Abstract
A Rotary-Pulsation Apparatus (RPA), also known in the literature as a Rotational Hydrodynamic Cavitation Reactor (RHCR), is a device which typically consists of a rotating mechanism that generates pulsations or vibrations within a fluid. This can be achieved through various means such as mechanical agitation, pneumatic pulses, or hydraulic forces. It is widely used in food, chemical, pharmaceutical, and microbiological industries to improve the mixing of different fluids, dispersion, pasteurization, and sterilization. In the present paper, a CFD study was conducted to develop and optimize the geometry of the RPA’s rotor and stator to induce cavitation in the fluid flow. The effect of cavitation has the potential to improve dispersion and emulsion properties and to significantly reduce operation pressure, in comparison to conventional mixing systems.
Keywords:
cavitation; CFD; rotary-pulsation apparatus; dispersion; emulsion; optimization; cavitation reactor 1. Introduction
Various types of mixers are being used in the industry for the continuous processing of fluids in pipelines, serving various objectives such as mixing, dispersion, heat transfer, and reaction. The type of fluid flow regime and the pressure levels in both the main stream and additive stream are crucial factors in selecting the appropriate equipment. Fluid flow within the pipeline itself can generate sufficient turbulence to produce simple mixing and dispersion processes. This approach is particularly effective in highly turbulent flow conditions where mixing length and time are not critical. Tee mixers, impingement jet mixers, and spray nozzles (for liquid into gas) are commonly utilized, especially when there is sufficient pressure energy available in the additive stream or which can be supplied. These side-stream additive injection devices are sometimes combined with static mixers to enhance design and performance. Static mixers are widely used in different sectors of process industries. They are designed as motionless elements integrated into a pipeline; these devices induce specific flow patterns that effectively blend fluids as they move through [1,2,3,4].
Another category being used in in-line dispersion applications is the category of rotor–stator mixers [5,6,7]. A distinguishing characteristic of a rotor–stator mixer is its high-speed rotor, which serves as the driven mixing element, positioned closely to a stator, the fixed mixing element. Typically, rotor tip speeds range from 10 to 50 m/s. These mixers are commonly referred to as high-shear devices due to the significantly higher local energy dissipation and shear rates they generate compared to conventional mechanically stirred vessels. In a rotor–stator mixer, shear rates typically range from 20,000 to 100,000 s−1, with local energy dissipation potentially being three orders of magnitude greater than in conventional mechanically agitated vessels. The combined action of the rotor and stator produces mixing energy, shear, elongational stresses, turbulence, and cavitation (in varying proportions depending on speed, viscosity, and other fluid flow parameters), which facilitate mixing or size reduction. Consequently, the rotor–stator assembly is often referred to as a generator. Rotor–stator mixers available commercially span a range of sizes, from small laboratory units to large-scale production units capable of handling flow rates exceeding 1000 gallons per minute, powered by drives with over 100 horsepower [8].
A Rotary-Pulsation Apparatus (RPA) is one of the rotor–stator mixer’s variations. It is widely used in agricultural and food industries and has the capability to execute simultaneously multiple tasks, acting as a homogenizer, wet colloidal mill, heater, centrifugal pump, pasteurizer, and producing high-quality dispersions [9]. The pulsating action in this type of device is achieved through hydroacoustic action: the primary small-scale mechanical effects of cavitation pressure pulsation and the secondary effects of the generation of quasi-harmonic acoustic waves. The rotor and stator were modified and optimized to produce more cavitation bubbles. Hydrodynamic cavitation is a formation of vapor bubbles in a flow where the pressure drops below the vapor pressure [10]. One important aspect of bubble dynamics involves deviation from spherical symmetry, when the collapse of vapor or cavitation bubbles in the zone of the higher pressure can result in extremely high interface velocities and localized pressures. This intense process carries significant technological implications as it can cause critical damage to adjacent solid surfaces [11,12]. On the other hand, these physical effects and the resultant cavitation erosion are widely used in different industries.
Bitumen separation technology utilizing cavitation jets was introduced in [13]. It was demonstrated that cavitation jets can effectively separate bitumen at relatively low temperatures (5–6 °C), indicating the potential for cavitation jet technologies to replace the hydrotransport process. In [14], various cavitation nozzles designed for bitumen separation were tested. A range of nozzles was specifically designed for generating low-intensity cavitation at high cavitation numbers (0.37–0.46), aiming to explore different types of cavitation generators. It was shown that the self-resonating nozzle yielded significantly better results compared to both conventional nozzles and conventional nozzles with passive control mechanisms.
In [15], the efficiency of well drilling for creating salt caverns using cavitating jets was studied and compared to a traditional mining approach. On-site testing demonstrated that employing self-resonating cavitating jets in rapid solution mining technology can significantly accelerate the construction process during the initial pocket phase of cavern development. In [16], radioactive scale cleaning based on cavitating jets was presented.
In [17], vortex-based cavitation was used to create high-quality emulsions at flow rates of 1LPM and 20 LPM. The influence of multiple passes through the vortex-based hydrodynamic cavitation (HC) device, the type of oil used, and the scale of the device on the emulsion breakage process and the resulting droplet size distribution (DSD) were studied. The experiments involved generating oil-in-water emulsions containing 5% and 15% oil concentrations, using rapeseed oil (RO) and tetrachloroethylene (TCE) as oil phases with respective densities of 915 kg/m3 and 1620 kg/m3.
Hydrodynamic cavitation is a promising technology known for its ability to improve processes and has proven highly effective in a range of chemical and environmental applications. Advanced rotational hydrodynamic cavitation reactors (ARHCRs), equipped with cavitation generation units (CGUs) to initiate cavitation, have emerged as superior options for industrial-scale applications compared to traditional devices [18]. In [19], a rotational hydrodynamic cavitation reactor (RHCR) with a rotor and stator was used for cavitation generation. The rotor, a solid cylinder with a 264 mm diameter, had 24 rows of inner holes evenly distributed along its circumference, with each row positioned 15° apart from adjacent rows. Additionally, five columns of inner holes were evenly distributed along the rotor’s axial direction, with a 22.5 mm gap between adjacent rows. Each hole had a height of 55 mm and a diameter of 15 mm. The rotor–stator clearance was set at a fixed 8 mm. The rotor was driven by a motor and induces cavitation within the inner holes. A motor inverter was used to control the motor’s rotation speed, which was set to 1200 rpm in this study. In [20], a novel rotor-radial groove (RRG) hydrodynamic cavitation reactor, based on a rotor and stator, was introduced. Computational fluid dynamics (CFD) analysis was used to assess the cavitation performance of the RRG hydrodynamic cavitation reactor, using cavitation intensity and energy efficiency as key evaluation metrics for different internal configurations. The investigation included an analysis of cavitation generation across various shapes of the cavitation generation unit (CGU), interaction distances, and rotor speeds. The casing adopts a volute-type structure, while the rotor features a semi-open impeller design, providing efficient liquid conveyance. Its profile follows a third-order Bezier curve. Rectangular-shaped CGUs are positioned on the stator, with the stator’s center hollowed out to facilitate fluid intake from the inlet. The fluid enters axially and is ejected radially by the rotor post-hydrodynamic cavitation reaction. Notably, high-intensity cavitation occurs in the impeller area and within the blind hole inside the reactor. CGU shapes (rectangular and cylindrical), rotor speeds (3600, 4320, and 5760 rpm), and interaction distances (1, 1.5, and 2 mm) were studied in this paper.
A common similarity in the design of the devices presented in the literature review is the shape of the rotor and stator channels. It has a regular geometric shape: rectangular (prismatic) or cylindrical [18,19,21,22]. Optimizing the RHCR design to achieve a maximum cavitation effect includes varying the channel sizes, the distance between them, and their number in the rotor or stator. Transforming flow ports is a complex technical task. The geometric shapes of the channels must ensure the symmetry of location on the rotor circle and connection with the stator channels, which causes difficulties in their modification.
On the other hand, the diverging shape of the rotor channel will lead to a pressure drop during the transition from a wide inlet to a narrow outlet section; the speed and, consequently, the kinetic energy of the flow, will increase. The inverse shape of the stator channel can be used to simulate the diffuser of a conventional Venturi tube, which is obtained when the rotor and stator channels coincide. Accordingly, the fluid flow rate decreases and the pressure increases. This design will lead to a superposition of shear and tangential stress fields in a complex flow, which intensifies hydrodynamic cavitation at the boundary of the transition of the rotor channel to the stator one. In this study, an RHCR with complex channel shapes was designed and constructed to promote the cavitation effect in liquid processing.
The main goal of this paper is to present a complete numerical analysis of a novel geometry of rotational hydrodynamic cavitation reactor to improve its design and increase its efficiency. The effects of fluid viscosity, different rotational speeds, and geometry were considered and design recommendations were suggested.
2. Rotational Hydrodynamic Cavitation Reactor (Rotary-Pulsation Apparatus)
A schematic of a rotational hydrodynamic cavitation reactor (RHCR) is shown in Figure 1. The rotation of the rotor creates a vacuum at the inlet (3) of the device (Figure 1). Therefore, fluid enters the RHCR without an additional pump in line.
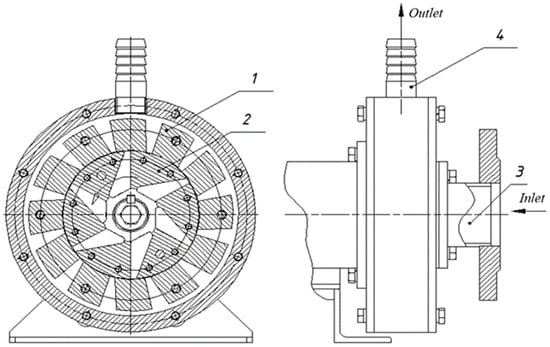
Figure 1.
Rotational hydrodynamic cavitation reactor: 1. stator, 2. rotor, 3. inlet, 4. outlet.
In accordance with the technical specifications, angular speed does not exceed 50 Hz.
One of the rotor/stator variations and cavitation zone schematics is shown in Figure 2.
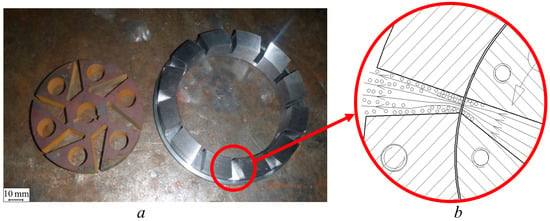
Figure 2.
(a) Rotor and stator. (b) Cavitation region.
The detailed geometric dimensions of the rotor and stator which were used in this study are shown in Figure 3.
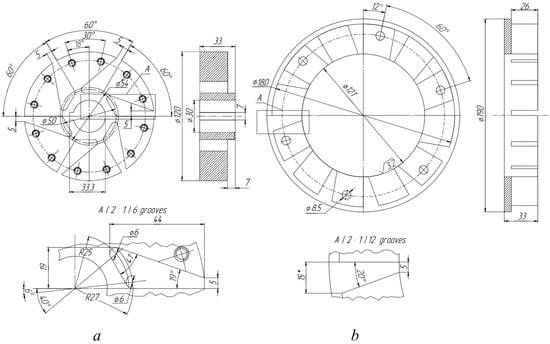
Figure 3.
(a) Detailed dimensions of rotor. (b) Detailed dimensions of stator.
The main original design elements are the rotor channels (Figure 3a (insert A)) and stator (Figure 3b (insert A)). The rotor, from the inlet pipe, captures the liquid with its wide side and accelerates it along a tapering passage towards the stator. When the channels coincide, a pulsed injection of liquid occurs into the neck of the stator channel.
3. CFD Model
The proposed CFD model was developed based on a Reynolds-averaged Navier–Stokes (RANS) approach for 3D flow using the ANSYS CFX 2023 R2 software package. Shear Stress Transport (SST) was used as a turbulence model. This model combines the advantages of both the k-ω model (effective near the walls) and the k-ε model (better performance in the free-stream). This blending ensures accurate modeling of both the near-wall regions, where cavitation often initiates, and the outer flow, where it develops [23]. Cavitation flows typically involve high shear rates, especially in the boundary layers and near rotating blades. The SST model accounts for these shear stresses more effectively, leading to a more accurate representation of the cavitation phenomena. Furthermore, rotary devices involve complex flow patterns, including flow separation. The SST model is known for its improved accuracy in predicting flow separation under adverse pressure gradients, which is critical in cavitation scenarios.
A Rayleigh-Plesset cavitation model in a multiphase medium was implemented as a model of interphase mass transfer in a CFX solver [24,25,26,27]. The key parameters in a numerical cavitation experiment are the radius of the surrounding bubble RB (radius under normal pressure of 1.013 × 10⁵ Pa = 1 atm), the amplitude of the driving pressure Pa, and the gas concentration in the liquid surrounding the bubble at p = P0, measured by the partial pressure divided by the environment pressure. To analyze cavitation characteristics, the “Vapor” area has been added to the liquid definition field. The material chosen is water vapor at 25 °C; the fluid model is homogeneous. In the inlet section, the volume fraction of water (1) and vapor (0) is determined. The main diameter of vapor bubbles in the Rayleigh–Plesset equation is chosen to be 2 × 10⁻⁶ m; the saturated vapor pressure, considering the temperature of the simulated liquid 25 °C, is pv = 3170 Pa. The remaining default modeling parameters are considered standard for most cavitating flows. The computation domain is shown in Figure 4. Geometrical dimensions are shown in Figure 3. For the stator, the domain “stationary” is selected as a motion and “rotating” is selected for the rotor. The interface for interaction between domains is also specified. The interaction type is “Fluid-Fluid”, and the interface model option is “General Connection”.
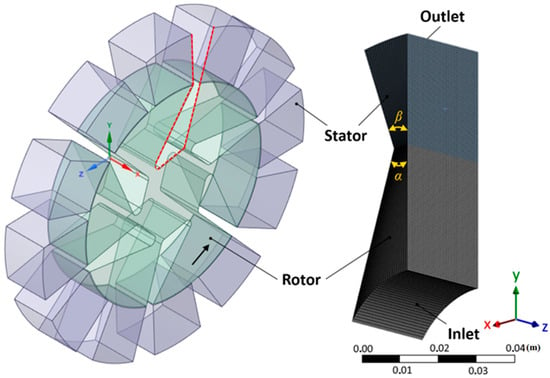
Figure 4.
Computation domain (traced with red line from the left and shown as 3D mesh on the right).
Since all channels are the same, only one channel was considered in this study. The rotor was set as the rotation region. The following rotational speeds were used: 15, 25, 35, and 50 Hz. The inlet static pressure varied from 1 to 10 atm (most of the cases at 1 atm) and the volumetric flow rate from 10 to 40 LPM. A value of 1 atm was set on outlet, with a value of 0.5 atm used in some cases. Angles were as follows: α = 19.0 ± 0.5°, β = 20.0 ± 0.8°. Temperature was set as 25 °C. The quality of the computational mesh was checked by gradually reducing the cell size, until stable results were achieved at six characteristic points on the Series 3 line (Figure 5a). The dependence of pressure on the maximum size δ of an element of a structured computational mesh at six characteristic points is shown in Figure 5b. Numerical simulation was performed at δ < 0.5 mm. As a result, structural mesh with 0.77 million cells was used in this study. To analyze the pressure and vapor phase in the channel, five straight lines were built (50 points each), from which the hydrodynamic characteristics were determined (Figure 5). Each straight line is numbered from right to left (Series 1–Series 5). In addition, the pressure distribution is considered at the inlet, rotor, and stator walls of the channel.
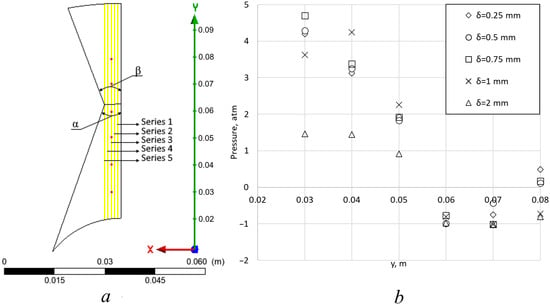
Figure 5.
(a) Control lines (characteristic points are notated as red dots). (b) Mesh study. Pressure in six characteristic points.
As will be shown, hydrodynamic characteristics (static and total pressure, vapor concentration, and fluid flow) have complex gradient distributions on selected planes. To analyze the results obtained, the maximum values were chosen, and the average values were chosen to plot the correlation curves.
4. Results
Figure 6 shows a graph of the distribution of static pressure pstat,in of the RHCR channel for the frequency range of 15–50 Hz. An initial frequency of 15 Hz was selected for two reasons. Firstly, the inlet pressure pstat,in ≈ 1.25 atm approaches that specified in the calculation (pin = pout = 1 atm), and therefore a further decrease in frequency will practically equate the pressure at the channel inlet and outlet, which will lead to a disruption of the RHCR operation. Secondly, for a given frequency, the onset of cavitation occurs (Figure 6a), a phenomenon that intensifies the processes of emulsification and dispersion and is necessary when using a RHCR. The pressure increases from the center of the channel to its side wall. This increase is expressed quantitatively by pstat,max = 1.85 atm.
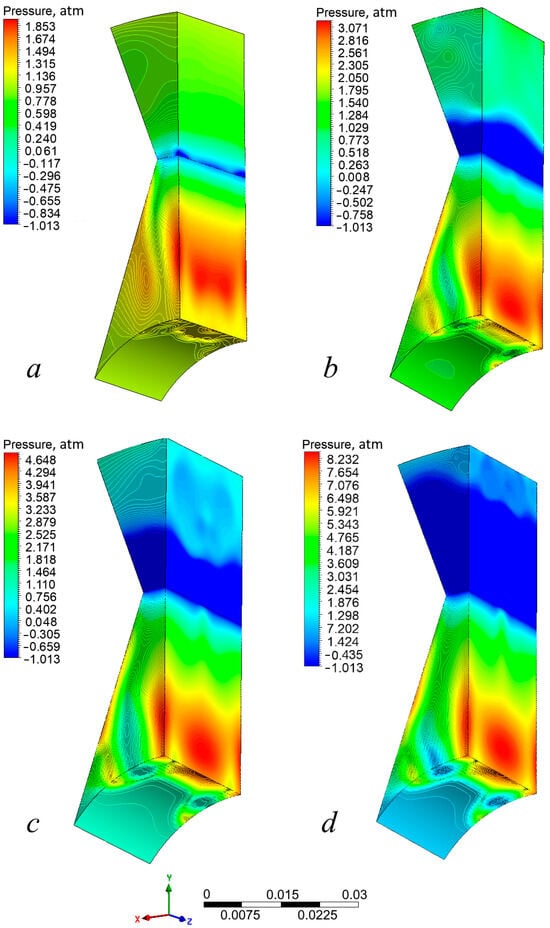
Figure 6.
Static pressure distribution pstat. Initial conditions: pin = pout = 1 atm, T = 25 °C. (a) Rotor rotation frequency 15 Hz, (b) rotor rotation frequency 25 Hz, (c) rotor rotation frequency 35 Hz, (d) rotor rotation frequency 50 Hz.
The observed pressure jump in the rotor channel (Figure 7a) is a result of fluid accumulation, and causes a further flow impulse when the rotor output coincides with the stator input of the device. In addition, the increase in pressure at a certain distance from the inlet is associated with the converging shape of the rotor channel, which is a structural feature of the RHCR in this study. It can be seen from Figure 7a that cavitation starts at a point of 0.06 m, where we can observe a pressure drop to minimum value. We can also observe a static pressure maximum at Δy = 0.012 from the inlet plane. The value of maximum pressure is growing from the center of the channel in the direction of the wall, from the Series 5 line to Series 1 (from 1.55 atm to 1.85 atm). The minimum value is achieved in the narrowest region of the channel and maximum is pressure can be observed near the straight wall near the channel’s inlet.
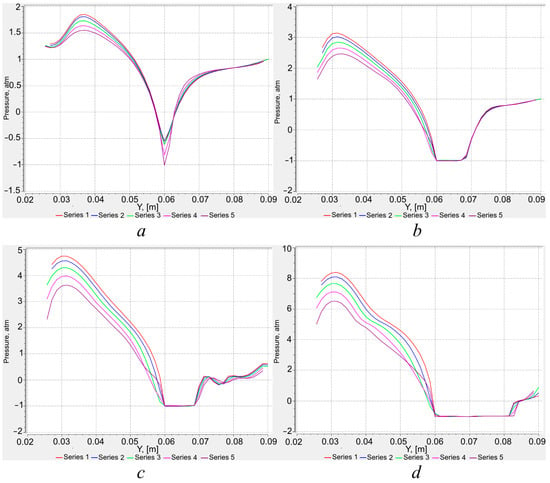
Figure 7.
Static pressure vs. y-coordinate. Series 1–5. (a) Rotor rotation frequency 15 Hz, (b) rotor rotation frequency 25 Hz, (c) rotor rotation frequency 35 Hz, (d) rotor rotation frequency 50 Hz.
At a rotation frequency of 25 Hz (Figure 6b), the spread of pstat,in on the input plane increases (Figure 7b). It is pstat,in = 1.3–2.35 atm. The maximum static pressure pstat,max increases and approaches the input plane; here, pstat,max = 3.07 atm. It can be seen from Figure 7b that in a narrow section, static pressure is dropping below saturation pressure (pstat < psat); the coordinate y = 0.06 m corresponds to the onset of cavitation. Graphically, one can determine the length of the cavitation cavity lcav, that is, Δy, where pstat < psat, considering the reference pressure. According to Figure 7b, lcav = 0.008 m. In the expanding diffuser section of the channel, the static pressure pstat,out increases to pout = 1 atm, while there is no data scatter between the results along auxiliary lines (Series 1–5).
For operating conditions at 35 Hz (Figure 6c), the spread on the plane of the channel entrance was pstat,in = 2.15–4.25 atm (Figure 7c). Furthermore, we can see from Figure 7c that when moving further into the channel for y = 0.031–0.032 m, a maximum is observed with the following range for data lines (Series 1–5): pstat,max = 3.55–4.86 atm. This is followed by a synchronous static pressure decrease along all lines to a value at y = 0.06 m. The length of the cavitation cavern is lcav = 0.008 m (Figure 7c). Thus, the size of cavitation is the same for the rotation frequencies 25 Hz and 35 Hz. But, at the exit from the diffuser section, the static pressure is not restored to the specified pout = 1 atm and corresponds to pstat,out = 0.80–0.85 atm.
The results of numerical modeling at a rotation frequency of 50 Hz (Figure 6d) showed that at the entrance to the RHCR channel, the pressure was pstat,in = 5–7.8 atm (Figure 7d). As we can see from 6d, maximum static pressure values change between 6.51 atm and 8.23 atm. Cavitation starts in the narrowing of the channel at y = 0.06 m. The length of the cavitation cavern is lcav = 0.024 m (Figure 7d). An increase in the flow cavitation area is also observed in the static pressure distribution (Figure 6d). The rotational frequency 50 Hz has certain boundary consequences. The cavitation zone will completely fill the space in the expanding section of the channel (Figure 6d). A further increase in frequency will only lead to an increase in the proportion of the vapor phase in the liquid.
The distribution of total pressure ptot in the RHCR channel for rotational frequencies of 15–50 Hz is shown in Figure 8.
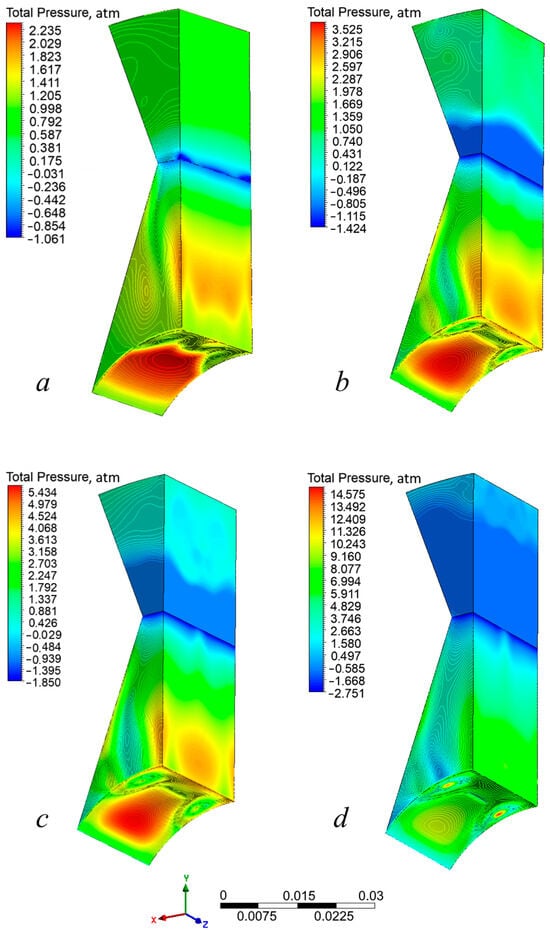
Figure 8.
Total pressure distribution ptot. Initial conditions: pin = pout = 1 atm, T = 25 °C. (a) Rotor rotation frequency 15 Hz, (b) rotor rotation frequency 25 Hz, (c) rotor rotation frequency 35 Hz, (d) rotor rotation frequency 50 Hz.
The calculated values of the total pressure at the inlet ptot,in, outlet ptot,out, and maximum ptot,max obtained are similar to the results in Figure 6. To make a quantitative forecast of pressure in various places of the RHCR channel, the results of modeling static and total pressure are combined in Table 1.

Table 1.
The dependence of the pressure and length of the cavitation zone on frequency.
Summarizing above results: The main features of rotor–stator devices are their high speed and high shear stresses. The rotor and stator develop mixing energy, shear, turbulence, and cavitation. In a narrow section of the RHCR channel, pstat < psat, which corresponds to the onset of cavitation. On the contours of Figure 6 and Figure 8, the low-pressure area is colored with blue. Graphically, one can determine the length of the cavitation cavity lcav, that is, Δy, where pstat < psat, considering the reference pressure. In the expanding diffuser section of the channel, the static pressure pstat,out increases to pout = 1 atm, and cavitation stops. The results of calculating the length of the cavitation region are also presented in Table 1.
Approximating the data from Table 1 using the method of least squares, the dependence equations p = f(ν) and lcav = f(ν) were obtained. The estimated relative error of the method is 5%. [28] Thus, the quantities of interest will be determined by the following equations:
- (1)
- Inlet static pressure:
- (2)
- Maximum static pressure in the channel:
- (3)
- Inlet total pressure:
- (4)
- Maximum total pressure in the channel:
- (5)
- Outlet total pressure:
- (6)
- Length of cavitation zone:
Based on the obtained Equations (1)–(6), it is possible to estimate the hydrodynamic characteristics of the RHCR for a given rotor speed.
The analysis of the degree of cavitation was carried out using the obtained distributions of the volume fraction of the vapor phase ω depending on the rotation frequency ν in the RHCR channel, with equal pressures at the inlet and outlet: pin = pout = 1 atm (Figure 9).
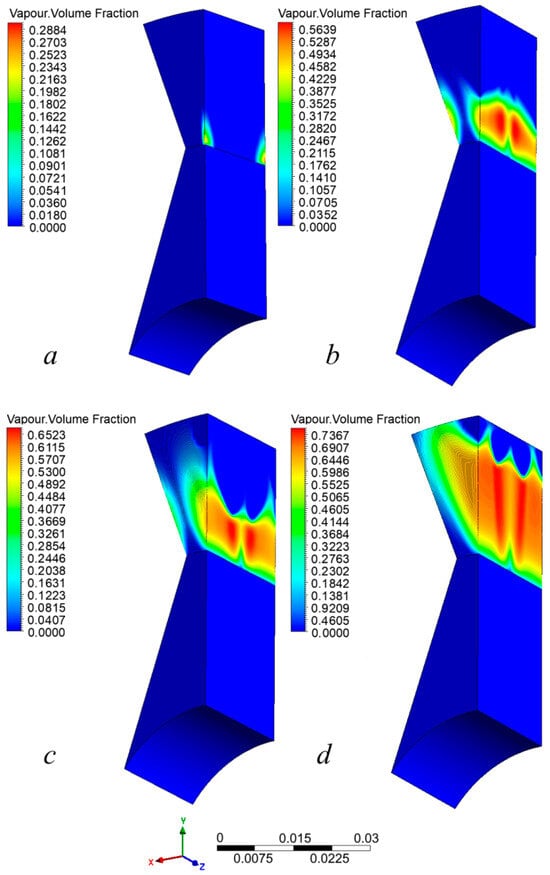
Figure 9.
Vapor volume fraction, ω. Initial conditions: pin = pout = 1 atm, T = 25 °C. (a) Rotor rotation frequency 15 Hz, (b) rotor rotation frequency 25 Hz, (c) rotor rotation frequency 35 Hz, (d) rotor rotation frequency 50 Hz.
At ν = 15 Hz, the cavitation region is weakly expressed. The vapor phase appears at the rectangular edges of the stator inlet, and its concentration does not exceed ω = 0.2884 (Figure 9a). For ν ≥ 25 Hz, we can observe a significantly increased cavitation zone. It occurs at the boundary of the rotor and stator and intensifies in the direction of the straight wall of the stator (Figure 9b,c). At ν = 50 Hz, the cavitation region reaches the stator output (Figure 9d). The analysis of cavitation characteristics showed that in an RHCR with the geometry proposed in this study, vapor bubbles will always be present as long as there is a flow through its channels. The origin of cavitation is the rectangular sides of the stator; with increasing frequency, vapor bubbles also form at the inclined side. At ν = 50 Hz, the cavitation region occupies the whole volume of the stator. In this case, the calculated mass flow rate of the processed fluid is 3.8–4.4 kg/s.
The graphical dependence of the maximum value of the vapor phase for a frequency ωmax = f(ν) is shown in Figure 10. A point (0;0) has been added to the graph, since without rotor rotation there will be no cavitation. In addition, the top of the curve must correspond to ω = 1.
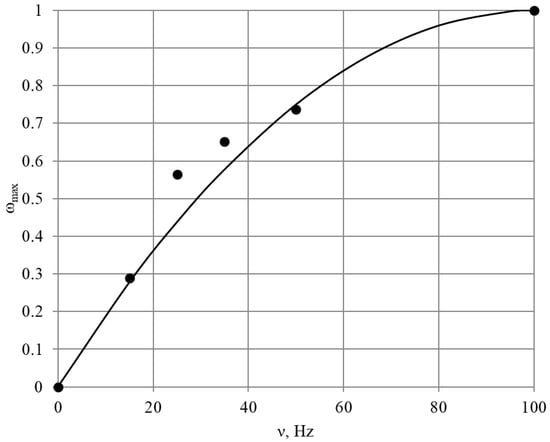
Figure 10.
Maximum proportion of vapor phase from temperature; experimental points and interpolation curve.
The maximum concentration of the vapor phase increases steadily with an increasing ν. The equation of dependence ωmax = f(ν) compiled according to the distributions of the vapor phase and the initial conditions will have the following form:
From Equation (7), it is possible to determine the frequency value at which the proportion of the vapor phase will be maximum, where ωmax = 1.
Since the discriminant of the equation is 0, there is one positive root that will satisfy the experimental conditions:
Thus, for the studied RHCR geometry, when the rotor rotates with a frequency ν = 100 Hz, the maximum fraction of the vapor phase in the channel stator ωmax ≈ 1 will be achieved. The length of the cavitation region at the obtained frequency, according to (6), is as follows:
Compared to traditional RHCRs, which have a direct flow when the rotor and stator channels coincide [18,19,21,22], the proposed geometry theoretically generates a larger cavitation zone and higher vapor phase concentration under the same kinematic rotation parameters. The optimal angles for narrowing the rotor channel (α) and expanding the stator (β) (Figure 11) were tested by varying these values in steps of ±2 to ±50 within the selected frequency range. The variability in step size is due to geometric constraints on the channel dimensions, ensuring that it is technically feasible to form a closed circle from them.
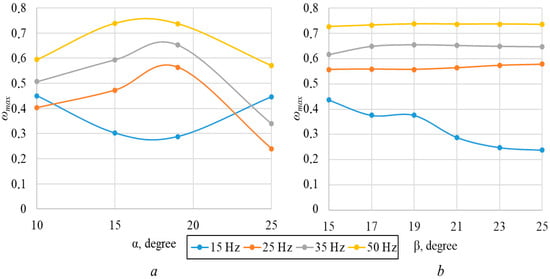
Figure 11.
(a) Maximum fraction of vapor phase vs. rotor channel angle of narrowing, (b) vs. expansion of the stator β for the studied frequencies.
Numerical simulation results indicate that altering the angle α improves cavitation characteristics at low frequencies, specifically at ν = 15 Hz (Figure 11a). However, this frequency aligns with the onset of cavitation at the stator ends (Figure 9a) and is not practically relevant for RHCR operation. Any deviation of the rotor taper angle from the standard value of α = 19.0 ± 0.5° clearly results in a decline in RHCR performance at frequencies of ν = 25–50 Hz (Figure 11a). This leads to a reduction in both the maximum vapor phase fraction (ωmax) and the total volume of the cavitation region. However, it is important to note that altering α requires adjustments to the rotor side lengths, the radius of curvature at the rotor channel inlet, and, consequently, the overall geometry of the RHCR inlet. Additionally, this change disrupts the symmetry of the channels, compared to the six-channel configuration of the current design. Therefore, modifying the taper angle α introduces new geometric dimensions, which could significantly alter the design of the RHCR.
Changing the angle β does not significantly affect ωmax at frequencies of ν = 25–50 Hz (Figure 11b), unlike the changes observed with angle α. However, at the selected angle of β = 20.0 ± 0.8°, cavitation in the stator channel is most pronounced at these frequencies. An increase in ωmax is observed only at ν = 15 Hz when β is decreased. At higher frequencies, the proposed geometry of the stator and rotor is optimal and will produce the most substantial cavitation effect.
5. Conclusions
This study aimed to optimize the geometry of a rotational hydrodynamic cavitation reactor (RHCR) using computational fluid dynamics (CFD) to enhance cavitation effects, improve dispersion, and reduce operational pressure.
The CFD analysis demonstrated that the onset and intensity of cavitation, as well as the length of the cavitation zone, are highly dependent on the rotational speed of the rotor. At lower rotational frequencies, cavitation is initiated at specific points within the narrow section of the channel, while higher frequencies significantly increase the cavitation zone length, indicating a higher intensity of cavitation. Specifically, as the rotational frequency increased from 15 Hz to 50 Hz, the maximum static pressure in the channel increased, and the cavitation zone extended from 0.0009 m to 0.024 m.
It was shown that at an optimal frequency range, cavitation could be effectively managed to potentially enhance mixing and dispersion while maintaining manageable pressure levels. The maximum static pressure observed varied significantly with frequency, highlighting the need for precise control over operational parameters to balance cavitation benefits and mechanical integrity.
The resulting pressure distribution profiles have demonstrated complex gradient distributions influenced by rotor speed and geometry, crucial for optimizing reactor design. The equations derived for predicting inlet and maximum pressures, as well as the cavitation zone length, offer practical tools for designing and scaling RHCRs in various industrial applications.
In conclusion, this study demonstrates the potential of optimized RHCR geometry and operational parameters to achieve superior cavitation performance. These results can potentially improve the design and efficiency of cavitation reactors, promising significant improvements in fluid mixing, dispersion, and overall process efficiency in industrial applications. Future work should focus on the experimental validation of these results and further refinement of CFD models to incorporate more complex fluid behaviors and reactor configurations. In general, the generation and development of cavitation in a rotary- pulsation generator is not the final objective of this study. The primary interest lies in examining the effects of cavitation in a rotary -pulsation generator on the parameters of processed heterogeneous solutions. For washing solutions, this includes static shear stress, viscosity, electrical stability, and other characteristics. For cement slurries, the focus is on reducing fluid loss and increasing the strength of the cement stone. Experimental setups are being developed for the dispersion of washing solutions and cement slurries. These setups will provide a validation of numerical modeling results and an indirect assessment of cavitation development under different design and operating conditions in a rotary -pulsation generator. This will be achieved by evaluating changes in the concentration of colloidal particles and electrical stability in hydrocarbon-based solutions, as well as the dynamics of strength changes in cement stone for cement slurries and acoustic measurements. Preliminary tests of several prototypes have already shown that cavitation generators can enhance the properties of heterogeneous process liquids and accelerate their preparation processes. In the near future, experimental studies will be conducted, and the validation outcomes will be presented in the next paper. If a satisfactory correlation with the numerical study results is achieved for these heterogeneous water- and hydrocarbon-based systems, the developed numerical model can be used to design and optimize the design and operating characteristics of rotary-pulsation generators across a wide range of parameters.
Author Contributions
M.O.—Experimental procedures, participated in paper writing; A.U.—Numerical analysis, participated in paper writing; I.P.—Experimental procedures, participated in paper writing; N.B.—Numerical analysis, participated in paper writing; M.E.H.—Numerical analysis, participated in paper writing. All authors have read and agreed to the published version of the manuscript.
Funding
The research is carried out with the financial support of the Kuban Science Foundation in the framework of the scientific project Num. MFI-20.1/54.
Institutional Review Board Statement
Not applicable.
Informed Consent Statement
Not applicable.
Data Availability Statement
The original contributions presented in the study are included in the article, further inquiries can be directed to the corresponding author.
Conflicts of Interest
The authors declare no conflict of interest.
References
- Nauman, E.B.; Kothari, D.; Nigam, K.D.P. Static mixers to promote axial mixing. Chem. Eng. Res. Des. 2002, 80, 681–685. [Google Scholar] [CrossRef]
- Hobbs, D.M.; Muzzio, F.J. Optimization of a static mixer using dynamical systems techniques. Chem. Eng. Sci. 1998, 53, 3199–3213. [Google Scholar] [CrossRef]
- Ling, F.H.; Zhang, X. A Numerical Study on Mixing in the Kenics Static Mixer. Chem. Eng. Commun. 1995, 136, 119–141. [Google Scholar] [CrossRef]
- Szalai, E.S.; Muzzio, F.J. A fundamental approach to the design and optimization of static mixers. AIChE J. 2004, 49, 2687–2699. [Google Scholar] [CrossRef]
- Bourne, J.R.; Garcia-Rosas, J. Rotor-stator mixers for rapid micromixing. Chem. Eng. Res. Des. 1986, 64, 11–17. [Google Scholar]
- Kowalski, A.J. An expression for the power consumption of in-line rotor-stator devices. Chem. Eng. Process. Process Intensif. 2009, 48, 581–585. [Google Scholar] [CrossRef]
- Doucet, L.; Ascanio, G.; Tanguy, P.A. Hydrodynamics Characterization of Rotor-Stator Mixer with Viscous Fluids. Chem. Eng. Res. Des. 2005, 83, 1186–1195. [Google Scholar] [CrossRef]
- Edward, L.P.; Victor, A.A.-O.; Suzanne, M.K. Handbook of Industrial Mixing: Science and Practice; John Wiley & Sons, Inc.: Hoboken, NJ, USA, 2003; ISBN 9780471269199/9780471451457. [Google Scholar] [CrossRef]
- Kaziev, G.Z.; Koroteev, M.P.; Kokoev, T.I.; Koroteev, A.M.; Stepnov, A.F.; Dzhioeva, C.G. Research in the field of processing plant materials, and obtaining new materials, biologically active substances and medicines. IOP Conf. Ser. Earth Environ. Sci. 2021, 624, 012117. [Google Scholar] [CrossRef]
- Knapp, R.T.; Daily, J.W.; Hammitt, F.G. Cavitation; McGraw-Hill: New York, NY, USA, 1970. [Google Scholar]
- Brennen, C.E. Cavitation and Bubble Dynamics; Oxford University Press: Oxford, UK, 1995. [Google Scholar]
- Young, F.R. Cavitation; McGraw-Hill Book Company: New York, NY, USA, 1989. [Google Scholar]
- Bukharin, N.; El Hassan, M.; Nobes, D.; Omelyanyuk, M. Reducing energy consumption during bitumen separation from oil sand. Energy Rep. 2020, 6 (Suppl. S2), 206–213. [Google Scholar] [CrossRef]
- Bukharin, N.; Vinogradov, O.G. Investigation of the effect of slurry density on a bitumen separation process based on cavitating jets. Ind. Eng. Chem. Res. 2012, 51, 6175–6183. [Google Scholar] [CrossRef]
- Song, X.; Li, G.; Yuan, J.; Tian, Z.; Shen, R.; Yuan, G.; Huang, Z. Mechanisms and field test of solution mining by self-resonating cavitating water jets. Pet. Sci. 2010, 7, 385–389. [Google Scholar] [CrossRef]
- Bukharin, N.; El Hassan, M.; Omelyanyuk, M.; Nobes, D. Applications of cavitating jets to radioactive scale cleaning in pipes. Energy Rep. 2020, 6 (Suppl. S9), 1237–1243. [Google Scholar] [CrossRef]
- Thaker, A.H.; Ranade, V.V. Emulsions Using a Vortex-Based Cavitation Device: Influence of Number of Passes, Pressure Drop, and Device Scale on Droplet Size Distributions. Ind. Eng. Chem. Res. 2023, 62, 18835–19390. [Google Scholar] [CrossRef] [PubMed]
- Xia, G.; You, W.; Manickam, S.; Yoon, J.Y.; Xuan, X.; Sun, X. Numerical simulation of cavitation-vortex interaction mechanism in an advanced rotational hydrodynamic cavitation reactor. Ultrason. Sonochem. 2024, 105, 106849. [Google Scholar] [CrossRef] [PubMed]
- Zhang, W.; Xie, C.; Fan, H.; Liu, B. Influence of Hole Geometry on Performance of a Rotational Hydrodynamic Cavitation Reactor. Front. Energy Res. 2022, 10, 881811. [Google Scholar] [CrossRef]
- Song, Y.; Hou, R.; Liu, Z.; Liu, J.; Zhang, W.; Zhang, L. Cavitation characteristics analysis of a novel rotor-radial groove hydrodynamic cavitation reactor. Ultrason. Sonochem. 2022, 86, 106028. [Google Scholar] [CrossRef] [PubMed] [PubMed Central]
- Samani, B.H.; Behruzian, M.; Najafi, G.; Fayyazi, E.; Ghobadian, B.; Behruzian, A.; Mofijur, M.; Mazlan, M.; Yue, J. The rotor-stator type hydrodynamic cavitation reactor approach for enhanced biodiesel fuel production. Fuel 2021, 283, 118821. [Google Scholar] [CrossRef]
- Lyu, F.; Tang, M.; Zhou, F.; Zhang, X.; Han, S.; Zhang, S. Research on the Effect of Structural Parameters on Cavitation Performance of Shear Hydrodynamic Cavitation Generator. Appl. Sci. 2024, 14, 3676. [Google Scholar] [CrossRef]
- Menter, F.R. Two-Equation Eddy-Viscosity Turbulence Models for Engineering Applications. AIAA J. 1994, 32, 1598–1605. [Google Scholar] [CrossRef]
- Rayleigh, L. On the pressure developed in a liquid during the collapse of a spherical cavity. Lond. Edinb. Dublin Philos. Mag. J. Sci. Ser. 6 1917, 34, 94–98. [Google Scholar] [CrossRef]
- Plesset, M.S. The dynamics of cavitation bubbles. J. Appl. Mech. 1949, 16, 228–231. [Google Scholar] [CrossRef]
- Huang, S.; Guan, J. Analysis on Cavitation Performance in Multi-Stage Centrifugal Pump Based on Cavitation Model. Adv. Mater. Res. 2011, 317–319, 414–417. [Google Scholar] [CrossRef]
- Jean-Pierre, F. The Rayleigh-Plesset equation: A simple and powerful tool to understand various aspects of cavitation. In Fluid Dynamics of Cavitation and Cavitating Turbopumps; CISM Courses and Lectures; Springer: Vienna, Austria, 2007; Volume 496, pp. 1–41. [Google Scholar] [CrossRef]
- Charnes, A.; Frome, E.L.; Yu, P.L. The Equivalence of Generalized Least Squares and Maximum Likelihood Estimates in the Exponential Family. J. Am. Stat. Assoc. 1976, 71, 169–171. [Google Scholar] [CrossRef]
Disclaimer/Publisher’s Note: The statements, opinions and data contained in all publications are solely those of the individual author(s) and contributor(s) and not of MDPI and/or the editor(s). MDPI and/or the editor(s) disclaim responsibility for any injury to people or property resulting from any ideas, methods, instructions or products referred to in the content. |
© 2024 by the authors. Licensee MDPI, Basel, Switzerland. This article is an open access article distributed under the terms and conditions of the Creative Commons Attribution (CC BY) license (https://creativecommons.org/licenses/by/4.0/).