Abstract
Shallow floodplains play a crucial role in river basins by providing essential ecological, hydrological, and geomorphic functions. During floods, intricate hydrodynamic conditions arise as flow exits and re-enters the river channel, interacting with the shallow vegetation. The influence and mechanism of shoal vegetation on channel hydrodynamics, bed topography, and sediment transport remain poorly understood. This study employs numerical simulations to address this gap, focusing on the Xiaolangdi–Taochengpu river section downstream of the Yellow River. Sinusoidal-derived curves are applied to represent the meandering river channel to simulate the river’s evolutionary process at a true scale. The study simulated the conditions of bare and vegetated shallow areas using rigid water-supported vegetation with the same diameter but varying spacing. The riverbed substrate was composed of non-cohesive sand and gravel. The analysis examined alterations in in-channel sediments, bed morphology, and bed heterogeneity in relation to variations in vegetation density. Findings indicated a positive correlation between vegetation density and bed heterogeneity, implying that the ecological complexity of river habitats can be enhanced under natural hydrological conditions in shallow plain vegetation and riparian diffuse flow. Therefore, for biological river restoration, vegetation planting in shallow plain regions can provide greater effectiveness.
1. Introduction
The meandering river is the most common form of river in nature. In the lower reaches of the Yellow River in China, there are large amounts of alluvial plains on both sides of the main river channel. During the dry season, the fertile soil in the alluvial plain area is cultivated with a large amount of farmland and vegetation. In the flood season, the increase in inflow causes the river water to flood the nearby plains, forming shoals. The vegetation in the shoals can effectively improve the ecological health, water quality, and long-term stability of the river, playing an irreplaceable role in maintaining the health and stability of the aquatic ecosystem [1]. Due to the complex geometric structure of the main river channel, the resulting water flow structure has a high three-dimensional nature and exhibits secondary flow [2]. Vegetation typically grows on the alluvial plains outside the main river channel (shoal vegetation), greatly altering the water flow structure and momentum transfer [3]. A deep understanding of how shoal vegetation affects the flow structure and momentum transfer in meandering rivers is of great importance in studying the transport and diffusion patterns of sediments in rivers [4].
Based on the lateral structure of alluvial water flow, Tominaga and Nezu [5] divided the cross-section into four regions—the main channel equilibrium zone, the shoal interaction zone, the shoal equilibrium zone, and the side wall zone—and found that the logarithmic distribution of the vertical flow velocity still applies in the equilibrium zone. Sanjou et al. [6,7] found that the flow velocity in the floodplain area is usually less than in the main channel. The exchange of a large amount of water flow between the high and low-velocity areas causes additional flow resistance, and the additional flow resistance caused by the meandering main channel has a relatively small effect on the flow in the floodplain [8,9,10,11].
When shoals are vegetated, Yang [12] investigated the flow velocity distribution and turbulence characteristics in the river channel. The study found that after the introduction of vegetation, the flow velocity in the main channel increased significantly, while the flow velocity in the shoals decreased notably. Additionally, due to the increased roughness, the turbulence intensity of the water flow rose considerably. The study also observed minimal variation in turbulence intensity across different directions, with all directions displaying an “S” shaped distribution. Zhang [13] conducted physical model experiments on river channels with vegetated shoals and found that the maximum flow velocity in trapezoidal main channels was not at the water surface; the water flow velocity in the shoal interaction zone was greater than in the shoal zone, and the impact of vegetation on the water flow in the main channel was relatively weak.
Submerged aquatic vegetation suppresses the development of water flow velocity by increasing the hydraulic resistance of the river, leading to a more complex vertical structure of flow velocity and turbulence [14,15,16,17]. Liu et al. [18] studied the impact of vegetation on the flow field in the main channel of a floodplain through a flume experiment and found that vegetation on the floodplain significantly reduced the conveyance capacity of the floodplain, increased the flow velocity along the meandering river channel. Wang et al. [19] modeled vegetation as a porous medium and studied the characteristics of water flow in alluvial channels with shoal vegetation, finding that floodplain vegetation expanded the lateral mass exchange range for bank flow.
Vegetation can reduce bank erosion and lateral migration of the channel, decreasing the formation of new river channels [20]. Sediment trapping by vegetation is an important factor controlling river width in meandering rivers [21]. The additional soil cohesion provided by vegetation is an important factor in the development and maintenance of meandering rivers [22,23,24]. The reduction of sediment flux induced by vegetation increases the bed slope in the vegetated area [25]. Further experiments have studied the impacts of different diffusion mechanisms (water flow versus wind) and different vegetation settlement locations (sandbars versus floodplains) [26,27]. Recently, there has been increased attention on the interaction between flow and the developing vegetation cover [28,29].
Previous research methods have predominantly focused on examining flow turbulence in river channels under both vegetated and non-vegetated conditions, with less attention given to the flow structure and bed morphology. Additionally, the underlying mechanisms by which changes in shoal vegetation density affect sediment flux and bed morphology in river channels have not been thoroughly elucidated. Furthermore, few studies have simultaneously considered the combined characteristics of shoal area vegetation and river channel morphology, making it challenging to develop a comprehensive understanding of these dynamics. In this study, Delft3D is employed to simulate the evolution of meandering rivers, specifically focusing on the Xiaolangdi-Taochengpu river section downstream of the Yellow River at a real scale. The research aims to address the following questions: (1) How do changes in shoal vegetation density impact the three-dimensional water structure within the river channel? (2) How do changes in shoal vegetation density influence sediment flux and bed morphology in the river channel as a result of alterations in the flow field? (3) To what extent does shoal vegetation density affect the sediment transport capacity in the river channel? To explore these questions, numerical simulations were systematically conducted with varying shoal vegetation densities to achieve the research objectives.
2. Methodology and Model Validation
2.1. Numerical Methods
The Delft3D-FLOW is used to solve the Navier–Stokes equations for incompressible fluids under shallow water and Boussinesq assumptions. In the vertical momentum equation, the vertical acceleration is neglected, leading to the hydrostatic pressure equation. The solution process mainly follows the hydrostatic pressure assumption, Boussinesq assumption, and Boussinesq approximation; the finite difference method (FDM) is used for numerical solution with the Alternating Direction Implicit (ADI) scheme. The spatial discretization is done using orthogonal curvilinear grids, and relevant parameters at the discrete points on the grid are solved.
The σ coordinate system is defined as
where z is the vertical coordinate in physical space; is the free surface elevation above the reference plane (at z = 0); d is the depth below the reference plane; H is the total water depth, given by . The σ coordinate system can conform to both the water surface and the bottom, as shown in Figure 1.
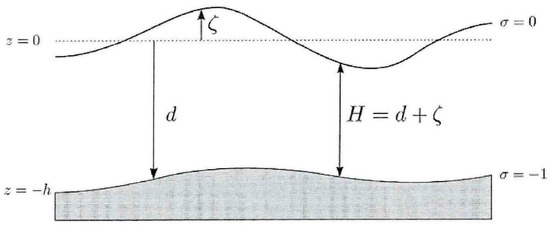
Figure 1.
Definition of σ coordinate.
The depth-averaged continuity equation is obtained by integrating the continuity equation for incompressible fluid over the total depth and taking into account the kinematic boundary conditions at the water surface and bed surface. The formula is as follows:
where is the water level above a reference horizontal plane (datum); is the grid spacing in the horizontal (ξ) direction; is the grid spacing in the curvilinear (η) direction; is the depth below a certain horizontal reference plane (datum); is the speed of water in the or direction; is the depth-averaged speed in the or direction; is the velocity component in the ξ direction; is the velocity component in the direction; is the flow contribution per unit area. The grid space schematic is shown in Figure 2.
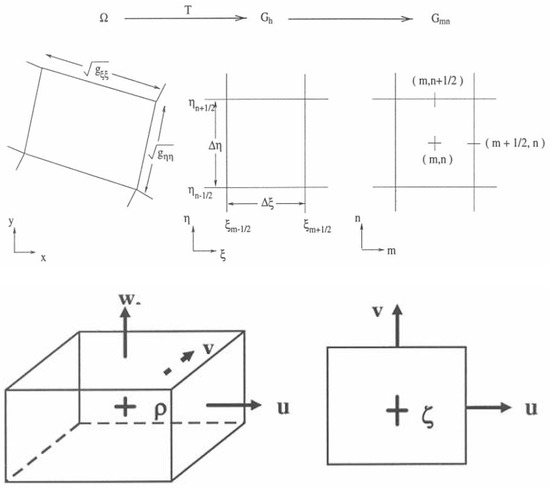
Figure 2.
Grid space schematic.
The horizontal momentum equations along the ξ and η directions, respectively, are
where is the density of the water; is the eddy viscosity coefficient; and are the momentum sources/sinks in the ξ and η directions, respectively; are the velocity components in the ξ and η directions, respectively; and are the gradient of the static pressure in the ξ and η directions, respectively; and are the turbulent momentum fluxes in the ξ and η directions, respectively; is the Coriolis force parameter, , ∅ is the latitude of the earth, and Ω is the radius of the earth.
The vertical velocity can be expressed in horizontal velocities and water depths:
where the vertical velocity is defined at the iso σ-surfaces. is the vertical velocity relative to the moving σ-plane.
The transport equations use orthogonal curvilinear coordinates on the plane and coordinates in the vertical direction:
where and are the turbulent diffusion coefficients in the horizontal and vertical directions, respectively, is the first-order decay coefficient, is the substance concentration, is the diffusion due to the sub-grid turbulence model, is background horizontal eddy diffusivity, is background vertical eddy diffusivity, is the diffusion due to the turbulence model invertical direction, is the kinematic viscosity of water, is either the (molecular) Prandtl number for heat diffusion or the Schmidt number for diffusion of dissolved matter. and the source and sink terms per unit area due to the discharge or withdrawal of water and/or the exchange of heat through the free surface :
By solving the three-dimensional advection-diffusion equation for suspended sediment, we can compute the three-dimensional transport of sediment:
In this equation, represents the mass concentration of the sediment component. The terms , , and denote the turbulent diffusion coefficients for the sediment component. The term represents a source-sink term that accounts for interactions with the riverbed, such as entrainment and deposition, while indicates the settling velocity of the sediment.
The turbulent model adopts the standard k-ε turbulence model based on the Reynolds-averaged Navier-Stokes equations, using two equations to describe turbulent velocity and turbulent kinetic energy, respectively.
The basic input parameters of the three-dimensional vegetation module are the relationship between the stem number per unit area and height, , and the relationship between stem width and height, . The influence of vegetation on the momentum equation is given by the vertical distribution of frictional force:
where is the horizontal flow velocity profile, is the drag force coefficient of the water flow under the action of vegetation. reflects the resistance of vegetation to water flow and has high engineering application value, but of vegetation is often difficult to determine. Previous researchers have summarized a large number of empirical formulas. This study adopted the formula summarized by Wang et al. (2018) [30]:
where is the Reynolds number of vegetation based on flow velocity, and is the characteristic length of Reynolds, the article adopts flow depth, and is the dynamic viscosity.
2.2. Model Validation
The study employs Bernard’s (1992) [31] bend flow tests to assess the accuracy of the Delft3D bend flow model rigorously. In this test, a flow rate of 49.5 m3/s was applied at the inlet, and a water level condition of 0 m (with a water level of 1.36 m relative to the bottom of the water) was adopted at the outlet, both as fixed boundary conditions. The tank’s bottom elevation was set at −1.36 m, with the entire bottom treated as a slope characterized by a Manning coefficient of 0.026. A structured grid of 980 × 40 × 40 was employed for the simulation. The time step is 0.0075 s, and the viscosity coefficient of water is . Six measurement stations (S1–S3) were established along the flow direction to independently observe the cross-sectional flow and facilitate a comparison between the predicted and observed data.
The comparison results are presented in Figure 3. The simulated vertically averaged flow velocities are generally slightly higher than the measured values; however, the model effectively captures the distribution of cross-sectional flow velocities. The extreme values of flow velocities in the simulation closely approximate the measured data, with an average error of 7.82%. Overall, the Delft3D simulation results demonstrate a high degree of agreement with the measured data, making the model well-suited for hydraulic simulations of meandering rivers.

Figure 3.
Vertical average flow velocity distribution in the measured section(u represents the vertical average flow velocity, U denotes the cross-sectional average flow velocity, d is the distance from the right bank of the flume, and D refers to the width of the flume), Bernard’s (1992) [31].
Kassem’s (2002) [32] U-shaped tank experiment at the Fluid Mechanics Laboratory of Delft University was utilized to validate the sediment model. The tank features a 180° bend with two straight sections, each 15 m in length, positioned before and after the bend. The tank itself is 1.7 m wide and 0.2 m deep, with a Chezy coefficient of 26.4 m1/2/s and a bed slope of 0.0018. A sediment layer with a median particle size of 0.78 mm and a thickness of 0.2 m was used. The bend radius is 4.25 m, resulting in a total length of 13.35 m. The experiment commenced with an inlet flow rate of 0.17 m3/s, with the outlet controlling the water level at 0.2 m. A structured grid of 120 × 20 × 10 was employed for the simulation. The time step is 0.0075 s, and the viscosity coefficient of water is . Incoming sediment content is 0.
After the bed morphology had fully developed, the distribution of sediment erosion and deposition was compared with the experimental results, specifically examining the cross-section profile at 0.34 m from both sides of the bend, as shown in Figure 4. The comparisons indicate a high degree of correspondence between the simulated and observed distributions of erosion and deposition at the bend, with the extremum values of erosion and deposition closely aligning with the observed results. This demonstrates that Delft3D is capable of accurately predicting the sediment dynamics in bend channel flows, making it a suitable tool for simulating sediment behavior in such environments.
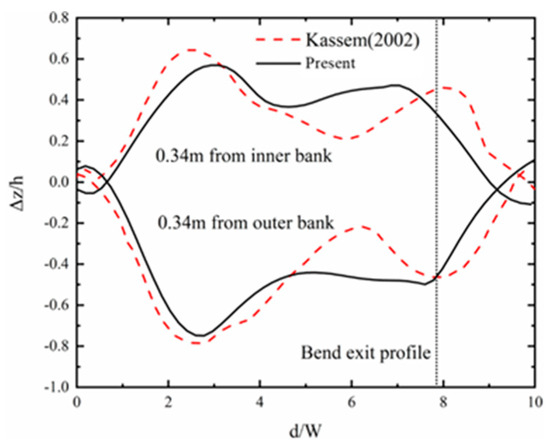
Figure 4.
Distribution of sediment erosion and deposition in U-shaped water tank and comparison of results (Δz represents the sedimentation and erosion value, h denotes the initial thickness of the sediment, d is the distance along the measurement line after entering the bend, and W refers to the width of the flume), Kassem’s (2002) [32].
The study utilized a recirculating water tank experiment conducted by Yang et al. (2022) [33] to validate the vegetation model. The tank dimensions were 30 m in length, 1 m in width, and 0.7 m in height, featuring a rectangular cross-section and a bottom slope of 0.0001. The vegetation area spanned 10 m across the entire width of the tank. The inlet flow rate was maintained at 0.035 m3/s, while the outlet controlled the water level at 0.25 m. A structured grid of 250 × 40 × 30 was employed for the simulation. The time step is 0.0075 s and = 0.85. The viscosity coefficient of water is . In the experiment, submerged vegetation was simulated using rigid cylindrical bars with a diameter of 0.5 cm and a height of 0.75 cm. The experiment explored three different vegetation densities, determined by varying the unit water-facing area of the vegetation ( = 0.78, 1.56, 2.83 m−1):
In the equation, represents the diameter of the vegetation, while represents the average spacing between the vegetation.
After the flow field was fully developed, the results were compared with measurements from Yang’s (2022) [33] experiment, as illustrated in Figure 5. The results demonstrate a high degree of accuracy for high-density vegetation, with a slightly lower fit for low-density vegetation. Nonetheless, the trend in the flow velocity distribution remains consistent with the measured values, with an overall error within 5%. Consequently, the vegetation model effectively represents the flow velocity distribution within the vegetation canopy and the free water layer, making the present numerical model well-suited for simulating water flow in vegetated environments.

Figure 5.
Flow velocity distribution in the measured section (u is the flow velocity in the flow direction), Yang et al. (2022) [33].
2.3. Simulation Settings
The study utilized a sinusoidal-derived curve [34] to model the natural geometry of meandering rivers, specifically focusing on the Xiaolangdi-Taochengpu river section downstream of the Yellow River. A uniform distribution of vegetation elements was employed to simulate shallow shoal vegetation. The density of the vegetation canopy was quantified using the solid volume fraction of the vegetation, and the bed sediment was composed of non-cohesive sand.
The sinusoidal-derived curve represents the bend angle of the river as a sine function of the river distance , expressed as follows [35,36]:
where is the maximum bend angle of the river meander curve, and is the arc length of a single river meander.
The solid volume fraction is often used to characterize the magnitude of vegetation distribution density, calculated as follows (Ghisalberti and Nepf, 2002 [35]):
where is the diameter of the vegetation element, is the average spacing of the vegetation element, and is the height of the vegetation element.
The numerical model’s case setup is based on the Xiaolangdi-Taochengpu reach in the lower reaches of the Yellow River [37]. The main river channel is 20 m wide and 1500 m long, with a maximum bend angle of and an arc length λ of 60° and 500 m, respectively, resulting in a river meandering index of 1.35. The computational domain is a rectangular area measuring 320 m by 1115 m, with a water depth of 2 m in the main channel (the channel is 2 m deeper than the floodplain). The river cross-section consists of a rectangular main channel flanked by shoals on both sides.
In the simulation, the water density is = 1000 kg/m3, the water kinematic viscosity is = 8.97 × 10⁻⁷, the median particle size of the sediment is = 0.05 mm, and the density of sediment is = 2650 kg/m3. The riverbed slope is = 0.2‰, and the Chezy coefficient [37] is = 50.31. The upstream inlet flow rate is 468 m3/s, and the controlled downstream water level is −0.3 m (with the reference water level being the free water surface at the inlet). In the shoal plains, the diameter of the vegetation element is = 0.06 m, and the vegetation density is controlled by varying the average spacing ΔS of the vegetative elements (from 0.6 to 0.2 m). A structured grid of 375 × 351 × 30 was employed for the simulation, as shown in Figure 6.
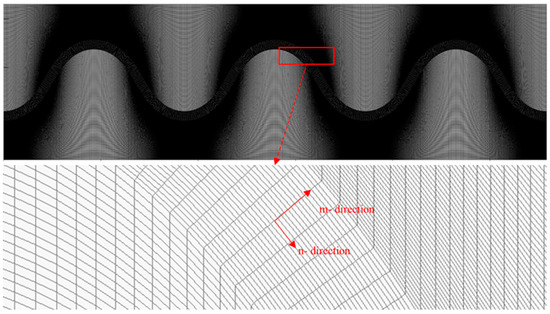
Figure 6.
Schematic diagram of the grid.
This study examines the distribution of natural aquatic vegetation ranging from sparse to dense, with λ values from 0.1 to 0.9, where λ = 0.1 represents the limit of sparse vegetation and λ = 0.9 represents dense vegetation [38]. The vegetation is modeled as rigid and uniformly distributed across the shoal plains on both sides of the main channel, as illustrated in Figure 7. The specific parameters are detailed in Table 1, where “S6” indicates that the average spacing of the uniformly distributed vegetation is 0.6 m, while “NP” denotes the reference case, which has no vegetation distribution on the shoal plains.
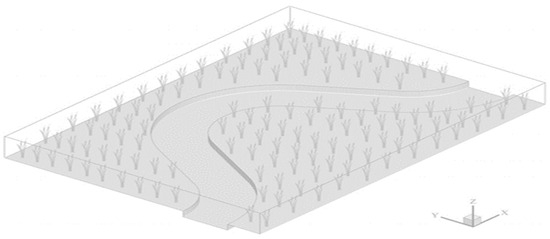
Figure 7.
Schematic diagram of shoal vegetation distribution.

Table 1.
Simulation parameters.
2.4. Mesh Convergence Study
To assess the impact of grid density on the established flow–sediment model, a sensitivity analysis of the grid was conducted to verify the convergence of the simulation results(Table 2). The time step for each simulating condition was set at 0.00067 s. After the flow field stabilized, the vertical average flow velocity at the bend crest cross-section and the cross-sectional elevation after 300 min of numerical simulation were evaluated. Additionally, the average height variation along the centerline and the right bank of the river at T = 300 min was analyzed. The results of this analysis are presented in Figure 8.

Table 2.
Grid convergence verification parameter settings (m- and n- directions are defined in Figure 8).

Figure 8.
Comparison of (a) m-directional erosion, (b) depth average velocity, and (c) n-directional erosion under different grids.
The comparison results demonstrate that grid resolutions coarser than G3 produce inaccurate results, characterized by the disappearance of flow structures near the banks and the absence of erosion and deposition patterns at the shore-bank interface. This inadequacy leads to errors exceeding 100% in sediment erosion and deposition compared to the results of G5. In contrast, grid resolutions finer than G4 yield simulation results with deviations of less than 10%. Consequently, the grid resolution of G4 (375 × 351 × 30) effectively captures the flow structures and sediment erosion and deposition patterns, offering an optimal balance between simulation accuracy and computational load.
3. Results and Discussions
3.1. Flow Structure
The mean velocity distribution of flow within the catchment area is a fundamental characteristic of meandering rivers. To effectively describe the velocity distribution within the river channel, it is essential to classify the area into bends and transition zones based on topographic features and variations in the flow field. Seven cross-sections were selected along the primary channel, as illustrated in Figure 9.
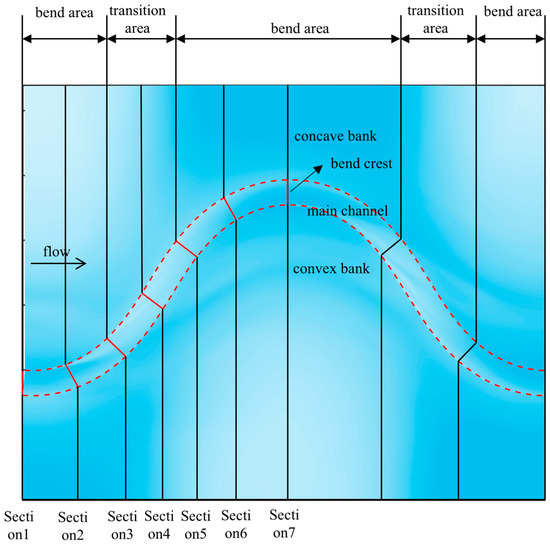
Figure 9.
Schematic diagram of river channel zoning.
Figure 10 presents the velocity distribution for each phase within a single river channel cycle. The simulation assumed stable bed conditions, disregarding sediment movement. Velocity data is normalized against the average flow velocity, , in the channel and is depicted through a color contour map, with the main channel delineated by a red dashed line. Overall, the velocity within the main channel significantly exceeds that of the adjacent shoal areas, with flow increasingly converging towards the main channel as vegetation density rises. The water predominantly flows downstream, with the maximum velocity increasing from 1.3 to 1.8.
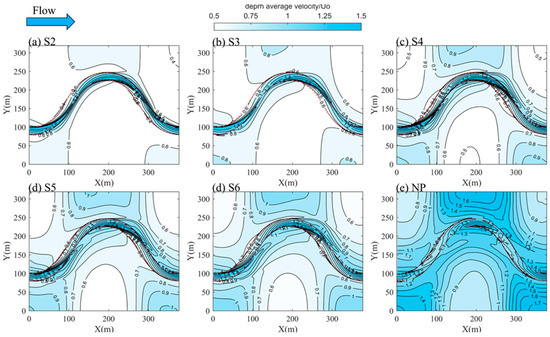
Figure 10.
Contours of planar flow velocity.
Due to the inertia of the water, streamlines in the main channel tend to shift towards the downstream shoals within the transition zone after navigating the bend, leading to erosion along the downstream bank where high-velocity water flows. The directional change of streamlines towards the shoals is strongly influenced by vegetation density: higher vegetation concentration results in streamlines remaining predominantly within the main channel, thereby mitigating the erosive impact of high-velocity flows on shoals. As vegetation density increases, the average velocity of the shoal plains decreases from 0.9 to 0.6, consistent with findings from earlier studies (Wang et al., 2022) [19].
In meandering rivers, water flow induces lateral circulation as it navigates bends, driven by the combined effects of gravity and inertia. This lateral movement, coupled with the river’s longitudinal flow velocity, generates a spiral motion that propels the water forward, playing a critical role in the development of curved river channels. The strength of this circulation is assessed using Shukry’s standard [39], with the calculation formula presented as follows:
where , , , , and are the velocities in the longitudinal, transverse, and vertical directions of the cross-section, respectively, and is the gravitational acceleration.
Figure 11 illustrates the distribution of circulation intensity within the main channel under varying conditions. The data reveals that circulation intensity increases after the bend crest, stabilizes within the transition zone, and then diminishes as it approaches the next bend, eventually reaching its peak again at the bend crest. Interestingly, the circulation intensity in the bend region is minimally affected by vegetation density, with the lowest intensity observed near the bend crest, approximately 0.8%. In contrast, the circulation intensity within the transition section is significantly influenced by vegetation density; as vegetation density increases, circulation intensity decreases. Without vegetation, this section exhibits instability, with a peak circulation intensity reaching 8.8%.
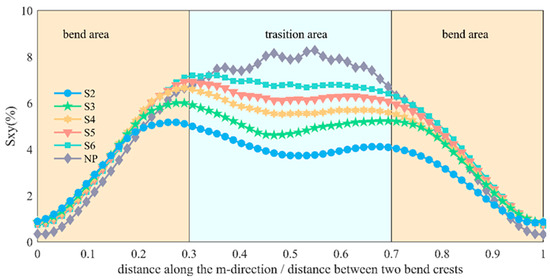
Figure 11.
Distribution of main channel circulation intensity along the channel.
Selecting the bend crest in the curved area as the characteristic section (see Figure 9), the distribution of the circulation structure under various conditions is depicted in Figure 12. In this figure, the right side corresponds to the left bank of the channel, where the arrow vectors represent the flow velocity vectors, scaled by the average flow velocity .
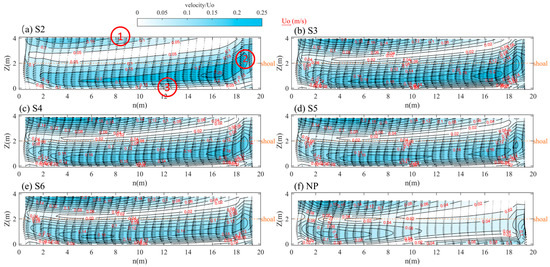
Figure 12.
Circulation structure of the main bend section.
An analysis of the flow direction at the cross-section, as shown in Figure 12, reveals that the inertia of the water promotes straight-line motion. As water flows into the bend, it accelerates toward the concave bank, raising the water level and creating a transverse slope directed toward the convex bank. This transverse slope maintains a pressure differential towards the convex bank, driving the flow in that direction (see position 1 in the diagram). Upon encountering the convex bank and vegetation, the water deflects downward before transitioning from the convex bank to the concave bank at the channel’s bottom, resulting in a clockwise circulation pattern at the cross-section (see positions 2 and 3 in the diagram). When this circulation merges with the longitudinal flow, it generates a helical flow effect, facilitating the transport and exchange of sediments within the flow.
As shown in Figure 12, from the perspective of flow velocity across the cross-section, the surface flow velocity on the concave bank side significantly exceeds that on the convex bank side, with the velocity disparity becoming more pronounced near the water surface. The center of the high-velocity flow region at the bend’s crest is located approximately 0.25 times the channel width from the concave bank. In contrast, in the region symmetrical to this center, located 0.75 times the channel width from the concave bank, there exists a relatively weaker high-velocity area. This suggests that circulation development adjacent to the main flow is both substantial and intense. Vertically, circulation intensity is highest at the water surface and diminishes as it approaches the channel’s bottom boundary. Between the two high-speed regions, a low-speed distribution belt exists along the shoal contour line, characterized by nearly zero horizontal and vertical flow velocities and low circulation intensity.
In the absence of vegetation, circulation intensity in the section is more concentrated on the concave bank side, resulting in an asymmetric circulation structure. As vegetation density increases, the symmetry of the circulation structure improves, and the extreme values of circulation intensity in the two high-velocity areas decrease.
Figure 13 presents the average flow velocity and secondary flow distribution within the main channel across various cross-sections (Sections 1–7, as shown in Figure 9), both with and without vegetation on the shoals. The average flow velocity along the left bank of the river channel is non-dimensionalized using the reference velocity . The secondary flow distribution is represented by a 2D vector plot derived from the transverse and longitudinal velocity components, with the vector unit size indicated by .
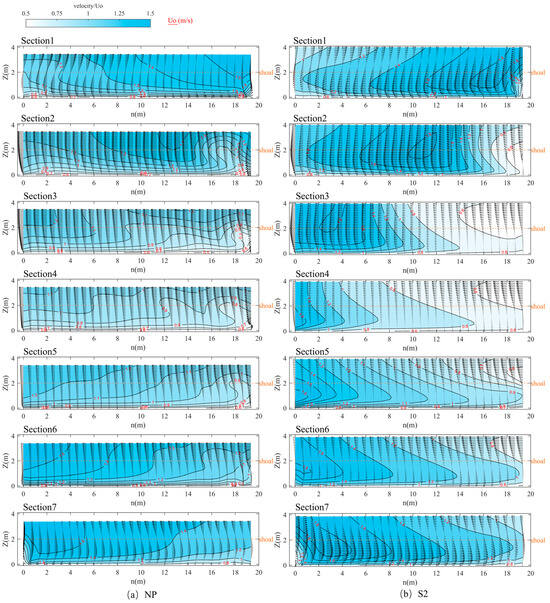
Figure 13.
Circulation structure of the main channel along the section.
As illustrated in Figure 13a, in the absence of vegetation in the shoal area, the peak flow velocity in the main channel does not exceed 1.6, occurring near the left bank at the water surface of bend crest Section 1. As the flow progresses into the transitional channel, the maximum flow velocity decreases slightly and shifts toward the right bank. The influence of the primary flow towards the convex bank creates a significant velocity gradient on the left bank compared to the right. When the flow enters the next bend section after the transitional channel, the primary flow gradually shifts towards the convex bank of the subsequent bend, leading to a pronounced flow velocity gradient on the right bank of the channel. This flow velocity distribution is consistent with the experimental findings of previous researchers (Moncho-Esteve et al., 2017 [40]).
When the shoal area is populated with vegetation, as shown in Figure 13b, the peak flow velocity in the channel reaches approximately 1.8 and shifts across the sections as the primary flow advances. The structure of the main flow within these sections becomes more defined. It is characterized by a more concentrated flow and a larger horizontal velocity gradient transitioning from the main flow area to the low-speed region.
Secondary flow is a significant characteristic of complex curved hydrodynamics. As illustrated in Figure 13, double secondary flow cells appear at section 1 of the bend crest. The surface flow moves from the concave bank to the convex bank, while at the riverbed, the flow moves from the convex bank to the concave bank, creating a clockwise cell at the core of the main channel. As the flow enters the transitional channel, the uniform flow from the left bank integrates into the primary river channel, leading to the dissolution of the larger clockwise structure and the formation of a new counterclockwise cell along the left bank, advancing toward the riverbed. As the flow progresses into the transitional channel, the shoal flow dominates the lateral velocity profile, resulting in the entire lateral flow velocity of the main river channel shifting from the left bank to the right bank, with the exception of a minor counterclockwise cell located at the base of the left bank.
The analysis under these two conditions reveals that the flow velocity distribution within the main channel intensifies in the presence of vegetation. As vegetation density increases, the distribution of high-velocity flow shifts downward toward the riverbed, leading to a well-defined flow velocity distribution structure. This structure exhibits a “U”-shaped profile from the water surface downward, which is consistent with the findings of Wang et al. [19].
3.2. River Channel Evolution
The beds of natural river bends are continuously shaped by sediment erosion, and changes in bed topography can lead to the reshaping of the river’s hydraulic characteristics. This dynamic interaction ultimately creates a coupling effect among bed topography, flow characteristics, and the river’s planform.
Figure 14 illustrates the temporal changes in the total sediment transport rate along the right bank of Section 1 (refer to Figure 9). For coarser, non-cohesive material, we can specify that, at all open inflow boundaries, the flow should enter carrying all “sand” sediment fractions at their equilibrium concentration profiles. This means that the sediment load entering through the boundaries will be near-perfectly adapted to the local flow conditions, and very little accretion or erosion should be experienced near the model boundaries. Generally, sediment transport is higher during the early stages of channel evolution but stabilizes over time. After T = 6000 min, sediment transport rates under various conditions show little variation, indicating the attainment of a quasi-equilibrium state.
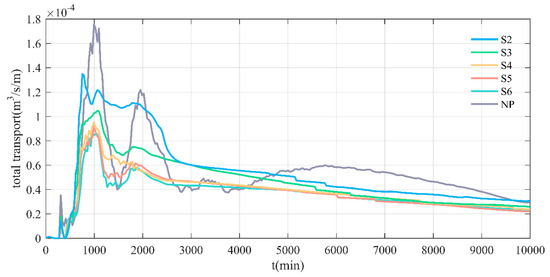
Figure 14.
Total sediment transport at the right bank of the bend section changes over time.
Vegetation density plays a significant role in influencing sediment transport within the main channel. With low vegetation density, sediment transport rates fluctuate considerably during the initial phase, exhibiting multiple peaks within a short period, with peaks exceeding 300% of the quasi-equilibrium state due to intense flow-bed interactions. However, as vegetation density increases, sediment transport rates in the main channel also rise, but the variations in transport rate over time become smoother, leading to a more stable channel evolution process.
The evolution of bed morphology for condition S6 is depicted in Figure 15. In the bend section, deep troughs develop on the convex side of the channel’s curve. Downstream, in the transitional zone, alternations between shallow shoals and deep troughs reflect fluctuations in the hydrodynamic axis of the primary channel. Notably, significant changes in bed morphology occur over a relatively short period. As time progresses, the deep troughs in the bend section continue to deepen while the main channel steadily shifts downstream. The rate of migration in the transitional zone exceeds that in the bend section, leading to a less seamless transition between these zones and increasing the channel’s curvature.
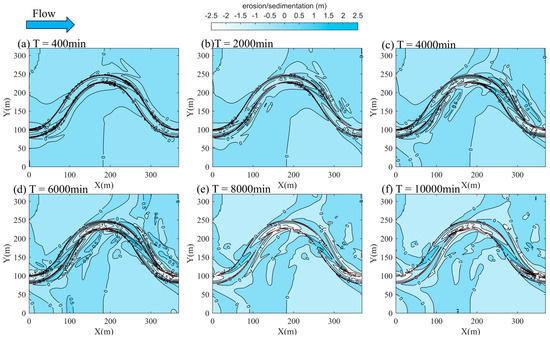
Figure 15.
Channel evolution process for caseS6.
In the early stages, sediment accumulates in the downstream bars of the transitional zone due to substantial morphological changes, forming intersecting shoals. Over time, ripple formations emerge vertically on these shoals, located downstream of the main channel, resulting in the development of two sandbars. These sandbars can reach a height of 0.25 times the main channel depth () and align with the direction of the newly formed main channel. Additionally, an overall trend of downstream migration of the shoals is observed, with migration distances reaching up to 0.5 times the main channel width ().
The results shown in Figure 12 and Figure 13 indicate that by T = 6000 min, the development of the river’s channel morphology has reached a state of equilibrium. Consequently, the morphological characteristics at this time are illustrated in Figure 16. The findings suggest that vegetation density on the shoals significantly influences the river channel’s morphology. At higher vegetation densities, the main channel’s morphology remains relatively intact, with flow concentrated within the main channel. This leads to a more pronounced distribution of shallow shoals and deep troughs. As vegetation density decreases, the main channel tends to shift downstream. This downstream shift results in a more fragmented river morphology, enriching the shoal topography and gradually leading to the formation of sandbars and shallow shoals along the main channel.
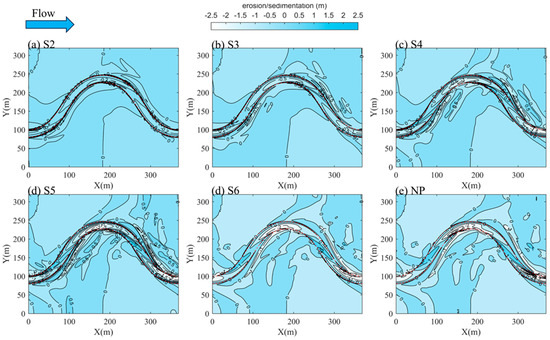
Figure 16.
Bed morphology at T = 6000 min for each case.
Figure 17 illustrates the along-channel riverbed morphology of the main channel at the right bank, spanning from Section 1 to Section 7, at T = 6000 min for each condition. The results indicate that in the bend section, the concave bank and the downstream transitional channel have migrated downstream. The channel topography appears relatively flat, with changes being less noticeable due to the effects of vegetation. The channel migration along the convex bank in the bend section occurs at a slower pace (as shown in Figure 15), leading to considerable fluctuations in the along-channel topography, characterized by intermittent distributions of shallow shoals, deep troughs, and free sandbars. As vegetation density increases, the depth of the deep troughs gradually rises, and new sandbars develop behind these deep troughs, with sandbar heights reaching up to 1.75 m.
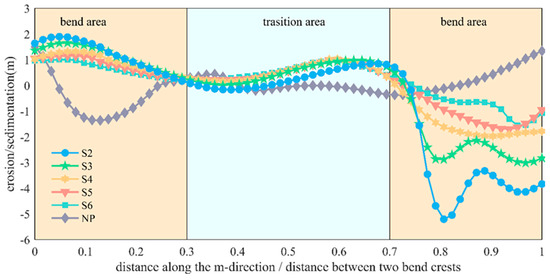
Figure 17.
Bed morphology at T = 6000 min for each simulating condition.
Figure 18 depicts the variations in cross-sectional erosion and deposition of the riverbed for each condition at Section 1. The findings reveal that under low-density vegetation, there is a significant undulation in the cross-sectional topography, featuring multiple peaks alongside numerous sandbars and shallow shoals dispersed throughout the landscape. As vegetation density increases, the undulation of the shoal topography becomes less pronounced, with erosion primarily concentrated in the deep trough of the main channel.
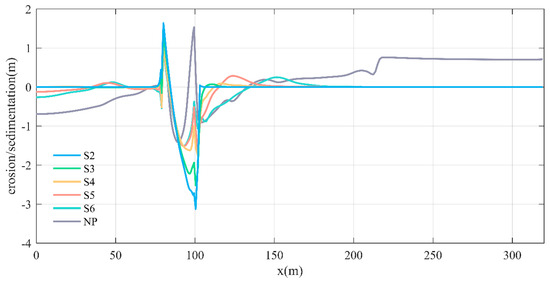
Figure 18.
Topography of the bend crest section at T = 6000 min.
The volume and variability of sediment transport in rivers are crucial for the functioning of river systems. Sediment transport significantly influences material fluxes, biogeochemical cycles, water quality, river morphology, and the development of deltaic regions. It impacts aquatic ecosystems and animal habitats that rely on the river while also affecting human utilization of river resources. Notably, high sediment transport can lead to sedimentation in reservoirs, water intakes, and irrigation systems, which increases the cost of water management and poses serious challenges to the sustainable development of water resources.
Figure 19 and Figure 20 depict the distribution of bed-load sediment transport and suspended sediment transport (Equations (8)–(11)), respectively, along the right bank of the main channel for each condition. The results indicate that suspended sediment transport in the channel is significantly greater than bed-load sediment transport, with the former generally being 10 times larger than the latter. Sediment transport near the bend crest is relatively low, gradually increasing as the flow travels through the bend and then decreasing as it approaches the next bend.
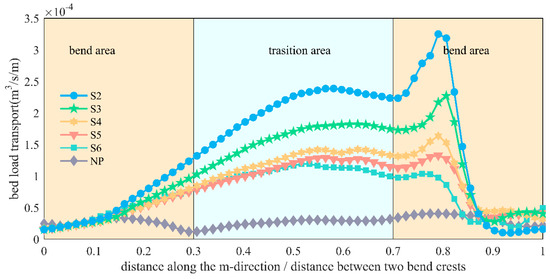
Figure 19.
Distribution of bed load sediment transport at T = 6000 min.
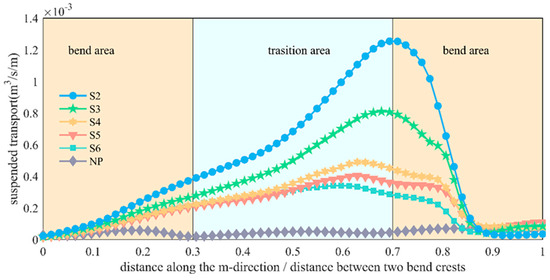
Figure 20.
Distribution of suspended sediment transport at T = 6000 min.
Bed-load sediment transport exhibits a prominent peak shortly after entering the bend section, with the peak intensity increasing as vegetation density rises. This is attributed to the erosion and high sediment transport caused by the deep troughs (as seen in Figure 17). The distribution of suspended sediment transport follows a similar pattern to that of cohesive sediment transport, but it peaks when the flow transitions from the bend section into the transitional channel. Overall, sediment transport increases with higher vegetation density.
In summary, sediment transport within the channel is concentrated at the boundary between the transitional and bend sections, leading to severe erosion along the riverbanks. The migration rate of the transitional section downstream is faster than that of the bend section, as specifically illustrated in Figure 15.
The relationship between the average total sediment transport and the vegetation solid volume fraction (λ) of the main channel is illustrated in Figure 21. The data reveal a rising trend in average total sediment transport as vegetation density increases, particularly in channels with low vegetation density. However, as vegetation density continues to rise, this increasing trend diminishes. Specifically, when vegetation density is high (λ > 0.9), changes in the transport rate caused by the same variation in vegetation density ( = 0.1) are minimal, at only around 10% of what is observed under low-density vegetation conditions (λ < 0.1).
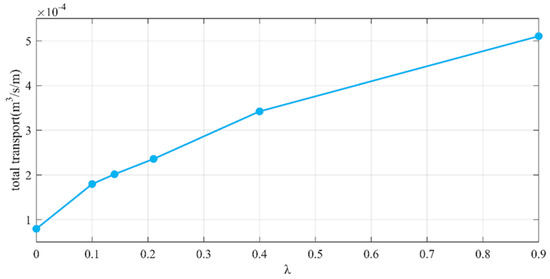
Figure 21.
Relationship between vegetation density and total sediment transport in the main channel.
In summary, shoal vegetation plays a crucial role in the evolution of river channels. The complex flow structure influences the downstream migration rate of the transitional main channel, which occurs more rapidly than in the bend section. This discrepancy leads to the fragmentation of the primary channel morphology and the formation of new side channels, adversely affecting the stability of riverbanks and agricultural practices on the shoals. Increasing shoal vegetation density causes water flow to concentrate more within the main channel, thereby reducing riverbank erosion and preserving the continuity and integrity of the main channel. Additionally, shoal vegetation enhances the sediment transport capacity of the entire river system while decreasing sediment build-up on the shoals by promoting erosion and reducing sediment deposition in the main channel.
4. Conclusions
This study employed Delft3D to perform a numerical simulation of an alluvial river featuring a 60° bend, integrating the momentum equation with drag force to analyze the effects of shoal vegetation. The investigation focused on flow characteristics and riverbed evolution under varying vegetation densities, specifically solid volume fractions ranging from 0 to 0.9. The main findings are as follows:
1. The flow velocity within the main channel is significantly higher than in the adjacent shallow floodplains and becomes increasingly concentrated in the main riverbed as vegetation density rises. The intensity of secondary flow in the transition channel decreases with higher vegetation density. Conversely, in the absence of vegetation, secondary flow intensity is unstable and exhibits significant fluctuations.
2. Without vegetation in the shoal area, the maximum flow velocity is located at the left bank of the water surface at the bend crest. As the water progresses into the transitional channel, this maximum flow velocity slightly decreases and shifts toward the right bank. With the introduction of vegetation in the shoal area, the maximum flow velocity relocates as the main flow advances. Vegetation leads to a more focused flow velocity distribution within the main channel. As vegetation density increases, the high flow velocity distribution moves lower toward the riverbed, creating a distinct “U”-shaped profile from the water surface to the riverbed.
3. In low-density vegetation areas, the cross-sectional topography exhibits considerable variation, including multiple peaks, numerous sandbars, and shallow shoals. As vegetation density increases, the variation in shoal topography decreases, with erosion concentrating in the deep troughs of the main channel. Additionally, the overall average sediment transport increases with higher vegetation density, though the sensitivity of sediment transport rates to vegetation density diminishes.
4. Shoal vegetation enhances the sediment transport capacity of the entire river channel by reducing sediment accumulation on the shoals by promoting erosion and minimizing sediment deposition in the main channel. The rate of downstream migration in the transitional main channel exceeds that in the bend section, leading to the gradual fragmentation of the primary channel morphology and the creation of new side channels. These changes can negatively impact the stability of riverbanks and agricultural operations in the shoal regions.
Author Contributions
Conceptualization, H.X. and Z.Z.; methodology, Z.Z. and C.J.; software, H.X.; validation, H.X., D.X. and Z.Z.; formal analysis, H.X.; investigation, H.X.; resources, Z.Z. and C.J.; data curation, H.X. and Z.Z.; writing—original draft preparation, H.X.; writing—review and editing, C.J., D.X., X.C., L.T., Y.W. and Z.Z.; visualization, H.X.; supervision, Z.Z. and C.J.; project administration, Z.Z. and C.J.; funding acquisition, Z.Z. and C.J. All authors have read and agreed to the published version of the manuscript.
Funding
This research was funded by the National Natural Science Foundation of China (grant number 52179076, 52401340) and the Open Fund of State Key Laboratory of Hydraulics and Mountain River Engineering, Sichuan University (grant number 2310).
Data Availability Statement
The data that support the findings of this study are available from the corresponding author upon reasonable request.
Acknowledgments
We gratefully acknowledge the support of Tianjin University and Sichuan University, China, for funding this work.
Conflicts of Interest
The authors declare no conflicts of interest.
Nomenclature
| the maximum bend angle of the river meander curve | |
| unit water-facing area of the vegetation [m−1] | |
| the solid volume fraction | |
| the diameter of the vegetation element [m] | |
| the average spacing of the vegetation element [m2] | |
| the drag force coefficient of the water flow under the action of vegetation | |
| the strength of the circulation | |
| the average flow velocity in the river | |
| the main channel width [m] |
References
- Ali, S.Z.; Dey, S. Hydrodynamic instability of meandering channels. Phys. Fluids 2017, 29, 125107. [Google Scholar] [CrossRef]
- Engel, F.L.; Rhoads, B.L. Three-dimensional flow structure and patterns of bed shear stress in an evolving compound meander bend. Earth Surf. Process. Landf. 2016, 41, 1211–1226. [Google Scholar] [CrossRef]
- Li, J.; Zhang, M.; Jiang, E.; Pan, L.; Wang, A.; Wang, Y.; Jian, S. Influence of floodplain flooding on channel siltation adjustment under the effect of vegetation on a meandering riverine beach. Water 2021, 13, 1402. [Google Scholar] [CrossRef]
- Chatelain, M.; Proust, S. Open-channel flows through emergent rigid vegetation: Effects of bed roughness and shallowness on the flow structure and surface waves. Phys. Fluids 2021, 33, 106602. [Google Scholar] [CrossRef]
- Tominaga, A.; Nezu, I. Turbulent Structure in Compound Open-Channel Flows. J. Hydraul. Eng. 1991, 117, 21–41. [Google Scholar] [CrossRef]
- Wormleaton, P.R.; Allen, J.; Hadjipanos, P. Discharge Assessment in Compound Channel Flow. Am. Soc. Civ. Eng. 1982, 108, 975–994. [Google Scholar] [CrossRef]
- Sanjou, M.; Nezu, I. Turbulence structure and coherent motion in meandering compound open-channel flows. J. Hydraul. Res. 2009, 47, 598–610. [Google Scholar] [CrossRef]
- Zhang, H.T.; Dai, W.H.; da Silva, A.M.F.; Tang, H.-W. Numerical study on resistance to flow in meandering channels. J. Hydraul. Eng. 2022, 148, 04021059. [Google Scholar] [CrossRef]
- Guan, D.; Zhou, Y.; Shahin, M.A.; Tirkolaei, H.K.; Cheng, L. Assessment of urease enzyme extraction for superior and economic bio-cementation of granular materials using enzyme-induced carbonate precipitation. Acta Geotech. 2023, 18, 2263–2279. [Google Scholar] [CrossRef]
- Tang, Z.; Melville, B.; Shamseldin, A.; Guan, D.; Singhal, N.; Yao, Z. Experimental study of collar protection for local scour reduction around offshore wind turbine monopile foundations. Coast. Eng. 2023, 183, 104324. [Google Scholar] [CrossRef]
- Wang, M.; Yu, Q.; Xu, Y.; Li, N.; Wang, J.; Cao, B.; Wang, L.; Avital, E.J. A Numerical Study on the Influence of Riparian Vegetation Patch on the Transportation of Suspended Sediment in a U-Bend Channel Flow. Fluids 2024, 9, 109. [Google Scholar] [CrossRef]
- Yang, K.J.; Liu, X.N.; Cao, S.Y.; Zhang, Z.X. Flow turbulence characteristics of compound river channel with floodplain under vegetation effect. J. Hydraul. Eng. 2005, 36, 1263–1268. (In Chinese) [Google Scholar]
- Zhang, M.W. Study on Flow Characteristics of Compound River Channel with Vegetated Floodplains; Tsinghua University: Beijing, China, 2011. (In Chinese) [Google Scholar]
- Stone, B.M.; Shen, H.T. Hydraulic resistance of flow in channels with cylindrical roughness. J. Hydraul. Eng. 2002, 128, 500–506. [Google Scholar] [CrossRef]
- Stoesser, T.; Kim, S.J.; Diplas, P. Turbulent flow through idealized emergent vegetation. J. Hydraul. Eng. 2010, 136, 1003–1017. [Google Scholar] [CrossRef]
- Rao, P.L.; Prasad, B.S.S.; Sharma, A.; Khatua, K.K. Experimental and numerical analysis of velocity distribution in a compound meandering channel with double layered rigid vegetated flood plains. Flow Meas. Instrum. 2022, 83, 102111. [Google Scholar]
- Lyness, J.F.; Myers WR, C.; O’Sullivan, J.J. Hydraulic characteristics of meandering mobile bed compound channels. Proc. Inst. Civ. Eng. -Water Marit. Energy 1998, 130, 179–188. [Google Scholar] [CrossRef]
- Liu, C.; Shan, Y.; Liu, X.; Yang, K.; Liao, H. The effect of floodplain grass on the flow characteristics of meandering compound channels. J. Hydrol. 2016, 542, 233. [Google Scholar] [CrossRef]
- Wang, Y.; Yang, Z.; Liu, M.; Yu, M. Numerical study of flow characteristics in compound meandering channels with vegetated floodplains. Phys. Fluids 2022, 34, 115107. [Google Scholar] [CrossRef]
- Gran, K.; Paola, C. Riparian vegetation controls on braided stream dynamics. Water Resour. Res. 2001, 37, 3275–3283. [Google Scholar] [CrossRef]
- Inoue, T.; Mishra, J.; Parker, G. Numerical Simulations of Meanders Migrating Laterally as They Incise into Bedrock. J. Geophys. Res. Earth Surf. 2021, 126, e2020JF005645. [Google Scholar] [CrossRef]
- Braudrick, C.A.; Dietrich, W.E.; Leverich, G.T.; Sklar, L.S. Experimental evidence for the conditions necessary to sustain meandering in coarse-bedded rivers. Proc. Natl. Acad. Sci. USA 2001, 106, 16936–16941. [Google Scholar] [CrossRef] [PubMed]
- Tal, M.; Paola, C. Dynamic single-thread channels maintained by the interaction of flow and vegetation. Geology 2007, 35, 347–350. [Google Scholar] [CrossRef]
- Tal, M.; Paola, C. Effects of vegetation on channel morphodynamics: Results and insights from laboratory experiments. Earth Surf. Process. Landf. 2010, 35, 1014–1028. [Google Scholar] [CrossRef]
- Le Bouteiller, C.; Venditti, J.G. Vegetation-driven morphodynamic adjustments of a sand bed. Geophys. Res. Lett. 2014, 41, 3876–3883. [Google Scholar] [CrossRef]
- van Dijk, W.M.; Teske, R.; van de Lageweg, W.I.; Kleinhans, M.G. Effects of vegetation distribution on experimental river channel dynamics. Water Resour. Res. 2013, 49, 7558–7574. [Google Scholar] [CrossRef]
- Vargas-Luna, A.; Duró, G.; Crosato, A.; Uijttewaal, W. Morpho logical adaptation of river channels to vegetation establishment: A lab oratory study. J. Geophys. Res. Earth Surf. 2019, 124, 1981–1995. [Google Scholar] [CrossRef]
- Fernandez, R.L.; McLelland, S.; Parsons, D.R.; Bodewes, B. Riparian vegetation life stages control the impact of flood sequencing on braided river morphodynamics. Earth Surf. Process. Landforms 2021, 46, 2315–2329. [Google Scholar] [CrossRef]
- Kyuka, T.; Yamaguchi, S.; Inoue, Y.; Ferrel, K.R.A.; Kon, H.; Shimizu, Y. Morphodynamic effects of vegetation life stage on experimental meandering channels. Earth Surf. Process. Landforms 2021, 46, 1225–1237. [Google Scholar] [CrossRef]
- Wang, W.J.; Peng, W.Q.; Huai, W.X.; Katul, G.G.; Liu, X.-B.; Qu, X.-D.; Dong, F. Friction factor for turbulent open Channel flow covered by vegetation. Sci. Rep. 2019, 9, 5178. [Google Scholar] [CrossRef]
- Bernard, R.S.; Schneider, M.L. Depth-Averaged Numerical Modeling for Curved Channels; USAE Waterways Experiment Station, Hydraulics Laboratory: Warren County, MS, USA, 1992.
- Kassem, A.A.; Chaudhry, M.H. Numerical Modeling of Bed Evolution in Channel Bends. J. Hydraul. Eng. 2002, 128, 507–514. [Google Scholar] [CrossRef]
- Yang, Z.H.; Guo, M.; Li, D. Theoretical model of suspended sediment transport capacity in submerged vegetation flow. J. Hydrol. 2022, 609, 127761. [Google Scholar] [CrossRef]
- Kinoshita. Investigation of Channel Deformation in Ishikari River. In Report of Bureau of Resources; Department of Science and Technology: Tokyo, Japan, 1961. [Google Scholar]
- Ghisalberti, M.; Nepf, H.M. Mixing layers and coherent structures in vegetated aquatic flows. J. Geophys. Res. Ocean. 2002, 107, 3-1–3-11. [Google Scholar] [CrossRef]
- Langbein, W.B.; Leopold, L.B. River Meanders—Theory of Minimum Variance. In Rivers and River Terraces; U.S. Geological Survey Professional Paper; Palgrave Macmillan: London, UK, 1966; pp. H1–H14. [Google Scholar]
- Niu, C.; Li, D.; Zhao, L.; Han, S.; Quan, L.; Li, X.; Hu, C. Analysis of the Evolution Law and Influencing Factors of River Bed Roughness in the Wide Beach Area of the Lower Yellow River in the Past 20 Years. J. Appl. Basic Eng. Sci. 2024, 32, 984–999. (In Chinese) [Google Scholar] [CrossRef]
- Tinoco, R.O.; Coco, G. A laboratory study on sediment resuspension within arrays of rigid cylinders. Adv. Water Resour. 2016, 92, 1–9. [Google Scholar] [CrossRef]
- Shukry, A. Flow around bends in an open flume. Trans. Am. Soc. Civ. Eng. 1950, 115, 751–779. [Google Scholar] [CrossRef]
- Moncho-Esteve, I.J.; Folke, F.; García-Villalba, M.; Palau-Salvador, G. Influence of the secondary motions on pollutant mixing in a meandering open channel flow. Environ. Fluid Mech. 2017, 17, 695–714. [Google Scholar] [CrossRef]
Disclaimer/Publisher’s Note: The statements, opinions and data contained in all publications are solely those of the individual author(s) and contributor(s) and not of MDPI and/or the editor(s). MDPI and/or the editor(s) disclaim responsibility for any injury to people or property resulting from any ideas, methods, instructions or products referred to in the content. |
© 2024 by the authors. Licensee MDPI, Basel, Switzerland. This article is an open access article distributed under the terms and conditions of the Creative Commons Attribution (CC BY) license (https://creativecommons.org/licenses/by/4.0/).