Article

Impacts of Mask Wearing and Leakages on Cyclic Respiratory Flows and Facial Thermoregulation

1
Department of Biomedical Engineering, University of Massachusetts, Lowell, MA 01854, USA
2
Department of Aerospace, Industrial, and Mechanical Engineering, California Baptist University, Riverside, CA 92504, USA
*
Author to whom correspondence should be addressed.
Submission received: 5 November 2023 / Revised: 20 December 2023 / Accepted: 23 December 2023 / Published: 27 December 2023

Abstract

:
Elevated face temperature due to mask wearing can cause discomfort and skin irritation, making mask mandates challenging. When thermal discomfort becomes intolerable, individuals instinctively or unknowingly loosen or remove their facemasks, compromising the mask’s protective efficacy. The objective of this study was to numerically quantify the microclimate under the mask and facial thermoregulation when wearing a surgical mask with different levels of misfit. An integrated ambient–mask–face–airway computational model was developed with gaps of varying sizes and locations and was validated against complementary experiments. The low Reynolds number (LRN) k-ω turbulence model with porous media was used to simulate transient respiratory flows. Both skin convective heat transfer and tissue heat generation were considered in thermoregulation under the facemask, besides the warm air exhaled from the body and the cool air inhaled from the ambient. The results of this study showed that when wearing a surgical mask with a perfect fit under normal breathing, the temperature at the philtrum increased by 4.3 °C compared to not wearing a mask. A small gap measuring 0.51 cm2 (gap A) at the nose top resulted in 5.6% leakage but reduced the warming effect by 28% compared to zero gap. Meanwhile, a gap of 4.3 cm2 (R1L1) caused 42% leakage and a 62% reduction in the warming effect. Unique temporospatial temperature profiles were observed at various sampling points and for different gap sizes, which correlated reasonably with the corresponding flow dynamics, particularly close to the gaps. The temperature change rate also exhibited patterns unique to the gap site and sampling point, with distinctive peaks occurring during the inspiratory–expiratory flow transitions. These results have the significant implications that by using the temporospatial temperature profiles at several landmark points, the gap location can potentially be pinpointed, and the gap size and leakage fractions can be quantified.

1. Introduction

Wearing masks became an essential part of daily life in many parts of the world during the COVID-19 pandemic that was declared by the World Health Organization (WHO) on 11 March 2020, and which lasted around two years [1]. While mask wearing has been shown to be effective in reducing viral transmission, it can also cause some side effects, including impaired facial expression, enhanced eye muscle activity, increased facial temperature, and associated discomfort or skin irritation [2,3,4,5]. Facemasks can trap heat close to the skin and notably increase facial temperature [6]. This effect can be particularly pronounced for tight-fitting masks with high filtration efficiencies or high breathing resistances when worn for a prolonged time in a high-temperature environment [7]. The increase in skin temperature may also be accompanied by a decrease in blood flow to the face, which can lead to further skin discomfort and irritation [8].
Thermal discomfort or skin irritation can have an adverse impact on facemask compliance, often prompting the wearer to loosen or take off the mask to ease the discomfort [9,10]. Considering that the mask fit is one of the two key factors that ensure effective protection by mask wearing (the other being the mask’s filtration efficiency), wearing a facemask with gaps/leaks will remarkably compromise the mask’s effectiveness in preventing the spread of respiratory droplets. It has been demonstrated that even a small gap between the mask and skin can cause substantial leakage flows, thereby reducing the protection efficiency [11,12]. Moreover, for a given gap, the higher the mask flow resistance, the higher the leakage fraction will be [13]. Discomfort from mask wearing can discourage people from wearing a mask altogether, which increases the viral transmission risks.
Some skin ailments are sensitive to facial temperature changes. These ailments can be triggered or exacerbated by changes in temperature, leading to symptoms such as itching, redness, or inflammation [14,15,16,17]. Examples of thermally sensitive skin ailments include rosacea (characterized by redness, flushing, and bumps on the face), eczema (a chronic skin condition characterized by dryness, itch, and inflammation), psoriasis (a chronic autoimmune disorder causing red, flaky skin patches), and dermatographism (raised, red lines or hives on the skin) [18,19,20,21,22]. In addition, the skin around the mouth and nose (i.e., the philtrum region) is more sensitive to thermal variation [23]. This region is particularly rich in nerve endings and blood vessels, the latter of which dilate or constrict in response to temperature variations. The philtrum skin is thinner than other areas of the face (except around the eyes), making it more predisposed to thermally sensitive ailments.
A few studies have investigated facial temperature variations when wearing a facemask. They indicate that the thermal discomfort induced by mask wearing can be influenced by various factors, including the mask type, fit, the wearer’s physical activity, and the environment. A tight-fitting mask made of low-breathable materials can cause more discomfort in hot and humid environments [24,25,26]. Yip et al. [27] examined facial temperatures under different types of masks and reported that some types were more effective in warming the skin than others. Pequeña et al. [28] compared fabric masks and face shields in affecting facial temperature and discomfort and found a higher facial temperature when wearing a fabric mask but a similar thermal discomfort level between these two. Scarano et al. [29] reported that the facial temperature was above 34.5 °C when wearing an N95 or surgical mask, a level that could elicit mild sensations of thermal discomfort. Salati et al. [30] reported that N95 respirator mask breathing leads to excessive carbon dioxide inhalation and reduced heat transfer in the human nose. Inthavong et al. [31] also showed a cooling effect on nasal mucosa from the latent heat of evaporation. Facial temperature and discomfort in healthcare workers were studied by Lembo et al. [32], Zhu et al. [33,34], and Beonell et al. [35]; all reported a significant increase in facial temperature, but the increasing magnitude varied with the mask type, length of wearing time, and the individual’s physical activity. Surgical facemasks were rated significantly lower for heat perception and overall discomfort than both N95 facemasks [36]. Exercise and being overweight could further increase the facial temperature, perceived breathing effort, and thermal discomfort [37,38,39,40,41]. Wearing N95 and surgical masks was shown to increase the heart rate and subjective sensations of discomfort in healthy volunteers but did not significantly impact thermal stress [42,43,44,45,46,47].
The objective of this study was to simulate the heat transfer through the facemask and validate it against experimental measurements. It was hypothesized that mask wearing would significantly increase facial temperature and that the mask–face gap size and location would noticeably regulate local temperatures, including the philtrum, chin, nose bridge, and cheeks. Specific aims included:
(1)
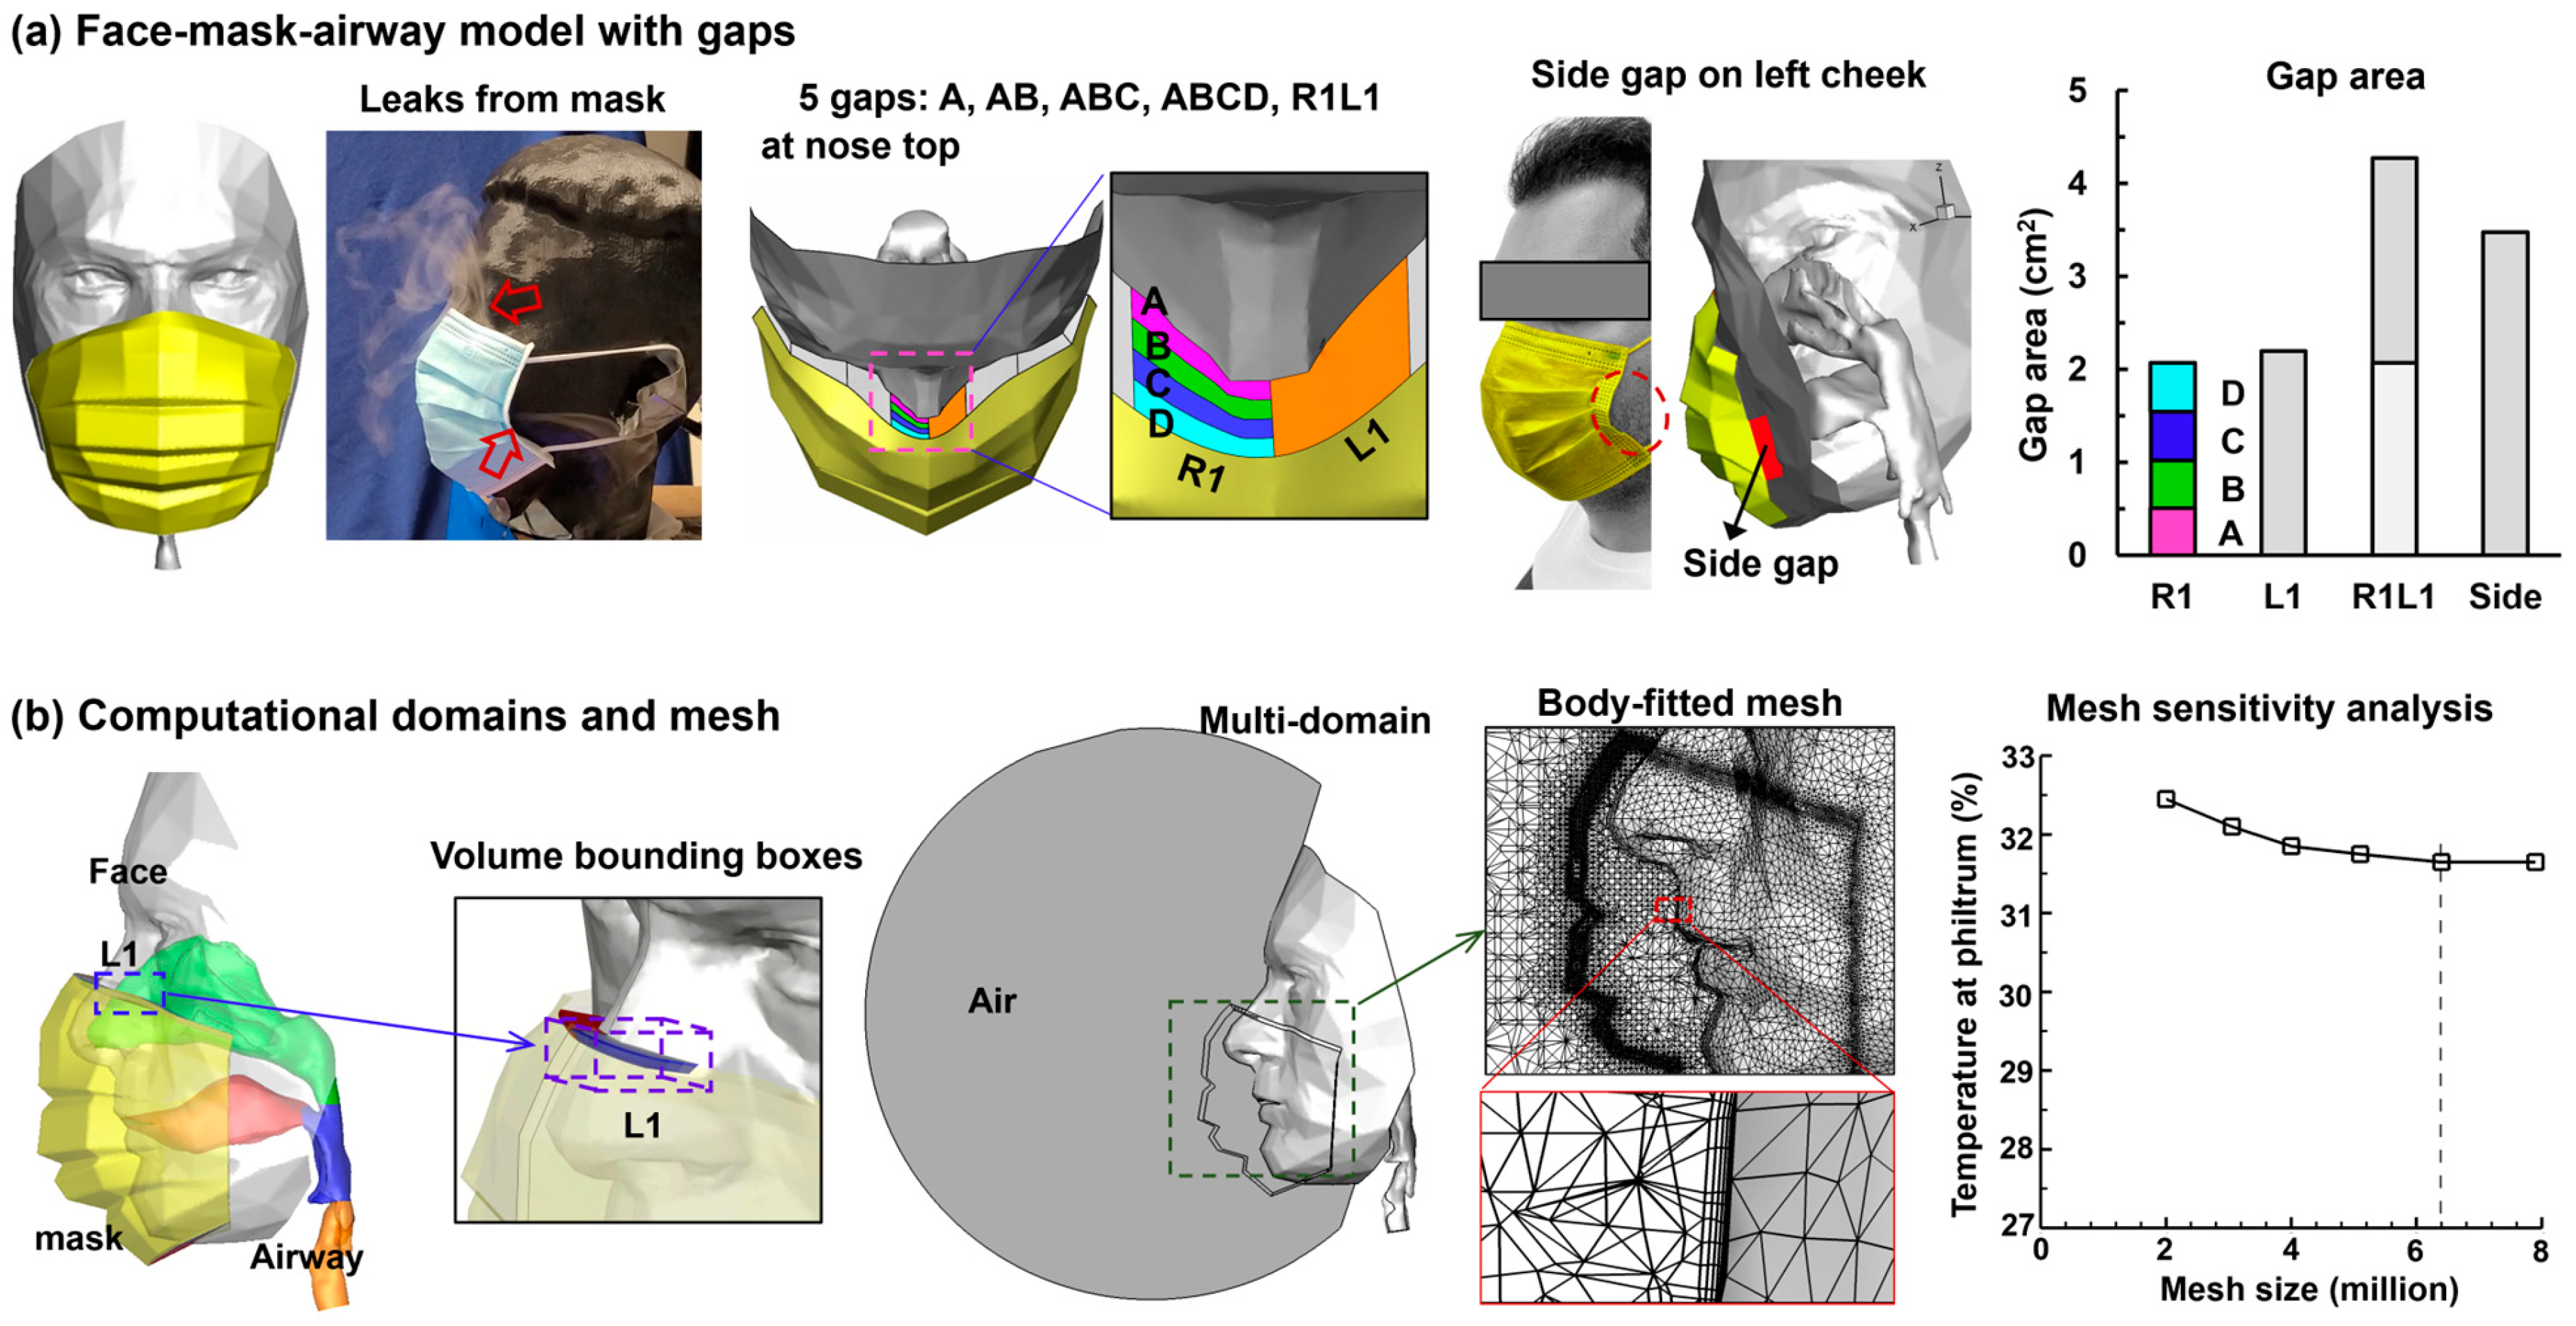
Develop an integrated ambient–mask–face–airway computational model with varying gaps for respiratory flows and heat transfer under tidal breathing.
(2)
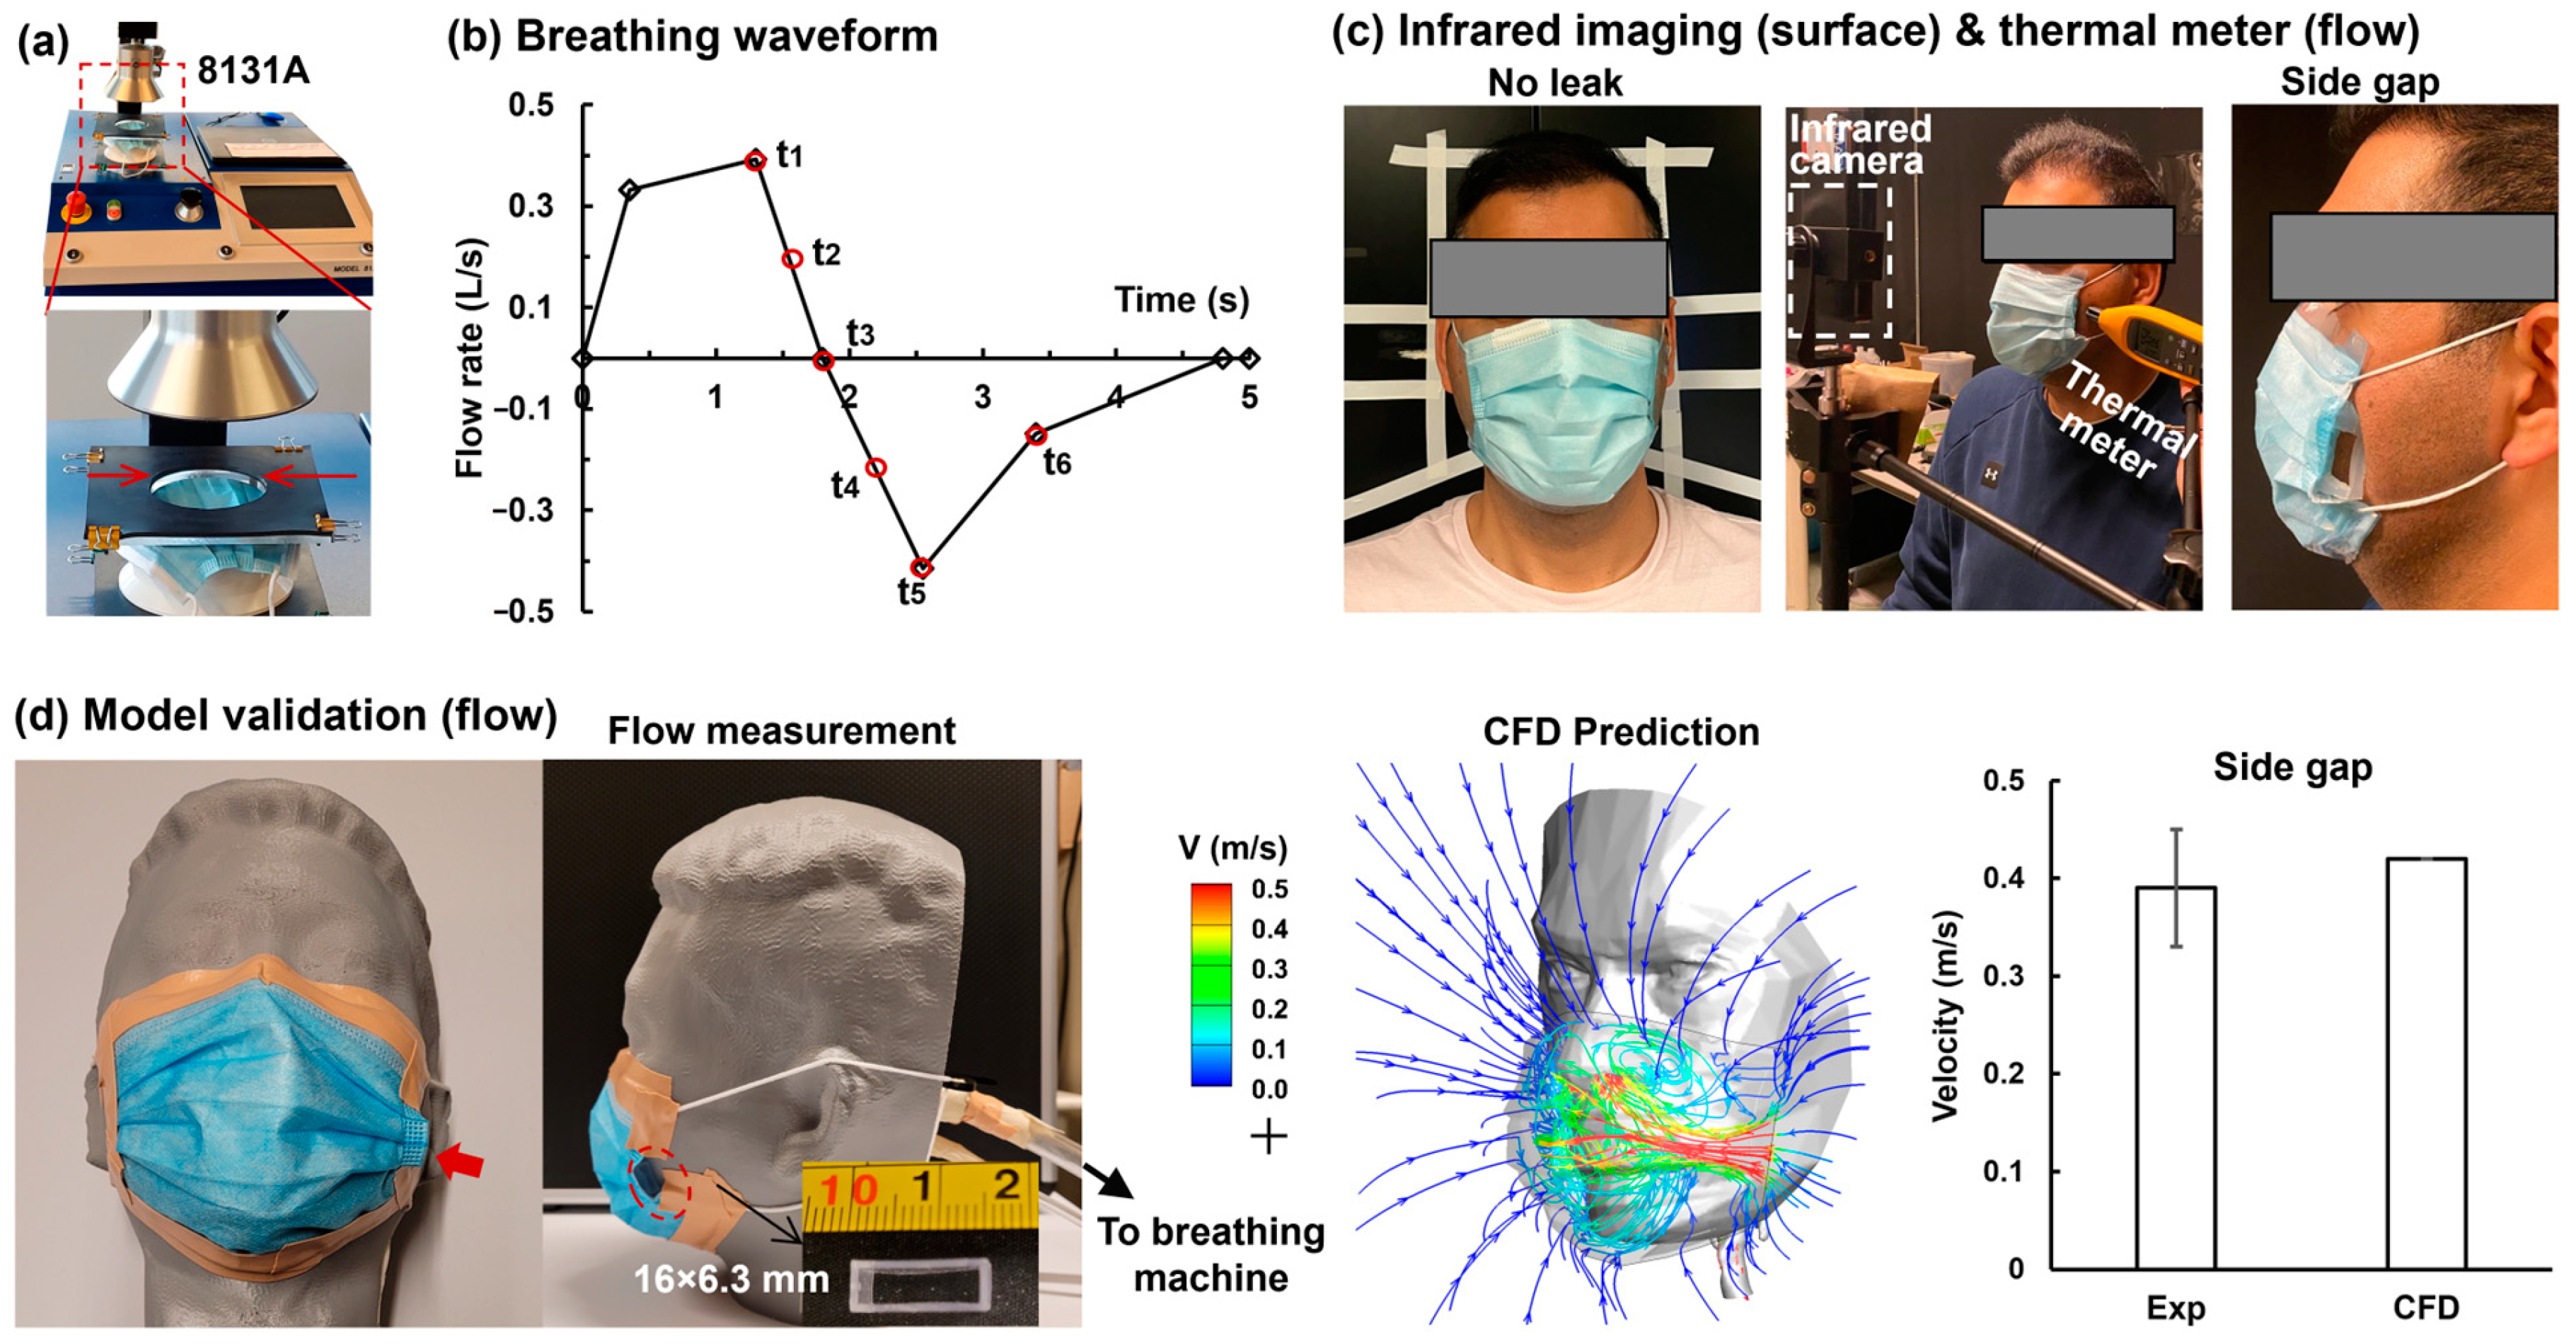
Validate the computational model against corresponding experimental measurements, including the mask–face surface temperatures using infrared imaging, the air temperature using thermal probes, and leakage flow velocities using an anemometer.
(3)
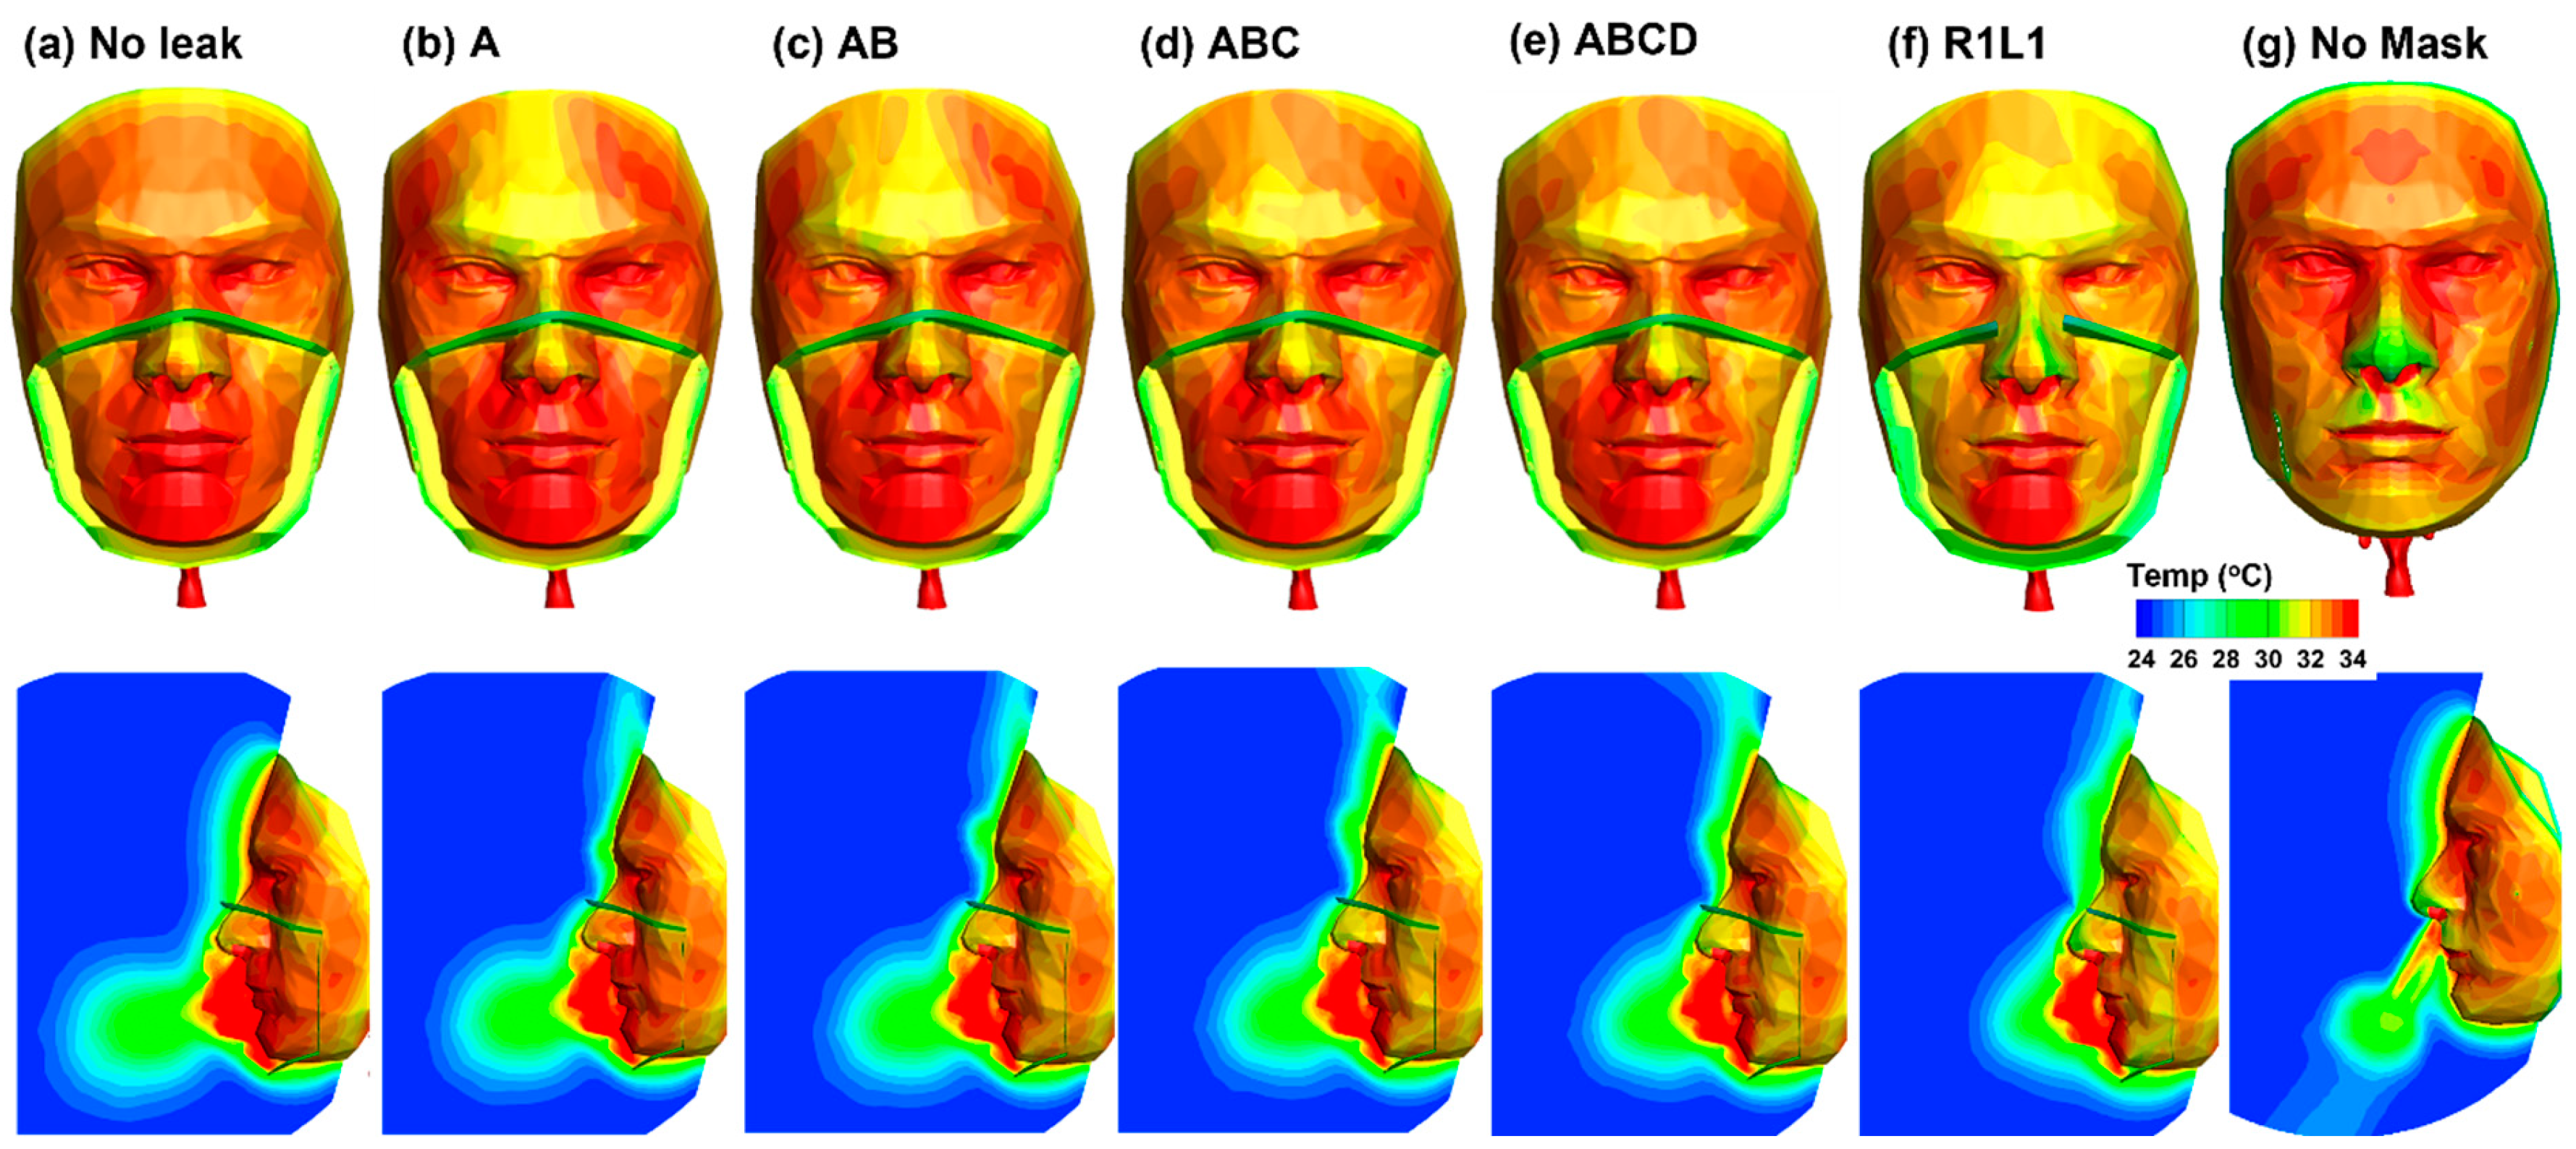
Quantify the temperature variations and thermal regulations under the facemask under varying leakage flows in comparison to the case with no mask.
(4)
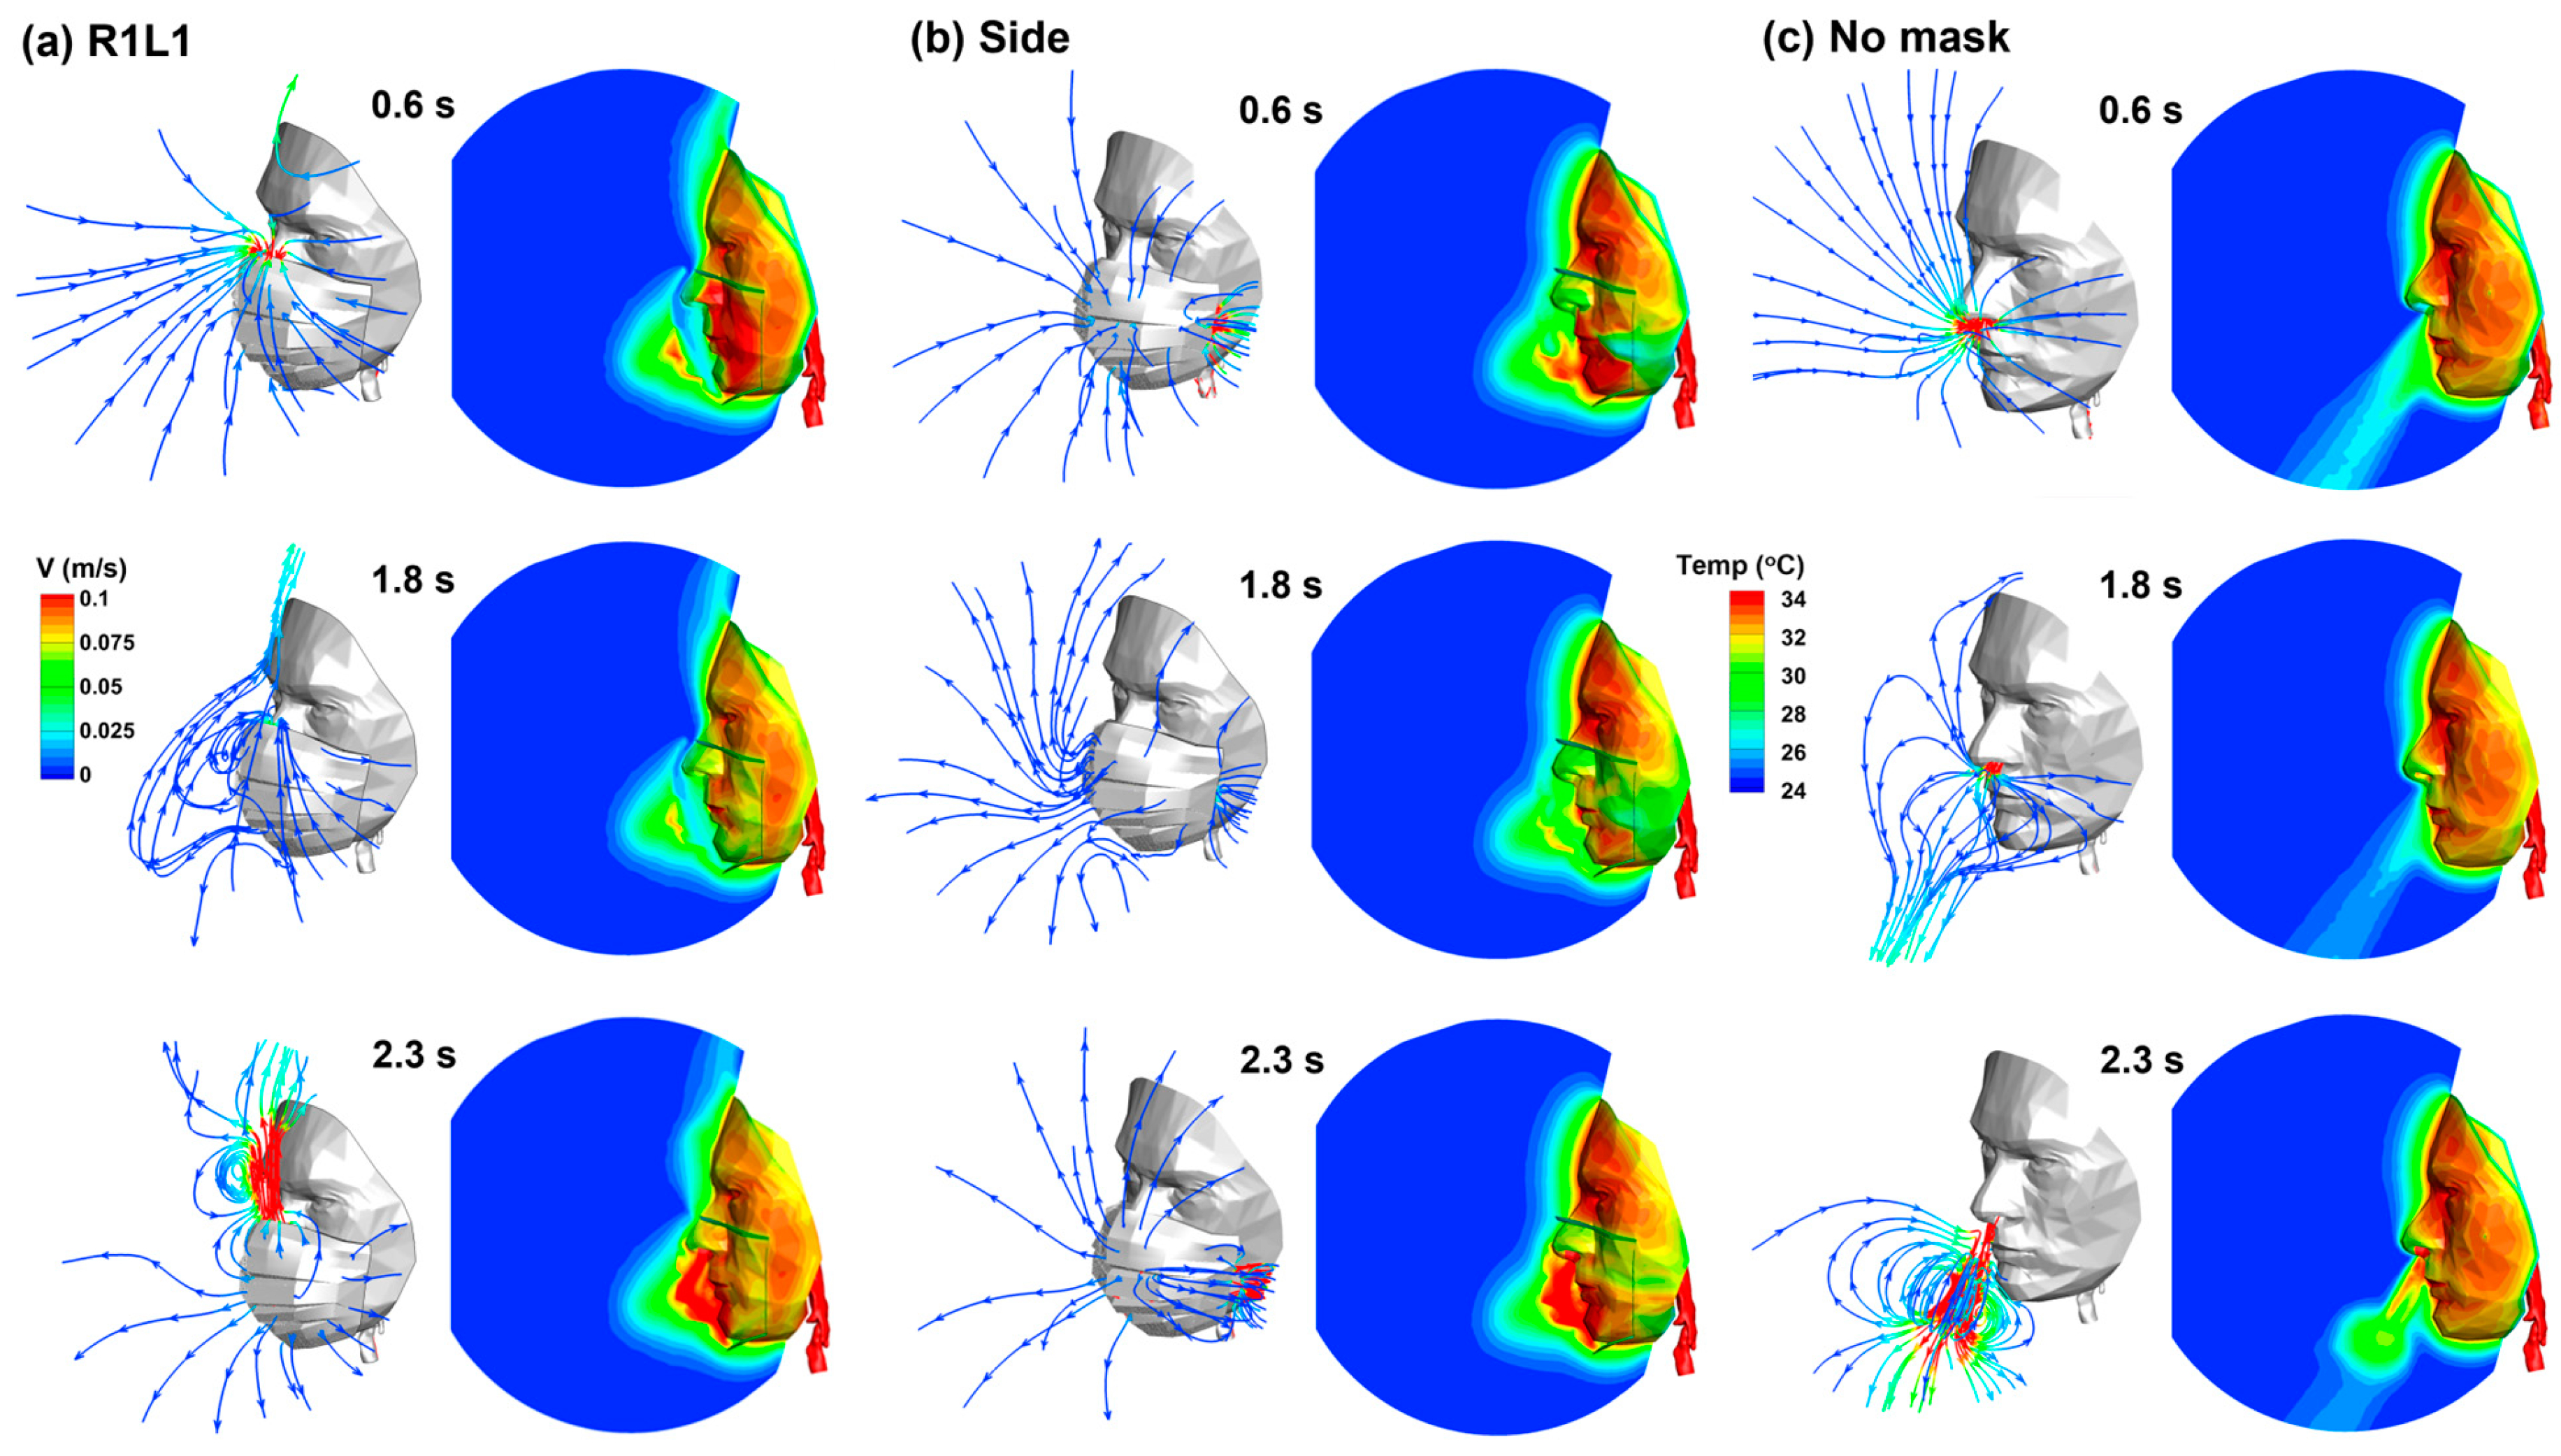
Examine the airflow characteristics underlying the spatiotemporal variation in face and airflow temperatures.

2. Materials and Methods

2.1. Mask–Face–Airway Model with Gaps

The computational model was composed of four distinct sections, each being a separate volume (Figure 1). These sections represented the surrounding air, a surgical mask, the airspace under the mask, and an upper respiratory airway that included the nose, mouth, pharynx, and larynx [48,49], as shown in Figure 1b. The graphics software Blender (Amsterdam, Netherlands) was used to develop the surgical mask geometry based on photos taken from varying orientations. Three pleats were retained in the mask morphology. The total surface area of the mask was 158 mm2, close to that of an actual surgical mask (150–160 mm2). The mask boundary snugly covered the face, forming a mask–face interface, as detailed in [50]. Numericaly, the mask was modeled as a porous medium, and its resistance was derived from pressure drops measured with a TSI mask tester (Figure 2a). The face–airway geometry was devloped based on MRI scans of a 53-year-old male and was integrated with the mask geometry [51,52,53].
To consider gaps along the mask–face interface, the mask geometry was divided into two parts: the mask front and the interface where the mask meets the face, as shown in the third and fourth panels of Figure 1b. When there is no leak, respiratory airflow traverses both the front of the mask front and the mask–face interface (i.e., both parts are specified as porous media). Distinct volumes were built along the mask–face interface. To investigate flows leaking from a gap, the volumes filling the gap were changed from porous media to air within the “cell zone conditions” [54,55]. Creating a gap at the mask–face interface can cause a significant portion of the inhaled air to flow through the gap, thus escaping the mask filtration.
There were five gaps (A, AB, ABC, ABCD, and R1L1) on the nose top and one on the left cheek (Side), as illustrated in Figure 1a. The gaps A, AB, ABC, and ABCD were on the right side of the nose bridge and represented a progressively worsening mask fit at the nose top. The gap R1L1 was on both the right and left sides of the nose bridge. The area of each gap is shown in the rightmost panel of Figure 1a, with A, B, C, and D stacking on each other, reflecting an incrementally enlarging gap. Note that the gap ABCD is the same as the gap R1 (Figure 1a). The mask–face interface is shown in the third panel in Figure 1b, which is further denoted by the refined mesh in the fourth panel in Figure 1b.

2.2. Facemask Physical Properties

The physical properties of a surgical mask include the filter resistance matrix (1/m2), thermal conductivity (W/m K), and heat capacity (J/kg K). The facemask flow resistance was calculated based on the measurement with a Filter Tester 8130A (TSI, Shoreview, MN). Figure 2a shows the Filter Tester, as well as the mask holding fixture featuring a circular hole with a diameter of 7.62 cm (or 3 in) and a cross-sectional area of 45.6 cm2. The viscous resistance of the mask was calculated using Darcy’s law:
Viscous Resistance = Δ P ( Q / A ) μ L
Given a TSI-measured ΔP of 4.86 mmH2O at Q = 85 L/min, a sampling area A of 45.6 cm2, and a mask thickness L of 2.3 mm, the mask resistance was determined to be 3.727 × 10⁹ 1/m2. The air dynamic viscosity μ was 1.825 × 10⁻⁵ kg/m·s. The heat capacity of the facemask was 42.85 J/kg K, the thermal conductivity was 0.11 W/m K, and the density was 946 kg/m3 [56,57].

2.3. Boundary Conditions for the Airway and Face

Cyclic breathing was considered in this study (Figure 2b). The respiration waveform followed that measured by Noto et al. [58] under normal breathing conditions, featuring a tidal volume of 0.5 L, a respiration cycle of 5 s (i.e., the respiration rate of 12 breaths per minute), an I:E ratio of 3:5, and a breath hold of 0.2 s at the end of exhalation. This resulted in the cumulative area in Figure 2b being 0.5 L above the x-axis and −0.5 L below the x-axis. The time to reach the peak inspiratory flow (0.332 L/s) was 0.35 s, the inspiratory time was 0.18 s, the time to reach the peak expiratory flow (0.415 L/s) was 2.55 s, and the expiratory time lasted 3 s (0.18–0.48 s). The airway wall maintained a constant body temperature of 310.15 K (37 °C). Physical properties of the face included a density of 1000 kg/m3, a heat capacity of 3770 J/kg K, and a thermal conductivity of 0.187 W/m K [59]. A mixed boundary condition of convection and radiation was specified on the face, with a heat transfer coefficient of 0.66 W/m K, a near-wall free stream temperature of 305 K, an external emissivity of 0.98, and an external radiation temperature of 298.15 K [60]. The wall thickness was 8 mm, and the heat generation was 6666 W/m3 [61]. The far-field ambient air had a temperature of 25 °C and zero pressure. A flow rate, following the waveform in Figure 2b, was prescribed at the tracheal outlet to mimic tidal breathing.

2.4. Numerical Methods

The low Reynolds number (LRN) k-ω turbulence model was employed to compute the multi-regime respiratory flows in the airway, mask–face space, and ambient space [62,63]. This model has been well validated to be suited for both turbulent and transitional flows [64,65]. The flow governing equations were solved using Ansys Fluent 21 (Canonsburg, PA, USA). The computational mesh was created with Ansys ICEM CFD. A multi-scale mesh approach was employed, using coarse meshes for the ambient air, ultra-fine meshes for the mask, normal meshes for the face, and fine meshes for the airway. This strategy aimed to balance prediction accuracy with computational efficiency (Figure 1b, upper panel) [66]. To account for the effects of boundary flow, prismatic cells with five layers’ expansion were generated in the near-wall region of both the face and airway (lower panel, Figure 1b). A grid-independent outcome was achieved at 6.4 million (Figure 1b), which was used for all following numerical simulations.

2.5. Experimental Methods

A FLIR ONE Pro iOS thermal camera (Wilsonville, OR, USA) was used to record the temperature variation on the mask worn by a volunteer under normal breathing conditions. Likewise, pieces of tape were applied along the mask–face interface to achieve a perfect fit (no leak), as shown in Figure 2c. A Fluke 971 thermal meter (Everett, WA, USA) was used to record the temperatures from the left-side gap (Figure 2c). Leakage flow speeds were determined from a gap located at the left-central cheek of a full-sized head manikin (Figure 2d). To ensure no leakage except the predefined gap, pieces of tape were applied around the mask–face interface. To introduce a gap with a defined size, a 6.5 × 17 mm rectangular duct was positioned between the mask and the skin at the left-central cheek. The head manikin was attached to a Robinair vacuum (Warren, MI, USA) that produced a consistent inhalation rate of 15 L/min. The speed of the flow exiting from the gap was gauged using a TSI 9565 VelociCalc anemometer (Shoreview, MN, USA). Data were collected five times to compute the mean and standard deviation, which were then compared to corresponding CFD projections.

3. Results

3.1. Model Validation

The computational model was validated against experiments in a threefold assessment: (1) leakage flow velocities through a prescribed gap of a surgical mask, (2) exhaled flow patterns without a facemask, and (3) temperature distributions on the mask during inhalation and exhalation. Figure 2d compares the measured and predicted expiratory flow velocities through a gap of 16 × 6.3 mm on the mask’s left side. The leakage flow velocity was sampled right at the gap and repeated five times, giving the mean and standard deviation in Figure 2d. The good agreement between the measured and predicted velocities indicates that the computational model adequately captured the mask’s flow dynamics.
Figure 3a compares the computational simulation with in vitro visualization of exhaled flows without a facemask for a steady flow rate of 15 L/min. Both exhibited jet flow patterns. It is also noted that the agreement was qualitative only. When wearing a facemask, recirculating flows were observed under the facemask, and exhaled flows traversed the entire mask (Figure 3b). Moreover, within the confined space beneath the facemask, the temperature varied significantly. The warm exhaled air rapidly blended with the trapped air, decreasing its temperature (Figure 3b).
Figure 4 compares the temperature distributions on the exposed face and facemask within one breathing cycle between the infrared imaging and computational simulations. A perfect seal (i.e., no leaks) was ensured in the infrared testing by using tape around the mask. During inhalation, cooler ambient air (blue color) was inhaled through the mask, and the large blue color area indicated that the inspiratory air was evenly distributed across the entire mask. During exhalation, the blue color on the facemask gradually transitioned to red, beginning at the nose, then at the lower facemask, and eventually at the upper facemask. Overall, the computational model replicated the cooling and warming effects during inhalation and exhalation, respectively. Furthermore, the temperature magnitudes on the face and facemask were also consistent with the infrared imaging and simulation results. Both findings suggest that the computational model effectively reproduces heat transfer in mask flows during tidal breathing.

3.2. Airflow and Temperature Variations with/without Mask Wearing

Figure 5 shows the airflow around the facemask, as well as the temperature distributions in the ambient air and on the face at varying instants within a breathing cycle. Streamlines were color-coded ranging from 0–0.1 m/s, while the thermal map was color-coded between 24–34 °C. Two common facemask-wearing scenarios were considered: one with a gap at the nose top (R1L1) and the other at the side (Side), with the R1L1 area slightly larger than that of the Side gap (4.27 cm2 vs. 3.48 cm2), as listed in Table 1. During inhalation (t = 0.6 s), streamlines converged towards the mask, with increasing speeds as they approached. Airflow entered the mask–face space either by penetrating the mask media or through the gap(s). The facemask media presented a substantially higher flow resistance, causing a noticeable proportion of the inspiratory airflow to redirect towards the gap and enter the mask–face space at a much higher speed (red colors in upper panels, Figure 5a,b). The intensified leakage flow would not only enhance convective heat exchange but also bring in colder air during inhalation and carry away warm air during exhalation, thus significantly impacting the thermal sensation on the mask-covered skin. At 1.8 s (middle row, Figure 5), representing the beginning of exhalation, strong mixing occurred due to flow reversal. One major difference in airflow streamlines was observed during exhalation (t = 2.3 s, lower row), where the no mask case exhibited a jet flow in contrast to the diverging profile in the two facemask-covering cases.
Figure 5 shows the temperature profiles both inside and outside the mask–face space. At 0.6 s from the start of the inhalation, cold air entered the mask–face space through the gaps and locally cooled down the air trapped under the mask (Figure 5a,b). The no mask case exhibited an inclined downward thermal plume (Figure 5c); this profile was different from the corresponding airflow profile (Figure 5c), which converged toward the nostrils. The concentrated thermal plume was remanent from the previous exhalation.
At 1.8 s (middle row, Figure 5), the thermal plume in the no mask case decreased in extent because of the constant inhalation of cold ambient air. However, due to the asymmetry between inspiratory (diffusively converging) and expiratory flows (concentrated jet-like), the thermal plume could not be eliminated completely by the inspiratory cold air. At 2.3 s (0.5 s from the start of the exhalation, lower row, Figure 5), a clear difference in temperature was observed inside and outside the mask, as part of the exhaled warm air was trapped in the mask–face space, recirculating and mixing with the remanent air. The cooling and warming effects by the leakage flows were observed in both mask-covering cases but were particularly pronounced in the side gap case, where the left cheek had a lower temperature during inhalation and a higher temperature during exhalation. Also noted was that in the left cheek, the cooling area during inhalation exhibited a wedge shape converging to the side gap (Figure 5b, middle panel), while the warming area during exhalation exhibited a stripe shape leaving through the gap (Figure 5b, lower panel), which were respectively consistent with the inspiratory and expiratory leakage flow patterns.

3.3. Vortex Dynamics and Thermoregulation

Figure 6 shows the instantaneous vortex structures among three cases at varying instants (inhalation, transition, and exhalation). As expected, vortices were observed through the gaps in both the R1L1 and Side cases during both inhalation and exhalation. Considering that it took time for a vortex to completely decay, a high-temperature vortex close to the skin was expected to increase facial temperature and cause a warm sensation.
For the case with a nose-top leakage (R1L1, Figure 6a) at 0.6 s (inhalation), the mask-covered facial skin exhibited higher temperatures than the uncovered skin, indicating a remaining warming effect from the previous exhalation. This was consistent with the high-temperature vortices near the nose (hollow blue arrow, Figure 6a). On the other hand, the cooling effect increased due to the inhalation of colder ambient air, as indicated by the green-colored vortices close to the mask (hollow pink arrow, Figure 6a). These vortices represent the airflows inhaled through the mask filter, which mixed with the warm air trapped under the mask. A portion of colder airflow was inhaled through the gap at the nose top (solid black arrow) and cooled down the trapped air close to the facial skin (Figure 6a, upper panel). At the end of inhalation (t = 1.8 s), the vortex temperature under the mask was lower than the facial skin temperature (middle panel, Figure 6a). These low-temperature vortices recirculated within the mask-covered space, cooling the facial skin.
The lower panel in Figure 6a shows the vortices at 0.5 s after the start of exhalation. The exhaled air gradually warmed both the air and facial skin under the mask to a temperature that was higher than the uncovered facial temperature. An appreciable portion of leakage flow was observed from the nose-top gap, whose temperature quickly decreased to the ambient temperature due to strong mixing. Careful observation also revealed a slightly higher airflow temperature near the forehead skin than the distal side, as illustrated by the brown hollow arrow in the lower panel of Figure 6a.
Figure 6b shows the vortex dynamics near the facemask with a gap at the left cheek (Side). Interestingly, the facial temperature was persistently lower on the left cheek than the surrounding skin throughout the breathing cycle. The leakage flow during inhalation effectively cooled down the left face due to forced convection (upper and middle panels in Figure 6b). Note the drastic differences in vortex structures between R1L1 and Side at 0.6 s (Figure 6a vs. Figure 6b), with the latter displaying a left-skewed asymmetry.
Figure 6c depicts the facial temperature and vortex dynamics without a mask. Negligible vortices were observed during inhalation because of the low-speed flows converging towards the nostrils. During exhalation, a sequence of vortices emanated from the nostrils, which advanced through the quiescent surrounding air and led to the formation of a large vortex ring (lower panel, Figure 6c). The temperature of the vortex ring quickly decreased to that of the environment. Throughout the breathing cycle, the facial temperature remained higher than the ambient temperature. This was due to the heat balance between the tissue heat generation, skin heat dissipation through radiation and convection, as well as the airflows inhaled at ambient temperature and exhaled at body temperature. To quantify the effects of mask wearing and leakage flows on facial thermoregulation, we treated the facial temperature with no mask as the baseline and hypothesized that an instantaneous local facial temperature higher than the baseline would cause a warm perception, and vice versa.

3.4. Gap Size Effects on Facial Theomoregulation

3.4.1. Airflow and Facial Temperatures

The effects of an enlarging gap on facial thermoregulation were further investigated by considering five gap sizes (A–D, R1L1) in comparison to the cases with either no leak or no mask. Figure 7 compares both the facial (upper panels) and airflow (lower panels) temperature distributions among these seven cases at 2.3 s (0.5 s from the start of exhalation). Overall, similar temperature patterns were observed among mask-wearing cases, with an elevated temperature on the covered skin compared to the uncovered skin. However, subtle differences were also noted. First, as the gap enlarged, the forehead temperature decreased progressively due to increasing leakage flows and associated convective heat dissipation. In comparison to the baseline case (no mask), the presence of leakage flows at the nose bridge noticeably cooled down the forehead (Figure 7g vs. Figure 7b–f). Secondly, the temperature on the two cheeks decreased with an enlarging gap size because of a more intensified convective cooling effect. At t = 2.3 s (i.e., 0.5 s from the start of exhalation), the exhaled warm air from the nostrils had not yet warmed up the facial skin. The airflow temperature under the mask had increased to 34 °C in contrast to 31–32 °C on the facial skin (lower panels of Figure 7); this was because the variation in the facial temperature lagged that of the airflow. Thirdly, with an enlarging gap, the thermal plume above the nose intensified while that in front of the mask decreased, indicating that an increasing leakage flow exited the mask–face space through the gap rather than the mask filter, an observation that was consistent with Schlieren imaging in [67,68]. In comparison to the baseline case (no mask), all mask-wearing cases had a higher temperature at the philtrum and nose tip due to the trapping/mixing of warm air during exhalation. Considering that the philtrum is more sensitive to thermal stresses than other regions of the face, quantifying the instantaneous local thermal stress could be critical in understanding the thermal regulation and sensation on the facial skin.

3.4.2. Temperature Variations at the Philtrum

The variation in temperature at the philtrum is shown in Figure 8 when wearing a facemask with various levels of leakage. Figure 8a shows the individual temperature variations for three breathing cycles. All cases exhibited approximately periodic fluctuations, indicating a dynamic balance between warming and cooling effects. In cases with no leak and gap A, both of which had a good mask–face fit, the lowest temperature still increased (dashed arrow in the first panel, Figure 8a), suggesting that the warming effects under the mask still built up 30 s after putting on a room-temperature facemask. The temperature buildup significantly slowed down for cases with a gap AB or larger. The temperature profile with no mask (the last panel in Figure 8a) showed a different pattern from those with face coverings, which appeared to be more similar to the respiration waveform as displayed in Figure 2b. Figure 8b compares the temperature profiles among the eight cases by plotting them with the same T scale (25–37 °C). As expected, the philtrum temperature with no leak was the highest of all time and had a small range of variation (solid black line). Compared to no mask, mask wearing with no leak increased the temperature at the philtrum by 4.3 °C (Figure 8b). Large temperature fluctuations occurred for all leaking cases, and the fluctuation amplitude increased with the gap size. The case with no mask had a constantly low philtrum temperature with a small range of variation (dashed black line). However, even lower philtrum temperatures were found in loose-fitting cases of ABCD and R1L1 during inhalation, when the inhaled ambient air through these large gaps significantly cooled down the philtrum with elevated forced convection.
The philtrum temperature variation was also sensitive to the gap location. Even with a similar gap size between R1L1 and Side, notable differences existed in both the shape and amplitude between these two cases, with the Side gap exhibiting a more erratic profile but a smaller variation amplitude (brown solid line vs. red dotted line in Figure 8a,b). Considering the four cases from A to ABCD with increasing gap sizes, the temperature fluctuation amplitude increased progressively but at a decreasing rate (Figure 8b).
Taking the no mask case as the baseline situation that was acclimated to the environment, we hypothesized that a local temperature higher than the baseline would warm up that region and elicit a warm perception, and vice versa. As a result, all temperature profiles were replotted in Figure 8c by subtracting the instantaneous baseline temperature (i.e., ΔT). For all cases of facemask wearing considered, there was a much shorter period of cooling period (<1.4 s out of 1.8 s of inhalation) than warming (>3.5 s out of 5 s respiration). Furthermore, the ΔT magnitude was larger during the exhalation than inhalation, which was consistent with an overall warming effect with facemask wearing, as shown in Figure 8d–f.
The ΔT relative to the baseline was integrated with time (q = ∫ΔTdt) separately for the periods of warming and cooling in each of the three breathing cycles, as shown in Figure 8d, with the brown bar denoting warming and blue cooling. Figure 8e shows the mean and standard deviation of the q (warming and cooling), while Figure 8f shows the net warming effects. In both figures, we noted (1) dominant warming over cooling, (2) reduced warming with larger gaps, (3) increased cooling with larger gaps, and (4) insignificant variance among three consecutive breathing cycles. The variances were presumably due to the transient flow oscillations despite an overall repeating flow pattern across cycles.
Comparing no leak vs. A–ABCD, the warming effect decreased nonlinearly with the gap size and reached equilibrium at ABC, indicating that even with a very small gap (like A), the warming effect could be reduced significantly. The warming effects persisted for gaps of ABC and larger (Figure 8d), because of the trapping of exhaled warm air, which recirculated around the philtrum. Comparing A–ABCD and R1L1 with increasing gap size and at the same site (nose top), the cooling effect constantly increased, indicating the elevating forced convection of inhaled ambient air through the gap. Comparing the cases of R1L1 and Side cases with gaps of similar size but different locations, the warming effect on the philtrum was similar, but the cooling effect was higher when leakages occurred at the nose top (R1L1) rather than the lateral sides (Figure 8d–f). This would lead to an overall higher warm perception at the philtrum with a side gap than with a gap at the nose top (Figure 8f).

3.4.3. Temperature Change Rate at the Philtrum

Figure 9a shows the change rate of temperature, dT/dt, at the philtrum. Either one, two, or multiple peaks were observed within each breathing cycle, depending on the gap size and location. When there was no leak, one major spike was observed during the transition from inhalation to exhalation (i.e., 17 s, 22 s, and 27 s, Figure 9a, first panel). For cases with a nose-top gap (A–R1L1), the dominant spike occurred during the transition from exhalation to inhalation and had multiple spikes with much smaller amplitudes during the inhalation-to-exhalation transition (Figure 9a, second panel). Multiple spikes in philtrum dT/dt were also observed when there was a side leakage; the spikes were of similar magnitudes and were not all occurring at the breathing transitions (Figure 9a, third panel). The dT/dt peaks in the case of no mask had significantly smaller magnitude and the change was much less drastic (Figure 9a, fourth panel).
A comparison of dT/dt among eight cases within the same range is shown in Figure 9b, with zoomed views for the inhalation (view 1) and exhalation (view 2). Three observations were noteworthy. First, the philtrum dT/dt amplitude was much lower in the cases of no leak and no mask than in any mask-leaking cases, regardless of the gap sizes; this was especially more pronounced during the inhalation (Figure 9b, middle panel). Second, the dT/dt peak amplitude increased with the gap size, even though nonlinearly, during both inhalations and exhalations. Thirdly, the philtrum dT/dt profiles were significantly different between the inhalation and exhalation. Understanding the differences in dT/dt among varying gap sizes and locations would be beneficial to the development of correlations between facemask leakage and temperature measurements. Relying solely on temperature for the correlation development would result in measurement instability due to a large dT/dt, thereby reducing the correlation’s accuracy. However, incorporating dT/dt itself as an additional index in the correlation could enable more accurate predictions of facemask leakage. Furthermore, since the dT/dt profiles differed remarkably between different gap locations, including dT/dt in the correlation would even facilitate pinpointing the gap site, thereby providing more relevant information for improving facemask design for specific patient subgroups.

3.4.4. Temperature Variations at the Chin

Temperature profiles at a different sampling site (chin) are shown in Figure 10. Because the chin was approximately 6.5 cm below the philtrum, the temperature profiles of these two points appeared similar for each corresponding case considered except ‘No mask’ (Figure 8 vs. Figure 10). This might be attributed to the flow recirculation in the philtrum–chin zone in all face-covering cases, while such a recirculation flow was absent in the case of no mask, which instead had a jet flow during exhalation and a converging flow during inhalation. Note that even for the baseline case ‘No mask’, the skin temperature varied both temporally and spatially due to the instantaneous rivalry between heat generation and convective heat dissipation.
The warming and cooling effects relative to the control case are shown in Figure 10c. Again, the warming effect at the chin was the highest with no leak and decreased when leakage existed, similar to that at the philtrum. However, a quantitative comparison between Figure 10c and Figure 8e revealed that the chin warming effects were lower than the philtrum (i.e., 15 °Cˑs at the chin vs. 25 °Cˑs at the philtrum for no leak). On the other hand, the chin cooling effect was much higher than the philtrum (i.e., −7 °Cˑs at the chin vs. 3 °Cˑs at the philtrum for R1L1, which had the largest gap at the nose top). The latter was reasonable, considering that during inhalation, the convective cooling flow through the nose-top gap was stronger at the chin than the philtrum, which was partially blocked by the nose tip. This difference also suggested that the philtrum was more likely to perceive excess warmth, let alone the fact that the philtrum was more sensitive to thermal variation.

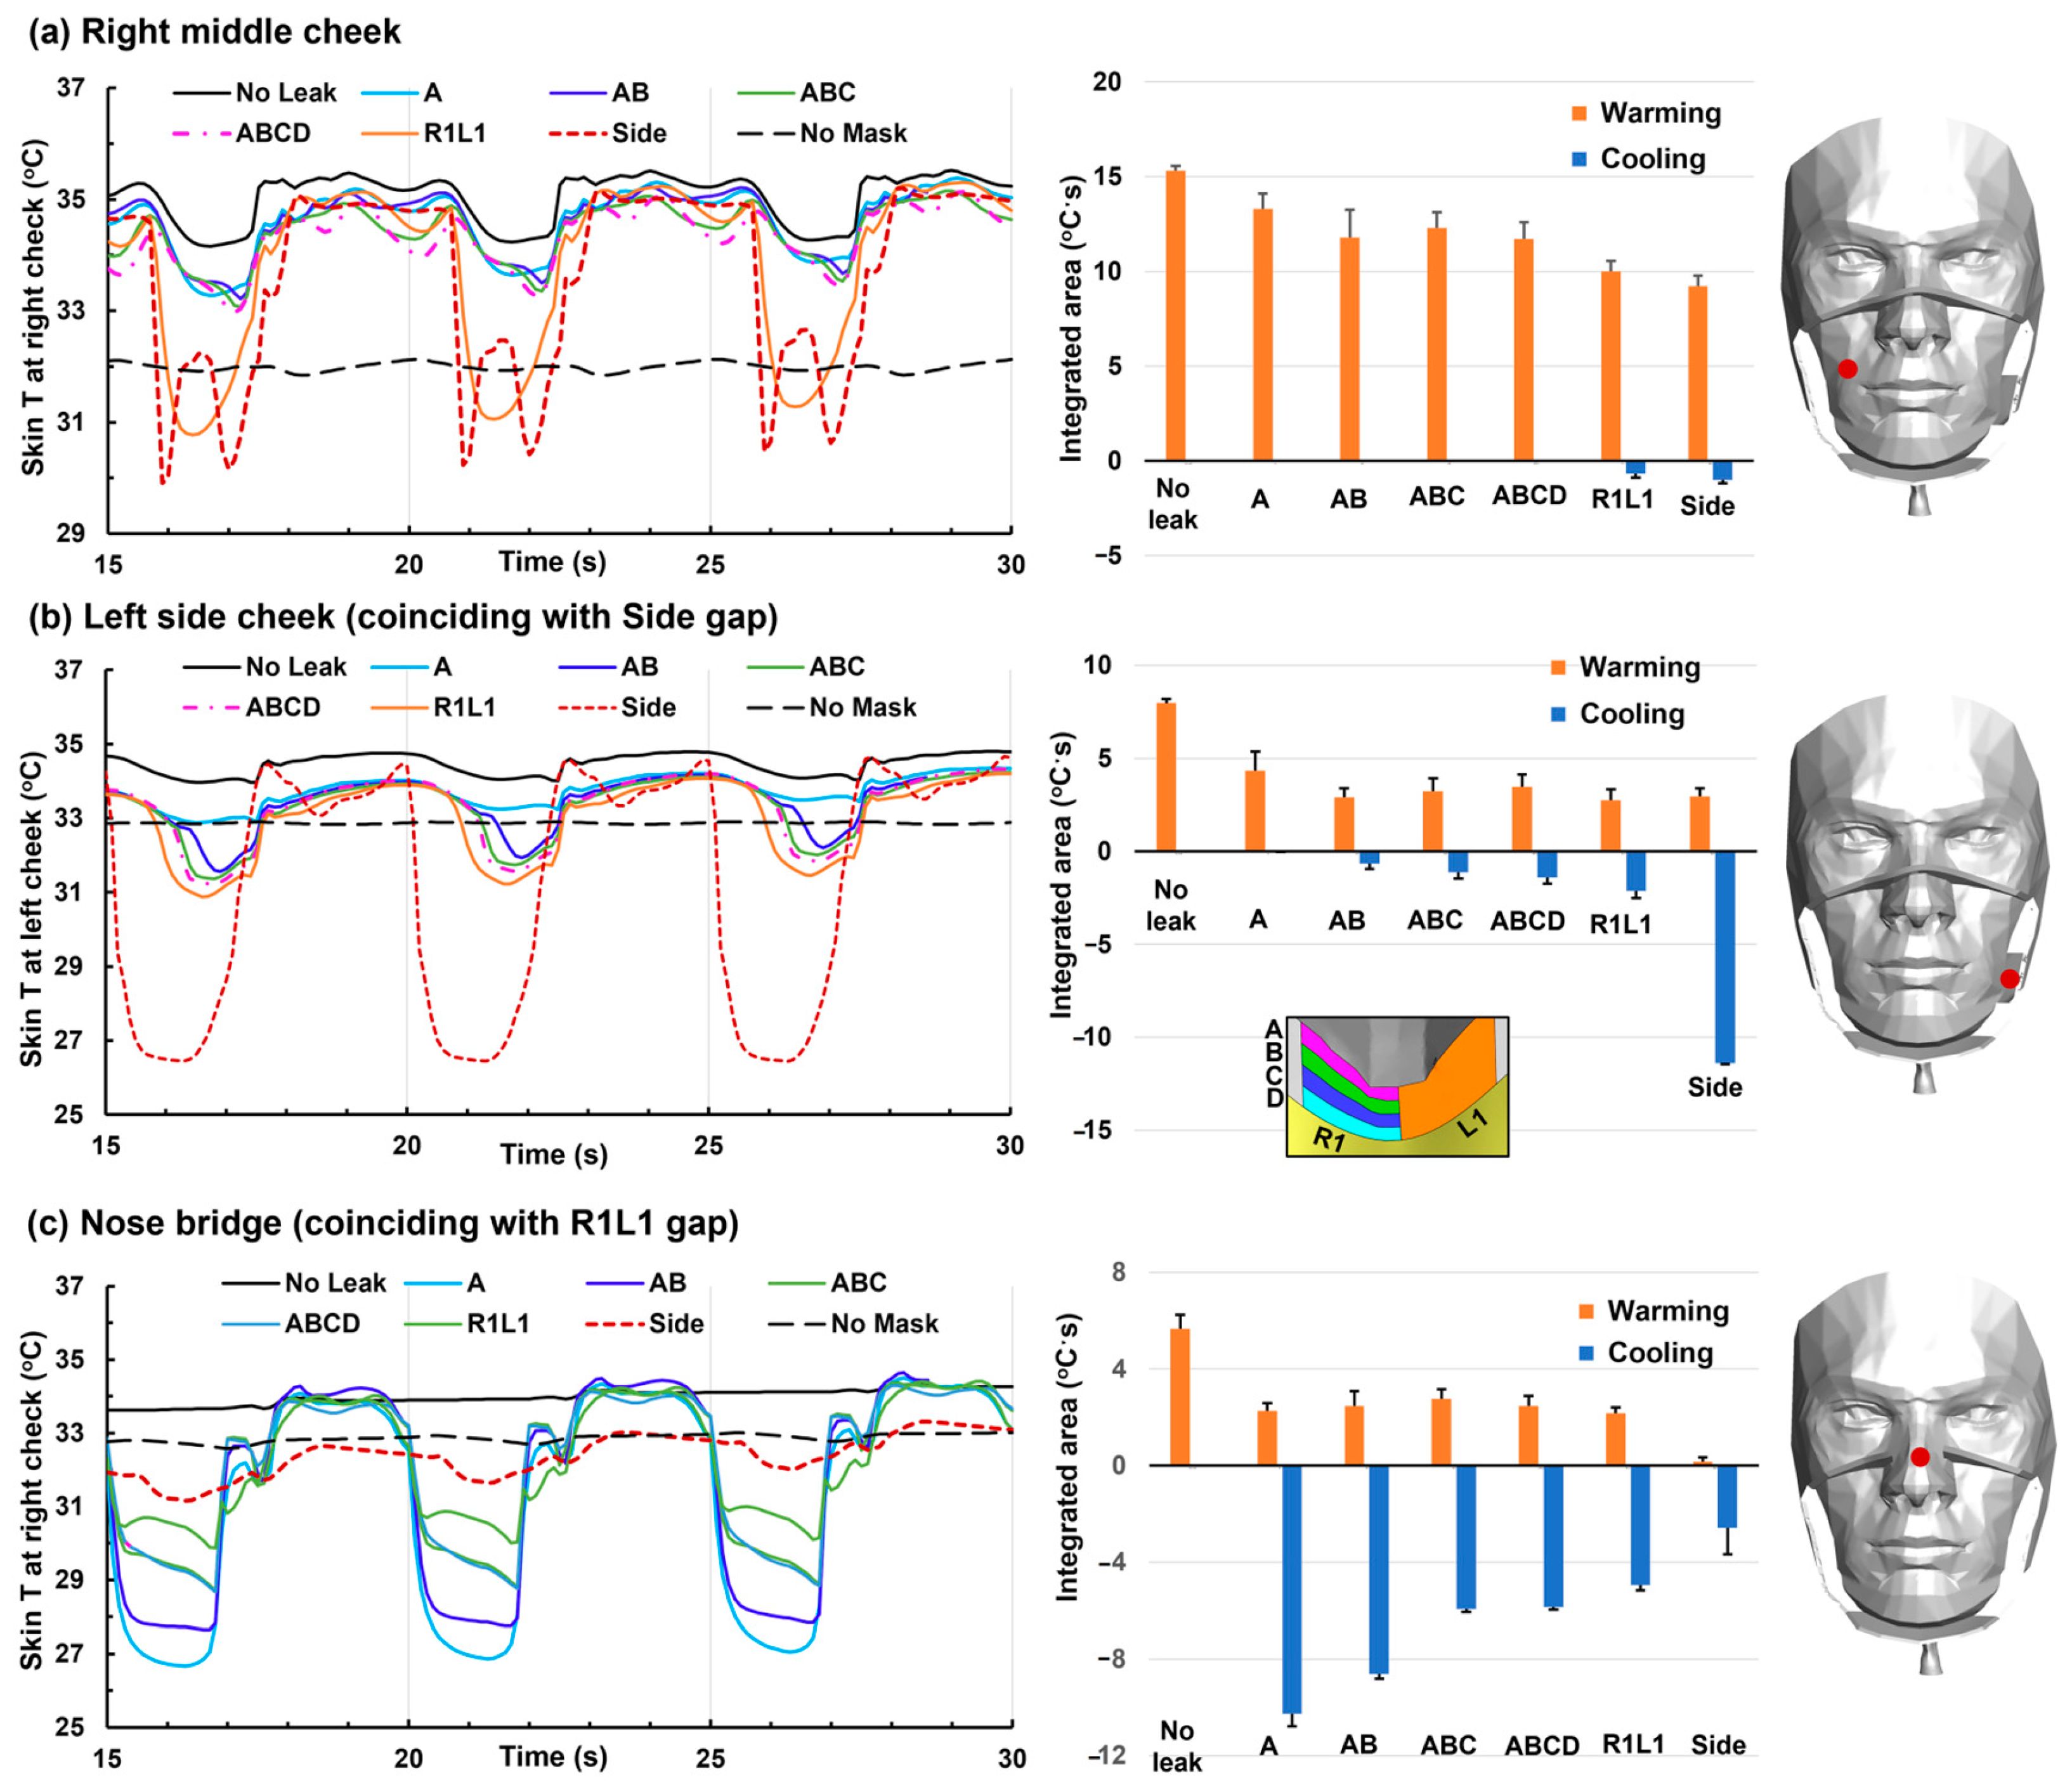
3.4.5. Temperature Variations at the Right/Left Cheeks and Nose Bridge

Figure 11 shows the temporal temperature profiles (T-profiles) and thermal regulation under varying mask wearing conditions at three sampling points: the right-middle cheek, the left-side cheek (coinciding with the side gap), and the nose bridge (coinciding with the R1L1 gap). The T-profile at the right-middle cheek (Figure 11a) had a much narrower range (30–35 °C) than that at the two peripheral sampling points at the left-side cheek and nose bridge (26–34 °C, Figure 11b,c). The temporal temperature variation was not linear with the gap size; this was reasonable as the local flow features were not linear with the gap size, which varied drastically both temporally and spatially.
In Figure 11a, the T-profiles at the right-middle cheek had similar magnitudes for gaps A–ABCD (0.51–2.07 cm2), while the magnitude increased abruptly for the gap R1L1 and Side (4.27 and 3.48 cm2). This difference might result from the bulk leakage flow, which was not strong enough to reach the right-middle cheek until the gap size increased to R1L1 and Side. In Figure 11b, the T-profile at the left-side cheek fluctuated at a drastically larger amplitude when the leakage flow coincided with the sampling point. The corresponding T-profiles with a nose-top gap (A–ABCD, R1L1) exhibited similar patterns, and the fluctuation amplitude increased with the gap size. In Figure 11c, the T-profile at the nose bridge was sensitive to the nose-top gap size but not to the side gap. It was observed that the largest fluctuation in the T-profile occurred at gap A and decreased nonlinearly with increasing gap sizes. This observation and its implications for facial thermal regulation will be explained in the following sections.
Considering the thermal regulation with mask wearing, it was no surprise that a perfect seal (i.e., no leak) led to the highest warming effect for all sampling points considered. The warming effect gradually decreased with the gap size from A to ABCD to R1L1 and Side. The warming effect at the right-middle cheek had a much larger magnitude than that of the other two points (Figure 11a vs. Figure 11b,c), both of which were peripheral to the nostrils and close to the mask brink. Specifically, the cooling effect at the right-middle cheek was negligible for the gap size of ABCD and smaller. The cooling effect became perceivable for R1L1 and Side (4.27 and 3.48 cm2) but was still much smaller than the counterpart warming effect, which was reasonable due to the prolonged contact between the facial skin and the trapped expiratory warm air under the mask. Therefore, the net warming effect at the right cheek was large for all mask wearing conditions considered (right panel, Figure 11a).
The right panel of Figure 11b shows the thermal regulation on the left-side cheek. When the gap (i.e., side) was the same as the sampling point, the cooling effect was significantly higher than warming (i.e., −12.3 vs. 2.4 °Cˑs, Figure 11b, side). By comparison, the cooling effect was much smaller for all nose-top gaps considered (A–ABCD, R1L1), which only became noticeable from AB and increased with gap size. It was noted that leakage flows via the nose-top gaps affected both the flow distribution and heat balance under the facemask.
Interesting observations in thermal regulation were made when both the sampling point and leakage flow were at the nose top (Figure 11c, right panel). The warming effects appeared insensitive to the gap size and were small in magnitude (i.e., 1.8–2.8 °Cˑs). The cooling effect peaked at the smallest gap A (10.6 ± 0.5 °Cˑs), decreased slightly at gap AB (8.6 ± 0.2 °Cˑs), and stabilized for larger gaps (5.6–6.2 °Cˑs, ABC, ABCD, and R1L1). The peak cooling at gap A might be counterintuitive at first glance. This, however, was reasonable, as explained by the velocity and temperature profiles in the four enlarging gaps (A–ABCD). At gap A, both the flow and thermal boundary layer were the thinnest and had the highest gradient. When the gap increased, the thickness of the shear/thermal layers increased, and the near-wall gradient decreased, even though the leakage volumetric flow rate increased. Furthermore, the vortices within the leakage flow enhanced the mixing, leading to a relatively constant shear/thermal layer thickness at gap ABC and larger (Figure 11c).
A negligible warming effect was observed at the nose bridge when the leak occurred at the left-side cheek (Figure 11c, right panel, side gap). This indicated only a small amount of expiratory air was ventilated to the nose top while the majority exited through the side gap. On the other hand, a nontrivial cooling effect occurred at the nose top from the side leakage flows, reflecting the high level of asymmetry in thermal-fluid dynamics between the inhalation and exhalation phases (i.e., a hysteresis loop).

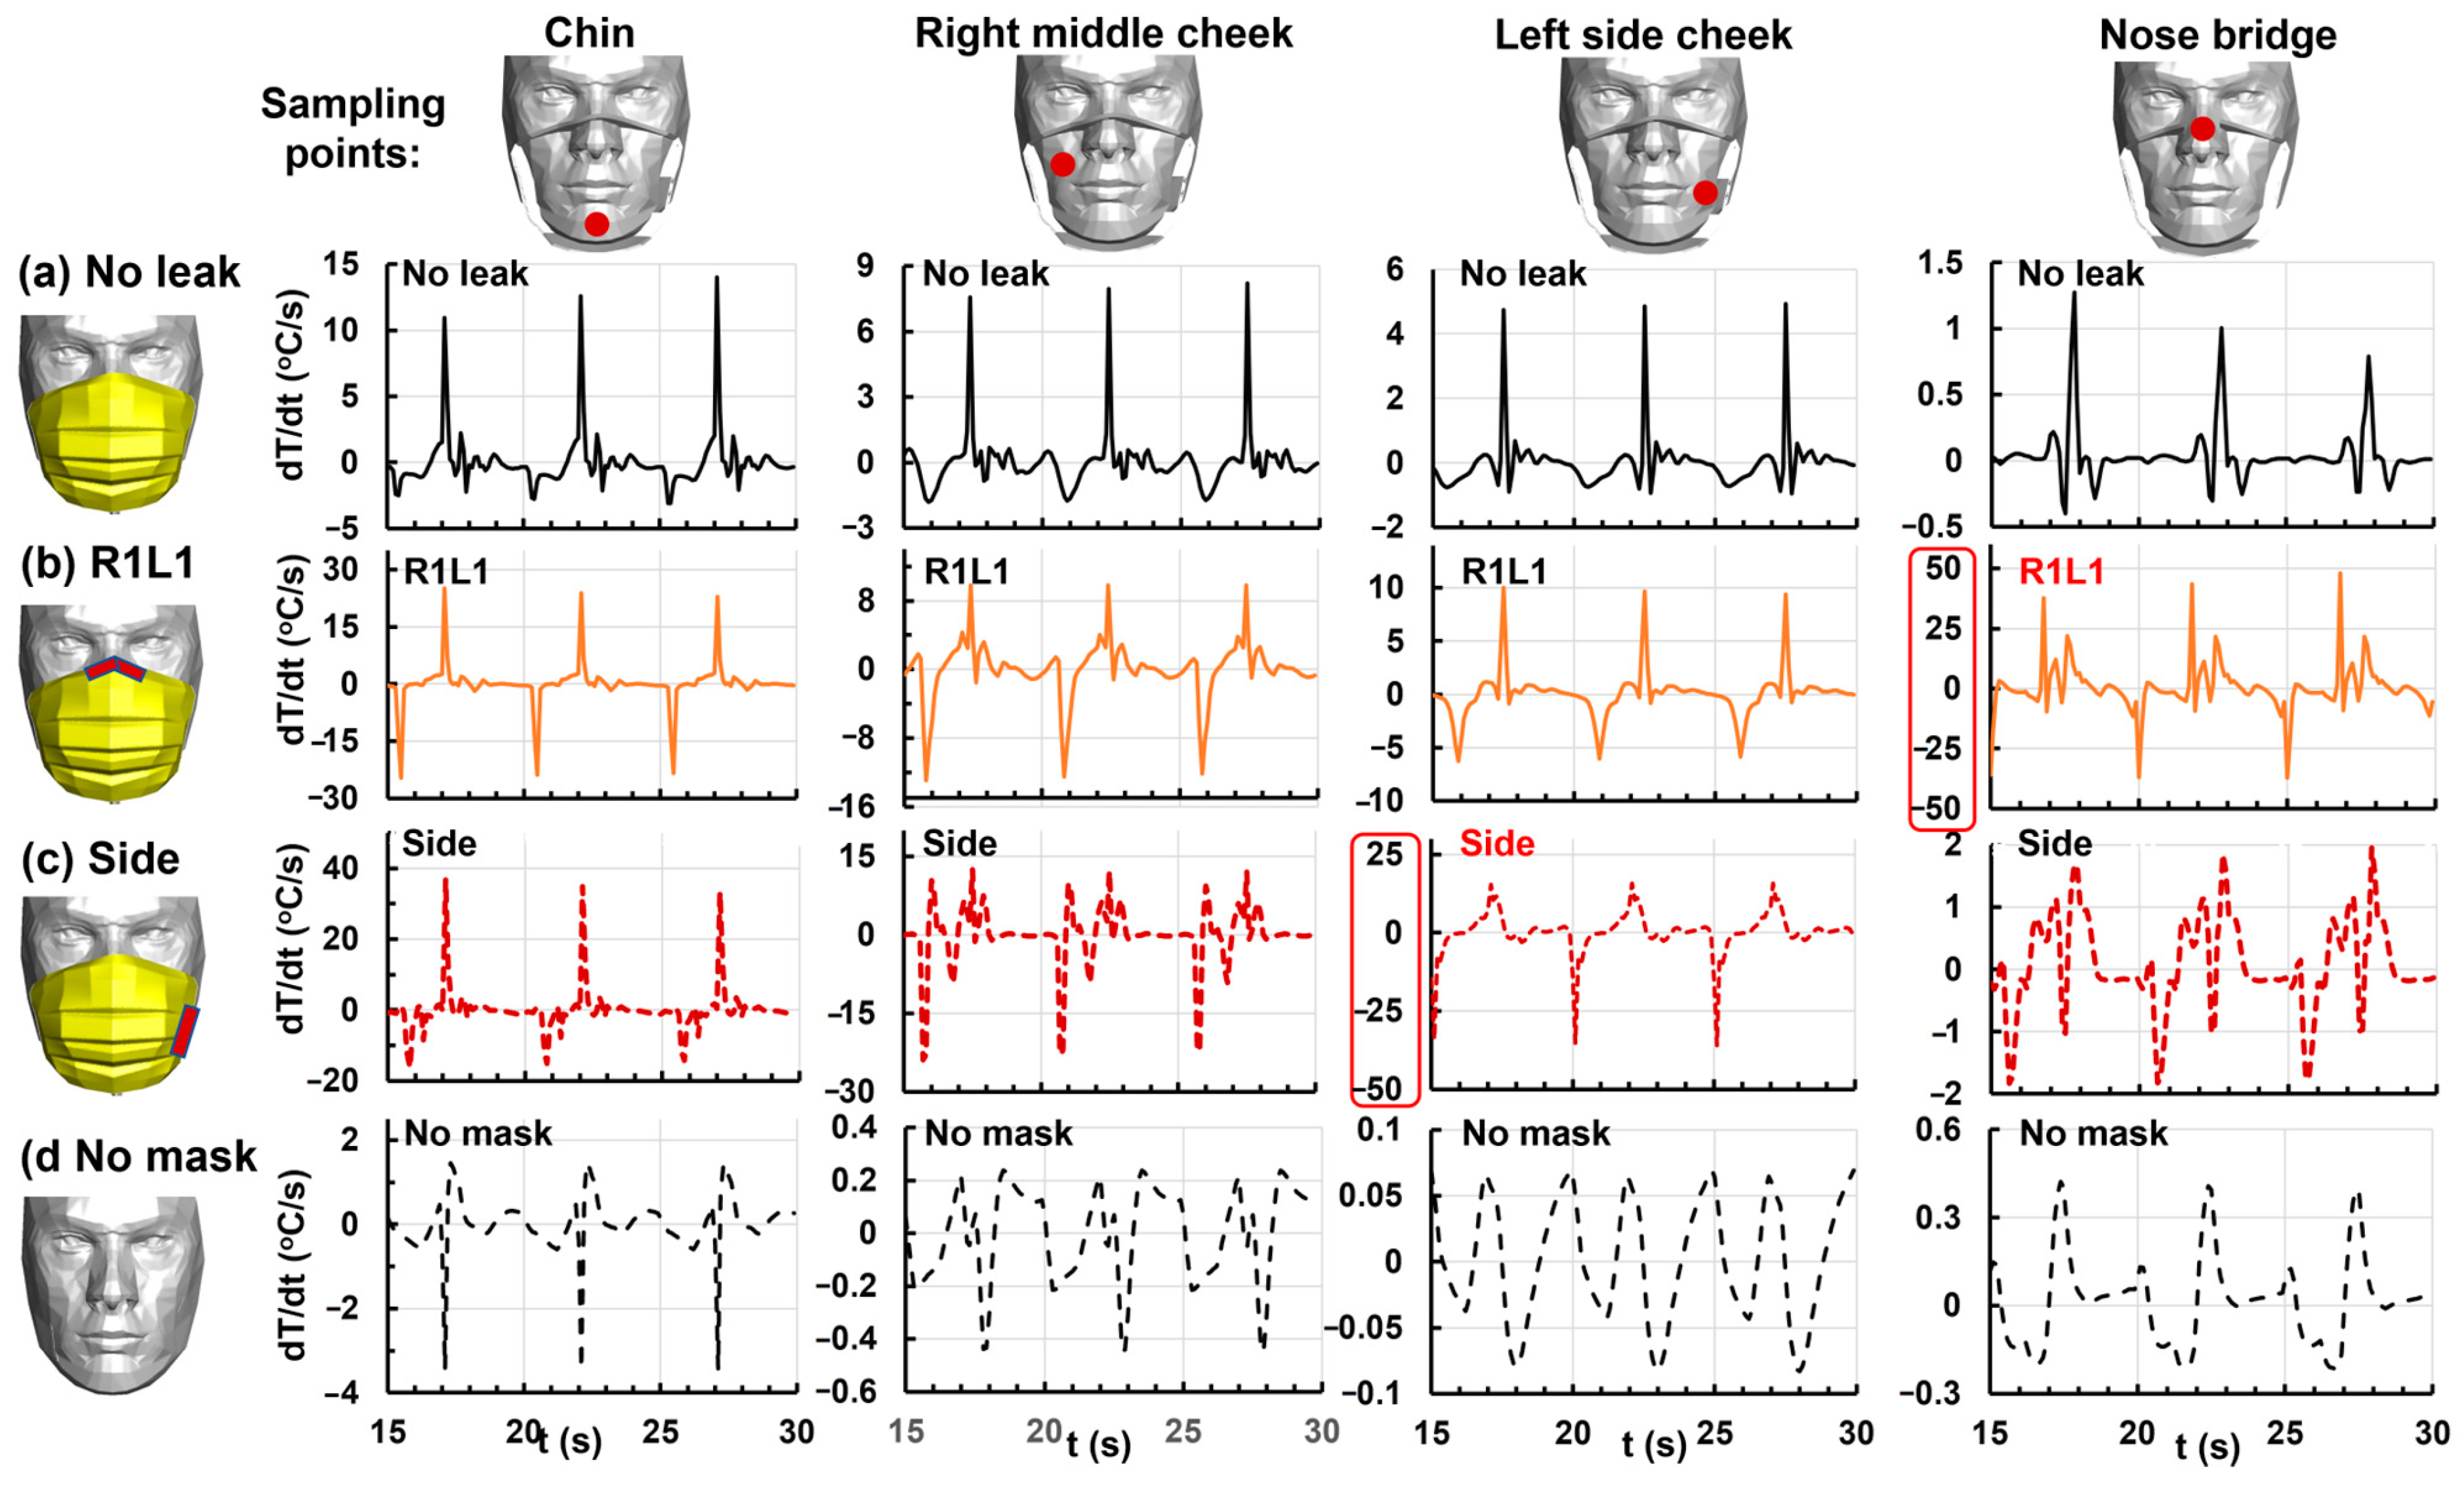
3.4.6. Temperature Change Rate at the Chin, Right/Left Cheeks, and Nose Bridge

Figure 12 shows the temperature change rate (dT/dt) at four sampling points (columns) under four mask wearing conditions (rows) for three breathing cycles (15–30 s). The dT/dt magnitude was associated with the heat stress and could affect the facial skin sensation. Several observations were noteworthy in Figure 12. First, abnormally large magnitudes in dT/dt were found when the gap coincided with the probe, as displayed in Figure 12b (R1L1 gap~nose bridge probe) and Figure 12c (Side gap~left-side cheek probe). Secondly, when the facemask fit perfectly (no leak), the dT/dt profiles appeared similar in pattern for all probes, with a sharp peak at the end of inhalation. It was also noted that the dT/dt peak magnitude was much lower at the nose bridge, where the flow ventilation was also the least with a perfect seal. Thirdly, for a given sampling point, distinct dT/dt profiles were found among the four mask wearing conditions. Likewise, for a prescribed gap, the dT/dt profiles at different sampling points were both different and unique. Thus, it was possible to use the thermal properties at several sample points, individually or as a combination, to decide a mask wearing condition, such as the gap size and gap location.

4. Discussion

In this study, we developed an integrated ambient–mask–face–airway computational model that considered tissue heat generation, skin heat dissipation, and warming/cooling effects from exhalation/inhalation and validated it against complementary experiments. Subsequently, we systematically investigated respiratory flows and temperature variations when wearing a surgical mask with different gap sizes and locations. The simulation results agreed well with our general knowledge regarding mask wearing. They also provided rich insights into the transient thermal regulations under the mask that were difficult to measure using conventional experimental approaches. These included the detailed thermal regulation mechanisms, the unique temperature variation patterns in the mask-covered space and on the mask-covered face, and their potential implications for developing a mask-fit tester for disposable masks or formulating mask wearing guidance, which will be discussed in more detail below.

4.1. Thermal Regulation Mechanisms with Mask Wearing

The thermoregulation under the facemask is determined not only by the rivalry between exhaled warm air and inhaled cool air but also by the balance between convective/radiative dissipation and continuous heat generation from the skin. The mask’s resistance and fit will determine the fraction of air through the mask and the gap, as shown in Table 1. The mask’s heat capacity and conductivity will determine how fast the mask temperature changes, while the airflow around the facemask will influence the efficiency of heat exchange between the air inside and outside the mask (i.e., via convection), as illustrated in Figure 5, Figure 6 and Figure 7. Due to the physical and thermal resistance of the facemask, a local flow-temperature environment will be created under the mask, which will be warmed by the exhaled warm air and body-generated heat while being cooled down by the inhaled ambient air and heat dissipation from the mask surface. In this study, we observed that the time to reach an equilibrium between heat generation and heat dissipation was longest for the case of ‘no leak’, and gradually decreased with increasing mask–face gap sizes. For normal respiration and an ambient temperature of 25 °C as in this study, the no leak case took more than 12 breathing cycles (i.e., 1 min) after putting on the mask to reach the heat equilibrium. For each case, the temperature profile repeated itself once the equilibrium was reached.

4.2. Unique Patterns of Temperature Variations vs. Gap Size/Location and Sampling Points

We observed unique patterns of temperature variations vs. gap size, gap location, and sampling points, as demonstrated in Figure 8, Figure 9, Figure 10 and Figure 11. These included (1) the temporal temperature profile, (2) the relative magnitudes of temperature variation, and (3) the inhalation–exhalation asymmetry in cooling–warming. For instance, for a given sampling point like the nose bridge in Figure 11c, distinct temperature profiles were predicted among the eight cases considered, reflecting a high sensitivity of temperature variation to the gap size. Moreover, the cooling effect was significantly higher than the warming effect when the sampling point was close to the gap, indicating that the gap location can be pinpointed by comparing the warming–cooling effects within a breathing cycle at multiple sampling points across the mask.
The temperature change rate (dT/dt) also exhibited patterns unique to the gap size/location and sampling point, with distinctive peaks occurring during the inspiratory–expiratory flow transitions, as displayed in Figure 9 for the philtrum and Figure 12 for the chin, right/left cheek, and nose bridge. Thus, the dT/dt can provide an additional index for mask-fit, with dT/dt at different sampling points being used, individually or as a combination, to estimate the gap size and location.

4.3. Implications for Development of Fit Test Tool for Disposable Masks

The unique patterns in T and dT/dt specific to the gap size/location may act as a foundation to develop a long-needed fit tester for disposable masks. Currently, there is no such instrument on the market; the closest comparable product is the respirator fit tester, such as the TSI Portacount. Unlike a disposable mask, a respirator is designed to fit tightly to the face morphology with minimal leakage. A fit score > 100 with the Portacount tester is considered a “pass” when wearing a respirator. However, if the TSI Portacount is used to test a disposable mask like a surgical mask, unreasonably low scores (0–40) are obtained, often with large variability. It is evident that the TSI Portacount fit tester, which was designed for respirators, produces errors that are too large to be feasible for disposable masks. Note that during the COVID-19 pandemic, we primarily wore disposable masks, not respirators, to protect ourselves and others around us. Because of the nonexistence of approved standardized mask-fit testers for disposable masks, it has been difficult to quantitatively evaluate a mask’s protection efficiency. Similarly, since there is no objective way to evaluate the mask fit, no clear guidance exists for mask design.
Based on unique correlations between the temporospatial temperature variations and gap size/location, it is promising to reversely quantify the gap sizes (or fit scores) by measuring temperature variations under the mask. It is even possible to pinpoint the gap location by using multiple sampling points across the mask, as suggested by the abrupt increase in cooling effect when the sampling point is close to the gap (Figure 11b,c). Indeed, more studies are needed to test this feasibility or develop a working fit score tester for disposable masks.

4.4. Implications for Mask Wearing as a Public Health Measure in Viral Control

Understanding the correlation between thermal perception and gaps, as well as the gap–leakage correlation, may help establish guidelines that ensure adequate mask fitting and minimize thermal discomfort. The effectiveness of mask wearing as a public health strategy to curb viral spread at a population scale can be influenced by numerous factors [69]. However, one primary determinant is how consistently individuals comply with mask wearing guidelines, such as wearing them continuously in high-risk regions and ensuring a good fit [70,71,72,73,74]. Martín-Sánchez et al. reported large COVID-19 outbreaks in places like bars, restaurants, or gyms where strict adherence to mask wearing rules was difficult, despite 99% of adults reportedly wearing masks in public [73]. Moreover, respiratory infectious viruses like SARS-CoV-2 and its mutants are often highly transmissible, with interpersonal infections occurring within a short time window [75]. Thus, even a short period of time loosening or taking off the mask due to thermal discomfort can significantly undermine the outcomes of mask wearing, considering that even a minor gap can lead to a 30–60% fraction of respiratory airflow escaping the mask filtration. Another complicating factor is that places with high viral risks are often confined, inadequately ventilated, and warmer than outside, which can further increase the likelihood of thermal sensation and/or discomfort, tempting the wearer to temporarily loosen or take off the mask. In this study, we observed a 4.3 °C increase at the philtrum when wearing a snugly fitted surgical mask than without a mask, as shown in Figure 8b. Considering that the philtrum is more sensitive to thermal stresses than other regions of the face, an elevated temperature of 4.3 °C can cause excess thermal sensation, promoting the wearer to loosen the mask or take it off. Such temptations can be more pronounced for those with thermally sensitive skin ailments or for children with lower tolerances for thermal discomfort [76,77].
On the other hand, leakage flows did decrease the warming effect during exhalation and increase the cooling effect during inhalation, as shown in Figure 8, Figure 9, Figure 10 and Figure 11. Considering the philtrum, a minor gap (gap A) at the nose top of 0.51 cm2 led to 5.6% leakage and a 28% reduction in the net warming effect, while a larger gap (R1L1, 4.27 cm2) led to 41.7% leakage and a 62% reduction in warming, as shown in Table 1 and Figure 8f, respectively. Particularly, the cooling effect can overtake the warming effect at the gap site due to the enhanced convection from the leakage flows during inhalation, as demonstrated by Figure 11b for the left side and Figure 11c for the nose bridge. This also explains the temptation to loosen the mask fit to quickly relieve thermal discomfort around that region.

5. Conclusions

In summary, transient respiratory flows and temperature variations were simulated under varying mask-fit conditions in a physiology-based ambient–mask–face–airway model that was validated against complementary experiments. A better understanding of the thermoregulation under the facemask was obtained that hinged on (1) the flow partition across the facemask and (2) the transient balance between tissue heat generation, skin heat dissipation through radiation and convection, and warming/cooling effects from exhalation/inhalation. Specific findings were:
  • Wearing a surgical mask with a perfect fit caused temperatures up to 4.3 °C higher at the philtrum than no mask in ambient conditions of 25 °C under normal breathing.
  • A minor gap of 0.51 cm2 at the nose top led to 5.6% leakage and a 28% decrease in warming effect, while a gap of 4.27 cm2 led to 41.7% leakage and a 62% decrease in warming effect, relative to a perfect fit.
  • The cooling effect occurred predominantly during inhalation and was more significant in the gap proximity.
  • For a given sampling point, the temporal temperature profiles (T and Dt/dt) were distinctive among incrementally increasing gap sizes.
  • Combining the temperature variations (T, dT/dt, and warming/cooling) at multiple sample points yielded a unique pattern for one gap size/location. It would be promising to reversely determine the gap size/location using temperature measurements at multiple points across the mask.
  • This was a physiology-based simulation study, and future human studies are recommended to confirm the results.

Author Contributions

Conceptualization, X.S. and J.X.; methodology, K.B., X.S. and J.X.; software, K.B. and J.X.; validation, X.S. and J.X.; formal analysis, K.B., X.S. and J.X.; investigation, K.B., X.S. and J.X.; data curation, K.B.; writing—original draft preparation, J.X.; writing—review and editing, K.B. and X.S.; visualization, K.B. and J.X.; supervision, J.X. All authors have read and agreed to the published version of the manuscript.

Funding

This research received no external funding.

Data Availability Statement

The data presented in this study are available upon request from the corresponding author.

Acknowledgments

Amr Seifelnasr at UMass Lowell Biomedical Engineering is gratefully acknowledged for editing and proofreading this manuscript.

Conflicts of Interest

The authors declare no conflicts of interest.

References

  1. Cucinotta, D.; Vanelli, M. WHO declares COVID-19 a pandemic. Acta Biomed. 2020, 91, 157–160. [Google Scholar] [PubMed]
  2. Okazaki, S.; Yamanami, H.; Nakagawa, F.; Takuwa, N.; Kawabata Duncan, K.J. Mask wearing increases eye involvement during smiling: A facial EMG study. Sci. Rep. 2021, 11, 20370. [Google Scholar] [CrossRef] [PubMed]
  3. Rinck, M.; Primbs, M.A.; Verpaalen, I.A.M.; Bijlstra, G. Face masks impair facial emotion recognition and induce specific emotion confusions. Cogn. Res. Princ. Implic. 2022, 7, 83. [Google Scholar] [CrossRef] [PubMed]
  4. Langbehn, A.T.; Yermol, D.A.; Zhao, F.; Thorstenson, C.A.; Niedenthal, P.M. Wearing N95, surgical, and cloth face masks compromises the perception of emotion. Affect. Sci. 2022, 3, 105–117. [Google Scholar] [CrossRef] [PubMed]
  5. Park, S.R.; Han, J.; Yeon, Y.M.; Kang, N.Y.; Kim, E. Effect of face mask on skin characteristics changes during the COVID-19 pandemic. Skin Res. Technol. 2021, 27, 554–559. [Google Scholar] [CrossRef] [PubMed]
  6. Tang, T.; Zhu, Y.; Zhou, X.; Guo, Z.; Mao, Y.; Jiang, H.; Fang, Z.; Zheng, Z.; Chen, X. Investigation of the effects of face masks on thermal comfort in Guangzhou, China. Build. Environ. 2022, 214, 108932. [Google Scholar] [CrossRef]
  7. Venugopal, V.; Lennqvist, R.; Latha, P.K.; Rekha, S.; Suraya, A.; Jakobsson, K.; Kjellstrom, T. Challenges in conducting epidemiological field studies evaluating associations between heat stress and renal health among workers in informal sectors: Experiences from India. Environ. Res. 2021, 200, 111343. [Google Scholar] [CrossRef]
  8. Roberge, R.J.; Kim, J.-H.; Coca, A. Protective facemask impact on human thermoregulation: An overview. Ann. Occup. Hyg. 2012, 56, 102–112. [Google Scholar]
  9. Cates, V.C.; Marullo, A.L.; Isakovich, R.; Bird, J.D.; Keess, J.L.; Ricord, K.C.; Leslie, K.M.; Janssens, A.A.; Bhardwaj, R.; Day, T.A. Comparison of mild physiological effects of surgical masks and N95 respirators over 60 min at rest. J. Appl. Physiol. 2023, 135, 227–237. [Google Scholar] [CrossRef]
  10. Pan, X.; Li, X.; Kong, P.; Wang, L.; Deng, R.; Wen, B.; Xiao, L.; Song, H.; Sun, Y.; Zhou, H.; et al. Assessment of use and fit of face masks among individuals in public during the COVID-19 pandemic in China. JAMA Netw. Open 2021, 4, e212574. [Google Scholar] [CrossRef]
  11. Su, W.-C.; Lee, J.; Xi, J.; Zhang, K. Investigation of mask efficiency for loose-fitting masks against ultrafine particles and effect on airway deposition efficiency. Aerosol Air Qual. Res. 2022, 22, 210228. [Google Scholar] [CrossRef] [PubMed]
  12. Schmitt, J.; Wang, J. A critical review on the role of leakages in the facemask protection against SARS-CoV-2 infection with consideration of vaccination and virus variants. Indoor Air 2022, 32, e13127. [Google Scholar] [CrossRef] [PubMed]
  13. Xi, J.; Barari, K.; Si, X.A.; Abdollahzadeh Jamalabadi, M.Y.; Park, J.H.; Rein, M. Inspiratory leakage flow fraction for surgical masks with varying gaps and filter materials. Phys. Fluids 2022, 34, 041908. [Google Scholar] [CrossRef]
  14. Abduljabbar, M.; Kalthoum, D.E.; Bakarman, M.; Wahby Salem, I.; Alsulaimani, Z.; Alharbi, W.; Shawish, S.; Alsobhi, R. The correlation between wearing face masks and skin damage in adults during the COVID-19 pandemic: A cross-sectional study in eddah, Saudi Arabia. Cureus 2022, 14, e31521. [Google Scholar] [CrossRef] [PubMed]
  15. Gül, Ü. COVID-19 and dermatology. Turk. J. Med. Sci. 2020, 50, 1751–1759. [Google Scholar] [CrossRef] [PubMed]
  16. Lin, P.; Zhu, S.; Huang, Y.; Li, L.; Tao, J.; Lei, T.; Song, J.; Liu, D.; Chen, L.; Shi, Y.; et al. Adverse skin reactions among healthcare workers during the coronavirus disease 2019 outbreak: A survey in Wuhan and its surrounding regions. Br. J. Dermatol. 2020, 183, 190–192. [Google Scholar] [CrossRef] [PubMed]
  17. Bukhari, A.E.; Bin Dakhil, A.A.; Albrkheel, A.A.; Almutlq, M.M.; Alolayan, O.K.; Alqahtani, M.A.; Alsubaie, F.S.; Alessa, D.S.; Alzamil, F.M. Face mask-induced skin changes: A new common phenomenon during the coronavirus disease 2019 pandemic. Dermatol. Rep. 2023, 15, 9526. [Google Scholar] [CrossRef]
  18. Teo, W.L. The “Maskne” microbiome–pathophysiology and therapeutics. Int. J. Dermatol. 2021, 60, 799–809. [Google Scholar] [CrossRef]
  19. Paiva-Santos, A.C.; Gonçalves, T.; Peixoto, D.; Pires, P.C.; Velsankar, K.; Jha, N.K.; Chavda, V.P.; Mohammad, I.S.; Cefali, L.C.; Mazzola, P.G.; et al. Rosacea topical treatment and care: From traditional to new drug delivery systems. Mol. Pharm. 2023, 20, 3804–3828. [Google Scholar] [CrossRef]
  20. Rathi, S.K.; Dsouza, J.M. Maskne: A new acne variant in COVID-19 era. Indian J. Dermatol. 2022, 67, 552–555. [Google Scholar]
  21. Thatiparthi, A.; Liu, J.; Martin, A.; Wu, J.J. Adverse Effects of COVID-19 and Face Masks: A Systematic Review. J. Clin. Aesthet. Dermatol. 2021, 14, S39–S45. [Google Scholar] [PubMed]
  22. Nahm, W.J.; Nagler, A.R.; Milam, E.C. Association of perioral dermatitis with facial mask usage during the COVID-19 pandemic: A retrospective study. JAAD Int. 2023, 10, 86–87. [Google Scholar] [CrossRef] [PubMed]
  23. Kisielinski, K.; Giboni, P.; Prescher, A.; Klosterhalfen, B.; Graessel, D.; Funken, S.; Kempski, O.; Hirsch, O. Is a mask that covers the mouth and nose free from undesirable side effects in everyday use and free of potential hazards? Int. J. Environ. Res. Public Health 2021, 18, 4344. [Google Scholar] [CrossRef] [PubMed]
  24. Gericke, A.; Militký, J.; Venkataraman, M.; Steyn, H.; Vermaas, J. The effect of mask style and fabric selection on the comfort properties of fabric masks. Materials 2022, 15, 2559. [Google Scholar] [CrossRef]
  25. Mumma, J.; Liu, F.; Ng, N.L.; Morgan, J.; Lane, M.; Gannon, P. Designing better cloth masks: The effect of fabric and attachment-style on discomfort. J. Occup. Environ. Hyg. 2023, 20, 23–32. [Google Scholar] [CrossRef] [PubMed]
  26. Kwong, L.H.; Wilson, R.; Kumar, S.; Crider, Y.S.; Reyes Sanchez, Y.; Rempel, D.; Pillarisetti, A. Review of the breathability and filtration efficiency of common household materials for face masks. ACS Nano 2021, 15, 5904–5924. [Google Scholar] [CrossRef] [PubMed]
  27. Yip, W.K.; Leung, L.; Lau, P.; Tong, J. The effect of wearing a face mask on body temperature. Hong Kong J. Emerg. Med. 2005, 12, 23–27. [Google Scholar] [CrossRef]
  28. Pequeña, A.R.; Prasetyo, Y.T. The Effect of mask & face shield on the general discomfort of the workers in the food industry: A structural equation modeling approach. J. Phys. Conf. Ser. 2021, 1996, 012012. [Google Scholar]
  29. Scarano, A.; Inchingolo, F.; Lorusso, F. Facial skin temperature and discomfort when wearing protective face masks: Thermal infrared imaging evaluation and hands moving the mask. Int. J. Environ. Res. Public Health 2020, 17, 4624. [Google Scholar] [CrossRef]
  30. Salati, H.; Khamooshi, M.; Vahaji, S.; Christo, F.C.; Fletcher, D.F.; Inthavong, K. N95 respirator mask breathing leads to excessive carbon dioxide inhalation and reduced heat transfer in a human nasal cavity. Phys. Fluids 2021, 33, 081913. [Google Scholar] [CrossRef]
  31. Inthavong, K.; Fletcher, D.F.; Khamooshi, M.; Vahaji, S.; Salati, H. Wet surface wall model for latent heat exchange during evaporation. Int. J. Numer. Methods Biomed. Eng. 2022, 38, e3581. [Google Scholar] [CrossRef] [PubMed]
  32. Lembo, M.; Vedetta, C.; Moscato, U.; Del Gaudio, M. Thermal discomfort in healthcare workers during the COVID-19 pandemic. Med. Lav. 2021, 112, 123–129. [Google Scholar] [PubMed]
  33. Zhu, Y.; Mao, Y.; Li, Y.; Tang, T.; Jiang, H.; Qiao, S.; Lin, S.; Zheng, Z.; Fang, Z.; Chen, X. Field investigation of the heat stress in outdoor of healthcare workers wearing personal protective equipment in South China. Front. Public Health 2023, 11, 1166056. [Google Scholar] [CrossRef] [PubMed]
  34. Zhu, Y.; Qiao, S.; Wu, W.; Li, Y.; Jian, H.; Lin, S.; Tang, T.; Zheng, Z.; Mao, Y.; Chen, X.; et al. Thermal discomfort caused by personal protective equipment in healthcare workers during the delta COVID-19 pandemic in Guangzhou, China: A case study. Case Stud. Therm. Eng. 2022, 34, 101971. [Google Scholar] [CrossRef]
  35. Bonell, A.; Nadjm, B.; Samateh, T.; Badjie, J.; Perry-Thomas, R.; Forrest, K.; Prentice, A.M.; Maxwell, N.S. Impact of personal cooling on performance, comfort and heat strain of healthcare workers in PPE, a study from west Africa. Front. Public Health 2021, 9, 712481. [Google Scholar] [CrossRef] [PubMed]
  36. Li, Y.; Tokura, H.; Guo, Y.P.; Wong, A.S.W.; Wong, T.; Chung, J.; Newton, E. Effects of wearing N95 and surgical facemasks on heart rate, thermal stress and subjective sensations. Int. Arch. Occup. Environ. Health 2005, 78, 501–509. [Google Scholar] [CrossRef] [PubMed]
  37. Chandrasekaran, B.; Fernandes, S. Exercise with facemask; Are we handling a devil’s sword? A physiological hypothesis. Med. Hypotheses 2020, 144, 110002. [Google Scholar] [CrossRef] [PubMed]
  38. Zheng, C.; Poon, E.T.; Wan, K.; Dai, Z.; Wong, S.H. Effects of wearing a mask during exercise on physiological and psychological outcomes in healthy individuals: A systematic review and meta-analysis. Sports Med. 2023, 53, 125–150. [Google Scholar] [CrossRef]
  39. Person, E.; Lemercier, C.; Royer, A.; Reychler, G. Effect of a surgical mask on six minute walking distance. Rev. Mal. Respir. 2018, 35, 264–268. [Google Scholar] [CrossRef]
  40. Jesus, J.P.; Gomes, M.; Dias-Gonçalves, A.; Correia, J.M.; Pezarat-Correia, P.; Mendonca, G.V. Effects of surgical masks on the responses to constant work-rate cycling performed at different intensity domains. Clin. Physiol. Funct. Imaging 2022, 42, 43–52. [Google Scholar] [CrossRef]
  41. Pimenta, T.; Tavares, H.; Ramos, J.; Oliveira, M.; Reis, D.; Amorim, H.; Rocha, A. Facemasks during aerobic exercise: Implications for cardiac rehabilitation programs during the COVID-19 pandemic. Rev. Port. Cardiol. 2021, 40, 957–964. [Google Scholar] [CrossRef] [PubMed]
  42. Yang, S.C.; Lee, C.W. Physiological effects of N95 respirators on rescuers during cardiopulmonary resuscitation. Heliyon 2023, 9, e18970. [Google Scholar] [CrossRef] [PubMed]
  43. Steinhilber, B.; Seibt, R.; Gabriel, J.; Bär, M.; Dilek, Ü.; Brandt, A.; Martus, P.; Rieger, M.A. Influence of face masks on physiological and subjective response during 130 min of simulated light and medium physical manual work—An explorative study. Healthcare 2023, 11, 1308. [Google Scholar] [CrossRef] [PubMed]
  44. Thi Ngoc Le, H.; Xuan Nguyen, K.; Duy Nguyen, T.; Quang La, H.; Thanh Nguyen, X.; Tien Le, D.; Quoc Pham, H.; Xuan Nguyen, K.; Hoang Nguyen, H.; Van Pham, V.; et al. Effects of three-hour wearing personal protective equipment on heart rate variability in healthcare workers for the treatment of COVID-19 patients. Int. J. Gen. Med. 2023, 16, 2531–2539. [Google Scholar] [CrossRef] [PubMed]
  45. Van Kampen, V.; Marek, E.-M.; Sucker, K.; Jettkant, B.; Kendzia, B.; Strauß, B.; Ulbrich, M.; Deckert, A.; Berresheim, H.; Eisenhawer, C.; et al. Influence of face masks on the subjective impairment at different physical workloads. Sci. Rep. 2023, 13, 8133. [Google Scholar] [CrossRef] [PubMed]
  46. Liu, C.; Li, G.; He, Y.; Zhang, Z.; Ding, Y. Effects of wearing masks on human health and comfort during the COVID-19 pandemic. IOP Conf. Ser. Earth Environ. Sci. 2020, 531, 012034. [Google Scholar] [CrossRef]
  47. Hopkins, S.R.; Dominelli, P.B.; Davis, C.K.; Guenette, J.A.; Luks, A.M.; Molgat-Seon, Y.; Sá, R.C.; Sheel, A.W.; Swenson, E.R.; Stickland, M.K. Face masks and the cardiorespiratory response to physical activity in health and disease. Ann. Am. Thorac. Soc. 2021, 18, 399–407. [Google Scholar] [CrossRef]
  48. Wang, J.; Xi, J.; Han, P.; Wongwiset, N.; Pontius, J.; Dong, H. Computational analysis of a flapping uvula on aerodynamics and pharyngeal wall collapsibility in sleep apnea. J. Biomech. 2019, 94, 88–98. [Google Scholar] [CrossRef]
  49. Xi, J.; Wang, Z.; Nevorski, D.; White, T.; Zhou, Y. Nasal and olfactory deposition with normal and bidirectional intranasal delivery techniques: In vitro tests and numerical simulations. J. Aerosol Med. Pulm. Drug Deliv. 2017, 30, 118–131. [Google Scholar] [CrossRef]
  50. Xi, J.; Si, X.A.; Nagarajan, R. Effects of mask-wearing on the inhalability and deposition of airborne SARS-CoV-2 aerosols in human upper airway. Phys. Fluids 2020, 32, 123312. [Google Scholar] [CrossRef]
  51. Xi, J.; Kim, J.; Si, X.; Corley, R.A.; Zhou, Y. Modeling of inertial depositions in scaled models of rat and human nasal airways: Towards in vitro regional dosimetry in small animals. J. Aerosol Sci. 2016, 99, 78–93. [Google Scholar] [CrossRef]
  52. Xi, J.; Longest, P.W. Numerical predictions of submicrometer aerosol deposition in the nasal cavity using a novel drift flux approach. Int. J. Heat Mass Transf. 2008, 51, 5562–5577. [Google Scholar] [CrossRef]
  53. Xi, J.; Longest, P. Effects of oral airway geometry characteristics on the diffusional deposition of inhaled nanoparticles. J. Biomech. Eng. 2008, 130, 011008. [Google Scholar] [CrossRef] [PubMed]
  54. Persson, B.N.J. Side-leakage of face mask. Eur. Phys. J. E Soft Matter. 2021, 44, 75. [Google Scholar] [CrossRef] [PubMed]
  55. Wang, T.K.; Solano, T.; Shoele, K. Bridge the gap: Correlate face mask leakage and facial features with 3D morphable face models. J. Expo. Sci. Environ. Epidemiol. 2021, 32, 735–743. [Google Scholar] [CrossRef]
  56. Lee, K.P.; Yip, J.; Kan, C.W.; Chiou, J.C.; Yung, K.F. Reusable face masks as alternative for disposable medical masks: Factors that affect their wear-comfort. Int. J. Environ. Res. Public Health 2020, 17, 6623. [Google Scholar] [CrossRef] [PubMed]
  57. Oner, E.; Seçkin, A.; Egeli, D.; Seçkin, M. Investigation of the thermal comfort properties of masks used during the COVID-19 pandemic. Int. J. Environ. Res. Public Health 2022, 19, 11275. [Google Scholar] [CrossRef]
  58. Noto, T.; Zhou, G.; Schuele, S.; Templer, J.; Zelano, C. Automated analysis of breathing waveforms using BreathMetrics: A respiratory signal processing toolbox. Chem. Senses 2018, 43, 583–597. [Google Scholar] [CrossRef]
  59. Romanovsky, A.A. Skin temperature: Its role in thermoregulation. Acta Physiol. 2014, 210, 498–507. [Google Scholar] [CrossRef]
  60. Cai, L.; Song, A.Y.; Wu, P.; Hsu, P.-C.; Peng, Y.; Chen, J.; Liu, C.; Catrysse, P.B.; Liu, Y.; Yang, A.; et al. Warming up human body by nanoporous metallized polyethylene textile. Nat. Commun. 2017, 8, 496. [Google Scholar] [CrossRef]
  61. Li, C.; Guan, G.; Reif, R.; Huang, Z.; Wang, R.K. Determining elastic properties of skin by measuring surface waves from an impulse mechanical stimulus using phase-sensitive optical coherence tomography. J. R. Soc. Interface 2012, 9, 831–841. [Google Scholar] [CrossRef] [PubMed]
  62. Wilcox, D.C. Formulation of the k-w Turbulence model revisited. AIAA J. 2008, 46, 2823–2838. [Google Scholar] [CrossRef]
  63. Szanyi, M.L.; Hemmingsen, C.S.; Yan, W.; Walther, J.H.; Glimberg, S.L. Near-wellbore modeling of a horizontal well with Computational Fluid Dynamics. J. Pet. Sci. Eng. 2018, 160, 119–128. [Google Scholar] [CrossRef]
  64. Xi, J.; Longest, P.W. Transport and deposition of micro-aerosols in realistic and simplified models of the oral airway. Ann. Biomed. Eng. 2007, 35, 560–581. [Google Scholar] [CrossRef] [PubMed]
  65. Si, X.; Talaat, M.; Xi, J. SARS-CoV-2 virus-laden droplets coughed from deep lungs: Numerical quantification in a single-path whole respiratory tract geometry. Phys. Fluids 2021, 33, 023306. [Google Scholar]
  66. Xi, J.; Zhang, Z.; Si, X. Improving intranasal delivery of neurological nanomedicine to the olfactory region using magnetophoretic guidance of microsphere carriers. Int. J. Nanomed. 2015, 10, 1211–1222. [Google Scholar] [CrossRef] [PubMed]
  67. Staymates, M. Flow visualization of an N95 respirator with and without an exhalation valve using schlieren imaging and light scattering. Phys. Fluids 2020, 32, 111703. [Google Scholar] [CrossRef] [PubMed]
  68. Tang, J.W.; Liebner, T.J.; Craven, B.A.; Settles, G.S. A schlieren optical study of the human cough with and without wearing masks for aerosol infection control. J. R. Soc. Interface 2009, 6 (Suppl. S6), S727–S736. [Google Scholar] [CrossRef]
  69. Taylor, S.; Asmundson, G.J.G. Negative attitudes about facemasks during the COVID-19 pandemic: The dual importance of perceived ineffectiveness and psychological reactance. PLoS ONE 2021, 16, e0246317. [Google Scholar] [CrossRef]
  70. Brooks, J.T.; Beezhold, D.H.; Noti, J.D.; Coyle, J.P.; Derk, R.C.; Blachere, F.M.; Lindsley, W.G. Maximizing fit for cloth and medical procedure masks to improve performance and reduce SARS-CoV-2 transmission and exposure, 2021. MMWR Morb. Mortal. Wkly. Rep. 2021, 70, 254–257. [Google Scholar] [CrossRef]
  71. Abaluck, J.; Kwong, L.H.; Styczynski, A.; Haque, A.; Kabir, M.A.; Bates-Jefferys, E.; Crawford, E.; Benjamin-Chung, J.; Raihan, S.; Rahman, S.; et al. Impact of community masking on COVID-19: A cluster-randomized trial in Bangladesh. Science 2022, 375, eabi9069. [Google Scholar] [CrossRef] [PubMed]
  72. Van der Westhuizen, H.M.; Kotze, K.; Tonkin-Crine, S.; Gobat, N.; Greenhalgh, T. Face coverings for covid-19: From medical intervention to social practice. BMJ 2020, 370, m3021. [Google Scholar] [CrossRef] [PubMed]
  73. Martín-Sánchez, M.; Lim, W.W.; Yeung, A.; Adam, D.C.; Ali, S.T.; Lau, E.H.Y.; Wu, P.; Yuen, K.-Y.; Leung, G.M.; Cowling, B.J. COVID-19 transmission in Hong Kong despite universal masking. J. Infect. 2021, 83, 92–95. [Google Scholar] [CrossRef] [PubMed]
  74. Bundgaard, H.; Bundgaard, J.S.; Raaschou-Pedersen, D.E.T.; von Buchwald, C.; Todsen, T.; Norsk, J.B.; Pries-Heje, M.M.; Vissing, C.R.; Nielsen, P.B.; Winsløw, U.C.; et al. Effectiveness of adding a mask recommendation to other public health measures to prevent SARS-CoV-2 infection in Danish mask wearers: A randomized controlled trial. Ann. Intern. Med. 2021, 174, 335–343. [Google Scholar] [CrossRef] [PubMed]
  75. Jia, H.; Wang, H.; Cao, L.; Lai, Z.; Cheng, Z.; Chen, Q.; Liu, T.; Liu, X.; Wen, Y.; Xu, C.; et al. Genetic analysis of a SARS-CoV-2 Omicron variant from a Chinese traveller returning from overseas. Emerg. Microbes. Infect. 2022, 11, 306–309. [Google Scholar] [CrossRef]
  76. Schmidt, N.B.; Richey, J.A.; Cromer, K.R.; Buckner, J.D. Discomfort intolerance: Evaluation of a potential risk factor for anxiety psychopathology. Behav. Ther. 2007, 38, 247–255. [Google Scholar] [CrossRef]
  77. Xu, Q.; Mao, Z.; Wei, D.; Fan, K.; Liu, P.; Wang, J.; Wang, X.; Lou, X.; Lin, H.; Wang, C.; et al. Association between mask wearing and anxiety symptoms during the outbreak of COVID 19: A large survey among 386,432 junior and senior high school students in China. J. Psychosom. Res. 2022, 153, 110709. [Google Scholar] [CrossRef]
Figure 1. Computational model for simulating facemask airflow and thermoregulation: (a) the integrated ambient–mask–face–airway model with gaps (A, AB, ABC, ABCD, R1L1, Side) of different sizes and locations, (b) computational domains and mesh with mesh sensitivity analysis.
Fluids 09 00009 g001
Figure 2. Methods and validation: (a) TSI 8131A facemask tester for breathing resistance and filtration efficiency, (b) breathing waveform for computational simulations, (c) infrared imaging and thermal meter for the characterization of surface and airflow temperatures, and (d) model validation against anemometer-measured leakage flows from a controlled side gap.
Fluids 09 00009 g002
Figure 3. Validation: (a) no mask, (b) with mask.
Fluids 09 00009 g003
Figure 4. Comparison of surface temperatures on the facemask and exposed face during one breathing cycle between (a) thermal camera imaging and (b) numerical predictions with no leak.
Fluids 09 00009 g004
Figure 5. Comparison of the streamlines and temperature profiles at three instants from the start of inhalation for three facemask-wearing scenarios: (a) with a gap at the nose bridge (R1L1), (b) with a gap at the left cheek (Side), and (c) with no mask.
Fluids 09 00009 g005
Figure 6. Instantaneous vortex structures at varying instants for (a) R1L1, (b) Side, and (c) no mask. The facial contour and vortices were color-coded by temperature.
Fluids 09 00009 g006
Figure 7. Comparison of the facial and airflow temperature distributions at 2.3 s with increasing gaps at the nose top (A–D, R1L1) in comparison to no leak and no mask: (a) no leak, (b) A, (c) AB, (d) ABC, (e) ABCD, (f) R1L1, and (g) no mask.
Fluids 09 00009 g007
Figure 8. Temperature variation at the philtrum: (a) temperature profiles under eight conditions; (b) comparison of the philtrum temperatures among eight conditions; (c) philtrum temperatures relative to that with no mask (i.e., dT); (d) the integration of dT, int(dT) representing the warming and cooling effects relative to ‘no mask’ for three consecutive breathing cycles; (e) mean and variance of the warming (orange) and cooling (blue) from three cycles; and (f) net warming effects.
Fluids 09 00009 g008
Figure 9. The change rate of philtrum temperature (dT/dt) vs. time: (a) dT/dt profiles under four facemask wearing conditions (i.e., no leak, R1L1, Side, and no mask); and (b) comparison of dT/dt profiles among eight facemask wearing conditions, with zoomed views during the flow transitions to inhalation (19.9–20.9 s) and exhalation (21–24 s).
Fluids 09 00009 g009
Figure 10. Temperature variation at the chin: (a) temperature variation vs. time under four facemask wearing conditions (i.e., no leak, R1L1, Side, and no mask); (b) comparison of the chin temperatures among eight conditions; and (c) warming (orange) and cooling (blue) effects at the chin.
Fluids 09 00009 g010
Figure 11. Temperature variation and thermal regulation under varying facemask wearing conditions at different sampling points: (a) right-middle cheek; (b) left-side cheek (under the side gap); and (c) nose bridge.
Fluids 09 00009 g011
Figure 12. Comparison of the temperature change rate (dT/dt) among four sampling points for four mask wearing conditions: (a) no leak, (b) R1L1, (c) Side, and (d) no mask. The four sampling points included the chin, right-middle cheek, left-side cheek (coinciding with the side gap), and nose bridge (coinciding with the R1L1 gap).
Fluids 09 00009 g012
Table 1. Gap areas and flow partition (%) through the gaps, mask front, and mask–face interface.
GapNo LeakAABABCABCDR1L1Side
A (cm2)00.511.021.552.074.273.48
Gap leak (%)05.611.116.221.541.742.8
Mask front (%)82.677.973.268.964.348.748.1
Interface (%)17.416.515.714.914.29.69.1
Disclaimer/Publisher’s Note: The statements, opinions and data contained in all publications are solely those of the individual author(s) and contributor(s) and not of MDPI and/or the editor(s). MDPI and/or the editor(s) disclaim responsibility for any injury to people or property resulting from any ideas, methods, instructions or products referred to in the content.

