Article

Impact of Surface Roughness on the Impingement of Urea–Water Solution Droplets

Institute of Powertrains and Automotive Technology, TU Wien, Getreidemarkt 9, Object 1, 1060 Vienna, Austria
*
Author to whom correspondence should be addressed.
Fluids 2023, 8(5), 152; https://doi.org/10.3390/fluids8050152
Submission received: 18 April 2023 / Revised: 8 May 2023 / Accepted: 9 May 2023 / Published: 12 May 2023
(This article belongs to the Section Heat and Mass Transfer)

Abstract

:
The understanding of impingement processes is crucial for optimizing automotive selective catalytic reduction (SCR) systems. An accurate description of this behavior helps design exhaust systems and increases the validity of modeling approaches. A component test bench was set up, featuring a droplet chain generator for producing droplet sizes typically found in the urea–water solution sprays of SCR systems. A heatable impingement plate with an interchangeable surface enabled investigation of the influence of surface roughness. Data were acquired using a high-speed camera and image postprocessing. The droplet–wall interaction could be described using different regimes. An approach to characterizing impingement behavior based on weighted-regime superposition enabled gradual transitions between regimes, instead of step-like changes. It was observed that the surface roughness increased the droplet–solid contact area and generated thermal-induced secondary droplets at lower temperatures. A region of enhanced mechanical disintegration of the droplet was found, caused by peaks of the surface shearing off parts of the droplet. The probability of a droplet rebounding from the wall was reduced on a rough surface, due to the interference of the surface spikes with the droplet’s spreading and contracting motion. Additionally, the influence of surface topography was investigated using a shot-peened surface. Caused by this surface’s reduced root mean square slope, the aforementioned enhancement of mechanical disintegration was not observed.

1. Introduction

1.1. Motivation

Selective catalytic reduction (SCR) continues to be a crucial technology for emission control, as emission standards for diesel vehicles are tightened further. The demand for constant improvement of SCR systems is evident. A deeper understanding of the processes involved in reducing nitric oxides (NOx) is necessary. This comprises the spray injection and primary breakup, droplet impingement, film formation and propagation, evaporation, and reaction of urea to gaseous ammonia via thermolysis and hydrolysis. Prior investigations by the authors underlined the importance of the impingement process in SCR simulation [1]. The interaction of the spray droplets with a hot wall significantly influences the ammonia preparation and mixing with the exhaust gas. This is crucial for a homogeneous distribution of the reducing agent at the catalyst inlet. Consequently, the parameters of the current experimental investigation were chosen to be as relevant as possible for SCR applications. This study focuses on the influence of surface roughness on impingement behavior, as the surfaces found in an exhaust system cannot be expected to be ideally smooth. Furthermore, the surface roughness of certain parts of an exhaust system, e.g., the mixing element, could be intentionally altered to influence droplet impingement. This tuning parameter could be used to optimize ammonia distribution and general system performance. To enable the development of such approaches, it is necessary to study the governing effects of surface roughness and describe them in empirical impingement models. These models can then be used in computational fluid dynamics (CFD) simulation tools, for a fast and secure development process, ensuring reliable system performance under various engine operating conditions (e.g., exhaust temperatures, gas velocities, and urea–water solution (UWS) injection rates).

1.2. Impingement Characterization

Droplet–wall interaction is a very complex topic, with many influencing factors. Consequently, the description of impingement behavior commonly relies on empirical approaches. Past research showed two major factors as influencing the impingement of droplets on hot surfaces: the surface temperature, and droplet kinetics [2]. The influence of temperature has been described using absolute temperature values or dimensionless numbers, e.g., as the ratio over the liquid’s saturation temperature [2,3,4,5]. As a kinetic parameter representing the droplet’s stability during impact, the dimensionless Weber number (We) or K-number have been used, the latter being a combination of the We and Reynolds-number (Re) [3,4,5,6,7]. The We-number was chosen for the current study based on various examples in the literature and experience from previous investigations [8]. As shown in Equation (1), this calculation is based on the wall-normal component of the velocity v n , droplet diameter d, density ρ , and surface tension σ . For specification of the temperature, the absolute surface temperature was used.
W e = ρ v n 2 d σ
Based on these main parameters, the occurrence of different impingement behaviors is often plotted on so-called impingement maps (e.g., Figure 1), to describe the outcome of a droplet–wall interaction [2,3,4,9].
These empirical maps are derived from the results of experimental investigations, and the definition of the regimes describing the droplet–wall interaction can vary considerably. In the past, authors describing their observations have defined a variety of regimes and individual denotations. The term ‘splash’ is an excellent example of an often-used name in impingement classification that can be linked to very different behaviors. It ranges from a small fraction of tiny secondary droplets at the rim of a spreading lamella to the complete disintegration of the droplet on impact [3,10,11]. Additionally, many of the resulting impingement maps show sharp threshold values separating one regime from another; for example, a certain temperature [2,3,4]. However, as indicated by the shaded areas between regimes in Figure 1, a transitional behavior was previously assumed, but this was simplified due to limited available data [3]. It was shown in the past that transitions can be observed [8,12], which contradicts the use of step-wise thresholds. An alternative classification approach based on a weighted superposition of four basic regimes can instead be used to capture smooth transitions [8].
With a variation of the surface temperature, the boiling behavior of a droplet during wall contact changes [2]. Consequently, three significant temperatures are often used to describe the thermal influence and sometimes serve as regime boundaries [3,4]. The first is the fluid saturation temperature at which boiling phenomena start to play a role [2]. The second value is the critical heat flux (CHF) temperature. Here, the most intense heat exchange between liquid and solid, due to strong vapor bubble formation, can be observed [13]. The third temperature is the Leidenfrost point (LFP), at which the vapor film closes and separates the liquid from the solid; thus, strongly reducing the heat flux to a local minimum [2,13]. However, this definition of LFP from a heat flux perspective does not apply to the dynamic droplet–wall interaction. Therefore, regarding impingement, a dynamic LFP has been defined as the temperature above which a droplet’s spreading and contraction behavior after impact do not change with an additional temperature increase [2,14].

1.3. Influence of Fluid and Droplet Size

Impingement behavior has been investigated using different fluids. Water, various alcohols, liquid fuels, or oils are frequently used. The influence of fluid properties (e.g., viscosity, surface tension) on impingement was shown to be relevant [10,15,16]. Additionally, liquid properties (e.g., vapor pressure, heat capacity, thermal conductivity) have a significant influence on heat transfer [2,13,14,17], which is a decisive aspect of the interaction between droplets and hot surfaces. Furthermore, it was reported that specific influences (e.g., droplet size on CHF) could be observed for water but not for fuels [2]. Unfortunately, no comprehensive description of the various influences of liquid properties on impingement has yet been provided. Consequently, UWS was chosen as a working liquid for the current study, to mimic an SCR system.
No reports could be found on the influence of the primary droplet diameter (at a constant We or K-number) on impingement behavior. However, the influence of roughness on impingement was described using a surface roughness that is nondimensionalized, using the primary droplet diameter [10,18,19]. The surface roughness would need to scale accordingly when using droplets that are an order of magnitude larger than found in sprays. As this is hardly achievable from a manufacturing point of view, using appropriate droplet sizes seems mandatory. Additionally, it was reported that the vapor layer forming beneath a sessile droplet under Leidenfrost conditions is strongly dependent on the droplet diameter [20]. This influence was later confirmed for impinging droplets [21], while the vapor layer thickness is generally an order of magnitude smaller in this dynamic scenario [5]. Especially in comparison to the surface roughness height, the vapor layer thickness is relevant for the influence of roughness on impingement behavior [22]. Consequently, adequate droplet sizes had to be used in the experiments.

1.4. Influence of Surface Roughness on Droplet Impingement

Surface roughness has been reported to influence several aspects of impingement. Roughness peaks penetrating the liquid can cause the appearance of bubbles at higher temperatures compared to smooth surfaces [7]. This changes the impingement behavior at this point, otherwise associated with the Leidenfrost effect. Similar phenomena were observed where surface spikes induced a violent breakup of the spreading liquid film [23]. On a rough surface, the temperature necessary for a droplet rebound can be increased significantly, which can be explained by the vapor mass escaping via the valleys of the surface topography [24]. The kinetic rebound–splash threshold was also reported to change with increasing roughness [11]. A change in surface roughness was associated with the change in contact angle and wettability [25,26]. The contact angle influences the spreading behavior of a droplet on a cold surface [26,27]. An increase in contact angle reduces the droplet spreading during impingement with moderate We-numbers (<200). For higher We-numbers, inertial effects become predominant, and influence of wettability becomes negligible. Consequently, the maximum spreading is only a function of the We-number [26]. During impingement on a hot surface, the independency of the maximum spreading diameter on surface geometry was reported [21,28].
Part of the influence of surface roughness on the impingement behavior can be related to the aspect of heat transfer. The highly complex interaction dynamic between liquid–solid–contact and heat transfer causes different effects of an increase of roughness on impingement, depending on the temperature [23]. It was reported that roughness does not significantly influence the heat flux above LFP. In contrast, increased roughness decreases the heat flux in the upper part of the transition boiling temperature range (between LFP and CHF). However, in the lower range of transition boiling and nucleate boiling, the increased nucleation site density of rougher surfaces causes an increase in heat flux [23]. The latter is confirmed by reports of enhanced heat transfer in the nucleate boiling regime, also causing secondary droplets to be expelled through bubble explosion much sooner after contact than on a smooth surface [10]. No consistent dependency of spray-induced heat transfer on surface roughness could be shown in [29], which was attributed to other additional influencing factors, e.g., the introduction of surface contaminants from surface treatment.
While the temperature of CHF is reported to be relatively insensitive to surface roughness, the LFP for deionized water was found to be 40 ℃ higher on a polished surface compared to a rough one [23]. This, however, seems to contradict other publications, where an increase in roughness caused a rise in LFP. For UWS, Steinbach (80 μm droplets) showed an increase of the LFP from around 300 ℃ for a smooth surface to 400 ℃ for R z = 35 μ m [24]. Kuhn ( 3 mm droplets) found an LFP of 220 ℃ for R z = 4.5 μ m , with the temperature values also increasing significantly for rougher surfaces (330 ℃ on R z = 98.4 μ m ) [11]. For a smooth surface, this is much lower than the values found by Steinbach [24] or in earlier experimental investigations by the current authors [8]. In the latter work, the top-end temperature limit of the thermal-induced breakup can be interpreted as LFP, which was reported at 300 ℃. Both values for smooth surfaces were closer to the temperature found by Kuhn for a rough one, which might have been caused by the significantly larger droplets than in [8,24]. It also cannot be neglected that the rougher impingement targets were also porous in [11].
Additionally, an interaction between We-number and the influence of roughness was shown [23]. The dependence of the heat flux on roughness was reported to decrease with an increasing We-number. For sessile droplets ( W e = 0 ), it was stated that the peaks penetrating through the vapor layer caused the LFP temperature to increase. In contrast, for impinging droplets, the surface spikes enhanced the rupture of the liquid film and cause a decrease in LFP temperature [23]. While the described case for sessile droplets agrees with other reports, the observed effects during impingement might be assigned to a direct mechanical rupture of the droplet from surface peaks instead of a thermal Leidenfrost effect.

1.5. Principal Conclusions and Main Aim of the Work

The interaction of impingement and heat transfer is a complex topic, where the influence of roughness on impingement has previously been observed but not completely understood. Primary droplet size is relevant and should be chosen at a corresponding order of magnitude, as in typical UWS sprays. The use of UWS in the experiments was similarly motivated.The current investigation examined how roughness potentially influences droplet impingement in an automotive SCR system. This might help to improve ammonia uniformity, by establishing roughness as an additional optimization parameter.

2. Materials and Methods

The following section describes the high-speed imaging used to capture the impingement behavior and the image postprocessing routine. As the setup was presented in [8], only some noteworthy improvements are specified here. With the study focusing on the influence of roughness, the relevant properties of the investigated surfaces are given.

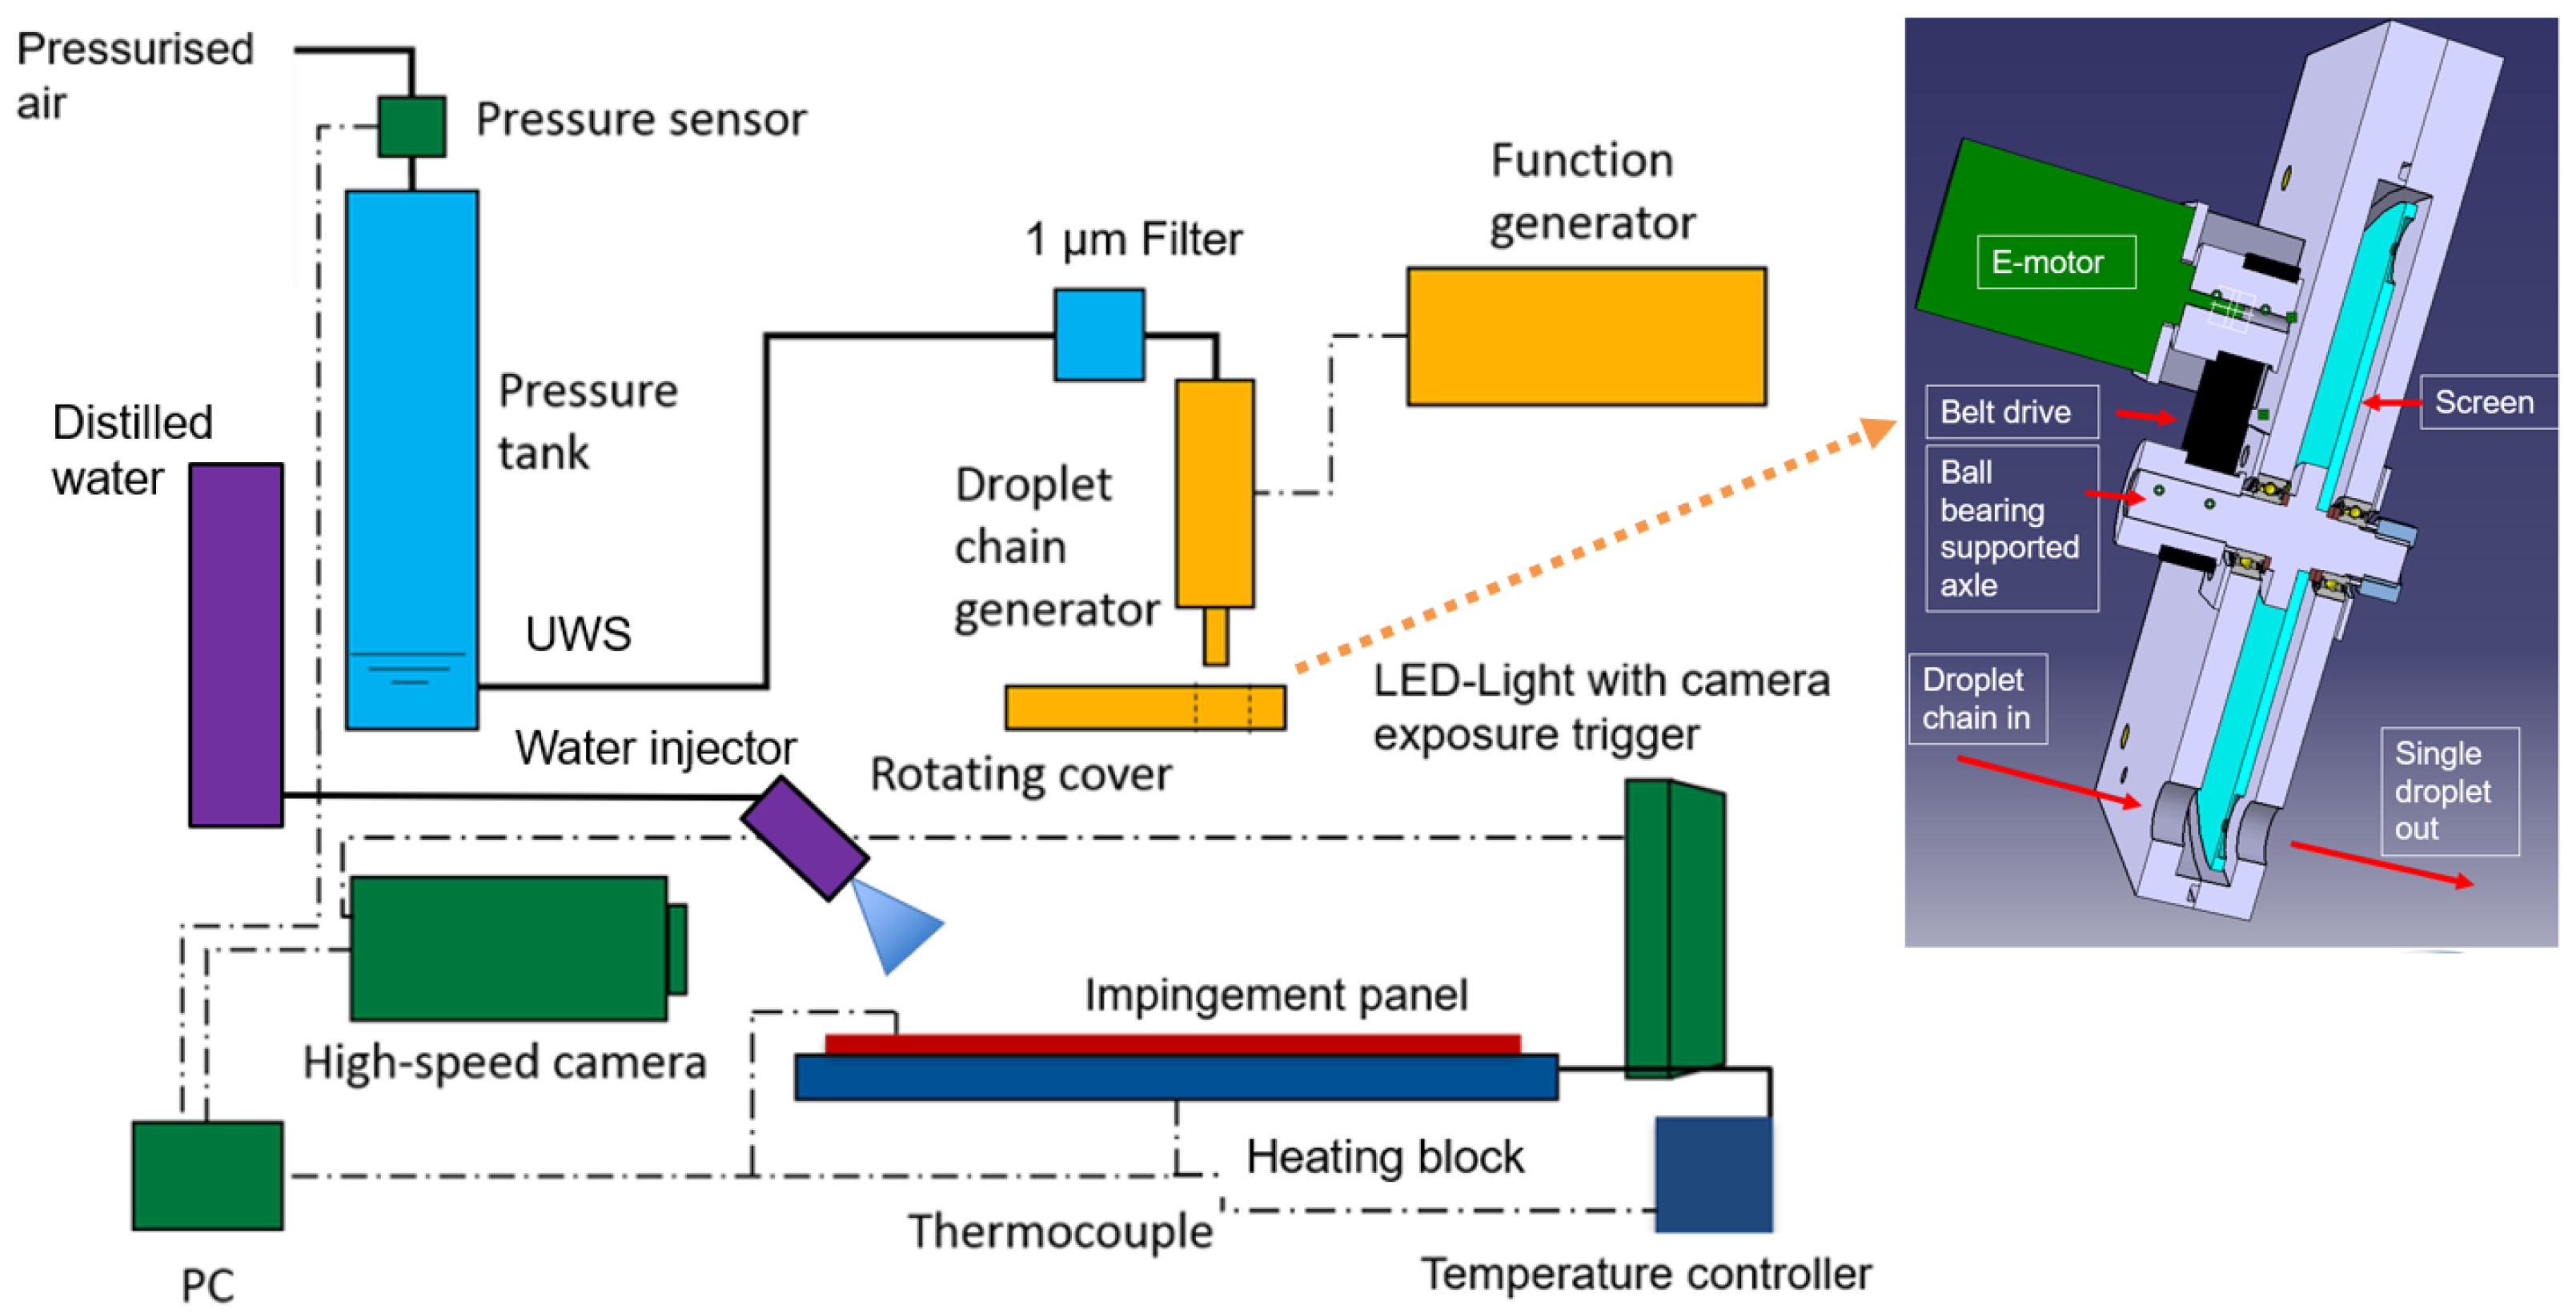
2.1. Test Bench Setup

Several methods have been described previously for studying the impingement of droplets [11,14,30,31]. Experiments were carried out using a droplet chain generator (DCG), to achieve droplet sizes comparable to those in SCR injectors. A schematic setup of the test bench is shown in Figure 2. A detailed setup description can be found in [8].
One drawback of a DCG is the fast succession of droplets impacting the surface, which limits the time to observe a single event, Figure 3a. A rotating cover was designed to cut single droplets from the droplet chain and provide the necessary observation time between droplets. A cut through the rotating cover is depicted in Figure 2 on the right-hand side, showing the rotating screen (light blue) with two holes for the droplets. From the incoming droplet chain from the left, only a single droplet passes through the opening, while the rest splash back from the screen. The result is a single droplet impact, Figure 3b.
This is a significant improvement over the test bench setup described previously [8], where the rotating cover was much simpler and only allowed separating a chain of a few hundred droplets from the continuous droplet stream. The start–stop functionality for the droplet stream was transferred to a movable collecting vessel installed in front of the outlet. It collects all liquid until the droplet chain has stabilized, and droplets can be released on the impingement surface at the start of the recording.
Further improvements included an automated cleaning system based on a three-hole injector with a narrow opening angle, Figure 2 (purple). A well-targeted 7-bar spray of distilled water after each impingement event inhibits the formation of solid deposits on the experimental surface. Revised positioning of the image recording system with a high-speed camera, macro lens, and LED lighting increased the spatial resolution to 106 pixels/mm and the temporal resolution to 38,000 fps. The quality of the temperature reading could be enhanced by positioning the thermocouple closer to the surface (0.3 mm). The surface temperature uniformity was checked before the beginning of the experiments using an infrared camera, and variations around the impingement area proved to be below 1.5 °C. The low variation in surface temperature also proved the good thermal contact between the heating block and the interchangeable stainless-steel targets.
A commercially available reducing agent was used as a working fluid, for the closest possible resemblance with urea-based SCR systems. The droplets consisted of 32.5% UWS, as standardized for automotive applications, with the physical properties given in Table 1.

2.2. Measurement Matrix and Surface Properties

The material for all impingement targets was stainless steel (EN-ISO 1.4301), due to its frequent use in exhaust aftertreatment systems. Different surface characteristics were achieved by shot-peening and sandblasting to different desired roughness values. The surface properties of the impingement targets were characterized in two areas per plate using optical methods (Alicona IF optical 3D profilometer, based on focus variation). One measurement was taken in the central impingement area and one towards the side of the plate, to check for uniformity of the surface parameters. The main parameters of the panels are shown in Table 2.
Typical line-profile-based roughness values R a (arithmetic mean height) and R z (peak-to-valley height) were evaluated, as well as their area-based counterparts S a and S z . An untreated (rolled) panel served as a smooth reference sample. In Figure 4, photographs of the four surfaces are shown. The more rounded topography of the shot-peened surface (05) compared to the quite edgy sandblasted surfaces (01, 02) is visible in the photos, and can be seen even better in the height profile visualized on a colored scale from −40 to +40 μ m in Figure 5.
In Figure 6, a section of the measured height profiles for all four surfaces shows the much steeper gradients resulting from sandblasting compared to the shot-peened plate. In addition, schematic droplets with 80 and 800 μ m diameter are depicted on the scale of surface height.
The parameters of droplet velocity and diameter, surface temperature, and impingement angle were varied during the experimental investigations. The ranges are given in Table 3.
The test samples were heated up to 410 ℃, the maximum surface temperature achievable without damaging the heating cartridges. The lower end of the investigated range was 150 ℃, below which no further change in impingement behavior could be observed. The temperature was varied with a step size of 10 ℃.
The maximum droplet diameter was governed by the orifice diameter at the outlet of the DCG, which was chosen to be 50 μ m . This was smaller than in the previous experiments, resulting in smaller droplets. Due to the rotating cover used to cut single droplets out of the droplet chain, the droplet diameter varied between 40 and 180 μ m . This variation was caused by some droplets contacting the cover, thereby losing some mass. This variation broadened the range of observed droplet diameters. The second effect of the cover was a slight deviation in droplet pathways, which led to droplets reaching the surface in different locations. Thus, multiple independent impingement events could be evaluated from one recording.
As a perfectly perpendicular impact is unusual in exhaust systems, the impingement angle was mainly set to 45° during the investigations. An occasional variation to 22° enabled the study of the influence of impingement angle. The relative pressure of the UWS was varied between 1.2 and 8.0 bar, to control the velocity of the impinging droplets.

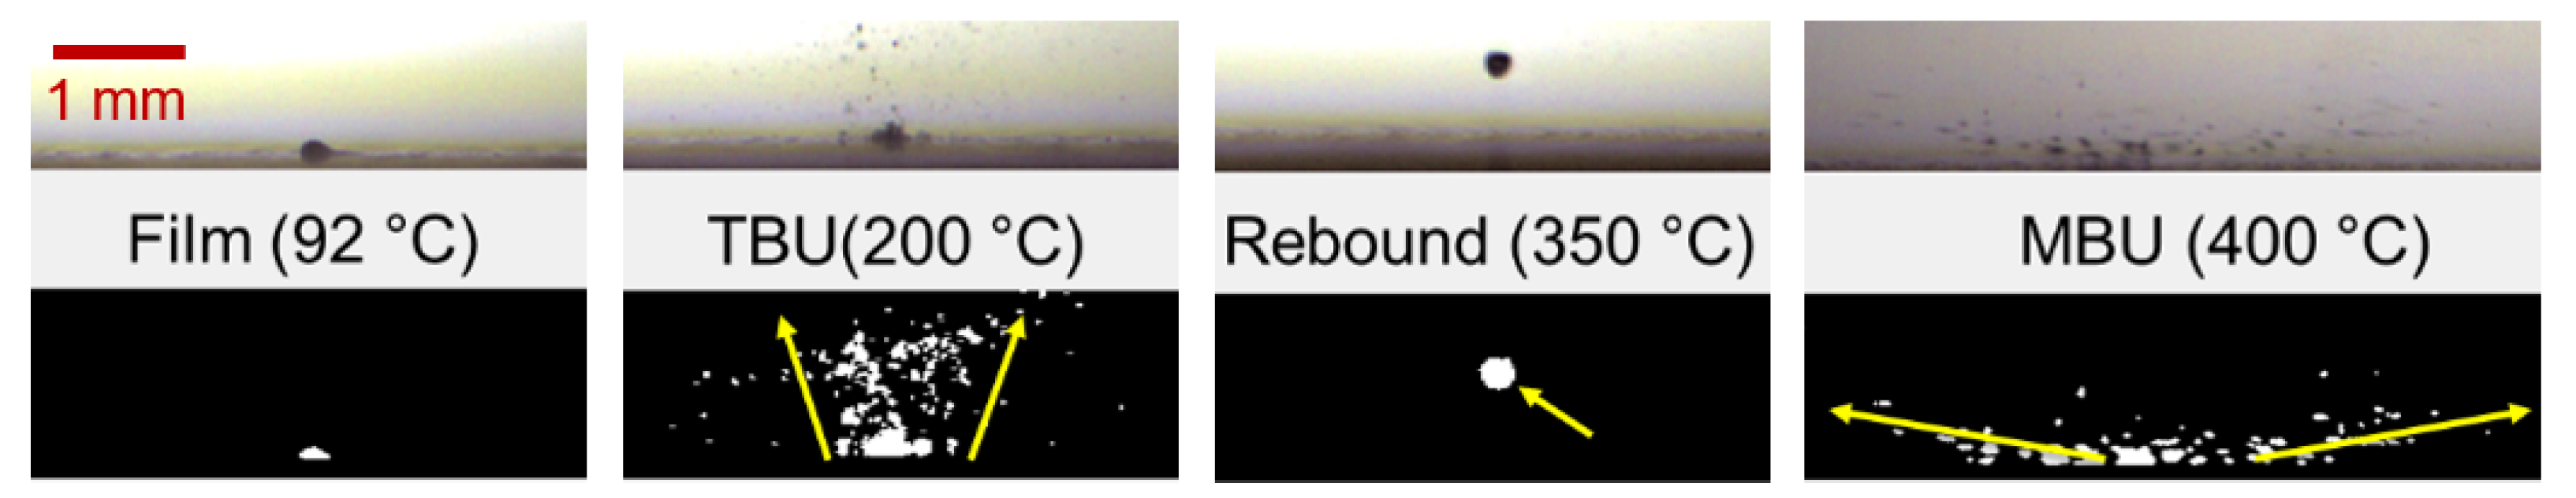
2.3. Image Postprocessing and Mass-Fraction-Based Regime Classification

The recorded videos were postprocessed using a MATLAB routine [8], to extract the relevant data such as droplet diameters, velocity, and We-number. For the current investigation, only impingement on dry surfaces was evaluated. Therefore, a droplet impacting a pre-existing film was not considered for analysis. As the error of the object detection and the evaluated diameter increases with decreasing droplet size, only droplets above 28 μ m diameter were included. Droplets were also excluded from further analysis if the droplet circularity was insufficient.
A mass-fraction-based approach for impingement characterization [8] was used, which reduced the number of impingement regimes to four basic behaviors, as schematically depicted in Figure 7. All observed droplet–wall interactions could be described as a weighted superposition of these basic regimes.
A droplet spreads on a wall when it interacts with a solid surface. If the wall temperature is sufficiently high, the contact layer of the liquid evaporates very rapidly to form a vapor cushion between the liquid and solid.
Rebound: In a rebound, the spread-out liquid retracts again and lifts off the surface, similar to the elastic impact of a solid ball.
Mechanical Breakup (MBU): With increasing kinetic energy involved, the impact forces spreading the liquid overcome the cohesive forces, and it breaks up into numerous secondary droplets on the wall. Those droplets move in every direction, away from the impact location, with an acute elevation angle following the spreading motion.
Thermal-induced Breakup (TBU): If the surface temperature is insufficient to generate a completely separating vapor cushion, the behavior of the liquid can be assigned to bubble or transition boiling. The growth and bursting of vapor bubbles create a mist of extremely fine secondary droplets that move away from the boiling film almost perpendicularly.
Film: If the surface temperature drops below the saturation temperature of the fluid, the liquid remains on the surface and forms a liquid film.
Typical examples of the four main regimes are shown in Figure 8. The top row shows images from the high-speed camera, highlighting the characteristics of the impingement outcome. Below, droplets are depicted in white on a black surface, with their pathways marked with yellow arrows.
Each observed impingement event was characterized based on these four regime descriptions within the first 0.3 ms. With interaction times in most cases being much shorter, this boundary was only relevant for the mass distribution between the film formation and TBU. In cases where mild bubble and secondary droplet formation due to TBU could be observed after the time limit, the whole mass remaining on the surface was assigned to the film regime. As only a few extremely fine droplets appeared in these cases, their contribution to any mass fraction could be considered negligible.
Individual droplet impingement events (coincident diameter and impact velocity) could not be repeated due to inevitable minor variations in the droplet generation, as described earlier. However, a large number of impingement events were recorded. A Delaunay-triangulation-based surface interpolation was used to create the presented impingement maps, e.g., Figure 9. A potential data analysis error can be observed, where immediately neighboring points with very similar impingement conditions are contained in the impingement maps. Single outliers caused steep gradients towards all neighboring points. The raw results from the analysis of the experimental data are not ideal for an empirical modeling approach, due to some of these experimental variations being caused by imprecision in the measurements. Therefore, smoothing is required, as explained in [8]. The smoothing process for the maps was refined compared to [8] by defining the structure of the synthetic impingement maps with isolines of constant mass fractions (0, 0.5, 1). Their position was optimized by minimizing the cumulative deviation from the experimental maps.

3. Results and Discussion

The results of the impingement investigations are shown in the form of four contour plots per surface. Two major influencing factors for the impingement, the surface temperature (x-axis) and the droplet We-number (y-axis), span the space for each plot. The first plot shows the mass fraction of the incoming droplet assigned to the film regime (range 0 to 1). The other maps represent equivalent data for the respective regimes. The impingement event outcome can be read from the combination of the values in the four plots for each set of surface temperature and We-number. As no significant influence of the impingement angle on the mass fraction distribution could be observed within the tested range, the plots are based on data points from 45°. In between those data points, the map was completed using linear surface interpolation based on Delaunay triangulation, as available in MATLAB for scattered data points. The results for impingement on a smooth surface are shown in Figure 9 and the successful transition to synthetic maps in Figure 10.
Consequently, the general impingement behavior can be discussed based on the presented results from the smooth surface, being the reference case. For temperatures up to 150 ℃, the impinging droplet formed a wall film. This temperature was insufficient to generate secondary droplets from boiling. Increasing the surface temperature slightly, depending on the We-number, the transition to a thermal-induced droplet breakup can be observed. The mass fraction of the secondary droplets generated by TBU was nearly independent of the We-number. With a further increase in temperature, TBU was gradually replaced by a rebound and MBU. In this high-temperature area on the impingement map, the influence of the We-number is significant for the droplet–wall interaction outcome. For We-numbers below approx. 30, the rebound behavior was dominant. For We-numbers above 30, with increasing impact energy, the mechanical disintegration during the spreading phase became the determinant behavior. Surface temperatures higher than 300 ℃ did not result in a further change of the impingement behavior. Consequently, this temperature can be regarded as the dynamic LFP.

3.1. Influence of Roughness

The influence of surface roughness on the impingement was shown by comparing the synthetic maps for the roughest surface, given in Figure 11, with those for the smoothest investigated surface in Figure 10.
The first noticeable difference can be found in the MBU regime. The regime was extended towards lower We-numbers, significantly reducing the area of rebound. The interaction between vapor, liquid, and surface is schematically depicted in Figure 12. The generated vapor layer could completely separate the liquid from the solid on the smooth surface. This enabled the droplet to spread along the wall and then contract again towards a spherical form. After this contraction, the droplet lifted off, resulting in a rebound. By increasing the roughness, however, peaks of the solid penetrated through the vapor. Additionally, as stated in [24], a part of the vapor mass could escape from beneath the liquid through the valleys of the rough surface. The resulting direct contact between the liquid lamella and solid surface disturbed the expanding and contracting motion. The lamella was torn apart through mechanical shearing into smaller secondary droplets, as typically seen in MBU (Figure 12 upper right picture). Additionally, vapor bubbles were formed at the tips of the peaks. Those may have caused lamella breakup as well (Figure 12 lower right picture).
These observations agree with the literature reports of splashing at lower We- or K-numbers on rougher surfaces [4,10,11].
The other area of extended MBU caused by roughness was towards lower temperatures. As in the case of the smooth surfaces, below 300 ℃, a transition towards TBU was observed. The source of the remaining mass fraction assigned to the MBU regime could be seen during the initial phase of the impingement process, as depicted in Figure 13  t 2 . During droplet spreading along the wall, with decreasing lamella thickness, a point was reached when parts of the rim were sheared off due to the interaction with surface spikes. The pathways of the resulting droplets matched the criteria defined for MBU. This effect could only be observed above a We-number of approx. 150. Below this, the impacting droplet’s kinetic energy seemed insufficient to drive a spreading motion with enough energy to cause the described shear breakup. This minimal We-number being higher (around 200) for the less rough surface ( R z = 24 μ m ) implies that the effect was more pronounced with increasing roughness. On the contrary, no influence could be observed from temperature. The remaining lamella, which was not sheared off, underwent heat-up, boiling, and consequently TBU, as expected at this surface temperature. In this phase, after a delay from boiling retardation, TBU-typical secondary droplets appeared, Figure 13  t 3 .
Similar effects of the breakup of the spreading film on rough surfaces shortly after impact have been observed previously. Previous explanations were either the interaction of a lamella with decreasing thickness with rough peaks [10] or a change in the LFP temperature [23].
As earlier publications showed, the contact patch area between droplet and wall increases with the We-number [26,31,33]. This stems from intensified droplet spreading along the wall, resulting from higher impact forces. Due to this effect, the transition from TBU to film formation shifts towards lower temperatures with increased We-numbers. As the heat flux from solid to liquid increases with the contact area, lower surface temperatures are sufficient to cause the boiling phenomena leading to TBU.
Another possibility increasing this liquid–solid contact area is the surface roughness, as shown in Figure 14. Consequently, the roughness influences the transition from TBU to film formation similarly to the We-number. This effect can be observed in the extension of the TBU towards lower temperatures in Figure 11 compared to Figure 10. This comparison also shows that at high We-numbers with an already large contact area from impact forces, the additional effect of the roughness decreases. It is, however, most relevant at small We-numbers.
The increase in heat flux on rough surfaces was in good agreement with literature [10,23].

3.2. Intensity of Roughness Influence

Further analysis was performed on the intensity of the influence of roughness, to see whether increasing the roughness value also caused a more severe effect. A comparison of Figure 15 and Figure 16 shows that the rougher the surface, the stronger the enhancement of the MBU intensity at lower temperatures, while the transition temperature to pure MBU remained unchanged at approx. 300 ℃. The extension of the MBU regime towards lower We-numbers at high temperatures also scaled with the surface roughness value. The same can be observed in the leftmost maps regarding the intensification of the TBU. The rougher the surface, the greater the TBU at lower temperatures.
It was assumed that the influence of the roughness was linear, as proportionally with the increase in roughness R z , the surface peaks became more prominent. Consequently, they protruded further through the vapor layer into the liquid at high temperatures. Thus, the contact area gain, relevant at lower temperatures, increased. To check the assumption of a linear correlation, derivation of synthetic maps was performed based exclusively on the smoothest ( R z = 7 μ m ) and the roughest ( R z = 63 μ m ) surface. The position of the supporting nodes for the mildly rough surface ( R z = 24 μ m ) was found through linear interpolation between those of the maps for the other two roughness values. Next, synthetic impingement maps were generated from these interpolated supporting nodes. The satisfactory agreement between the synthetic maps and the raw experimental result maps confirmed that the assumed linearity was acceptable. A comparison is shown in Figure 16 and Figure 17.

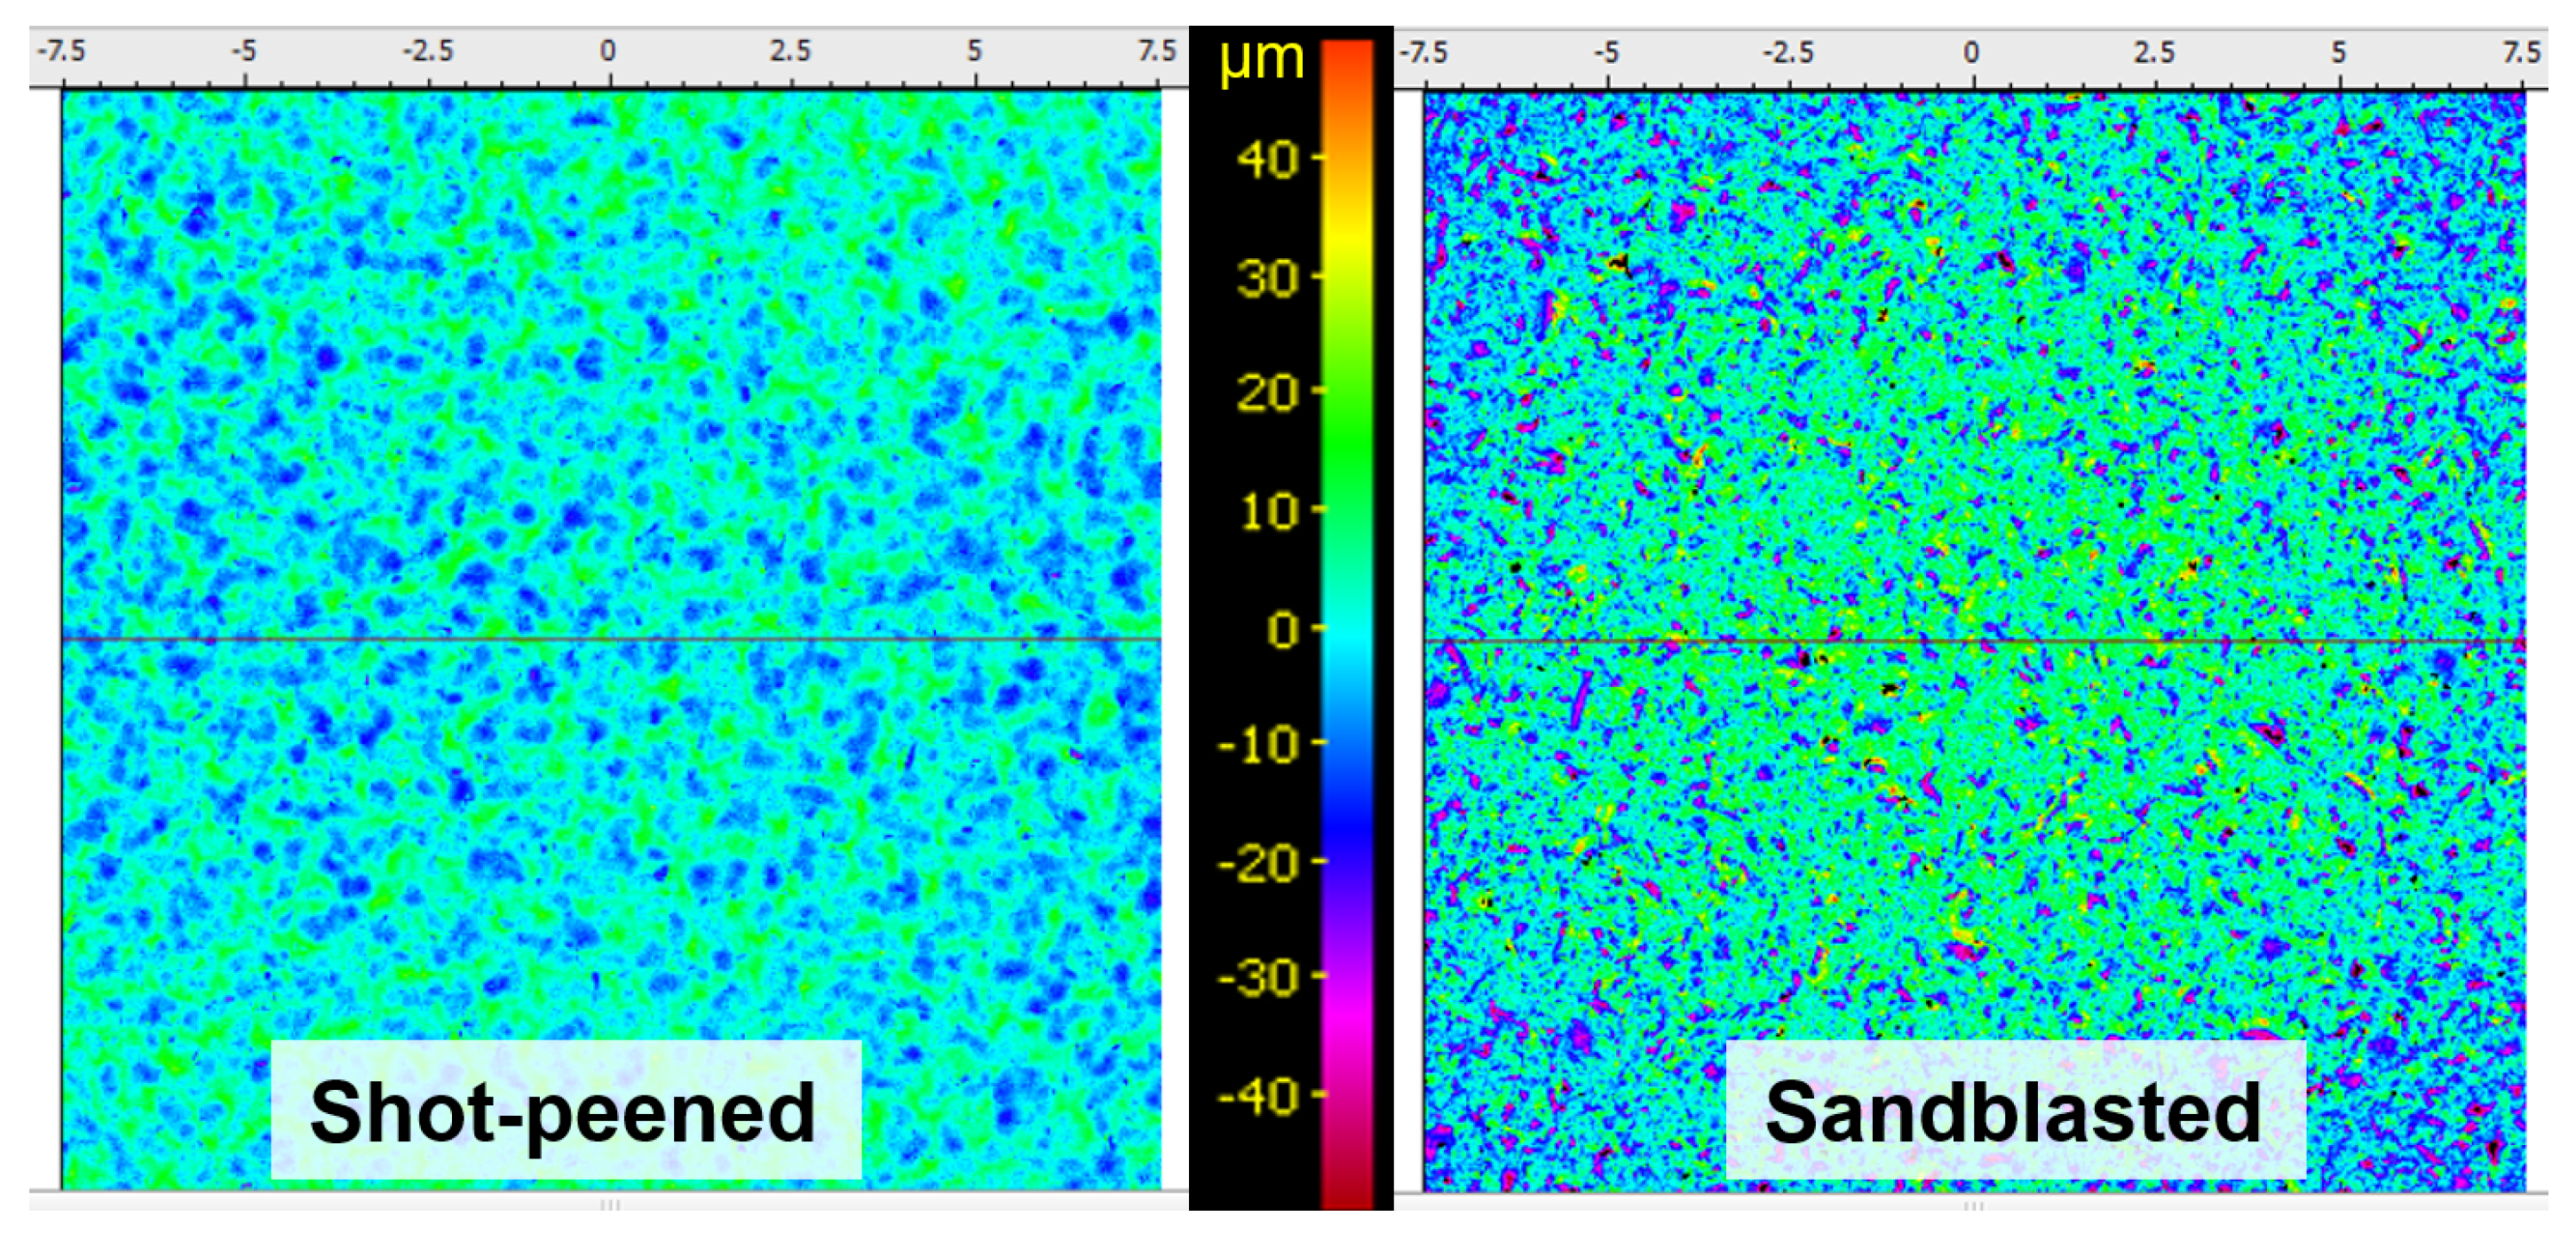
3.3. Influence of Topography

Besides the variation of roughness in terms of R z values, the surface topography was investigated using shot-peening instead of sandblasting. As shown in the description of the test samples, shot-peening yielded a more rounded structure (see Figure 6), due to the round particles used in surface finishing. The root mean square slope R d q is a parameter that numerically represents the steepness of a surface. It is defined as given in Equation (2) with the sampling length l and the local gradient of the surface profile d z d x . The shot-peened surface showed a considerably lower value in this respect than the sandblasted surface with a comparable R z value, as visible in Table 4.
R d q = 1 l 0 l d z d x 2 d x
At high temperatures, there was a transition from a rebound to MBU with increasing We-numbers. In this area, no significant difference between the shot-peened (Figure 18) and the sandblasted (Figure 16) surface structure was observed, i.e., no influence of topography. However, in Figure 18, the appearance of MBU at temperatures below 300 ℃ can hardly be observed.For topographies with R d q > 0.2 , the intensity increased with larger values of R d q . This effect suggests that the described mechanism for generating secondary droplets from the lamella shear strain only occurred during interaction with sharp objects. As visible in Figure 6 and numerically expressed by R d q , the gradients of the shot-peened surface were much smaller. The spreading lamella could move along the slopes and remain connected, instead of being ripped apart.
A reduced impact of surface roughness can also be observed regarding the surface area increase and the connected intensification of heat transfer at lower temperatures. In the case of the shot-peened surface, a reduced number of surface peaks caused a lesser increase in contact area on the wavier surface topography. Thus, the enhancement of TBU was less pronounced than on the sandblasted surface.

4. Conclusions

Experiments were conducted using UWS droplets representative of the droplets found in automotive SCR systems, and they were analyzed using high-speed imaging and image postprocessing. The observations regarding impingement behavior were presented using a characterization approach based on the weighted superposition of four basic regimes. This enabled a representation of the smooth transitions from one regime to another.
The influence of surface roughness on the impingement process was studied using the presented methodology. The main results were as follows:
  • An increased probability of thermal-induced breakup at lower temperatures, due to increased liquid–wall contact area for rough surfaces.
  • Enhancement of mechanical breakup towards lower temperatures, caused by surface edges shearing secondary droplets off the spreading lamella.
  • Reduced rebound at high temperatures, as surface peaks disturb and penetrate the vapor cushion between liquid and solid.
Apart from the roughness quantified in terms of the parameter R z , the influence of surface topography was investigated. A wavier surface structure with a smaller root mean square slope R d q was achieved using shot-peening. The smaller gradients significantly changed the roughness effect, even at similar R z values. The reduced rebound at high temperatures was not sensitive to the topography. However, an enhanced MBU at temperatures below 300 ℃ was hardly observed on the shot-peened surface. The intensification of the TBU due to the contact area increase was reduced but still visible.
In the next step, the knowledge gained from this experimental investigation will be implemented as a new impingement model in a CFD code. The scope will include simulation of SCR exhaust systems. On the one hand, improving impingement modeling should allow a more accurate prediction of ammonia gas distribution. On the other hand, impingement governs the growth of liquid film mass, which can be a precursor for the formation of solid deposits. Both aspects will be subject to further investigation in the near future.

Author Contributions

Conceptualization, M.Q. and T.L.; Data curation, M.Q.; Funding acquisition, T.L.; Investigation, M.Q.; Methodology, M.Q.; Project administration, T.L.; Software, M.Q.; Supervision, T.L.; Writing—original draft, M.Q.; Writing—review and editing, M.Q. and T.L. All authors have read and agreed to the published version of the manuscript.

Funding

This work was funded by the Federal Ministry for Economic Affairs and Climate Action (BMWK) through the German Federation of Industrial Research Associations eV (AiF) based on a decision taken by the German Bundestag and the Research Association for Combustion Engines eV (FVV) (funding no. 601400). The work at the TU Wien was funded by the Ministry for Climate Action, Environment, Energy, Mobility, Innovation and Technology (BMK) through the Austrian Research Promotion Agency (FFG), grant number 877645. The research was carried out within the framework of the industrial collective programme (IGF/CORNET no. 270 EN). Open Access Funding by TU Wien.

Data Availability Statement

The data are not publicly available due to confidentiality reasons.

Acknowledgments

The authors acknowledge TU Wien Bibliothek for financial support through its Open Access Funding Programme. The surface properties of the impingement plates were characterized at the Institute of Production Engineering and Photonic Technologies at TU Wien. Special thanks to Clemens Sulz and Johann Sauprigl.

Conflicts of Interest

The authors declare no conflict of interest. The funders had no role in the design of the study; in the collection, analyses, or interpretation of data; in the writing of the manuscript; or in the decision to publish the results.

Abbreviations

The following abbreviations are used in this manuscript:
CFDComputational fluid dynamics
CHFCritical heat flux
DCGDroplet chain generator
fpsFrames per second
LFPLeidenfrost point
MBUMechanical breakup
NOxNitric oxides
ReReynolds-number
SCRSelective catalytic reduction
TBUThermal-induced breakup
UWSUrea-water solution
WeWeber-number

References

  1. Quissek, M.; Lauer, T.; García-Afonso, O.; Fowles, S. Identification of Film Breakup for a Liquid Urea-Water-Solution and Application to CFD. In SAE Technical Paper Series; SAE International: Warrendale, PA, USA, 2019. [Google Scholar] [CrossRef]
  2. Liang, G.; Mudawar, I. Review of drop impact on heated walls. Int. J. Heat Mass Transf. 2017, 106, 103–126. [Google Scholar] [CrossRef]
  3. Bai, C.; Gosman, A.D. Developtment of Methodology for Spray Impingement Simulation. SAE Trans. 1995, 104, 550–568. [Google Scholar]
  4. Kuhnke, D. Spray/Wall–Interaction Modelling by Dimensionless Data Analysis. Ph.D. Thesis, Technische Universität Darmstadt, Darmstadt, Germany, 2004. [Google Scholar]
  5. Tran, T.; Staat, H.J.J.; Prosperetti, A.; Sun, C.; Lohse, D. Drop impact on superheated surfaces. Phys. Rev. Lett. 2012, 108, 036101. [Google Scholar] [CrossRef] [PubMed]
  6. Mundo, C.; Sommerfeld, M.; Tropea, C. Droplet-wall collisions: Experimental studies of the deformation and breakup process. Int. J. Multiph. Flow 1995, 21, 151–173. [Google Scholar] [CrossRef]
  7. Wachters, L.; Westerling, N. The heat transfer from a hot wall to impinging water drops in the spheroidal state. Chem. Eng. Sci. 1966, 21, 1047–1056. [Google Scholar] [CrossRef]
  8. Quissek, M.; Budziankou, U.; Lauer, T. A Novel Approach for the Impingement of AdBlue-Droplets based on Smooth Regime Transitions. In SAE Technical Paper Series; SAE International: Warrendale, PA, USA, 2020. [Google Scholar] [CrossRef]
  9. Börnhorst, M.; Deutschmann, O. Single droplet impingement of urea water solution on a heated substrate. Int. Heat Fluid Flow 2018, 69, 55–61. [Google Scholar] [CrossRef]
  10. Moita, A.S.; Moreira, A. Drop impacts onto cold and heated rigid surfaces: Morphological comparisons, disintegration limits and secondary atomization. Int. J. Heat Fluid Flow 2007, 28, 735–752. [Google Scholar] [CrossRef]
  11. Kuhn, C.; Schweigert, D.; Kuntz, C.; Börnhorst, M. Single droplet impingement of urea water solution on heated porous surfaces. Int. J. Heat Mass Transf. 2021, 181, 121836. [Google Scholar] [CrossRef]
  12. Cossali, G.E.; Marengo, M.; Santini, M. Thermally induced secondary drop atomisation by single drop impact onto heated surfaces. Int. J. Heat Fluid Flow 2008, 29, 167–177. [Google Scholar] [CrossRef]
  13. Koizumi, Y.; Shōji, M.; Monde, M.; Takata, Y.; Nagai, N. Boiling: Research and Advances; Elsevier: Amsterdam, The Netherlands, 2017. [Google Scholar]
  14. Wruck, N. Transientes Sieden von Tropfen beim Wandaufprall; Berichte aus der Verfahrenstechnik, Shaker: Aachen, Germany, 1999. [Google Scholar]
  15. Rioboo, R.; Tropea, C.; Marengo, M. Outcomes from a Drop Impact on Solid Surfaces. At. Sprays 2001, 11, 12. [Google Scholar] [CrossRef]
  16. Moita, A.S.; Moreira, A.L.N. Development of empirical correlations to predict the secondary droplet size of impacting droplets onto heated surfaces. Exp. Fluids 2009, 47, 755–768. [Google Scholar] [CrossRef]
  17. Habchi, C. A Comprehensive Model for Liquid Film Boiling in Internal Combustion Engines. Oil Gas Sci. Technol.—Rev. IFP 2010, 65, 331–343. [Google Scholar] [CrossRef]
  18. Liang, G.; Shen, S.; Guo, Y.; Zhang, J. Boiling from liquid drops impact on a heated wall. Int. J. Heat Mass Transf. 2016, 100, 48–57. [Google Scholar] [CrossRef]
  19. Birkhold, F. Selektive katalytische Reduktion von Stickoxiden in Kraftfahrzeugen: Untersuchung der Einspritzung von Harnstoffwasserlösung; Berichte aus der Strömungstechnik, Shaker: Aachen, Germany, 2007. [Google Scholar]
  20. Biance, A.L.; Clanet, C.; Quéré, D. Leidenfrost drops. Phys. Fluid. 2003, 15, 1632. [Google Scholar] [CrossRef]
  21. Tran, T.; Staat, H.J.J.; Susarrey-Arce, A.; Foertsch, T.C.; van Houselt, A.; Gardeniers, H.J.G.E.; Prosperetti, A.; Lohse, D.; Sun, C. Droplet impact on superheated micro-structured surfaces. Soft Matter 2013, 9, 3272. [Google Scholar] [CrossRef]
  22. Chandra, S.; Aziz, S.D. Leidenfrost Evaporation of Liquid Nitrogen Droplets. J. Heat Transf. 1994, 116, 999–1006. [Google Scholar] [CrossRef]
  23. Bernardin, J.D.; Stebbins, C.J.; Mudawar, I. Effects of surface roughness an water droplet impact history and heat transfer regimes. Int. J. Heat Mass Transf. 1997, 40, 73–88. [Google Scholar] [CrossRef]
  24. Steinbach, S. Einfluss der Transportvorgänge auf die Effizienz von Harnstoffkatalysatoren in SCR-Abgasanlagen. Ph.D. Thesis, Technische Universität München, München, Germany, 2007. [Google Scholar]
  25. Kubiak, K.J.; Wilson, M.; Mathia, T.G.; Carval, P. Wettability versus roughness of engineering surfaces. Wear 2011, 271, 523–528. [Google Scholar] [CrossRef]
  26. Antonini, C.; Amirfazli, A.; Marengo, M. Drop impact and wettability: From hydrophilic to superhydrophobic surfaces. Phys. Fluid. 2012, 24, 102104. [Google Scholar] [CrossRef]
  27. Moon, J.H.; Cho, M.; Lee, S.H. Dynamic contact angle and liquid displacement of a droplet impinging on heated textured surfaces. Exp. Therm. Fluid Sci. 2019, 101, 128–135. [Google Scholar] [CrossRef]
  28. Clanet, C.; Béguin, C.; Richard, D.; Quéré, D. Maximal deformation of an impacting drop. J. Fluid Mech. 2004, 517, 199–208. [Google Scholar] [CrossRef]
  29. Schweigert, D.; Damson, B.; Lüders, H.; Stephan, P.; Deutschmann, O. The effect of wetting characteristics, thermophysical properties, and roughness on spray-wall heat transfer in selective catalytic reduction systems. Int. J. Heat Mass Transf. 2020, 152, 119554. [Google Scholar] [CrossRef]
  30. Akhtar, S.W.; Yule, A.J. Droplet Impaction on a Heated Surface at High Weber Numbers. In Proceedings of the ILASS-Europe 2001, Zurich, Switzerland, 2–6 September 2001. [Google Scholar]
  31. Castanet, G.; Caballina, O.; Lemoine, F. Drop spreading at the impact in the Leidenfrost boiling. Phys. Fluid. 2015, 27, 063302. [Google Scholar] [CrossRef]
  32. BASF. Technisches Merkblatt AdBlue. 2008. Available online: https://docplayer.org/70411218-Adblue-technisches-merkblatt.html (accessed on 10 May 2023).
  33. Karl, A.; Anders, K.; Rieber, M.; Frohn, A. Deformation of liquid droplets during collisions with hot walls: Experimental and Numerical Results. Part. Part. Syst. Charact. 1996, 13, 186–191. [Google Scholar] [CrossRef]
Figure 1. Empirical Bai–Gosman impingement map. Reprinted with permission of SAE International from [3]; permission conveyed through Copyright Clearence Center, Inc.
Fluids 08 00152 g001
Figure 2. Test bench setup for the experimental investigation of impingement on rough surfaces, with a sectional view of the rotating cover on the right.
Fluids 08 00152 g002
Figure 3. Droplet cover influence on the high-speed recording: (a) With the rotating screen inactive, a chain of droplets reaches the surface in short succession. (b) With the screen rotating, single droplet impingement can be studied.
Fluids 08 00152 g003
Figure 4. Impingement surfaces used for investigations—photos in the top row—3D images from optical surface measurement in the bottom row (area 100 × 80 μ m ). Surfaces according to ID in Table 2. The scale bars apply to the respective rows.
Fluids 08 00152 g004
Figure 5. Different surface structures resulting from shot-peening and sandblasting. Results from optical measurements show the coloured height profile on 15 × 15 mm patches.
Fluids 08 00152 g005
Figure 6. Height profiles of the investigated surfaces and droplet sizes compared to the surface height.
Fluids 08 00152 g006
Figure 7. Four basic regimes of impingement behavior with characteristic secondary droplets.
Fluids 08 00152 g007
Figure 8. Pictures from high-speed recording before and after image postprocessing of characteristic events for the four basic regimes.
Fluids 08 00152 g008
Figure 9. Impingement maps for R z = 7 μ m . Blue dots represent experimental data points.
Fluids 08 00152 g009
Figure 10. Synthetic impingement maps for R z = 7 μ m .
Fluids 08 00152 g010
Figure 11. Synthetic impingement maps for R z = 63 μ m .
Fluids 08 00152 g011
Figure 12. Influence of surface roughness on the regime transition from a rebound to MBU. The surface peaks penetrated the vapor cushion, hindering the droplet retraction and lift-off necessary for a rebound.
Fluids 08 00152 g012
Figure 13. Mechanism of the extended MBU at lower temperatures. The rough surface rips off parts of the spreading lamella.
Fluids 08 00152 g013
Figure 14. Heat transfer increase from surface roughness and a corresponding larger contact area.
Fluids 08 00152 g014
Figure 15. Impingement maps for the sandblasted surface R z = 63 μ m . Blue dots represent experimental data points.
Fluids 08 00152 g015
Figure 16. Impingement maps for the sandblasted surface with R z = 24 μ m . Blue dots represent experimental data points.
Fluids 08 00152 g016
Figure 17. Synthetic impingement maps for R z = 24 μ m .
Fluids 08 00152 g017
Figure 18. Impingement maps for the shot-peened surface R z = 30 μ m . Blue dots represent experimental data points.
Fluids 08 00152 g018
Table 1. Physical properties of 32.5% urea–water solution (UWS) at 25 ℃ [19,32].
Density
[ kg / m 3 ]
Dynamic Viscosity
[ Pa s ]
Surface Tension
[ N / m ]
UWS1087 1.3 × 10 3 7.0 × 10 2
Table 2. Measured surface parameters of the investigated stainless-steel impingement panels.
Panel IDRa  [ μ m ] Rz  [ μ m ] Sa  [ μ m ] Sz  [ μ m ] Surface Treatment
ID 001 2.93 23.83 3.08 95.86 sandblasted
ID 002 8.41 62.51 8.60 194.68 sandblasted
ID 005 4.88 29.88 5.03 97.48 shot-peened
ID 009 0.83 7.08 0.81 52.93 untreated
Table 3. Range of experimental parameters.
ParameterUnitRange
Velocitym/s 0.5 20
Velocity wall-normalm/s 0.35 14
Droplet diameter μ m 40 180
Weber-number 1 400
Impingement angle 22 / 45
Surface temperature C 150 410
Table 4. Root mean square slope R d q of the impingement surfaces (DIN EN ISO 21920-2).
Panel ID1259
Surface Treatmentsandblastedsandblastedshot-peeneduntreated
Rz  [ μ m ] 2463307
Rdq  [ ] 0.232 0.291 0.138 0.083
Disclaimer/Publisher’s Note: The statements, opinions and data contained in all publications are solely those of the individual author(s) and contributor(s) and not of MDPI and/or the editor(s). MDPI and/or the editor(s) disclaim responsibility for any injury to people or property resulting from any ideas, methods, instructions or products referred to in the content.

