Article

Experimental Characterization of the Wettability of Coated and Uncoated Plates for Indirect Evaporative Cooling Systems

1
Politecnico di Milano, Department of Energy, Via Lambruschini 4, 20156 Milano, Italy
2
Recuperator S.p.A., Via Valfurva 13, 20027 Rescaldina, Italy
*
Author to whom correspondence should be addressed.
Fluids 2023, 8(4), 122; https://doi.org/10.3390/fluids8040122
Submission received: 3 March 2023 / Revised: 22 March 2023 / Accepted: 31 March 2023 / Published: 3 April 2023
(This article belongs to the Special Issue Fluids and Surfaces)

Abstract

:
Indirect Evaporative Cooling (IEC) is a very promising technology to substitute and/or integrate traditional air conditioning systems, due to its ability to provide cooling capacity with limited power consumption. Literature studies proved that a higher wettability of the IEC plates corresponds to better performance of the system. In this work, wettability of three different surfaces used for IEC systems plates—uncoated aluminum alloy (AL), standard epoxy coating (STD), and a hydrophilic lacquer (HPHI)—is studied and characterized in terms of static and dynamic contact angles. The static contact angle resulted to be the lowest for the HPHI surface (average 69°), intermediate for the STD surface (average 75°), and the highest for the AL surface (average 89°). The analysis of the dynamic contact angles showed that their transient behavior is similar for all the surfaces, and the advancing and receding contact angles obtained are consistent with the results of the static analysis. These results will be useful as input parameters in models aimed at predicting the IEC system performance, also using computational fluid dynamics.

Graphical Abstract

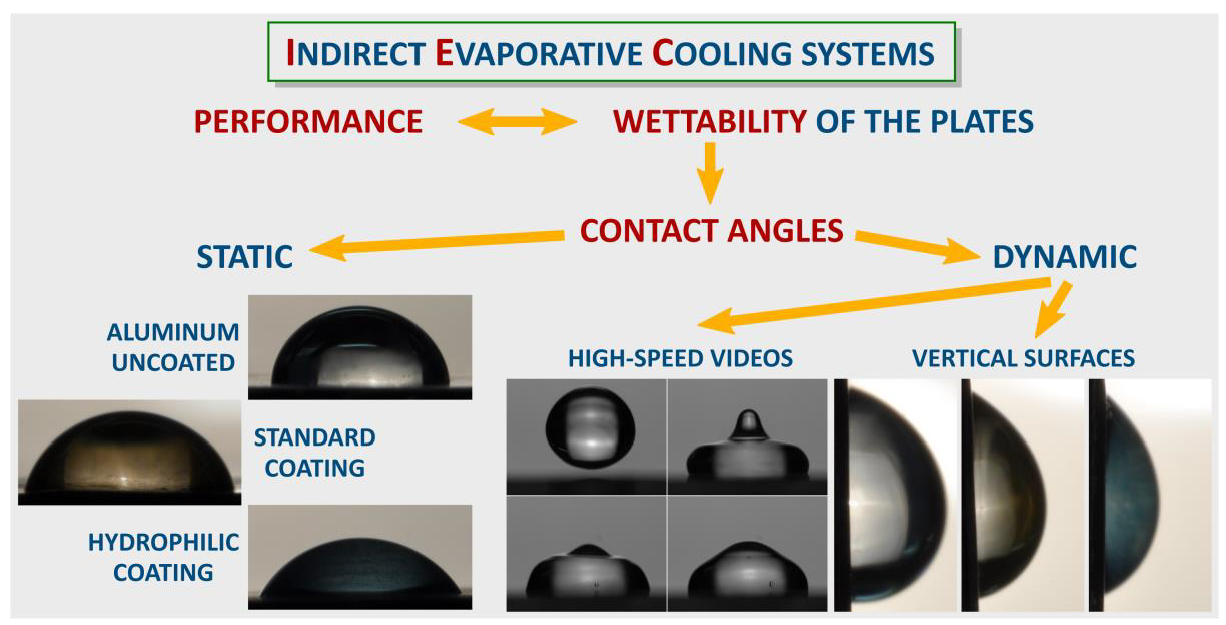
1. Introduction and State of the Art

Nowadays, heating, ventilation, and cooling systems have become a necessity for people living in both developed and developing countries, thus representing a significant fraction of primary energy use on a world basis [1]. In particular, the energy consumption due to the cooling of indoor environments is becoming much more relevant than a few decades ago, both for the higher request of adequate comfort conditions, and for the increase of the average outdoor temperature due to the climate change.
In this area, evaporative cooling is of great interest, as it allows to cool the air through the evaporation of water [1], constituting the basis of technologies which can guarantee significant primary energy saving during summer air conditioning. In particular, Indirect Evaporative Cooling (IEC) is one of the most promising solutions to replace and/or integrate traditional air conditioning systems [2]. In fact, indirect systems, unlike the direct ones, are able to reduce the air temperature without increasing its humidity ratio, thus promoting preservation of comfort conditions in the built environment.
In an IEC system, the primary (product) air flows over the dry side of a plate, and the secondary (working) air flows over the opposite wet side of the same plate. The secondary air absorbs heat from the primary air through the aid of water evaporation on the wet surface of the plate, thus cooling down the primary air, which is the aim of the system [3]. The complete IEC system is made of a series of plates, constituting numerous channels in which primary and secondary air flow alternately.
In the last 25 years, researchers have been trying to model the behavior of IEC systems, by building analytical, phenomenological, and numerical models. In particular, Alonso et al. [4] developed the first relevant analytical model in this field, based on some simplifying assumptions which made the model quite easy to implement. This first model was the basis of the work of Chen et al. [5], who introduced the effects of condensation of fresh air, and of the study of Heidarinejad and Moshari [6], whose model takes into account also longitudinal heat conduction and the effects of the change of water temperature along the plates surfaces in cross-flow configuration. Then, in 2017, De Antonellis et al. [7] introduced a new phenomenological model which also considers the effect of the adiabatic cooling of the working air in the inlet plenum and the wettability of the plates. This model opens a new perspective, as it considers the wettability of the surfaces as a very important aspect to consider for the evaluation of the performance of IEC systems. Finally, in 2021, Adam et al. [8] proposed a numerical model of cross-flow IEC systems, which takes into account again the wettability of the surfaces.
Several literature papers have shown that performance of IEC systems is strongly related to the formation of uniform water layers on the plates. In particular, Chua et al. [9] proved that a high wetting condition significantly increases the IEC system performance by decreasing the primary air outlet temperature and thus increasing the wet bulb effectiveness of the system. Furthermore, as previously mentioned, De Antonellis et al. [7] highlighted the importance of taking into account the surface wettability factor in the modeling of IEC systems, also by evaluating its effect on the performance of the system. Finally, Guilizzoni et al. [10] analyzed the wettability of two types of plates, showing that an increase of wettability of the plates leads to an increase in the performance of the system. As a consequence, in order to improve the performance of a system, it is necessary to increase as much as possible the surface wettability of the plates.
It has been shown that covering the IEC plates with suitable coatings changes their surface characteristics, and thus the performance of the entire system [11]. In particular, using hydrophilic coatings turned out to be a very effective way to increase the surface wettability [10], namely to reduce both the static and dynamic contact angles that the water drops form when laying on the plates, thus favoring the surface wetting.
The scope of this work is to experimentally analyze the static and dynamic contact angles of water drops in contact with three different surfaces belonging to IEC systems plates, in order to fully characterize the wettability of these surfaces, and to provide the values of the contact angles to be used in models, both simplified and based on computational fluid dynamics, aimed at predicting the IEC system behavior and performance. This piece of information is extremely relevant because the only data currently available in literature about this kind of surfaces are those reported in [10], which refer to a much less extensive experimental campaign involving only static contact angles of coated surfaces. Therefore, further investigations were needed in this field.
The three surface that were considered in this work are: the aluminum uncoated surface (AL), the same surface covered with a standard epoxy coating (STD), and again the same surface covered with a hydrophilic lacquer (HPHI). Firstly, the static contact angle has been evaluated by deposing sessile drops on the three surfaces, taking macrophotography pictures of these drops, and measuring the contact angle by using the Axisymmetric Drop Shape Analysis (ADSA) technique [12]. Secondly, dynamic contact angles (advancing and receding) were estimated in two ways: for sessile drops on vertical surfaces, and by means of high-speed videos of the drop impacts on the three surfaces. Finally, the results have been related to the IEC systems performance measured in a previous experimental campaign [10], in order to lay the foundations for future wettability analyses.

2. Materials, Methods, and Motivation

In this section, the experimental procedure and setup used for each of the aforementioned analyses are described. Moreover it is highlighted the reason why all these analyses are needed for an in-depth characterization of the surface wettability, and how each of the analyzed angles can be related to the IEC system working processes.

2.1. Evaluation of the Static Contact Angle

The first quantity that is typically used to characterize the wettability of a surface is the static contact angle, measured for a sessile, namely gently deposed, drop [13]. For this reason, as previously mentioned, the static contact angle that the drops form with each of the three investigated surfaces has been evaluated.
The static or Young contact angle, θ , is defined as the angle formed by the tangent to the drop profile with the tangent to the solid surface profile in a plane where the normal vectors to both the liquid-gas and solid-gas interfaces are contained [14]. This angle is defined for horizontal, flat, and smooth surfaces, while if the surface does not fit in these requirements, different contact angle models are necessary [15]. For example, in order to predict the equilibrium contact angle of a drop which fully penetrates the asperities of a rough surface the Wenzel model is used [16], while the Cassie-Baxter model [17] is exploited for predicting the static contact angle of a drop when some air remains trapped between the drop and the asperities of the surface.
In order to evaluate the static contact angle, flat rectangular surface samples (with dimensions of few millimeters per side) were placed on suitable sample holders and prepared through a careful cleaning with alcohol, rinsing with distilled water, and complete drying. The samples were located on an anti-vibrating optical bench (Newport, S A Series, 1.2 × 0.80 m ) with a carrying structure in aluminium alloy. Then, distilled water drops with volumes in the range 4 12 μ L (to consider the dependence on the volume) were gently deposed on each sample. A high precision metering pump (Cole-Parmer Instrument Company, model A D 74900 ) completed by suitable syringes (Hamilton) allowed to supply drops of controlled volume. Immediately after deposition, pictures of the drops were taken by using a Nikon D 90 S R L digital camera equipped with a Nikkor 60 m m F 2.8 Micro lens. Back illumination was provided by a 800 W halogen lamp equipped with a suitable diffusing screen. Finally, the contact angles were evaluated through the ADSA technique, whose details are thoroughly described in [12,18].
In short, the ADSA technique is based on the numerical fitting of the theoretical drop profile to the contour of experimental drops. The first is obtained by numerical integration of the classic Laplace-Young equation of capillarity [19]. The second is nowadays obtained by image processing of pictures of the drop-surface system.
Different versions of ADSA were developed along the years. In this work, the tests were conducted using the ADSA-P (perimeter) technique [12]. According to this method an objective function, to be minimized, is defined as the sum of the squares of the distances between the theoretical and the experimental drop profile points.
The experimental drop profile is extracted by a side view of the drop-surface sample system, using conventional edge detection operators. The numerical integration to obtain the theoretical drop profile, given by the Laplace-Young equation of capillarity, is usually done-under the assumption of drop axi-symmetry—in the peculiar arc length-turning angle coordinate system, that makes it very simple. From the best fit, the contact angle can be determined as the value of the turning angle at the intersection between the drop profile and the surface profile. The strategy employed in this work is to perform ADSA in the dimensionless version developed by Rotenberg et al. [20], with inclusion of some of the improvements by Cheng et al. [21], namely to fit the shape of the experimental drop to the theoretical drop profile using the Eötvös number as the adjustable parameter. The advantage of this version is that the only needed input is a side photograph of the drop surface system [14].
Practically, the measurement of contact angle consists of the following steps:
  • Pre-processing of the images (e.g., cropping if needed).
  • Image segmentation.
  • Extraction and smoothing of drop profile.
  • Fitting of the Laplace-Young equation to the experimental boundary.
  • Determination of the contact angle.
An a priori error propagation and uncertainty analysis of the ADSA technique is almost impossible to perform, as too many aspects are involved, from light and camera positions to camera resolution and sensor aspect ratio, to software parameters and operator’s ability. However, the accuracy of the ADSA technique has already been validated many times in literature studies [12,21], and also specifically for the system used in this work by means of drops artificially generated by a calculator, with separate analysis of the effects of the parameters (including the ones of the software), and also on rendered drops, in order to replicate the problems of alignment and illumination [14]. Thus, the error made when using this technique results to be within 1.5 ° [18].
Figure 1 shows three example of sessile drops, one deposed on each of the investigated surfaces in horizontal orientation.

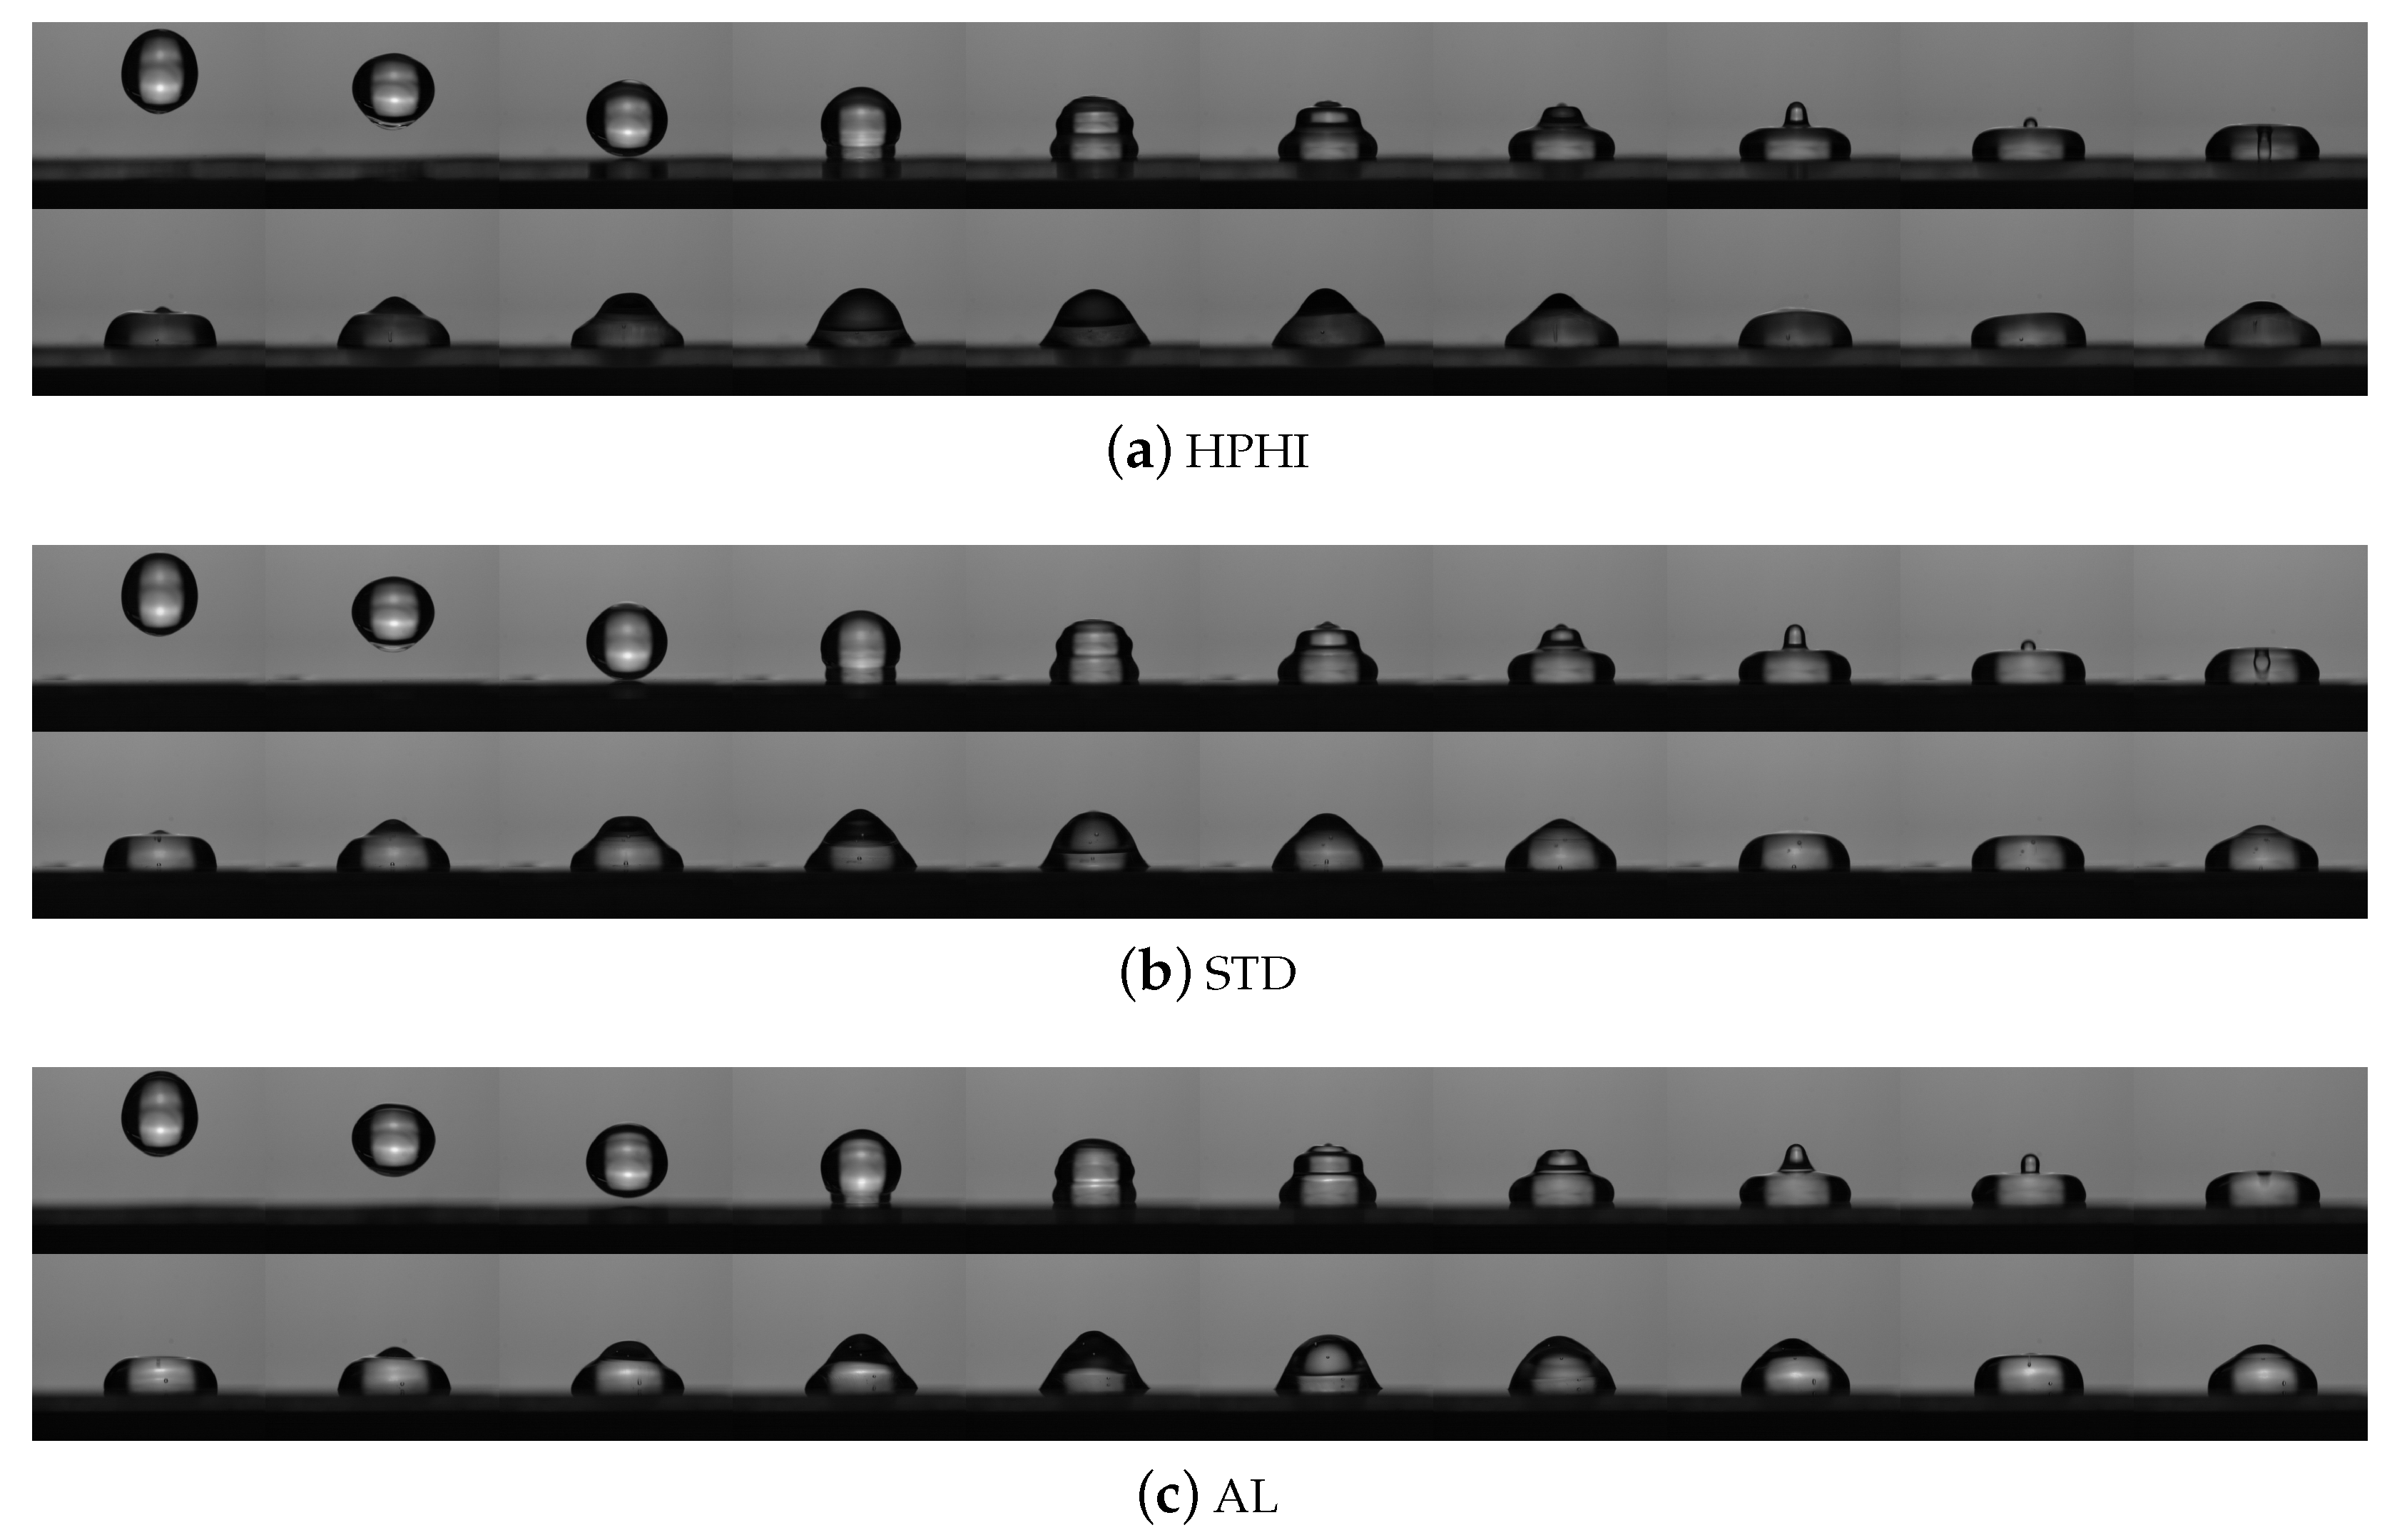
2.2. Evaluation of the Dynamic Contact Angles and Analysis of the Transient Behavior of the Drops

If a surface is not flat and horizontal, or if the drop is not gently deposed on the surface, it is not possible to evaluate the static or Young contact angle, so it is necessary to define the dynamic contact angles.
Focusing on the case of not gently deposed drops on a flat horizontal surface, it is possible to state that when a drop falls onto a surface, the contact angle changes with time, increasing and decreasing continuously until the drop reaches the equilibrium condition. In this scenario, two sets of dynamic contact angles can be defined: the advancing contact angles, θ a d v , which are the ones measured when the drop is spreading on the surface, and the receding contact angles, θ r e c , which are the ones measured when the drop is recoiling. The maximum and minimum values of these two sets are usually selected as the angles characterizing the dynamic behavior of the drop, and their difference θ a d v θ r e c is named contact angle hysteresis.
Dynamic angles can also be evaluated on sessile drops on vertical surfaces, even if the values obtained in this second way may differ from those obtained in the previous way.
For these reasons, the following step of the analysis was to evaluate the dynamic contact angles for the three investigated surfaces, both during drop impact and on vertical surfaces, and the transient behavior of these angles with time.
In order to perform the drop impact analysis, distilled water drops with the same range of volumes of the ones used for the static analysis were dropped from a fixed height on each of the three surfaces in horizontal orientation. Each sample was placed on sample holders and carefully cleaned as described in the previous section. The impact velocity was set to around 0.45 m s 1 . During the fall of each drop, a high-speed video of the side view of the drop-surface system was acquired, again using back illumination, through a Phantom Miro C 110 camera, equipped with the same Nikkor 60 m m F 2.8 Micro lens used for the static analysis. Then, the frames obtained from the acquired videos were processed to extract the drop contact angles. Further details about this procedure are described in [13].
Concerning the analysis of the dynamic contact angles on vertical surfaces, ten sessile distilled water drops (with the same volume range as before) were deposed on each of the investigated surfaces in vertical orientation, pictures of them were taken by using the same camera and lens of the static analysis, and their profiles were analyzed through image processing and polynomial interpolation (as the drops are no longer axisymmetric and ADSA cannot be used), in order to obtain the advancing and receding contact angles. The samples were again prepared as previously described.
Figure 2 shows three example of sessile drops, one deposed on each of the investigated surfaces in vertical orientation.

3. Results and Discussion

In this section, the results of the previously described analyses are presented and discussed.
As previously mentioned, three surfaces were analyzed: uncoated aluminum alloy (AL), standard epoxy coating (STD), and a hydrophilic lacquer (HPHI). From the results of previous studies [10], the HPHI surface should be the one with the lowest contact angles, so highest wettability, and best performance.

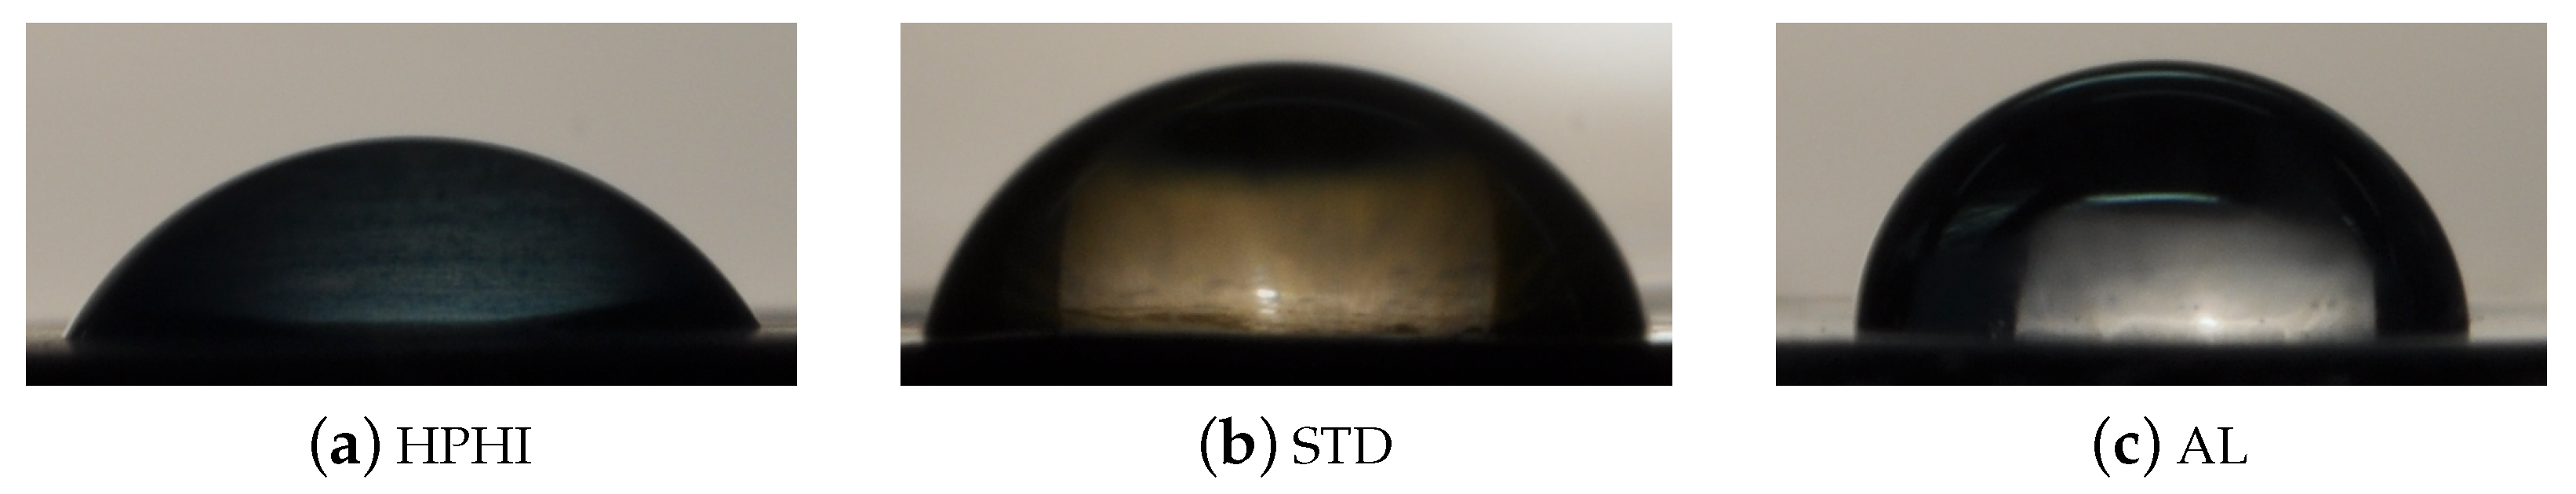
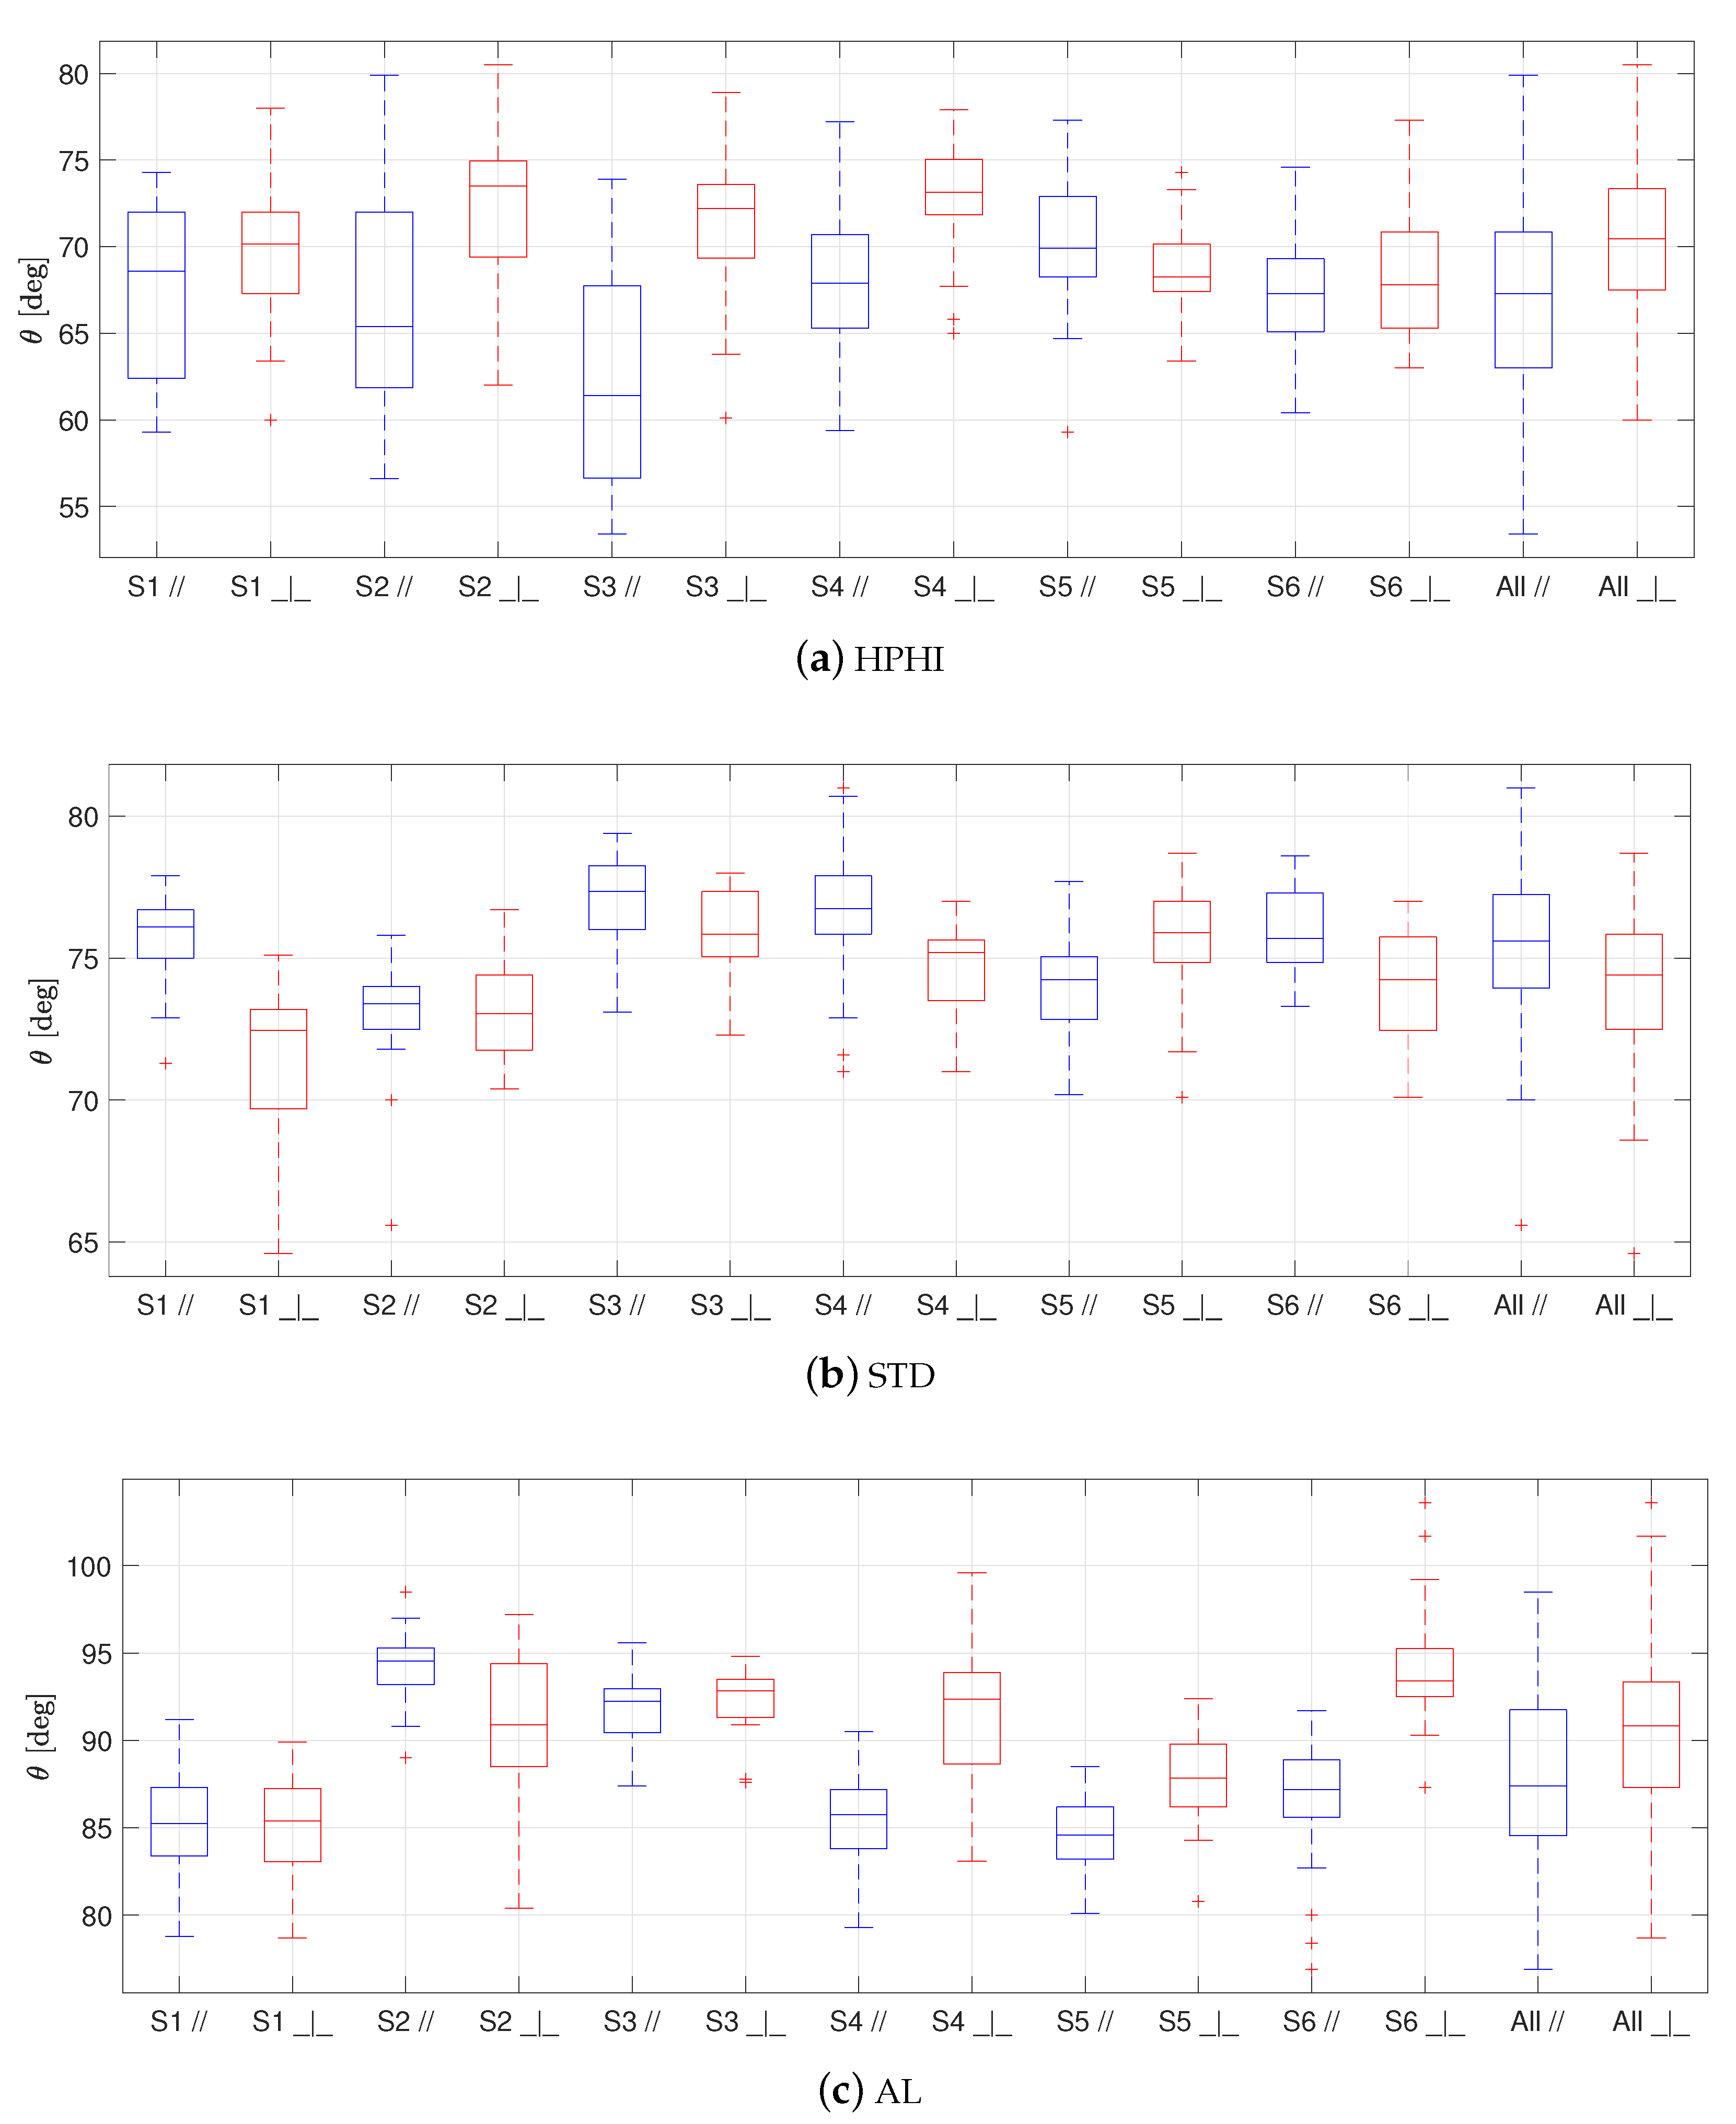
3.1. Static Contact Angle

Due to manufacturing, the investigated surfaces are not perfectly smooth; on the contrary, their texture includes micro-grooves dominantly oriented in one direction. Such grooves may alter the contact angle uniformity along the triple line, due to the “pinning on sharp edges” (Gibbs effect) phenomenon. Therefore, the static contact angle was evaluated by taking pictures in two directions: with the lens parallel to these grooves and with the lens perpendicular to them. The drop deformation was evaluated from top views of the drops themselves and it can be considered small enough to still allow the use of the ADSA technique. For each of the 3 surfaces, 6 different plate samples were considered. On each sample, 20 drops for each orientation were deposed, for a total of 720 drops (240 for each surface).
Figure 3 shows the results for the static contact angle on the six samples of each surface, HPHI in Figure 3a, STD in Figure 3b, AL in Figure 3c, when the grooves are parallel to the lens (in blue), and when they are perpendicular to the lens (in red).
As usual in boxplots, the box represents the interval between the first and third quartiles of the data distribution, with the central line corresponding to the median. The external whiskers represent the maximum and minimum values of the data distribution, excluding the outliers data. The latter, represented by red crosses in Figure 3, are the values outside the box which are at a distance from the first and third quartiles greater than 1.5 times the size of the box itself. This representation allows about 99 % coverage for normally distributed data.
From Figure 3, it is possible to notice that for all the surfaces there is a slight difference between the parallel and perpendicular orientations, and this difference strongly depends on the analyzed sample, so there is no “privileged” orientation.
Table 1 summarizes the overall results of the static contact angle analysis, in terms of average, median, and standard deviation values of the static contact angle for each of the three surfaces and for each of the two orientations, based on the “All” data of Figure 3a–c.
From this table, it is possible to notice that for all the surfaces, the difference between the parallel and perpendicular orientations in terms of average and median values is always less or at most equal to the corresponding standard deviation. Therefore, for subsequent analyses, the orientation of the grooves will be neglected for all the surfaces.
Figure 4 summarizes the overall results for the static contact angle, without considering the orientation of the grooves.
From this figure, it is possible to notice that the drops of the HPHI surface show the lowest static contact angle (global average: 69°, global median: 69°, global standard deviation: 5°), followed by the ones on the STD surface (global average: 75°, global median: 75°, global standard deviation: 3°), followed in turn by the ones on the AL surface, which shows the highest static contact angle (global average: 89°, global median: 89°, global standard deviation: 5°). These values are in good agreement with the results of previous analyses [10].
The evolution of the drop profile in time was also evaluated by taking pictures of the drops on each of the three surfaces every 20 s for 3 min , confirming that the drop evaporation follows the well-known “constant contact area, varying contact angle” behavior, that is typical on wettable surfaces [22,23]. Therefore, the information obtained about the static contact angle can be considered exhaustive and reliable.

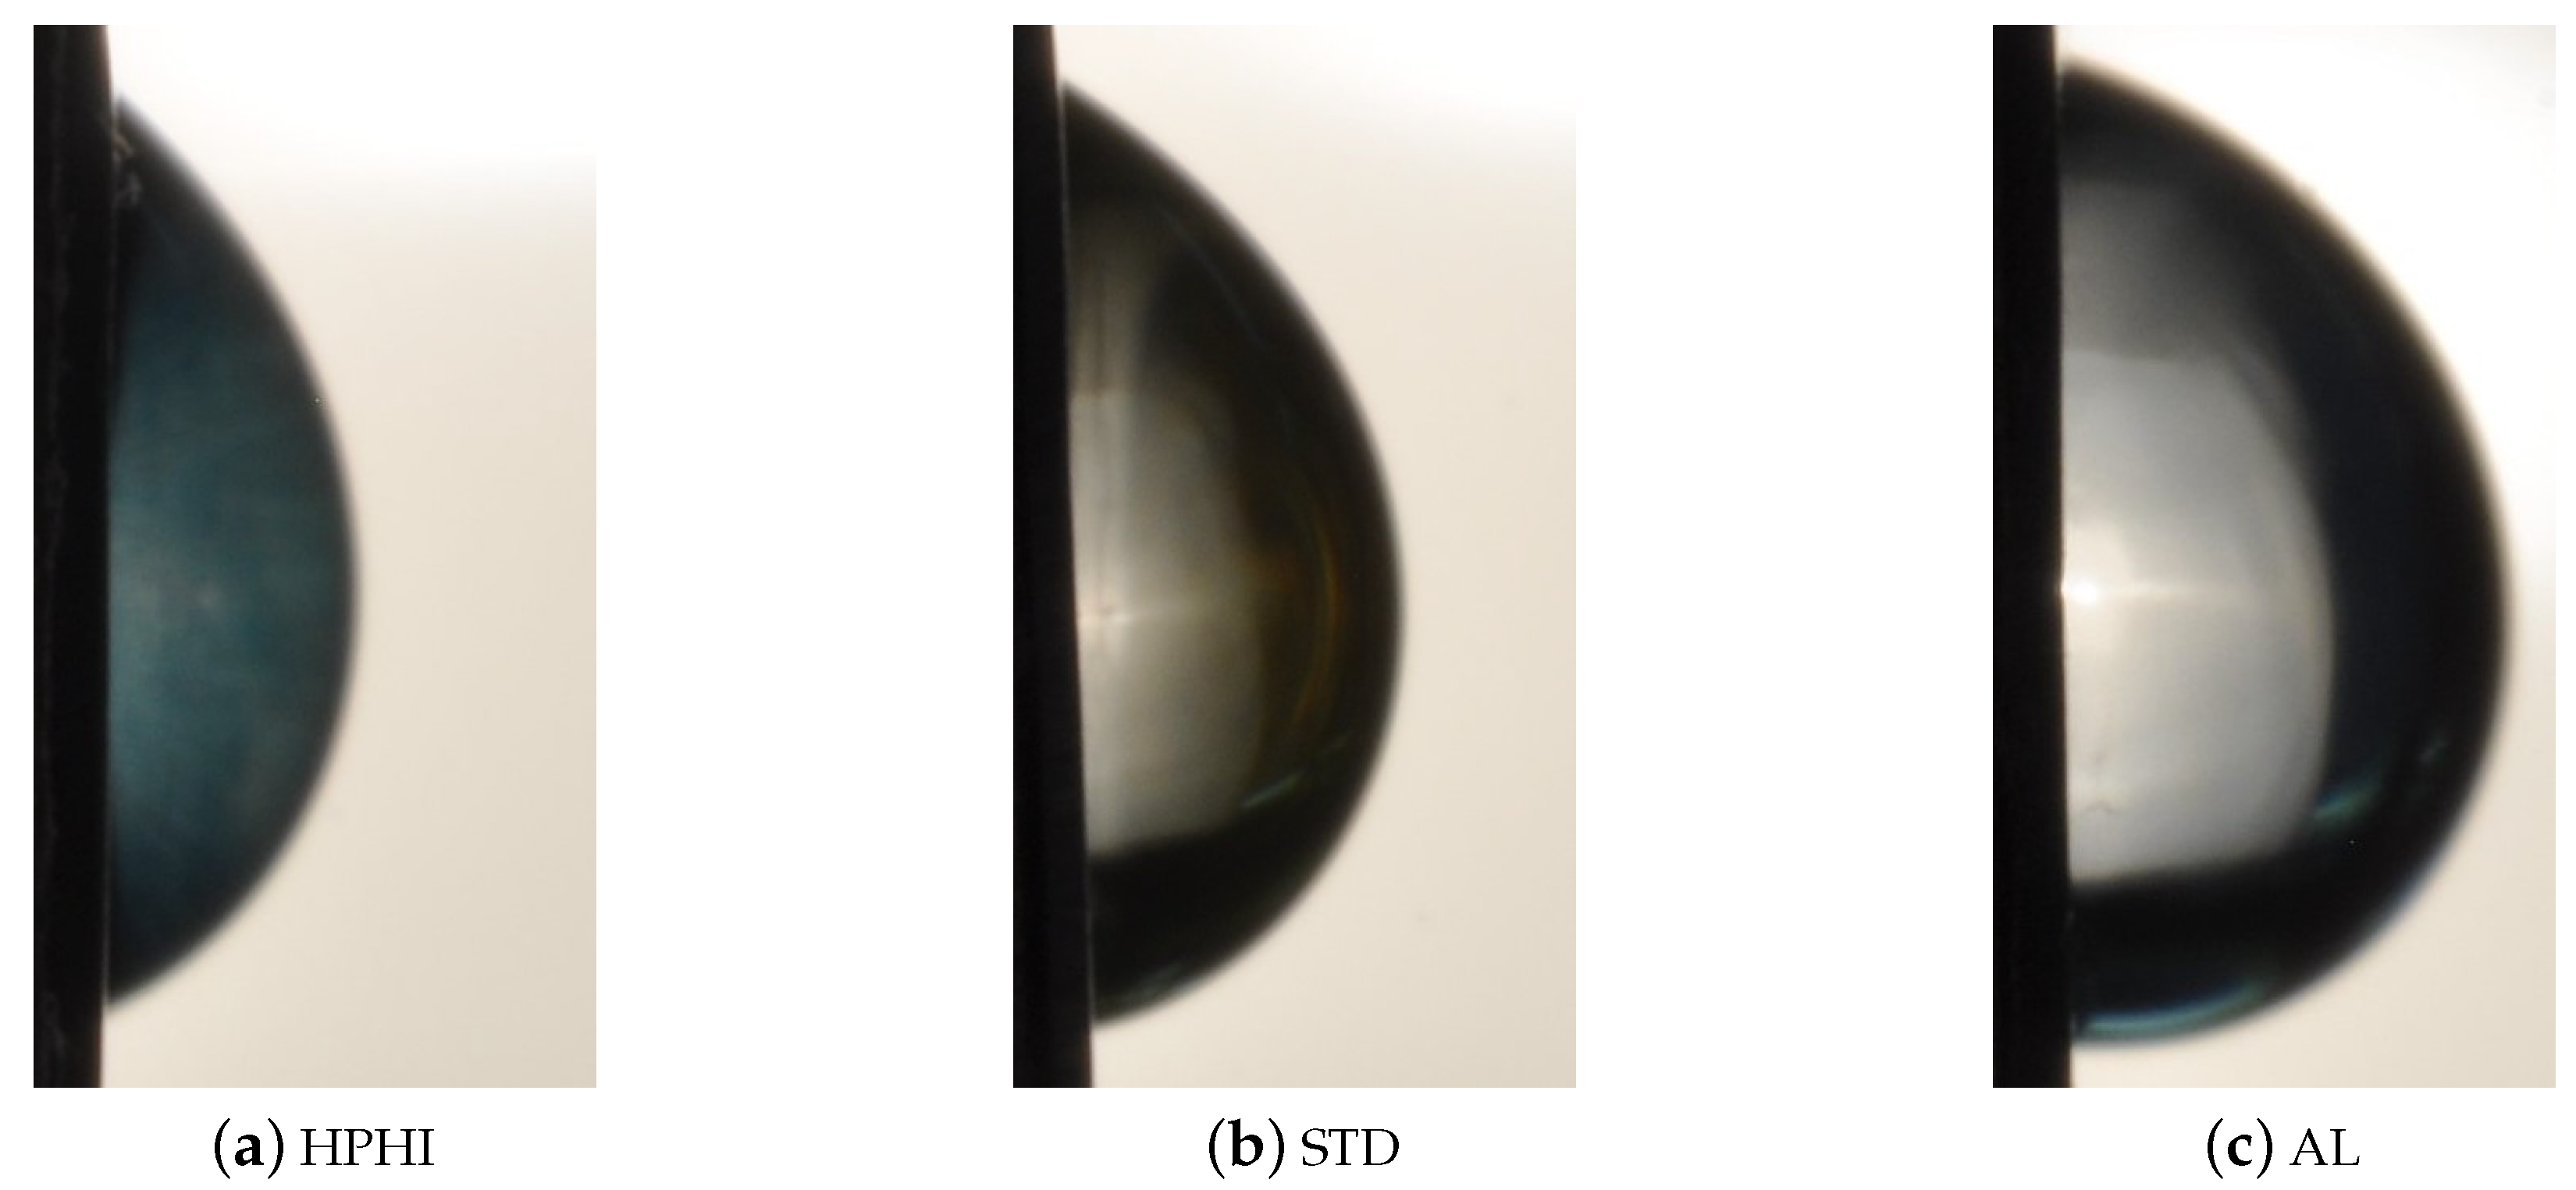
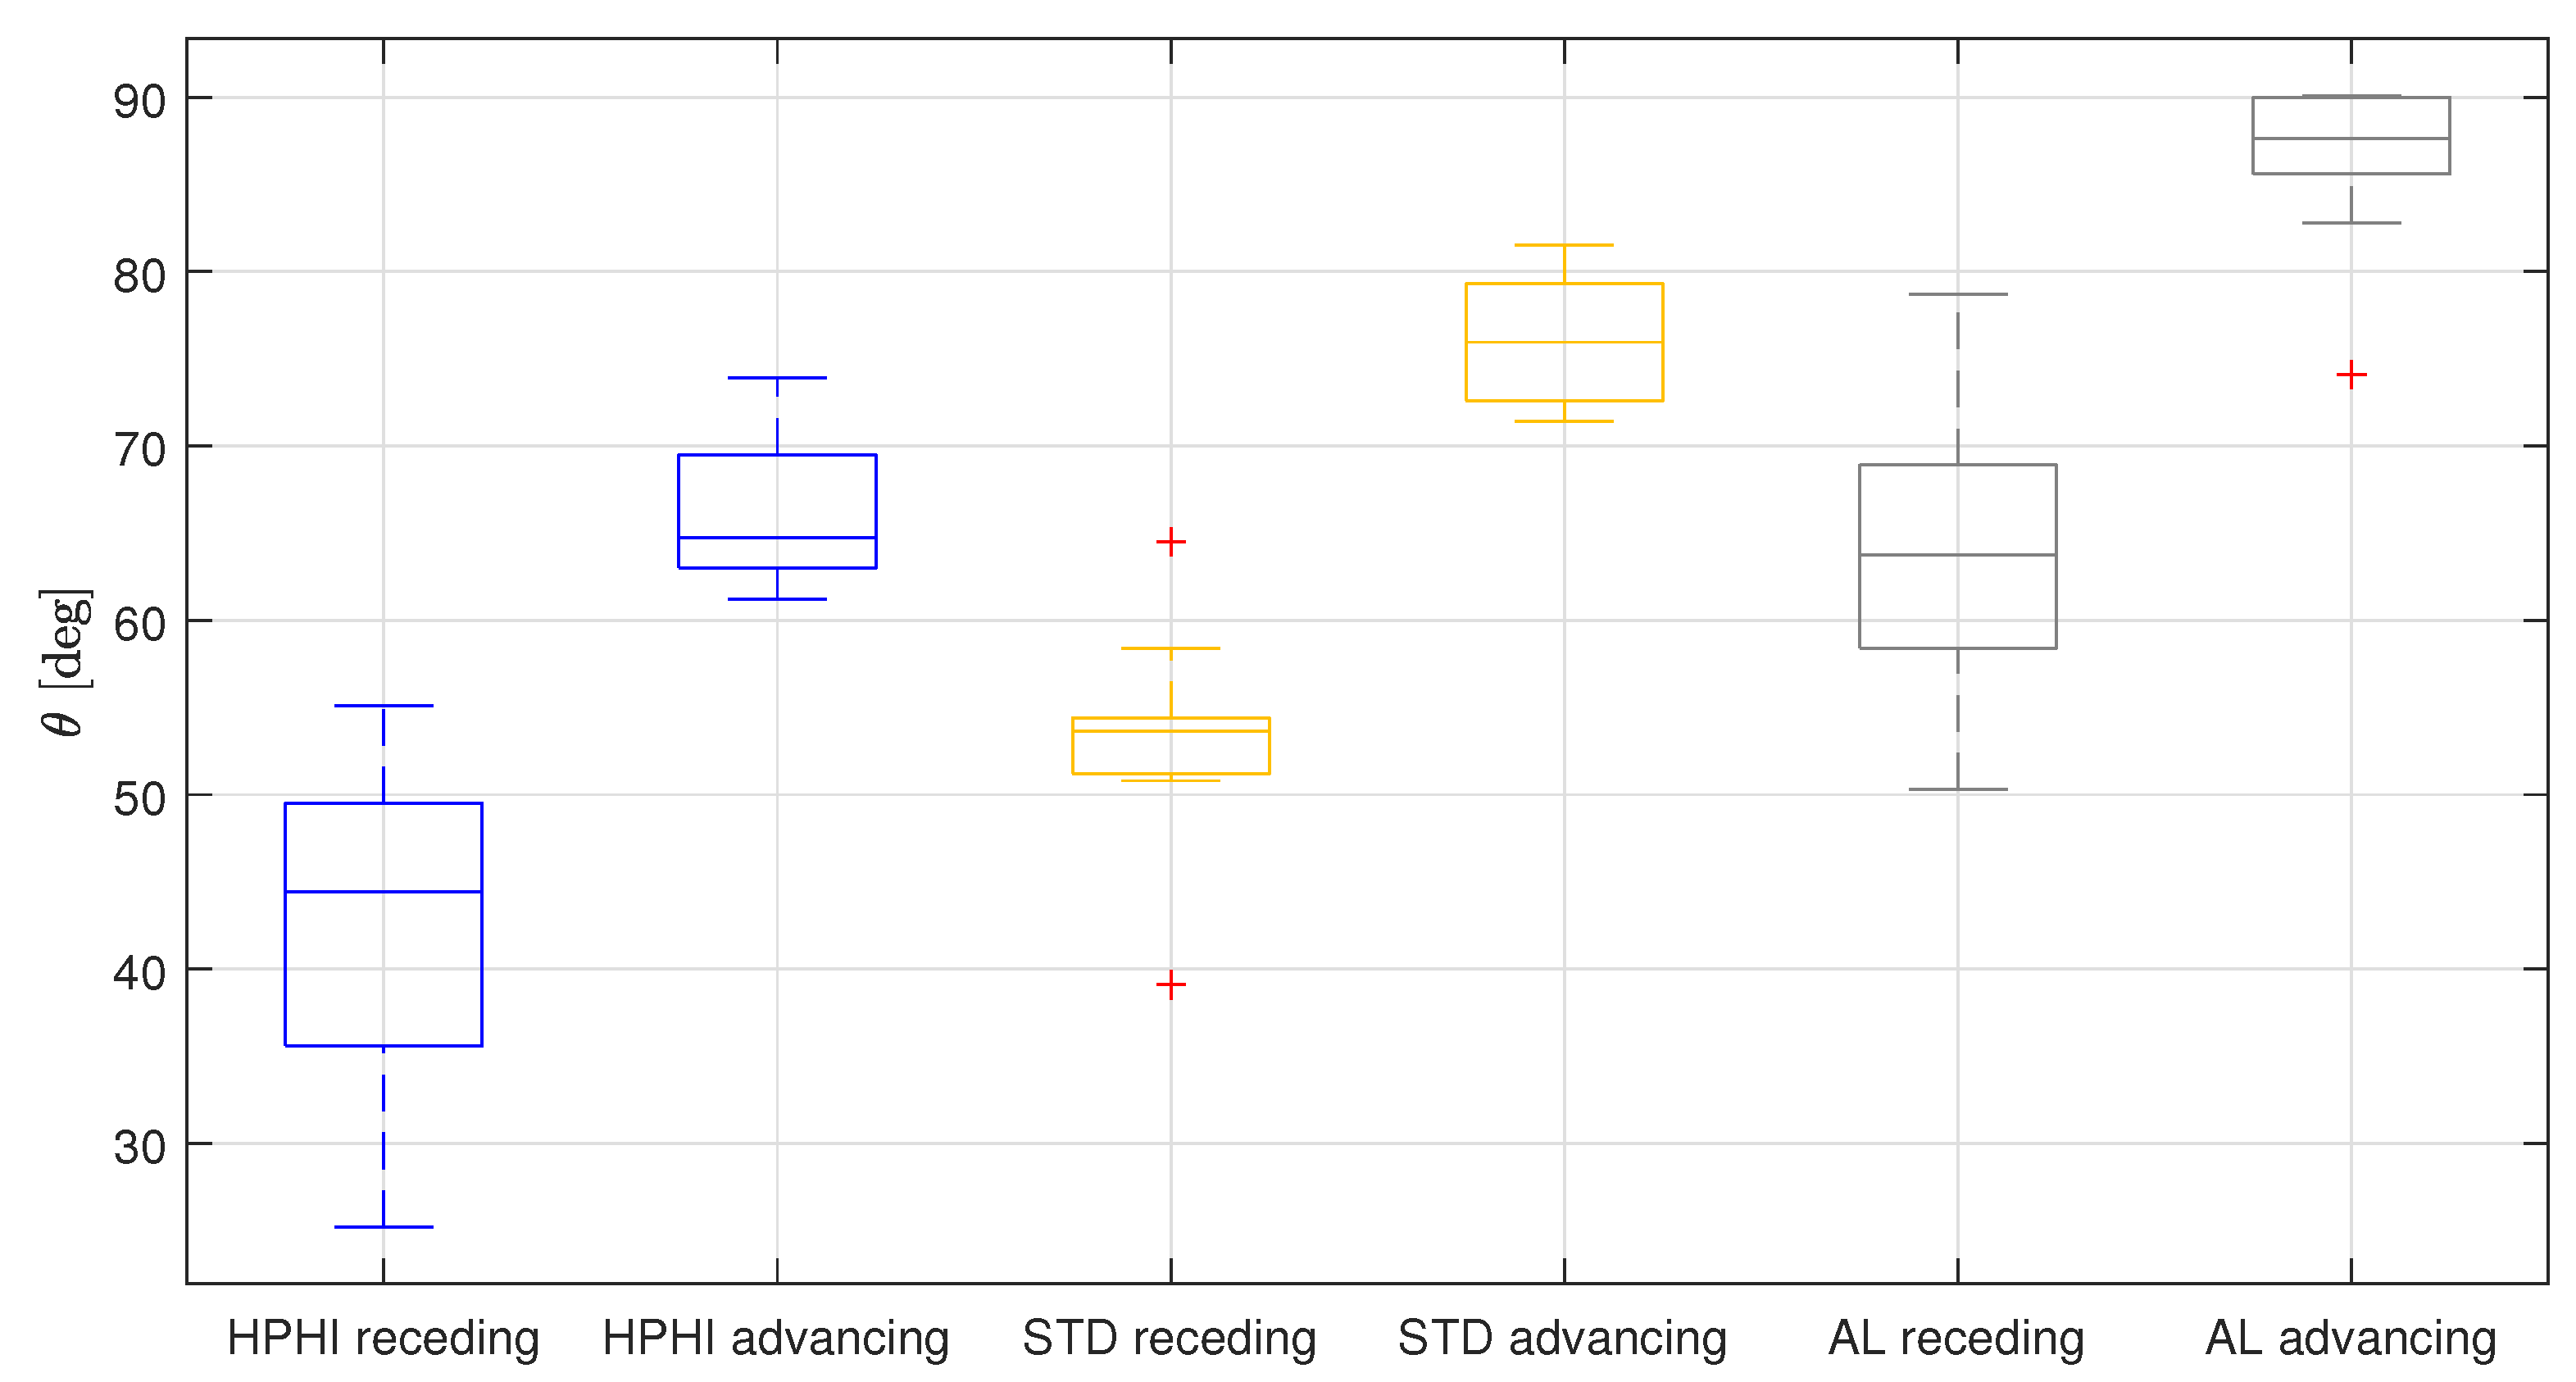
3.2. Dynamic Contact Angles and Transient Analysis

Figure 5 shows three sequences of frames obtained from the three high-speed videos of a drop falling on the HPHI surface, in Figure 5a, on the STD surface, in Figure 5b, and on the AL surface, in Figure 5c.
From this figure, it is possible to observe that the transient behavior of the drops falling on the three surfaces is almost the same, following the “usual” evolution for drop impacting surfaces with low-to-medium contact angles described in a large number of papers, e.g., [24,25,26]. Right after touching the surface, the drop takes on a particular shape, so that it seems to be divided into two or even three parts, and in this phase the contact angle is maximum (advancing contact angle). Then, the drop starts to recoil, and the contact angle decreases until reaching a minimum value (receding contact angle). After that, the contact angle increases and decreases continuously during drop oscillations (with contact angle hysteresis decreasing in time given the reduction of the liquid velocity, as expected), until reaching an equilibrium condition in which the contact angle is not changing anymore.
In Figure 6 it is possible to observe an example of the trend of the contact angle over time for the drops falling on the three surfaces: HPHI in blue, STD in yellow, and AL in grey.
The first information that can be extracted from this chart concerns the total time of the transient, which is less than 1 s for all cases.
For each surface, it is also indicated the contact angle reached at the end of the transient, which is 62° for the surface covered with the HPHI coating, 72° for the surface covered with the STD coating, and 79° for the AL surface with no coating. These results are in a quite good agreement with those obtained from the static contact angle measurements.
The difference among the three surfaces is evident also for the dynamic contact angles: the advancing contact angles, represented by the values of the peaks of the curves, and the receding contact angles, represented by the values of the valleys of the curves, are again the lowest for the HPHI surface, intermediate for the STD surface, and the highest for the AL surface, consistently with the previous results.
Additionally, when considering the concave hull of the local minima and maxima of the contact angle profiles in time, it can be extracted that the contact angle hysteresis at the beginning of the transient is relatively similar between the three surfaces (in the range 60 ° ± 3 ° ), then the reduction of the quantity shows a slightly different trend. Thus, the “ranking” of the surfaces in terms of contact angle hysteresis is the same as that according to the static contact angle.
As previously mentioned, in order to evaluate the dynamic contact angles on the vertical surfaces, ten sessile drops were deposed on each surface. The results of this analysis can be seen in Figure 7, which shows the advancing and receding contact angles that the drops form with each surface.
From this Figure, it is possible to notice that again the HPHI surface shows the lowest contact angles, while the contact angles on the STD surface are intermediate, and the ones on the AL surface are the highest.
Table 2 summarizes the results of the dynamic contact angle analysis obtained from sessile drops deposed on vertical surfaces, again in terms of average, median, and standard deviation.
To further assess the reliability of the obtained results, the relations between the equilibrium and dynamic contact angles were also compared with the predictions of the model by Tadmor [27], that allows to estimate the equilibrium contact angle from the dynamic ones. This model was selected among those available in literature as it combines simplicity and theoretical background. According to Tadmor’s model, the static contact angle can be estimated as:
θ = arccos Γ a d v cos θ a d v + Γ r e c cos θ r e c Γ a d v + Γ r e c
where:
Γ a d v = sin 3 θ a d v 2 3 cos θ a d v + cos 3 θ a d v 1 3
and
Γ r e c = sin 3 θ r e c 2 3 cos θ r e c + cos 3 θ r e c 1 3
When considering the dynamic angles evaluated on the vertical surfaces, the difference between the equilibrium contact angle predicted by the model and the experimental one was between 9° and 12°. On the contrary, when using the dynamic angles from the high-speed videos, the prediction was quite satisfactory for STD, with an error of 5°, while it was consistent with the results obtained with the vertical surfaces for HPHI and AL, with an error of 11° and 9°, respectively. Thus, the obtained results can be considered quite satisfactory.

3.3. Correlation of the Wettability Results with IEC System Performance

The performance of IEC systems using plates with the HPHI and STD coating has been previously studied [10], showing that the cooling capacity of the system using the plates with the HPHI coating, evaluated in terms of wet bulb effectiveness and fraction of evaporated water, are always better than the performance of the system using plates with the STD coating. These results suggest that there is a positive correlation between the wettability of the coating and the performance of the IEC system, namely that a system using plates with high wettability shows better performance than a system using plates with low wettability.
The results from the present work, also including the uncoated AL surface, will be the basis to improve the existing models aimed at predicting the behavior of IEC systems. In particular, the obtained wettability values will be included both in simplified models (e.g., by means of the spreading parameter), and in multiphase numerical simulations of the IEC systems, in order to properly set the boundary conditions on the plates enclosing the device channels in the virtual domain.
Furthermore, it will be necessary to study what happens to the wettability of the plates when the surfaces are not clean, but there is some fouling, e.g., due to limescale, as it is in IEC real operative conditions.

4. Conclusions

In this work, the static contact angle and dynamic contact angles that a drop forms with three different surfaces used for IEC systems plates have been analyzed.
Firstly, the static contact angle has been measured for 240 drops on each surface, and the result showed that the static contact angle is the lowest (average value: 69°) for the surface covered with the hydrophilic lacquer (HPHI), it is intermediate (average value: 75°) for the surface covered with the standard epoxy coating (STD), and it is the highest (average value: 89°) for the uncoated surface (AL). The obtained results regarding the HPHI and STD surfaces are in good agreement with the results of a previous experimental campaign [10].
Secondly, the dynamic contact angles (advancing and receding) have been studied for sessile drops deposed on the three surfaces in vertical orientation and for drops falling on the three surfaces in horizontal orientation. This last analysis was also useful to evaluate the transient behavior of the drops. The results showed that the transient behavior is similar for all the surfaces, with the classic oscillating behavior of drops impacting onto non-superhydrophobic surfaces. The values of the contact angles reached at the end of the transient are consistent with the results of the static analysis, as the advancing and receding contact angles. In particular, the dynamic contact angles were used to predict the corresponding static contact angles by using the model of Tadmor [27], and the predictions can be considered quite satisfactory.
In conclusion, the wettability of three surfaces belonging to IEC systems plates was fully characterized, thus the results obtained in this study will be of use to extend the correlation between plates wettability and IEC system performance parameters that was observed in previous works, and to provide input values for both simplified and computational fluid dynamics models.

Author Contributions

Conceptualization, R.C., S.D.A., L.M., P.L. and M.G.; methodology, R.C. and M.G.; resources, P.L. and M.G.; software, R.C. and M.G.; investigation, R.C. and M.G.; formal analysis, R.C. and M.G.; validation, all authors; writing—original draft preparation, R.C.; writing—review & Editing, all authors; visualization, R.C. All authors have read and agreed to the published version of the manuscript.

Funding

This research received no external funding.

Data Availability Statement

Data are available from the authors upon reasonable request.

Conflicts of Interest

The three surfaces used for IEC systems plates, namely HPHI, STD, and AL, have been supplied by Recuperator S.p.A.

Abbreviations

The following abbreviations are used in this manuscript:
ADSAAxisymmetric Drop Shape Analysis
ALAluminum uncoated surface
HPHIAluminum surface coated with a hydrophilic lacquer
IECIndirect Evaporative Cooling
STDAluminum surface covered with a standard epoxy coating
VVolume
degDegrees
fps Frames per second
s Seconds
tTime
θ Static contact angle
θ a d v Advancing contact angle
θ r e c Receding contact angle
Γ a d v Advancing coefficient used in Tadmor model
Γ r e c Receding coefficient used in Tadmor model

References

  1. Sajjad, U.; Abbas, N.; Hamid, K.; Abbas, S.; Hussain, I.; Ammar, S.M.; Sultan, M.; Ali, H.M.; Hussain, M.; Wang, C.C.; et al. A review of recent advances in indirect evaporative cooling technology. Int. Commun. Heat Mass Transf. 2021, 122, 105140. [Google Scholar] [CrossRef]
  2. Yang, H.; Shi, W.; Chen, Y.; Min, Y. Research development of indirect evaporative cooling technology: An updated review. Renew. Sustain. Energy Rev. 2021, 145, 111082. [Google Scholar] [CrossRef]
  3. Duan, Z.; Zhan, C.; Zhang, X.; Mustafa, M.; Zhao, X.; Alimohammadisagvand, B.; Hasan, A. Indirect evaporative cooling: Past, present and future potentials. Renew. Sustain. Energy Rev. 2012, 16, 6823–6850. [Google Scholar] [CrossRef]
  4. Alonso, J.S.J.; Martinez, F.R.; Gomez, E.V.; Plasencia, M.A.G. Simulation model of an indirect evaporative cooler. Energy Build. 1998, 29, 23–27. [Google Scholar] [CrossRef]
  5. Chen, Y.; Luo, Y.; Yang, H. A simplified analytical model for indirect evaporative cooling considering condensation from fresh air: Development and application. Energy Build. 2015, 108, 387–400. [Google Scholar] [CrossRef]
  6. Heidarinejad, G.; Moshari, S. Novel modeling of an indirect evaporative cooling system with cross-flow configuration. Energy Build. 2015, 92, 351–362. [Google Scholar] [CrossRef]
  7. De Antonellis, S.; Joppolo, C.M.; Liberati, P.; Milani, S.; Romano, F. Modeling and experimental study of an indirect evaporative cooler. Energy Build. 2017, 142, 147–157. [Google Scholar] [CrossRef]
  8. Adam, A.; Han, D.; He, W.; Chen, J. Numerical analysis of cross-flow plate type indirect evaporative cooler: Modeling and parametric analysis. Appl. Therm. Eng. 2021, 185, 116379. [Google Scholar] [CrossRef]
  9. Chua, K.; Xu, J.; Cui, X.; Ng, K.; Islam, M. Numerical heat and mass transfer analysis of a cross-flow indirect evaporative cooler with plates and flat tubes. Heat Mass Transf. 2016, 52, 1765–1777. [Google Scholar] [CrossRef]
  10. Guilizzoni, M.; Milani, S.; Liberati, P.; De Antonellis, S. Effect of plates coating on performance of an indirect evaporative cooling system. Int. J. Refrig. 2019, 104, 367–375. [Google Scholar] [CrossRef]
  11. Zhao, X.; Liu, S.; Riffat, S.B. Comparative study of heat and mass exchanging materials for indirect evaporative cooling systems. Build. Environ. 2008, 43, 1902–1911. [Google Scholar] [CrossRef]
  12. Del Rıo, O.; Neumann, A. Axisymmetric drop shape analysis: Computational methods for the measurement of interfacial properties from the shape and dimensions of pendant and sessile drops. J. Colloid Interface Sci. 1997, 196, 136–147. [Google Scholar]
  13. Guilizzoni, M.; De Antonellis, S. Wettability analysis of desiccant beads for HVAC systems. J. Phys. Conf. Ser. 2019, 1249, 012005. [Google Scholar] [CrossRef]
  14. Guilizzoni, M.; Sapienza, J. Axisymmetric Drop Shape Analysis using a low-cost home-made setup. J. Phys. Conf. Ser. 2021, 1977, 012003. [Google Scholar] [CrossRef]
  15. Santini, M.; Guilizzoni, M.; Fest-Santini, S.; Lorenzi, M. Characterization of highly hydrophobic textiles by means of X-ray microtomography, wettability analysis and drop impact. J. Phys. Conf. Ser. 2017, 923, 012013. [Google Scholar] [CrossRef] [Green Version]
  16. Wenzel, R.N. Resistance of solid surfaces to wetting by water. Ind. Eng. Chem. 1936, 28, 988–994. [Google Scholar] [CrossRef]
  17. Cassie, A.; Baxter, S. Wettability of porous surfaces. Trans. Faraday Soc. 1944, 40, 546–551. [Google Scholar] [CrossRef]
  18. Guilizzoni, M. Drop shape visualization and contact angle measurement on curved surfaces. J. Colloid Interface Sci. 2011, 364, 230–236. [Google Scholar] [CrossRef] [PubMed]
  19. Laplace, P. Traité de Mécanique Céleste; Supplement au Dixième; Livre, Surl’Action Capillaire, Courcier: Paris, France, 1806. [Google Scholar]
  20. Rotenberg, Y.; Boruvka, L.; Neumann, A. Determination of surface tension and contact angle from the shapes of axisymmetric fluid interfaces. J. Colloid Interface Sci. 1983, 93, 169–183. [Google Scholar] [CrossRef]
  21. Cheng, P.; Li, D.; Boruvka, L.; Rotenberg, Y.; Neumann, A. Automation of axisymmetric drop shape analysis for measurements of interfacial tensions and contact angles. Colloids Surf. 1990, 43, 151–167. [Google Scholar] [CrossRef]
  22. Birdi, K.; Vu, D. Wettability and the evaporation rates of fluids from solid surfaces. J. Adhes. Sci. Technol. 1993, 7, 485–493. [Google Scholar] [CrossRef]
  23. Erbil, H.Y.; McHale, G.; Newton, M. Drop evaporation on solid surfaces: Constant contact angle mode. Langmuir 2002, 18, 2636–2641. [Google Scholar] [CrossRef]
  24. Rein, M. Phenomena of liquid drop impact on solid and liquid surfaces. Fluid Dyn. Res. 1993, 12, 61–93. [Google Scholar] [CrossRef]
  25. Rioboo, R.; Tropea, C.; Marengo, M. Outcomes from a drop impact on solid surfaces. At. Sprays 2001, 11, 155–166. [Google Scholar] [CrossRef]
  26. Josserand, C.; Thoroddsen, S.T. Drop impact on a solid surface. Annu. Rev. Fluid Mech. 2016, 48, 365–391. [Google Scholar] [CrossRef] [Green Version]
  27. Tadmor, R. Line energy and the relation between advancing, receding, and young contact angles. Langmuir 2004, 20, 7659–7664. [Google Scholar] [CrossRef]
Figure 1. Examples of sessile drops on the three different surfaces investigated in horizontal orientation.
Fluids 08 00122 g001
Figure 2. Examples of sessile drops on the three different surfaces investigated in vertical orientation.
Fluids 08 00122 g002
Figure 3. Boxplot representing the static contact angles obtained for the six samples of each of the three surfaces ( S 1 , S 2 , S 3 , S 4 , S 5 , S 6 ), and the overall results (All), with the camera lens parallel to the grooves (in blue) and perpendicular to them (in red).
Fluids 08 00122 g003
Figure 4. Boxplot representing the overall static contact angles for each of the three surfaces: HPHI in blue, STD in yellow, AL in grey.
Fluids 08 00122 g004
Figure 5. Frames from the high-speed video (at 909 fps ) of a drop falling on each of the investigated surfaces.
Fluids 08 00122 g005
Figure 6. Transient behavior of the drops falling on the three surfaces: HPHI in blue, STD in yellow, AL in grey.
Fluids 08 00122 g006
Figure 7. Boxplot representing the dynamic (advancing and receding) contact angles obtained by deposing sessile drops on each of the three surfaces in vertical orientation: HPHI in blue, STD in yellow, AL in grey.
Fluids 08 00122 g007
Table 1. Summary of the results of the static contact angle analysis.
MaterialOrientationAverageMedianStandard Deviation
HPHIParallel67°67°
HPHIPerpendicular70°70°
STDParallel75°76°
STDPerpendicular74°74°
ALParallel88°87°
ALPerpendicular90°91°
Table 2. Summary of the results of the dynamic contact angle analysis obtained from sessile drops deposed on vertical surfaces.
MaterialDynamic Contact Angle TypeAverageMedianStandard Deviation
HPHIReceding42°44°
HPHIAdvancing66°65°
STDReceding53°54°
STDAdvancing76°75°
ALReceding64°64°
ALAdvancing86°88°
Disclaimer/Publisher’s Note: The statements, opinions and data contained in all publications are solely those of the individual author(s) and contributor(s) and not of MDPI and/or the editor(s). MDPI and/or the editor(s) disclaim responsibility for any injury to people or property resulting from any ideas, methods, instructions or products referred to in the content.

