1. Introduction
Droplet collision is an integral part of many natural and industrial processes, such as cloud formation [
1,
2], suspension aggregation [
3,
4], inkjet printing [
5,
6], etc. The major mechanisms of droplet aggregation in vapor are (1) classical Ostwald ripening that occurs via evaporation of fluid from smaller droplets and condensation at the surfaces of larger droplets (because the equilibrium pressure over small droplets is higher); this process is described by the Lifshitz–Slyozov theory [
7] and its various modifications [
8]; (2) the coalescence of droplets upon a physical contact induced by the capillary forces. The higher the equilibrium vapor pressure over the droplets, the faster the Ostwald ripening. The contact coalescence is usually controlled by the diffusion of droplets in the atmosphere of vapor (unless the droplets experience long-range forces, e.g., electrostatic repulsion between charged droplets). The overall kinetics of the contact-driven aggregation in droplet suspensions is routinely described by the Smoluchowski equation [
9], which (in the classical version) considers the relaxation of the coalescing droplets into one larger droplet as a very fast process in comparison with the droplet motion in the vapor atmosphere.
The dynamics of droplet coalescence upon contact have been examined in the literature, with most attention paid to collision-driven coalescence. Droplet collision could result in “shattering,” “stretching separation,” or “coalescence” [
10,
11,
12,
13,
14,
15,
16]. Shattering means that two droplets split into several smaller ones due to the mechanical impact; in the stretching separation, they temporarily unite only to separate shortly afterward. The published statistical analysis includes the dependence of the outcome probability on the relative velocity, surface tension, angle of impact, and other parameters. The process of droplet coalescence was mostly explored for pendant or sessile droplets, with the attention primarily focused on the progression of the liquid bridge, which forms as the droplets come into contact. Negative curvature of the bridge region causes the flow of the molecules from the bulk of the droplets towards the meniscus, leading to the gradual expansion of the bridge. The evolution of the meniscus in time was explored experimentally [
17,
18] and via various hydrodynamics simulations, including Lattice–Boltzmann [
19] and Smoothed Particle Hydrodynamics [
20]. Quantification of the bridge growth rate allows analysis of the internal flow, i.e., the interplay between the capillary and viscous forces. First estimations under the assumption of Stokes flow were made by Frenkel [
21] and then expanded by Hopper [
22], who provided an analytical solution for the coalescence of two viscous liquid cylinders. Later, Eggers et al. [
23] considered the coalescence of spherical droplets in 3D and argued that the Stokes regime was only valid for Reynolds numbers up to
, after which the flow transitioned to a regime dominated by inertial forces. If described in terms of the reduced bridge radius
, where
is the bridge radius and
is the initial droplet radius (parent droplets of equal sizes are assumed), then for the initial viscous regime
for
, where
. For larger
R, the flow transitions to the inertial regime, and the scaling becomes
with the time scale
. Here,
t is the time passed since the droplets came in contact,
is the dynamic viscosity,
is the surface tension, and
is the mass density. Although the scaling for the inertial regime was confirmed by both experiment [
18,
24] and simulations [
25], the logarithmic correction to the viscous scaling caused some discussions. For example, in an experimental study by Aarts et al. [
18], the viscous regime was found to be well described by a linear scaling
. This inconsistency was resolved by Paulsen et al. [
26], who proposed the existence of the inertia-limited viscous (ILV) asymptotic regime preceding the Hopper–Stokes regime. They argued that the viscous regime could not start until the surface tension forces were strong enough to initiate the translation of the droplets’ center of mass. Until then, the coalescence process is defined by viscous, inertial, and surface tension forces together. Recently, Xia et al. [
27] proposed a universality theory that combines the coalescence regimes described above, with ILV and inertial regimes being its two asymptotic approximations. Hence, we will refer to it as the “hydrodynamic regime” below.
Molecular simulations can help bypass some of the restrictions faced by empirical models and provide more physical details, as they do not require any assumptions about the nature of the system beyond the molecular interaction potential and can capture processes on scales that are out of reach of the current experimental methods. Recently, Perumanath et al. [
28] peeked into the initial stages of the coalescence process with MD simulations. While from the hydrodynamics standpoint, the moment of contact creates a singularity due to infinite surface curvature, MD allows inspecting this moment more carefully. The authors proposed that the contact between the two droplets is initiated by thermal fluctuations on their surfaces. As the droplets approach each other, the surface molecules in an area around the line of approach randomly start “jumping” across the gap due to thermal motion and proximity to the opposing surface. These “collective molecular jumps” constitute a new coalescence regime, which the authors call the “thermal regime,” preceding the hydrodynamic regime described above. This regime holds until the bridge radius grows to a certain threshold value
proportional to the width of the contact area on the surface, i.e., the area from which spontaneous molecular jumps can occur. MD is also used in the studies of more complicated cases of droplet collision, e.g., the collision of conducting droplets in an electric field [
29]. In this case, droplets deform into a conical shape as they approach each other due to the electrostatic force, and the outcome of the collision depends on the cone angle and the critical electrical field strength. Nanoparticles covered by an adsorbed liquid-like film also show a bridge formation and growth that results in an effective attraction between them, although they cannot coalesce [
30]. Another example is the recent study of the coalescence/sintering bifurcation phenomenon for nanoparticles [
31]. With the help of isothermal MD simulations, the authors discovered that the temperature of the transition from sintering to coalescence for Au nanoparticles is lower than the nanoparticle melting point. In the vicinity of that critical temperature, the child particle can have either a crystalline structure or a liquid-like structure at the same temperature.
In this research note, we explore the characteristic time of the coalescence of two nanodroplets once contact between them has been established. The coalescence time is determined as a function of the sizes of the parent droplets and the temperature. We examine the meniscus evolution and compare the coalescence timescale with the characteristic lifetime of a droplet in a dense suspension to check whether the finite coalescence time can influence the aggregation dynamics. The study aims at shedding light on the coalescence mechanism at spatial and temporal scales unavailable for experimental studies. In particular:
we explore the dependence of the characteristic coalescence time on the temperature and sizes of both droplets, which has not been explored in the experimental, simulation, and theoretical studies, as the literature review shows
by examining the bridge growth and coalescence time, we explore in detail the recently discovered “thermal scaling regime” of the contact coalescence, which cannot be experimentally observed for the small temporal and spatial scales
the characteristic coalescence times are for the first time compared with the characteristic lifetime of a droplet before it contacts another one in a suspension during the aggregation process; this comparison shows in what cases the finite coalescence times should be taken into account in the theoretical models and anticipates the studies of multiparticle collisions in the aggregation kinetics.
2. The Model and Simulation Details
The droplets are composed of Lennard–Jones (LJ) molecules. The LJ model is widely accepted for fluids with van der Waals interactions and quantitatively describes noble gases, nitrogen, and methane [
32,
33]. When working with the LJ potential, it is convenient to use the so-called reduced units, in which distances, masses, and energies are multiples of the parameters of the LJ potential
(the effective molecular diameter),
(the molecular mass), and
(the depth of the LJ potential, that is the minimum energy of interaction between two LJ particles), respectively. The density
is the number of LJ particles per volume equal to the cube of the effective diameter
, thus
in a simple cubic lattice, where the neighboring particles contact each other. All the values below are given in reduced units if not stated otherwise. The potential is cut and shifted at
. Critical properties for such system are
and
[
34,
35]. Three temperatures were considered:
, 0.70, and 0.75. The corresponding saturated vapor densities, pressures, and viscosities are shown in
Table 1. The rectangular simulation box has dimensions of
,
and
for the three temperatures, correspondingly. Periodic boundary conditions are applied to ensure constant volume and the number of LJ particles. Droplets are generated as spheres filled with LJ atoms arranged in face-centered cubic lattices and placed at a distance of
between their surfaces. This arrangement ensures that coalescence does not start right away, but rather the system equilibrates for a while, and droplets come in contact naturally by drifting towards each other due to the dispersion attraction. The moment of contact was determined using a clustering algorithm adopted from [
36]. Initial radii of droplets span from 6.0 to 12.0
and vary by 0.5
steps. In the initial configuration, the droplets are aligned along the
x-axis, and the left droplet is smaller or equal in size to the right one. In every particular simulation, the configuration is characterized by three parameters
, where
T is the system temperature,
is the radius of the smaller (left) droplet and
is the radius of the larger (right) droplet, e.g., (0.65, 7.0, 10.0) corresponds to a configuration of temperature 0.65 and initial droplet radii of 7.0 and 10.0
. Initial velocities of the molecules are randomly generated according to the temperature. One hundred simulations for each parameter set are performed to collect statistics. The necessity to conduct a large number of simulations to collect reasonable statistics prevents simulations of larger droplets due to computational expenses.
It should be noted that the vapor pressure (as well as the equilibrium density) depends on the droplet size, which means that the capillary coalescence and Ostwald ripening proceed concurrently. In the initial configuration, the two parts of the box are filled with LJ vapor in equilibrium with the droplet of particular radii (). That is, the density is different in the two halves of the box, and after the start, the vapor starts mixing, which leads to evaporation from the surface of the smaller droplet and condensation at the surface of the larger one. The resulting droplet is larger than the parent droplets, and, therefore, the saturated vapor has a lower density, which has to be taken into account in the calculation of the coalescence time.
The simulations are carried out with LAMMPS [
37,
38], and the temperature is maintained with the Nose thermostat [
39]. The simulation is gradually sped up: it is started by performing 30,000 timesteps of size 0.0001 in reduced units, then 30,000 timesteps of 0.001, and finally 45,000 timesteps of 0.01. For trajectories, the coordinates were stored every 1000 steps for the first two stages and every 250 steps for the last stage.
3. Results and Discussion
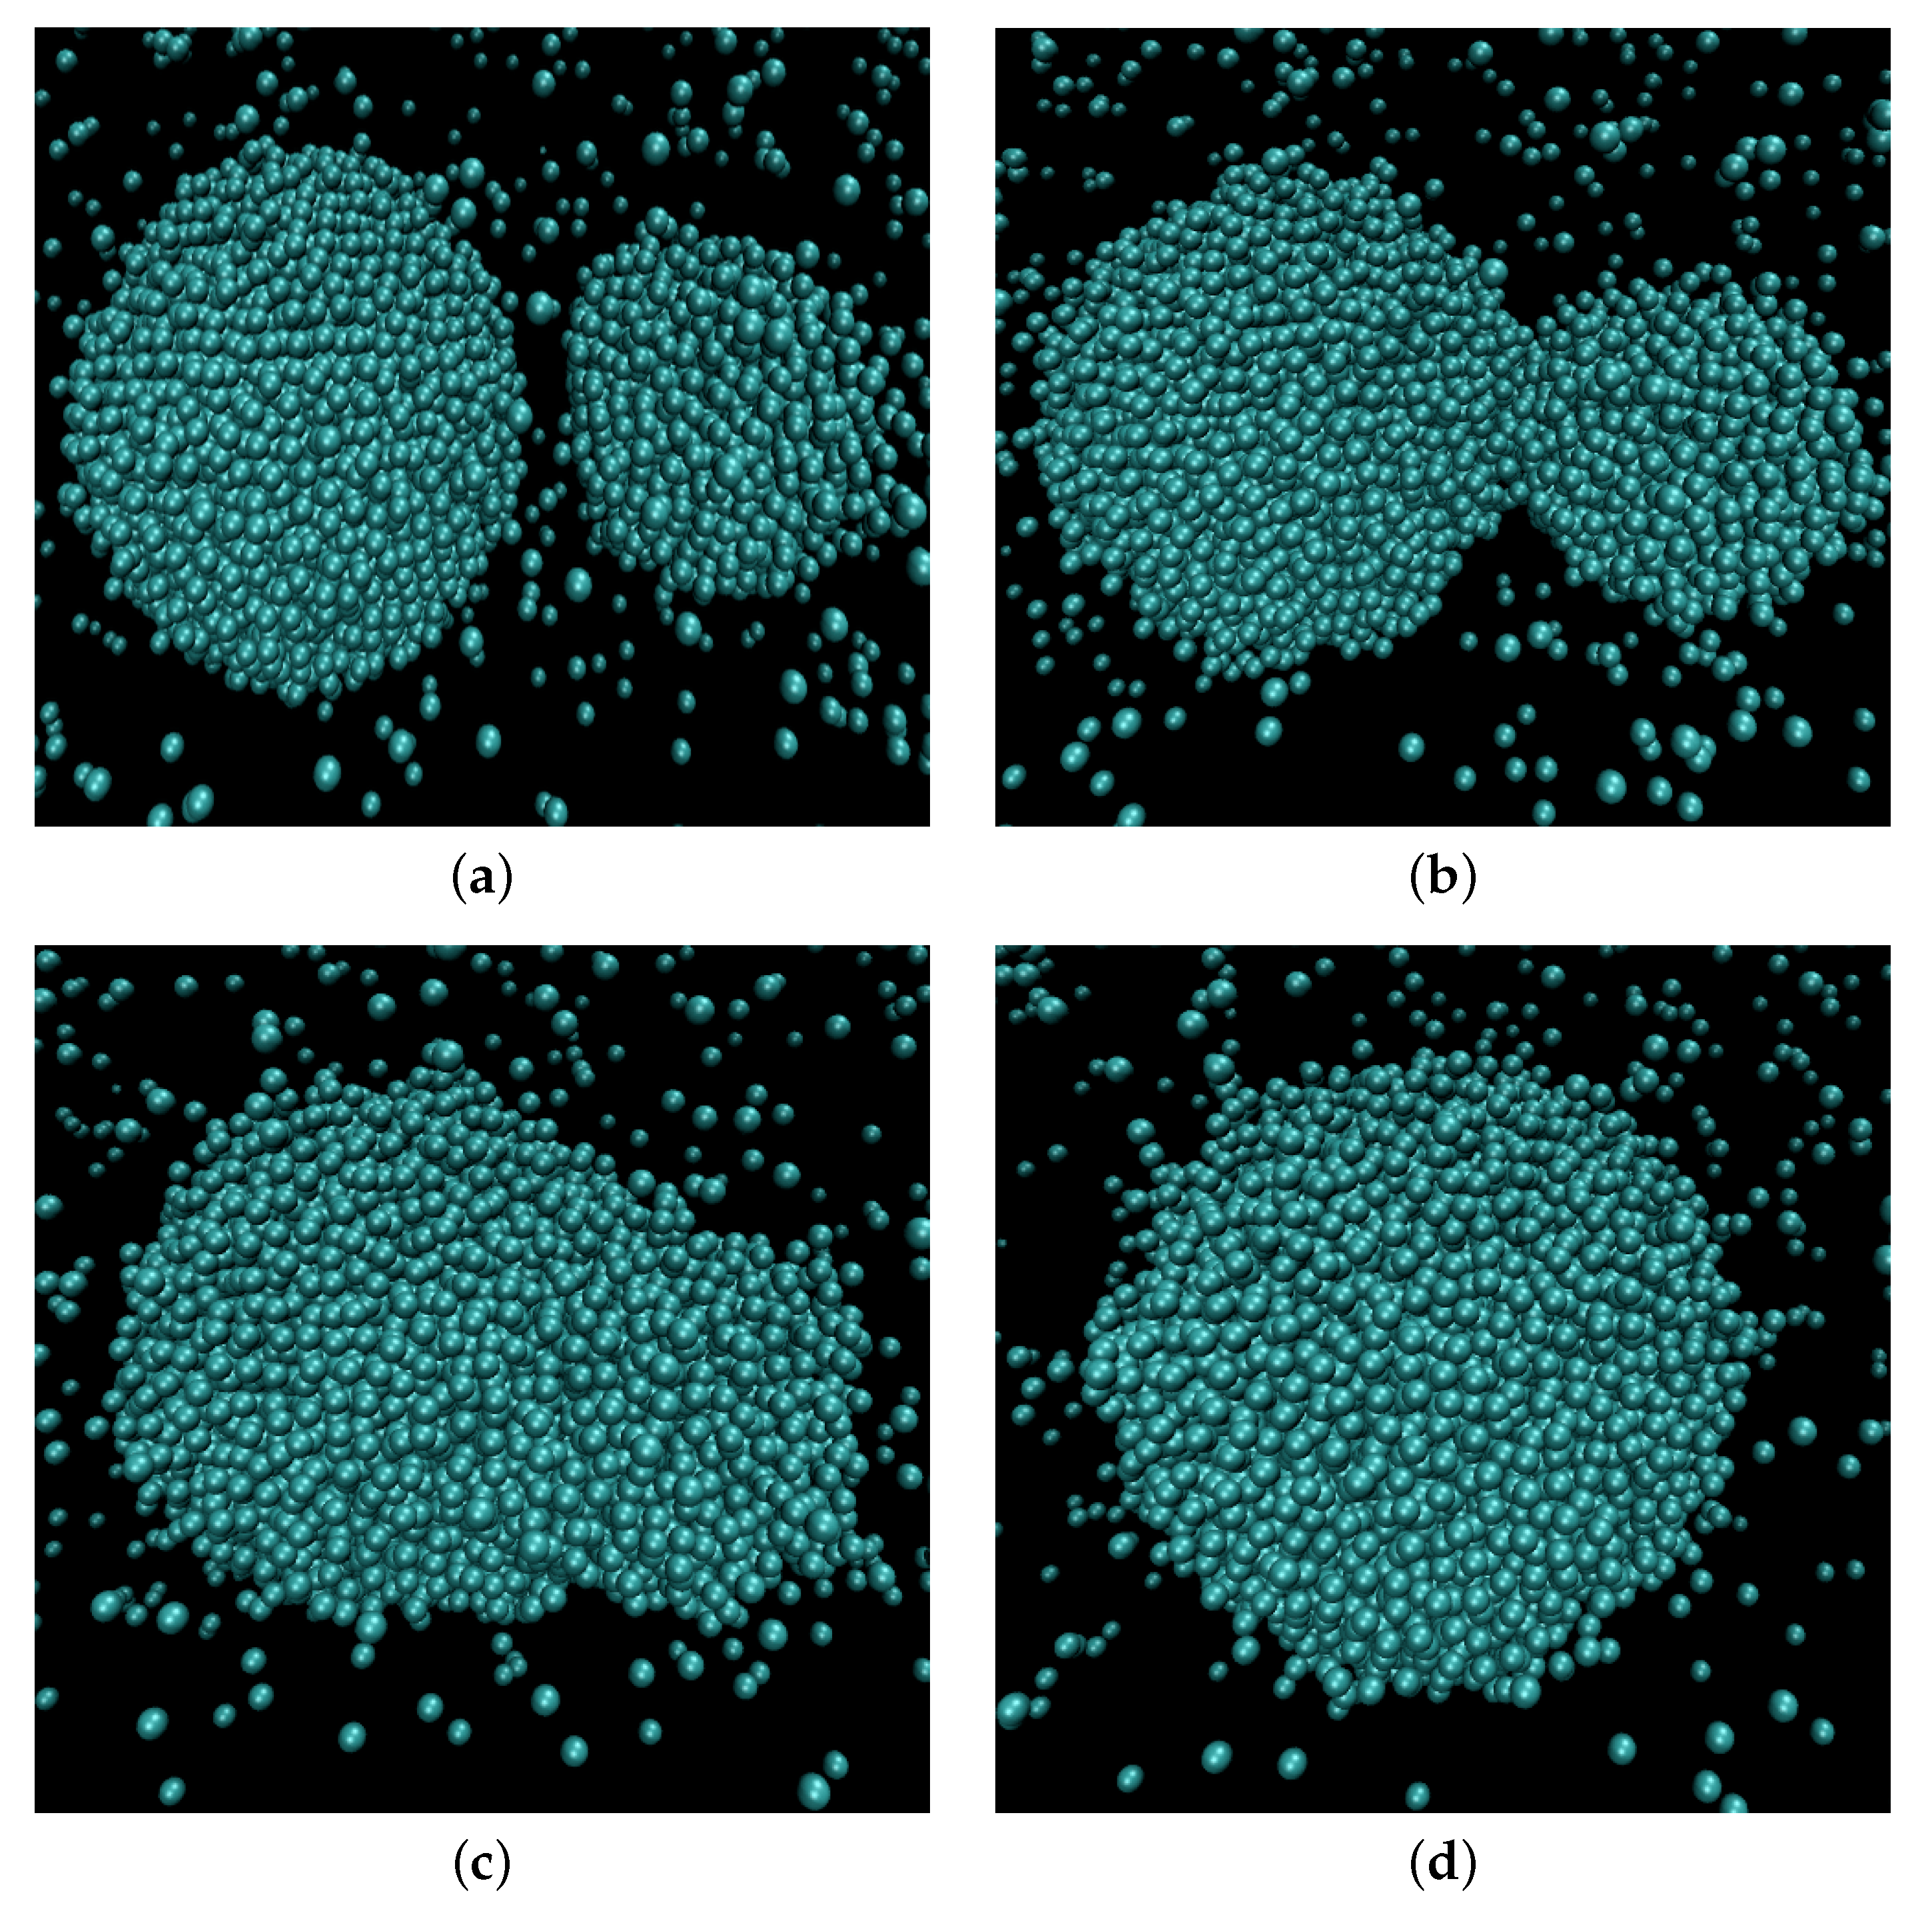
Figure 1 illustrates the coalescence process. The droplets attracted to each other by the van der Waals forces eventually establish contact. A bridge forms and grows around the point of contact until the parent droplets finally merge into a larger one. To follow the process, we apply a clusterization algorithm that assigns any two atoms located closer than
to each other to the same cluster. The frame when the algorithm detected only one large cluster is identified as the moment when the contact is established and, therefore, as the starting moment of the coalescence process (
). Correspondingly, the radius of gyration of the cluster is assumed as the main order parameter that describes the coalescence process. The characteristic coalescence time is estimated from its evolution, as described below. At the same time, we follow the dynamics of the liquid bridge growth characterized by the density profile built in two dimensions: tangential, i.e., along the line connecting the centers of mass of the merging droplets (identified as the axis with respect to which the cluster had the lowest radius of inertia at any given moment) and the radial one. The number density profiles are built in this coordinate system with the droplet domain divided into cylindrical slices of equal width of about
along the tangential direction. From the profile and the liquid density, the bridge radius is calculated.
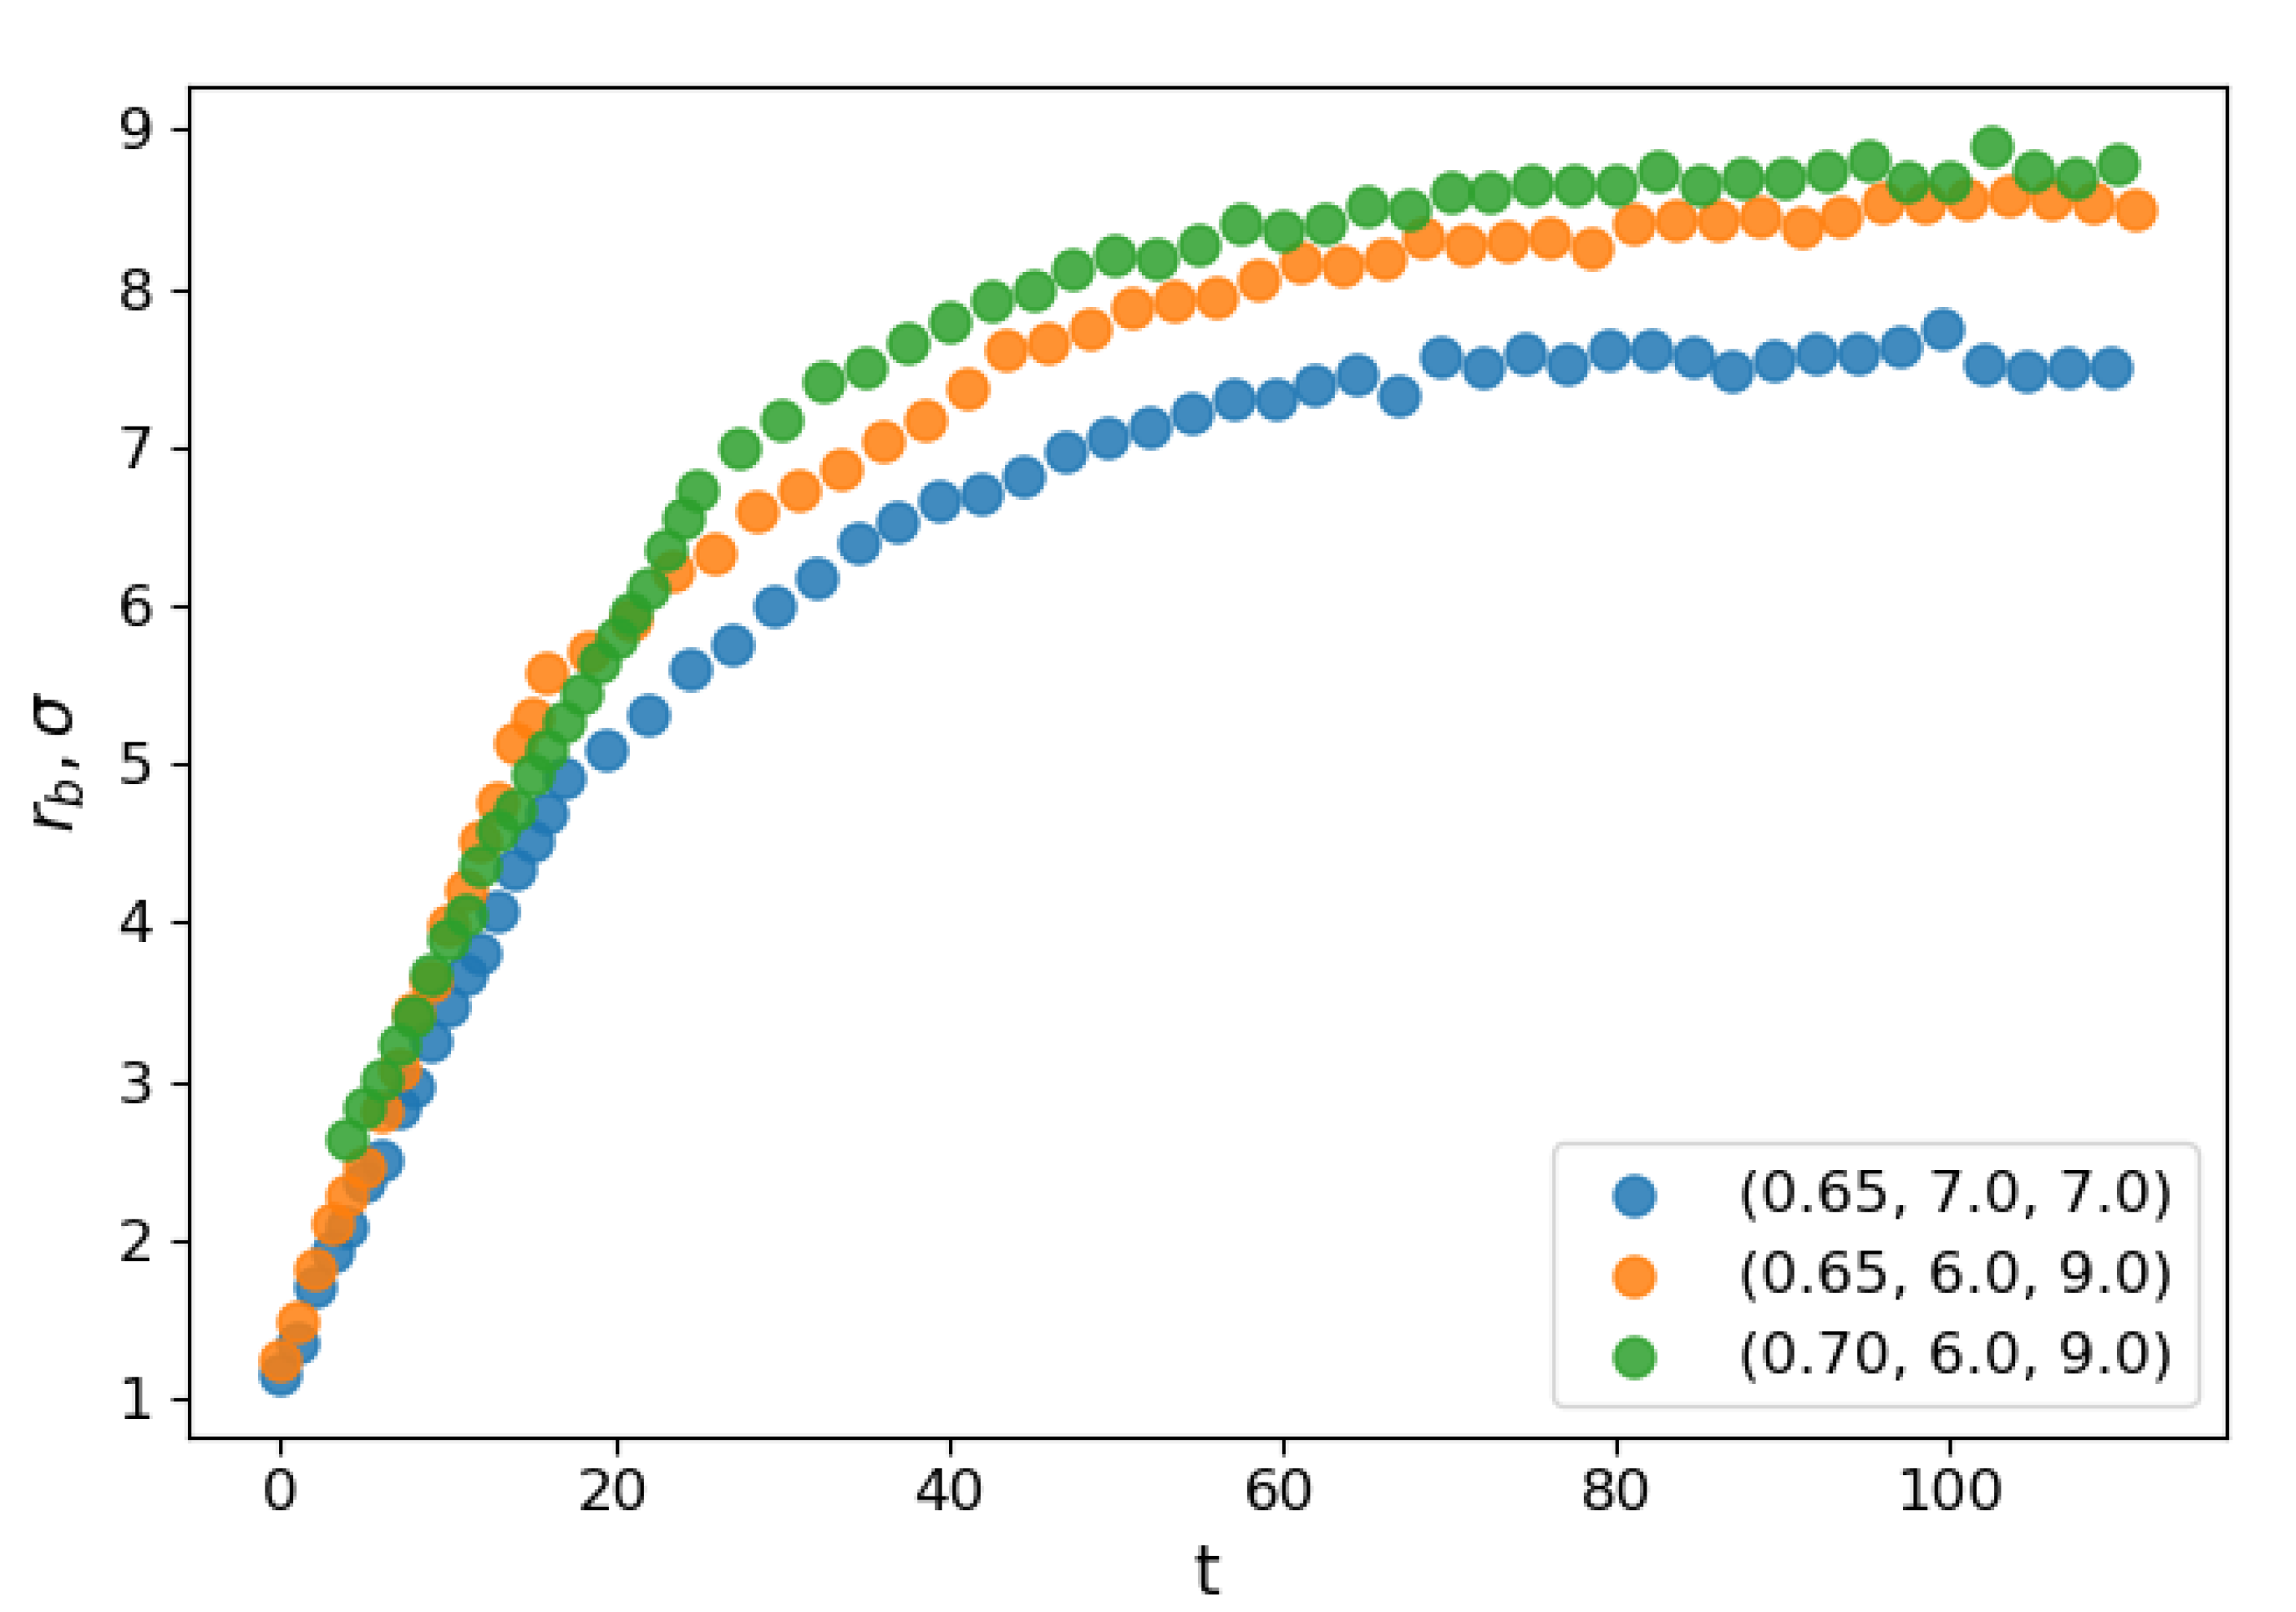
Figure 2 shows the dependence of the evolution of the average bridge radius on the time after the contact for select sets of parameters. At the starting moment of coalescence
, because the bridge consists of one molecule. The bridge radius grows approximately linearly with time, and then saturation is observed as the bridge radius becomes comparable to the droplet radius. The steep linear growth is consistent with the “collective molecular jumps” mechanism observed first by Perumanath et al. [
28]. Heinen et al. [
40] also observed a linear bridge growth in the initial stages of their MD simulations of droplet coalescence. The linear thermal regime then seemingly shifts to the less steep ILV regime and comes to a plateau shortly after. The dynamics of other scaling regimes are difficult to determine because the curve flattens too quickly. At higher temperatures, the thermal regime has a longer duration. However, the plateau value depends only on the radii of the coalescing droplets.
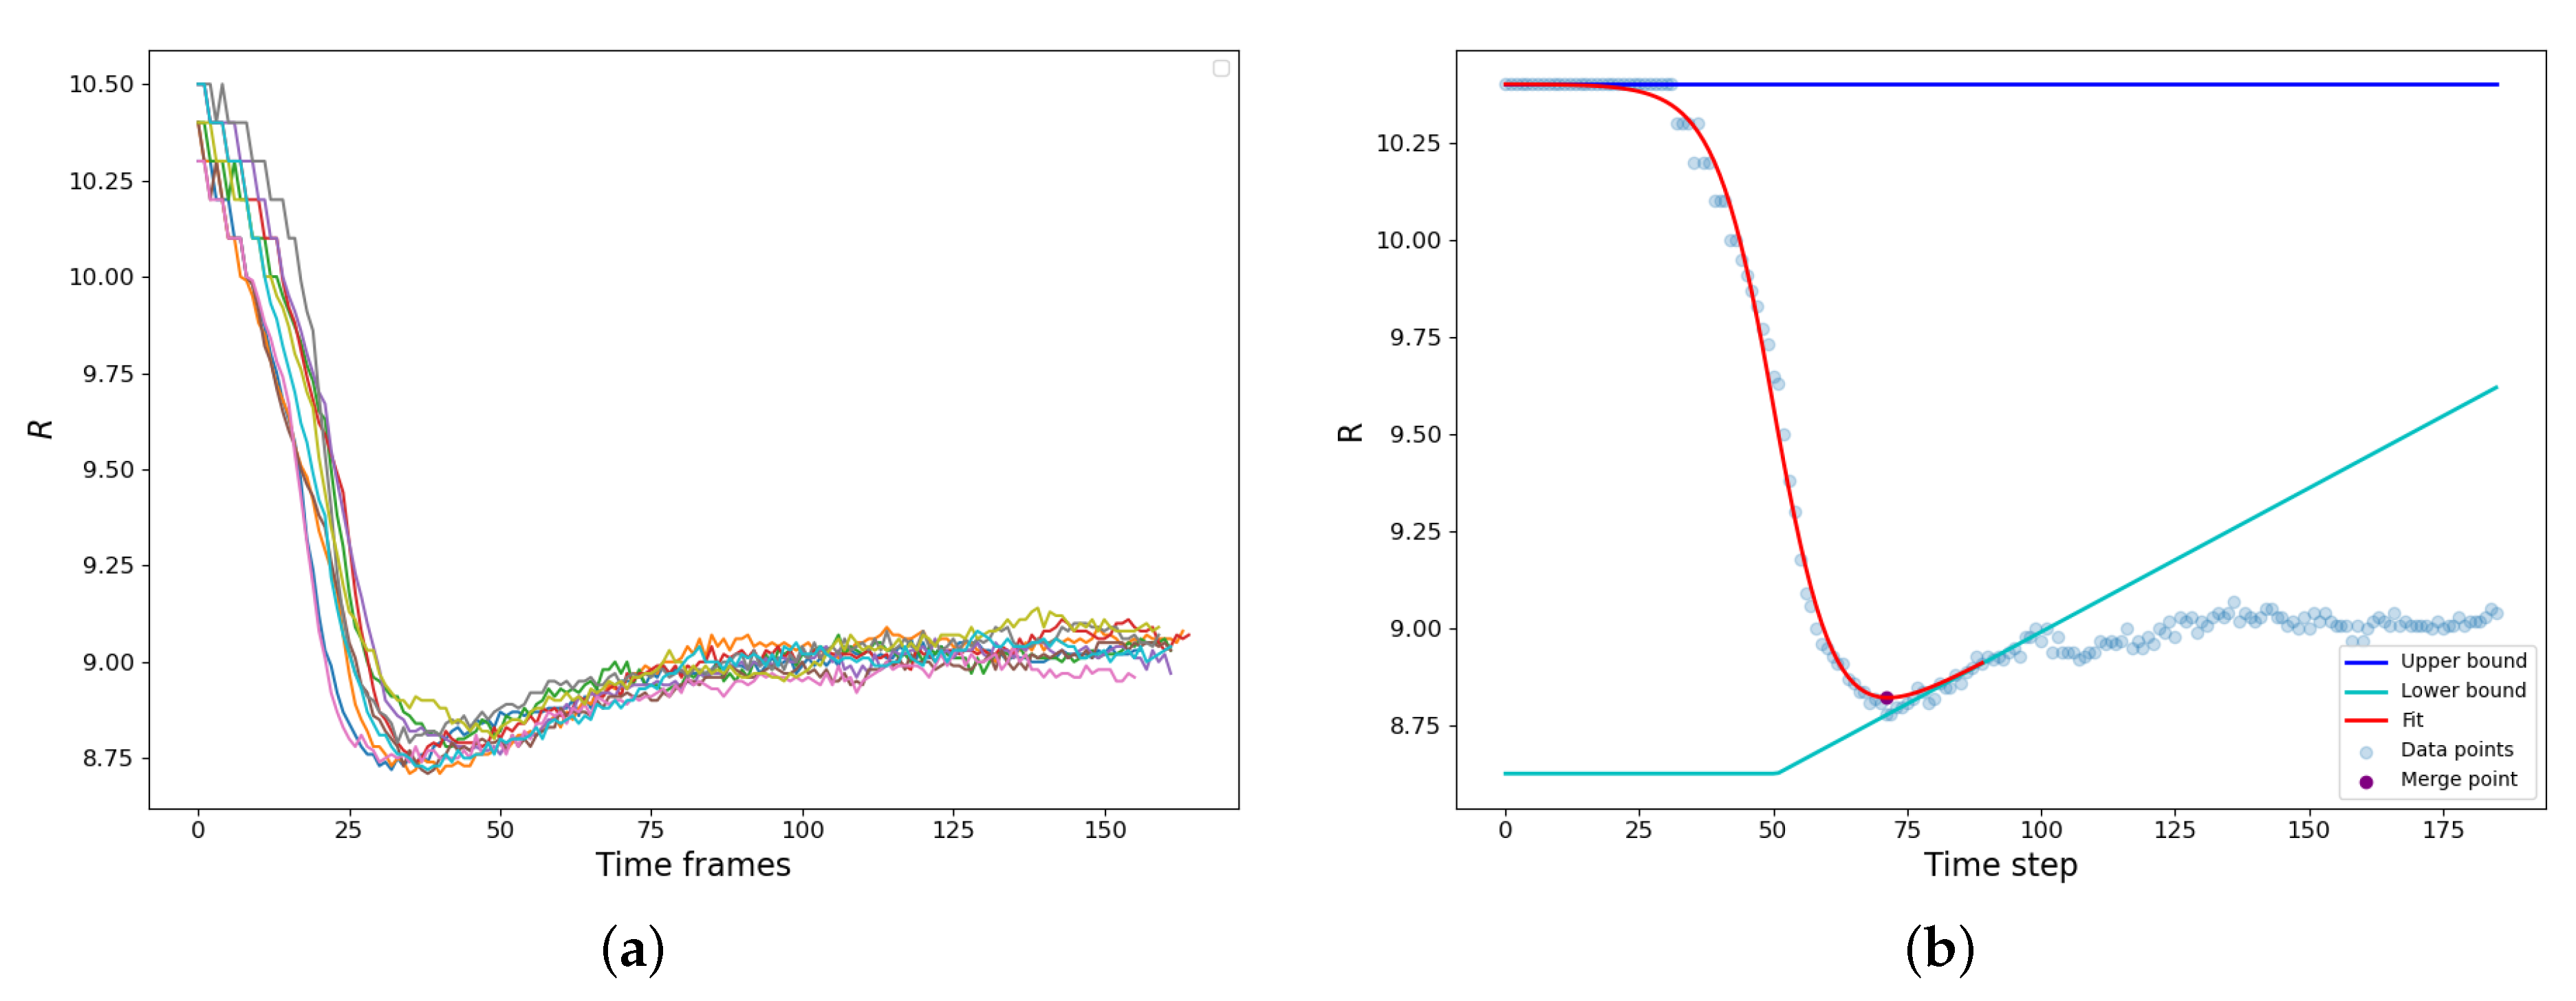
The bridge formation is accompanied by the reduction of the gyration radius of the newly forming droplet. A set of typical examples is shown in
Figure 3a. The vdW attraction causes particle motion to the bridge zone resulting in a rapid decrease of the gyration radius until the parent droplets finally merge into a new one. It should be noted that along with the capillary-driven coalescence, we concurrently observed the ripening mechanism: the LJ molecules evaporated from the areas of high curvature and condensed at the areas of lower curvature (
). Since the radius of the resulting droplet is higher, and the curvature is lower than those of the parent droplets, the resulting droplet actually somewhat grows in size after the shape relaxation has finished due to vapor condensation on its surface (
Figure 3a).
The calculation of the coalescence time is demonstrated in
Figure 3b. The
dependence is augmented with an interval of constant radius
, effectively assuming that before the contact
is the same as at the moment of the contact. Then we assume that during the condensation rebound, the droplet size linearly increases with time
, and the condensation rebound process starts after time
that corresponds to the maximum slope of
dependence. These assumptions create the “upper” and “lower” baselines.
is constant, while
is a piece-linear function, constant at
and fitting the condensation rebound regime at
(
Figure 3b). The
dependence is fitted using the hyperbolic tangent as:
where
and
D are the adjustable parameters, which characterize the “turning point” of the coalescence and the half-duration of the relaxation process. The moment
that corresponds to the minimum value of
was assumed as the end of the coalescence and, therefore, as the characteristic coalescence time.
With this procedure, the dependence of
is obtained.
Figure 4 shows how coalescence time depends on three major configuration parameters. The mean values of time obtained for each set of conditions are plotted. It can be seen that the coalescence time scales linearly with both initial droplet sizes. Interestingly enough, the temperature does not seem to accelerate the coalescence process in the mean but rather increases the standard deviation from the fitted plane. We trained linear regression models for every temperature separately and found the scores to be approximately equal
for
,
for
and
for
. The fairly unrestricted nature of our simulation setup is partly to blame since the
of initial separation between the outer droplet surfaces does not guarantee an immediate coalescence after equilibration, so by the time the droplets eventually come into contact, their sizes may have changed somewhat from the initial values. Since the droplet radii features have the same span of values, we can judge their importance based on the fitted weight coefficients. The smaller droplet has the larger weight between the two, making it the main parameter. The weight of the larger droplet is about 20 times smaller for all temperatures. To determine the influence of the temperature, we trained the linear regression model on the entire dataset. Considering the scatter of target values at higher temperatures and the span of considered temperature values, the corresponding weight is insignificant. The addition of Lasso regularization with constant
sets the temperature weight to zero and gives an overall better fit for temperatures
and
. It should be noted that the larger droplet’s coefficient does not vanish in this model: the role of the size of the larger droplet remains significant. The above Lasso model predicts zero coalescence time for two droplets of size
(that is, containing only one molecule), which is the correct asymptotic limit since merging of two single LJ molecules into a dimer “droplet” needs no internal restructuring. It was reported that an increase in temperature difference between the parent droplets accelerates the mixing between their particles [
41]. We did not attempt to validate those claims during the current work, but the temperature difference between the coalescing drops would lead to non-uniformity of the particle diffusion, which, in turn, could affect the coalescence time.
It is interesting to compare the coalescence times with the characteristic lifetimes of the droplet in a droplet suspension in vapor. To estimate the characteristic lifetimes, we conducted Langevin dynamics (LD) simulations. Each simulation modeled the Brownian motion of a particle whose mass and size corresponded to a liquid droplet at certain conditions in the medium with characteristics (density and viscosity) corresponding to the equilibrium vapor. The trajectory of the Brownian motion is recorded; after the simulation, we calculate the volume of the exclusion sphere (the exclusion sphere radius equals the particle diameter) covered during its motion per unit of time. The product of the volume by the concentration is the inverse average lifetime of the droplet with respect to the contact-driven coalescence if we assume that each contact leads to the merging of the two droplets (which is reasonable since the droplet velocities are very low). This estimation is fully similar to that of the free path of a molecule in a gas, but in the Brownian, rather than in the ballistic, regime of motion.
Here we consider only equally sized droplets. The larger the droplet sizes, the slower their motion is due to the increased mass, but the lower the viscosity of the vapor. Obviously, the droplet lifetime with the current assumptions decreases linearly with the volume fraction occupied by the liquid phase. LD simulations are carried out for the spherical particles with the mass and size corresponding to droplets containing 500, 750, 1000, 2500, 5000, and 10,000 molecules with the time step of . Reduced temperatures are once again 0.65, 0.70, and 0.75 . The coalescence times reported above only depend on the droplet size and grow proportional to .
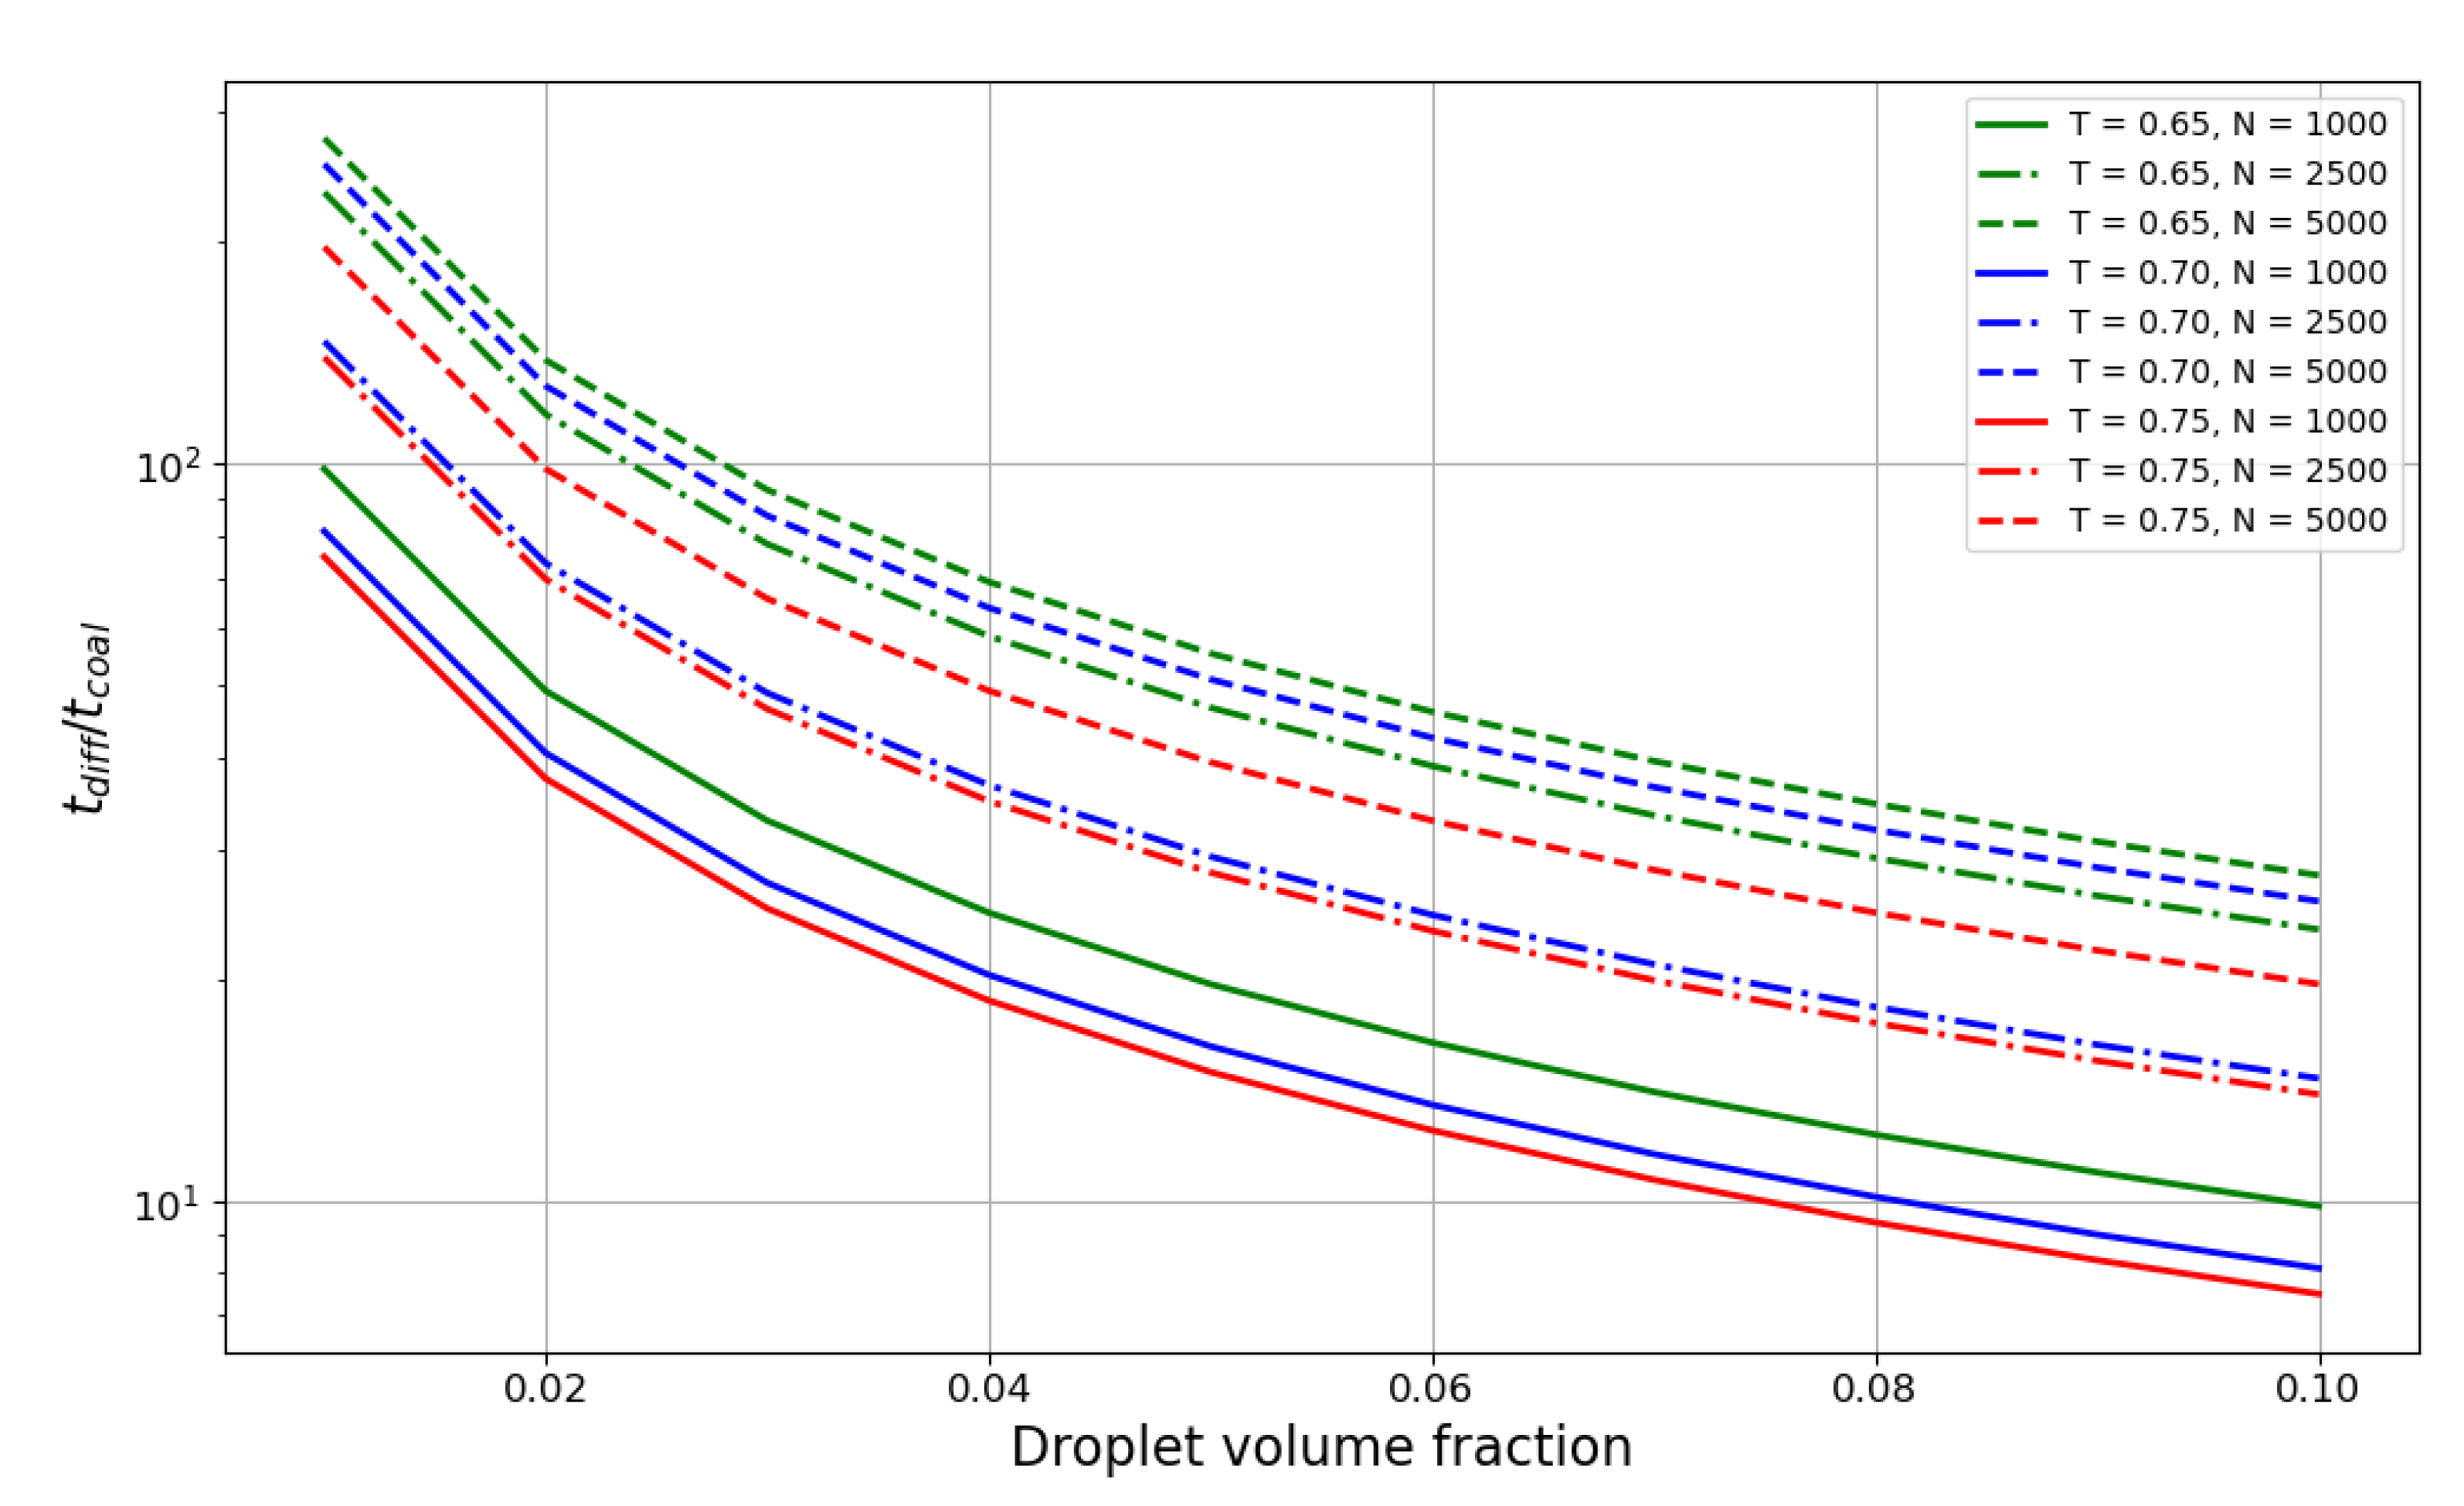
Figure 5 shows the ratio of the droplet lifetime to the coalescence time. The plot spans the values of liquid phase volume fractions from 0.01 to 0.1 with a step of 0.01. The ratio decreases exponentially with the increase in liquid volume fraction, and for smaller droplets with
reaches the value of 10 at 0.07–0.08 volume fraction, meaning the characteristic times become quite comparable at that point. Hence, for denser suspensions, coalescence time probably should be taken into account in aggregation theories. Temperature also has an influence on the ratio; although weaker than the dependence on the droplet size, it is still considerable for smaller droplets.
4. Conclusions
We have performed molecular dynamics simulations of LJ nanodroplet contact-driven coalescence (that is, merging of two droplets into a larger one) in quasi-equilibrium vapor. The droplet sizes ranged from 6 to 12 molecular diameters
, and the reduced temperature
ranged from 0.65 to 0.75. Upon establishing contact, the parent droplets form a bridge, with the radius growing linearly with time. This scaling regime is consistent with the “collective molecular jumps” mechanism described recently [
28] and is dominant for the considered length scales, with its duration increasing with temperature. Currently, this regime cannot be captured by experimental studies. Thus, for small droplets, the classical hydrodynamic regimes characterized by the power law (inertial) or the logarithmically corrected linear (viscous) bridge diameter dependence on time are not observed. The characteristic duration of the coalescence
is determined from the analysis of the gyration radius devolution in time.
shows a linear dependence on the initial radii of the smaller and larger droplets
with
as the main parameter with the largest weight. This is expected, because if
,
should depend on
only. Obviously, a twofold difference in the spatial size (eight-fold mass difference) is not sufficient to break the linear dependence. It is interesting that the temperature does not show a significant influence on
in the mean, despite the far greater molecular mobilities in the liquid phase. Removing the temperature feature from the model altogether even produces a better fit to the simulation results.
In practical conditions, the droplets are not spherical, and their motion is not purely diffusive; they often collide at considerable velocities. Since Perumanath et al. [
28], in the original article mentioning the “thermal scaling regime,” considered both cylindrical and spherical droplets and obtained qualitatively similar results, we would expect that the linear scaling of the characteristic time observed in this work would be valid for droplets whose shape is substantially non-spherical. Droplet velocities (especially for smaller droplets because that case corresponds to higher Reynolds numbers) should qualitatively affect the coalescence time. We may speculate that the linear scaling will hold when the droplet velocities are low (that is if the time within which the droplet travels the distance equal to its diameter is larger than the droplet coalescence time) and will break at higher velocities. However, the Reynolds number threshold for transitions between coalescence/stretching separation/shattering for nanodroplets is a potentially fruitful topic for future investigations.
Another outcome of this work is the comparison of the coalescence time to the “free diffusion time” in dense suspensions. This comparison also sheds light on the importance of multiparticle collisions in liquid droplet suspensions because if the coalescence time is negligible, the number of multiparticle contacts is negligible as well. The ratio appears to show a strong dependence on size (as droplet diffusion slows down faster than coalescence as the droplet grows) and a much weaker dependence on temperature. The results show that in very dense suspensions (droplet volume fraction above 0.1) and small sizes (), the coalescence time is undoubtedly comparable with the droplet lifetime and should be taken into account. In less extreme cases, the coalescence can be considered a fast process, although, of course, it depends on the required precision of the model.


