1. Introduction
Pressure-wave cleaning typically involves transducer-induced pressure waves in a liquid [
1]. Some pressure waves will induce the creation of bubbles in a liquid, a process referred to as cavitation [
2]. Ultrasonic waves induce a number of unstable cavitation bubbles that will collapse and generate a very powerful jet toward solid boundaries [
3,
4]. Studies have explored temperature [
5,
6,
7,
8], geometry [
9,
10,
11,
12,
13,
14], and elasticity [
15,
16,
17,
18,
19,
20,
21] as critical factors to manage the intensity and dynamics of cavitation. This strong jet and shock wave kills the bacteria [
22,
23] or further erodes the solid surfaces [
24,
25,
26] rather than gently cleans/scrubs adhered particles. Oftentimes, the damage caused by cavitation is so pronounced that solid structures are significantly eroded or completely destroyed [
24,
25,
26,
27].
There are three different regimes of pressure waves in fluids. Acoustic waves are audible and range up to around 25 kHz. Above those, there are ultrasonic and megasonic waves. Typically, in industry, the frequencies used for ultrasonic cleaning are between 25 kHz and 300 kHz. For megasonic cleaning, much higher frequencies are used that typically range from 500 kHz up to 10 MHz. Typically, both ultrasonic and megasonic pressure waves are generated by piezo-transducers, with costs ranging from one to ten USD depending on the size and quality of the transducers.
Typically, ultrasonic cleaning is not preferred on brittle or otherwise vulnerable solids as they may suffer damage or scars in the process. When megasonic transducers are used, the higher frequency generates smaller wavelengths, resulting in fewer and smaller cavitation bubbles [
28].
In terms of floor cleaning, both ultrasonic and megasonic waves can be used. Ultrasonic waves exhibit a powerful cleaning action, though surface damage can be significant. On the other hand, megasonic waves produce fewer and smaller cavitation bubbles, resulting in little to no surface damage. However, the effectiveness of cleaning is questionable due to the presence of fewer bubbles in a liquid. These observations support our main goal of combining megasonic waves with pre-existing bubbles.
Using bubbles to clean surfaces has proven to be useful in the food industry to clean fruits and vegetables [
29,
30,
31,
32,
33,
34]. Typically, fruits or vegetables are placed in a water bath, and bubbles are injected at the bottom of the tank. Bubbles will then rise, impact, and scrub the fruits by sliding along the surface. The main benefit of cleaning using injected bubbles is that bubbles are highly deformable, so the bubbles can go into small crevices or grooves to clean. The surface tension of the bubbles plays a crucial role, enabling them to adapt to the surface topography and ensuring thorough cleaning.
There are two problems to consider when applying this technique to floor cleaning applications: rising bubbles and limited cleaning power. First, due to buoyancy, bubbles rise up to the top surface, which makes it hard to keep them in contact with the surface to be scrubbed in a floor cleaning application. One way to rectify this rising-bubble problem is to utilize external pressure to push the bubbles to the targeted area. The second problem is that slowly rising bubbles do not produce strong cleaning forces (i.e., shear forces). To powerfully clean stained/dirty surfaces, external excitation is required to create strong shear forces and streaming circulations to efficiently scrub surfaces.
Since using pressure waves or bubbles alone shows limited capability when cleaning surfaces, what happens when we combine them? A method using pre-dispersed gas bubbles with acoustic waves has been used in the semiconductor industry [
35]. This method has been proven an effective means to remove particulate contaminants from semiconductor surfaces. The acoustically activated bubbles will stay close to the liquid–surface interface and vibrate at a high frequency. This, in turn, generates small vortices (micro streaming) and strong shear forces [
36,
37,
38,
39,
40], which cause the removal of particles from the surface without otherwise damaging it. Currently, this technology has been applied to the semiconductor industry to liberate particulate contaminants on small surface areas (silicon wafers or CPU chips). However, this combined method should work for cleaning large-scale floors and adhered strains/dirt, an application that has not been investigated extensively.
In this paper, we aim to test a method for cleaning soiled floors using ultrasonic piezo transducers. To integrate the cavitation method into surface cleaning applications effectively, we encounter several challenges. Firstly, the method traditionally requires a fully immersed liquid bath, which is impractical due to water usage constraints. Secondly, a comprehensive comparison of its cleaning performance relative to conventional methods, such as brushes, is yet to be conducted.
These transducers in our study oscillate back and forth with enough power to create tiny cavitation bubbles in water, which appear and collapse periodically. The collapsing of these bubbles can create very high shock-wave forces, which presumably can be used to shake loose embedded dirt and soil in flooring. The benefit of this system is that it could potentially be used in combination with other cleaning systems. Further benefits include that cavitation can work down into cracks and ridges and does not require cleaning soap solutions to operate. We test the cleaning performance of this system in combination with a metal brush, with no brush (direct transducer contact with water only), and with a water pocket. For each of these setups, we performed scrubbing tests with the transducer and micro-bubbler off, with the transducer on, and with the transducer and micro-bubbler on to help isolate the effects of each of these systems. Finally, we will present the results of different configurations.
2. Materials and Methods
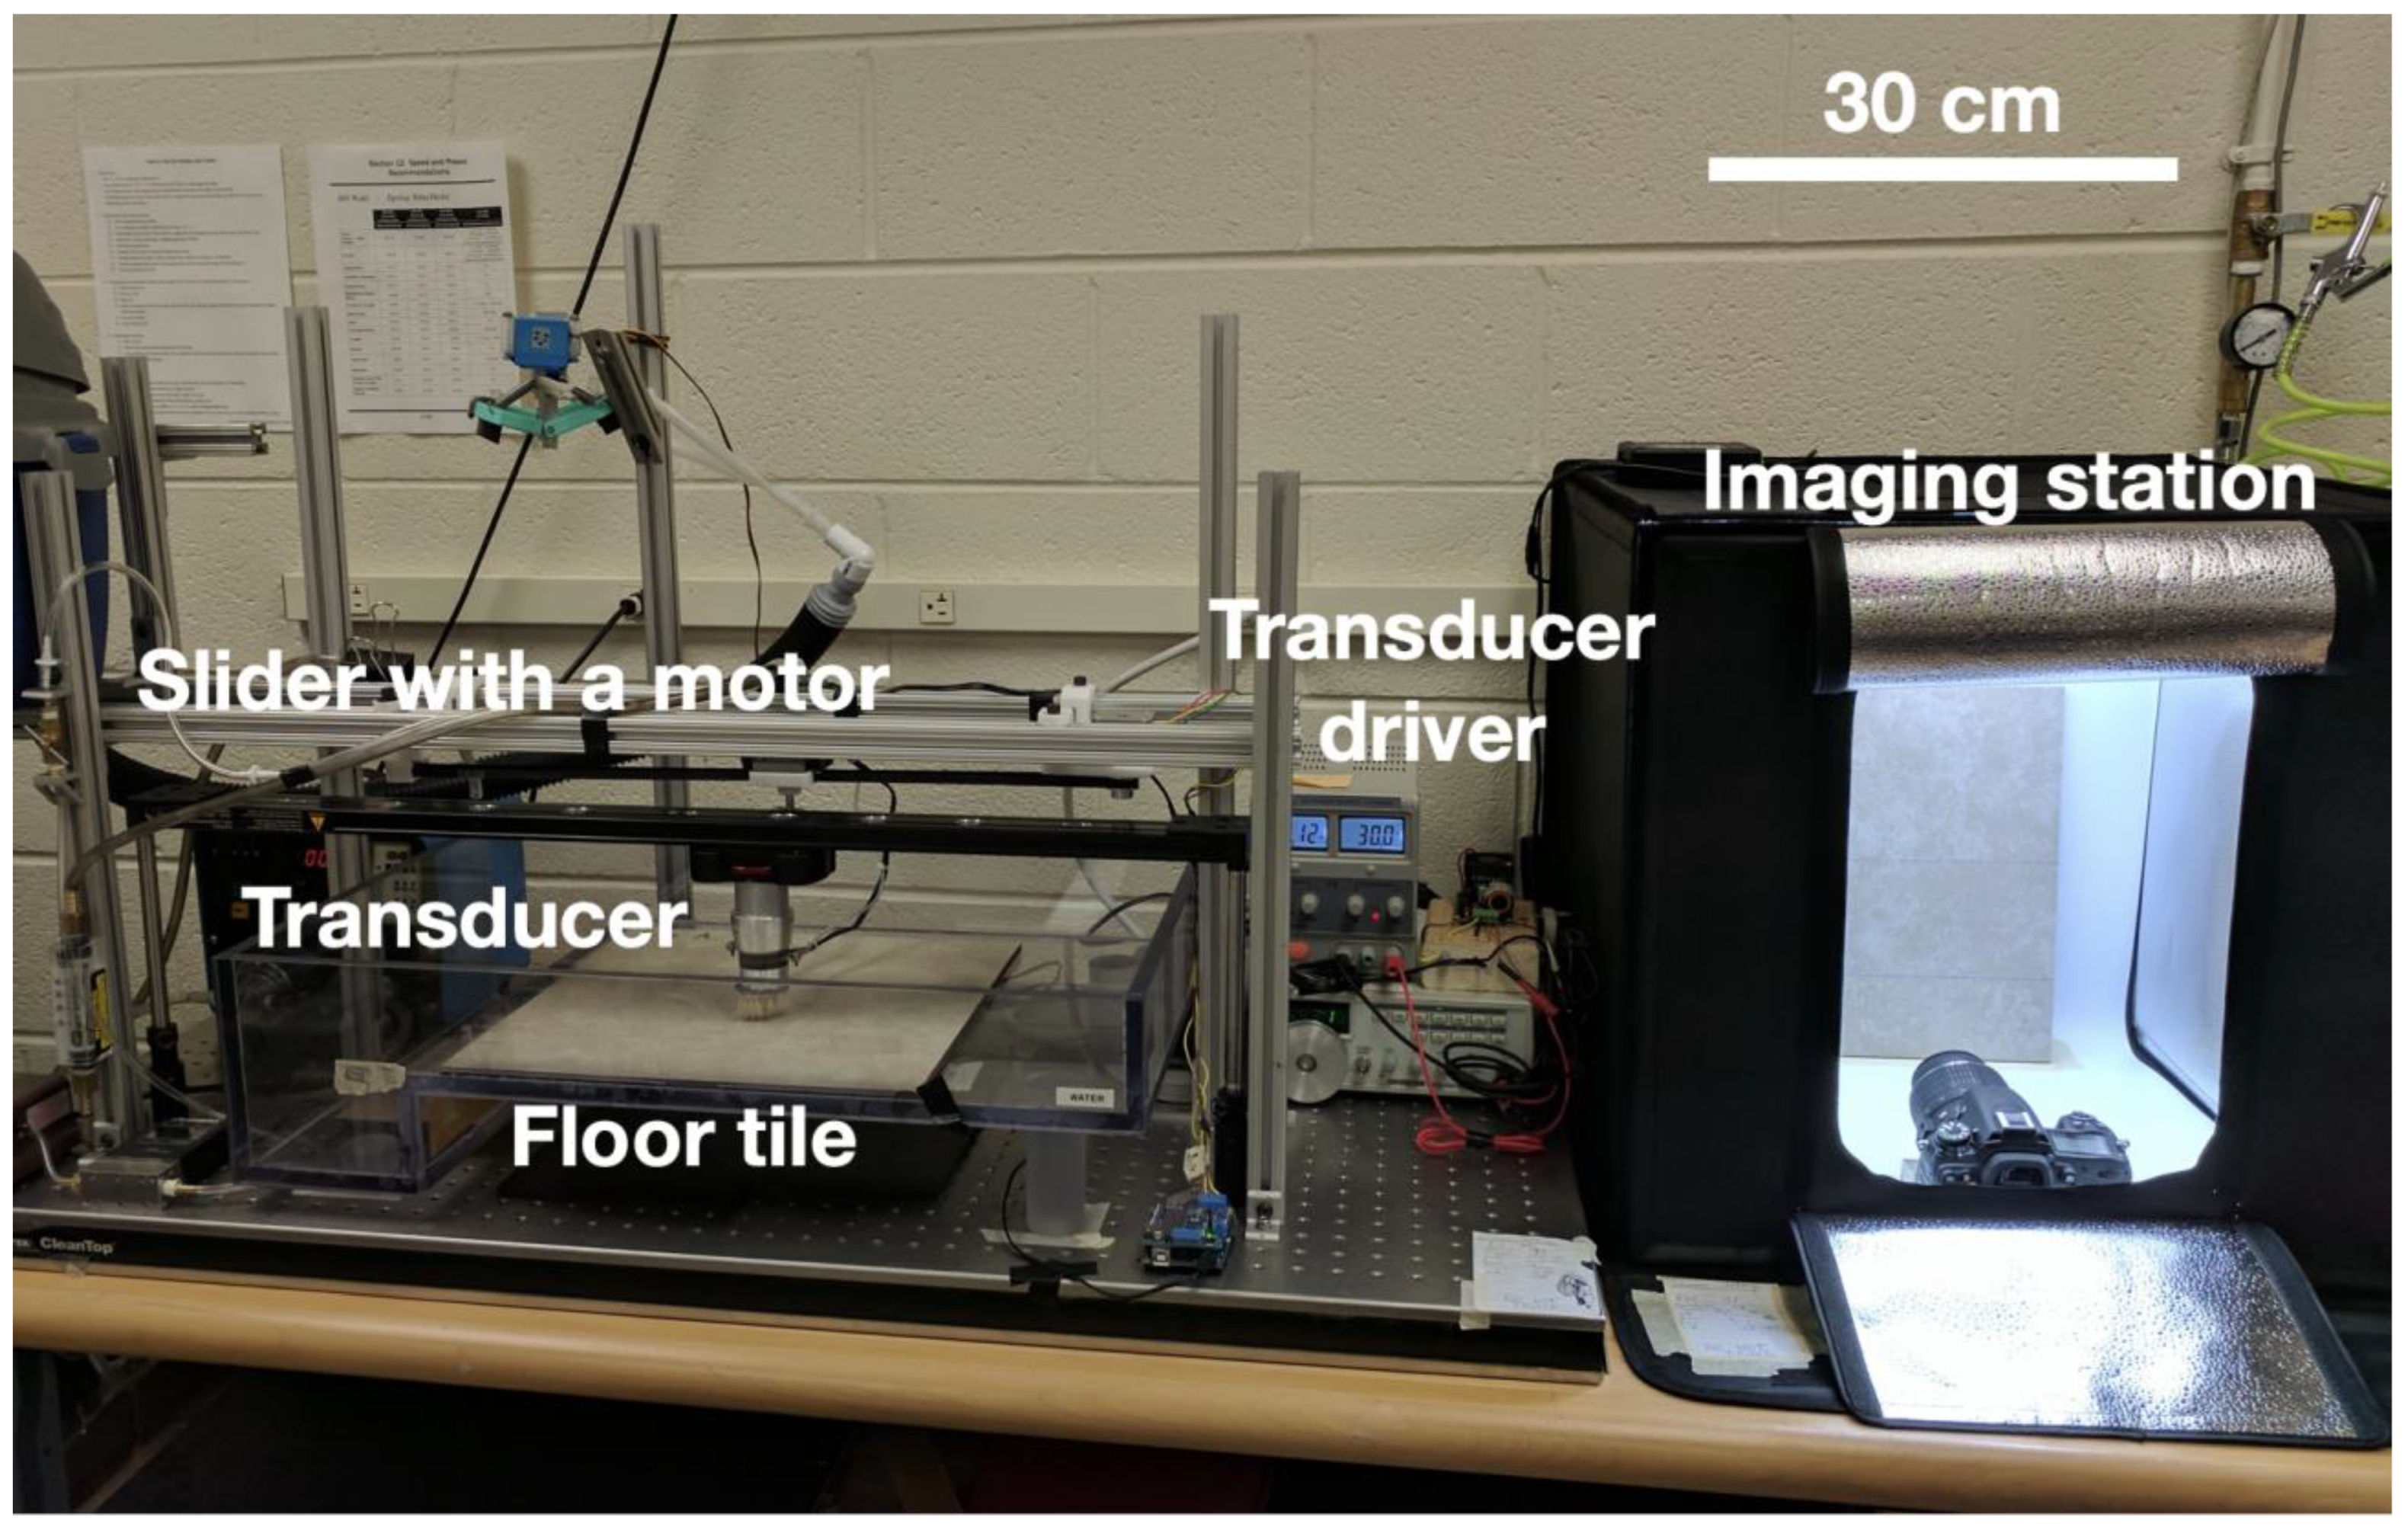
Our experimental setup, as shown in
Figure 1, is composed of five separate parts, many of which were modified at different points throughout the development of this system.
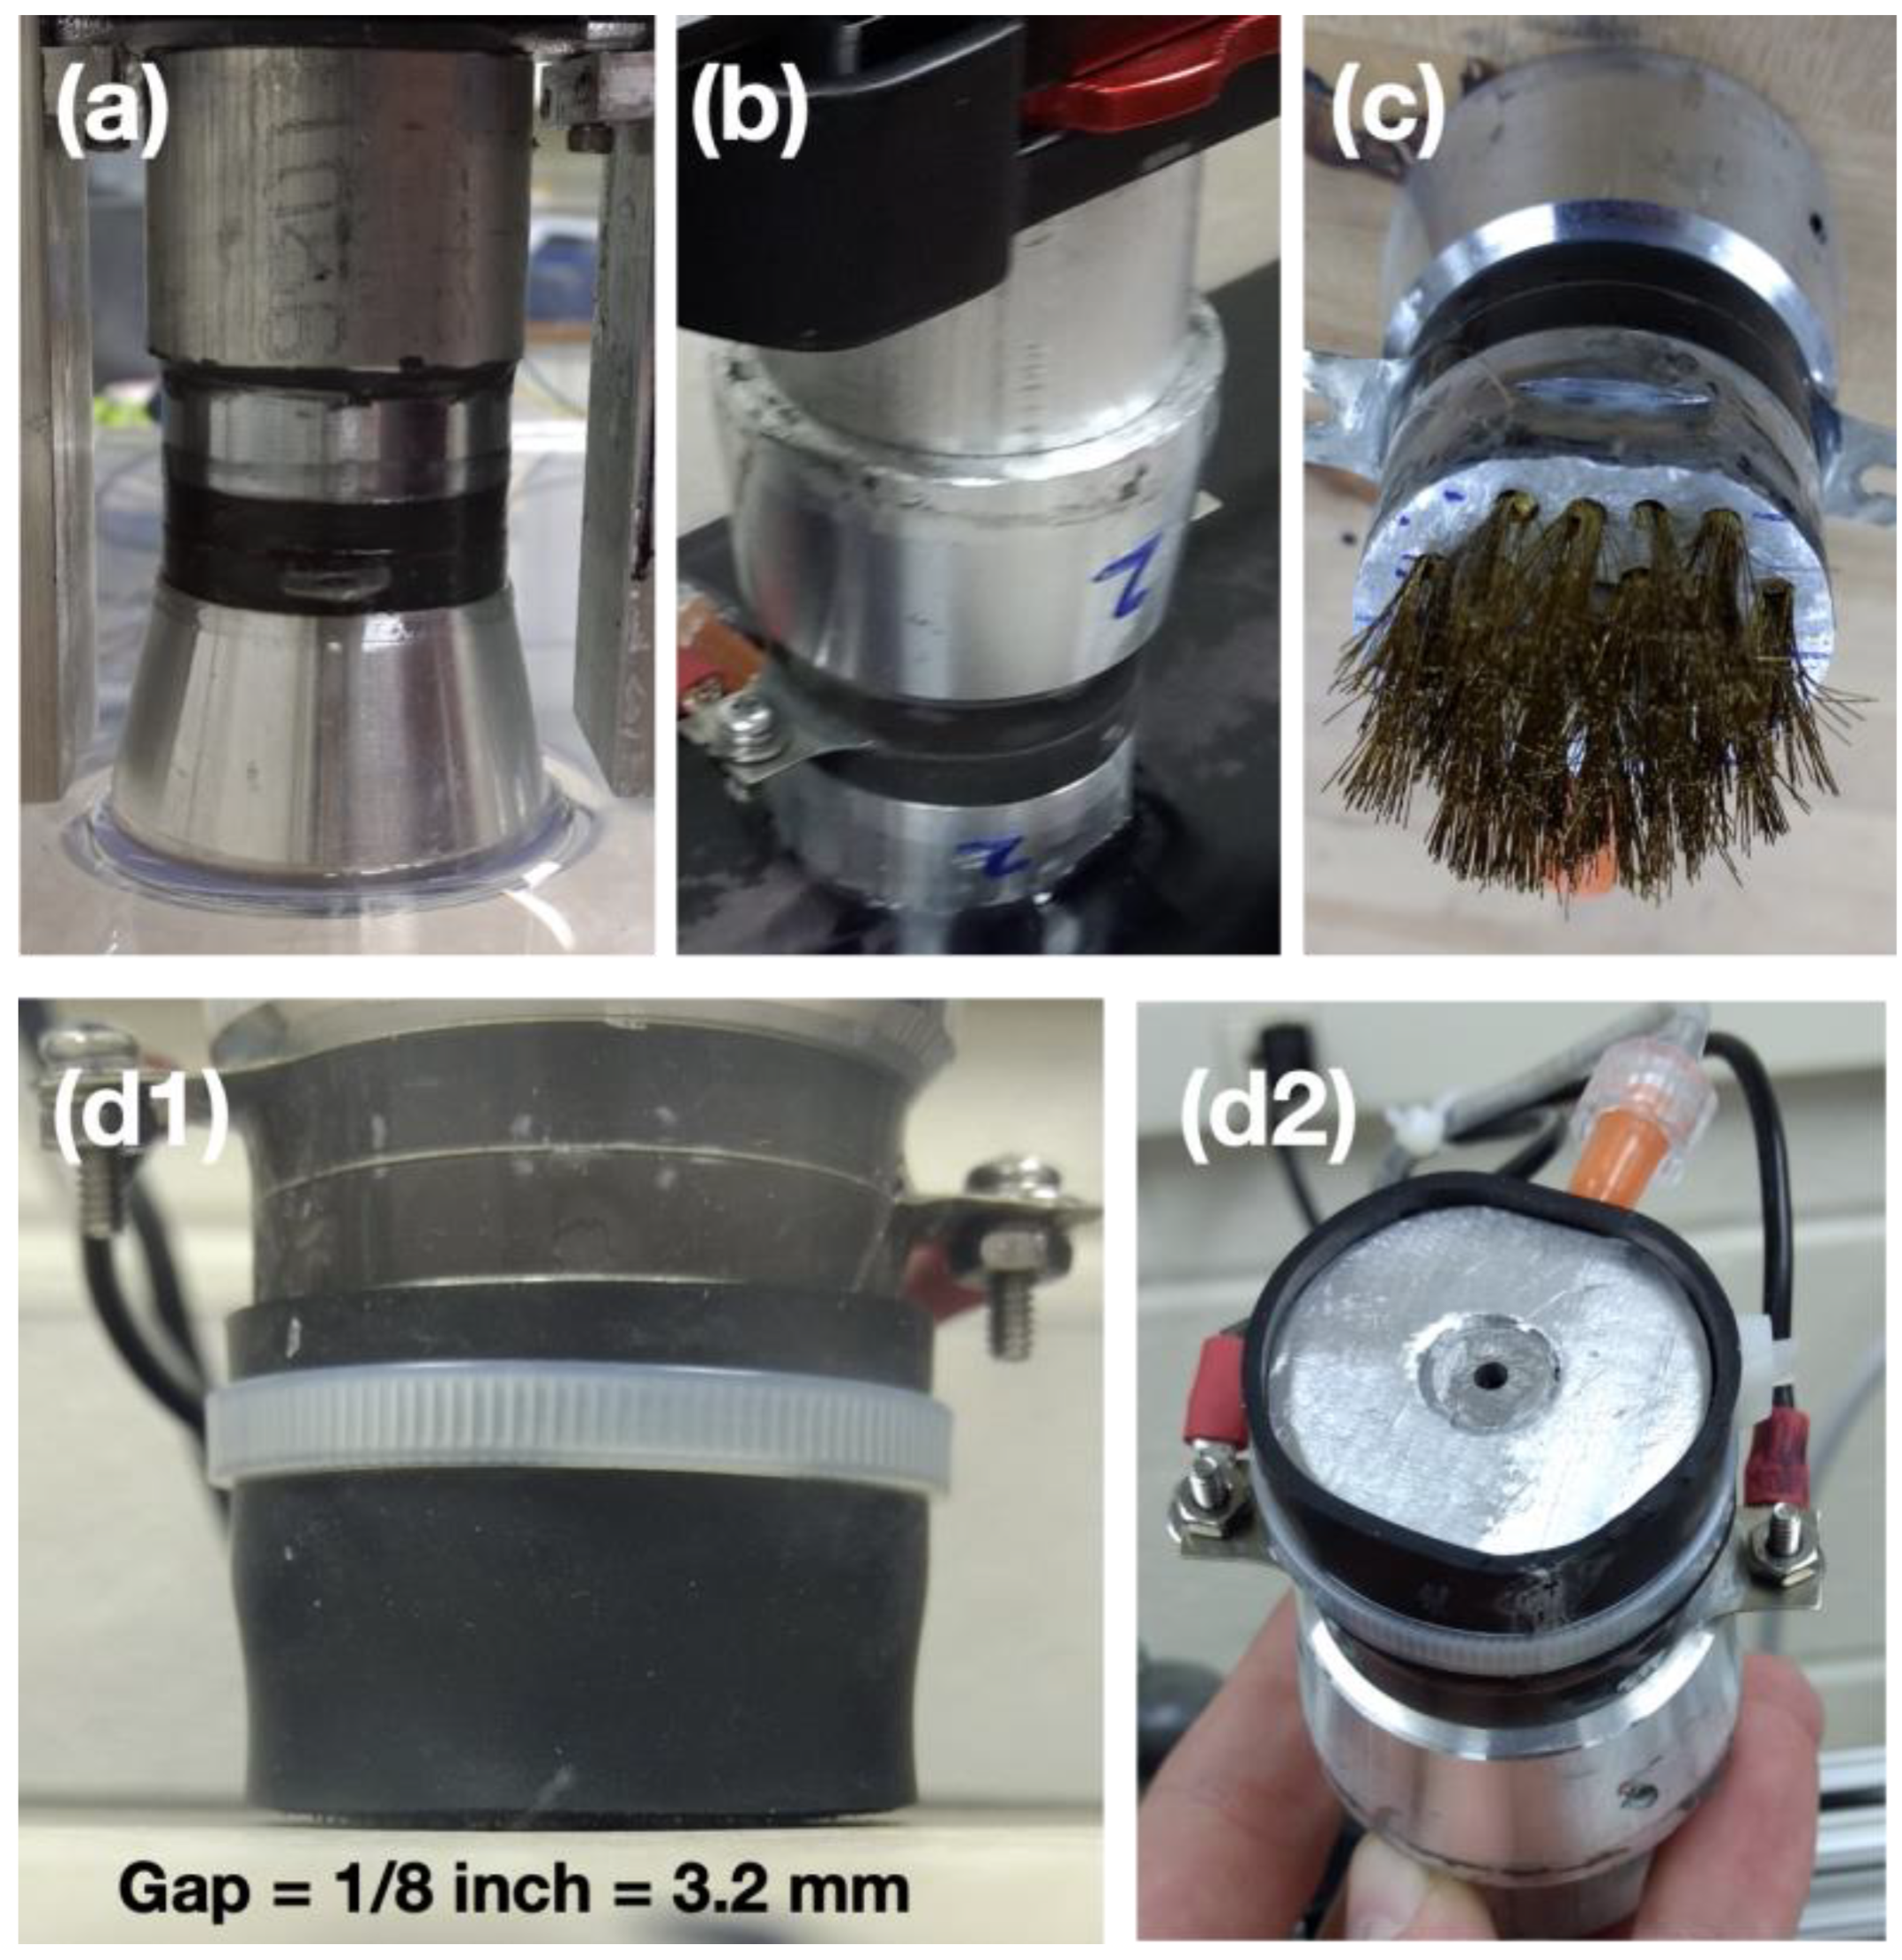
The first is the transducer driver system, which is composed of a signal generator, a power amplifier, a variable power supply, and the transducer itself. The signal generator is a GFG-8216A (GW Instek Co., New Taipei City, Taiwan), which generates a low-voltage frequency signal. This signal is amplified using a MX200 piezo driver (PiezoDrive Co., Shortland, Australia) to an output power of approximately 30 watts. This is connected directly to the 40 KHz Bolt Clamped Langevin Transducers (STEMiNC Inc., Davenport, FL, USA) we used in our experiments. The transducer manufacturer positioned a holding connection on the light mass side rather than on the heavy mass. Nevertheless, we examined two distinct configurations: one with a heavy mass at the bottom (
Figure 2a) and another with a light mass at the bottom (
Figure 2b). Vibration tests revealed that the configuration with a lighter mass at the bottom produces a more pronounced vibration than its heavy-mass counterpart. We prepared separate transducers for the plastic bristle brush, the brass bristle brush (
Figure 2c), and the water pocket (
Figure 2(d1,d2)) experiments. The ultimate design features a water pocket with a rubber enclosure integrated around a transducer. This enclosure serves dual functions; it acts as a squeegee and also confines water, minimizing water loss from the cylindrical structure. Due to the added mass of the brush heads, each transducer had to be tuned individually, and all were driven with an input power of 30 watts for our tests.
The second main part of the experimental setup is the scrubbing system based around a SLIDECAM V 800 camera slider (Varavon Inc., Gimpo, South Korea). This has a screw-on slider mount, which we used to hold the transducers. To automate the scrubbing process and to reduce variability between samples, we used a stepper motor and a belt drive to move the transducer/scrubber back and forth. The stepper motor is driven by an Arduino with a stepper motor shield for simplicity of use. The slider is programmed to move at a pace that completes one path in 20 s.
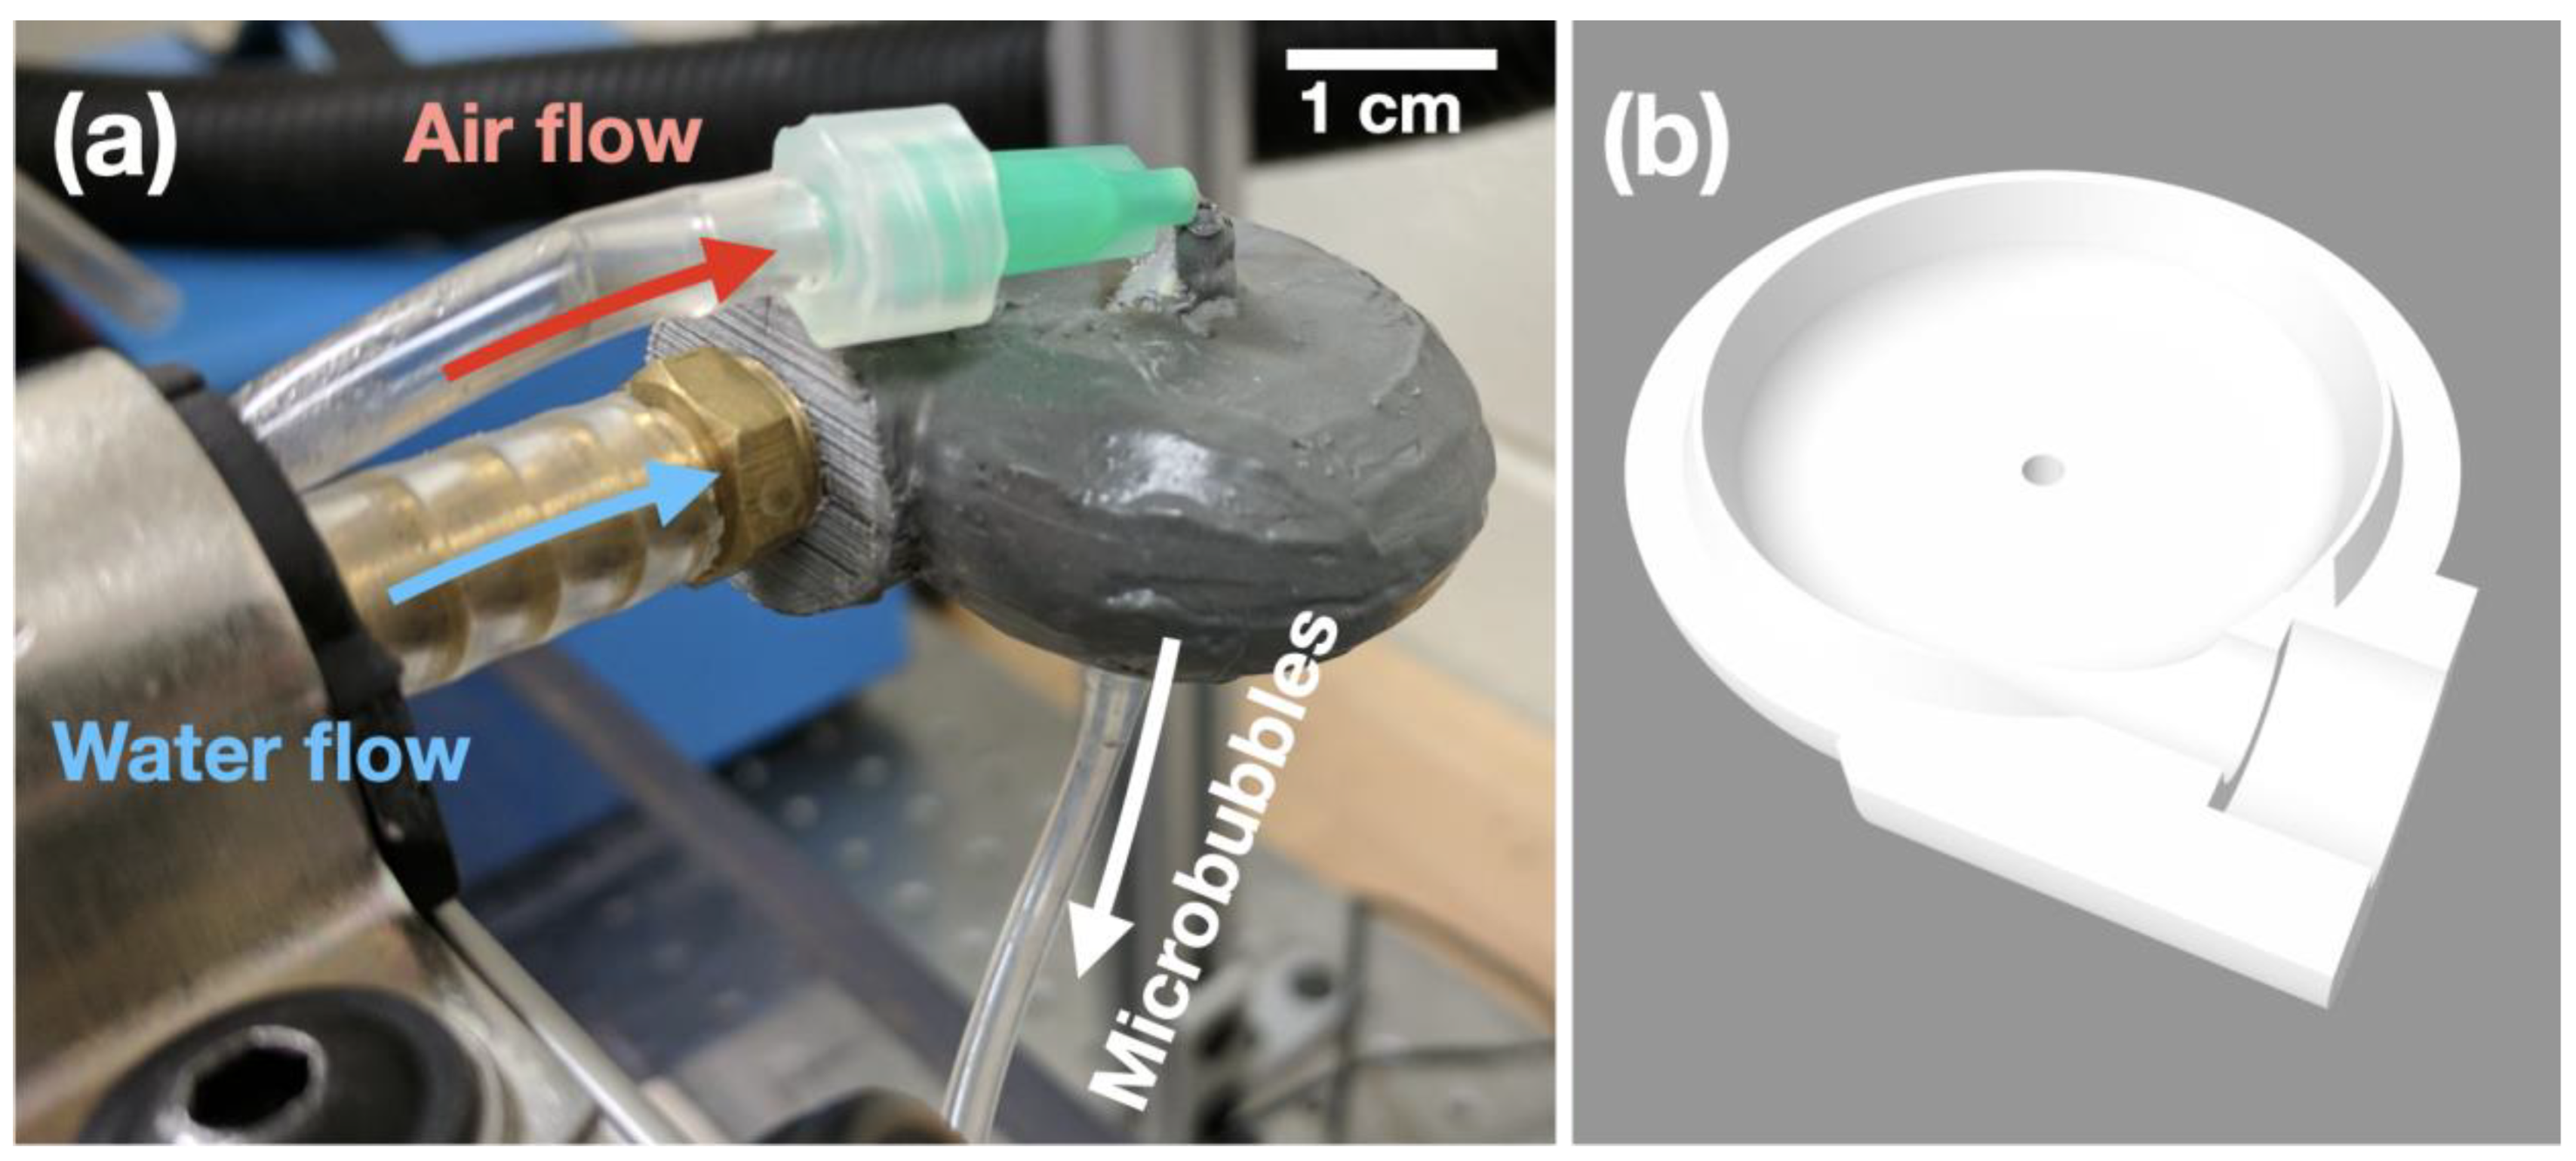
The third major component of the experimental setup is a custom micro-bubble generator, as shown in
Figure 3. Commercially available micro-bubble generators were prohibitively expensive and did not provide the low flow rates we desired since most commercial systems are designed for industrial-scale use. In the end, we were able to create our own micro-bubble generator capable of making bubbles as small as 200 microns at total flow rates of about 110 mL per minute. Measurements from a camera, while a thin laser sheet illuminated a plane, may lack precision as some bubbles deform into non-spherical shapes. The final micro-bubble generator design consists of an adjustable water pump, an air pump, and a vortex mixing device. It creates bubbles at an air/water volume ratio of about 5% (
Figure 4). A short and narrow hose runs from the device directly to the base of the transducer, where the micro-bubbles are injected.
An optional squeegee and vacuum system are the fourth main component of the experimental setup. There is one squeegee on each side of the transducer since it slides in both directions, and a servo moves the desired one into a position coordinated with the movement of the slider system. We decided that this system was another source of potential noise in our data, so we elected to remove it during our primary data collection; however, we did observe a few interesting behaviors with this system, which we will discuss in our results.
Additionally, we were interested in the effects of physically implanting the brush bristles into the end of the transducer. We tested two methods of securing the brush bristles. The first was a JB weld epoxy, and the second method used a small length of brass rod that would be punched into a drilled hole, as shown in
Figure 5.
The last overall system of our experimental setup was a method for reliably measuring the effectiveness of our cleaning mechanism. We used protein-based soil (2.5 g Nigrosin (A18147.22 from Thermo Scientific Chemicals, Waltham, MA, USA) + 190 g water + 220 g milk + 26 g white wheat flour). This is a very dark soil, so the European Cleaning Machines Association recommends measuring the darkness of the tile to measure how clean it is. We used a high-end digital camera on full manual settings to take photos of the floor tiles. Lighting conditions of our lab were held constant by using a purpose-built LED lighting box for all our pictures. We measured the darkness of each tile when it was completely clean, both after it was soiled and after it was scrubbed, for every test we performed. The darkness measuring system was automated using MATLAB 2017b, which corrects for any differences in the exposure brightness and averages the darkness of the entire scrubbed area to help minimize the variation in the cleaned area. To obtain a “percent cleaned” numerical result for each test, we mapped the measured darkness of the tile after scrubbing from a range of [when soil was applied, when the tile was fully clean] to a range of [0%, 100%] using this formula:
where ‘cleaned’ refers to the level of darkness of the soil-dirt tile after a cleaning test has been conducted, while ‘dirty’ denotes the darkness level of the soil-dirt tile before the cleaning test. The term ‘before’ is used to represent the darkness level of a clean tile surface. The output of this formula is as follows: 100% means the tile was completely cleaned, and 0% means the tile was just as visibly dirty as it was before cleaning. In this study, cleaning performance is quantified based on proficiency in contaminant removal from surfaces. We utilize images of cleaned surfaces and the cleaning percentage to measure the surface cleaning performance. While efficiency can also be delineated through the mechanical power input and output, we do not explore mechanical efficiency in this study.
3. Results
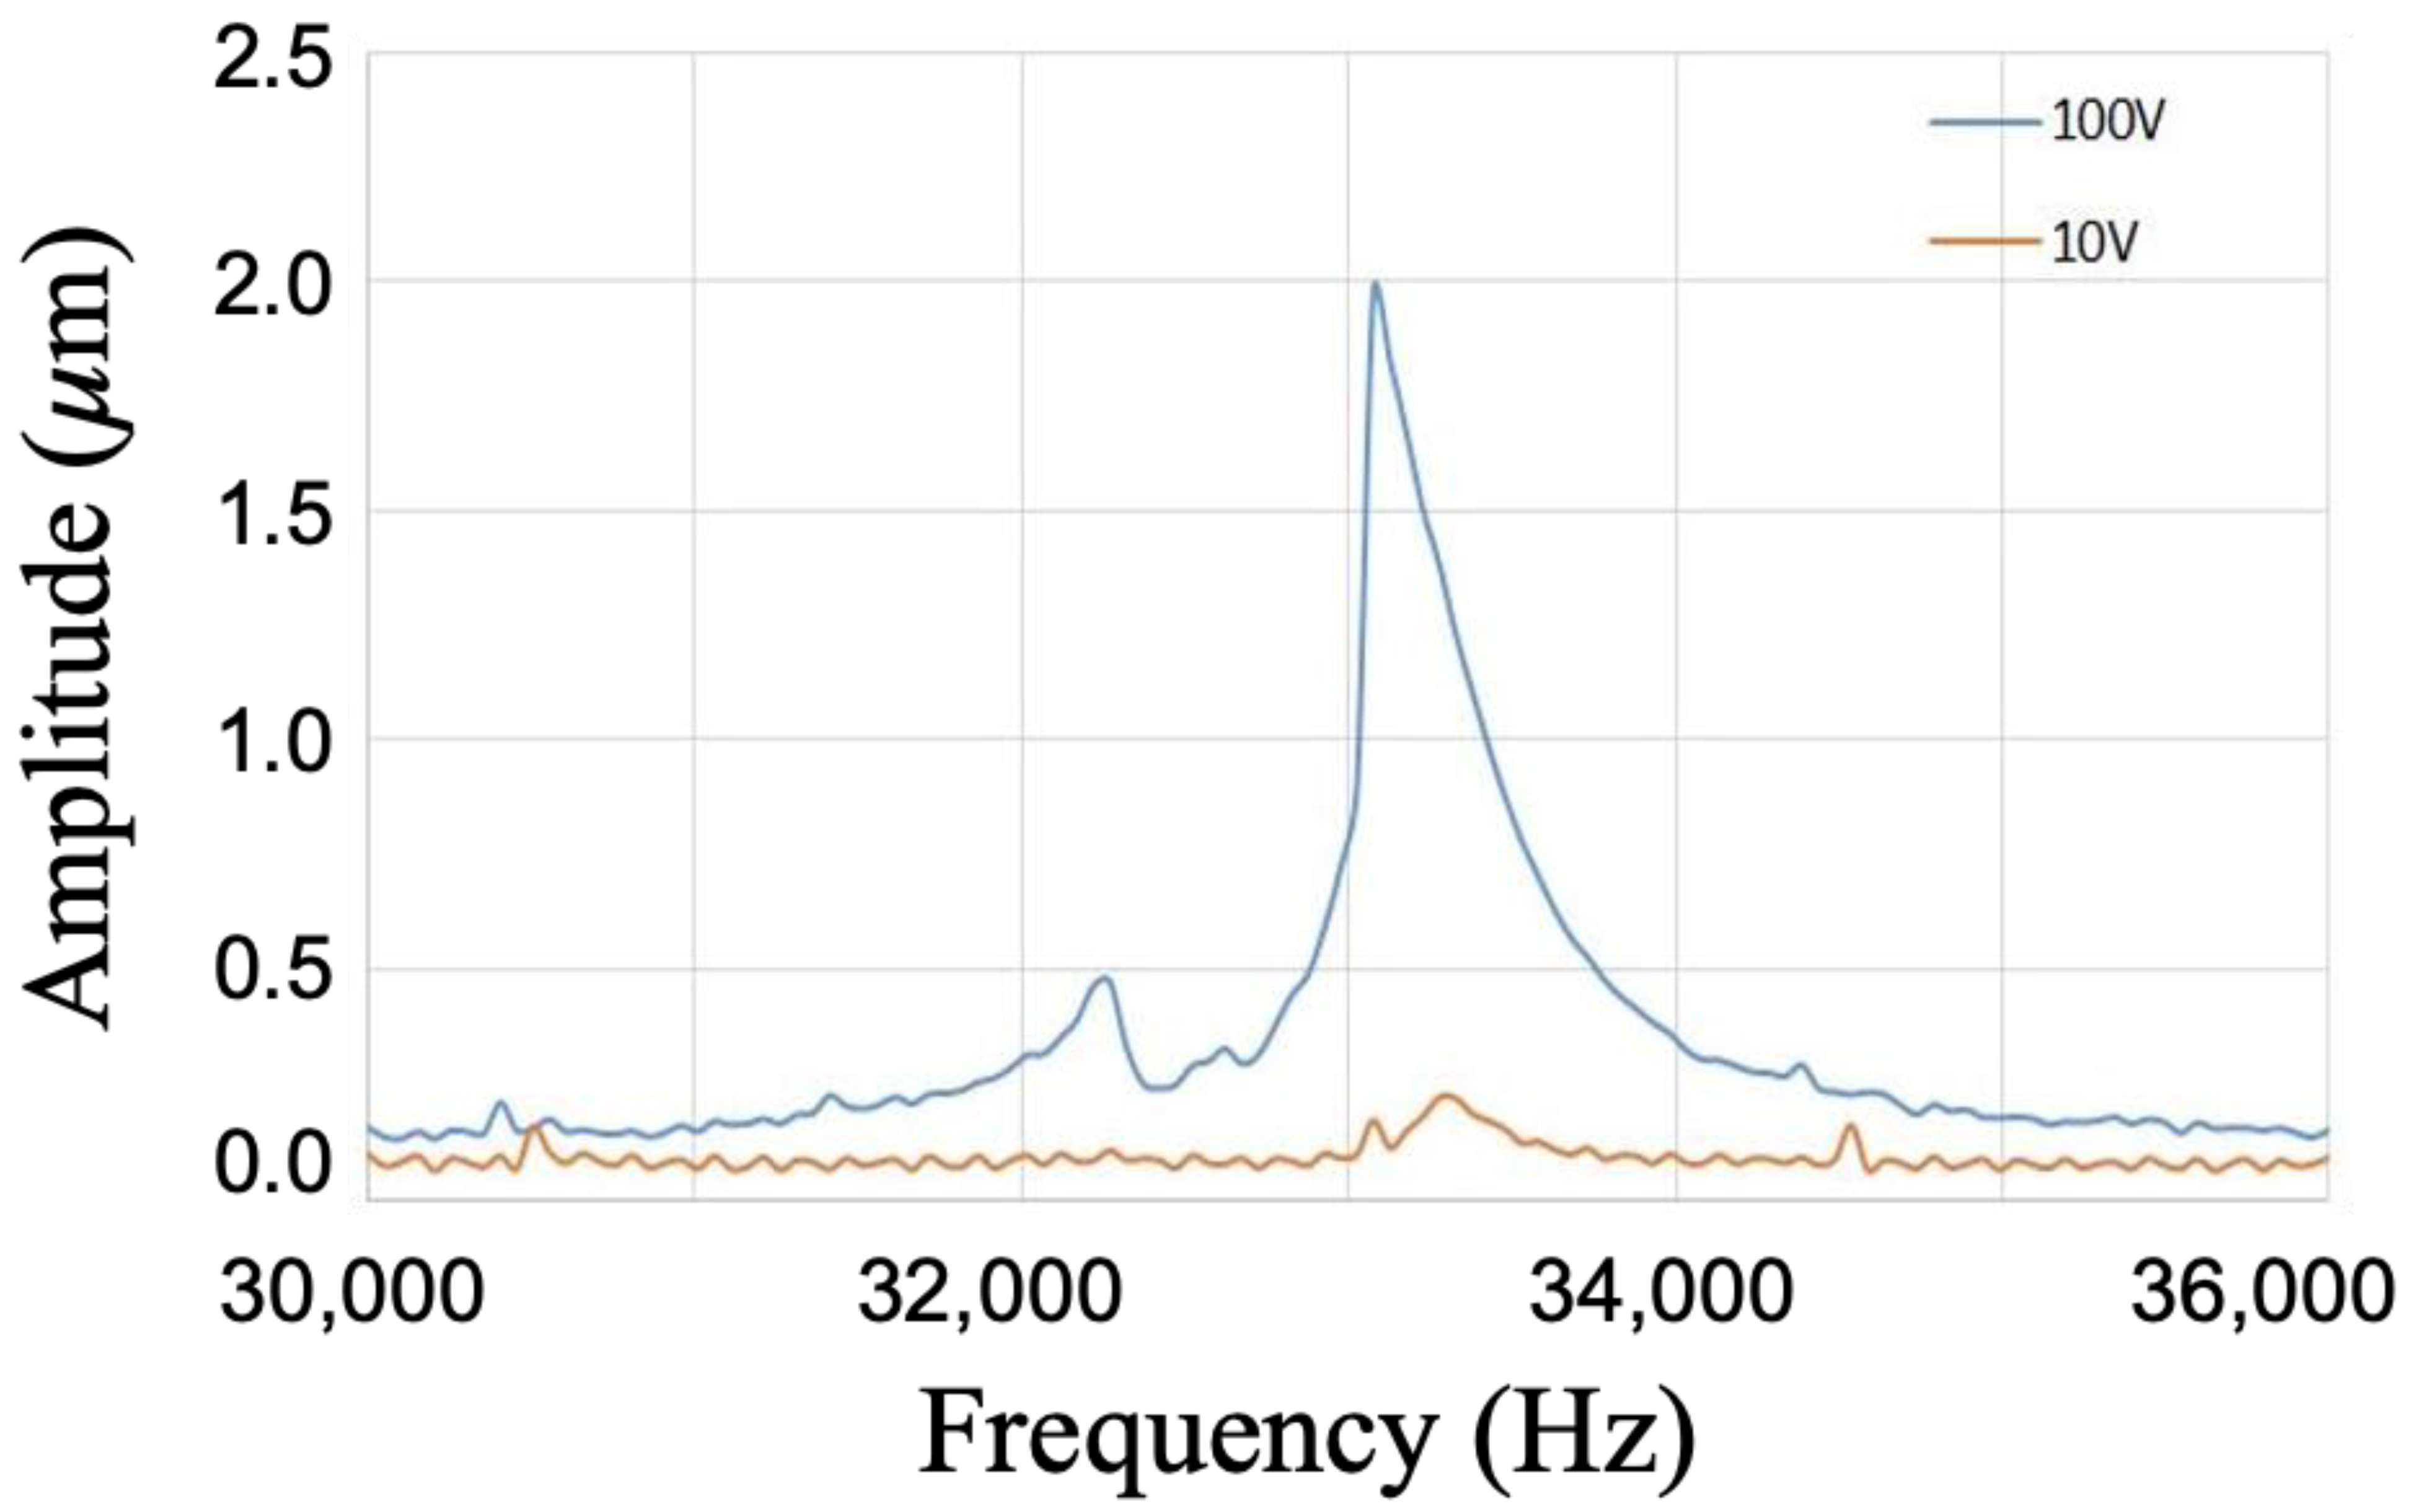
The amount of cavitation formed is dependent on the vibration amplitude of the transducer. Ultrasonic transducers are mass-spring-mass resonant systems and, therefore, operate at significantly higher output when tuned to resonance. To quantify the surface amplitude, we employed a surface vibrometer (OFV 5000/505, Polytec Inc., Irvine, CA, USA). This measurement was performed in air, not in water, due to the substantial mass of the transducer; we surmise that its amplitude remains consistent whether in air or water. We drove the transducer at a range of frequencies from 10 kHz to 40 kHz and found the resonant peaks. We ran the sweep at both 10 V and 100 V to observe the effects of nonlinear dynamics on the vibrating system, as shown in
Figure 6.
We found that the added mass of the slider mechanism did decrease the resonant frequency of the transducer from 40,000 Hz to about 33,200 Hz. The peak visibly tilts to the left, showing nonlinear softening behavior in the resonant system. This is important to note when tuning the system as the resonant frequency will decrease as the amplitude is increased, meaning a standard low amplitude analysis will not be correct in determining the resonant frequency at full power. Correctly tuning the system provided a 14× increase in amplitude versus non-resonant frequencies. Since this process takes a lot of time, we were only able to perform this detail of a resonance analysis for this 40 kHz transducer once with a heavy mass on the bottom, as shown in
Figure 2a.
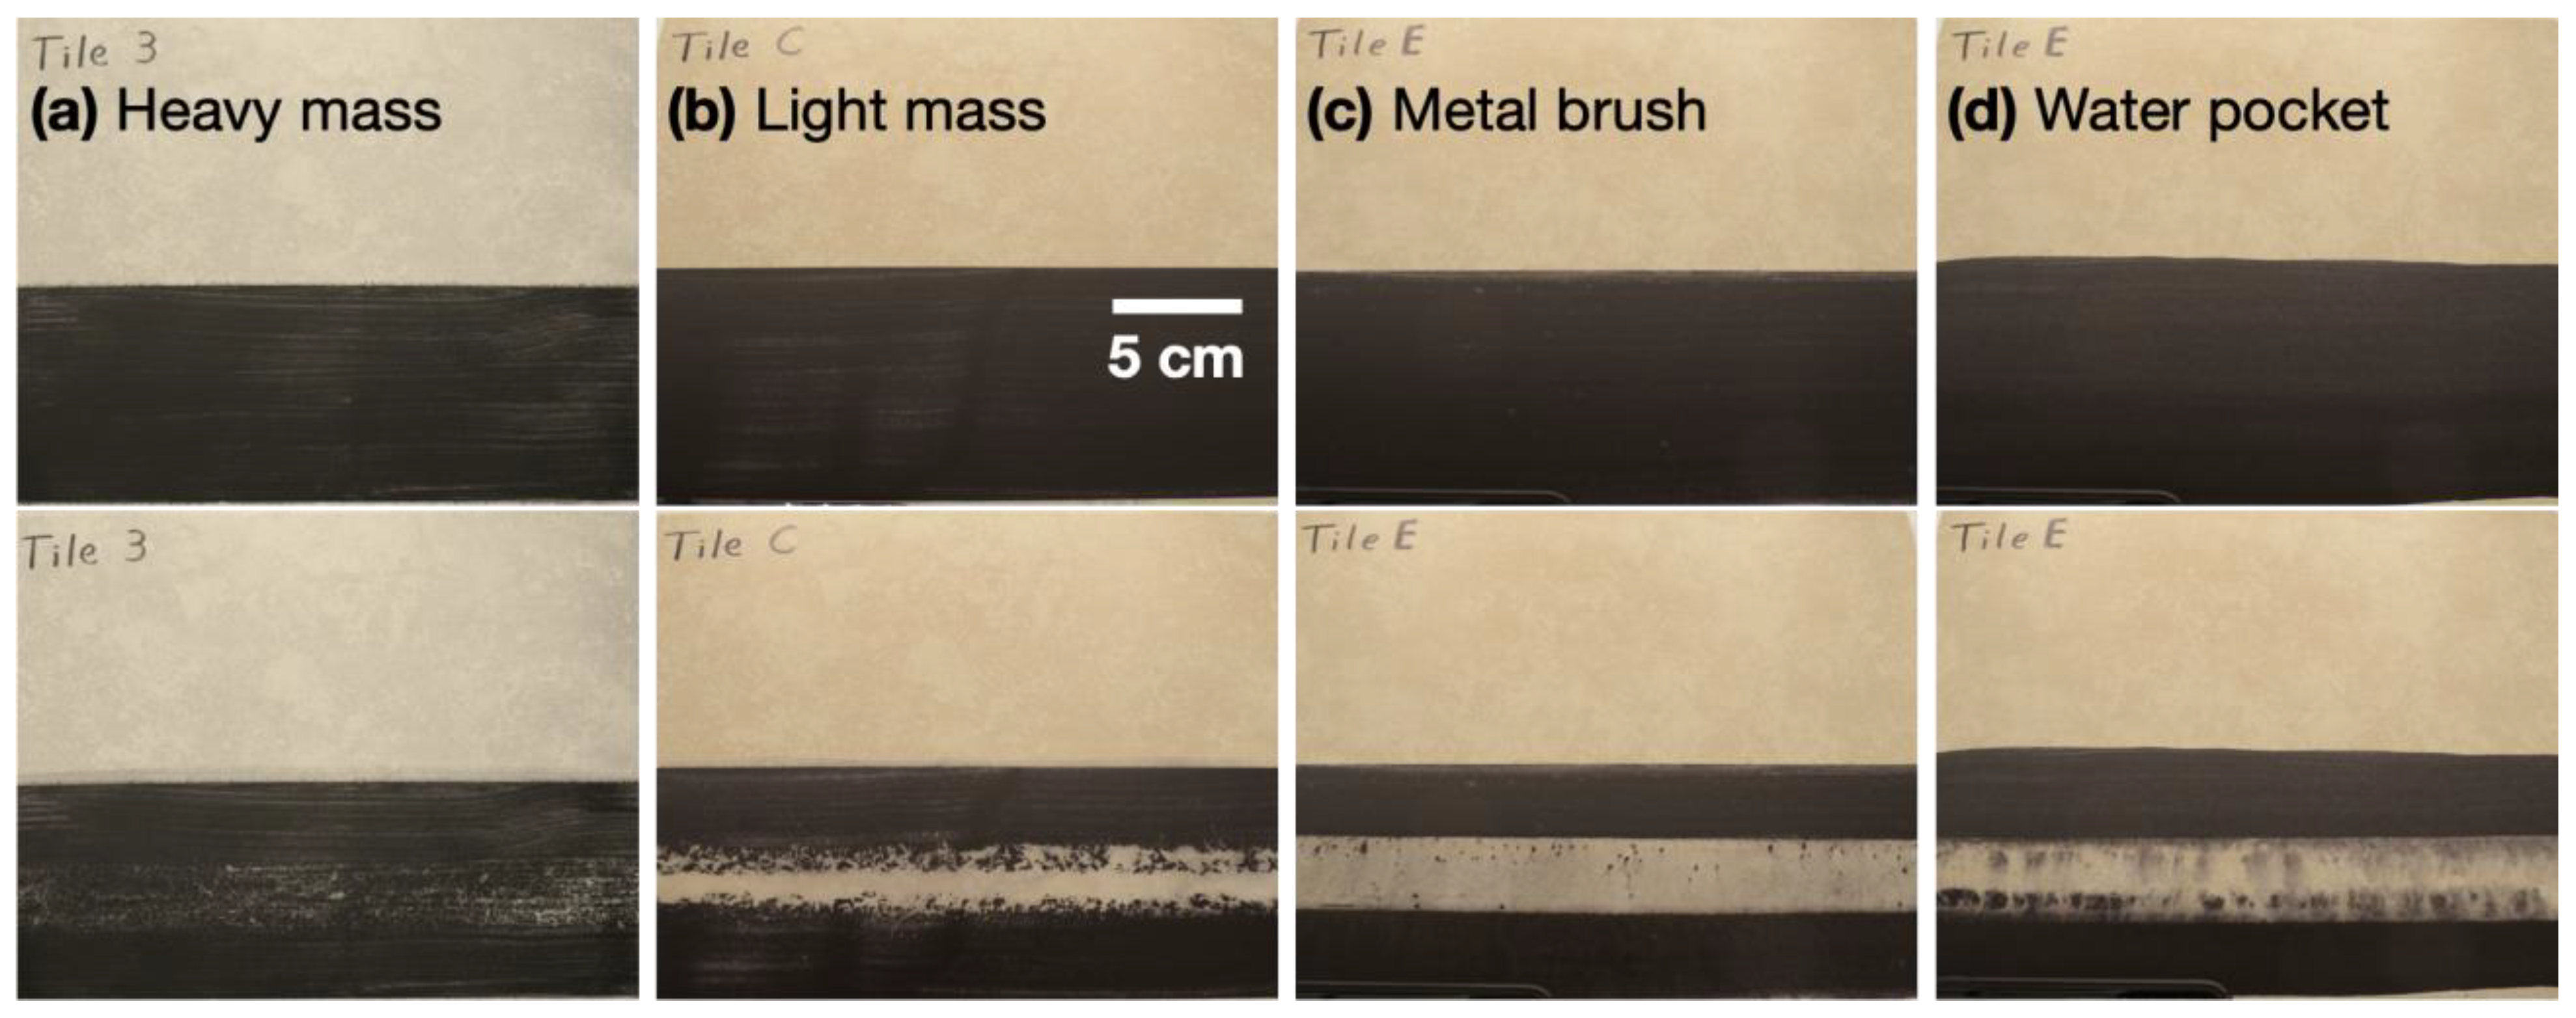
Figure 7 shows how the protein soil has been cleaned with various methods. The upper panel shows a tile with the protein soil before the cleaning test, whereas the lower panel shows the tile after the cleaning test. As described above, when the heavy mass is placed on the bottom, the transducer does not create strong vibrations. Hence, the tile does not get cleaned after the test, as shown in
Figure 7a. On the other hand, when the light mass is placed on the bottom, the tile gets cleaned quite well (see
Figure 7b). With the metal brush, it cleans the title relatively well.
Figure 7c shows that the dirt gets dispersed around the tile. Lastly, a transducer with a water pocket cleans the surface at the center region but leaves some dirt on the side. Even though the overall cleaning with the water pocket is not improved much, the water use is significantly reduced.
Figure 8 presents a sequence of images captured from a side view, detailing the disintegration process of a dirt particle under the effect of ultrasonic waves. In the first two images, we observe the liberation of a small dirt particle from the surface. As time progresses from 3.7 ms to 20.3 ms, multiple cavitation processes act upon the particle, gradually breaking it down and forming a nebulous cloud of smaller dirt fragments. This complex transformation is not only a reduction in size but also the particle being pushed upwards into the bulk fluid. Ultimately, the small particle continues to decrease in size until it virtually disappears, leaving behind a clear surface at around 22.2 ms. This intriguing process is further illustrated in a high-speed video provided in the
Supplementary Material.
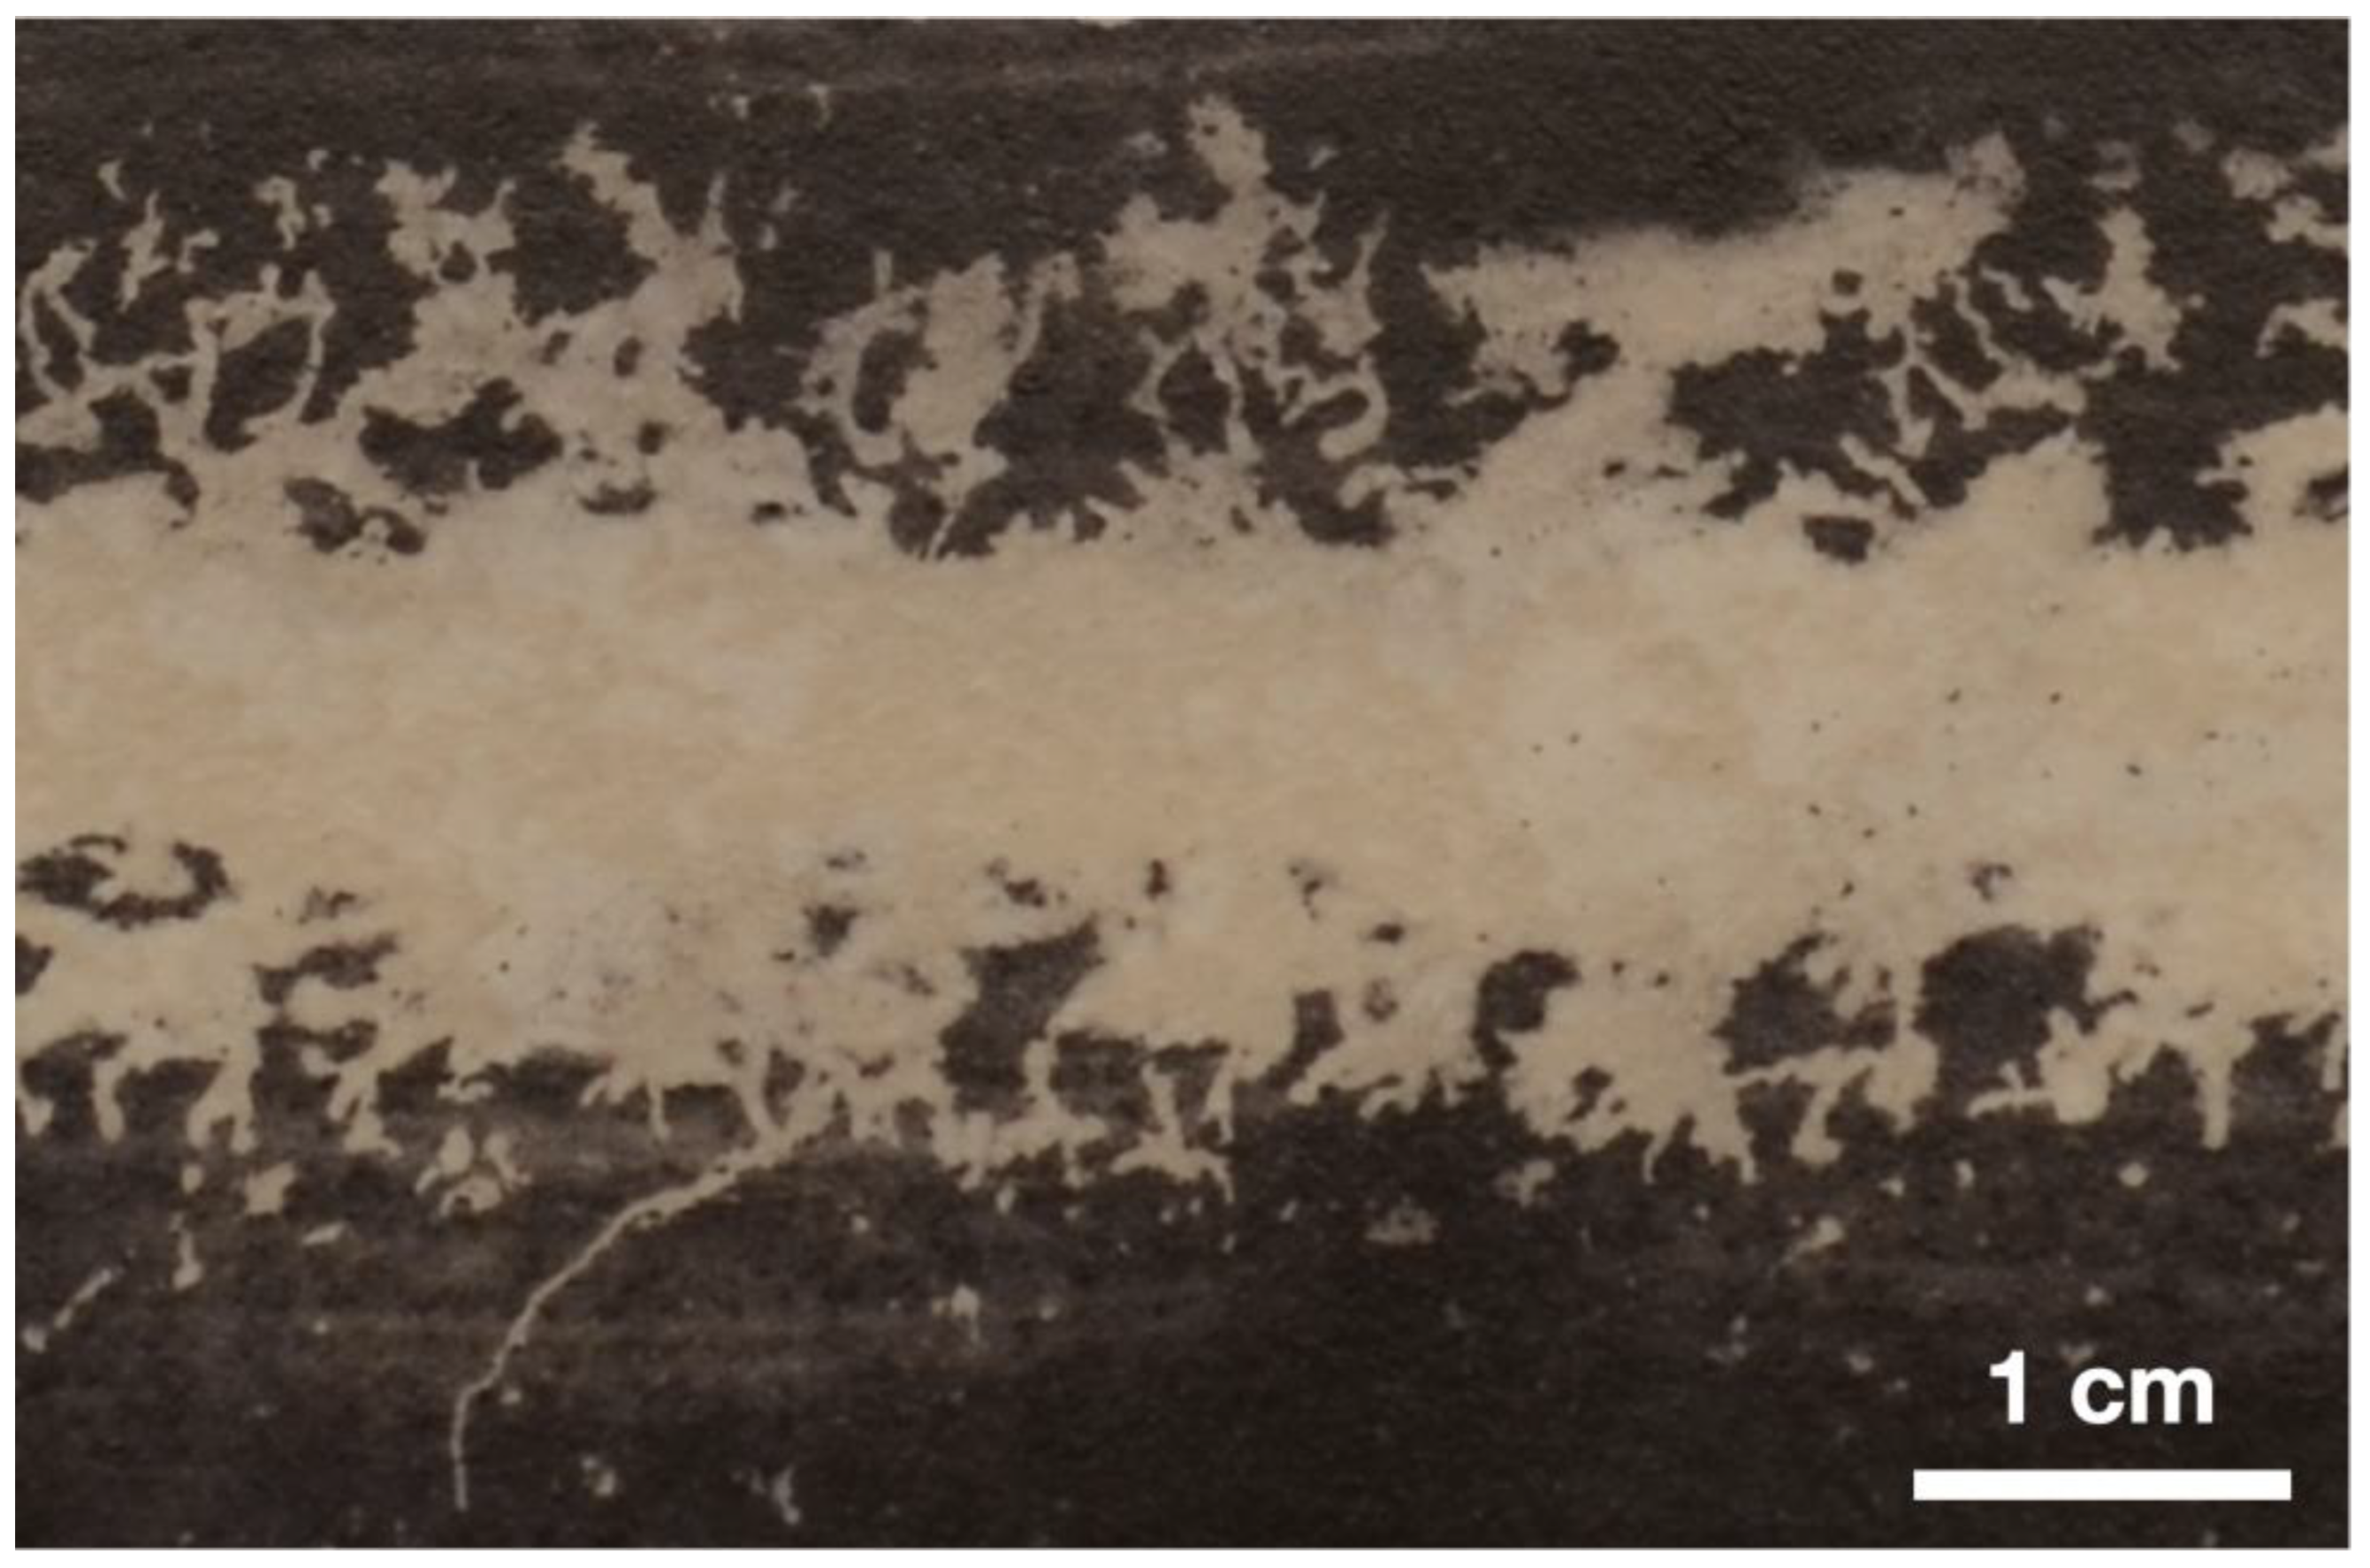
One interesting finding is a crack pattern when a transducer with a light mass on the bottom passes by.
Figure 9 shows the detailed structure/pattern of the removed protein soil. Such disjointed cleaned patterns are quite unique among all four configurations that we tested. We speculate that this pattern is a consequence of cavitation bubbles collapsing on the wall [
41]. Since the cavitation nucleation and collapsing are a random process, the location of cavitation cleaning is stochastic.
As indicated in
Table 1,
Table 2,
Table 3,
Table 4 and
Table 5, the performance of a transducer equipped with a heavy mass on the bottom is markedly deficient, failing to effectively clean the surface even when the transducer is active and microbubbles are injected. In contrast, all other tested configurations yield comparable cleaning performance, achieving around 60–70% surface cleanliness within the measured error bars. With the injection of microbubbles, there is a slight increase in cleaning performance, observing a rise from 2% to 9% with a heavy mass bottom and from 52% to 55% with a light mass bottom. However, given the large error, we cannot conclude whether the microbubbles significantly enhance the cleaning process or not. Though the cleaning performance is similar across these other configurations, a noteworthy distinction lies in the water consumption. Specifically, the design incorporating a water pocket dramatically reduces water use. While the necessary volume for the water pocket is a mere 3 mL, other configurations demand a significantly higher water volume, approximately 280 mL. This underlines the value of the water pocket design not just in terms of cleaning effectiveness but also in environmental sustainability.
4. Discussion
This research has successfully explored a practical design in floor cleaning by combining ultrasonic waves with pre-existing bubbles in a confined water pocket. While extensive scientific studies have been conducted on the impact of single or multiple cavitation bubbles in terms of erosion and cleaning, there has been limited research dealing with real tiled surfaces laden with dirt, especially when compared with other cleaning methodologies. The cleaning performance we achieved, particularly in configurations involving water pockets, highlights the potential of our method to redefine conventional cleaning techniques. Our experiments reveal a cleaning performance ranging from 60 to 70%, presenting a significant advancement in the field. Perhaps the most striking finding is the reduction in water usage when utilizing a water pocket configuration, where the necessary volume decreased from 280 mL to a mere 3 mL. This not only supports cleaning performance but also represents a meaningful contribution to sustainability. Additionally, our method’s ability to minimize surface damage in comparison with metal brushes offers a solution to a longstanding issue in ultrasonic cleaning, expanding the range of materials that can be safely cleaned. Moreover, the cost-effectiveness of the piezo-transducers used provides a potentially economical alternative for industrial cleaning applications.
Our study shows the promise of a method to clean surfaces through the combination of pressure waves with pre-existing bubbles, which offers promising results in terms of floor cleaning. This device does not require cleaning soap solutions to operate, which is an environmentally friendly option to clean surfaces. The study sheds light on an approach to conserve water during the cleaning process. The inception of a transducer embedded with a water pocket is quite novel, reducing water consumption significantly while maintaining optimum cleaning performance. It shows sustainable cleaning solutions, leading the way to eco-friendly advancements in cleaning technologies. The method’s success in removing embedded dirt and soil from flooring, along with its applicability beyond the semiconductor industry, holds significant implications for large-scale floor cleaning and adhered strains/dirt removal.
Several tasks remain for future work. First, we plan to quantify and visualize the effect of injected bubbles. First, we need to develop a method to count the number of microbubbles, a task that presents substantial challenges due to two principal reasons. First, the bubbles are injected using a pump and quickly disperse in water. Many bubbles are pushed out from a thin gap between the transducer and the surface. Secondly, as the transducer slides along the surface, some bubbles manage to enter the small spaces, while others are forced out due to the motion. As of now, we have not observed any notable differences in the structures of cavitation.
Furthermore, it is crucial to identify resonance on different transducers. At present, we have determined the resonant frequency on a bare 40 kHz transducer and have applied this to other transducers, assuming that minor modifications will not alter its resonant frequency. However, confirming the resonant frequency of all the different transducers is essential to ensure the accuracy and reliability of our findings. Moreover, a thorough study should be conducted on acoustic impedance matching related to epoxy, drilled holes, and affixed metal brushes, as these modifications, depending on their magnitude and dimensions, could potentially alter the outcomes.


