Abstract
The utilization of a rigid and projecting surface, coupled with an agitator and vortex generator, frequently results in the dissipation of more energy than the production of turbulence that meets the required criteria. By contrast, a passively oscillating flexible protruding surface can generate a greater turbulence level. In the current study, a circular finite cylinder (cantilever) was used as the geometry of the rigid and protruding surface. Both the material and the aspect ratio were varied. Also, a local Reynolds number within the subcritical flow range (102 < ReD < 105) was considered. The results from the rigid protruding surface (finite cylinder) serve as a validation of the published results and a benchmark for the improvement of the turbulence generated by the flexible protruding surface. The results obtained via an ultrasonic velocity profiler have further demonstrated that the flexible cylinder is capable of generating greater turbulence by examining the turbulence intensity, the turbulence production term and the Reynolds stress. All the flexible cylinders that oscillate show an increase in turbulence production but at different percentages. The cylinders studied in this work ranged from the least structural stiffness (EVA) to moderate (aluminum) and the highest structural stiffness (carbon steel). Through studying the normalized amplitude responses graph for the flexible cylinders, it is found that the oscillating motion does indeed contribute to the increment. A further examination of the results shows that the increase is due to the structural velocity instead of just the oscillating motion.
1. Introduction
The ability of vortex-induced vibration (VIV) to increase the strength of vortices shed through the vibration (e.g., see [1,2,3]) could promote the turbulence generated by a flexible protruding surface. Vortex shedding (typically a Kármán vortex) happens when flowing past a bluff body. Under conditions where the structure is rigid enough (high stiffness), to resist the different pressure distribution on the structure caused by the unsymmetrical vortices, it experiences little to negligible motion (oscillation or vibration as their meaning are interchangeable in this context). It is the same for rigid protruding surfaces, as some portion of the oncoming fluid loses kinetic energy as it meets the rigid protruding surface. Given a flexible body with low Young’s modulus properties and a geometry with a low second moment of area, the bending stiffness will inherently be lower. Therefore, a smaller fluid force is needed to drive the vibration for the VIV to happen.
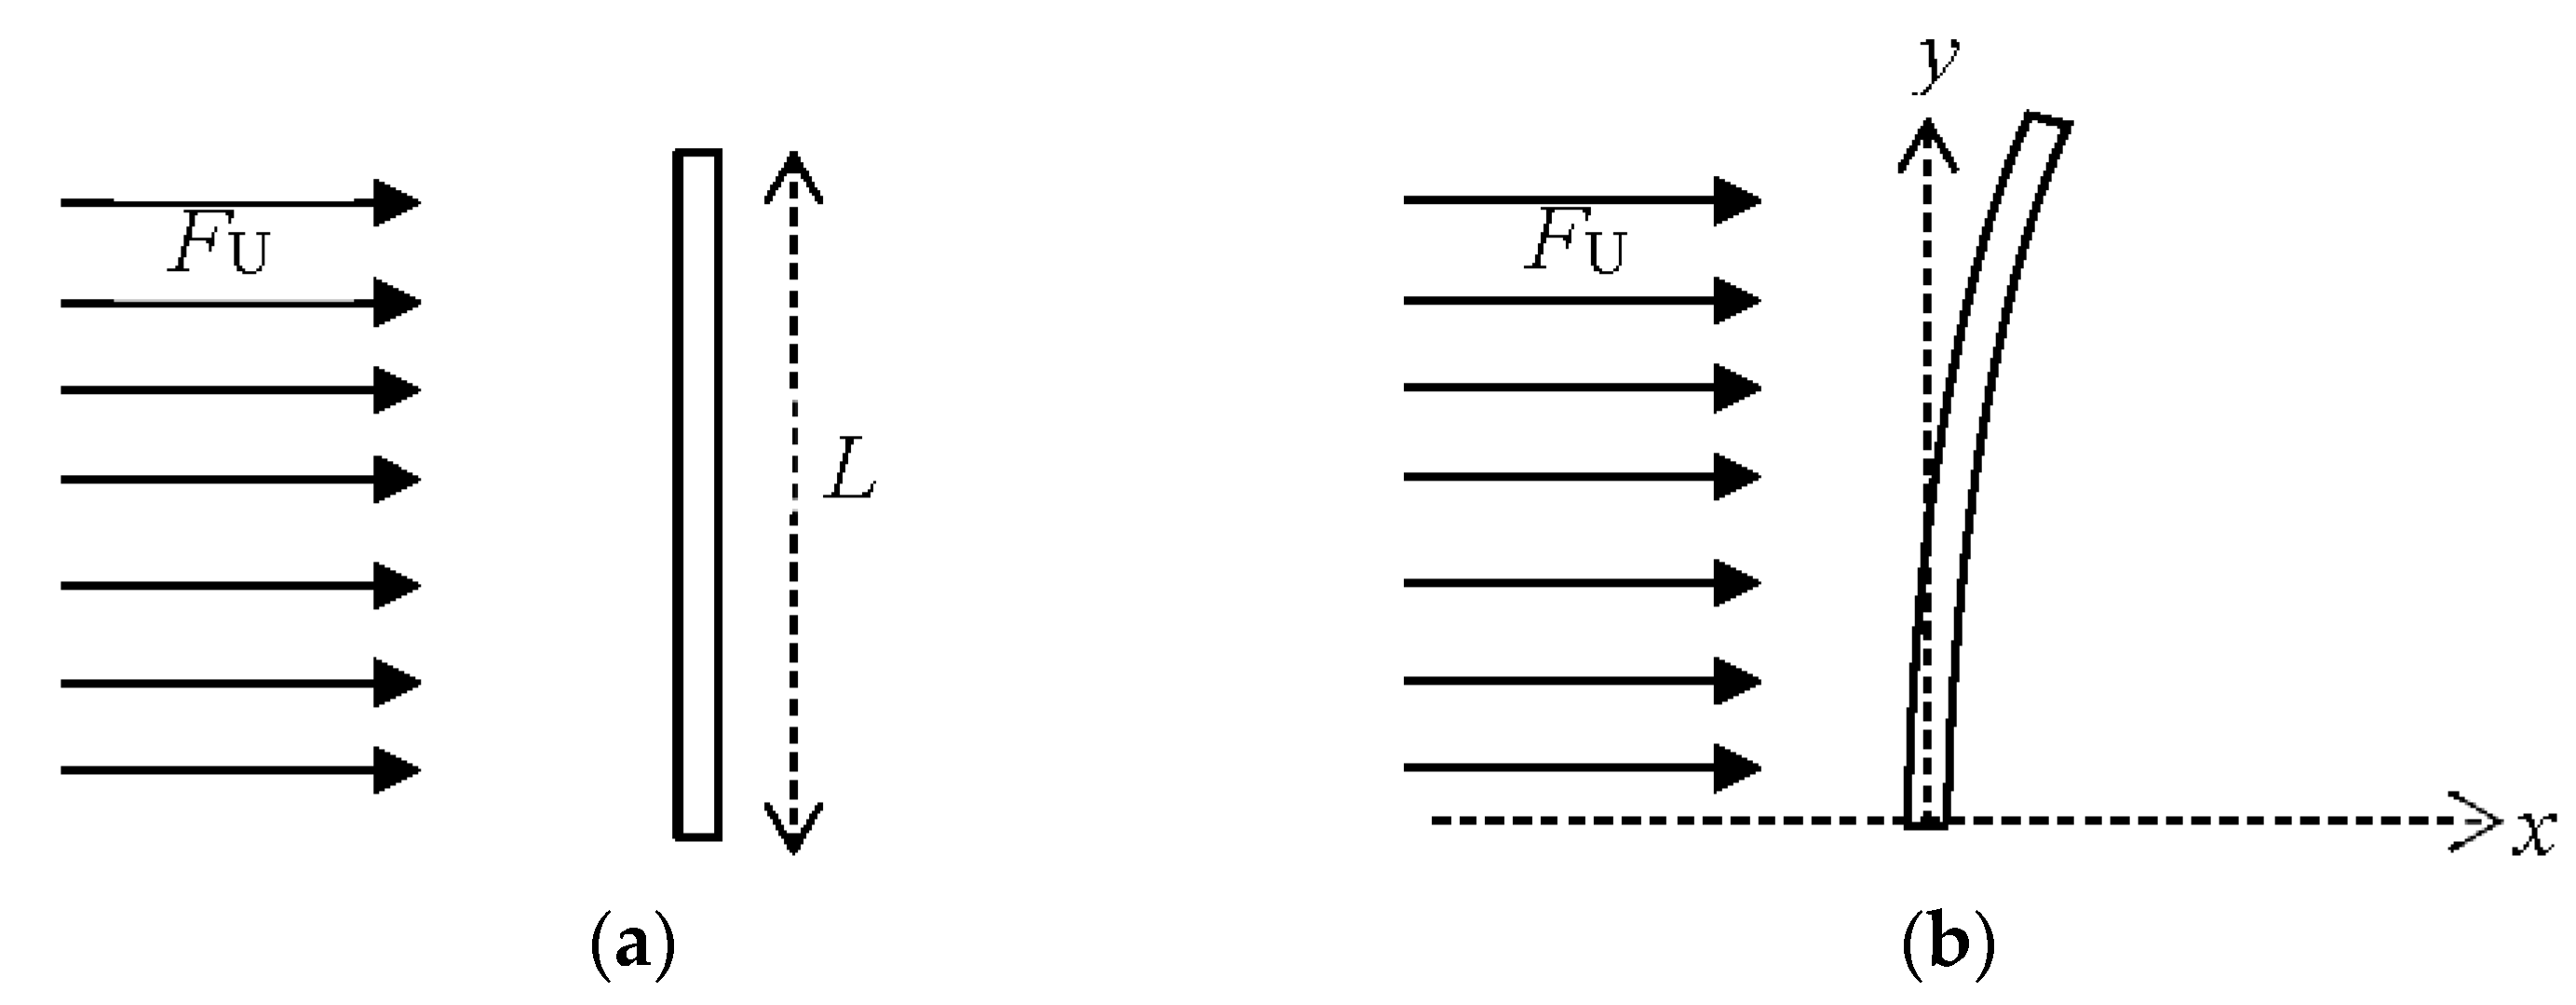
The main component that determines the flexibility or elasticity of a flexible cylinder is the structural stiffness, as shown in Figure 1. Stiffness relies on material properties and geometry. Therefore, it is the combination of the material’s Young’s modulus, E, and the element’s second moment of inertia, I.
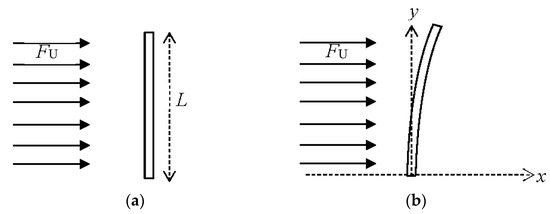
Figure 1.
(a) A rigid cantilever cylinder subject to fluid force, FU. (b) A flexible cantilever cylinder subject to fluid force, FU.
Under general situations, two types of vortex shedding can affect the oscillation mode of the VIV, one of which is perhaps more commonly known than the other—the Kármán vortex shedding. The Kármán vortex street consists of alternately shed vortices due to the asymmetric vortex shedding behavior. It is the asymmetric vortex shedding behavior that alters the pressure distribution on the surface of each side of the cylinder, thus leading to the vibration of the cylinder in transverse direction to the flow. This type of vibration is also widely known as cross-flow motion. The second type of vortex shedding is the symmetric vortex shedding. As the name suggests, it consists of a pair of symmetrical vortices when shed in one cycle. The vibration mode of this shedding is in-line or parallel to the flow, hence the name of in-line VIV. Under certain conditions, in-line VIV accompanied by symmetric vortex shedding may occur at lower flow velocities than the Kármán vortex shedding [4]. Another type of shedding that would happen in addition to either the Kármán vortex shedding or symmetric vortex shedding is the tip vortex shedding. It happens whenever the free end of the cylinder is exposed to the flow. These tip vortices are generally shed at a frequency one-third of the Kármán vortex shedding and may cause large-amplitude vibrations.
The back and forth motions, which are lift and drag, are due to vortex shedding at which the vortex shedding frequency, fs, is close to the cylinder’s natural frequency, fn, at the velocity. The Strouhal number, St, is the frequency of the excitation force in the lift direction whereas the frequency of the excitation force in the drag direction is normally two times that in the lift direction. The lift force can be explained as a group of vortices shed to one side of the cylinder once per cycle and then the other side. The lift force, which appears when the vortex shedding starts to occur, causes the cross-flow motion (perpendicular to the fluid flow direction). Similarly, the drag force appears as a result of vortex shedding but with all vortices shed downstream. In-line motion (in the same direction as the fluid flow) of the cylinder is caused by drag force. Since all the vortices are shed downstream of the cylinder in the drag direction, the drag force associated with vortex shedding occurs at twice the frequency of the lift force, as explained by [5].
Higher amplitudes of vibration in the cross-flow direction have been documented by various experimental results in [5,6]. When the amplitude reaches its maximum, lock-in is said to happen. Lock-in occurs when the natural frequency of the structure, fn, is in proximity to the vortex shedding, fv, or in mathematical expression, = 1. Both frequencies synchronize and large-amplitude vortex-induced structural vibration can occur. The vortices in lock-in conditions can pack a colossal amount of energy. Besides the increase in vortex strength, consequences of lock-in are also an increase in correlation length, in-line drag force and lock-in bandwidth; all of which increase maximum amplitude. The lock-in bandwidth was found to increase with increasing response amplitude [7]. It is easy to see that lower-mass-ratio cylinders require less energy to vibrate because they are lighter compared to higher-mass-ratio cylinders. Thus, they can achieve the maximum amplitude (lock-in) more effortlessly in a wider range of reduced velocity, as opposed to the higher-mass-ratio cylinders.
The wake structure differs according to the critical aspect ratio. The AR of the cylinder is defined by its length over diameter ratio, AR = L/D. From various studies by several authors, the value of the critical aspect ratio seems to be sensitive to experimental conditions, especially the relative thickness of the boundary layer [8,9]. The critical aspect ratio varied from 1–7 in many studies, which is a wide range. When a cylinder at a very low AR is immersed in an atmospheric boundary layer, the vortex formation length, the width of the near wake and the value of the Strouhal number at mid-height are reduced, comparable to the case of the small relative thickness of the boundary layer [10,11]. Liu et al. [12] supported that a two-dimensional region exists when the AR is greater than the critical aspect ratio but the area of the two-dimensional region decreases when the Re increases. It should, however, be noted that the range of the critical aspect ratio is only loosely defined based on the observation of the wake structure. It can be seen that the critical aspect ratio is sensitive and scales with the boundary layer thickness and Re because the AR has to be large enough to sustain the two-dimensional region. A low AR or an AR lower than the critical aspect ratio that is put in a higher Re and a thicker boundary layer signifies that the region of free end effects will engulf the whole span of the cylinder, suppressing the two-dimensional region.
Tip vortices are known to have more turbulent energy than the regular Kármán vortices. The turbulence intensity has also been reported to increase considerably at the free end of the cylinder. In the recent work of [13], they demonstrated that the streamwise turbulence intensity (u′/U) and wall-normal turbulence intensity (w′/U) are indeed higher at the free end and within the recirculation region on the wake centerline (y/D = 0). On the other hand, Park and Lee [14] also showed in their results that the turbulent kinetic energy is at its highest level at the free end for the cylinder of AR = 6 at ReD = 7500. Rostamy et al. [13] noticed that the elevated turbulence intensity extends into the downwash region. One noticeable distinct pattern that separates the cylinder of AR = 3 from the rest is that the location of the highest wall-normal turbulence intensity moves downward and further away to a distance of x/D = 2. The location of the highest wall-normal turbulence intensity appears to remain at x/D < 2 as the AR of the cylinder increases.
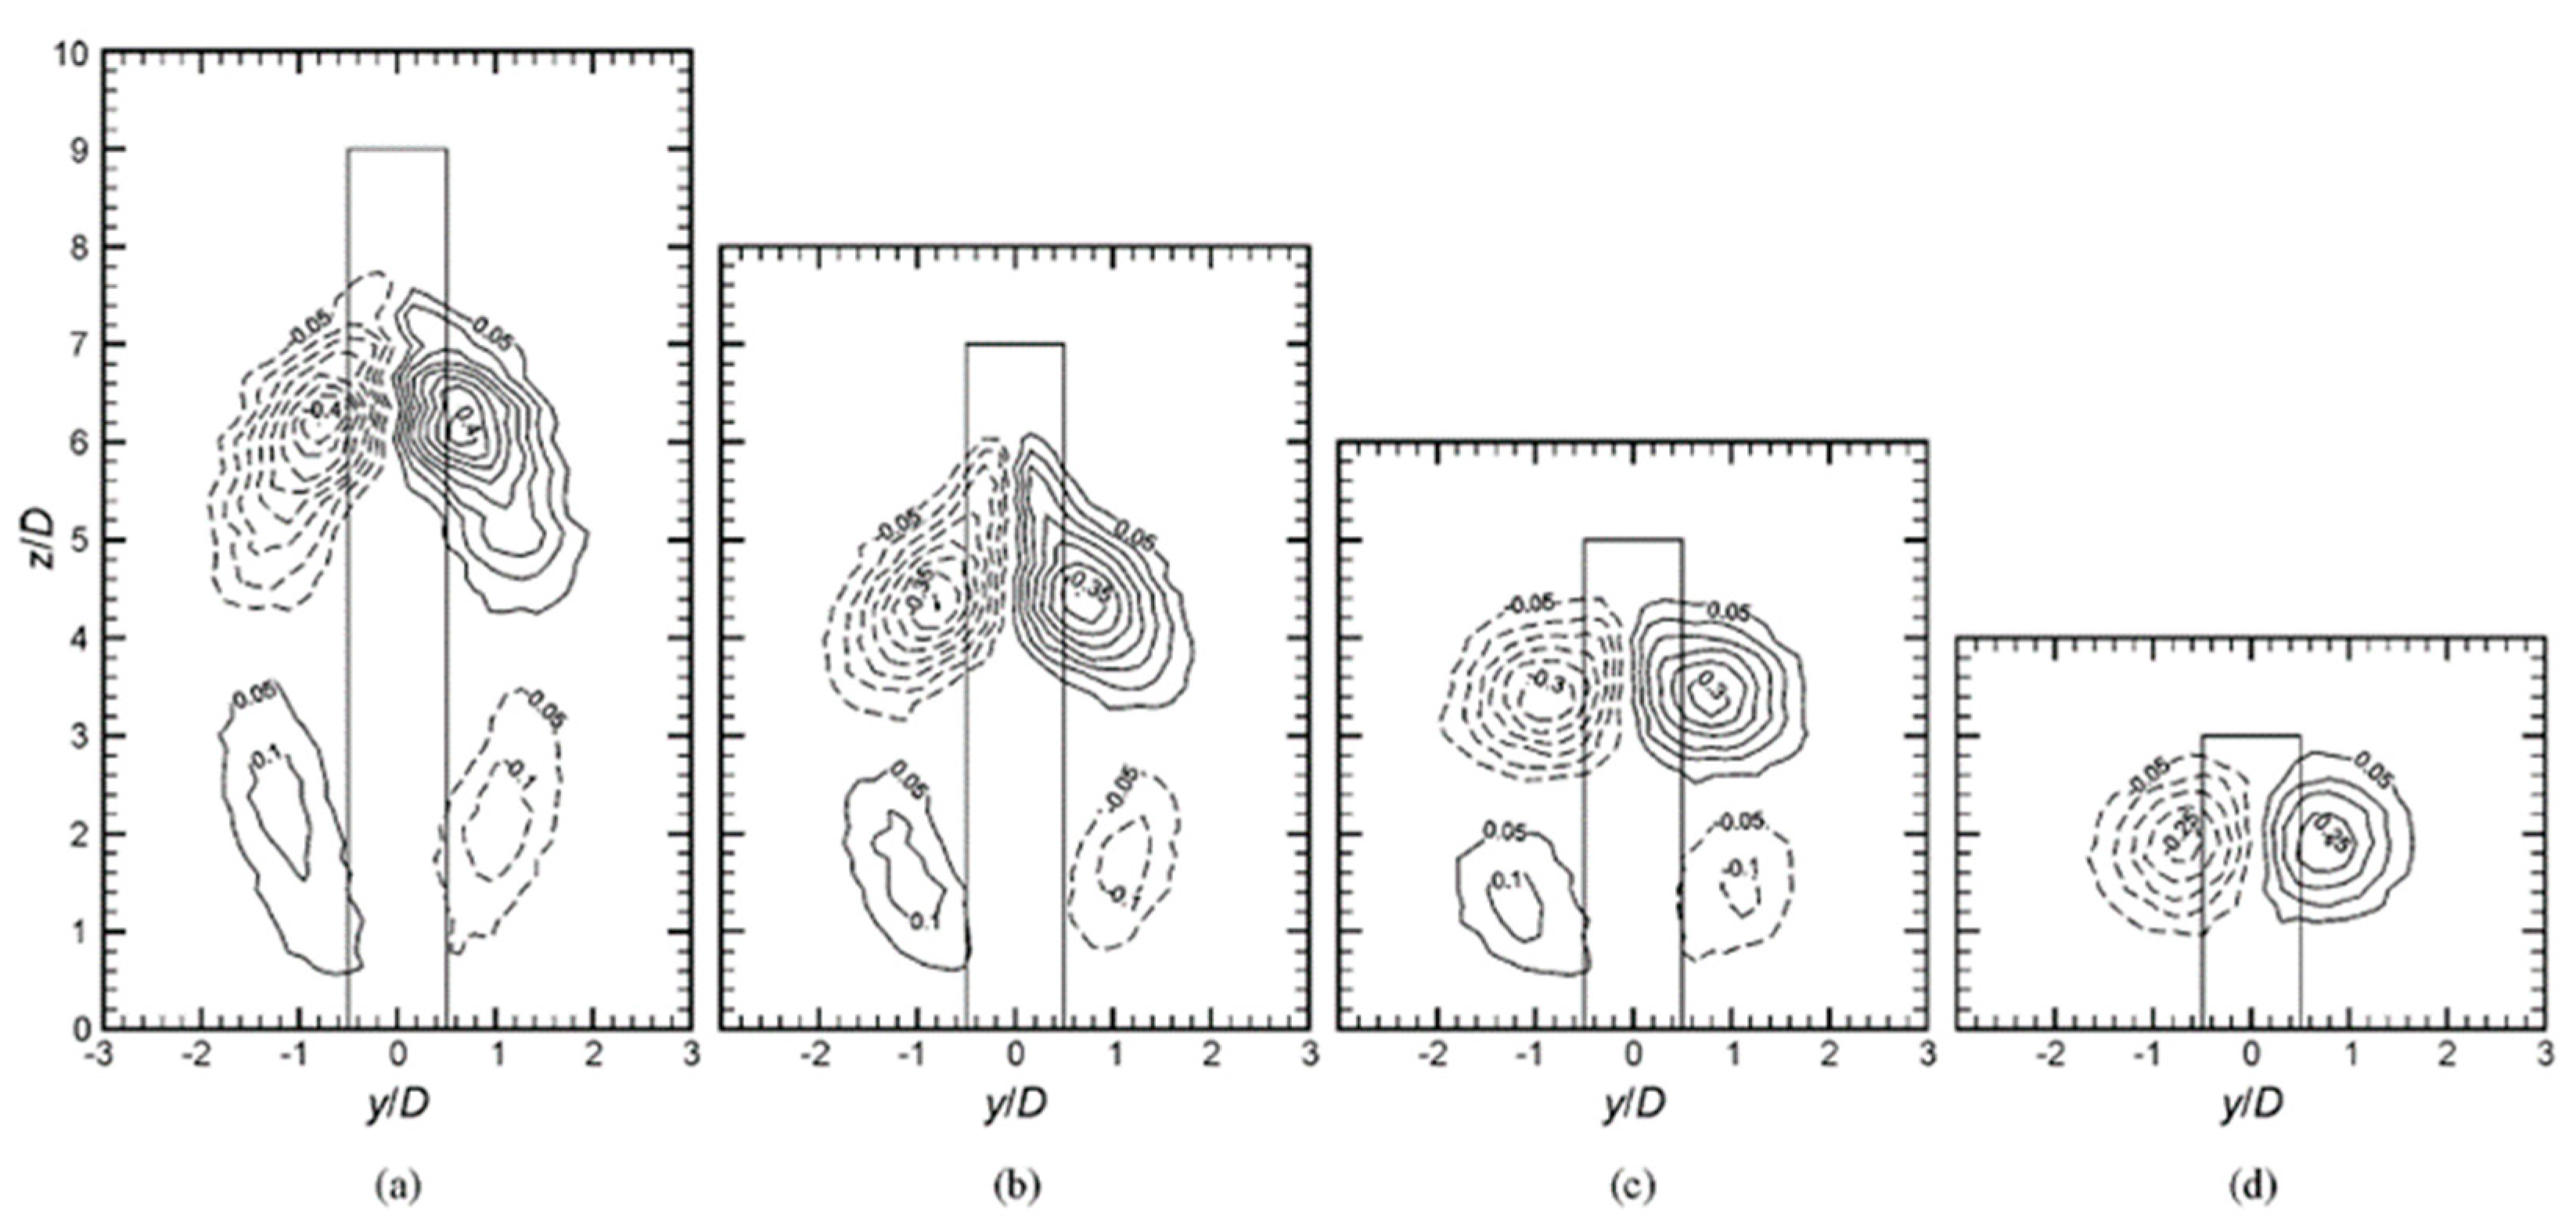
Similarly, the Reynolds shear stress (-) was also reported to be at a higher value in the experimental work from [13]. They noticed a region of positive shear stress and a region of negative shear stress at an evaluated value near the wake region. However, the region of positive shear stress is absent below the free end, leaving only the region of negative shear stress for a cylinder of AR = 3. On the contrary, the positive shear stress dominates the region just below the free end for AR = 9 but slowly decreases in size and level as the AR decreases until it disappears at AR = 3. In their results, the Reynolds shear stress is found to be at its highest for a cylinder of AR = 9 with a peak at 0.018. However, the Reynolds shear stress decreases as AR decreases. Additionally, according to Figure 2, ref. [8] also showed in their experimental results that the vorticity contour is immensely elevated near the free end. Thus, the tip vortices can greatly improve the quality of mixing. However, due to the downwash phenomenon that is always present at the free end, the tip vortices are always brought downwards to the ground plane. Therefore, its influence could only impinge on the fluid in the very near wake. The mean velocity, turbulence intensity and Reynolds shear stress distributions are similar for cylinders above the critical aspect ratio but dissimilar for cylinders below the critical aspect ratio [15].
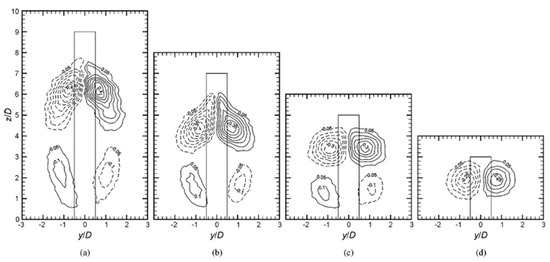
Figure 2.
The non-dimensional, time averaged, streamwise vorticity field at x/D = 6. (a) AR = 9, (b) AR = 7, (c) AR = 5 and (d) AR = 3. Vorticity contour increment is 0.05 and minimum vorticity contour is ±0.05, solid lines represent positive counter-clockwise [15].
The Reynolds normal () and shear () stress of a flexible cylinder have also been reported by [16] to increase significantly compared to that of a rigid cylinder. They first investigated the Reynolds shear stress of a rigid cylinder and compared it with the results from [17]. The periodic parts of Reynolds normal and shear stress of both studies are a near match though that of the experiment conducted by [17] was much higher at Re = 140,000. The peak total Reynolds stress is, however, much higher for the higher Re experiments. Govardhan and Williamson [16] therefore concluded that the periodic part of Reynolds stress, which is generated from the repeatable large-scale coherent structures, holds true over the range of Re = 3900 to 140,000. As the other component of total Reynolds stress—the random part of Reynolds stress—gains strength from the increasing strength of the Kelvin–Helmholtz instability of the separating shear layer as Re increases, the total Reynolds stress value increases. They also compared the Reynolds normal and shear stress value of a vibrating cylinder to that of a rigid cylinder and found that the periodic part of Reynolds stress ()max increases by up to 485%, ()max increases by 100% and ()max increases by 125% in the lower branch.
It was shown in previous work [6,18,19] that the flexible cylinders bring significant changes to the turbulence in the near wake—the x deflection of the flexible cylinders increases the turbulence wake region, which effectively increases the region of turbulent activities—and the aspects of the structural motion such as oscillating amplitude, oscillating frequency and the oscillating motion can enhance the turbulence energy production as demonstrated by the production term (in the kinetic energy budget) and the Reynolds stresses. Despite the remarkable findings, they are unable to confirm which parameter(s) of the structural motion could affect the enhancement of turbulence energy in the near wake. It is therefore, this work mainly investigates the influence of different properties of the flexible cylinders to bridge the gap. As an effort to encourage an organized oscillating motion, materials such as aluminum and carbon steel with moderately high stiffness and low damping coefficient are employed in this study. The metal group flexible cylinders have a Reynolds number of 2500 due to the limitation of the highest possible freestream velocity the water tunnel could provide. Apart from that, AR = 12 and 14 of polymer-based EVA flexible cylinders at Reynolds numbers of 4000, 6000 and 8000 are also investigated in this work.
2. Materials and Methods
2.1. Experimental Analysis
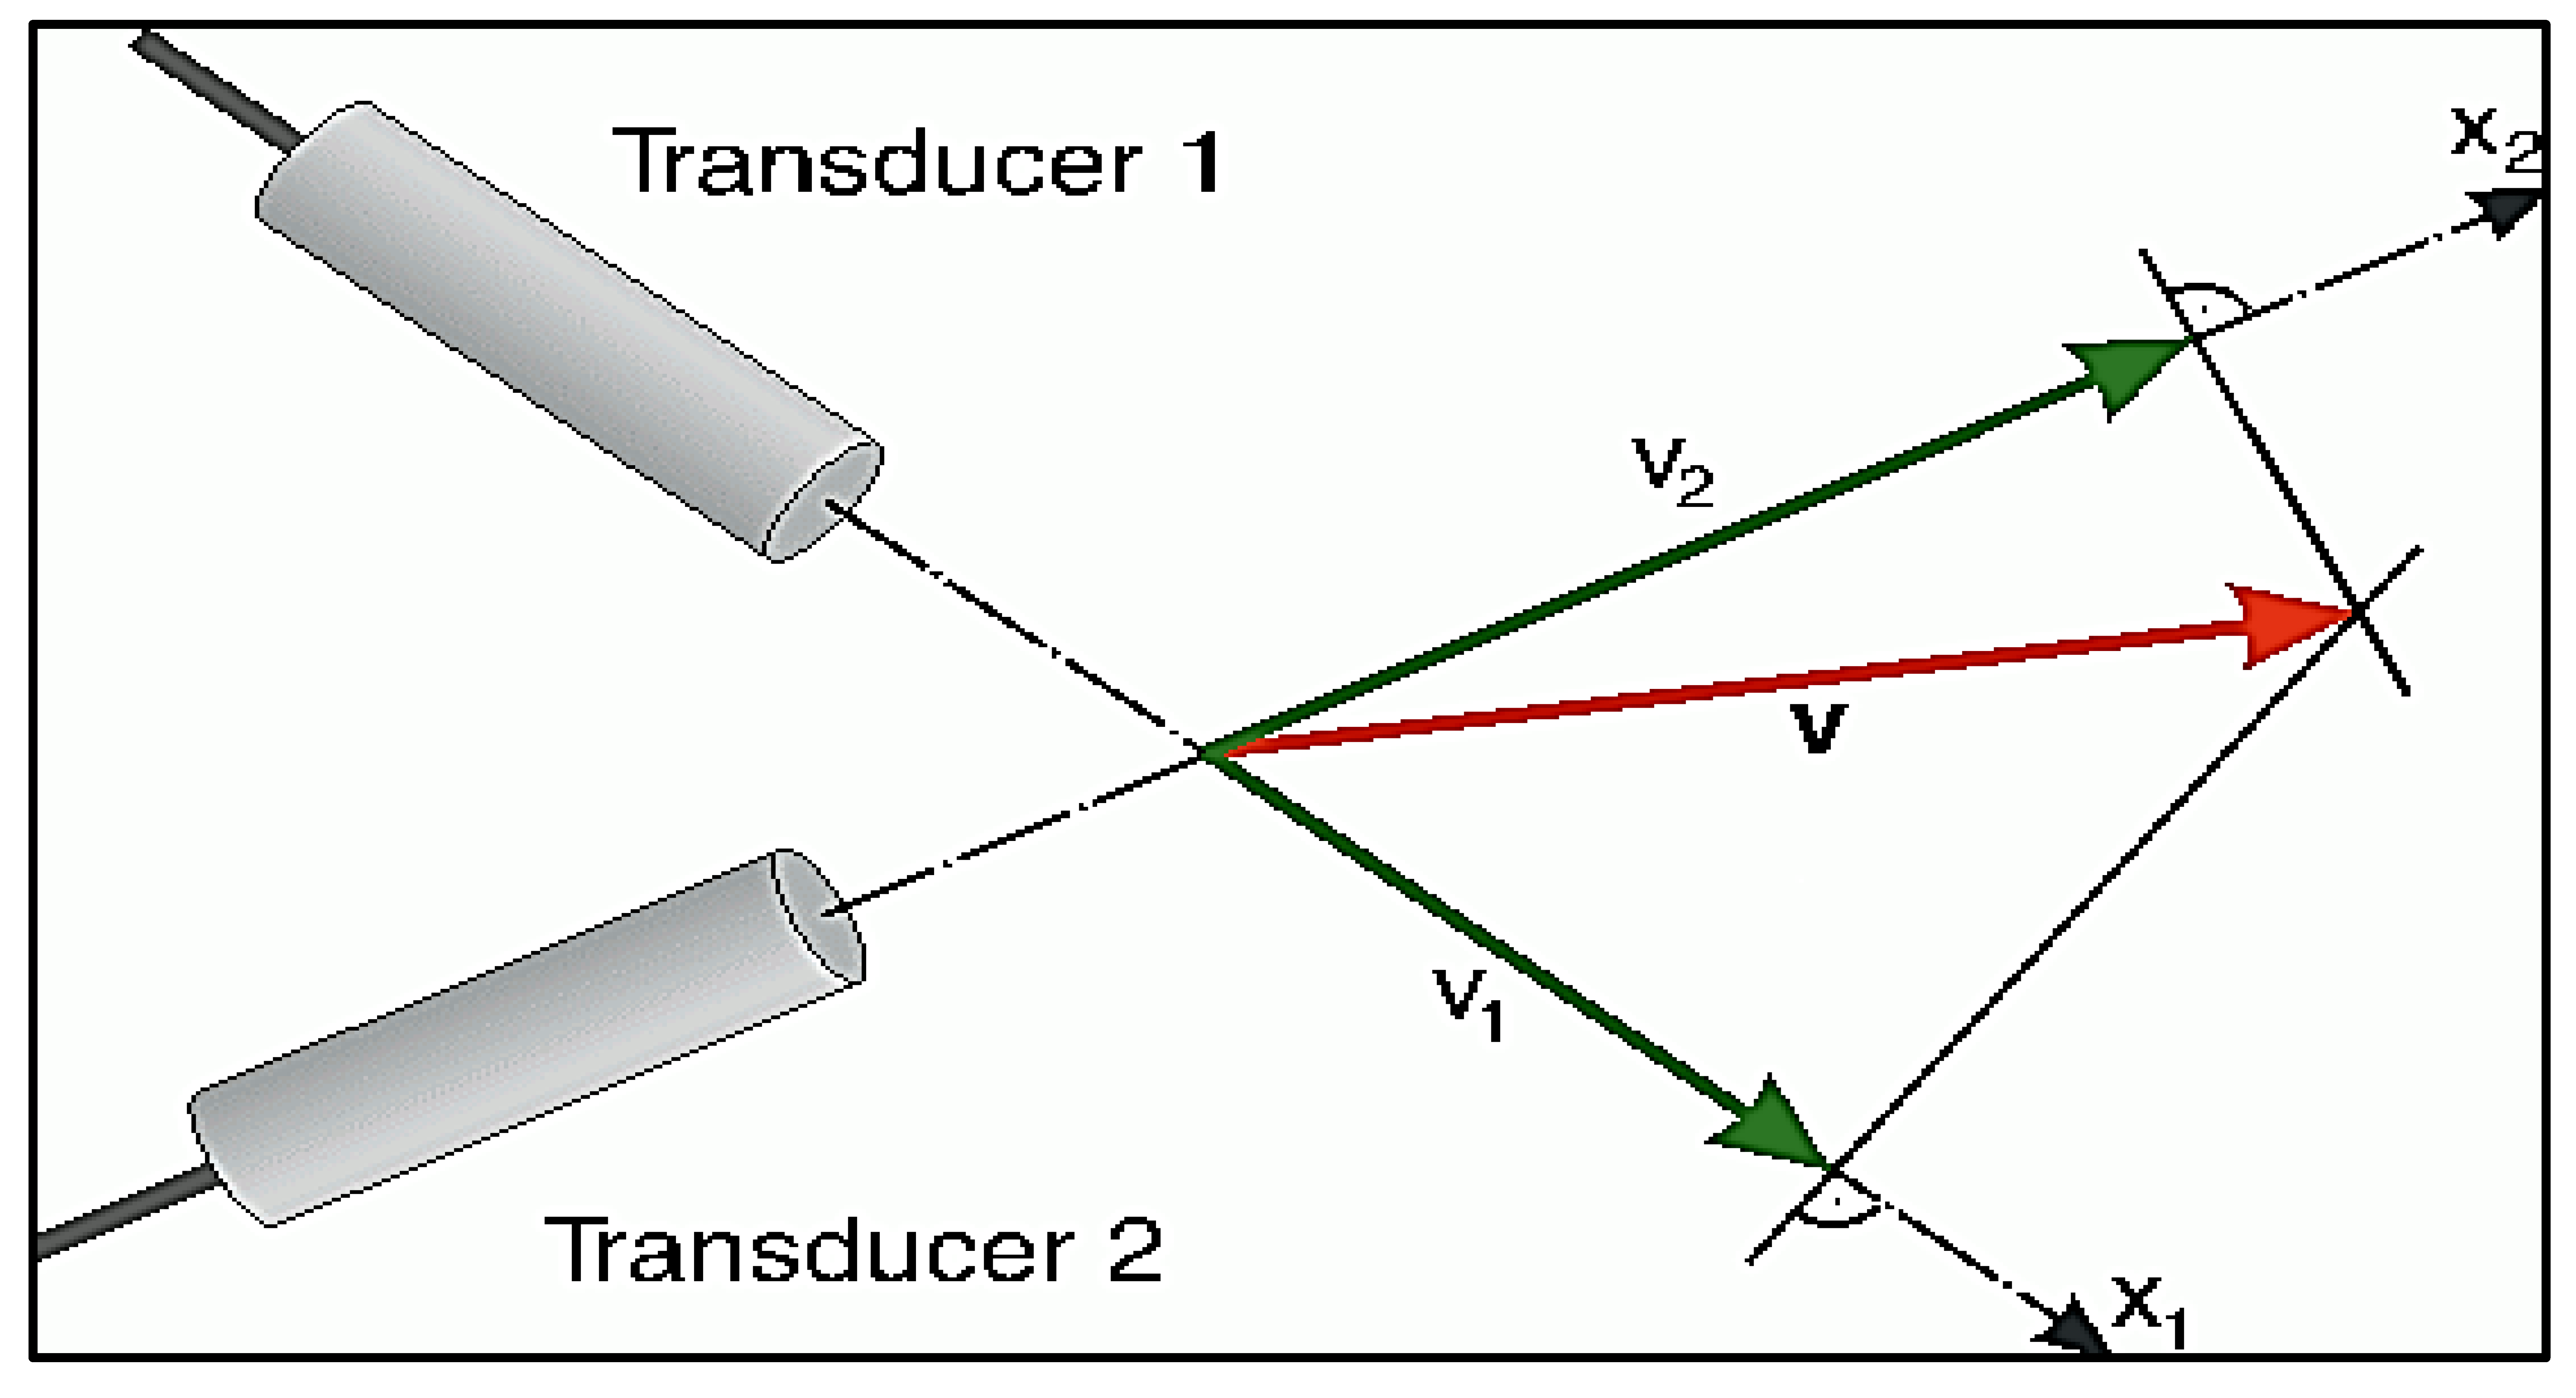
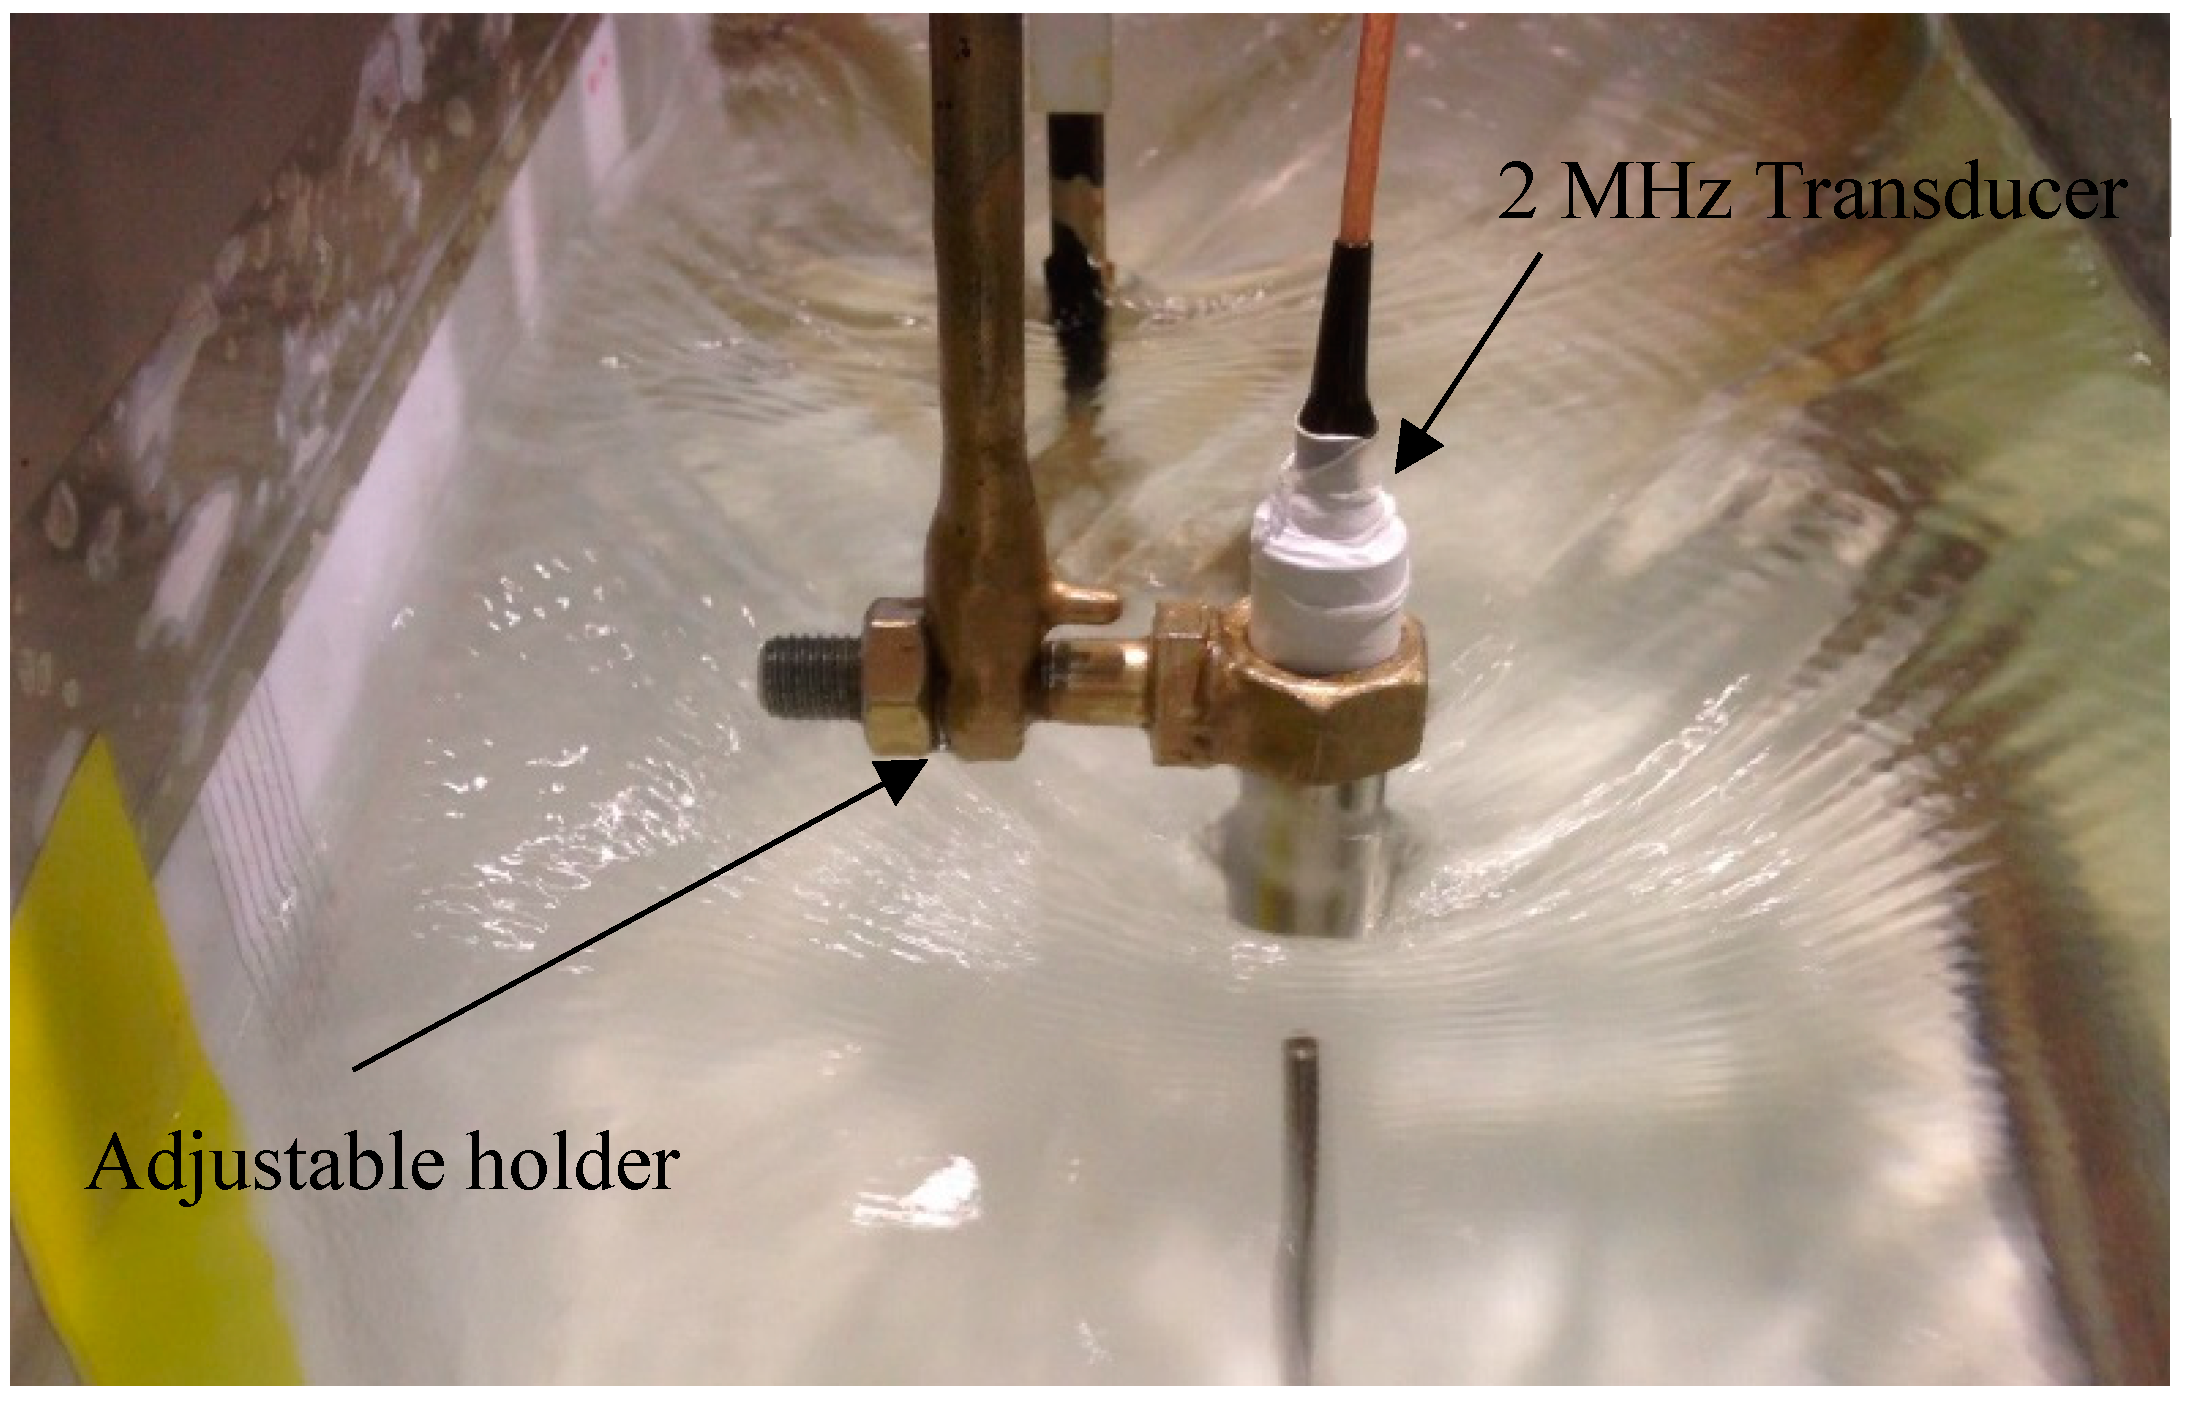
These objectives are achieved experimentally in an open channel water tunnel, as shown in Figure 3. To gain insights into the flow behavior, an ultrasonic velocity profiler (UVP), capable of measuring velocity vectors as a function of both space and time in a unidimensional Eulerian frame, was used to obtain the velocity vectors. The calibration of the 2 MHz transducer was carried out by positioning it at a trajectory angle that has the minimum Doppler angle error possible which is used in speed calculations. As stated by Yokoyama et al. [20], at least two transducers are needed for measuring two-dimensional flow and three transducers for three-dimensional flow. This is because each transducer is needed to measure each velocity component at one spatial point to form a vector. The vector is therefore obtained from any two non-parallel measured components. As the vector component is an orthogonal projection of a true vector into a measuring line (Figure 4), therefore, a large projection angle between the two transducers is encouraged to avoid large inaccuracy in direction estimation. In other words, two-dimensional flow or three-dimensional flow measurements, unlike the technique of one-dimensional flow measurements, rely solely on the orthogonal composition technique which in turn can only be achieved at their respective intersection points. Further details on the experimental set-up and UVP description can be referred to in [19,21].
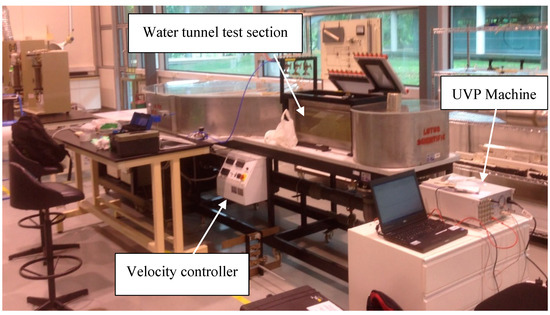
Figure 3.
The water tunnel with the test section made of Plexiglas for visualization purposes.
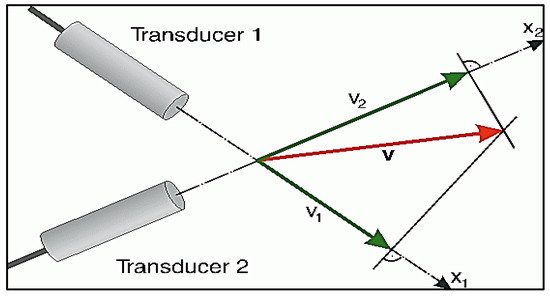
Figure 4.
Vector orthogonal composition technique.
With that in mind, the projection angle between two transducers is orthogonal (90° between the two transducers) when measuring the u and w velocity components behind the finite cylinder. For each of the measurements, 4069 samples were taken at a sampling rate of 100 Hz. Though proven mathematically that the sampling rate must be twice the highest frequency contained in the analogue signal, researchers normally would opt for a sampling rate more than twice the highest frequency contained in the analogue signal if plausible. To be safer, the 100 Hz sampling rate chosen in this experimental work was the highest sampling rate that could be selected after reducing the repetition to only 64 pulses. When considering the St for a cantilever, the St is approximately 0.14~0.18 [8]. Based on the Strouhal number equation, , selecting the maximum St, freestream velocity and the minimum diameter allows accounting for the maximum vortex shedding frequency available in this work. Taking this into consideration, the sampling rate chosen is twice as big as the maximum vortex shedding frequency calculated at ~40 Hz (i.e., the case of a flexible metal cylinder). There were over ~1600 cycles of vortex shedding throughout the measurement.
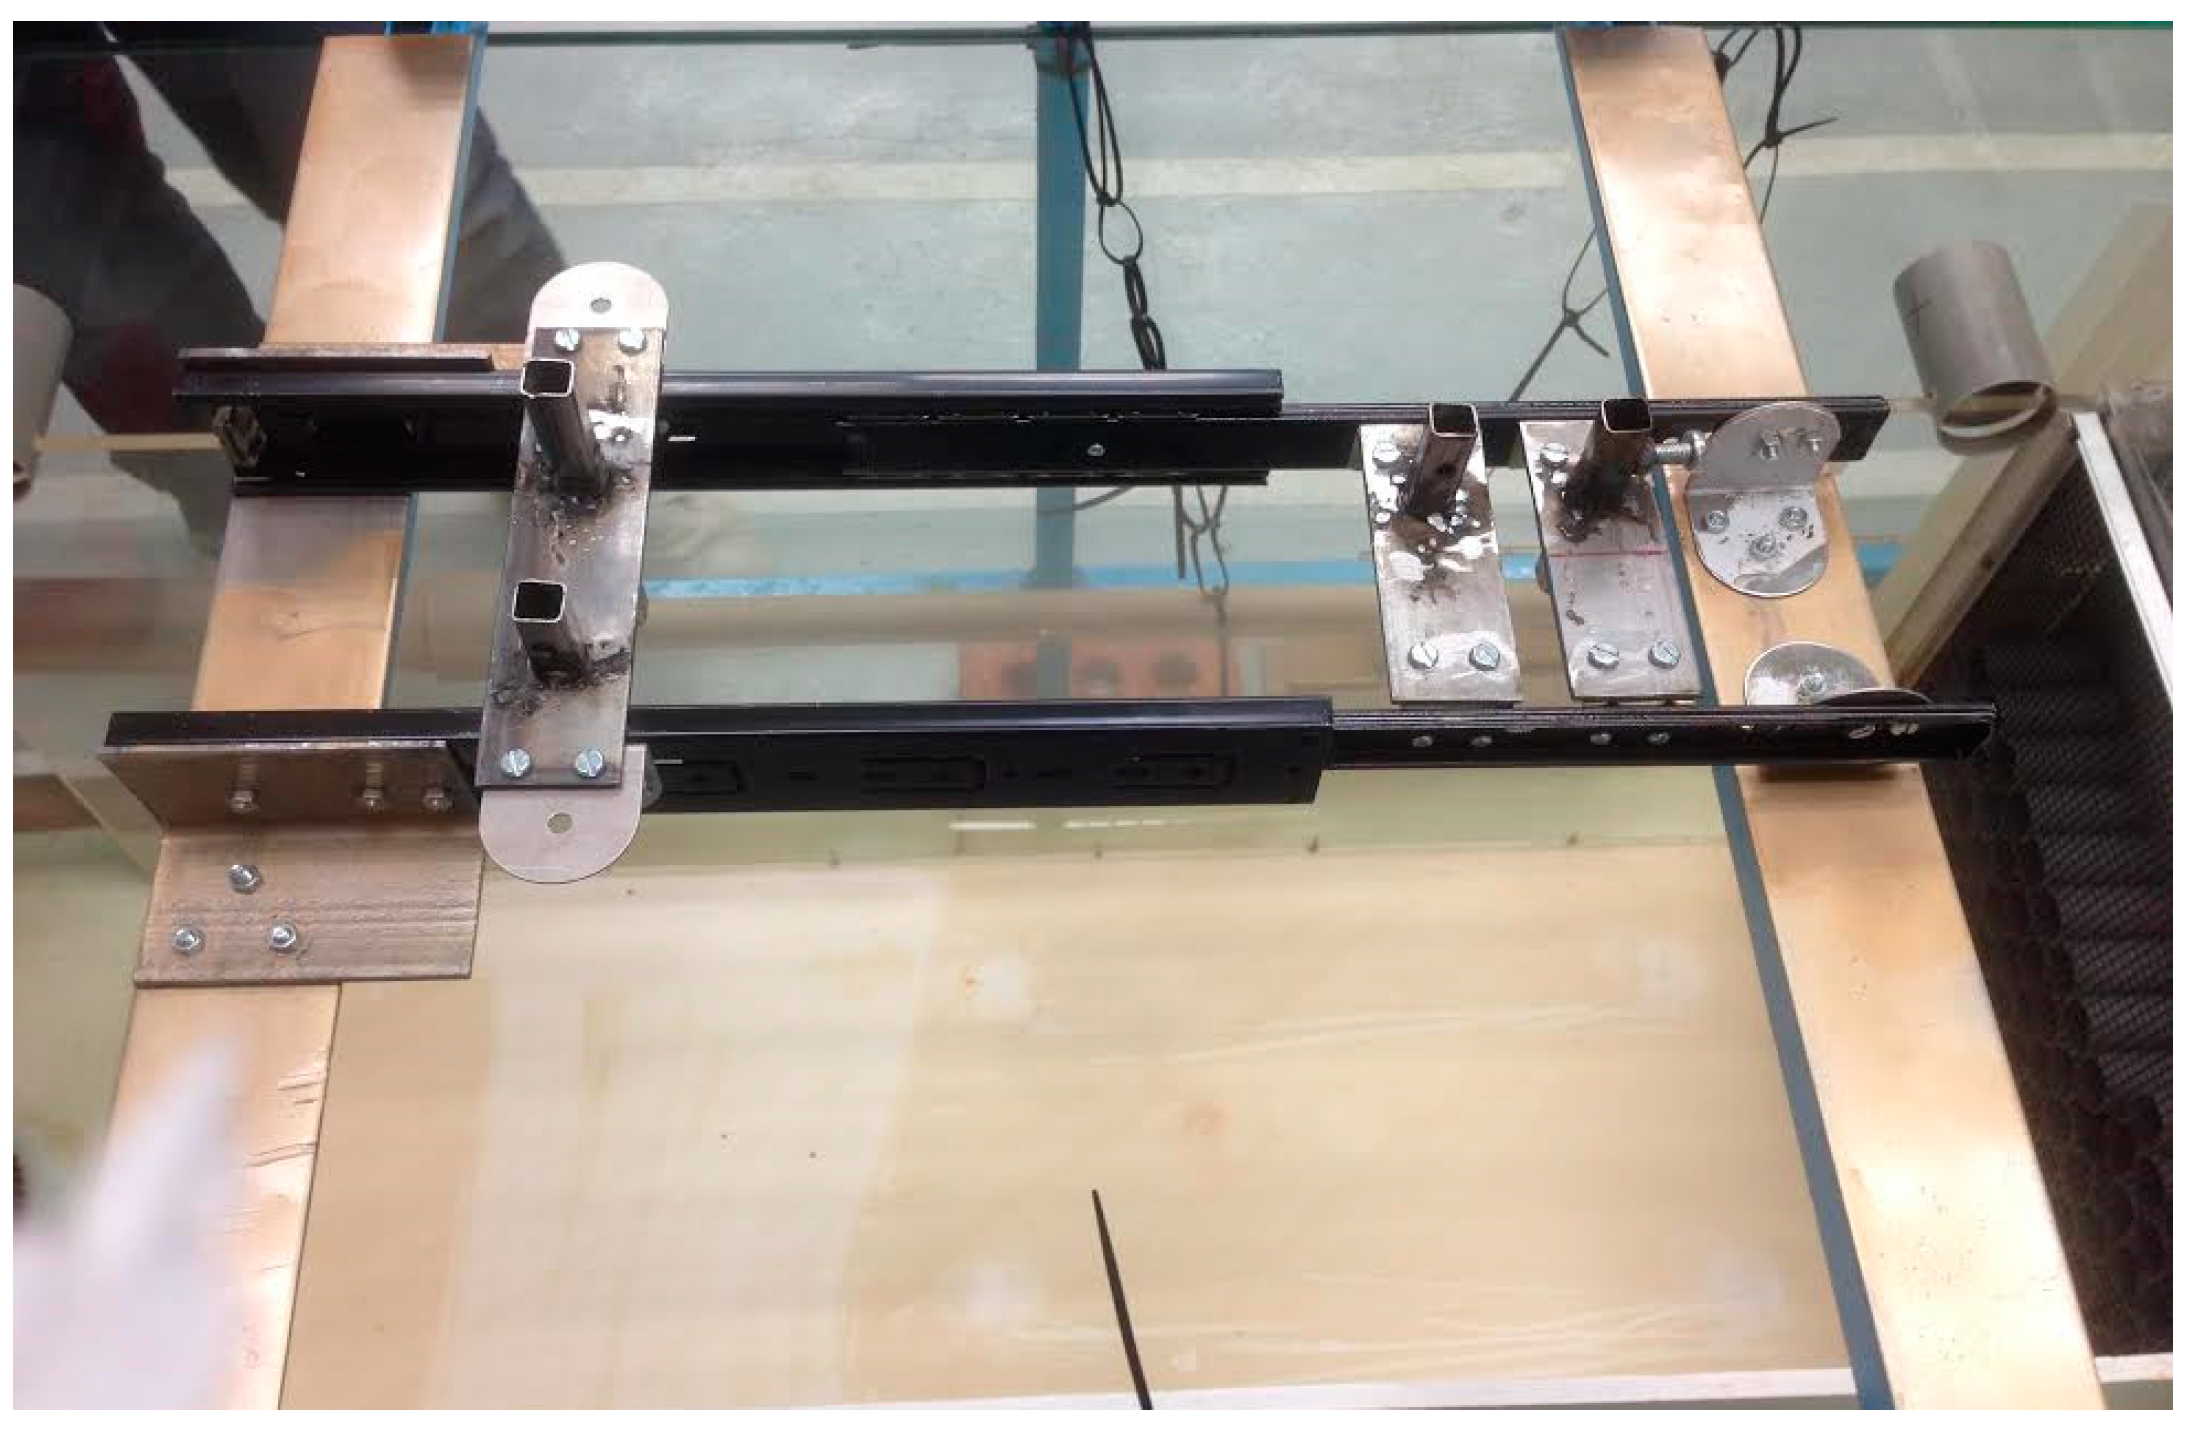
A traverse is important as it guides the UVP accurately. The basic design of the traverse can be seen in Figure 5 and Figure 6. It can be extended in x and z directions. The main body of the traverse was taken from a drawer slide as it can be extended with minimum friction and the extension was perfectly guided so it could travel in a straight line. The extension can be made up to 25 cm long. The extension had the resolution of a ruler, which is 1 mm, as a 50 cm long ruler was fitter on the guiding rail. The drawer slides were made to sit on a steel frame that provides stability to the traverse. All the joints were bolted using hexagonal nuts and bolts to ensure the sturdiness of the structure. To account for the ability to move in the z direction, 4 hollow bars were welded onto the 2-inch flat bars. The UVP transducer was attached to the holder that was moved and guided by the square hollow bar. When the transducer reached a desired location, the holder was jammed by the bolts so that it would stay in place. The UVP probe emits sound waves in the z direction (top to bottom) and x direction (streamwise). They are free to move in the x and z direction to collect the velocity around the cylinder upstream and downstream.

Figure 5.
UVP traverse system.
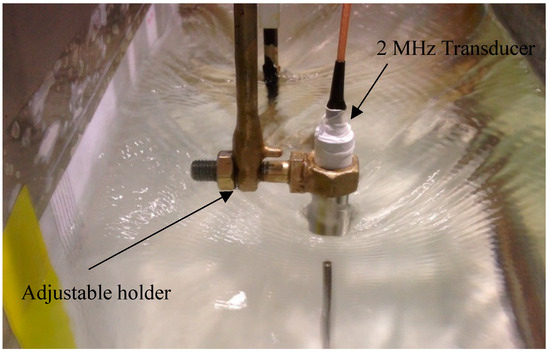
Figure 6.
UVP traverse and transducer.
A set of experiments was performed to investigate the boundary layer and properties of the flow prior to the finite and flexible cylinder experiments. The boundary layer thickness, δ, was defined as the point where the local mean velocity was 99% of the freestream velocity while the displacement thickness, δ*, was defined as the boundary layer displacement thickness. The momentum thickness, δθ, on the other hand, was defined as the distance by which the boundary should be displaced to compensate for the reduction in momentum of the flowing fluid on account of boundary layer formation. The shape factor, Hδ, which is the ratio of the displacement thickness over the momentum thickness, provides information on the nature of the flow. The tables below show a summary of the boundary layer measurements on the ground plane at different freestream velocities. x/D = 0 (350 mm from the leading edge of the flat plate) indicates the location of the cylinder. The ReL is based on the distance across the leading edge to the location of interest. The specifications of the boundary layer of U = 0.33 m/s, 0.49 m/s and 0.65 m/s are shown in Table 1, Table 2 and Table 3. Both rigid and flexible cylinders were partially immersed in the boundary layer (δ/H ranged from 0.3 to 0.5) under all Re. As previously mentioned, /H would greatly alter the critical aspect ratio where the vortex shedding at the free end is suppressed. Therefore, great care was taken to make sure the boundary layer was small enough such that the free end of the cylinder did not submerge in the boundary layer.

Table 1.
Boundary layer measurements on the ground plane at U = 0.33 m/s.
Table 2.
Boundary layer measurements on the ground plane at U = 0.49 m/s.
Table 3.
Boundary layer measurements on the ground plane at U = 0.65 m/s.
To visualize the oscillations of a flexible cylinder inside the recirculating water tunnel, a Canon Eos 60D camera was used. The camera is capable of recording 60 fps at 1280 × 720 pixels. The camera lens was mounted directly above the flexible cylinder where the oscillating motions were recorded and the distance between the lens and the cylinder’s free end was kept constant. The lens must be perfectly aligned to the cylinder’s free end so that the light wave is approaching the water in a direction which is perpendicular to the water’s surface since, theoretically, the light does not refract at the normal line. The video was analyzed by using motion analysis software, Photon FASTCAM Analysis version 1.3.2.0.
To ensure the success of the present study, the investigations were conducted in a systematic and organized manner. The tests were divided into two categories: rigid cylinder cantilever and flexible cylinder cantilever. Flow in the lower subcritical Reynolds number regime ~×103 is selected as the regime of interest as it is more compatible with most of the engineering applications. Given the height of the test section is only 20 cm, the overall length of the structure is less than 18 cm. Firstly, a series of tests were performed on a rigid cantilever in fluid. It served as an insight into flow behavior influenced by the free end and can later be used to explain the change in flow behavior caused by flexible cantilevers. Secondly, a series of tests were performed on a flexible cantilever in a fluid which provided a picture of the flow behavior of the complex problems. The movement of the flexible cantilever was not limited by any means and was intended to vibrate freely as the flow passed through it. Two governing parameters, namely Reynolds numbers (based on cylinder diameter) and structural stiffness, were varied throughout the tests. The variation of structural stiffness could be achieved by different material selections of different Young’s modulus and also geometry. Since the geometry was fixed in this research, different AR values were manipulated to achieve different stiffness for the same material. Full details on the finite rigid and flexible cylinder specifications can be found in [6]. Table 4 and Table 5 show the specifications of the models used in the experiments.
Table 4.
Summary of the specifications of finite rigid circular models.
Table 5.
Summary of the specifications of finite flexible circular models.
The stiffness rating and the deflection are seen to be governed by Young’s modulus, E, second moment of inertia, I, the overall length of the cantilever, L, and also the spanwise location of the cantilever, y. They are collectively a function of material properties. To vary the Young’s modulus, different materials of cantilever cylinders are adopted in this research—aluminum, carbon steel and ethylene vinyl acetate (EVA). The variation of the geometry can be achieved by changing the length or shape of the object as it affects the second moment of inertia. To increase the flexibility of the cylinders, one could replace the material with a high Young’s modulus value with one with a lower Young’s modulus value—EVA. Another method is to adopt a very large length-to-diameter ratio (lower I and longer L) to compensate for the materials (aluminum and carbon steel) that have high Young’s modulus values.
2.2. Turbulence Quantification
The behavior of fluctuation quantities can be described by applying the Reynolds decomposition method to the Navier–Stokes equations and after a series of simplifications [22] the kinetic energy budget which describes the energy of turbulence is formed. Since the kinetic energy budget provides insight into how the turbulence is distributed after being produced from the mean flow, there exists the kinetic energy budget for the mean flow and the kinetic energy budget for the turbulent flow, which compliment each other in the process of examining the transfer of turbulence energy. The kinetic energy budget of mean flow is given by:
whilst the kinetic energy budget of turbulent flow is given by the following equation:
The production term is generally positive in the kinetic energy budget of turbulent flow, signifying an energy supply from the mean flow to the turbulent flow. When comparing Equations (1) and (2), it can be understood that the transfer of energy between the mean and turbulent flow can only be carried out through the fifth term on the RHS, and therefore it is often labeled as the production term. The kinetic energy budget equations are useful in ‘visualizing’ the nature of turbulence and are especially useful in examining the level of turbulence energy produced by the rigid and flexible cylinders through evaluating the production term. In the current work, attention is given to the production term to understand the distribution of the energy by the rigid and flexible cylinders.
To examine the strength of the turbulence, the Reynolds averaged statistics, which is important as it gives insight into the transport of momentum within the flow because velocity fluctuations give turbulent flow extra kinetic energy and hence generate extra momentum transfer, is used. Reynolds stress is used to account for turbulent fluctuations in fluid momentum. Hence, the fluctuating components of the instantaneous flow were determined from each velocity field in the x–z plane. Since the Reynolds stress is the component of the total stress tensor in a fluid obtained from the averaging operation over the Navier–Stokes equations, the Reynolds averaged Navier–Stokes equation can be written as:
where is the Reynolds stress tensor. The instantaneous and mean velocities can be extracted directly from Met-Flow Software Version 3 except for the fluctuation velocity, so the fluctuation velocities of 4096 data points at one location were calculated by subtracting the mean from the instantaneous velocity. The u component fluctuation velocities were then multiplied by each other before averaging was performed to calculate the normal stress, , contributed by the u component. The same procedure is valid for the w component. To calculate the Reynolds shear stress, , the u fluctuation velocities were multiplied with the w component before averaging. The uncertainty analysis has been discussed in [19].
As this project is fully based on experimental work, the results have to be confirmed to be of high integrity. The uncertainty analysis is performed to give a quantitative estimation of the reliability of the measured value generated from a series of experiments. The uncertainty estimation for the different parameters is calculated based on the Coleman and Steele [23] approach at a 90% confidence level.
3. Results and Discussion
Based on the analysis of [18], it can be discerned that the wake region of the flexible cylinder is generally larger than that of the rigid cylinder. A larger wake region translates to a larger region where turbulence activities can happen effectively. Therefore, the increase in the wake region can be denoted as direct evidence of turbulence enhancement, in terms of the effectiveness of the region where turbulence activities take place. In addition, it is speculated that the increase in the wake region is caused by the bending of flexible cylinders. On the other hand, the turbulence intensity, production term and Reynolds stress have also seen huge increments in flexible cylinders [6,19]. It is speculated that the increment is not caused by the bending but by oscillating motion. So, this work investigates the validity of the speculation by manipulating the structural stiffness of the flexible cylinder by employing different materials.
3.1. Time Averaged Velocity Distribution
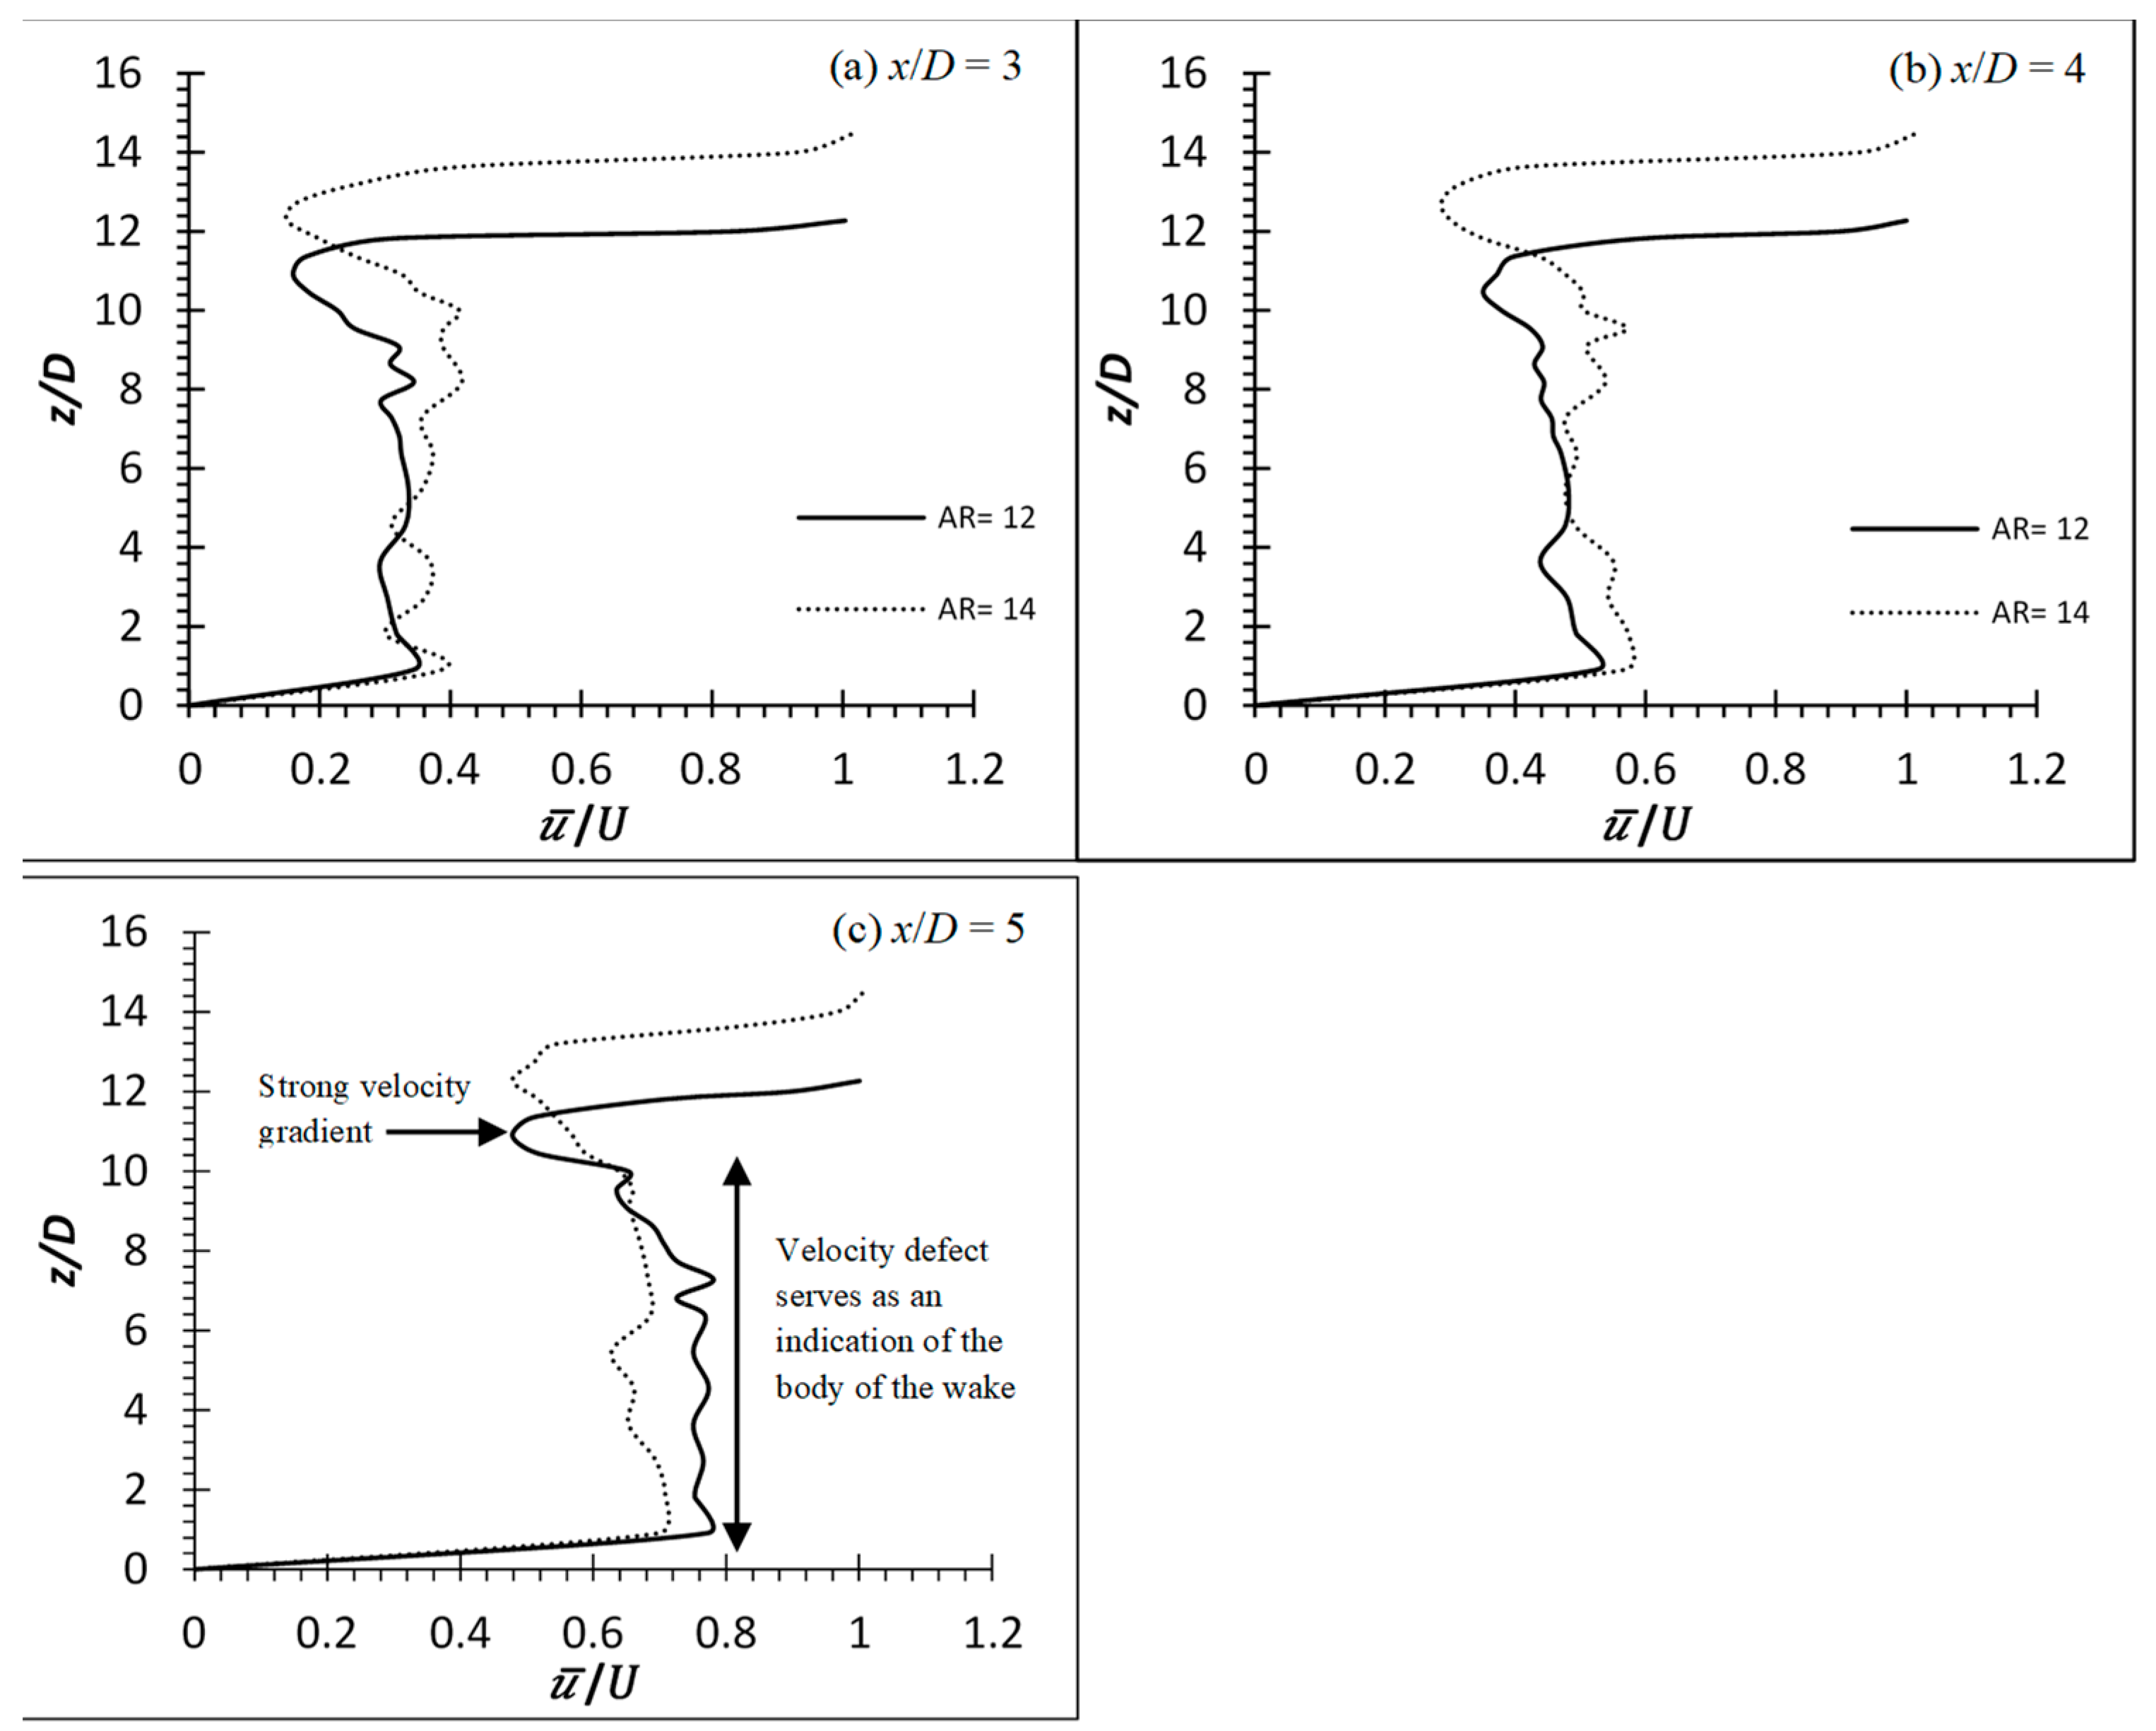
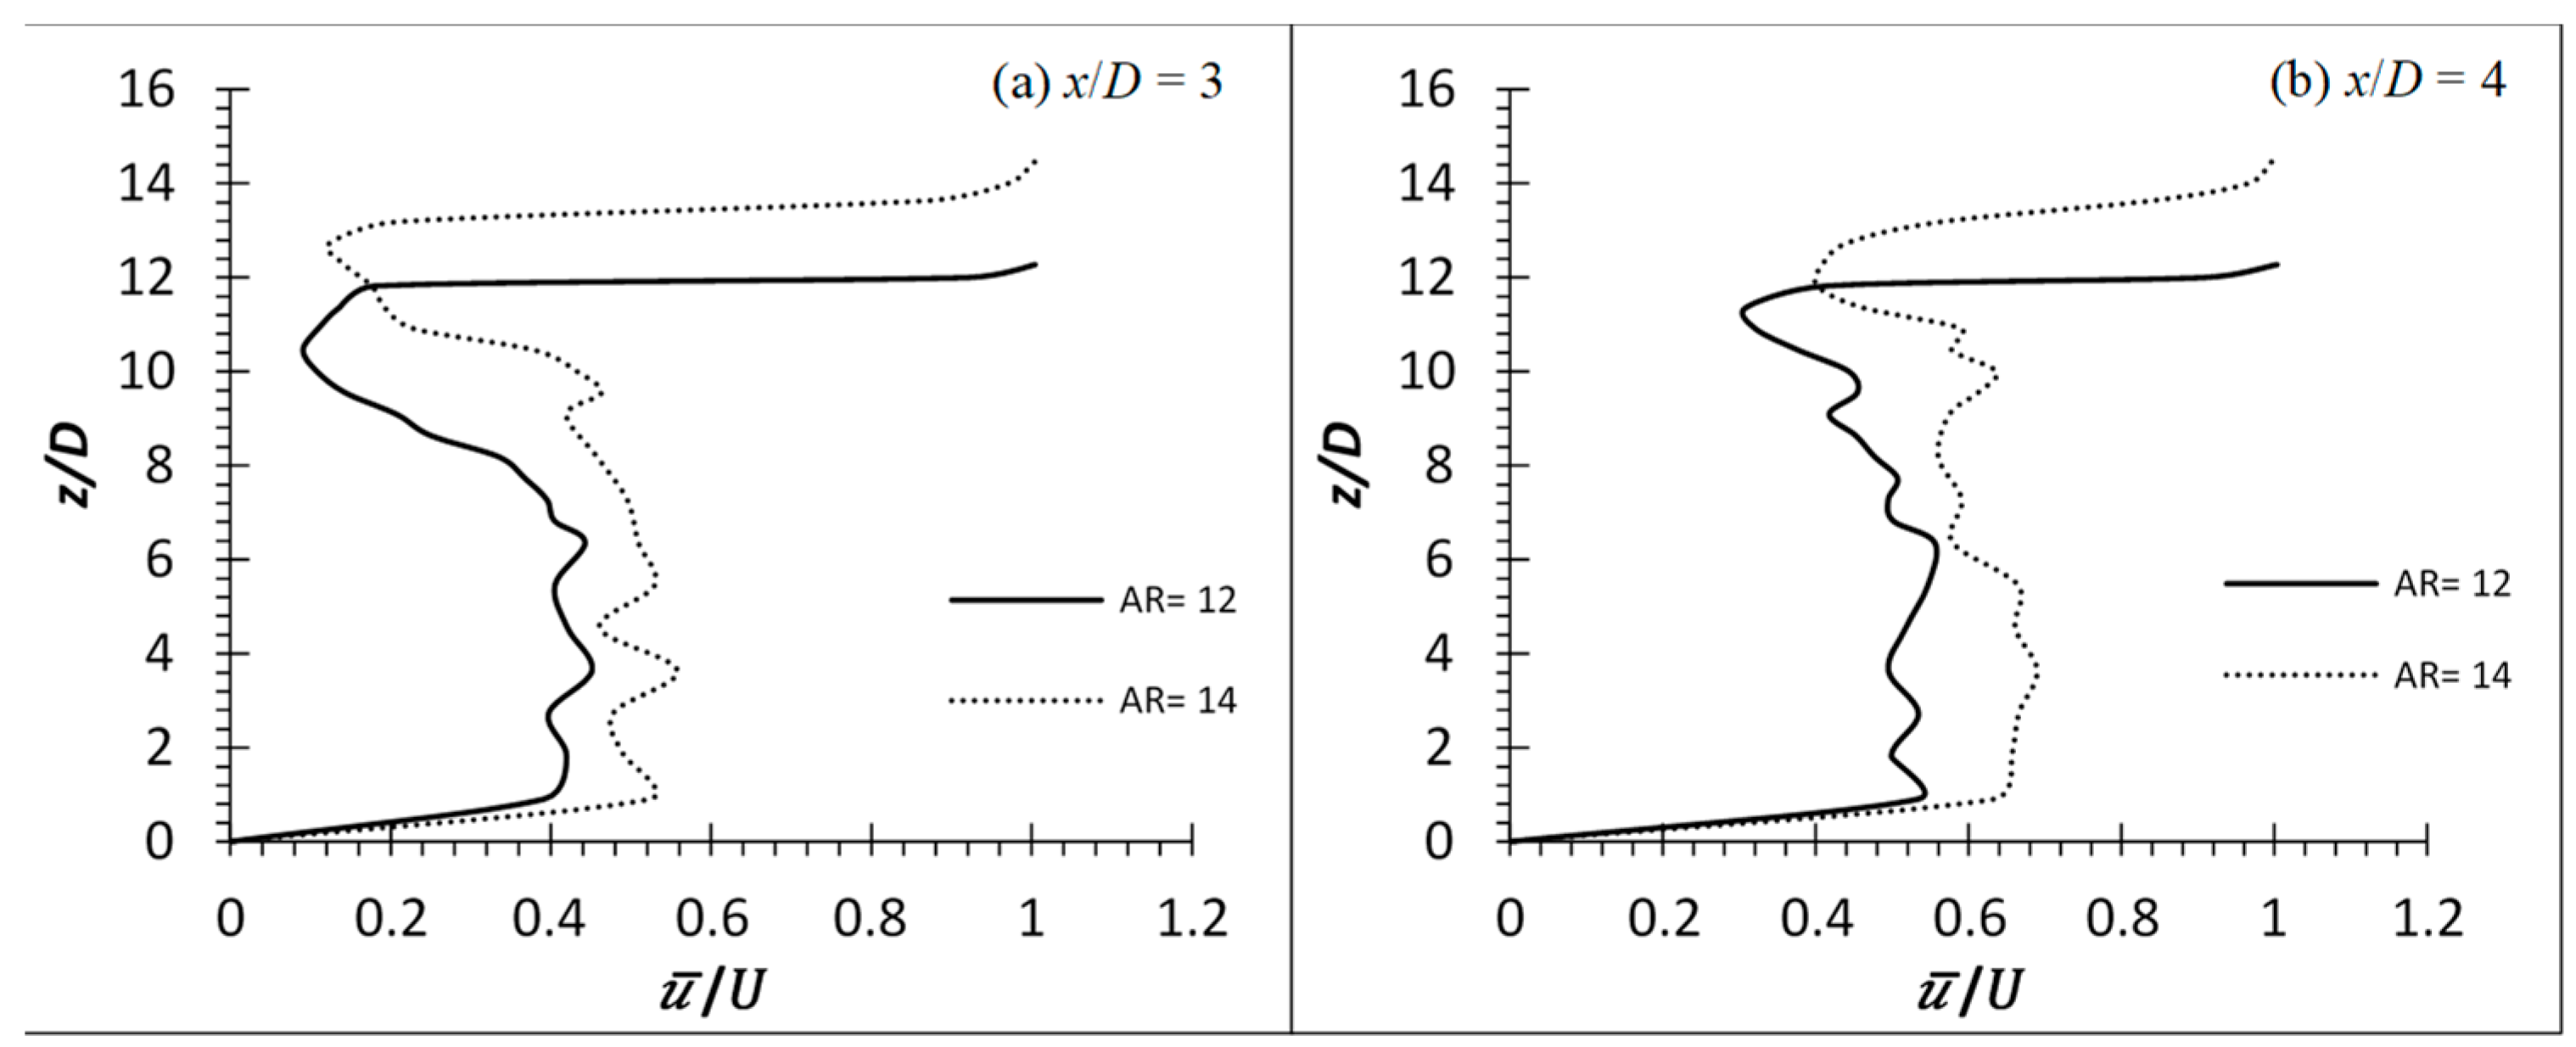
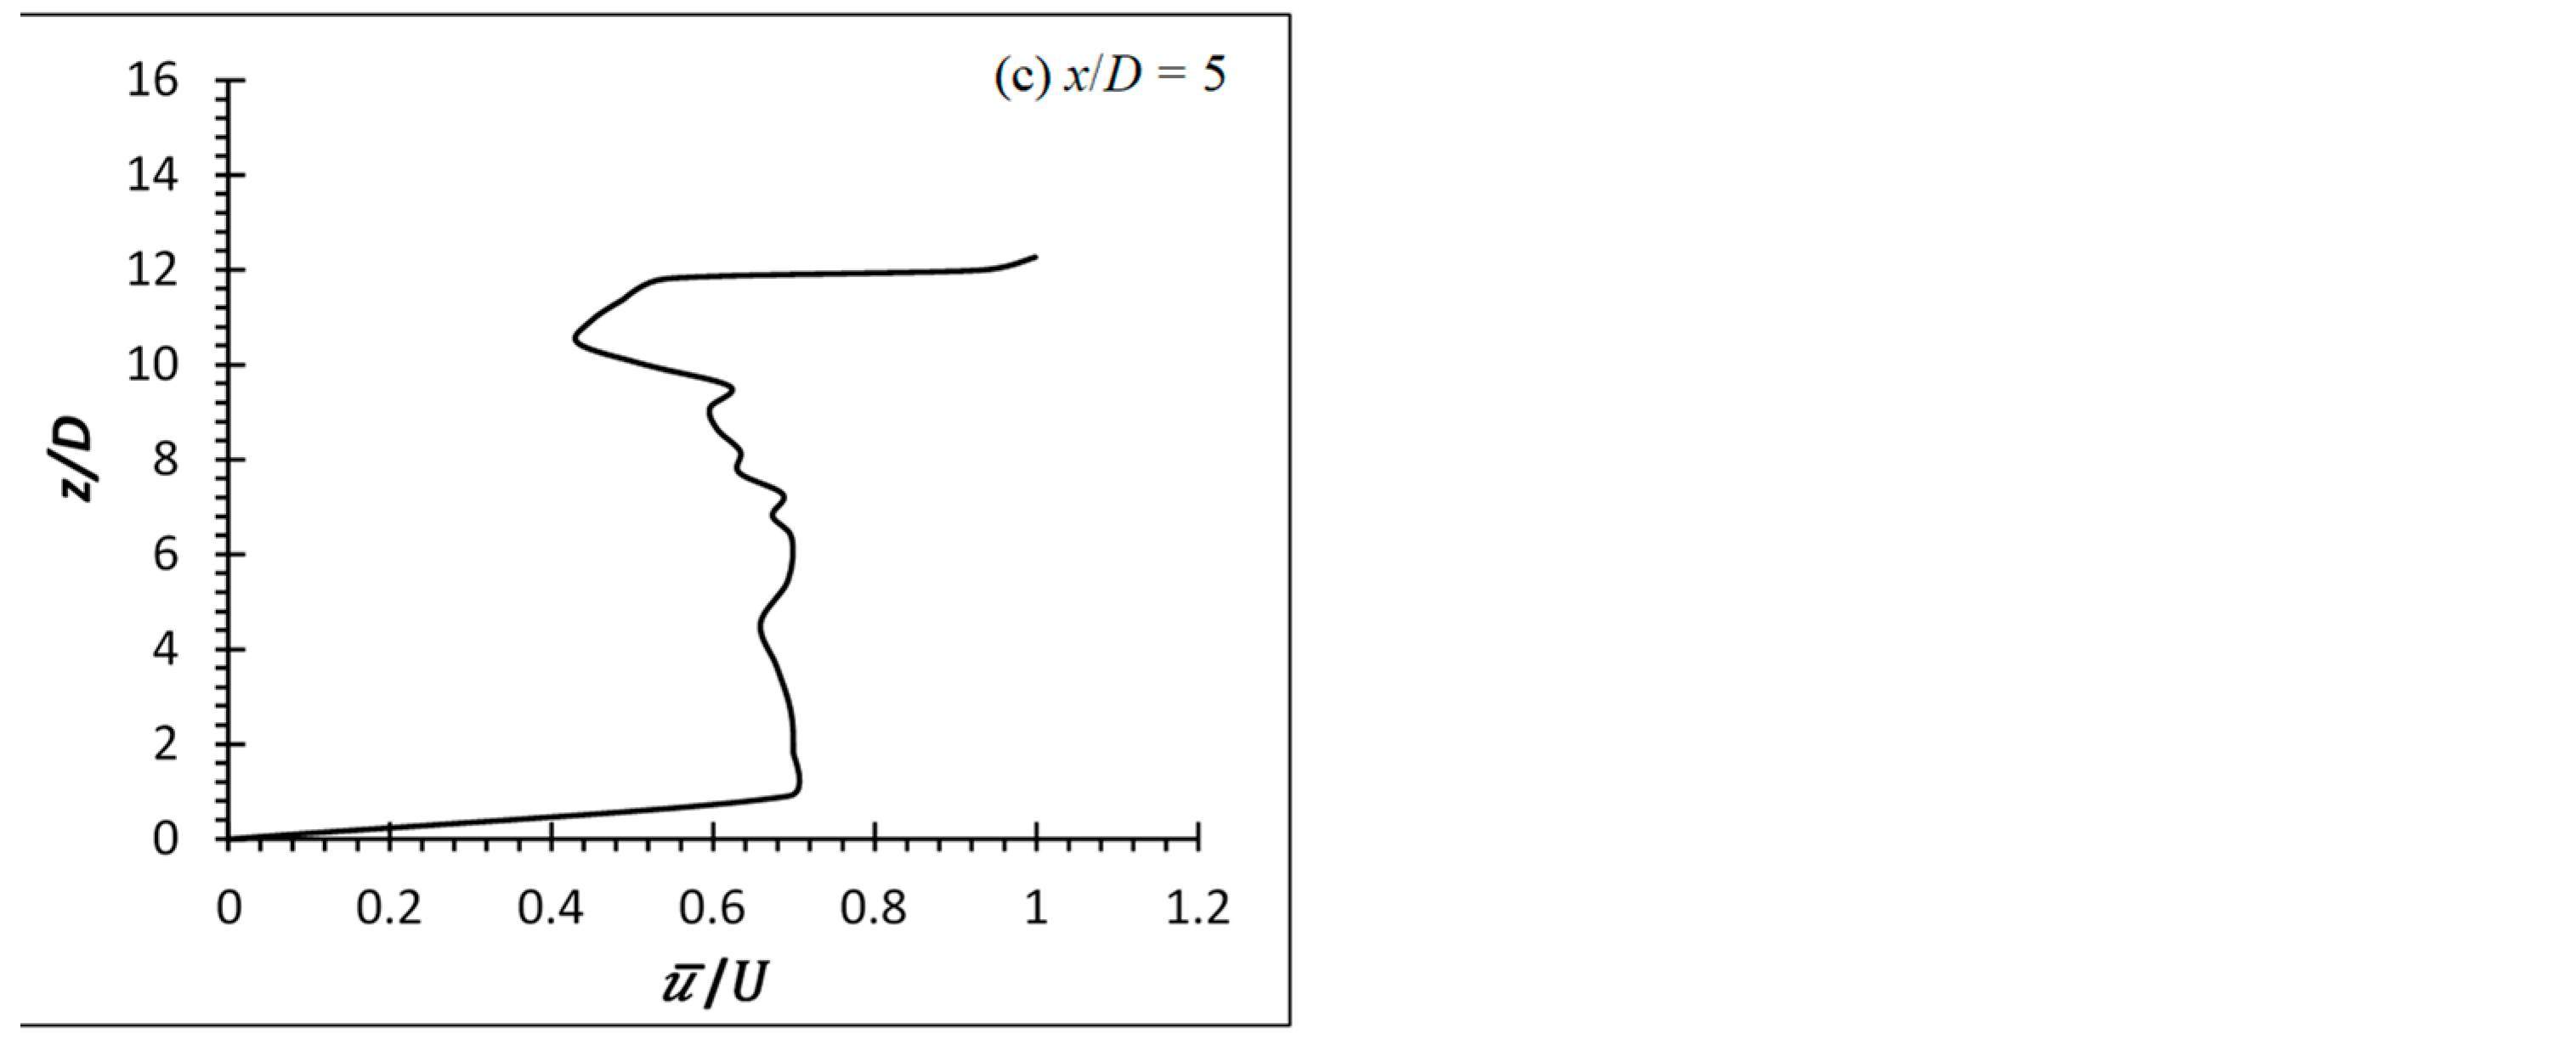
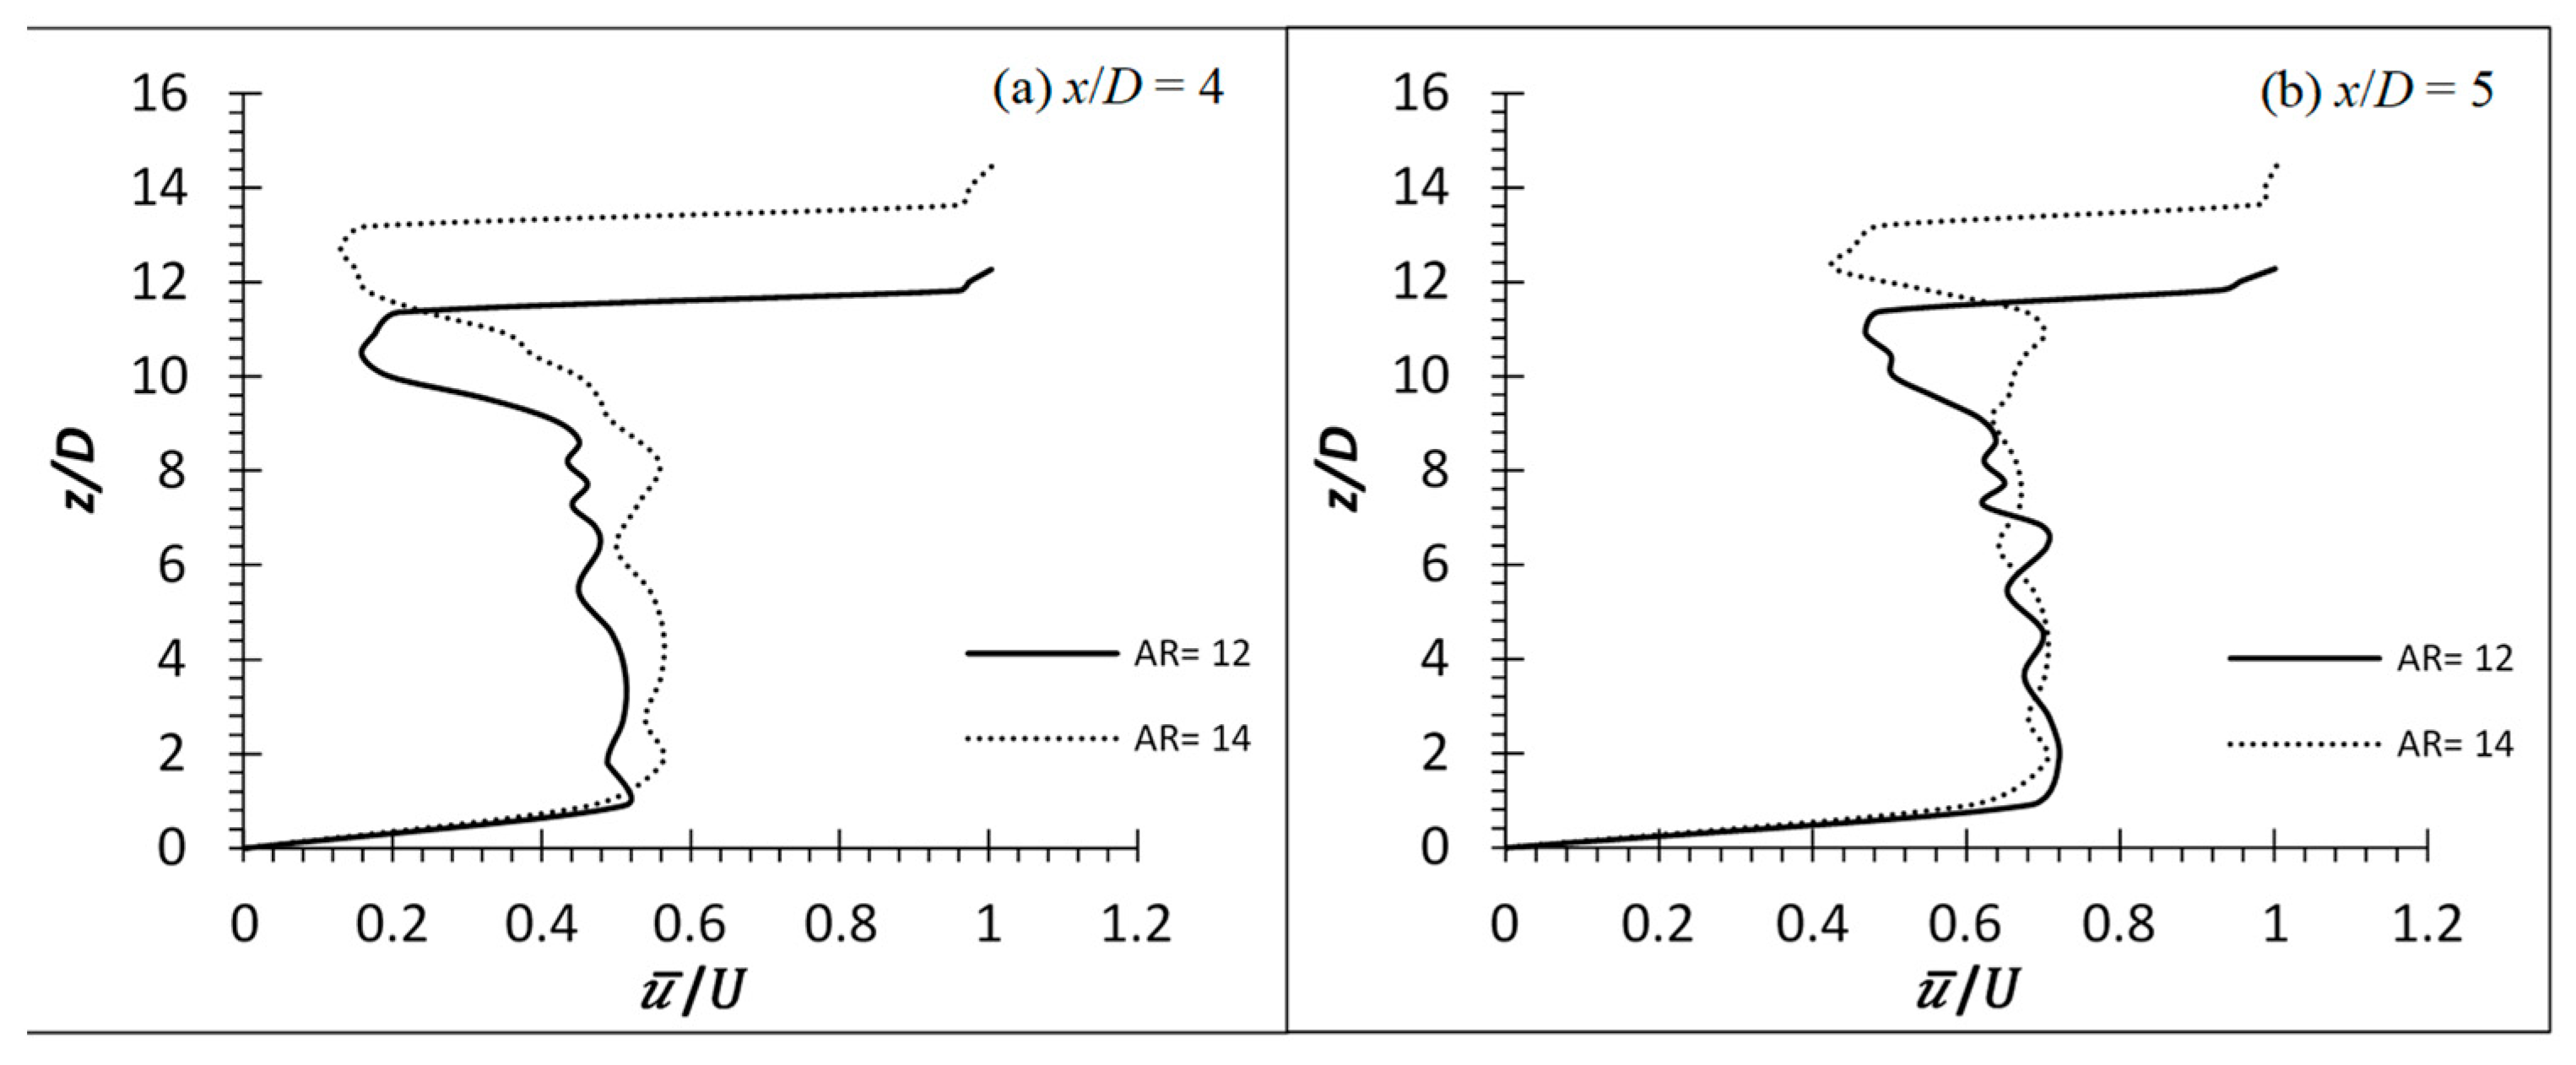
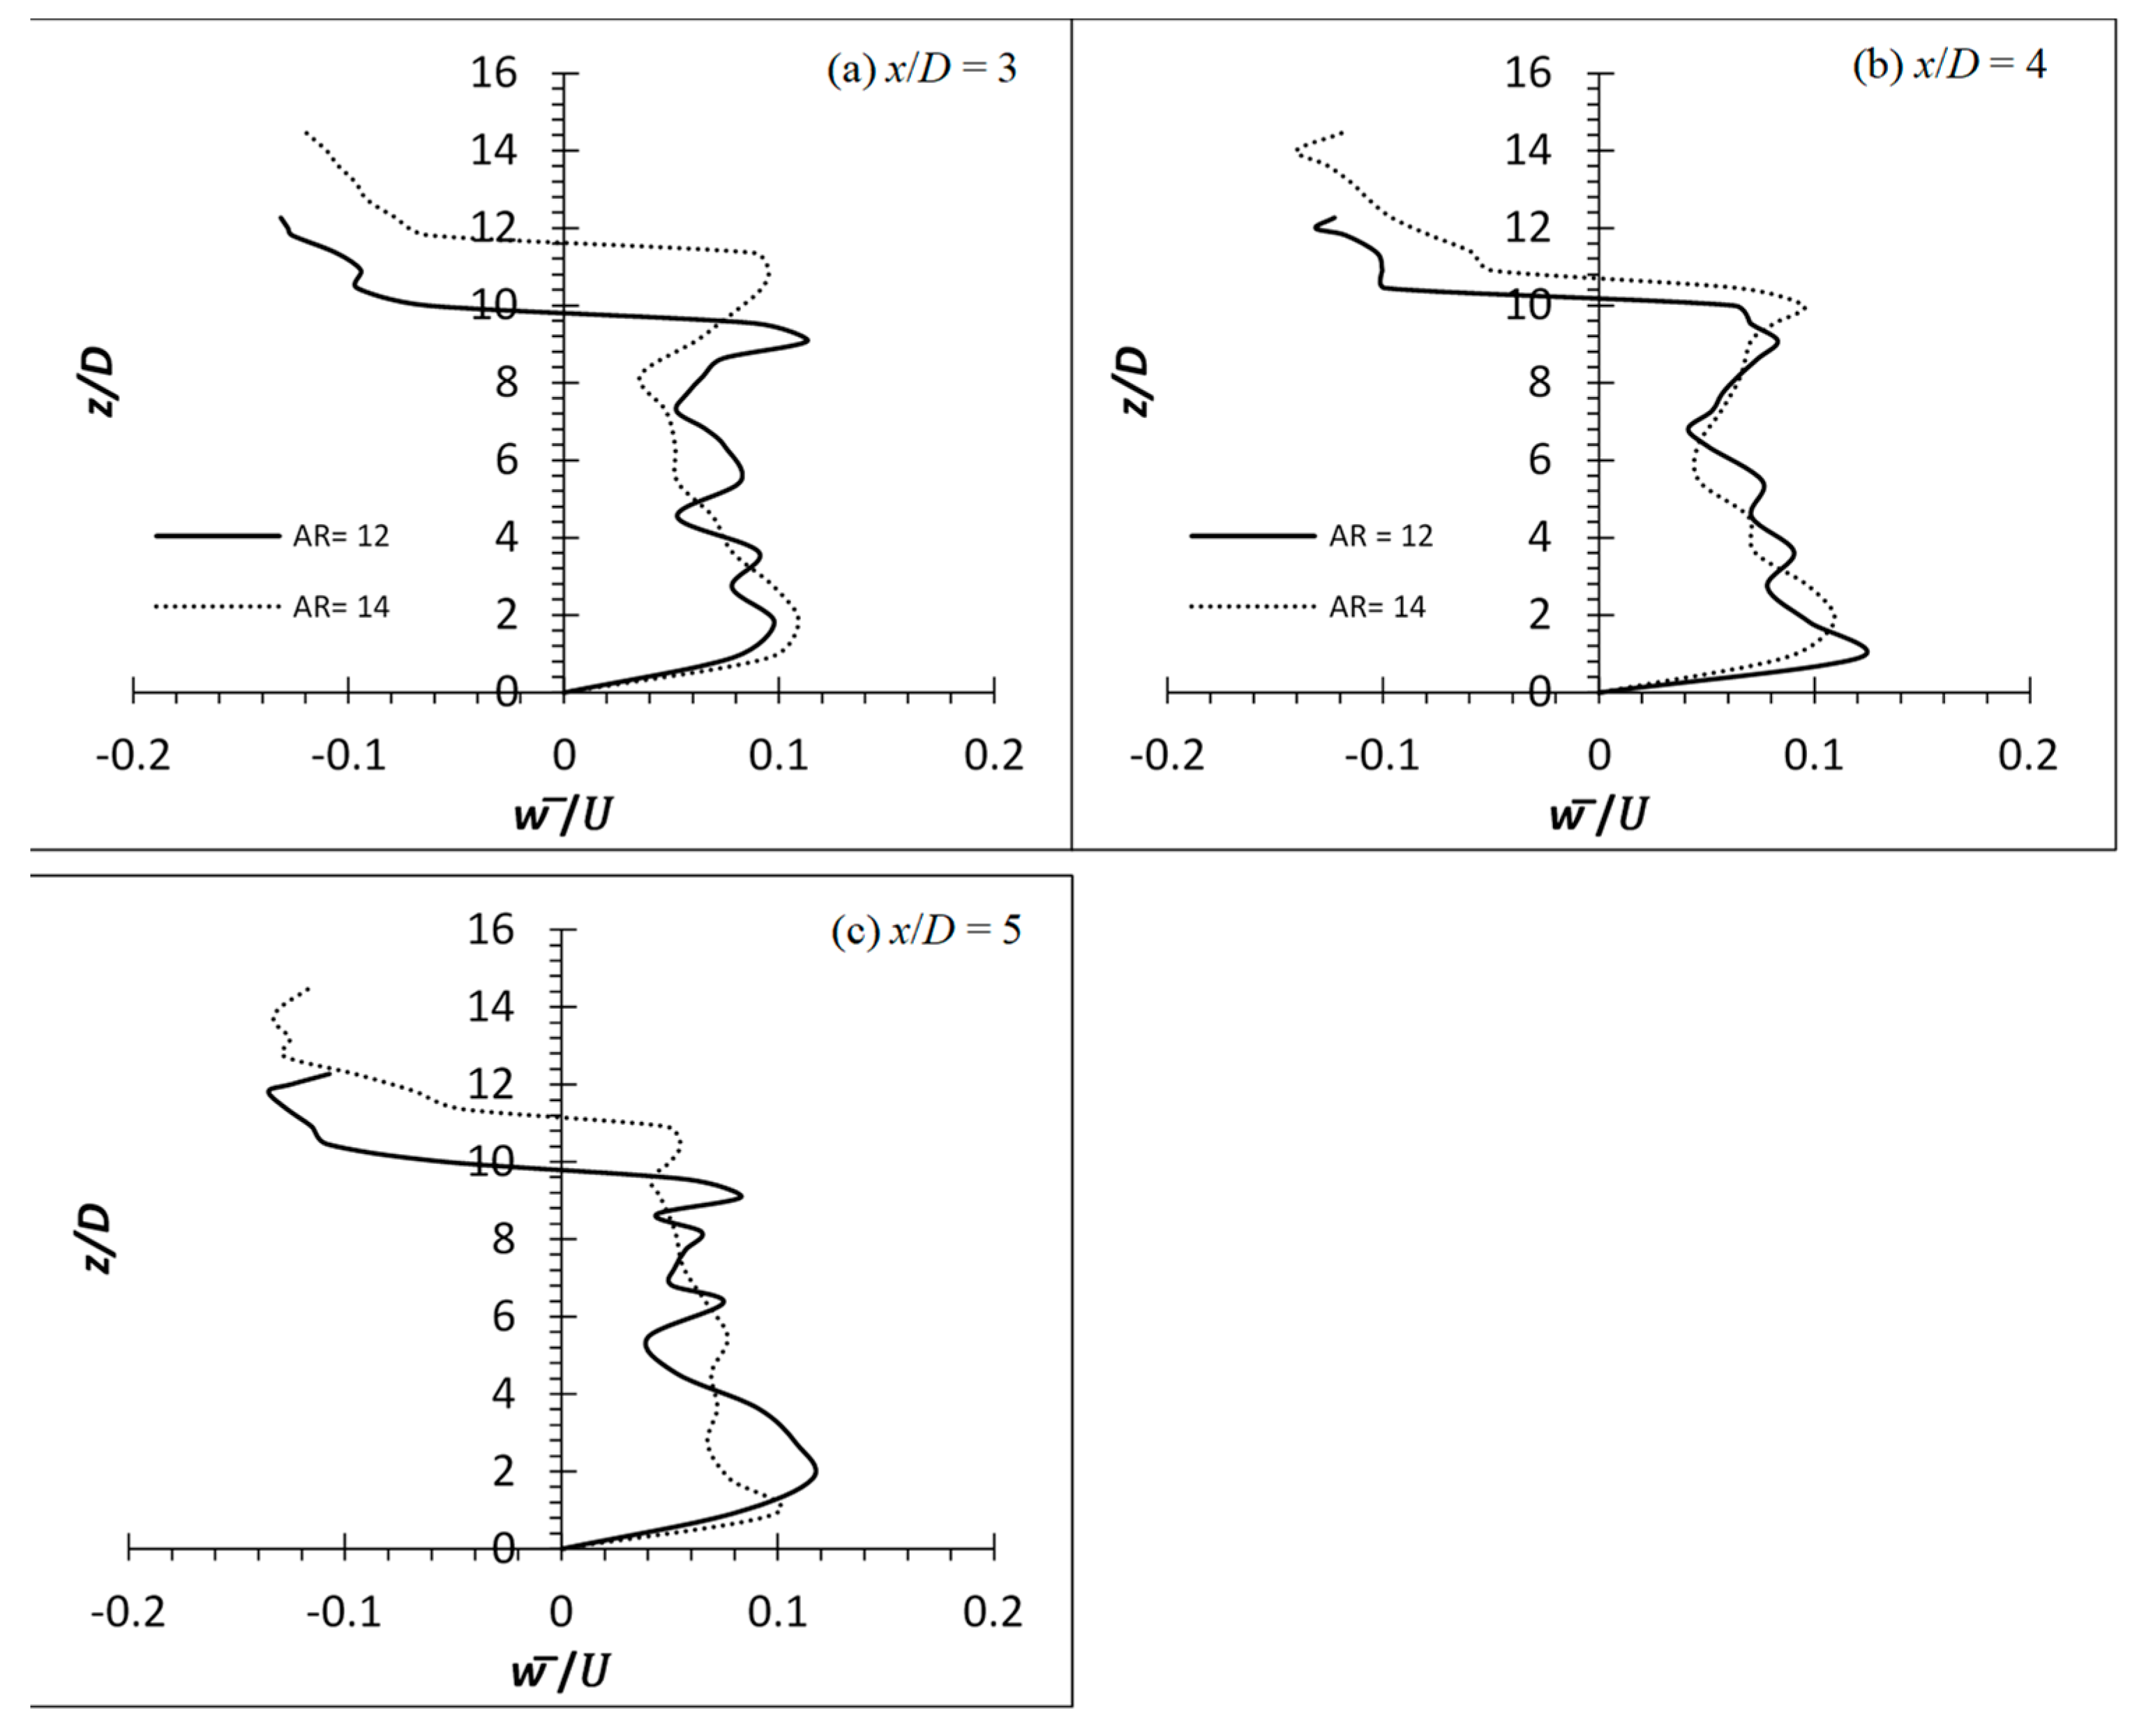
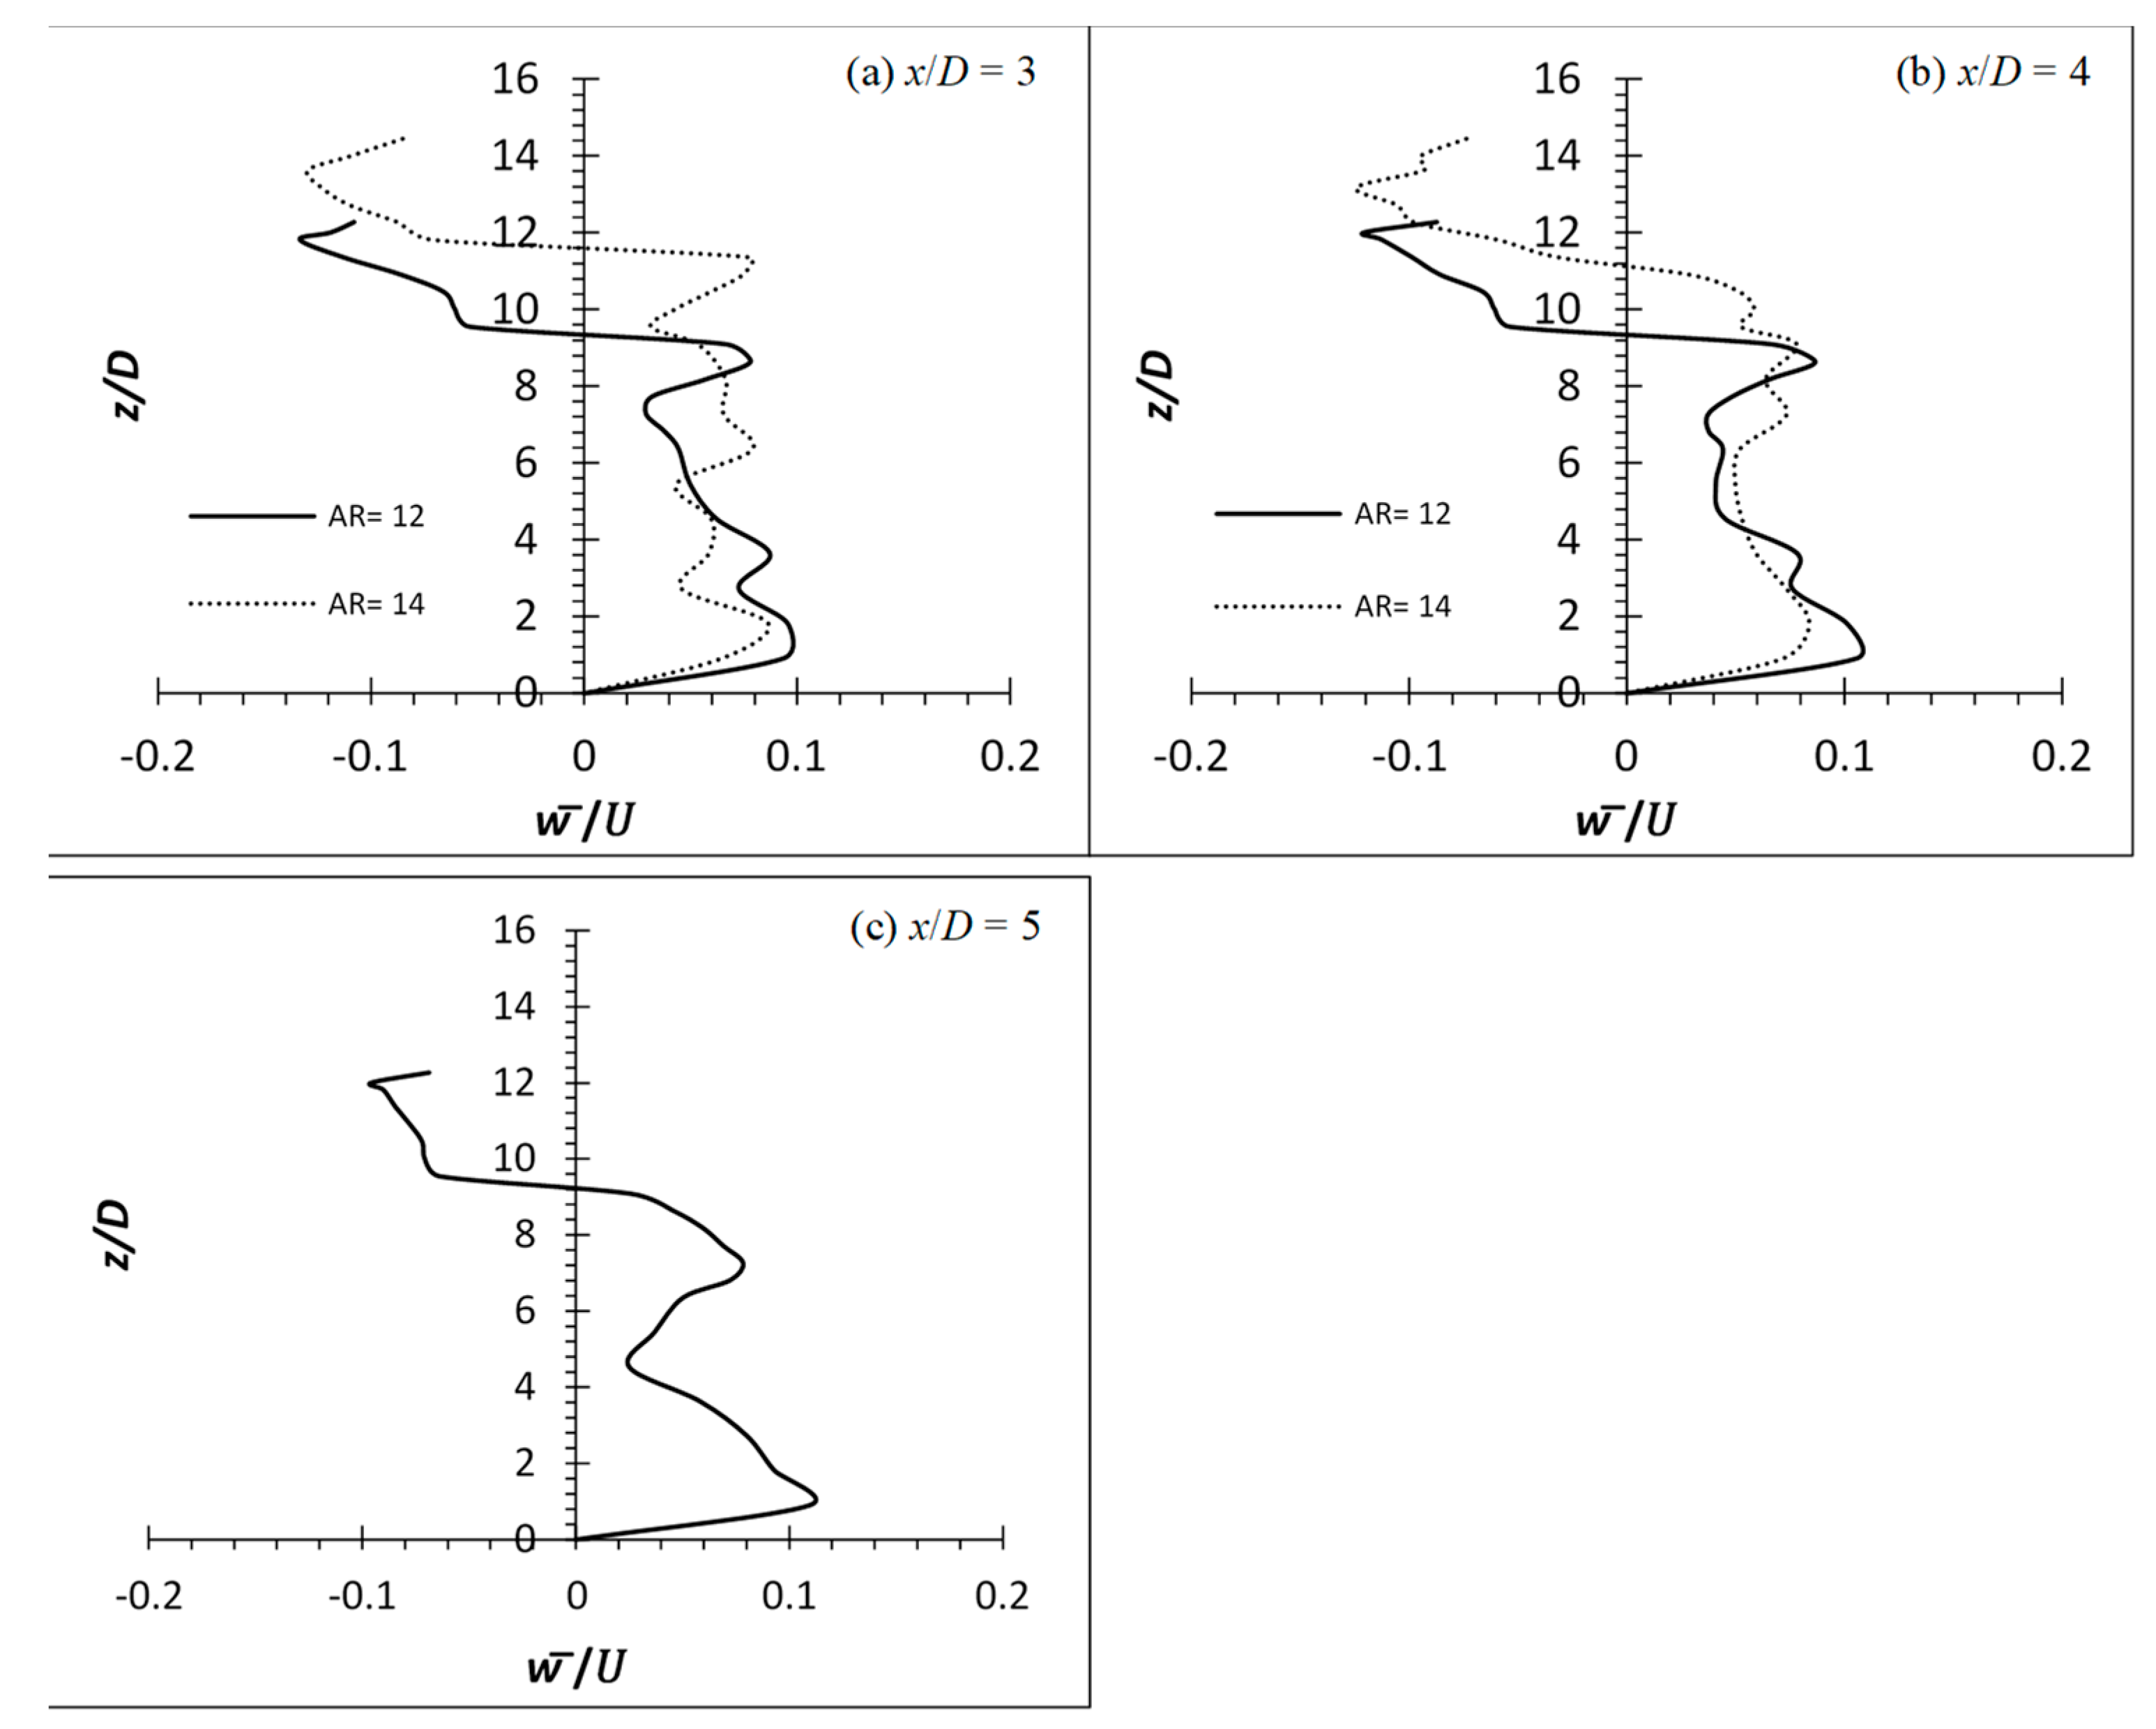
Figure 7, Figure 8, Figure 9, Figure 10, Figure 11 and Figure 12 show the time averaged streamwise velocity profile () and wall-normal velocity profile () of flexible cylinders of AR = 12 and 14 on the wake centerline (y/D = 0) at Re = 4000, 6000 and 8000, respectively. The distance measured of each velocity profile behind the cylinder is one diameter at x/D = 3, 4 and 5. The deflection downstream of the flexible cylinders has resulted in an increment of the wake region that is nearly identical to the cylinder’s height as indicated by the point where a strong velocity gradient happens. The tip effects for both flexible cylinders of AR = 12 and 14 at all Re can be seen only as influential to z/D ≈ AR − 1, consistent with the postulation of wake region increment due to the cylinder’s deflection.
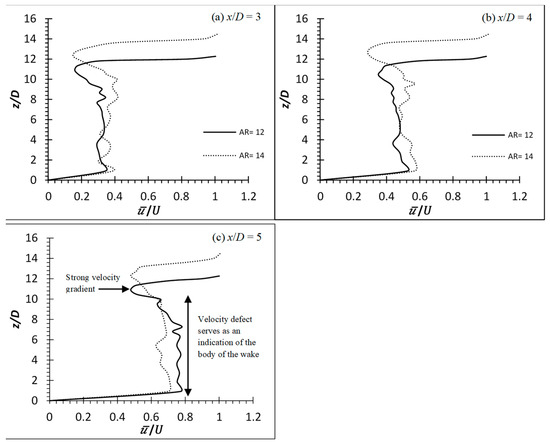
Figure 7.
Time averaged streamwise velocity profile of flexible finite cylinder of AR = 12 and 14 at wake centerline (y/D = 0) for Re = 4000.
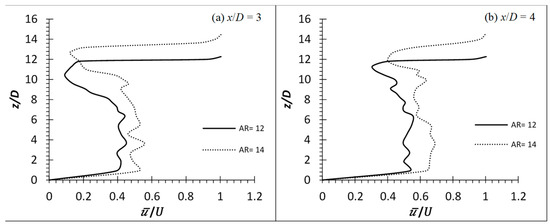
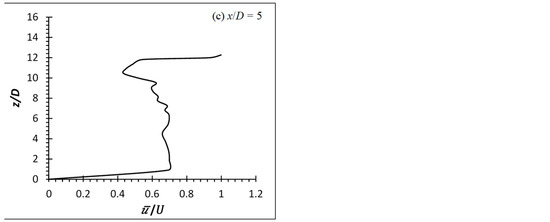
Figure 8.
Time averaged streamwise velocity profile of flexible finite cylinder of AR = 12 and 14 at wake centerline (y/D = 0) for Re = 6000.
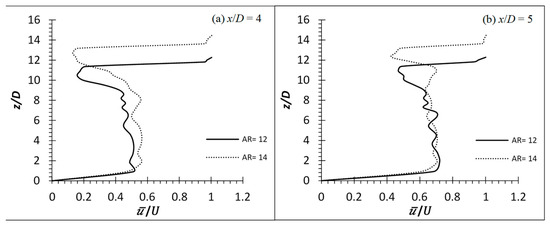
Figure 9.
Time averaged streamwise velocity profile of flexible finite cylinder of AR = 12 and 14 at wake centerline (y/D = 0) for Re = 8000.
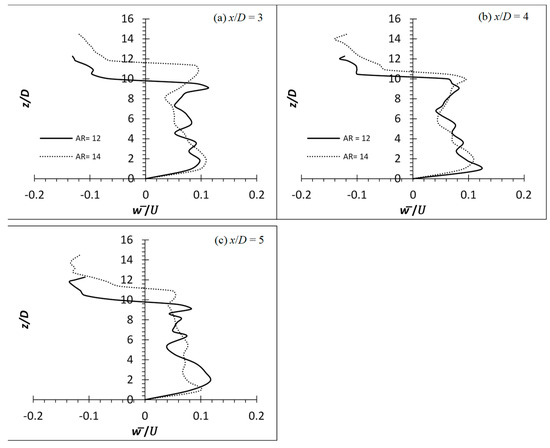
Figure 10.
Time averaged wall-normal velocity profile of flexible finite cylinder of AR = 12 and 14 at wake centerline (y/D = 0) for Re = 4000.
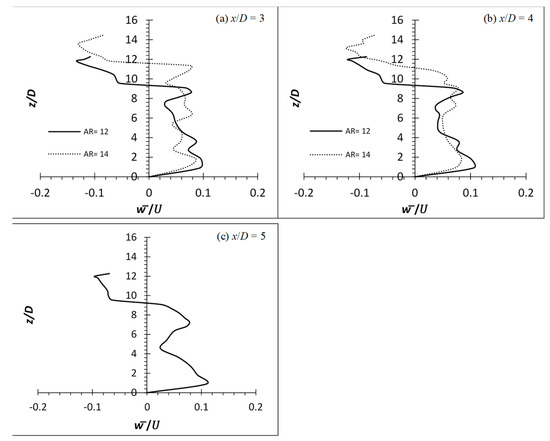
Figure 11.
Time averaged wall-normal velocity profile of flexible finite cylinder of AR = 12 and 14 at wake centerline (y/D = 0) for Re = 6000.
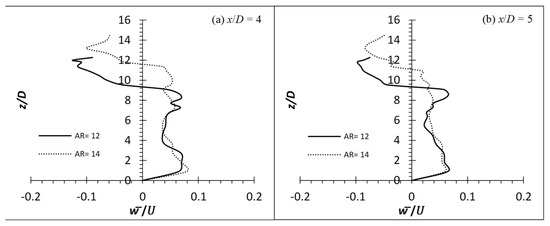
Figure 12.
Time averaged wall-normal velocity profile of flexible finite cylinder of AR = 12 and 14 at wake centerline (y/D = 0) for Re = 8000.
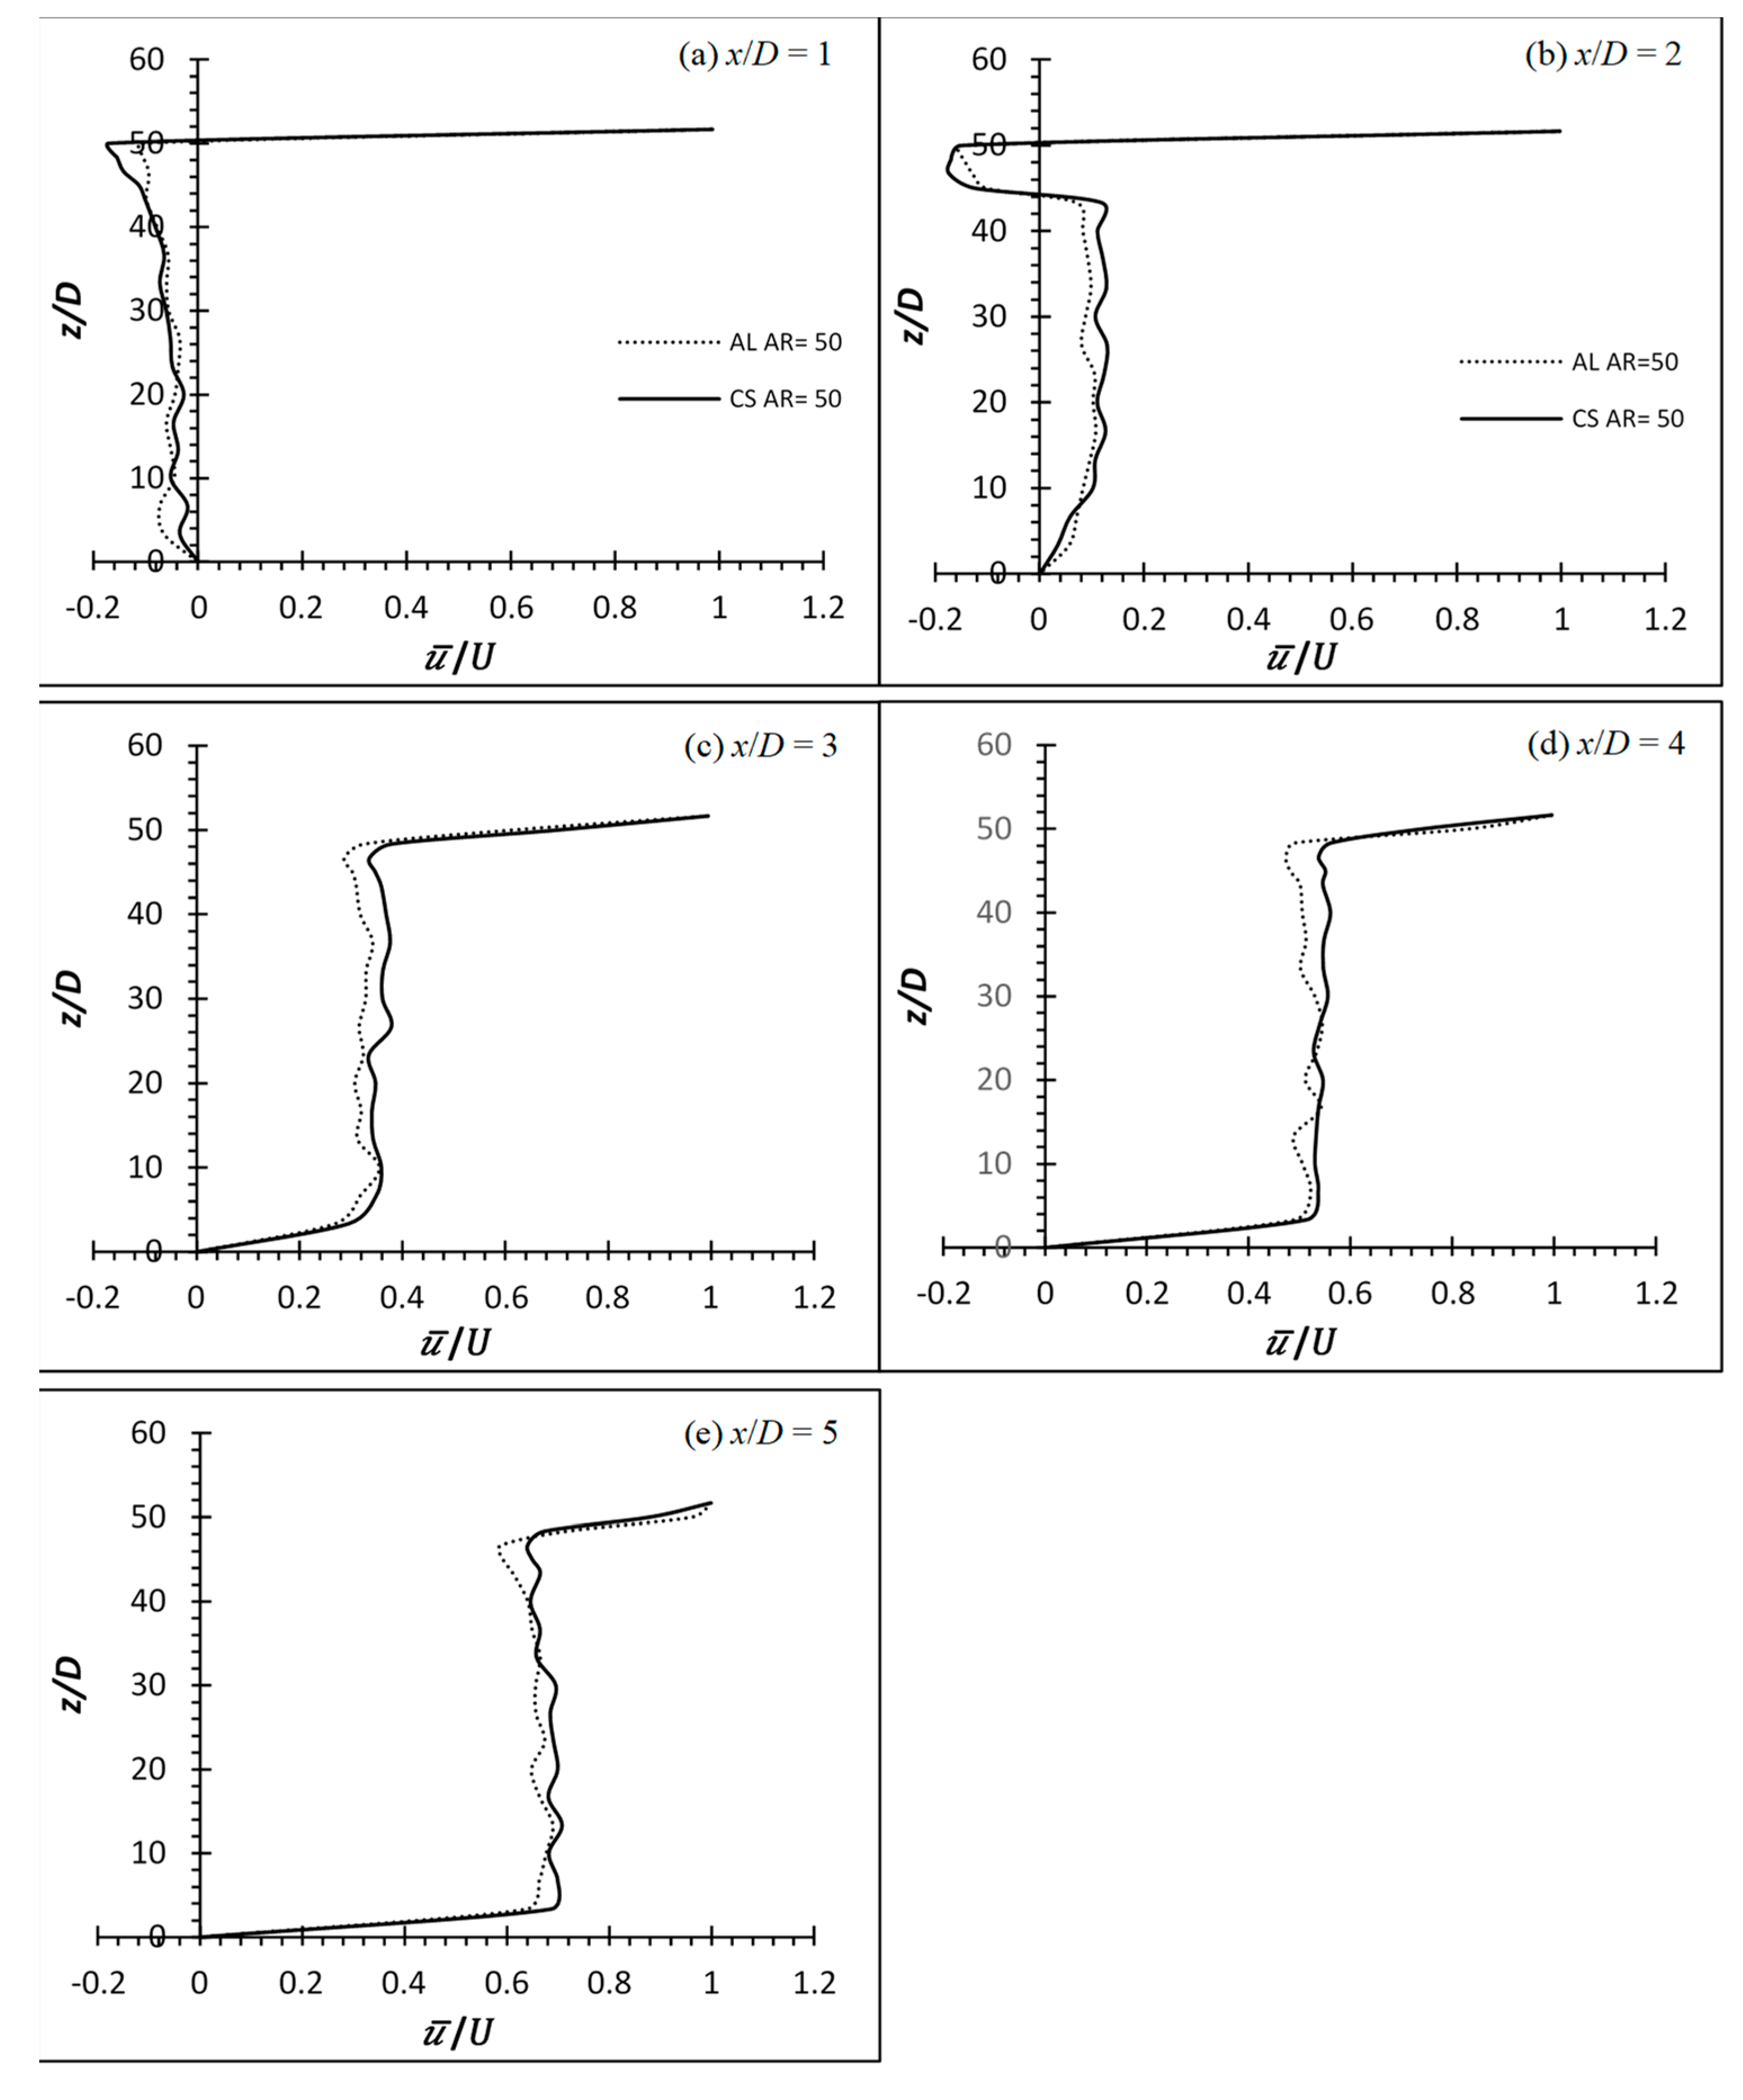
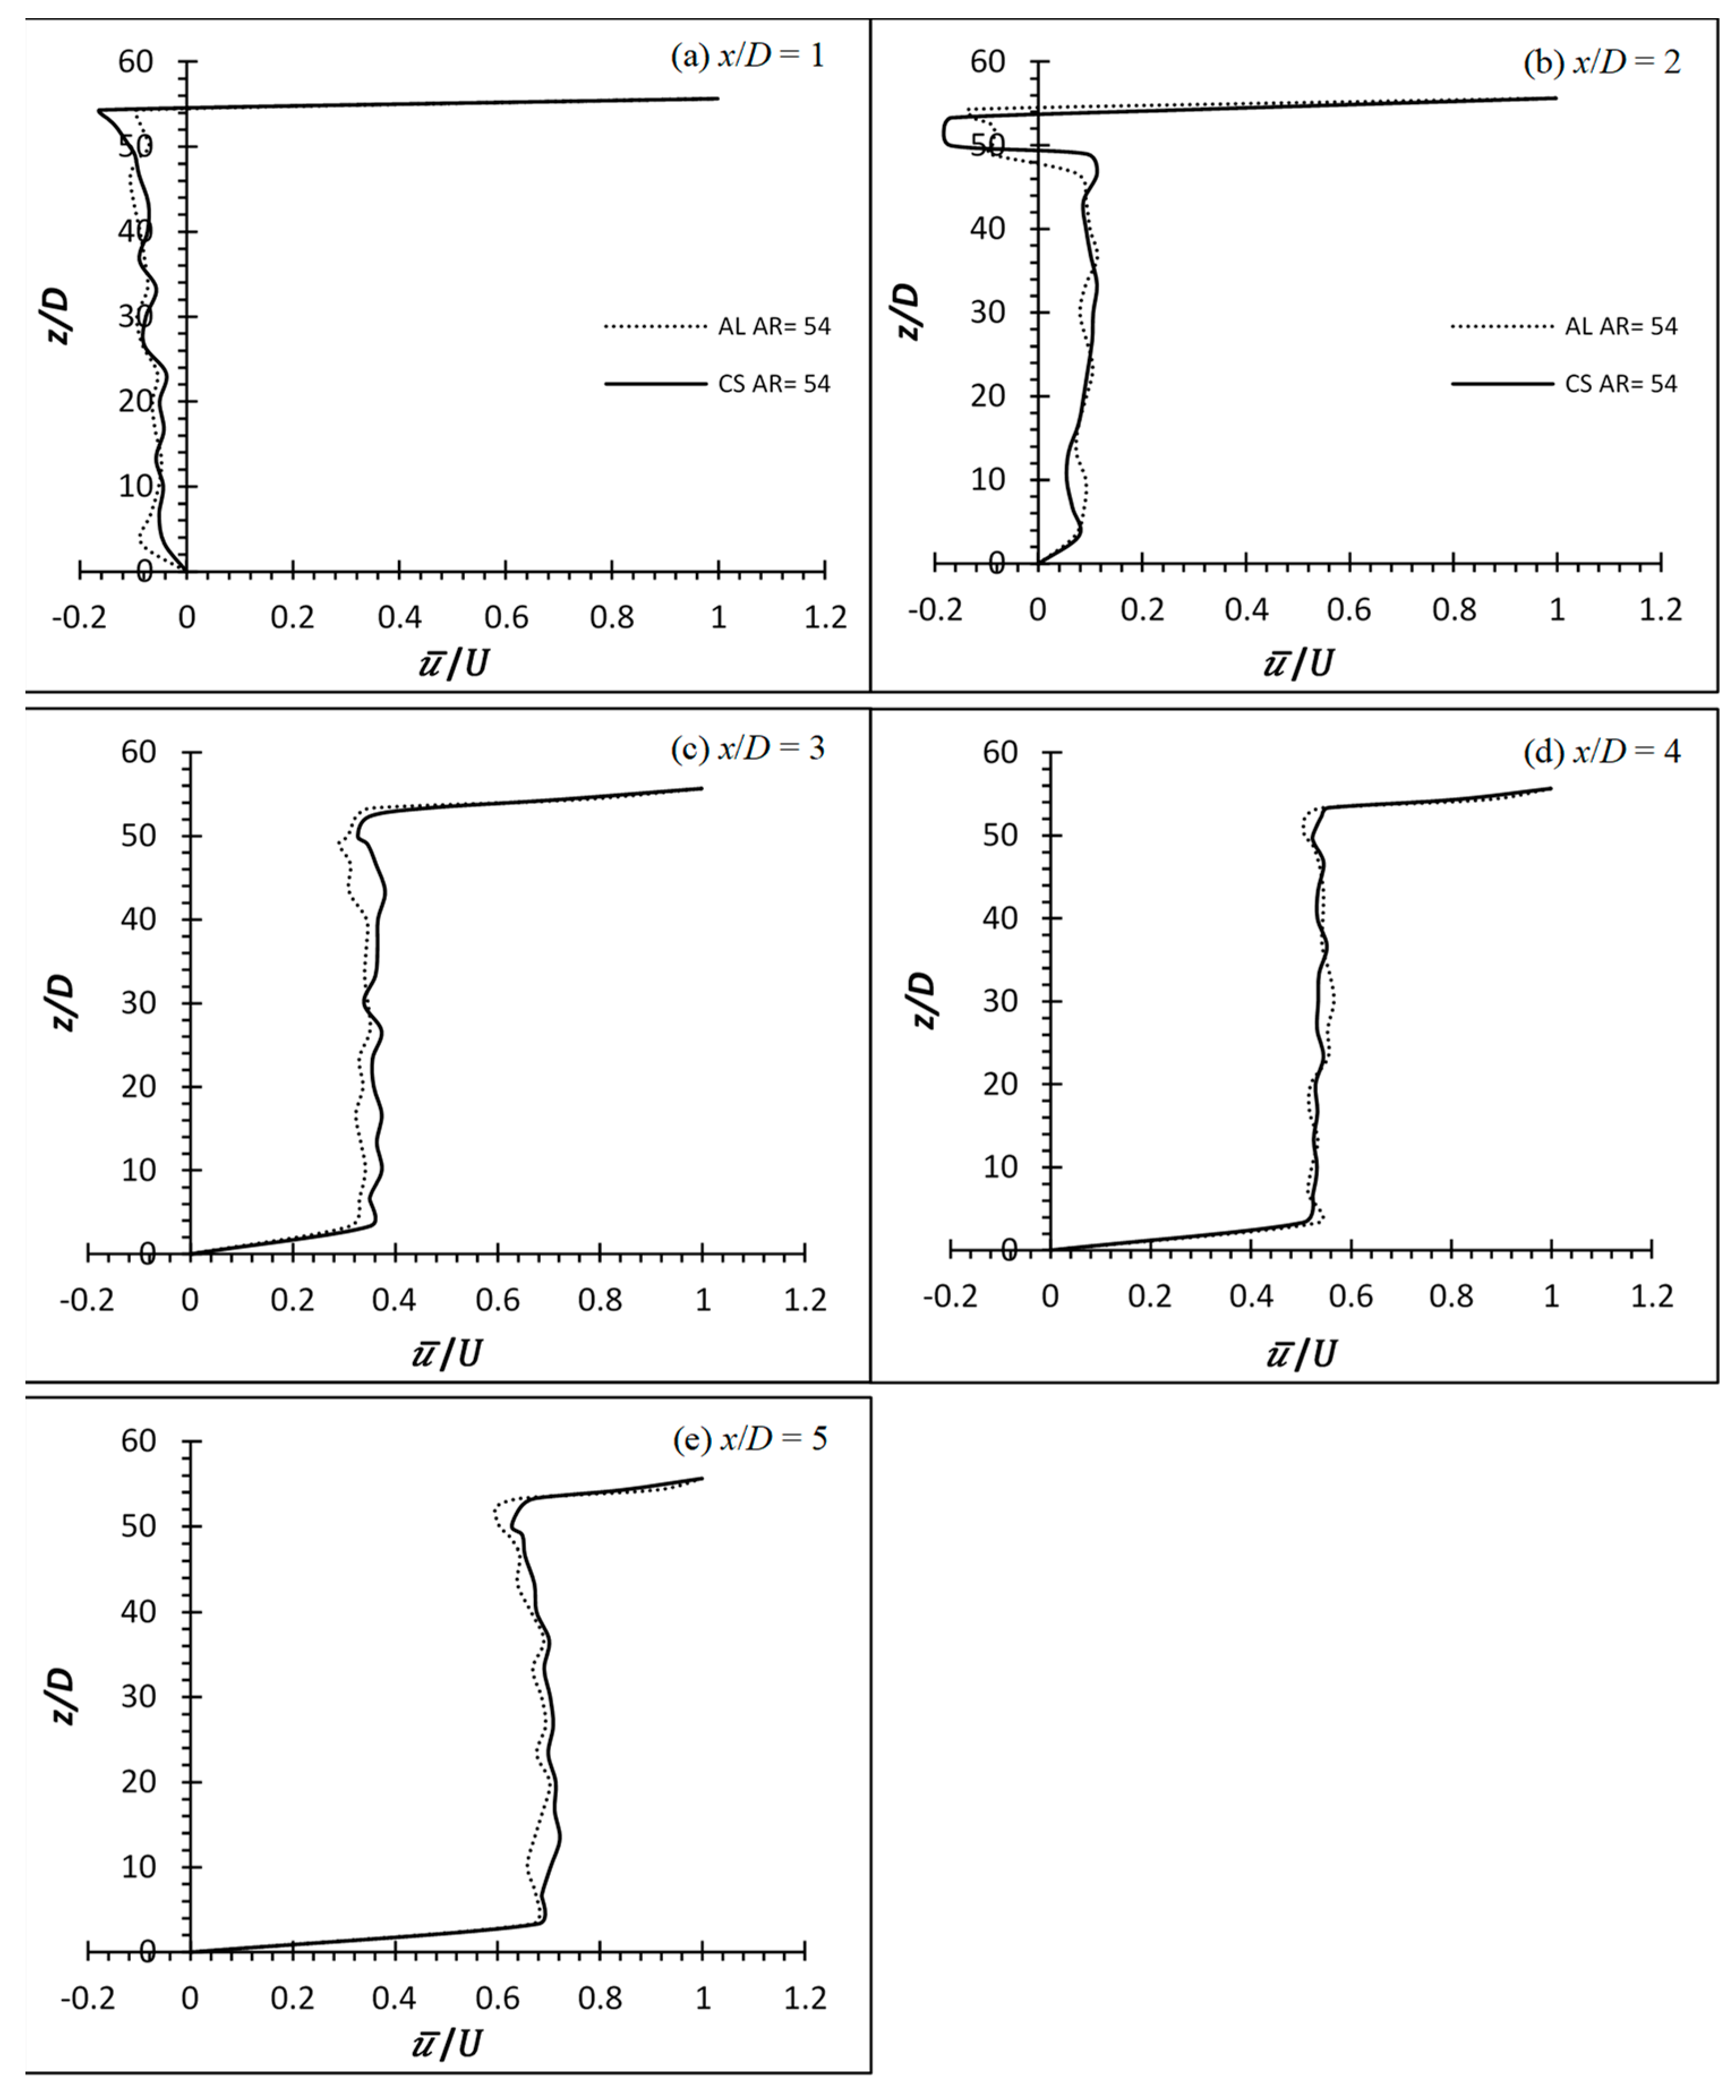
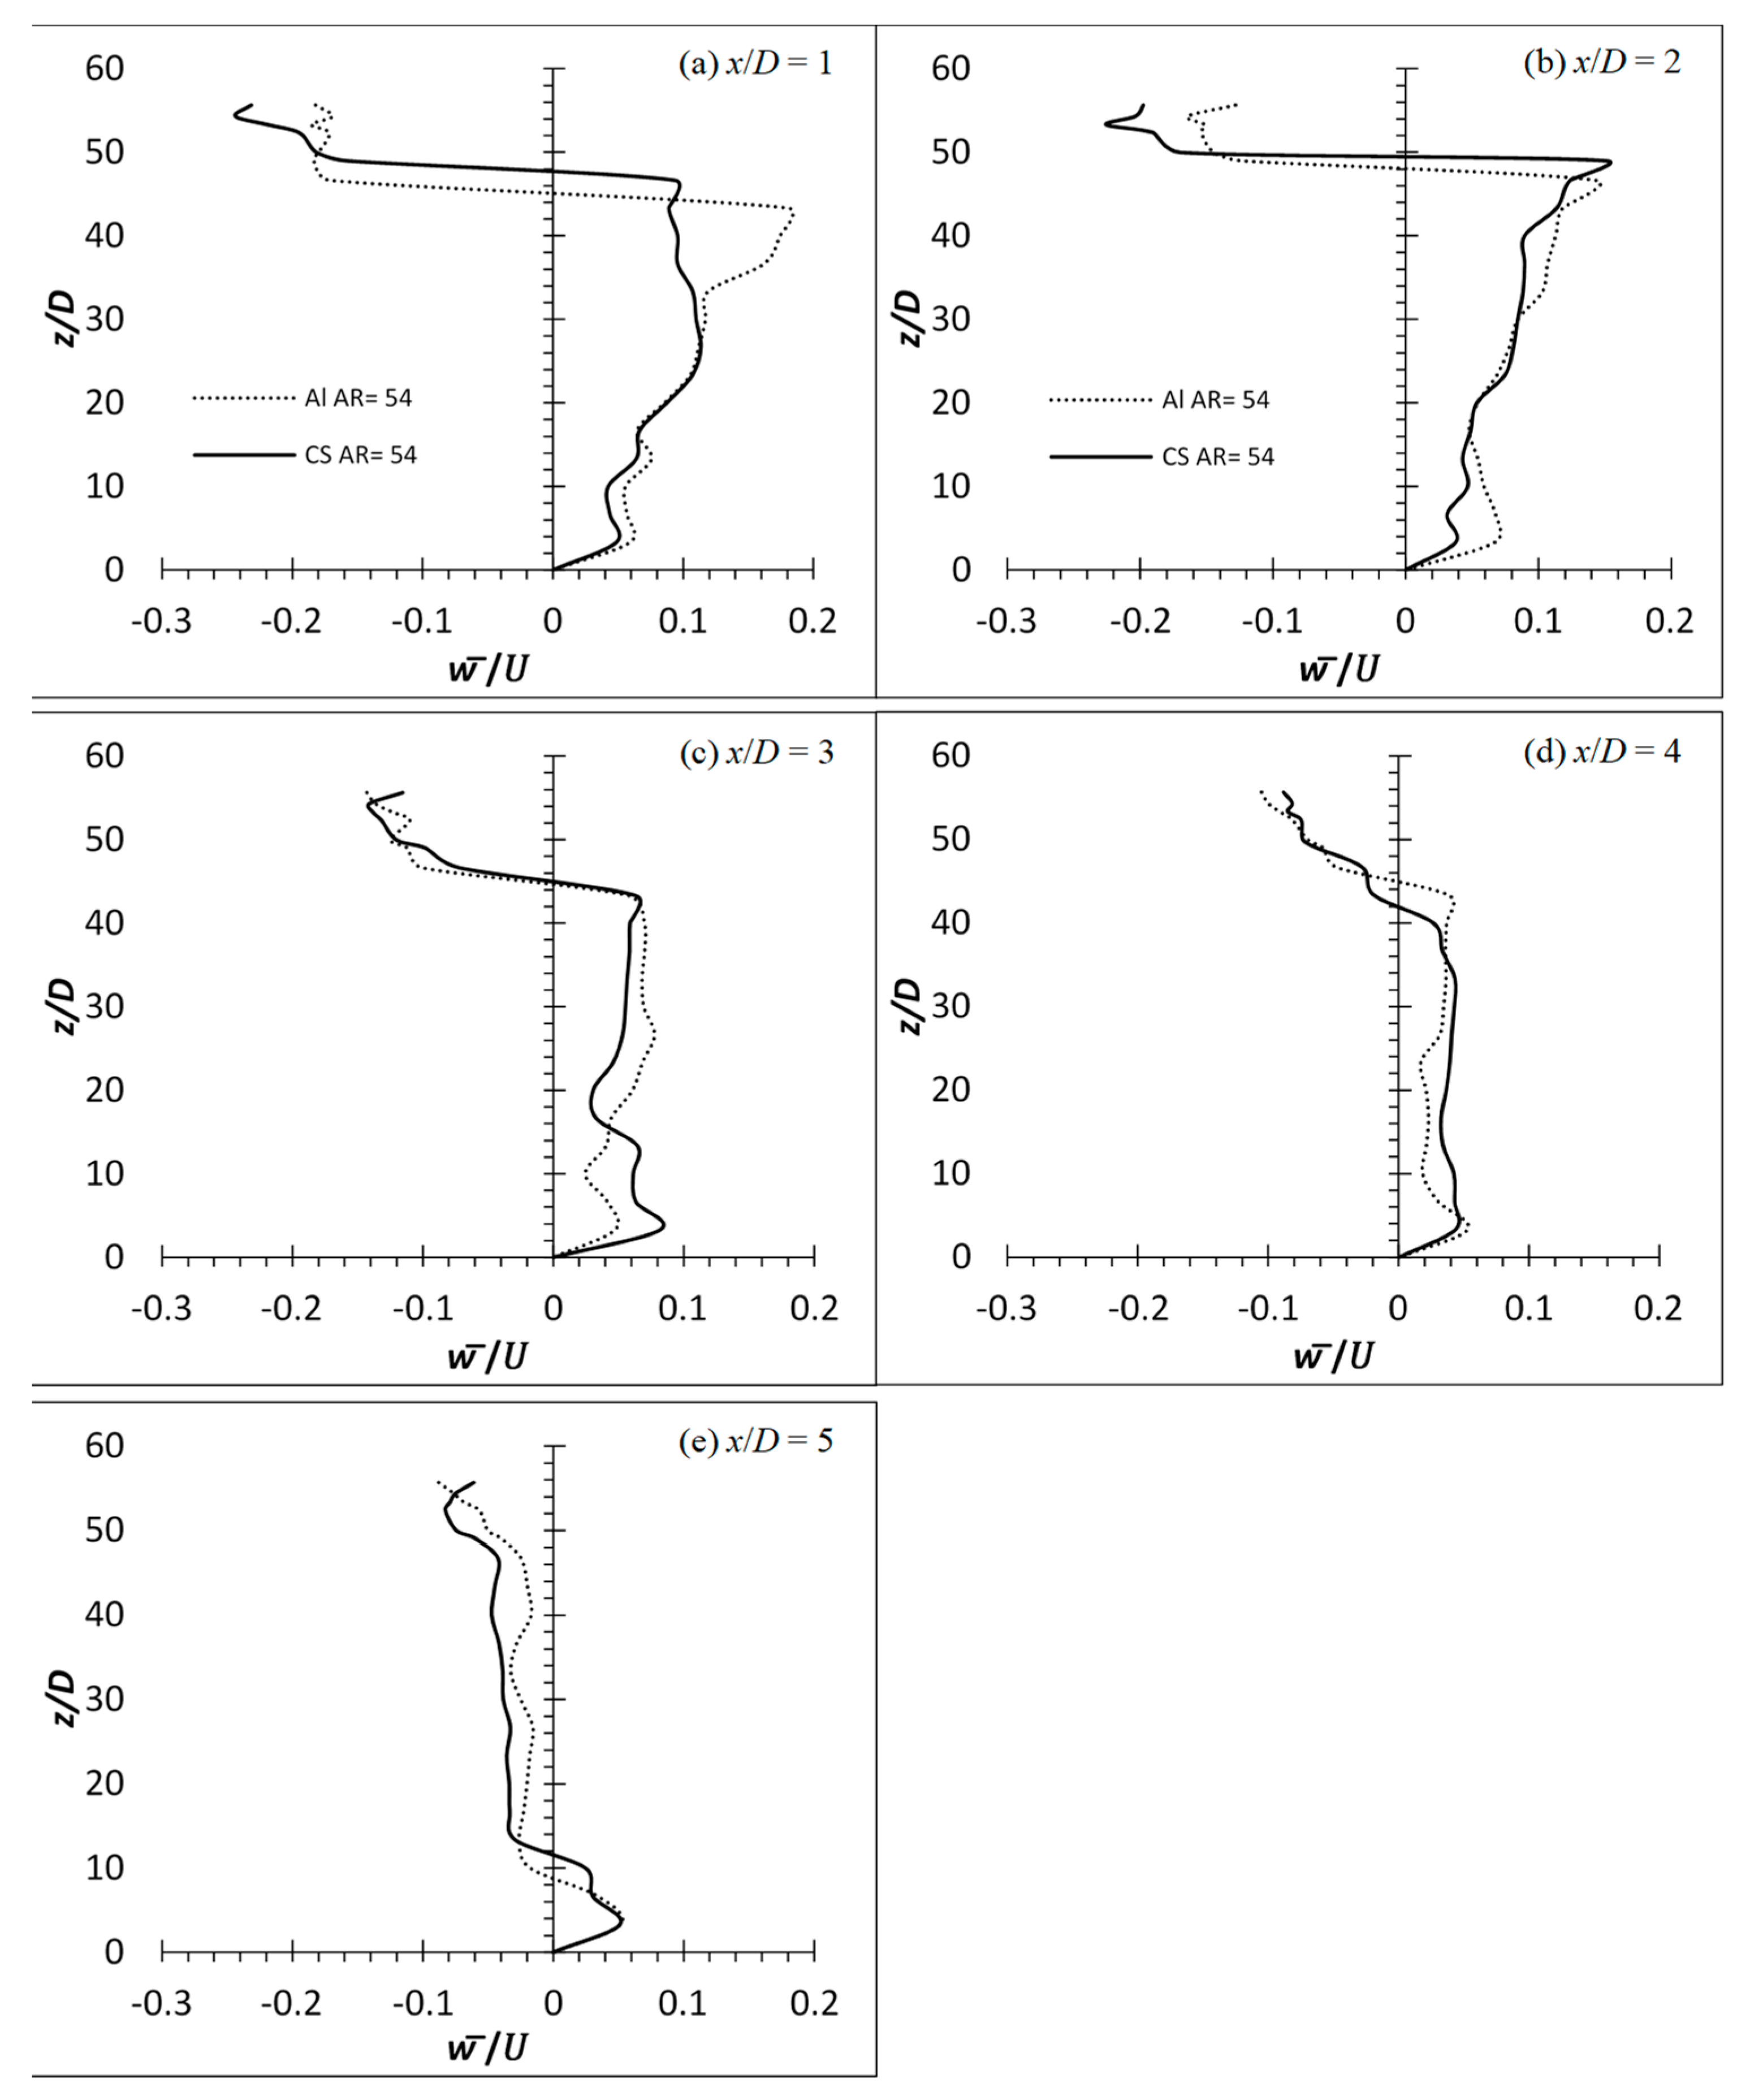
The time averaged () and () of flexible cylinders of AR = 50 and 54 on the wake centerline (y/D = 0) at Re = 2500 are shown in Figure 13, Figure 14, Figure 15 and Figure 16, respectively. The () and () for both materials at AR = 50 and 54 have hinted at the influence of downwash, as indicated by the higher localized negative w component velocity than the u component at a very near wake at x/D = 1 and 2 (compare Figure 13 and Figure 15 for aluminum and carbon steel cylinder of AR = 50 for example). Due to the extremely high AR (AR = 50 and 54), the influence of downwash is only affected from the free end to circa 7D from the free end at the near wake of x/D = 1 and 2 for both materials and AR in the span below that region is considered to be a two-dimensional flow region which is free from the tip vortex.
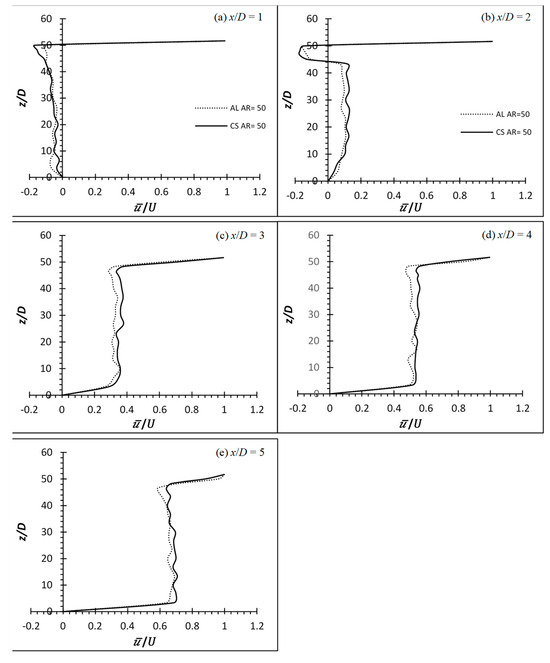
Figure 13.
Time averaged streamwise velocity profile of flexible finite cylinder (aluminum and carbon steel) of AR = 50 at wake centerline (y/D = 0) for Re = 2500. Aluminum is AL while carbon steel is CS.

Figure 14.
Time averaged streamwise velocity profile of flexible finite cylinder (aluminum and carbon steel) of AR = 54 at wake centerline (y/D = 0) for Re = 2500. Aluminum is AL while carbon steel is CS.
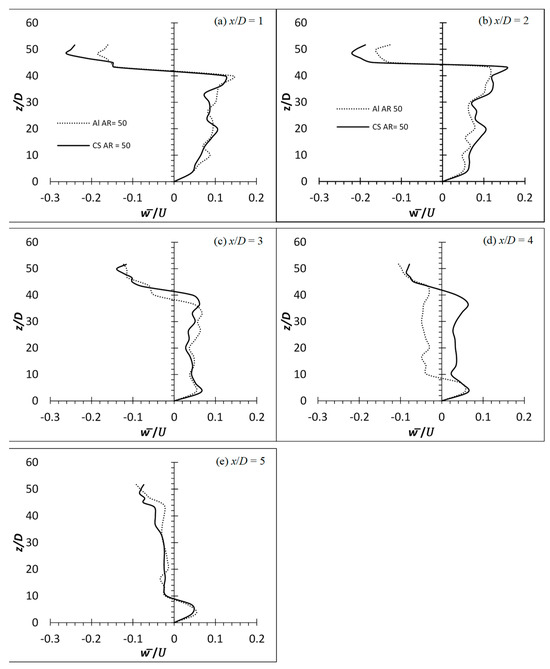
Figure 15.
Time averaged wall-normal velocity profile of flexible finite cylinder (aluminum and carbon steel) of AR = 50 at wake centerline (y/D = 0) for Re = 2500. Aluminum is Al while carbon steel is CS.

Figure 16.
Time averaged wall-normal velocity profile of flexible finite cylinder (aluminum and carbon steel) of AR = 54 at wake centerline (y/D = 0) for Re = 2500. Aluminum is Al while carbon steel is CS.
It is observed that no cylinders succumbed to the incoming force exerted on them by the oncoming fluid and deflected due to the relatively higher stiffness properties of both materials. Though the aluminum cylinders of both AR are not deflected in the x direction (too negligible), they do, however, oscillate/vibrate transversely. The downwash phenomenon is seen to be associated with all the metal group cylinders—carbon steel which acts like a rigid cylinder and aluminum which barely has any deflection but oscillates. As a result, it can be confirmed that the downwash phenomenon is caused by the deflection of the cylinder alone and not by the oscillation. Table 6 shows the average wake region based on the point of the greatest velocity gradient from the () profiles of EVA, aluminum and carbon steel cylinders. It is apparent to see from Table 6 that there is an increase in the wake region of the deflected cylinders; roughly equivalent to the deflected height of the cylinder.
Table 6.
The average wake region (in approximation) behind the rigid and flexible cylinders in different conditions.
In general, the () velocity profile might look similar for all the cylinders. However, the localized velocity for aluminum cylinders of both AR near the free end is slightly slower than that of carbon steel cylinders (see Figure 13 and Figure 14). The lower velocities of the aluminum cylinders could be due to the transverse oscillation of the cylinders (see [6]). As the cylinder is oscillating transverse to the flow, more energy from the mean flow is needed to account for the higher fluctuation velocities due to the higher shear rate and, hence, the lower velocities. On the contrary, throughout the experiment, it is observed that no oscillation phenomenon occurs for the carbon steel cylinders of both AR. As a result, the carbon steel cylinder behaves in the same manner as the rigid cylinder.
3.2. Turbulence Intensity
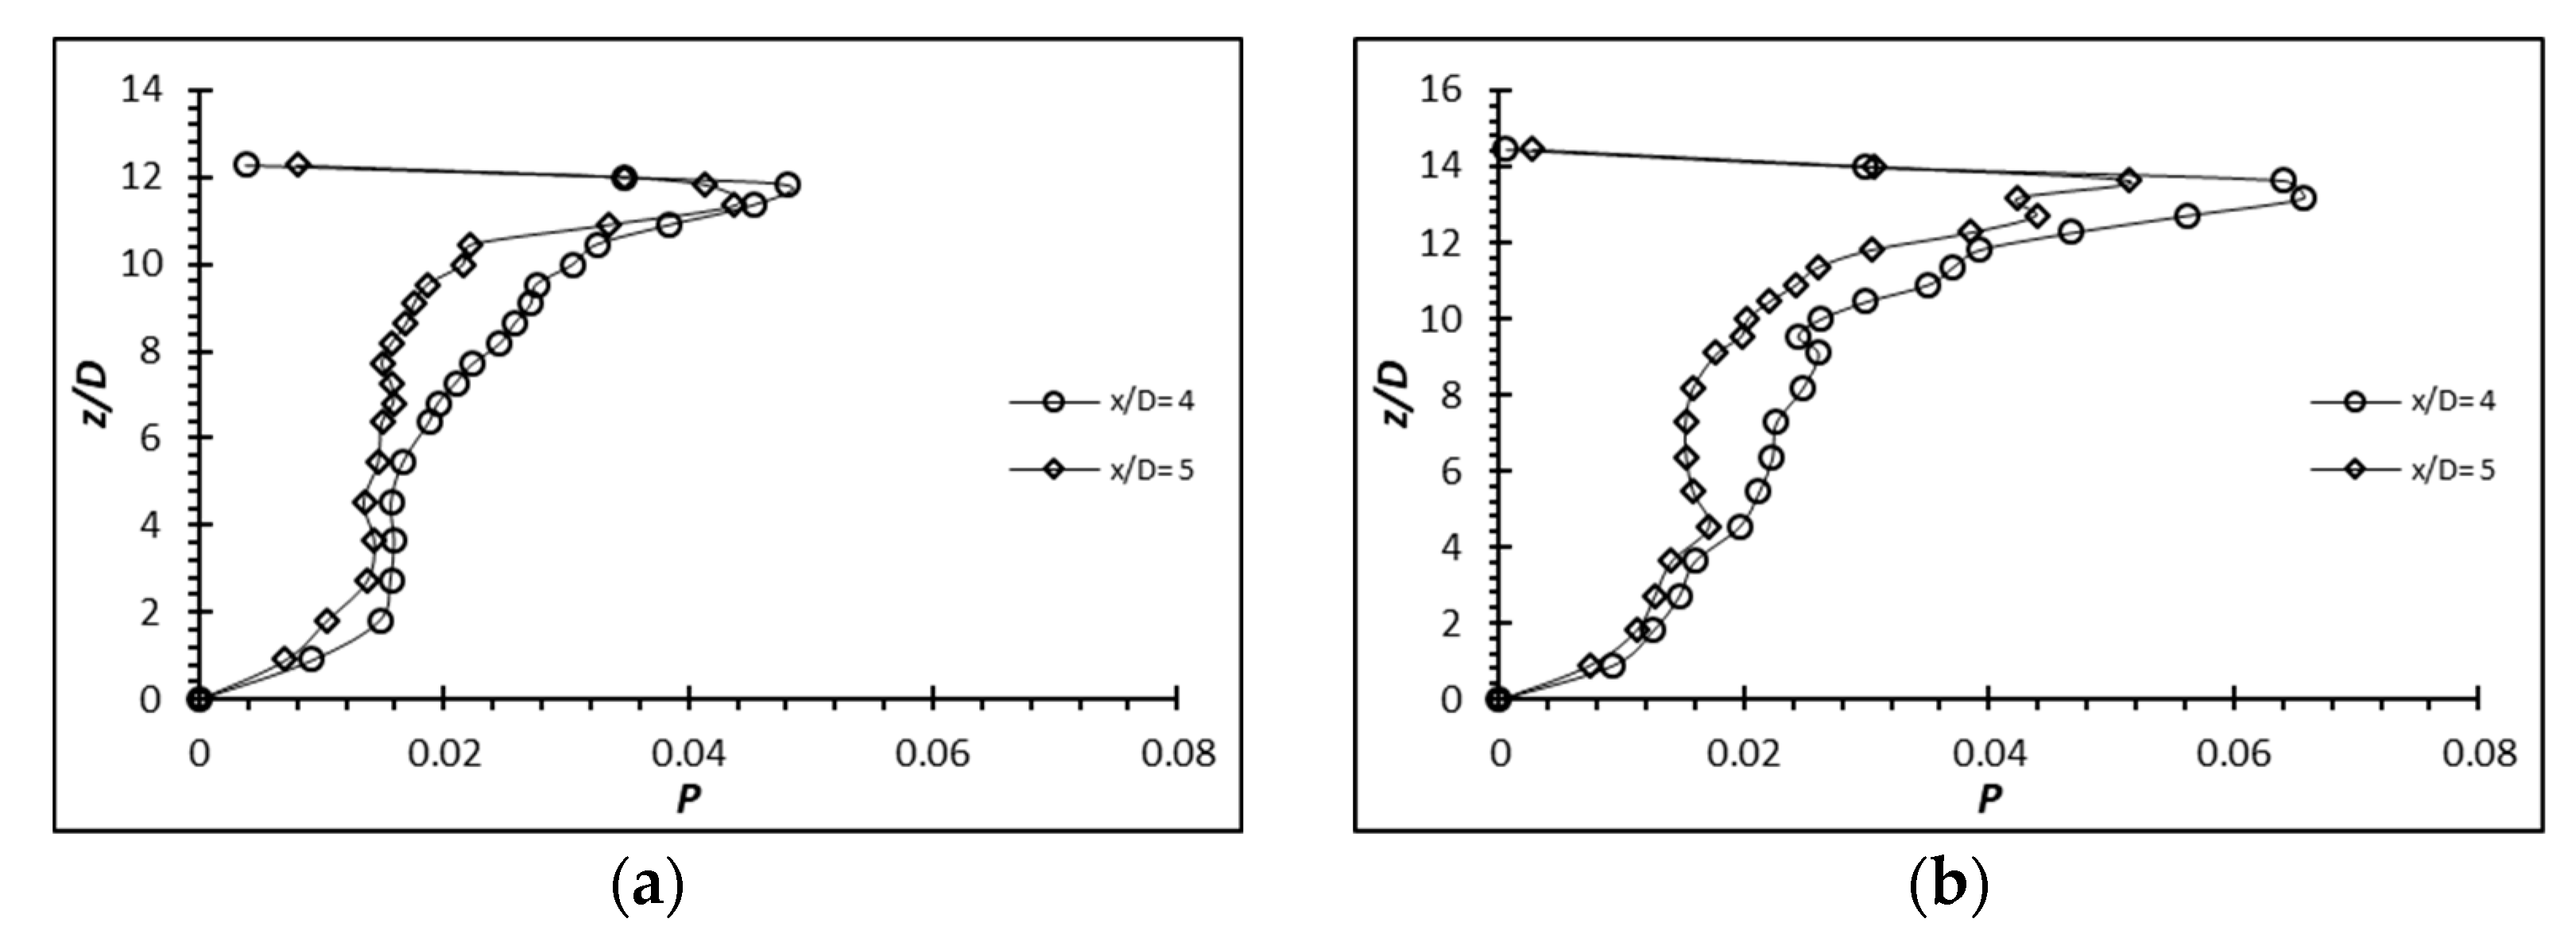
The distributions of the streamwise turbulence intensity (u′/U) and the wall-normal turbulence intensity (w′/U) of cylinders of AR = 12 and 14 at Re = 4000, 6000 and 8000 in the wake centerline (y/D = 0) are analyzed. Though both the EVA cylinders are of the same material, the AR is different, therefore, the stiffness of the cylinders is affected; hence, it is suspected that there will be differences in the magnitude of the (u′/U). In general, all of the cylinders have experienced an increment over the rigid cylinder of AR = 10 at Re = 4000, which is (/U) ≈ 26.14%. They show an elevated region near z/D = AR − 3, corresponding to the region where the cylinder oscillates most. Despite that, the magnitude of (/U) is very different for each cylinder. AR = 12 has a localized (/U) ≈ 42.14%, 48.44% and 41.66% at increasing Re (Figure 17). On the other hand, AR = 14 has a localized (/U) ≈ 52.39%, 64.48% and 43.64% at increasing Re (Figure 18).
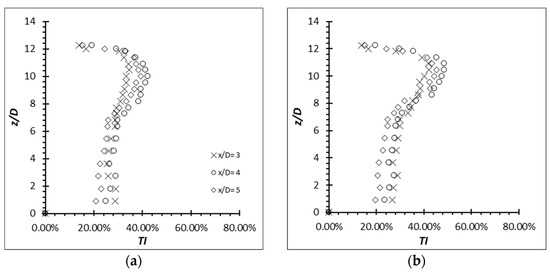
Figure 17.
Turbulence intensity distribution for AR = 12 at (a) Re = 4000; (b) Re = 6000.
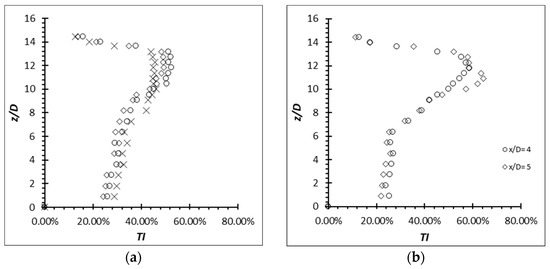
Figure 18.
Turbulence intensity distribution for AR = 14 at (a) Re = 4000; (b) Re = 6000.
It is observed that the localized (/U) of AR = 12 and 14 at Re = 8000 suffer from huge increments. It is therefore clear that the increment of the (u′/U) does not depend directly on the AR or Re; instead, it is the oscillating motion that is subjected to different AR or Re as it affects the structural stiffness. Mittal and Kumar [24] concluded that the motion of the cylinder alters the flow field significantly in their simulation in an attempt to investigate the VIV of a light circular cylinder in a uniform flow.
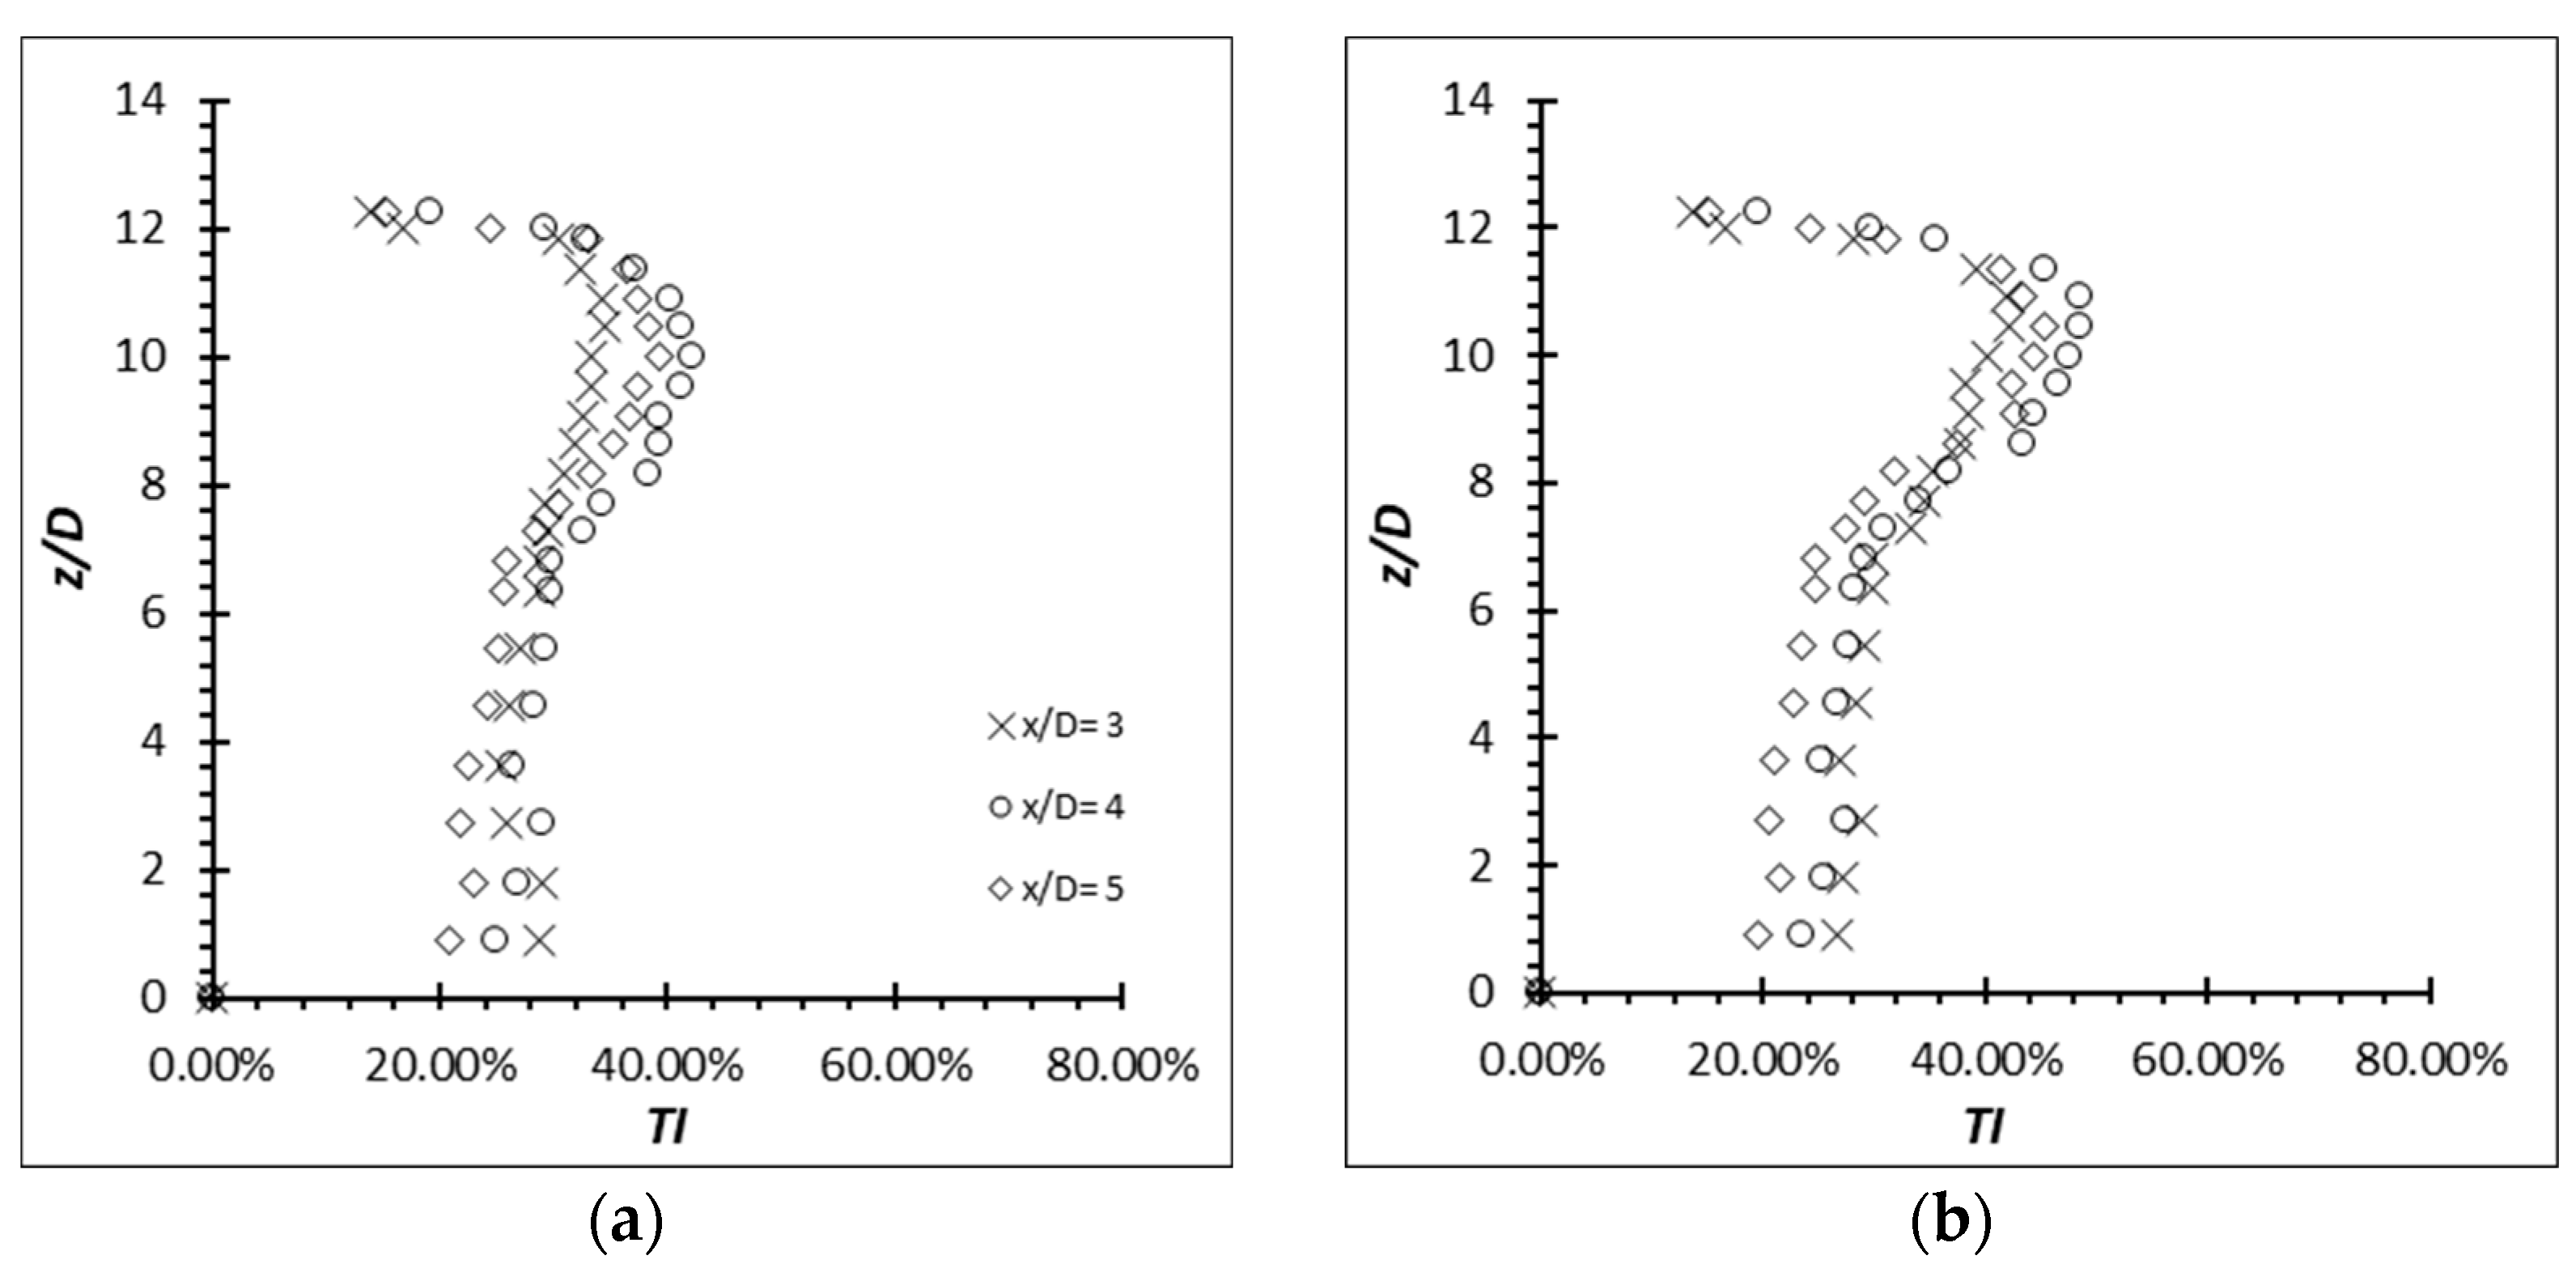
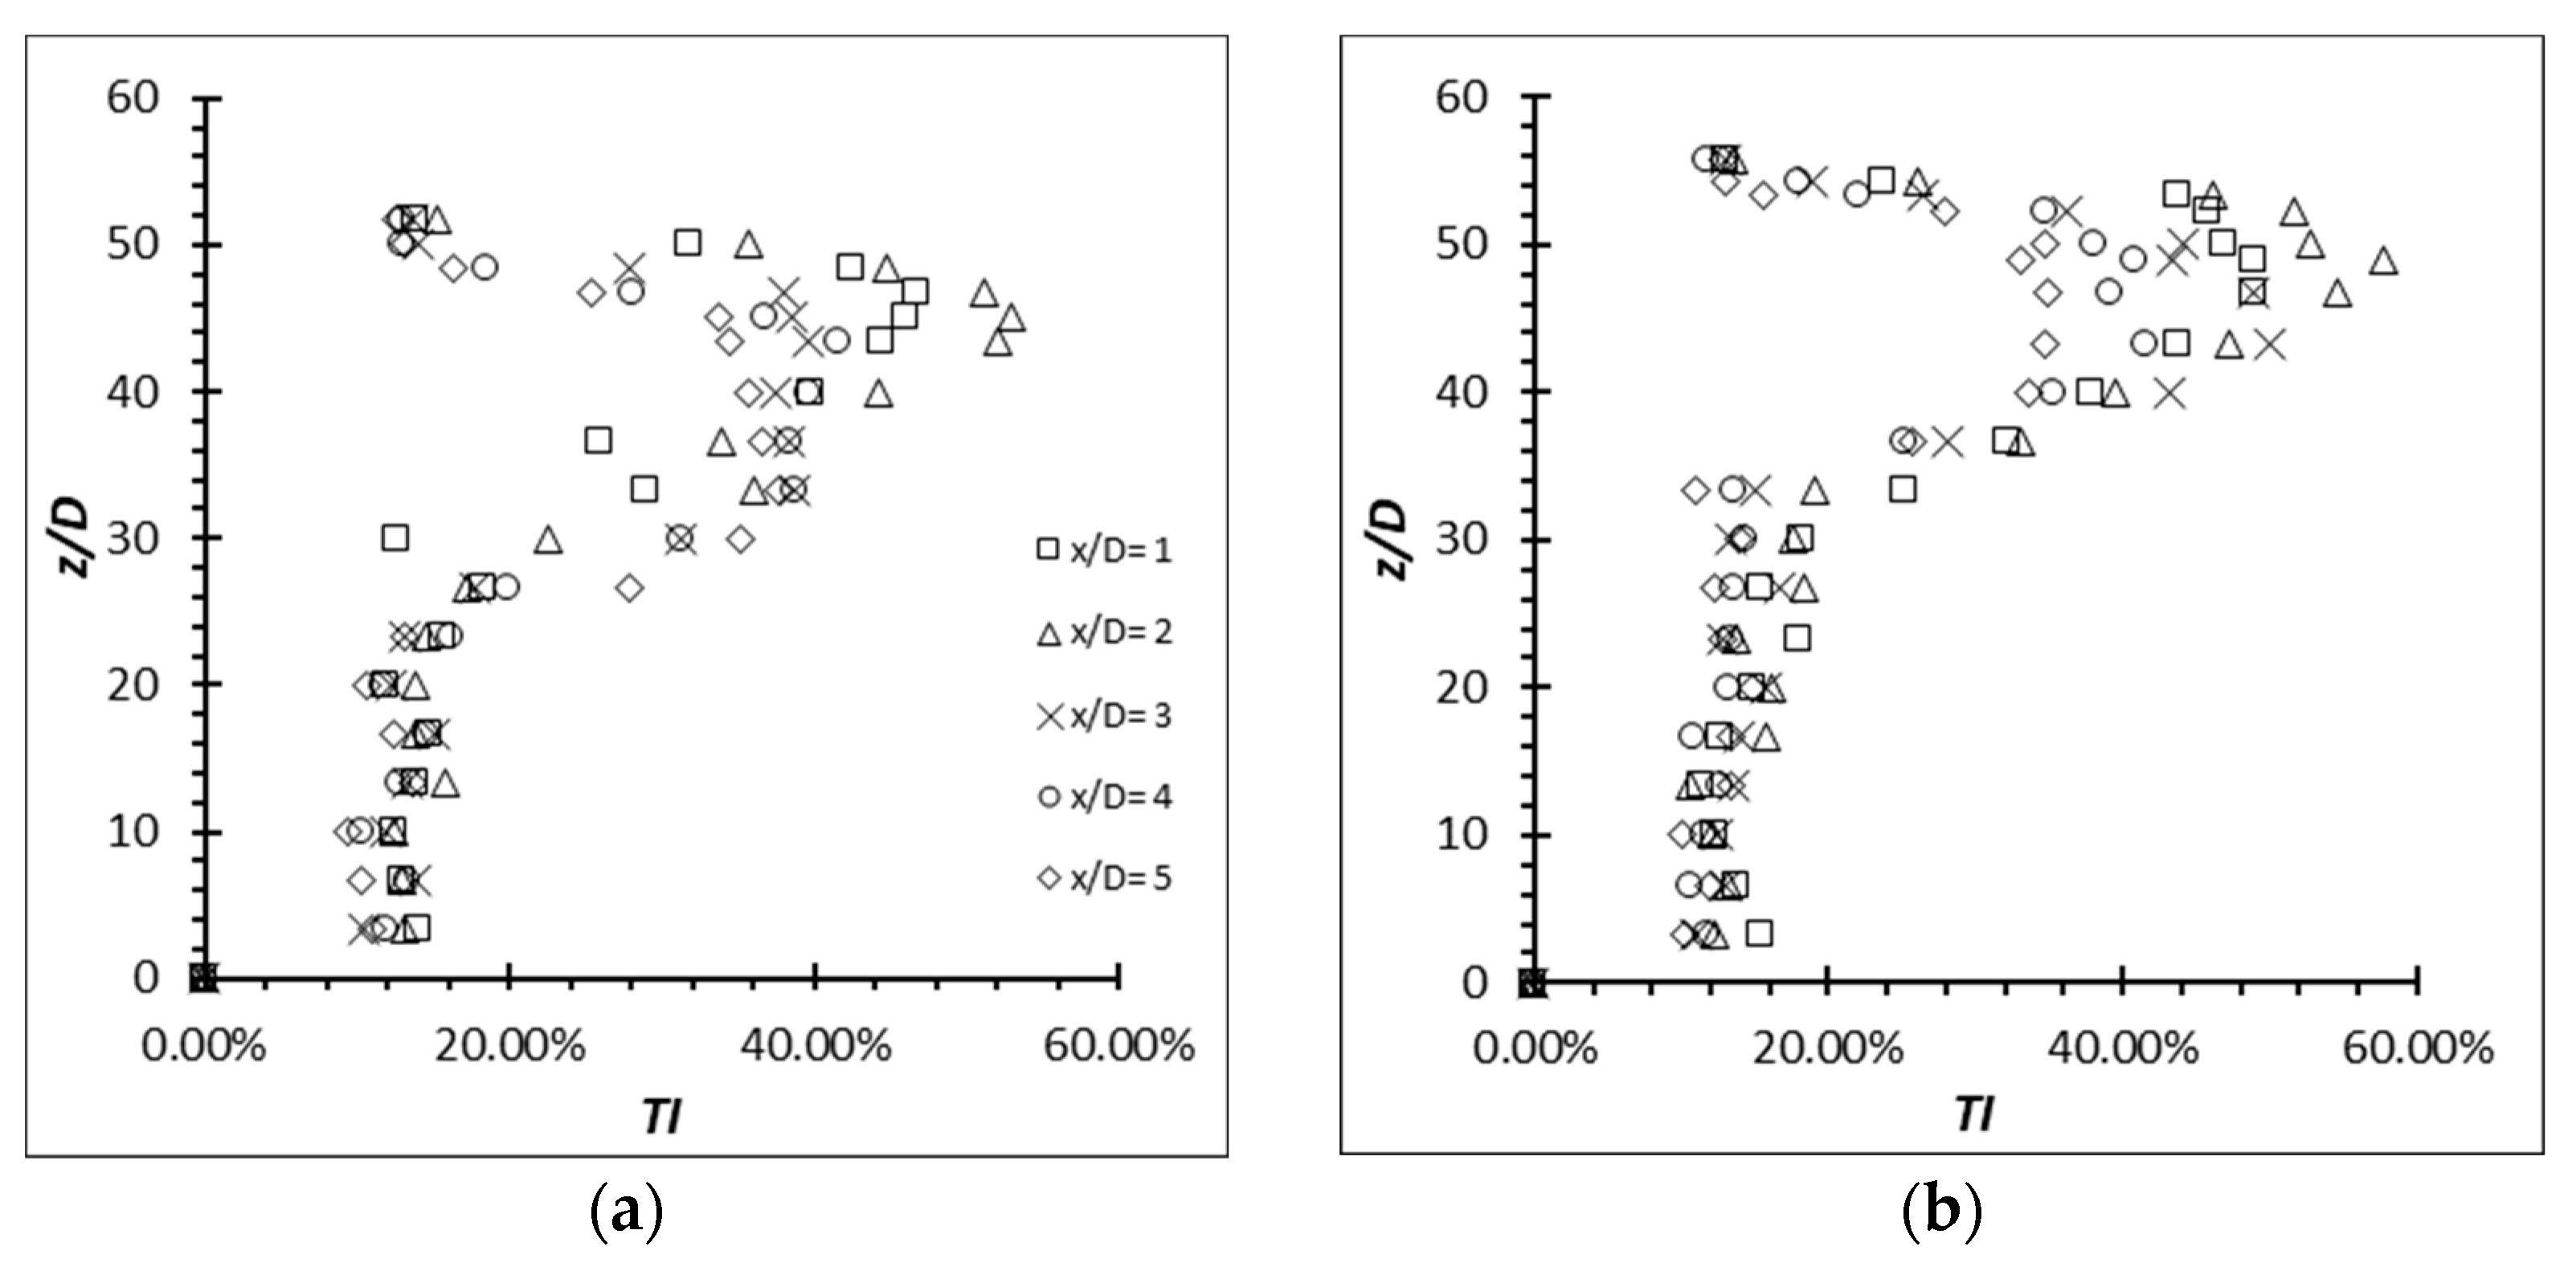
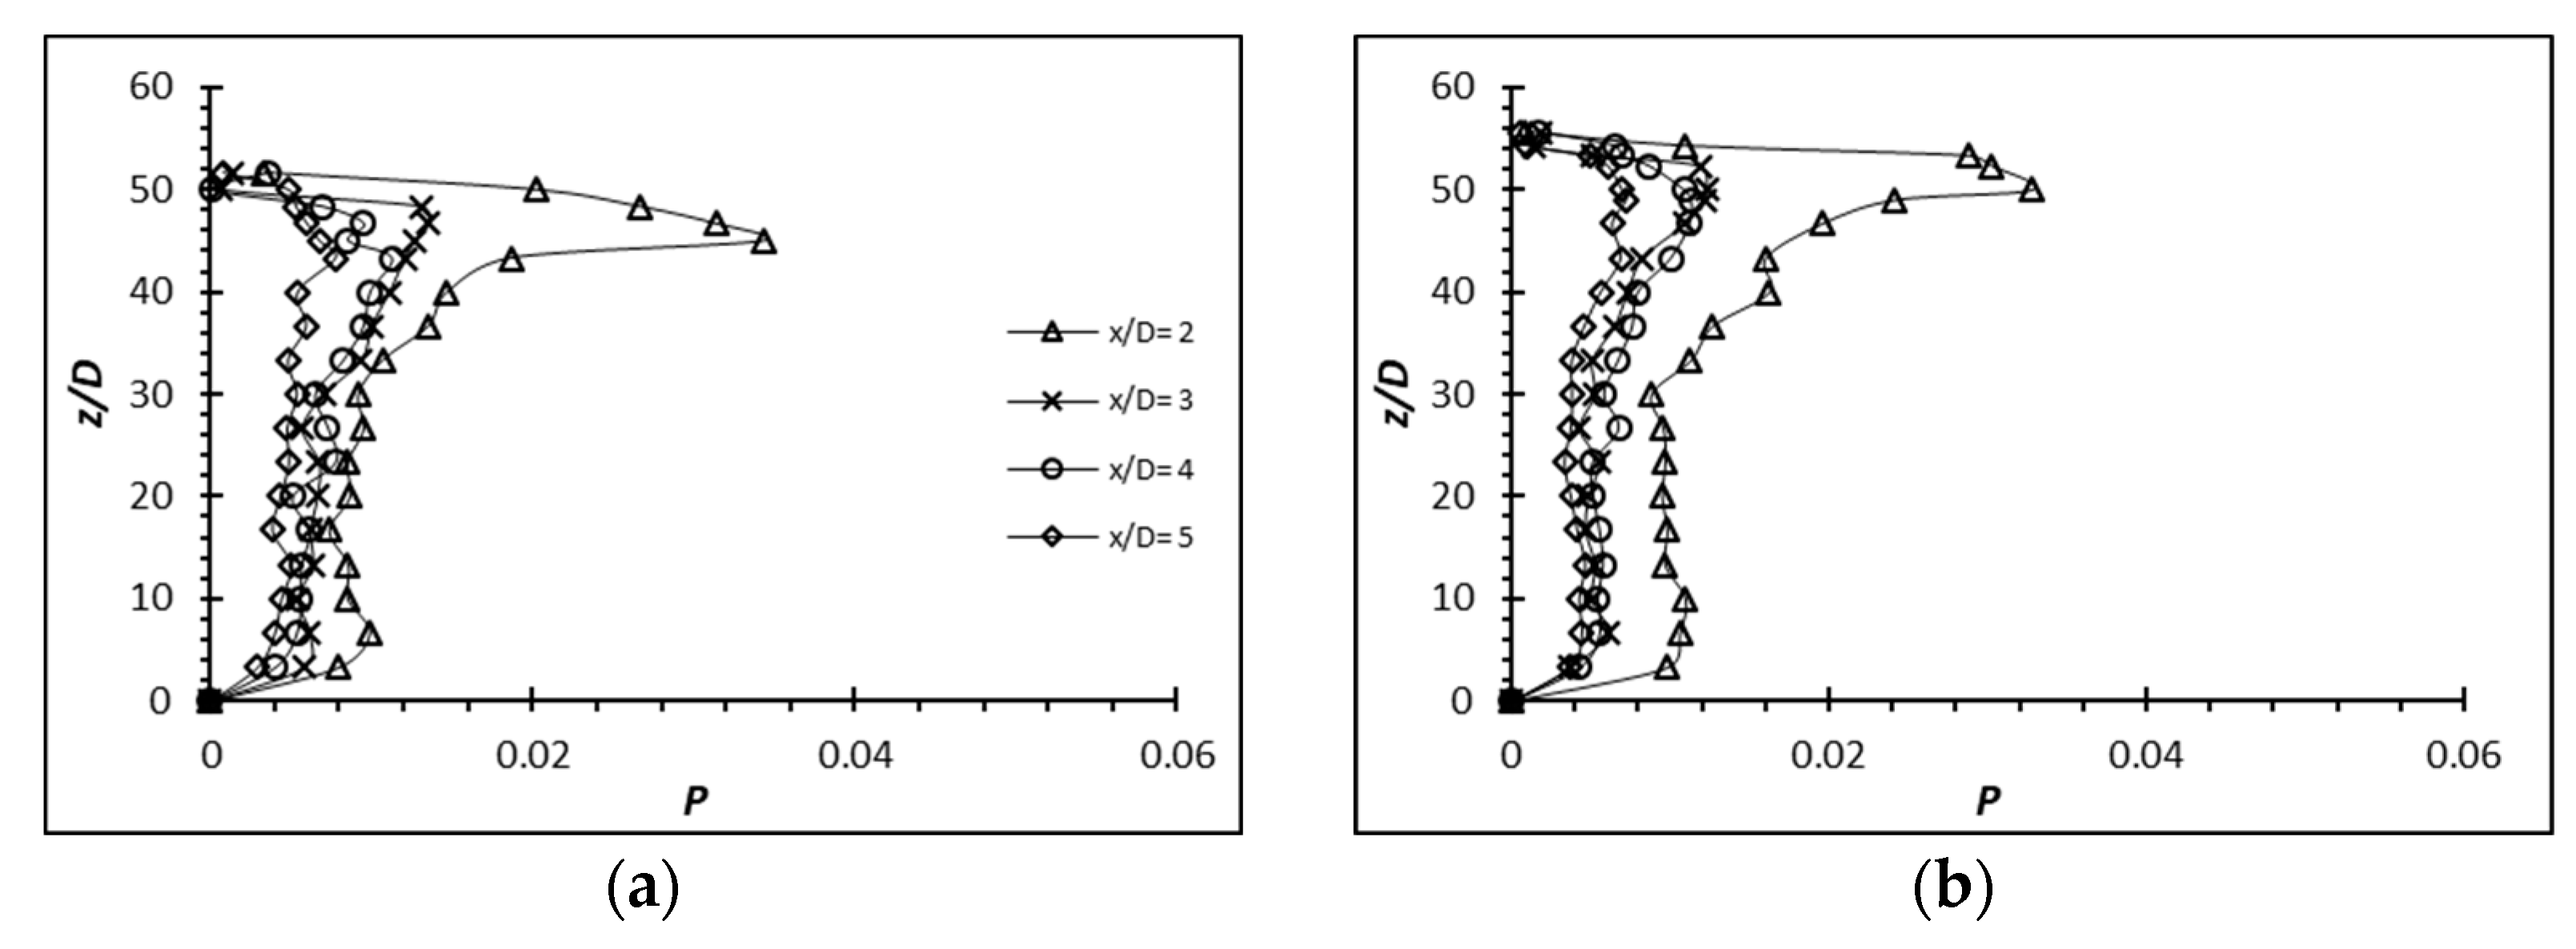
The distributions of the streamwise turbulence intensity (u′/U) and the wall-normal turbulence intensity (w′/U) of aluminum and carbon steel cylinders of AR = 50 and 54 at Re = 2500 in the wake centerline (y/D = 0) are also analyzed and shown in Figure 19 and Figure 20. It is noticeable that the localized (/U) of the metal group flexible cylinders is at approximately 5D from the free end at x/D = 2, unlike the EVA flexible cylinders. Beyond x/D = 2, the (u′/U) quickly subsides. This suggests that the downwash phenomenon due to no deflection of the metal group flexible cylinders has directed most of the vortical activities downward as the vortical activities follow the flow.

Figure 19.
Turbulence intensity distribution for aluminum cylinder at Re = 2500. (a) AR = 50; (b) AR = 54.
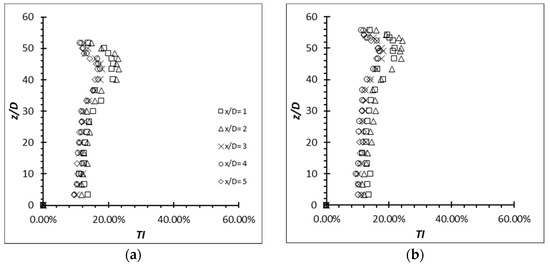
Figure 20.
Turbulence intensity distribution for carbon steel cylinder at Re = 2500. (a) AR = 50; (b) AR = 54.
According to Figure 19, in the aluminum cylinder, the localized (/U) is scattered around 1/3 of the cylinder’s span near the free end at z/D ≈ 33D to the free end. In contrast to that, the localized (/U) produced by the carbon steel cylinder (see Figure 20) is seen to concentrate only at the region from the free end to z/D ≈ AR − 10D; a smaller area of elevated turbulence intensity compared to the aluminum cylinder. The reason for the smaller area of augmented turbulence intensity could be the carbon steel cylinders behaving exactly as the rigid cylinder does. Despite not having an x deflection for the aluminum cylinder, it did vibrate at a comparatively high oscillating frequency (see Figure 21 and Figure 22). As the vibration takes place the most at the free end and subsides along the span (its local stiffness is the least stiff at the free end and slowly increases along the span towards the fixed end), the region where the vibration takes place has augmented the turbulence intensity; hence the larger area of elevated turbulence intensity for the aluminum cylinder. This finding is also in agreement with the findings from Thulukkanam [25] where VIV (vibration of the cylinder caused by the vortices shed) can increase the strength of the vortices shed.

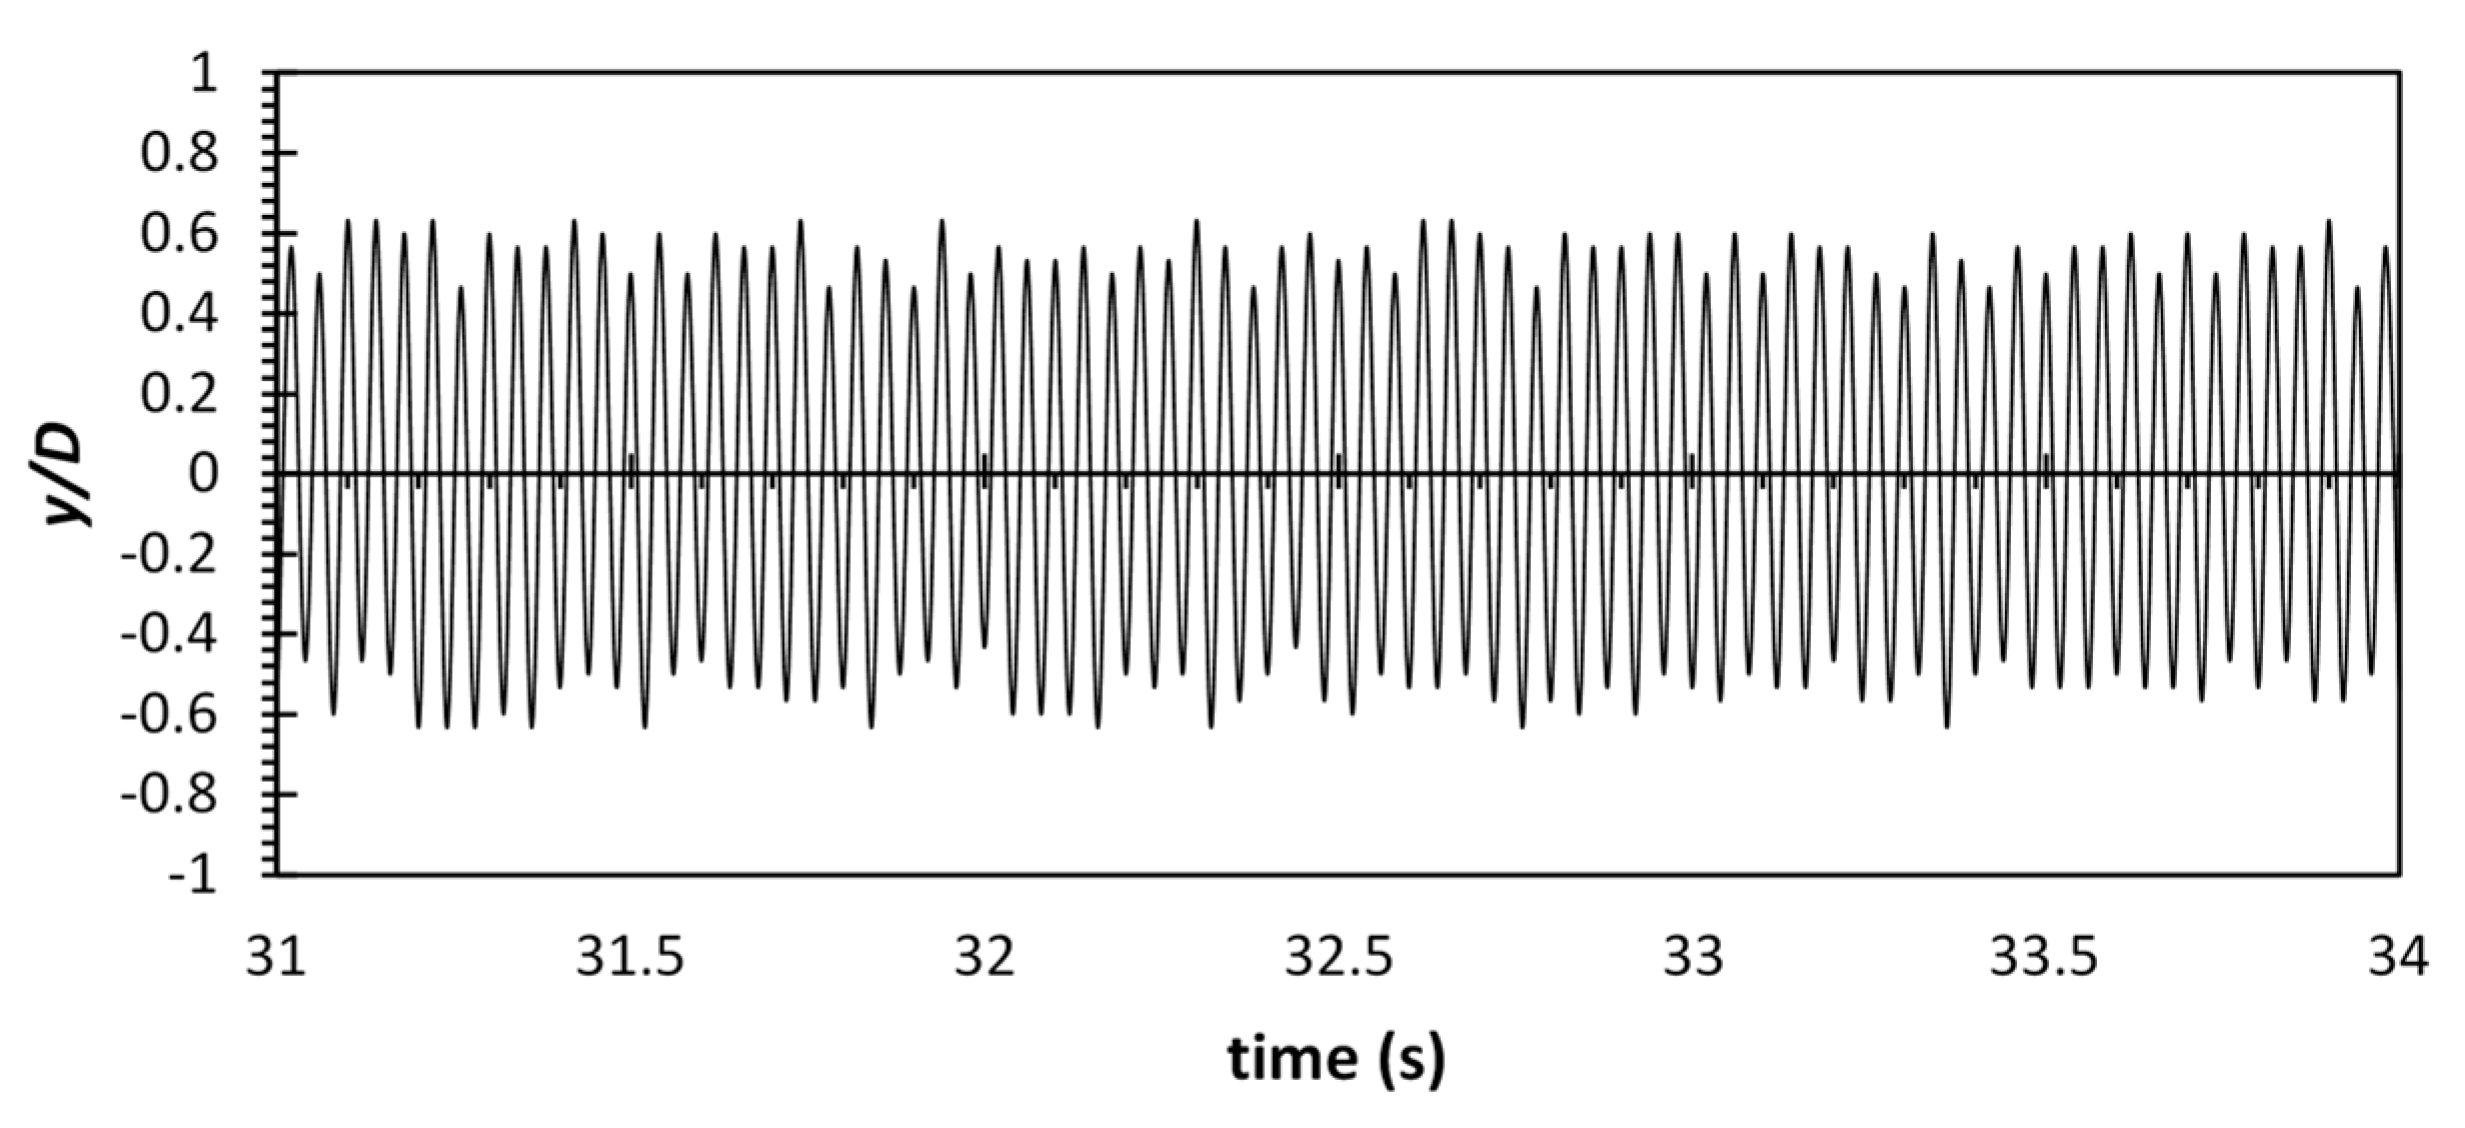
Figure 21.
Oscillation of flexible aluminum cylinder of AR = 50 at Re = 2500.
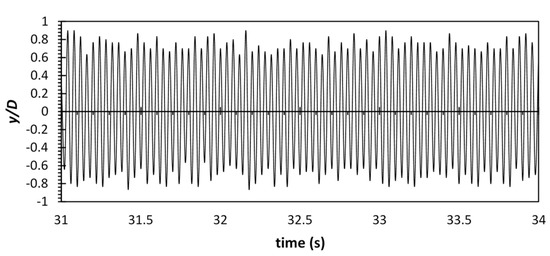
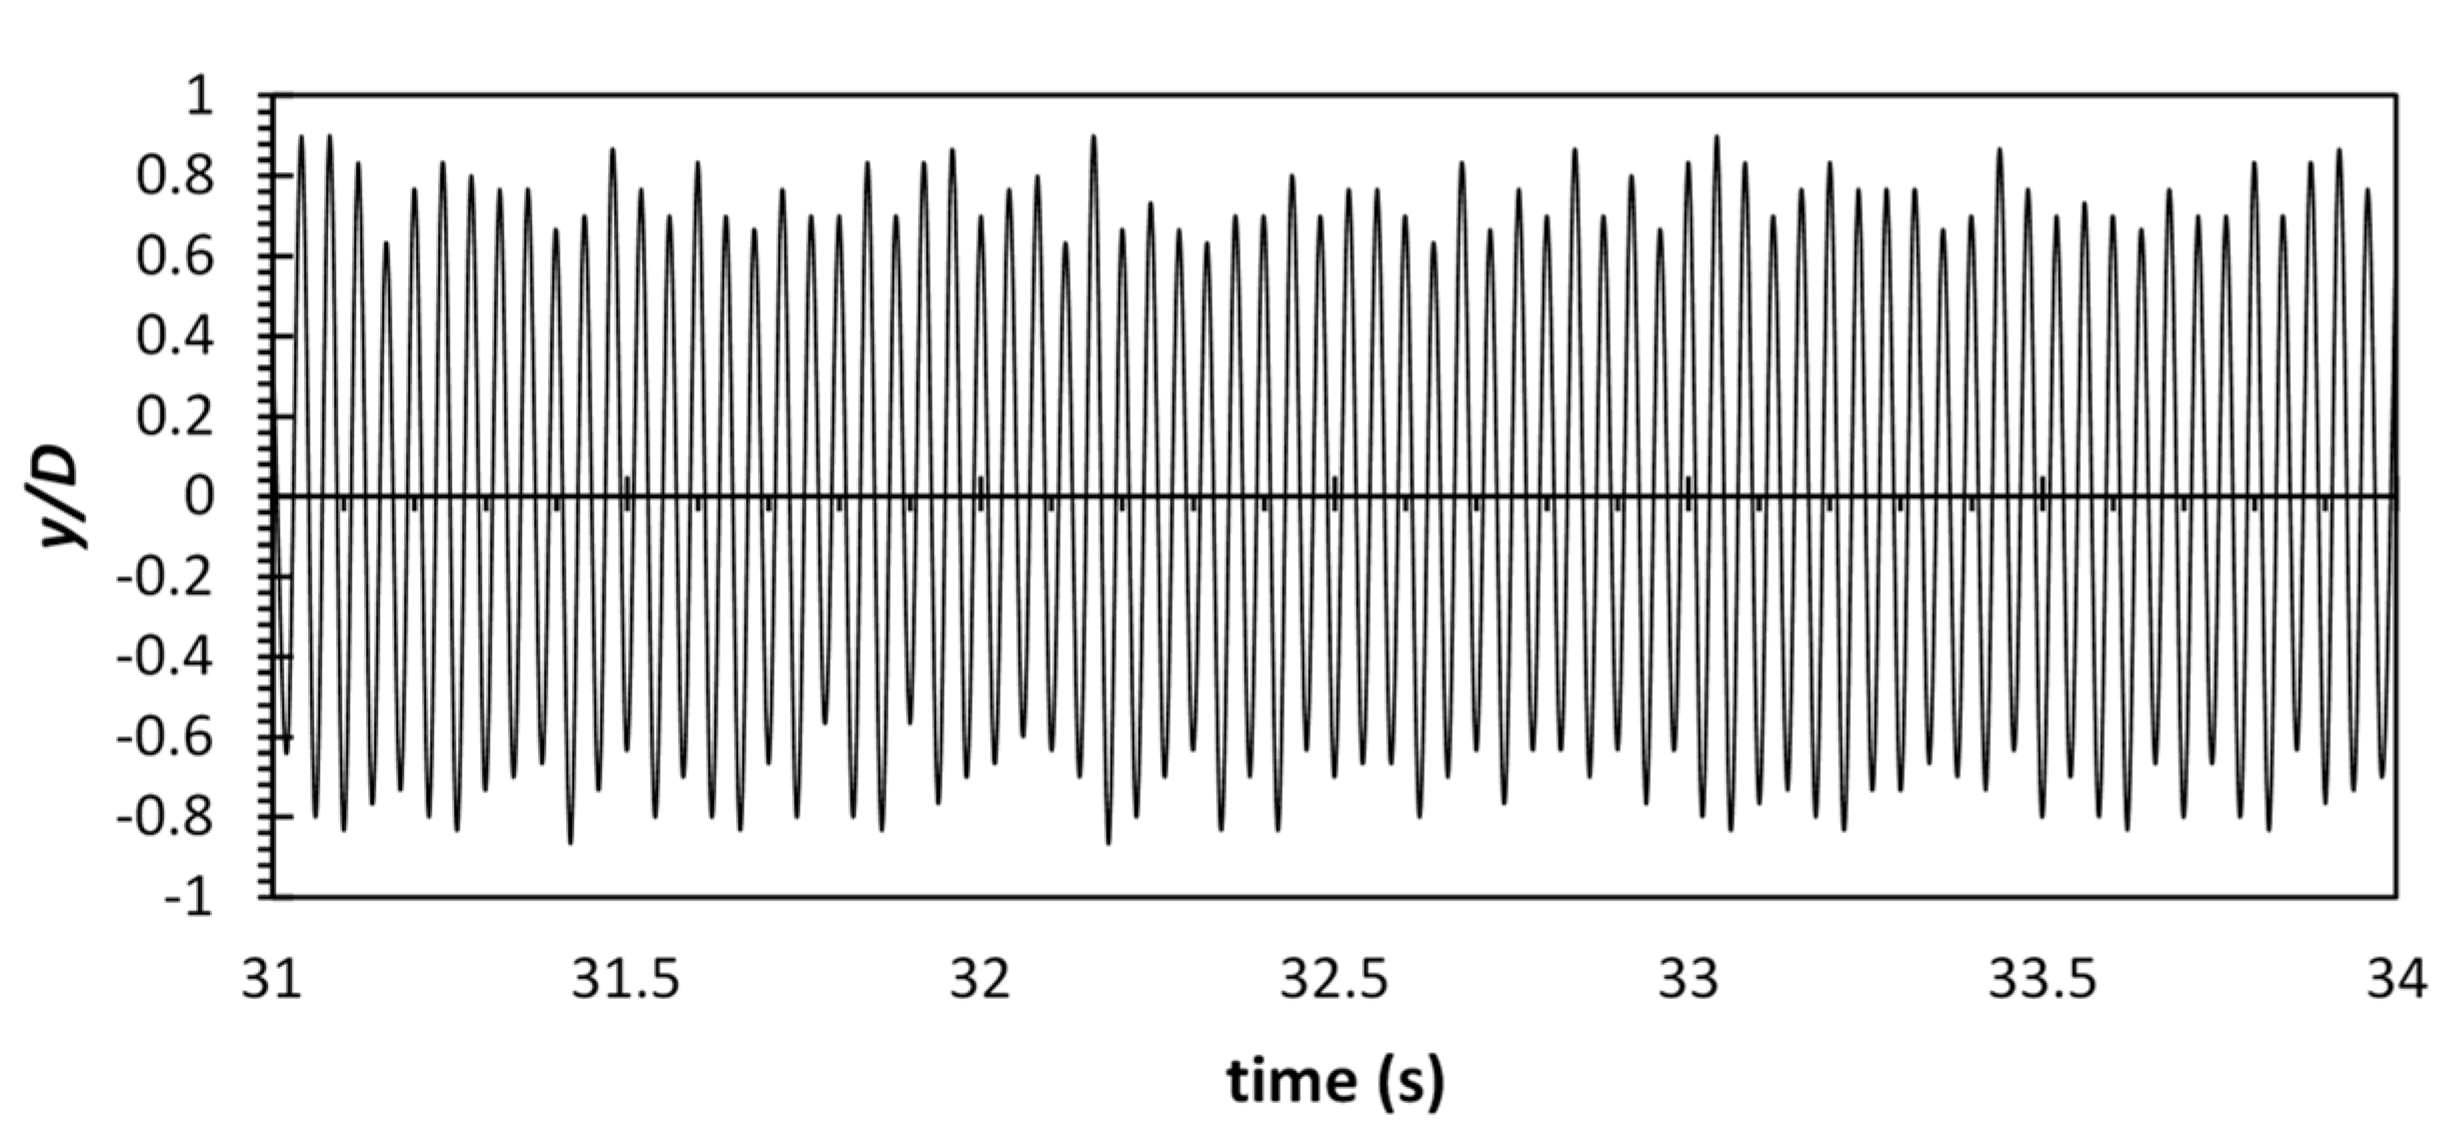
Figure 22.
Oscillation of flexible aluminum cylinder of AR = 54 at Re = 2500.
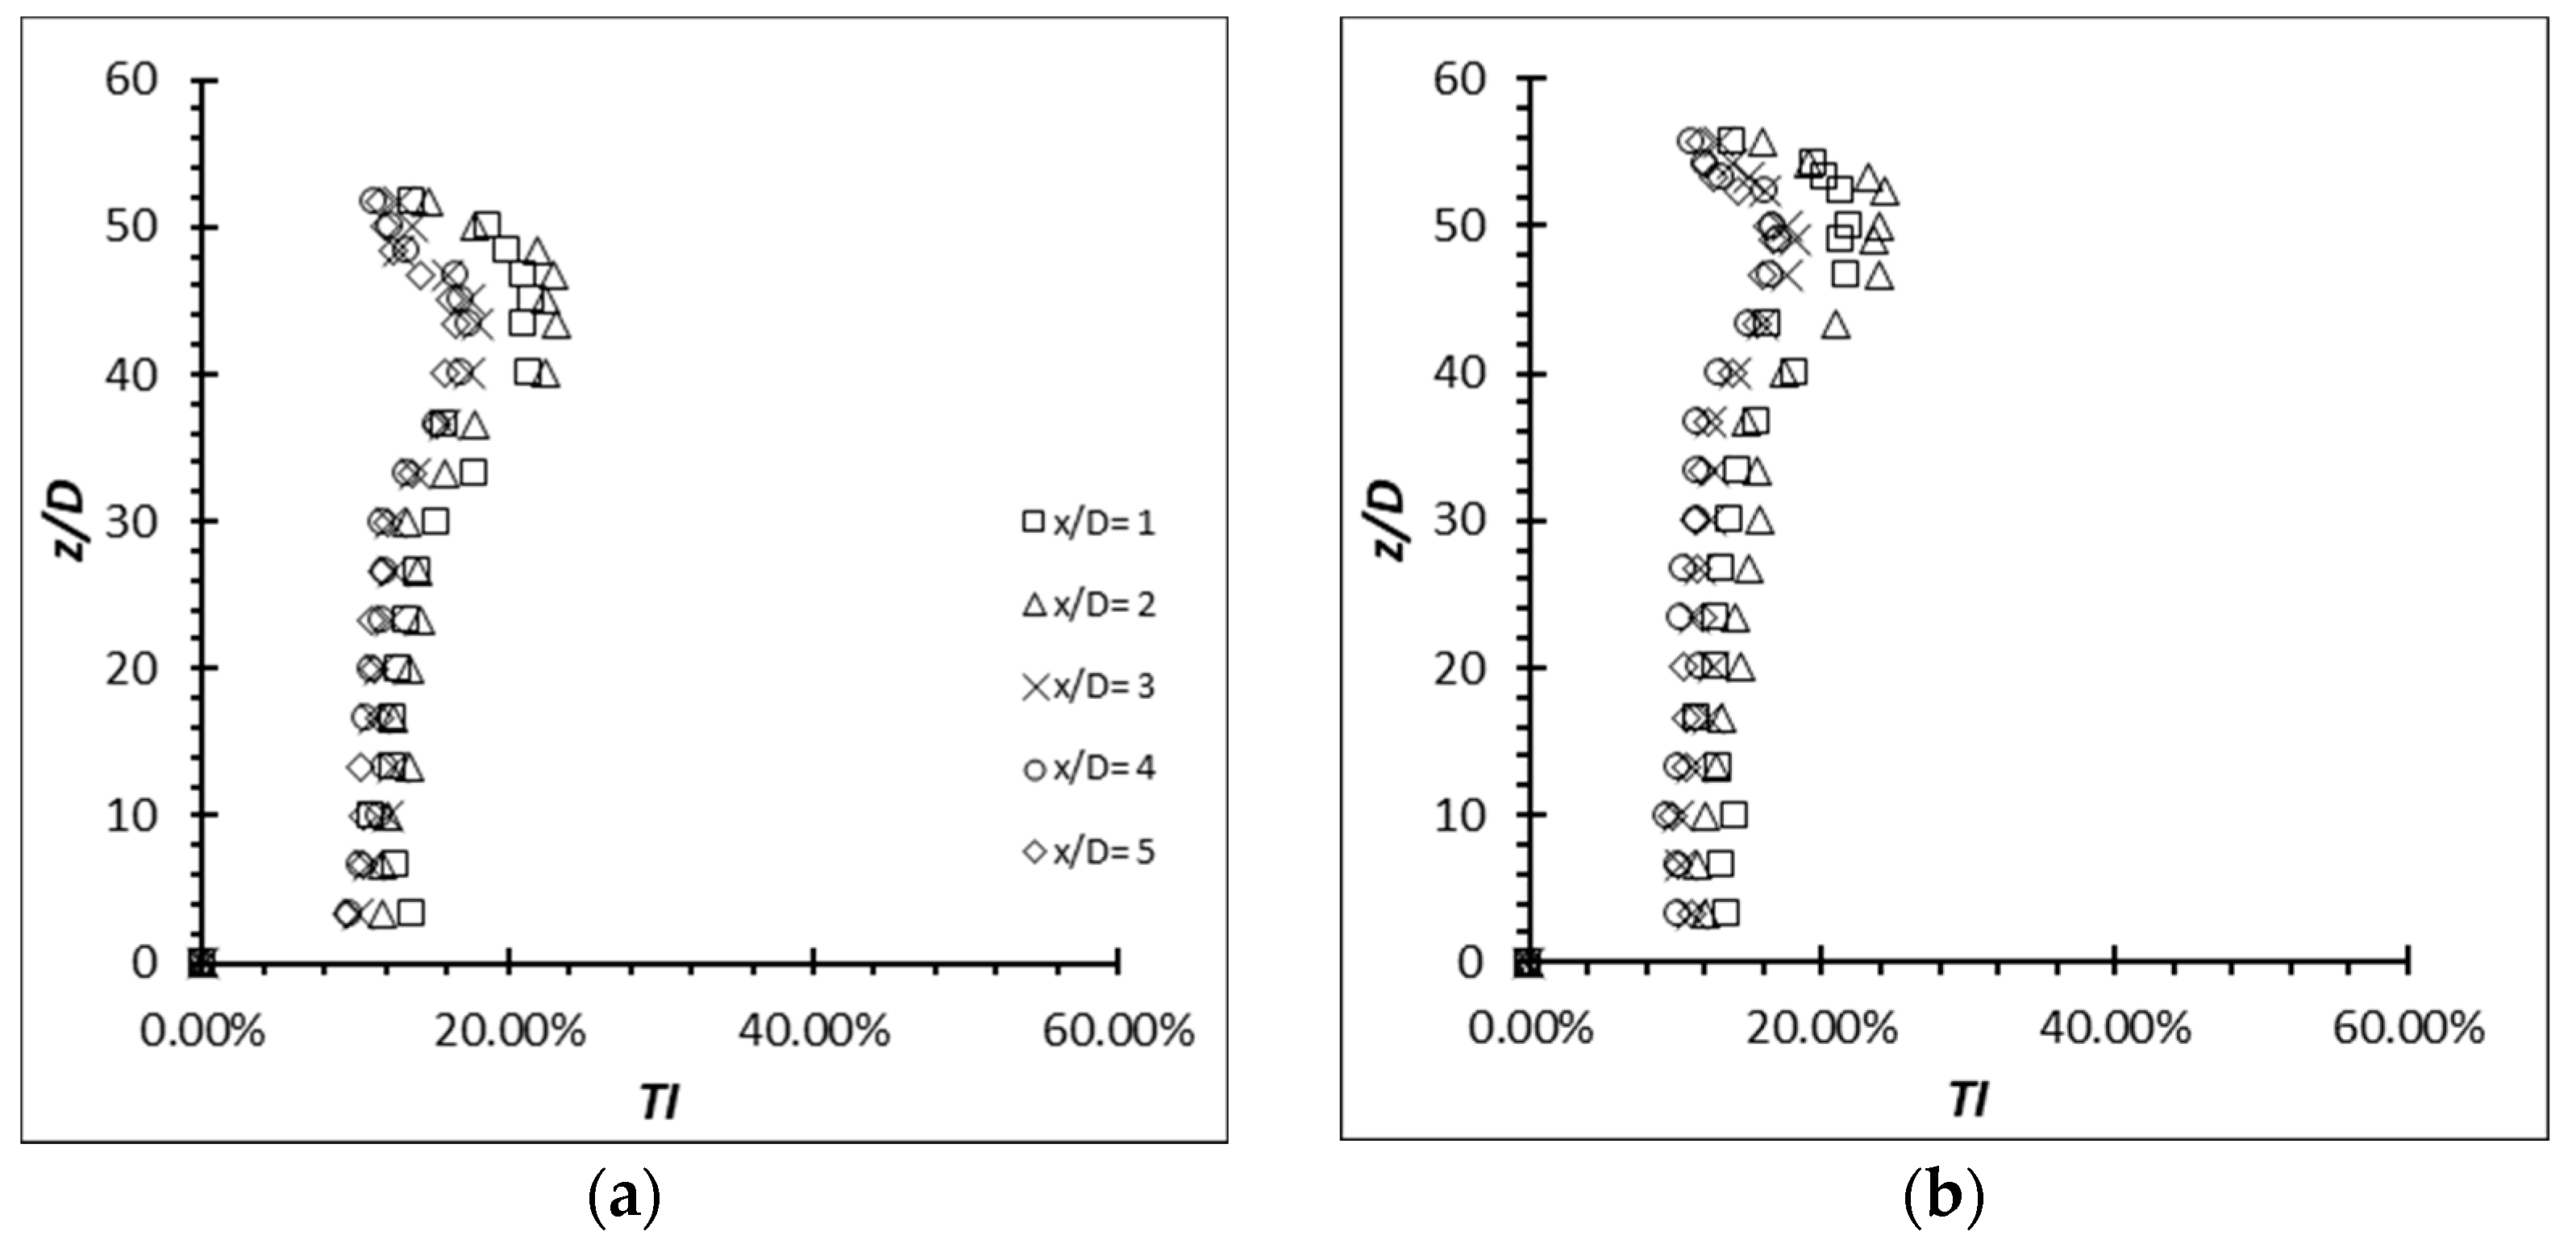
Since the carbon steel flexible cylinder behaves similarly to the rigid cylinder, it is expected that it will have a similar performance as the rigid cylinder. The local (/U) of the carbon steel of AR = 50 and 54 are (/U) ≈ 23.0% and 24.2%, respectively, slightly less than the (/U) produced by the rigid cylinder of AR = 10 and 16 at Re = 4000. The local (/U) of the flexible aluminum cylinder of AR = 50 and 54 are (/U) ≈ 52.9% and 57.8%.
3.3. Turbulence Kinetic Energy Budget
The flexible cylinder can enhance the turbulence generation; therefore, it can be seen that the normalized production term, , generated by the flexible cylinders of AR = 12 and 14 at all Re has increased with reference to the rigid cylinder (see Figure 23 for Re = 4000 for example). Similarly, the localized maximum production occurs in the vicinity of the free end where the shear layer instability is the strongest. It is evident that the production term values do not scale with the AR alone (though the values do indeed vary with the AR); instead, it is the different structural motions generated by the flexible cylinders at different AR which result in a different structural stiffness.
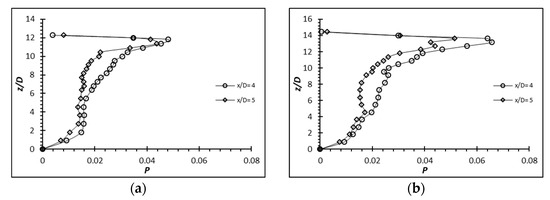
Figure 23.
Production term, , for flexible cylinder at Re = 4000 for (a) AR = 12; (b) AR = 14.
Similarly, the localized production term occurs in the vicinity of the free end for both aluminum and carbon steel cylinders at AR of both 50 and 54 (Figure 24 and Figure 25). In addition, it can be seen that the localized production term occurs at x/D = 2 in the wake region where the region is approximately close to the dividing streamline of the flow as indicated by the negative () at x/D = 2 and positive () at x/D = 3 of the velocity profile in Figure 13 and Figure 14. A dividing streamline is a boundary which separates the downward dominant flow and downstream dominant flow [13]. Beyond x/D = 2, the normalized production term quickly subsides as the flow is less chaotic due to the downwash that directs most of the vertical activities downwards instead of downstream.
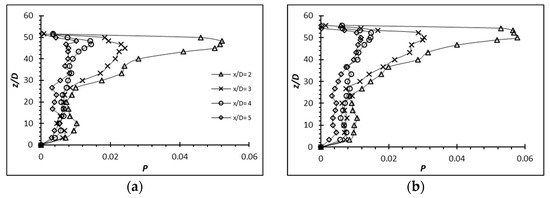
Figure 24.
Production term, , for flexible aluminum cylinder of (a) AR = 50 and (b) AR = 54 at Re = 2500.

Figure 25.
Production term, , for flexible carbon steel cylinder of (a) AR = 50 and (b) AR = 54 at Re = 2500.
The production term of the carbon steel cylinder remains at a lower magnitude than that of the aluminum cylinder (Figure 25). As mentioned, the carbon steel cylinder behaves like a rigid cylinder due to its high structural stiffness; therefore, it can serve as a reference/benchmark to the increment of the aluminum cylinder that oscillates. The increment of the production term by the aluminum cylinder of AR = 50 and 54 that oscillates can be seen from the graphs (Figure 24). They have a rather similar pattern in terms of the evolution of turbulence production. The contributor to this increment is suspected to be the higher oscillating amplitude (see Figure 21 and Figure 22) by AR = 54 as its structural stiffness is slightly lower than that of AR = 50.
3.4. Reynolds Stresses
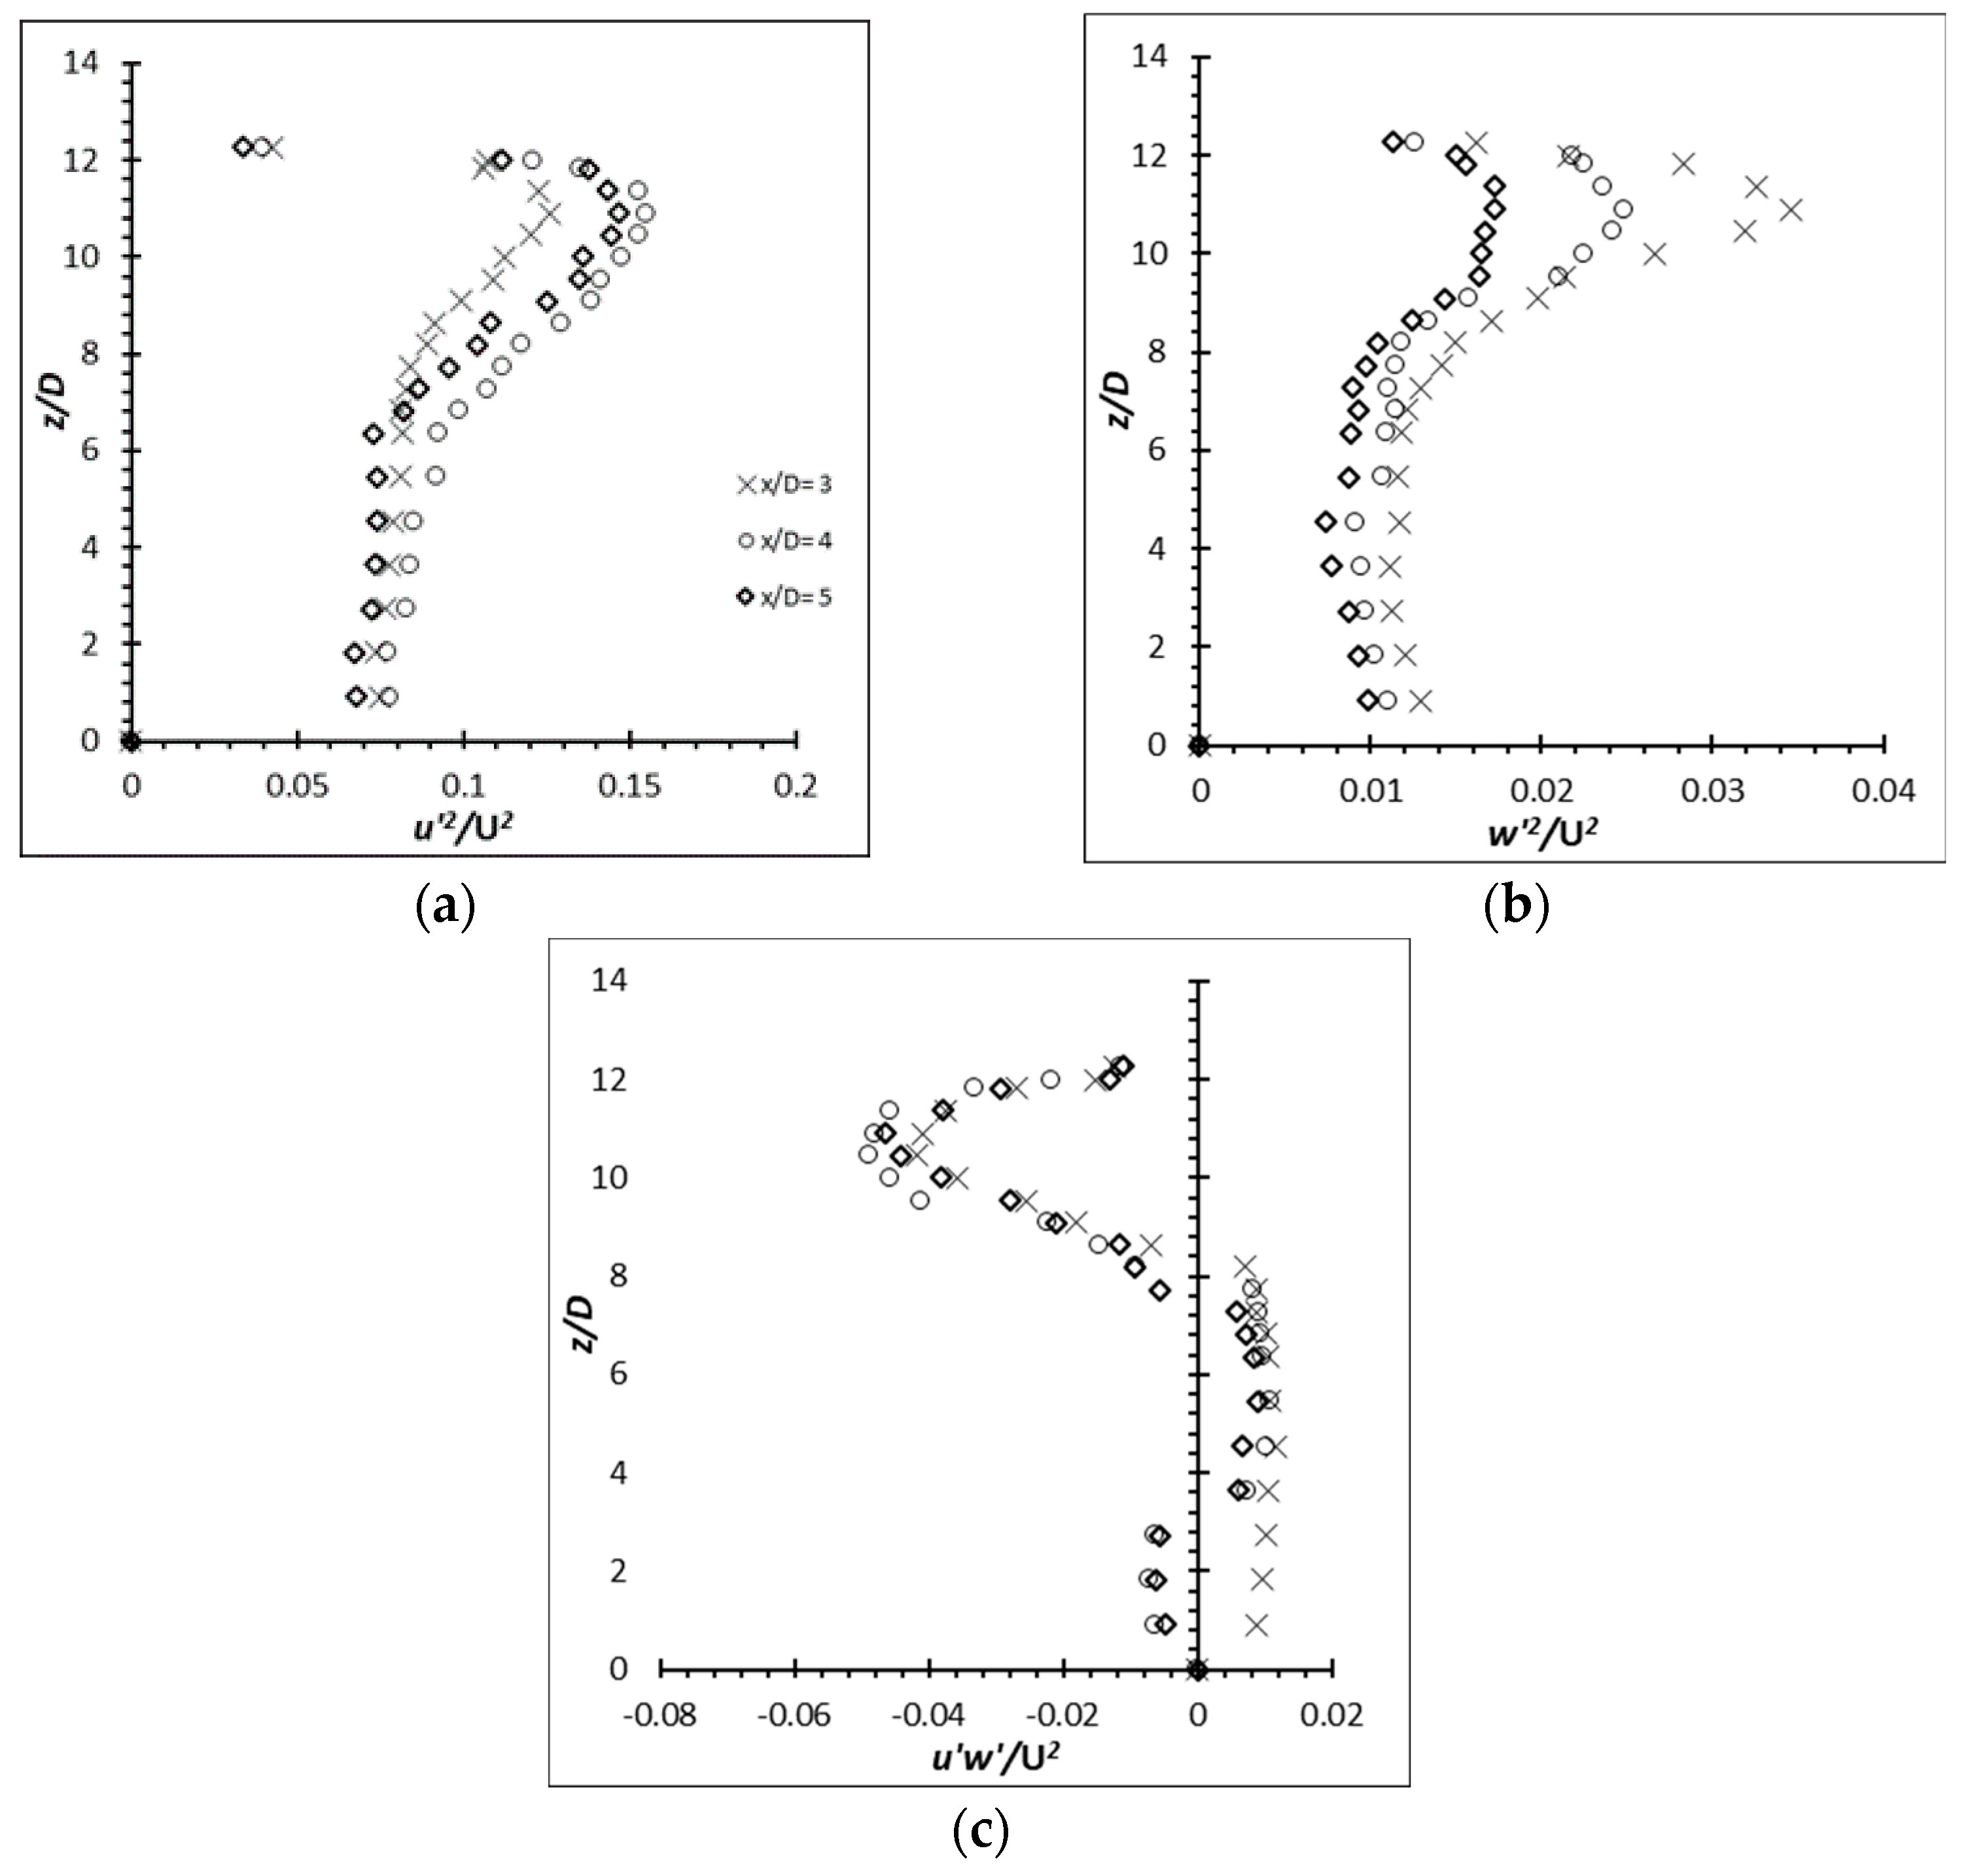
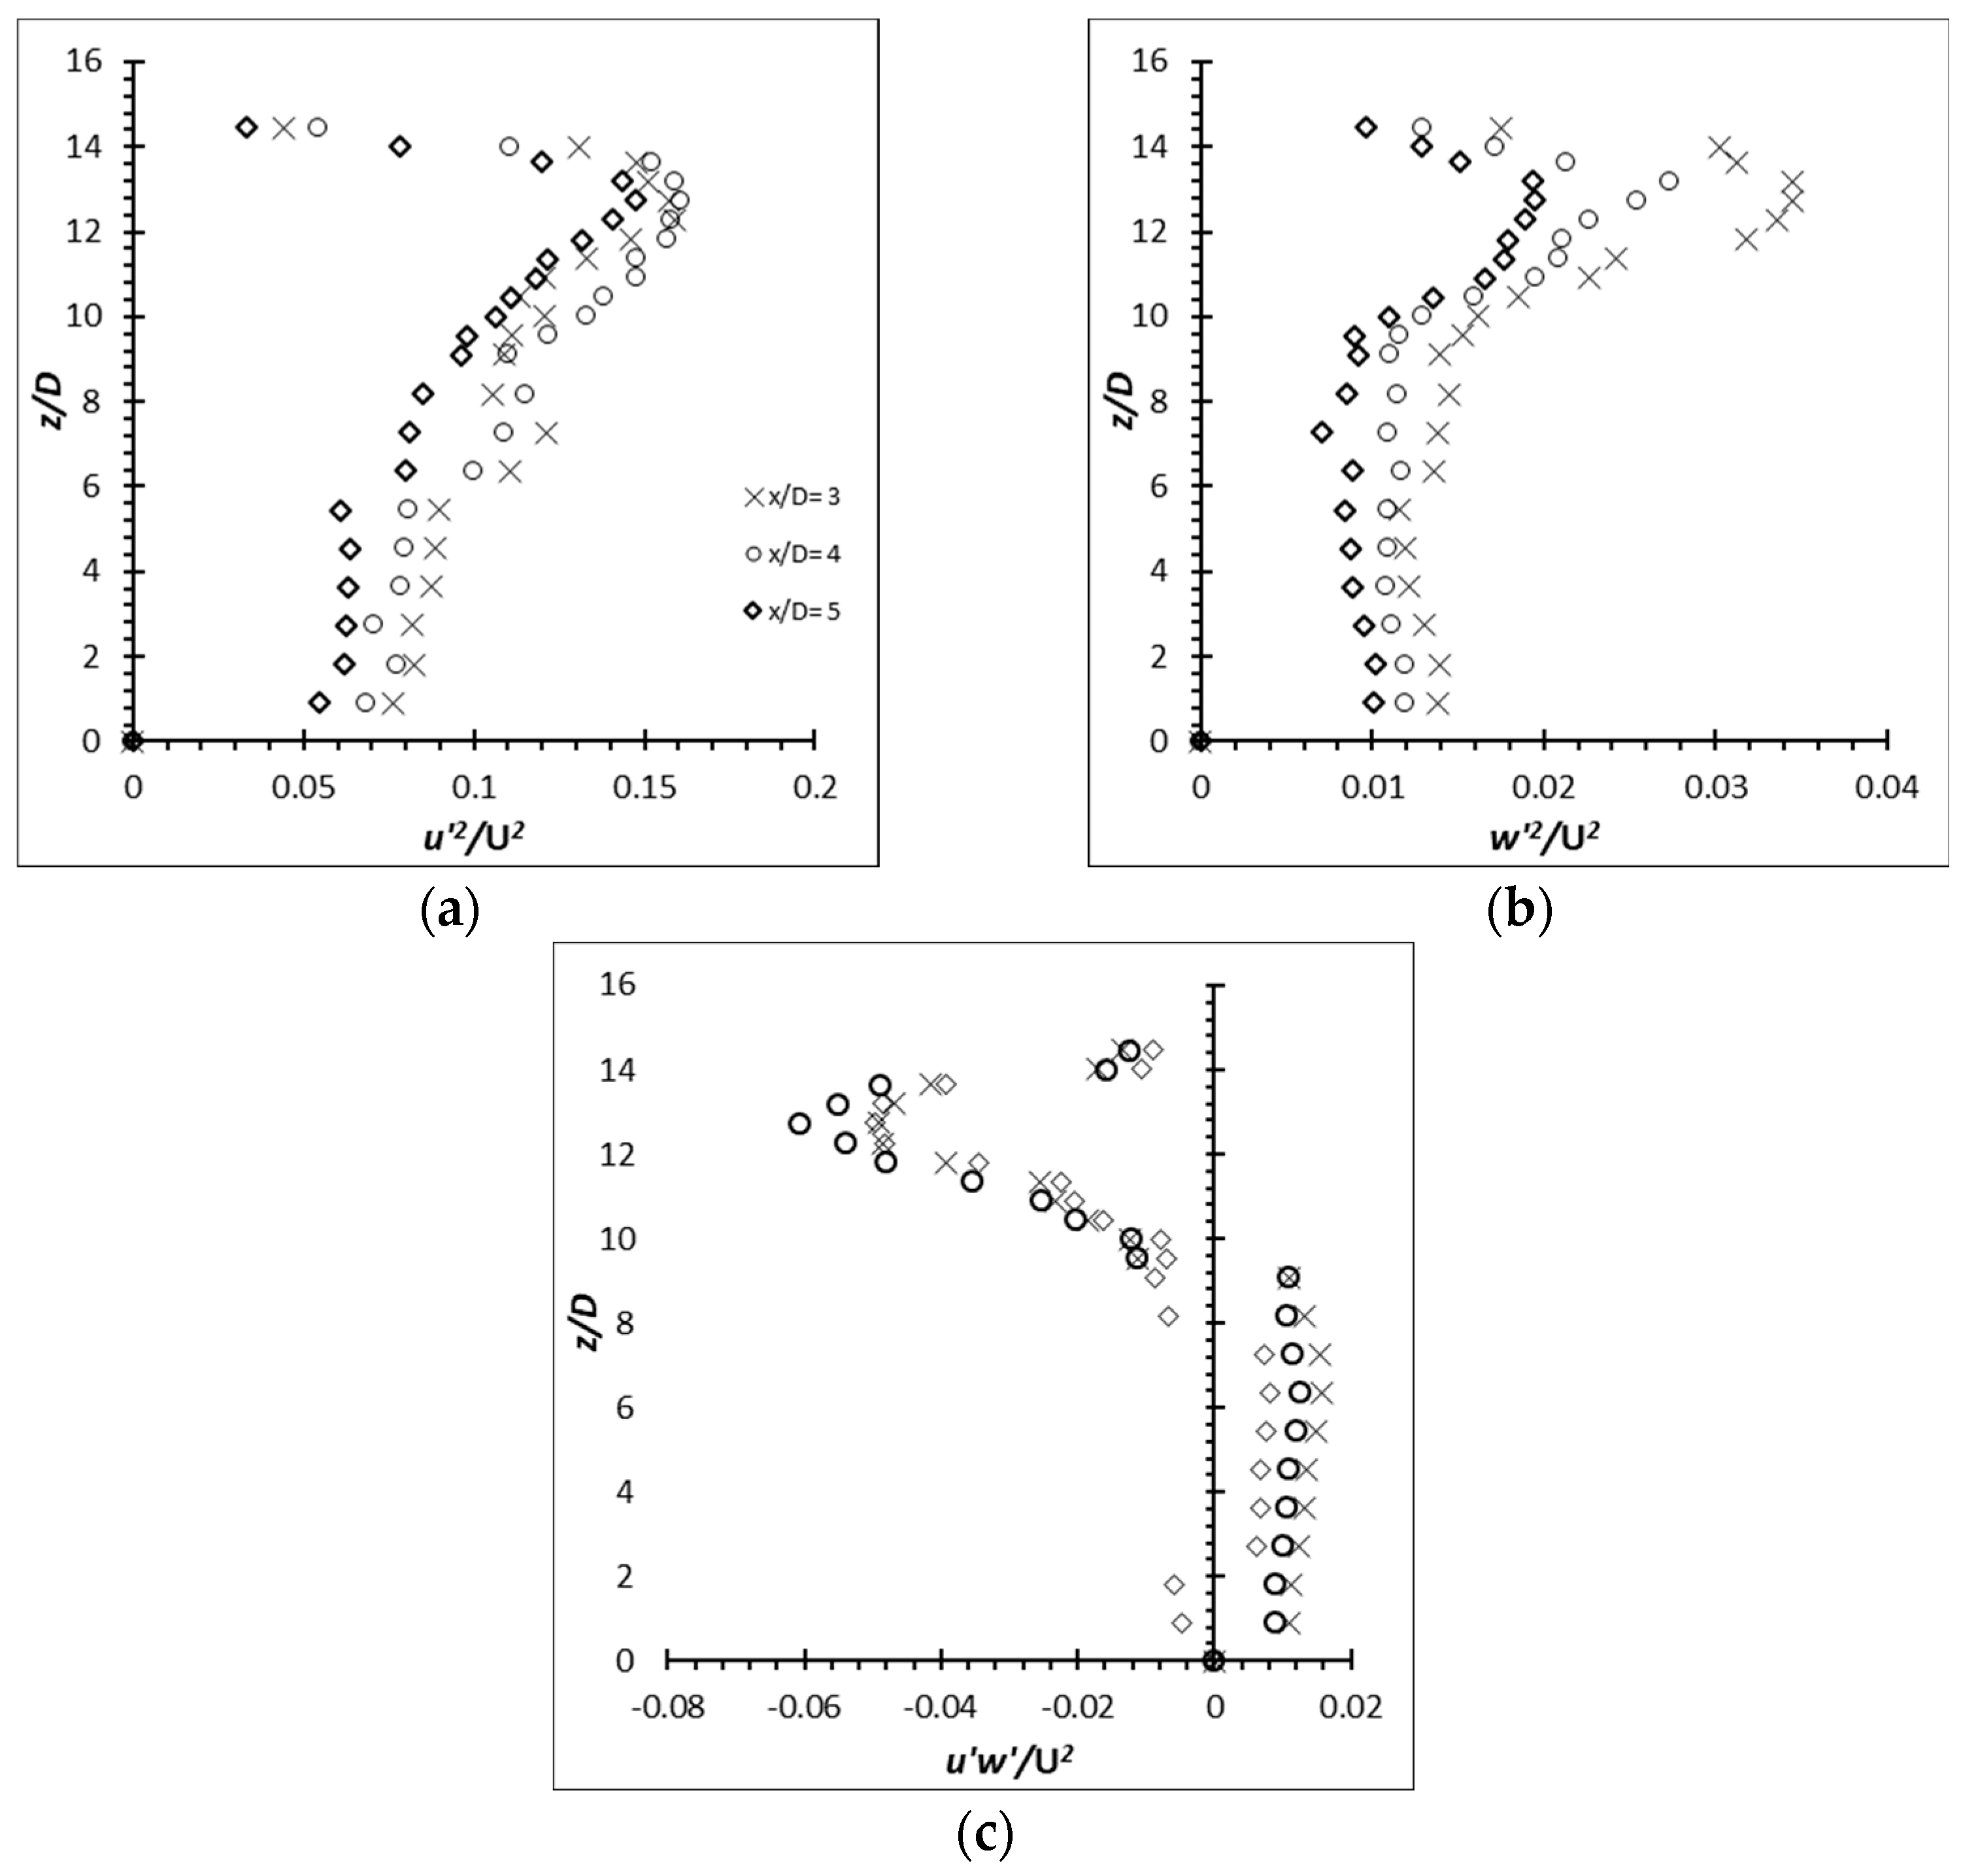
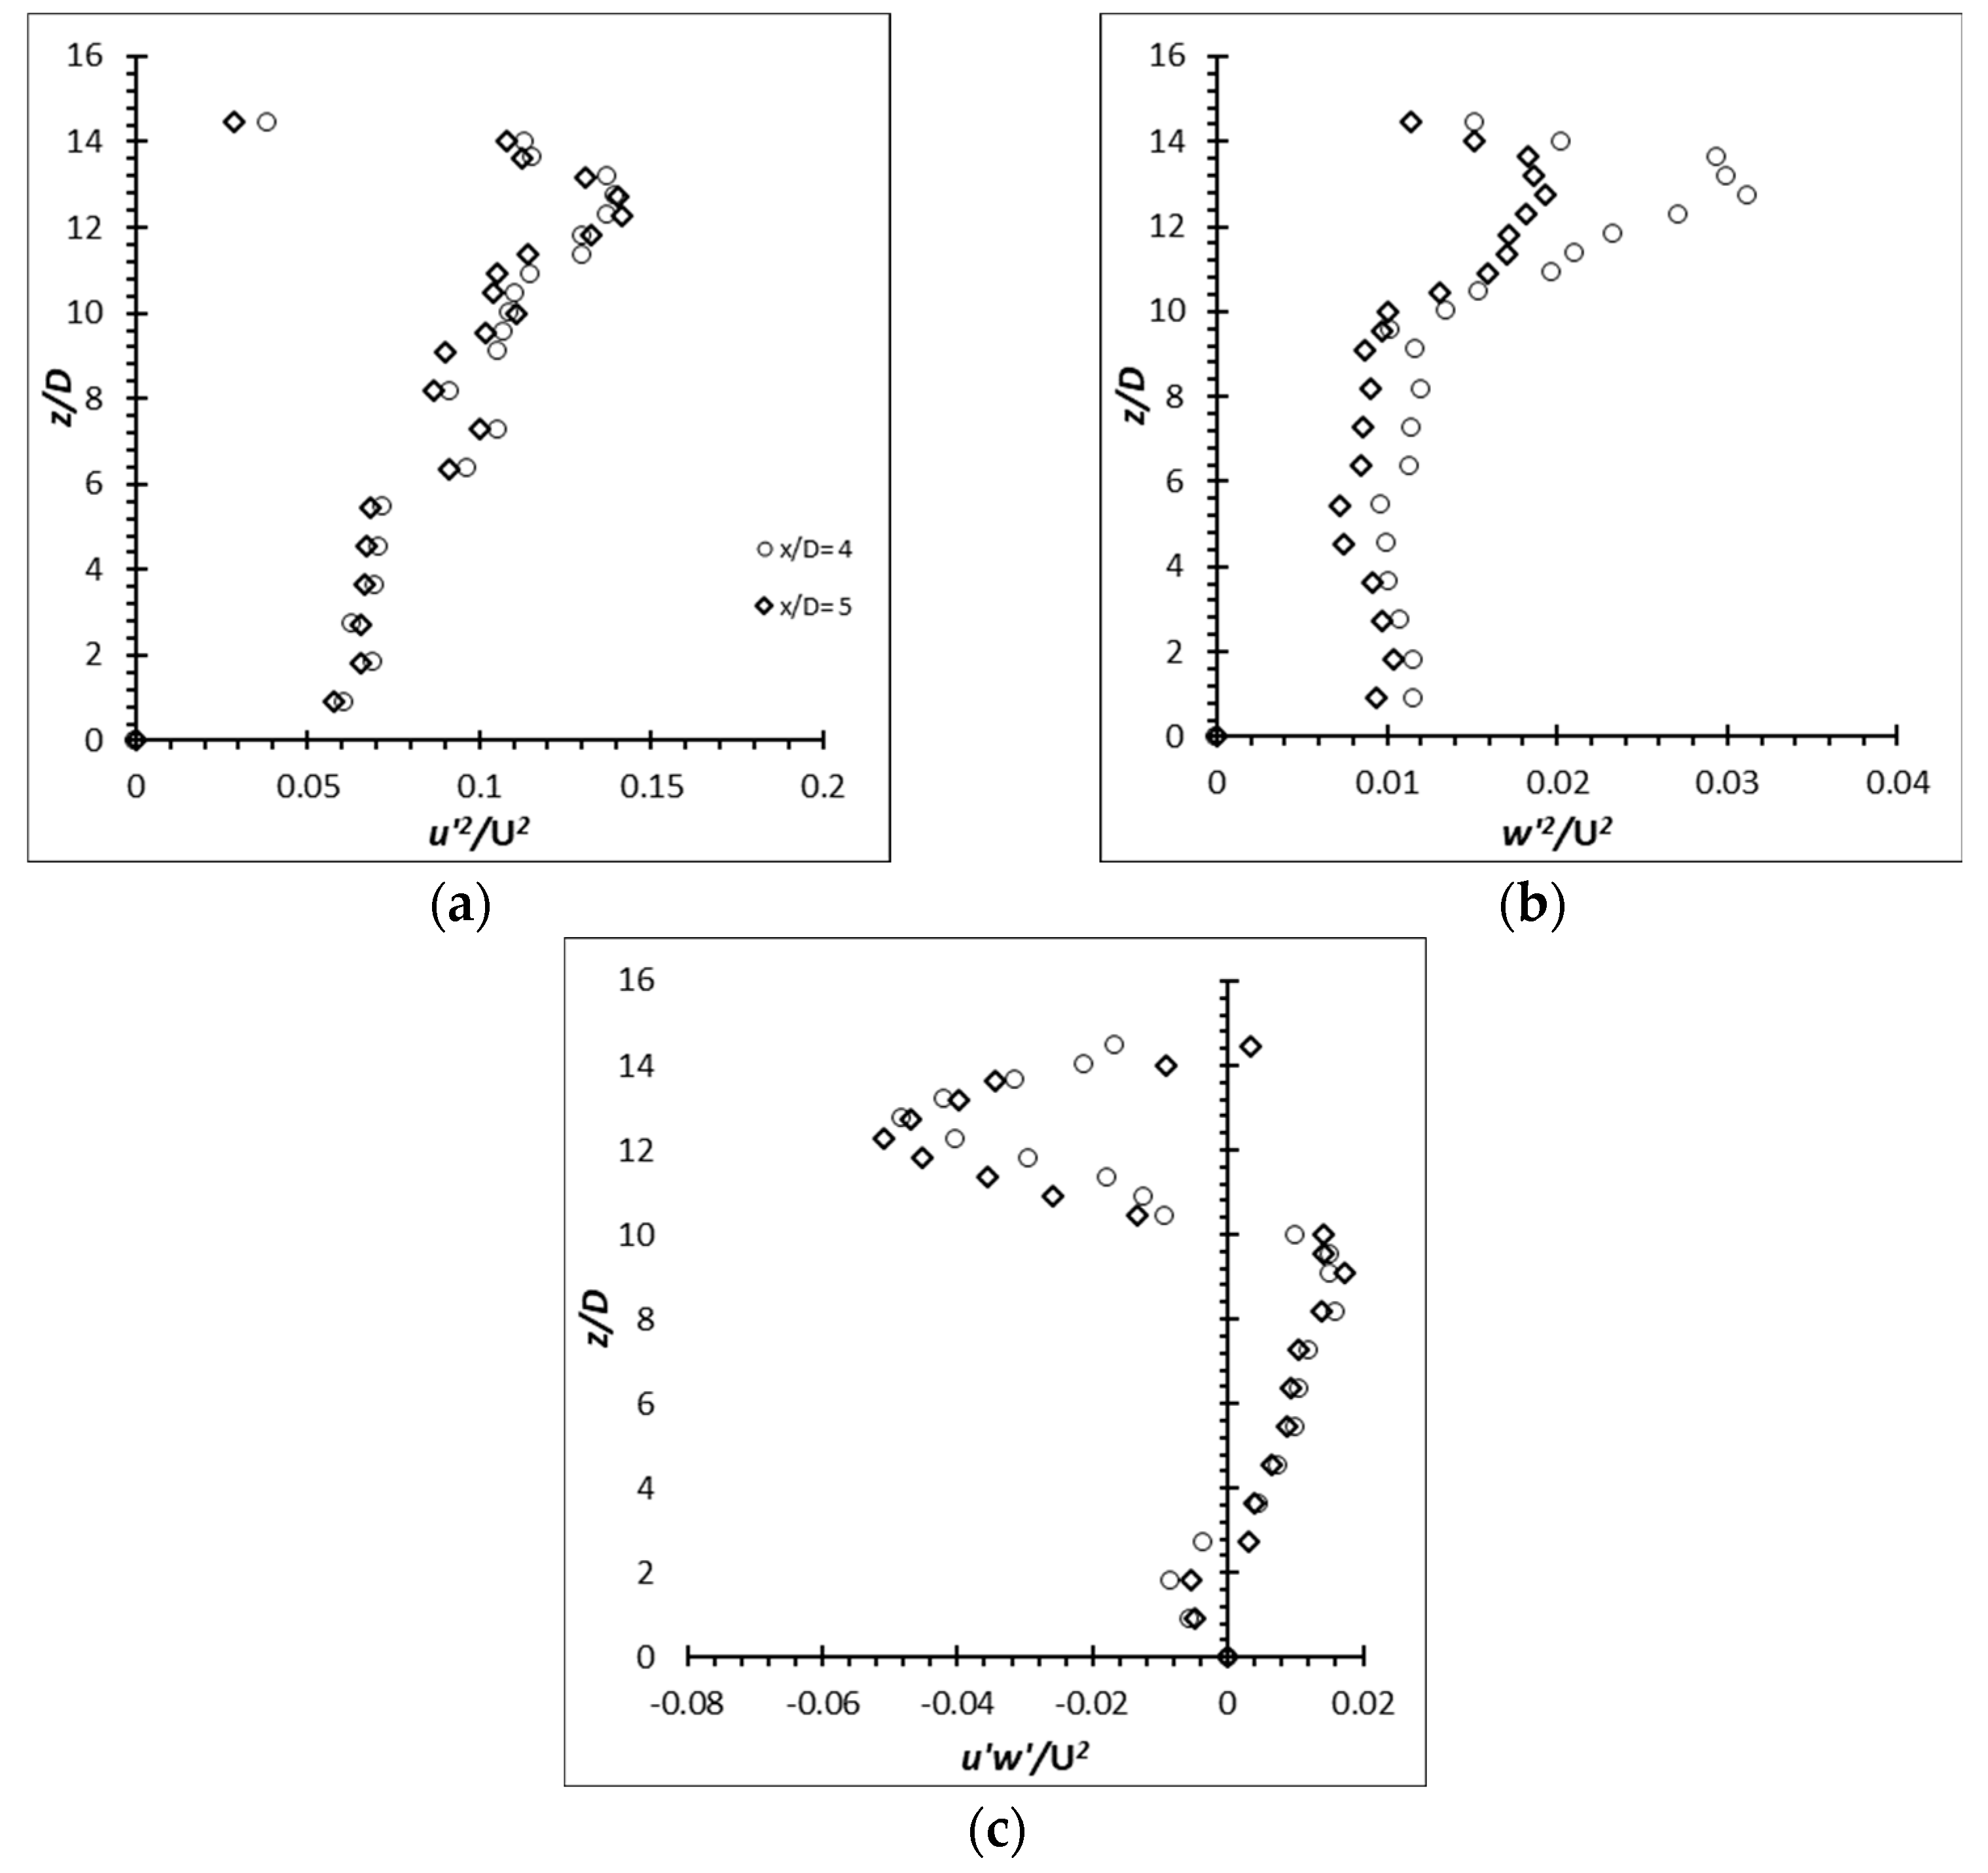
The Reynolds stresses for the flexible cylinders have seen a major increase over the rigid cylinders. The increment ranged from approximately 4.5% for a flexible cylinder of AR = 10 at Re = 8000 to over 150.0% for a flexible cylinder of AR = 16 at Re = 6000 on a similar condition case basis. Also, as demonstrated by the (u′/U) and the production term generated by the EVA cylinders of AR = 12 and 14, it is expected that the , and will increase as well. The Reynolds stresses, , and of the EVA flexible cylinder of AR = 12 and 14 at Re = 4000 and 8000 are presented in Figure 26, Figure 27, Figure 28 and Figure 29 to provide insight on the turbulent fluctuations in the flow. As anticipated, the of AR = 12 and 14 at all Re show increment. The is also consistent with the production term where the peak intensities coincide with each other near the free end and is also evident in the high shear rate (high velocity gradient) of the mean flow. It shows good agreement that the energy from the mean flow is being passed onto the fluctuating components by the mechanism of shear. Likewise, the shows a peak intensity in the regions of strong velocity gradient and it can be imagined that it is where the separated shear layer is. The localized max is located near the free end where the tip vortices are generated. The u’ in the near wake are more energetic than the w’, hence the magnitude of the component is much larger than that of the component. The evaluated Reynolds shear stress can be said to stem from the since the are more energetic than the in that region. The production term shows that the increment of turbulence production does not strictly follow the AR or Re pattern; there is an increase in turbulent production as the AR or Re increases. The same phenomenon can also be seen throughout the of the cylinders.
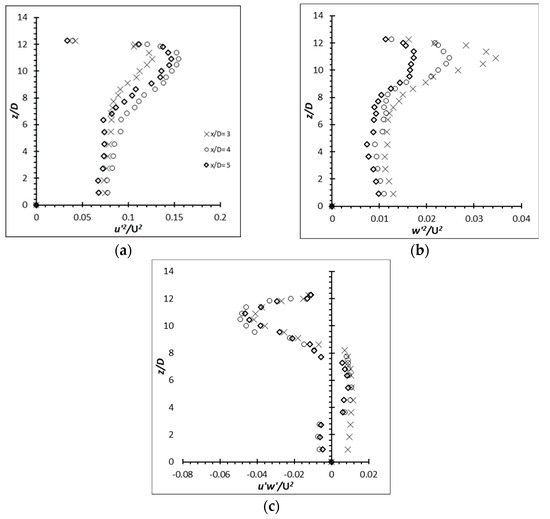
Figure 26.
Reynolds stress profiles for cylinder of AR = 12 at Re = 4000: (a) ; (b) ; (c) .

Figure 27.
Reynolds stress profiles for cylinder of AR = 12 at Re = 8000: (a) ; (b) ; (c) .
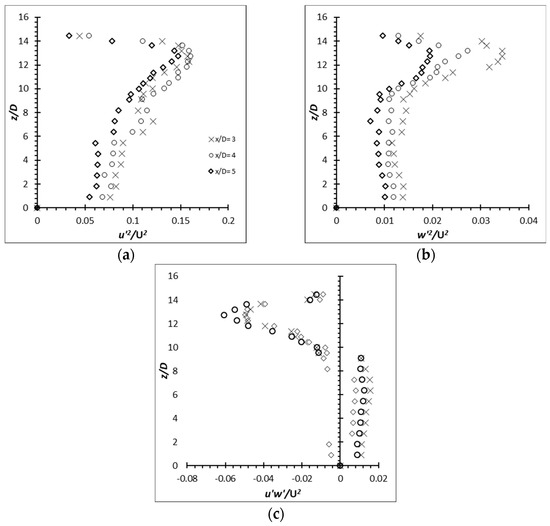
Figure 28.
Reynolds stress profiles for cylinder of AR = 14 at Re = 4000: (a) ; (b) ; (c) .

Figure 29.
Reynolds stress profiles for cylinder of AR = 14 at Re = 8000: (a) ; (b) ; (c) .
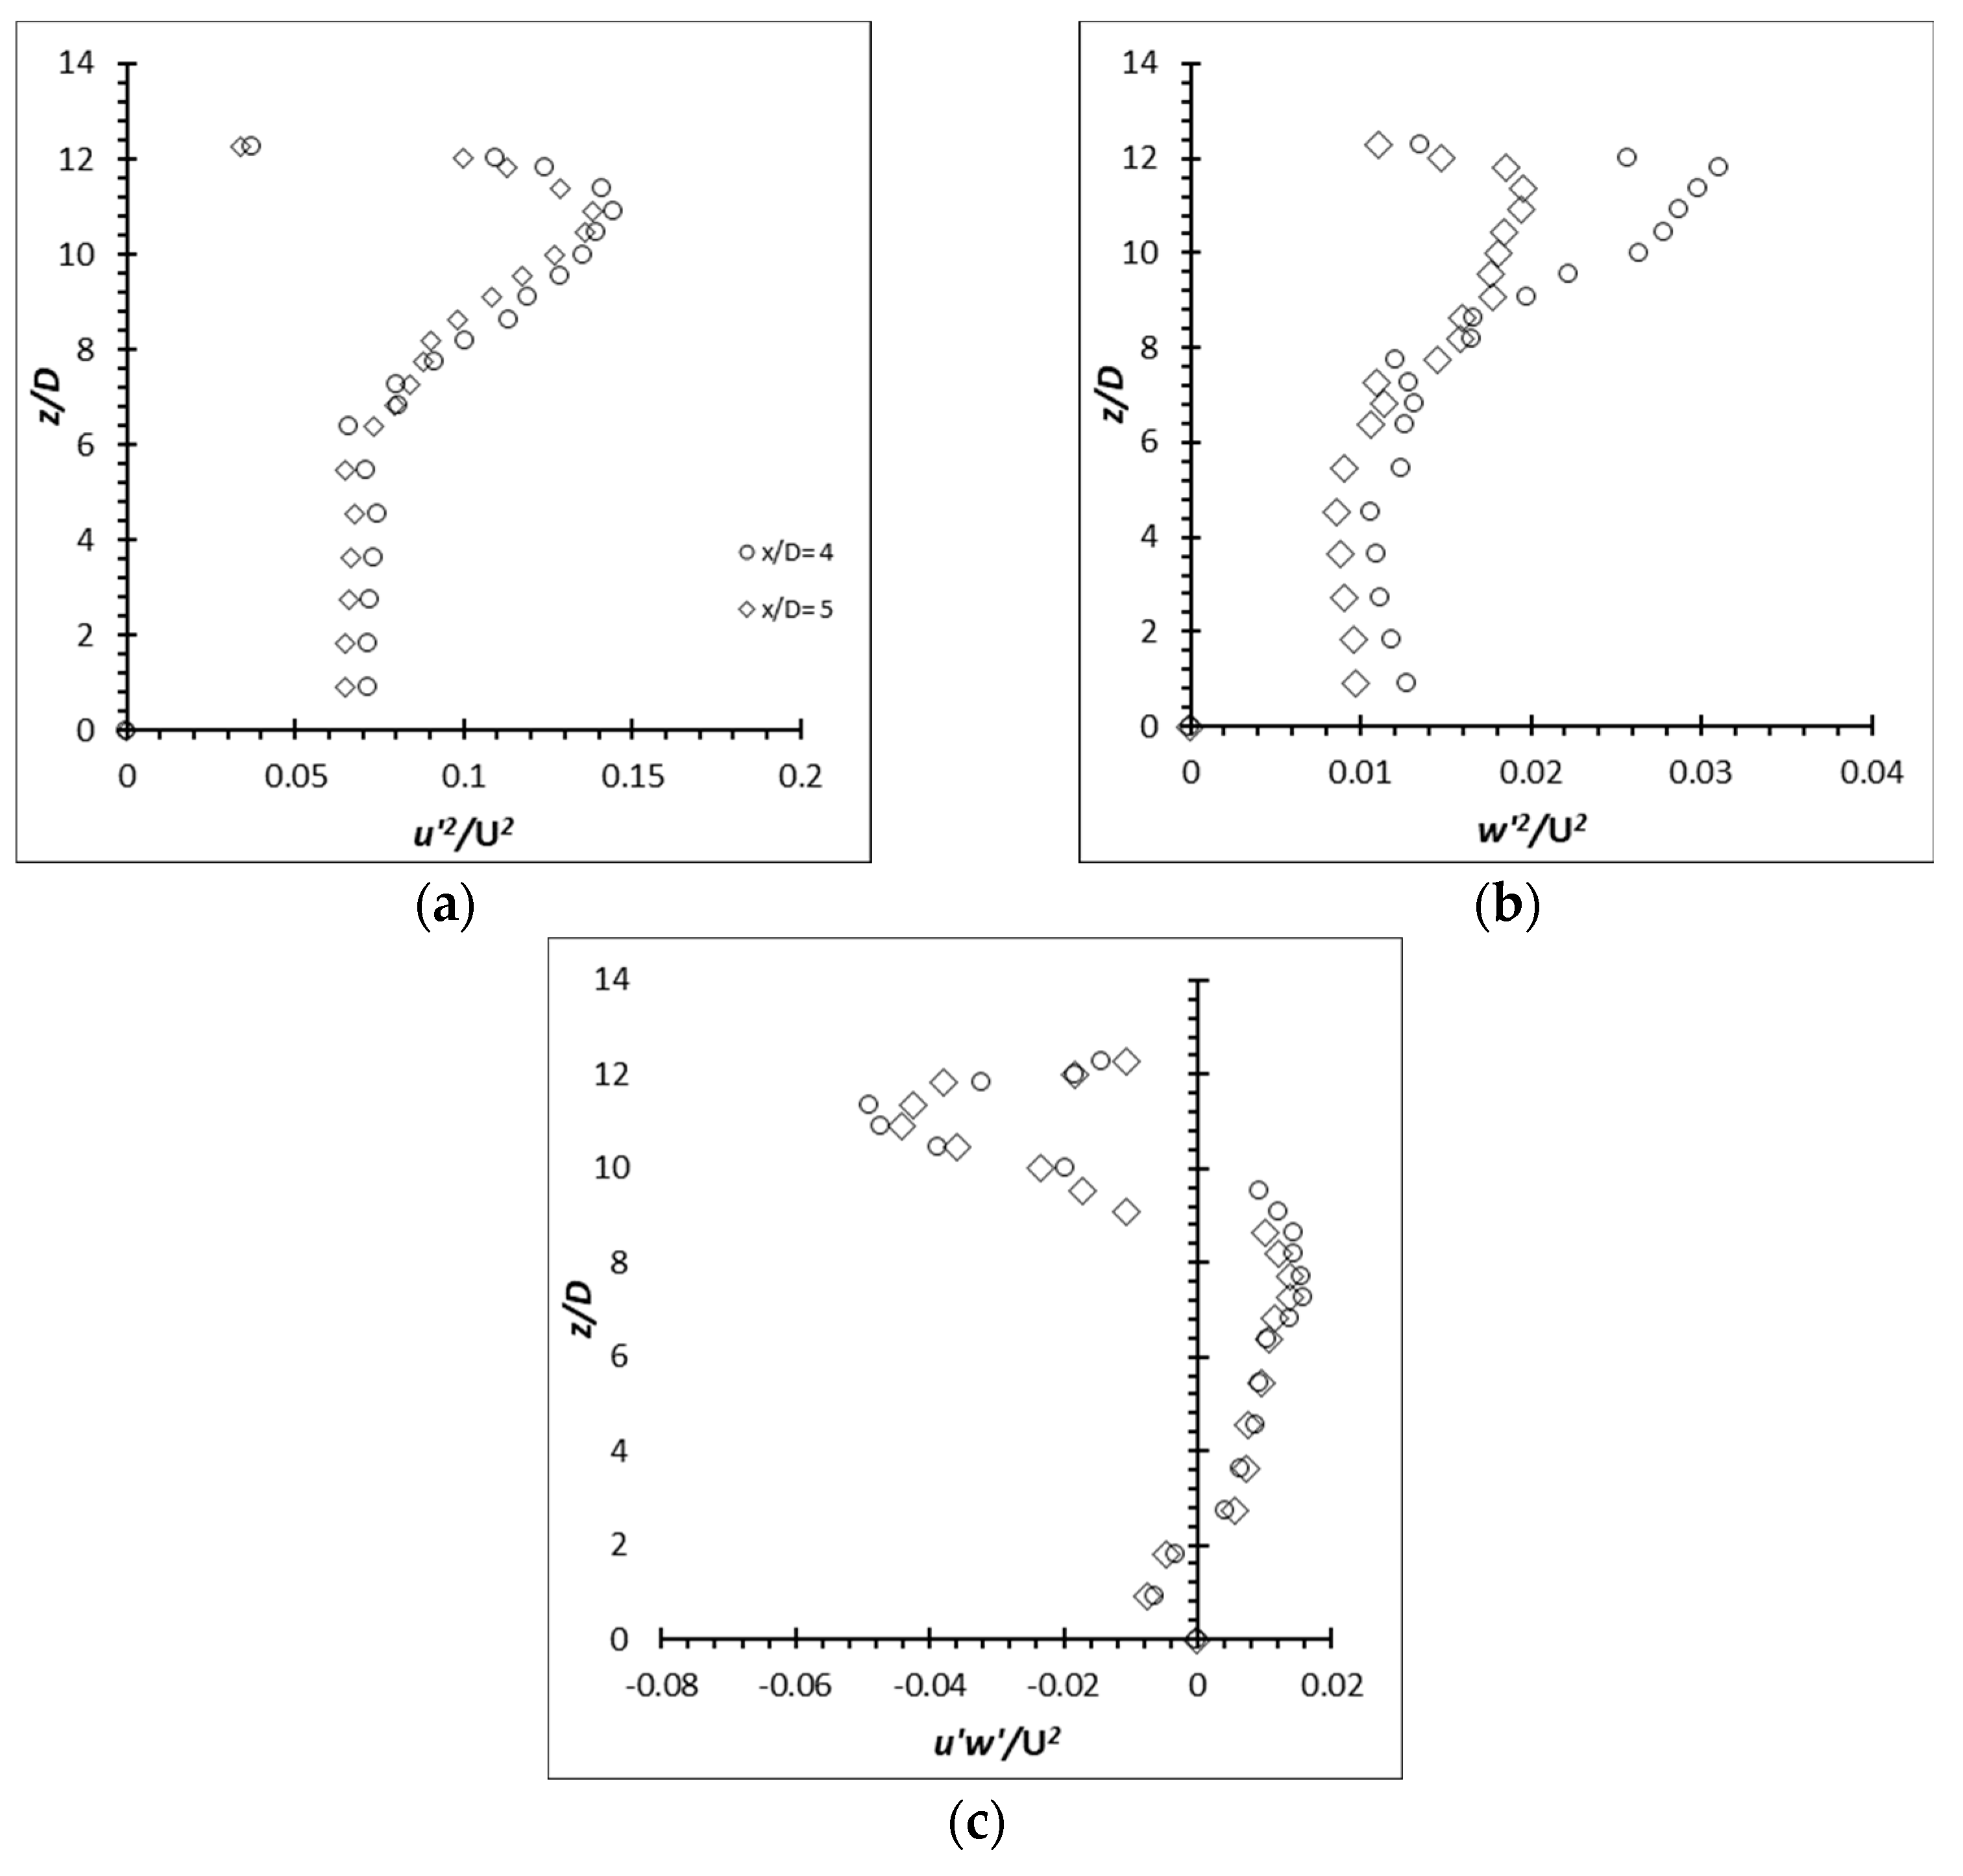
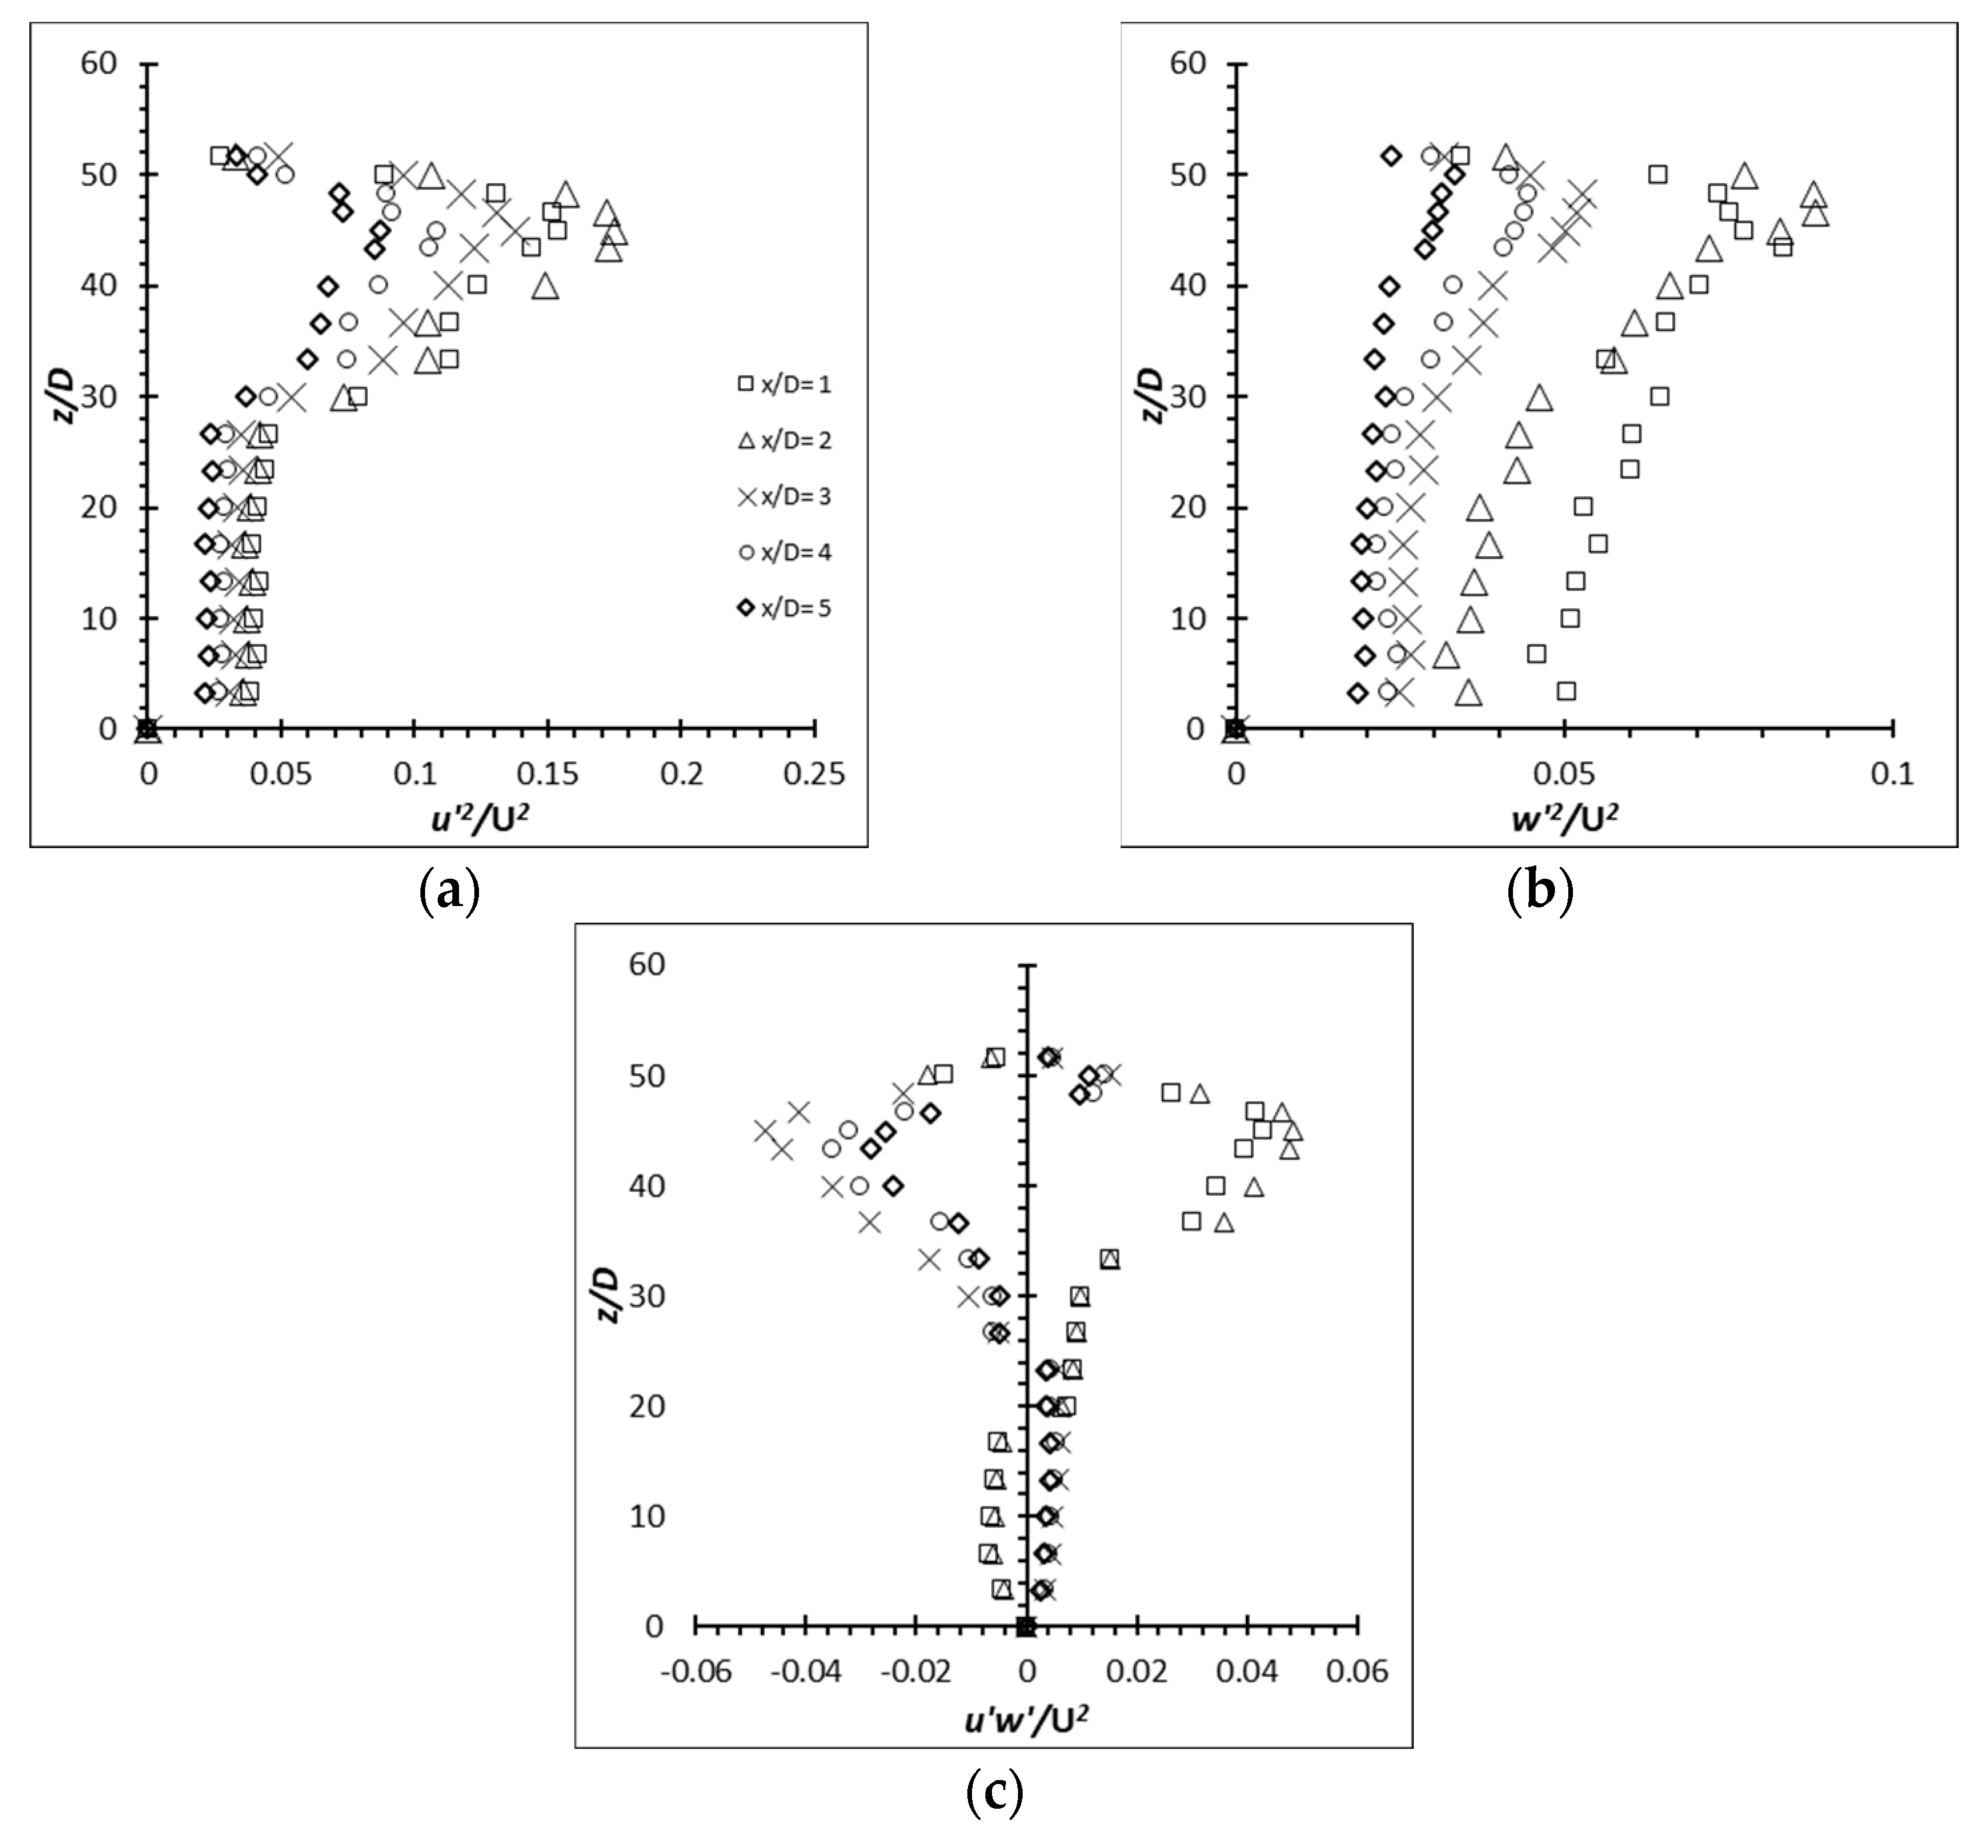
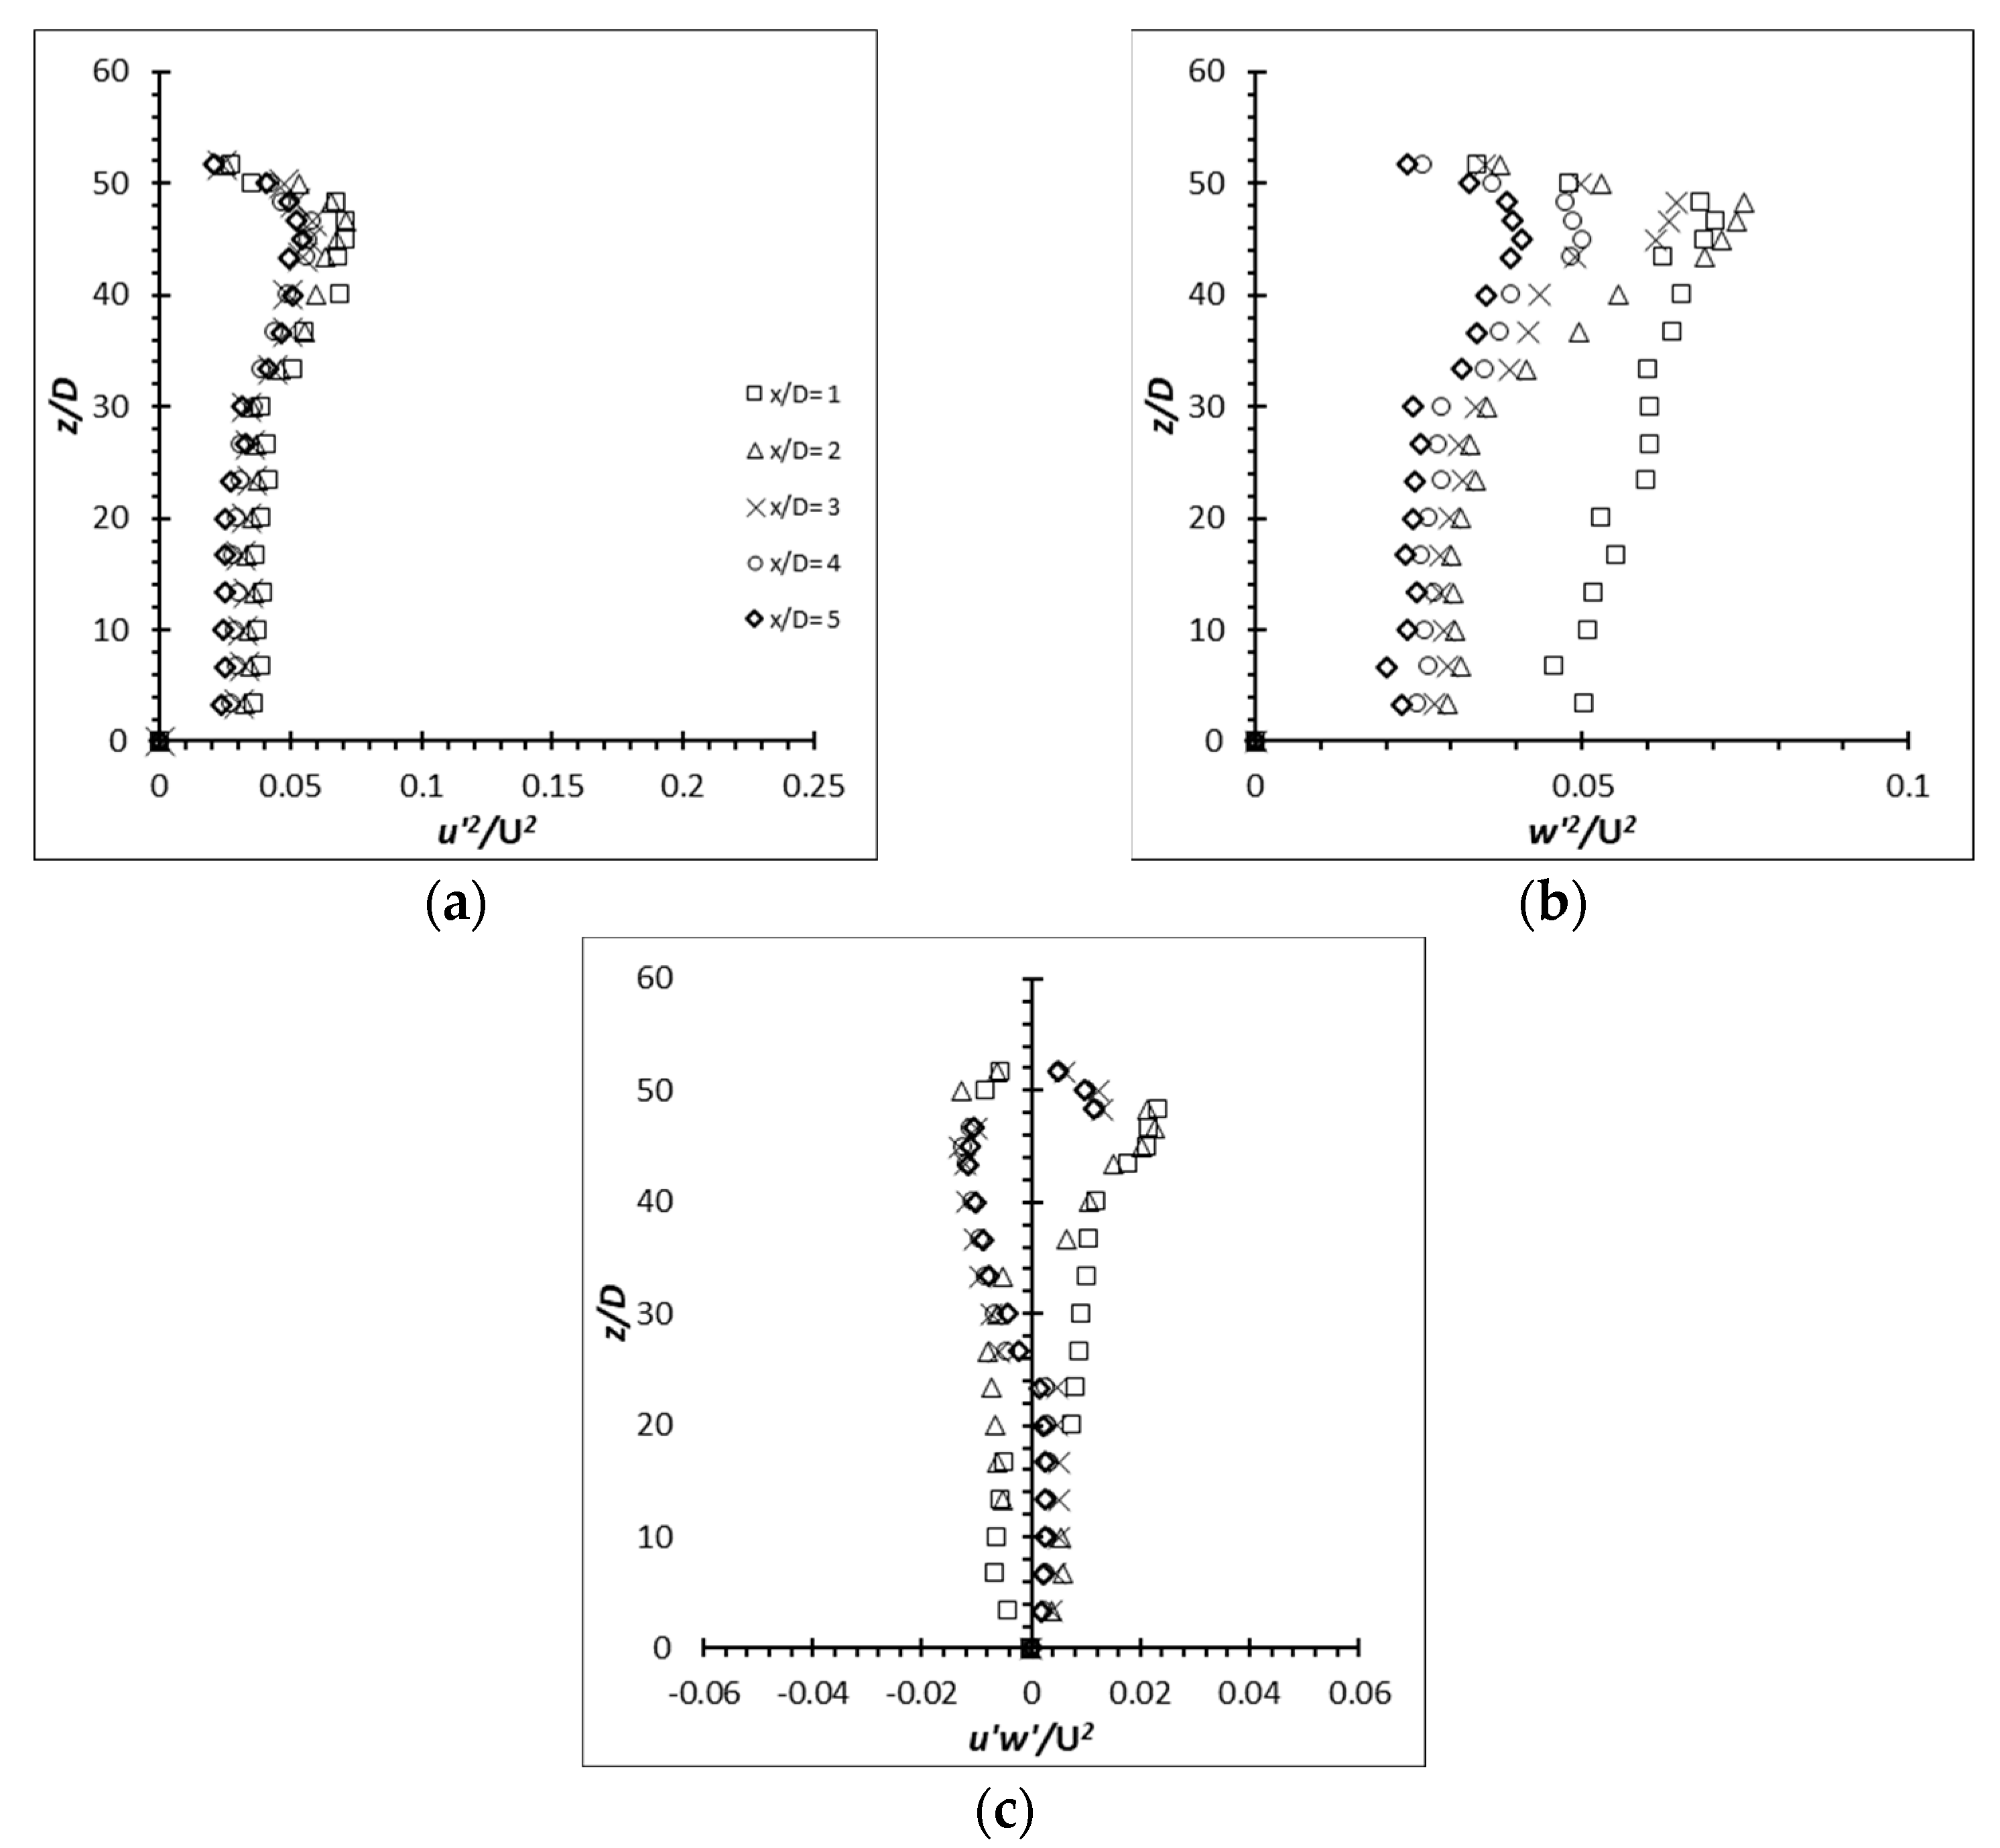
The Reynolds stresses, , and along the span of the aluminum and carbon steel cylinder of AR = 50 and 54 at Re = 2500 at the wake centerline (y/D = 0) are presented in Figure 30, Figure 31, Figure 32 and Figure 33. The local peak Reynolds shear stress of the aluminum cylinder of AR = 50 and 54 near the free end shows an approximate 128% and 131% increment for AR = 50 and 54 over the carbon steel flexible cylinder which behaves the same as a rigid cylinder. Their increment over the rigid cylinder of AR = 10 at Re = 4000 is approximately 14% and 26% for AR = 50 and 54, which shows a great deal of increment considering it is operating at Re = 2500. The enlargement in the region can also be seen from the (u′/U) and production graphs. The local peak for the carbon steel cylinders of AR = 50 and 54, however, suffer from any increment as they behaved exactly like the rigid cylinder throughout the experiments.

Figure 30.
Reynolds stress profiles for flexible aluminum cylinder of AR = 50 at Re = 2500: (a) ; (b) ; (c) .
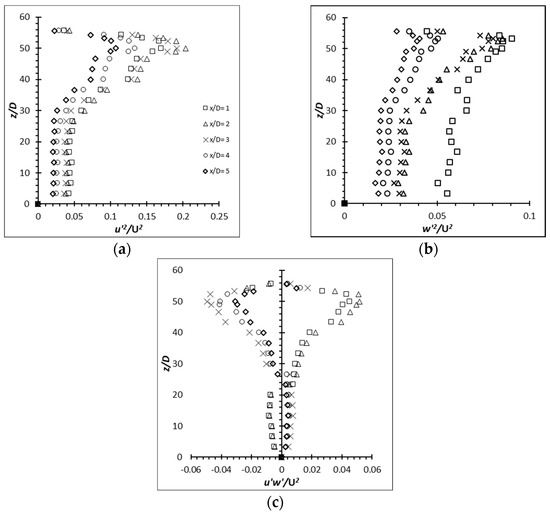
Figure 31.
Reynolds stress profiles for flexible aluminum cylinder of AR = 54 at Re = 2500: (a) ; (b) ; (c) .
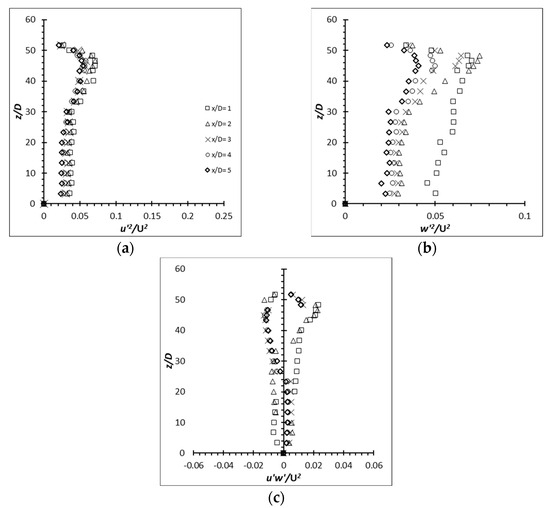
Figure 32.
Reynolds stress profiles for carbon steel flexible cylinder of AR = 50 at Re = 2500: (a) ; (b) ; (c) .
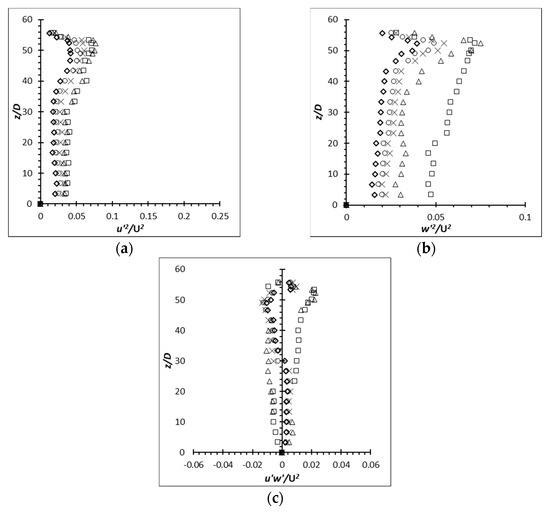
Figure 33.
Reynolds stress profiles for carbon steel flexible cylinder of AR = 54 at Re = 2500: (a) ; (b) ; (c) .
3.5. Roles of Oscillation of the Flexible Cylinder in the Turbulence Enhancement
The results have clearly shown that the turbulence production of the flexible cylinder is greater than that of the rigid cylinder. The turbulence intensity, production term from the turbulence kinetic energy budget equations and the Reynolds stresses have revealed that the turbulence enhancement depends on the structural dynamics or the motion of the oscillating cylinder rather than the AR or Re itself.
Regarding the production term of the EVA cylinder of AR = 12 and 14, the increment gained by the cylinder at Re = 8000 is the least. A look at the (y/D) of AR = 12 and 14 at Re = 8000 shows that the cross-flow oscillations/motions are disorganized. Furthermore, both show an abrupt change in amplitude and vortex shedding which latches onto a certain cycle. The abruptness of the cross-flow oscillations suggests that there could be a possibility of mode change between two or more modes of vortex shedding. This has been established by William and Roshko [26] regarding the vortex pattern in response to the oscillating motion of the vibrating cylinder. Langre et al. [27] expanded this approach to model the systems of bending beams and plates as dimensionless drag reduction mechanisms, as are most plants. They used the Vogel exponent, the power law dependence with the flow velocity by which the current results are consistent with the non-linear elastic behavior. Apart from that, Mittal and Kumar [24] also confirmed the existence of mode change of vortex shedding with the cylinder’s motion mentioned above. They discovered the large amplitudes of cross-flow oscillations correspond to anti-symmetric shedding. Despite that, no associated turbulence characteristics have been reported. Thus, the results generated in these experiments also serve to provide insights into the turbulence characteristics of the different oscillating motions of the flexible cylinders. Besides the above-mentioned features, it is also observed that the oscillations of AR = 16 at Re = 8000 are off-axis from the (y/D) graph. The same phenomenon was noticed by [24] in their results at high Re in which the wake is biased towards a particular side, away from the centerline. This is also evident by the fact that the cylinder is oscillating in favor of one side. It is suggested that the disorganized cross-flow oscillations which happen at Re = 8000 are due to the relatively low structural stiffness against the relatively strong fluid force (U = 0.65 m/s); thus, the flow becomes more complex.
Next, through the examination of AR = 12, 14 and 16 at Re = 6000, which coincidentally have the highest turbulence enhancement amongst the AR values, one can notice that the cross-flow oscillations are fairly organized. In other words, the oscillations have a fairly consistent frequency and amplitude. The (y/D) of AR = 12, 14 and 16 at Re = 4000 show fairly organized cross-flow oscillations, except their oscillating amplitude is lower than their respective AR operating at higher Re. The frequency of AR = 12 and 14 is close to regular and is in a more temporally periodic state. AR = 16 shows a higher amplitude in a certain cycle which could be due to the different mode change. It is believed that the cross-flow oscillations/motions of AR = 12 and 14 behave in this manner because its structural stiffness is relatively high in comparison to the relatively weak fluid force (U = 0.33 m/s) and the cross-flow oscillations are more predictable but lower amplitude. Therefore, the flow field is quite similar to that of a rigid/stationary cylinder [24]. Nevertheless, despite the similarity, the vibration of the cylinder has proven to enhance turbulence production.
Through the analysis above, it can be concluded that the vibration/oscillation/motion of the cylinder can alter the fluid flow significantly. The oscillation of the cylinder very much depends on the structural stiffness of the cylinder and the Re or fluid force more specifically. At a relatively high structural stiffness against relatively weak fluid force, the oscillations are fairly organized but the amplitudes are small. Turbulence enhancement is noticeable at this stage though not as significant. On the contrary, in the opposite condition, the flow becomes more complex and the cylinder undergoes fairly large amplitude but disorganized oscillation. Turbulence enhancement is also noticeable but at low efficiency. The (y/D) graphs suggest the possibility of mode change of vortex shedding. Mittal and Kumar [24] observed that under chaotic flow conditions, many small vortices are shed alongside the large vortex, and the flow field is very different from that of the rigid cylinder. Only in a suitable range of the structural stiffness and the fluid force will the oscillations become fairly organized and have a high amplitude. The turbulence enhancement associated with this oscillation is significant [28,29,30].
It shows that the max corresponds to the highest structural velocity (i.e., the velocity of the oscillation by the flexible cylinder under the same Re). However, it can be observed that the structural velocity at Re = 8000 is lower compared to the structural velocity of the same AR under lower Re. This is because the structural stiffness is too low for the fluid force. It causes the cylinder to oscillate in a disorganized motion. The frequent lower frequency and amplitude at certain cycles contribute to the lower structural velocity.
Since the vortex pattern depends heavily on the oscillation, it is suspected that the energy feeding process to the vortex must have been altered—it no longer follows the normal condition (classical Kármán vortex) where the vortex only sheds off when it has received sufficient energy. The mode change competition by the flexible cylinder could have interrupted the normal vortex formation for better or worse. Based on the performance of the turbulence enhancement by cylinders at Re = 8000, it can be confirmed that the alteration to the normal vortex formation at this Re is less than ideal as the improvement in max is quite low. It is recommended that the relationship between the motion of the cylinder and the vortex shedding mode be further studied or refined to further explore the effects of the shedding mode on the vortex strength. Fortunately, regardless of the performance of the turbulence enhancement, the adoption of flexible cylinders still proves to have a higher turbulence production than that of the rigid cylinder.
4. Conclusions
This work gives the conclusions of the key findings on the wake region modification by the flexible cylinder and the turbulence characteristics improved by the flexible cylinder over the rigid cylinder. The metal based flexible cylinder, namely the aluminum and carbon steel cylinder, did not experience a similar increment to that found in the EVA cylinder; instead, its wake region is approximately the same as that of the rigid cylinder. Through the analysis of the structural behavior, it is found that the cause of the increment in the wake region is due to the diminishing of the downwash that is presented in all cantilever cylinders. The reason for the disappearance is that the EVA flexible cylinder is deflected to the x direction due to the fluid force. As the metal based vibrating cylinders have a relatively higher stiffness property, they did not succumb to the bending; hence no deflection and, thereby, the wake region remained the same as that of a rigid cylinder.
Therefore, a greater deflection can greatly weaken the influence of downwash. The rigid cylinder of AR = 10 at Re = 4000 has produced a localized (/U) ≈ 26%. The turbulence intensity produced by another rigid cylinder at different AR and Re does not deviate much from 26%. In contrast to that, the increment of the localized (/U) produced by the flexible cylinder ranged from 36% to 99%. However, the carbon steel flexible cylinder did not experience any gain in value of the turbulence intensity as it behaved exactly like a rigid cylinder. The results show that the production term generated by the flexible cylinder is higher than that of a rigid cylinder. Similarly, the Reynolds shear stress has produced a similar pattern of results. The Reynolds shear stress is increased massively through the employment of flexible cylinders. However, the increment of the Reynolds shear stress does not strictly follow the AR or Re pattern. This suggests that the turbulence enhancement is neither influenced by the geometry factor (AR) nor the Re. Instead, it is closely linked to the structural dynamics of the cylinder that is governed by the AR and Re.
Author Contributions
Conceptualization, T.H.Y.; methodology, S.K.W.; validation, S.K.W. and S.A.S.; formal analysis, S.S.D.; investigation, T.H.Y.; resources, S.S.D., S.K.W. and S.A.S.; data curation, S.S.D.; writing—original draft preparation, T.H.Y.; writing—review and editing, S.S.D. and S.K.W.; visualization, T.H.Y.; supervision, S.S.D., S.K.W. and S.A.S.; project administration, S.S.D.; funding acquisition, S.S.D. All authors have read and agreed to the published version of the manuscript.
Funding
This research project was fully supported and funded by Fundamental Research Grant Scheme from Ministry of Higher Education Malaysia. The publication fund was supported by Abu Dhabi University.
Data Availability Statement
Not acceptable.
Conflicts of Interest
The authors declare no conflict of interest.
References
- Pattenden, R.J.; Turnock, S.R.; Zhang, X. Measurements of the flow over a low-aspect-ratio cylinder mounted on a ground plane. Exp. Fluids 2005, 39, 10–21. [Google Scholar] [CrossRef]
- Aris, M.; Owen, I.; Sutcliffe, C. The development of active vortex generators from shape memory alloys for the convective cooling of heated surfaces. Int. J. Heat Mass Transf. 2011, 54, 3566–3574. [Google Scholar] [CrossRef]
- Zahari, M.; Chan, H.B.; Yong, T.H.; Dol, S.S. The effects of spring stiffness on vortex-induced vibration for energy generation. In IOP Conference Series: Materials Science and Engineering; IOP Publishing: Bristol, UK, 2015; Volume 78, p. 012041. [Google Scholar]
- Tomomichi, N.; Kaneko, S.; Inada, F.; Kato, M.; Ishihara, K.; Nishihara, T.; Mureithi, N.W.; Langthjem, M.A. (Eds.) Flow-Induced Vibrations: Classifications and Lessons from Practical Experiences; Butterworth-Heinemann: Oxford, UK, 2013. [Google Scholar]
- Bai, Y.; Bai, Q. (Eds.) Subsea Pipelines and Risers; Elsevier: Amsterdam, The Netherlands, 2005. [Google Scholar]
- Yong, T.H.; Chan, H.B.; Dol, S.S.; Wee, S.K.; Sulaiman, S.A. Experimental Investigation on Effects of Elastic Agitator to Turbulence Enhancement. J. Appl. Fluid Mech. 2020, 14, 361–373. [Google Scholar]
- Kitagawa, T.; Fujino, Y.; Kimura, K.; Mizuno, Y. Wind pressures measurement on end-cell-induced vibration of a cantilevered circular cylinder. J. Wind. Eng. Ind. Aerodyn. 2002, 90, 395–405. [Google Scholar] [CrossRef]
- Sumner, D.; Heseltine, J.L.; Dansereau, O.J.P. Wake structure of a finite circular cylinder of small aspect ratio. Exp. Fluids 2004, 37, 720–730. [Google Scholar] [CrossRef]
- Luo, S.C. Flow past a finite length circular cylinder. In Proceedings of the Third International Offshore and Polar Engineering Conference, Singapore, 6 June 1993. [Google Scholar]
- Taniguchi, S.; Sakamoto, H.; Arie, M. Flow around Circular Cylinders of Finite Height Placed Vertically in Turbulent Boundary Layers. Bull. JSME 1981, 24, 37–44. [Google Scholar] [CrossRef]
- Park, C.-W.; Lee, S.-J. Flow structure around a finite circular cylinder embedded in various atmospheric boundary layers. Fluid Dyn. Res. 2002, 30, 197–215. [Google Scholar] [CrossRef]
- Liu, Y.; So, R.; Cui, Z. A finite cantilevered cylinder in a cross-flow. J. Fluids Struct. 2005, 20, 589–609. [Google Scholar] [CrossRef]
- Rostamy, N.; Sumner, D.; Bergstrom, D.; Bugg, J. Local flow field of a surface-mounted finite circular cylinder. J. Fluids Struct. 2012, 34, 105–122. [Google Scholar] [CrossRef]
- Park, C.; Lee, S. Effects of free-end corner shape on flow structure around a finite cylinder. J. Fluids Struct. 2004, 19, 141–158. [Google Scholar] [CrossRef]
- Adaramola, M.S. The Wake of an Exhaust Stack in a Crossflow. Ph.D. Thseis, Department of Mechanical Engineering, University of Saskatchewan, Saskatoon, SK, Canada, 2008. [Google Scholar]
- Govardhan, R.; Williamson, C. Mean and fluctuating velocity fields in the wake of a freely-vibrating cylinder. J. Fluids Struct. 2001, 15, 489–501. [Google Scholar] [CrossRef]
- Cantwell, B.; Coles, D. An experimental study of entrainment and transport in the turbulent near wake of a circular cylinder. J. Fluid Mech. 1983, 136, 321–374. [Google Scholar] [CrossRef]
- Yong, T.H.; Chan, H.B.; Dol, S.S.; Wee, S.K.; Kumar, P. The flow dynamics behind a flexible finite cylinder as a flexible agitator. IOP Conf. Ser. Mater. Sci. Eng. 2017, 206, 012033. [Google Scholar] [CrossRef]
- Dol, S.S.; Yong, T.H.; Bin Chan, H.; Wee, S.K.; Sulaiman, S.A. Turbulence Characteristics of the Flexible Circular Cylinder Agitator. Fluids 2021, 6, 238. [Google Scholar] [CrossRef]
- Yokoyama, K.; Kashiwaguma, N.; Okubo, T.; Takeda, Y. Flow measurement in an open channel by UVP. Proc. ISUD 2004, 4, 204–210. [Google Scholar]
- Jamshidnia, H.; Takeda, Y. UVP Measurement of Flow around a Baffle in a Rectangular Open Channel. J. Fluid Sci. Technol. 2009, 4, 758–774. [Google Scholar] [CrossRef]
- Park, C.W.; Lee, S.J. Free end effects on the near wake flow structure behind a finite circular cylinder. J. Wind. Eng. Ind. Aerodyn. 2000, 88, 231–246. [Google Scholar] [CrossRef]
- Coleman, H.W.; Steele, W.G. Experimentation and Uncertainty Analysis for Engineers, 2nd ed.; John Wiley and Sons, Inc.: New York, NY, USA, 1999; pp. 38–84. [Google Scholar]
- Mittal, S.; Kumar, V. Flow-induced vibrations of a light circular cylinder at reynolds numbers 103TO 104. J. Sound Vib. 2001, 245, 923–946. [Google Scholar] [CrossRef]
- Kuppan, T. Classification of Heat Exchanger. In Heat Exchanger Design Handbook, 2nd ed.; CRC Press Taylor & Francis Group: Boca Raton, FL, USA, 2013; pp. 1–27. [Google Scholar]
- Williamson, C.; Roshko, A. Vortex formation in the wake of an oscillating cylinder. J. Fluids Struct. 1988, 2, 355–381. [Google Scholar] [CrossRef]
- de Langre, E.; Gutierrez, A.; Cossé, J. On the scaling of drag reduction by reconfiguration in plants. Comptes Rendus Mécanique 2012, 340, 35–40. [Google Scholar] [CrossRef]
- Kang, Z.; Jia, L. An experiment study of a cylinder’s two degree of freedom VIV trajectories. Ocean Eng. 2013, 70, 129–140. [Google Scholar] [CrossRef]
- Kawamura, T.; Hiwada, M.; Hibino, T.; Mabuchi, I.; Kumada, M. Flow around a Finite Circular Cylinder on a Flat Plate : Cylinder height greater than turbulent boundary layer thickness. Bull. JSME 1984, 27, 2142–2151. [Google Scholar] [CrossRef]
- Sumner, D. Flow above the free end of a surface-mounted finite-height circular cylinder: A review. J. Fluids Struct. 2013, 43, 41–63. [Google Scholar] [CrossRef]


Disclaimer/Publisher’s Note: The statements, opinions and data contained in all publications are solely those of the individual author(s) and contributor(s) and not of MDPI and/or the editor(s). MDPI and/or the editor(s) disclaim responsibility for any injury to people or property resulting from any ideas, methods, instructions or products referred to in the content. |
© 2023 by the authors. Licensee MDPI, Basel, Switzerland. This article is an open access article distributed under the terms and conditions of the Creative Commons Attribution (CC BY) license (https://creativecommons.org/licenses/by/4.0/).