Abstract
The use of the new mining technology on the Third potash bed at the Starobinsk potash salt deposit is accompanied by the displacement of the undermined rocks. The displacement is accompanied by the foliation. The gas accumulates in the resulting foliation. The gas accumulations in the roof or the floor rocks can be the cause of a rockburst. A rockburst poses a threat to the miners’ lives, breaks driving and wide equipment and stops the working activity of the mines. Therefore, the study of the underworking effect on the gas content and the gas-dynamic characteristics are relevant problems in mining science. Thus, the purpose of this work is the study of the underworking effect on the gas content and the gas-dynamic characteristics. The τ criterion was used for testing the data samples. At the second stage of the comparative statistical analysis, two hypotheses H0 and H1 were accepted which were later subjected to verification using Student’s t-test. The gas parameters are changed by the camera floor and are not changed by other places. Therefore, the effect of the rock underworking leads to the formation of the additional foliation of the floor and, accordingly, to the free gases’ redistribution along the stratigraphic section and, ultimately, to the significant changes of the free gas content, the starting gas release and the gas pressure. The validity of the effect of the undermining can be the intensive gas releases repeatedly recorded in the process of drilling research holes into the soil with the ejection of a piece of the rock.
1. Introduction
The use of the new mining technology for the development of the Third potash bed at the Starobinsk potash salt deposit is accompanied by the intensification of the processes of the displacement of the undermined rocks. The new technology is a combination of two technological schemes—the gross excavation of the layers 2, 2–3 and 3 in the protected pillars and the excavation of the 4th sylvinite layer, which was undermined 25–30 years ago.
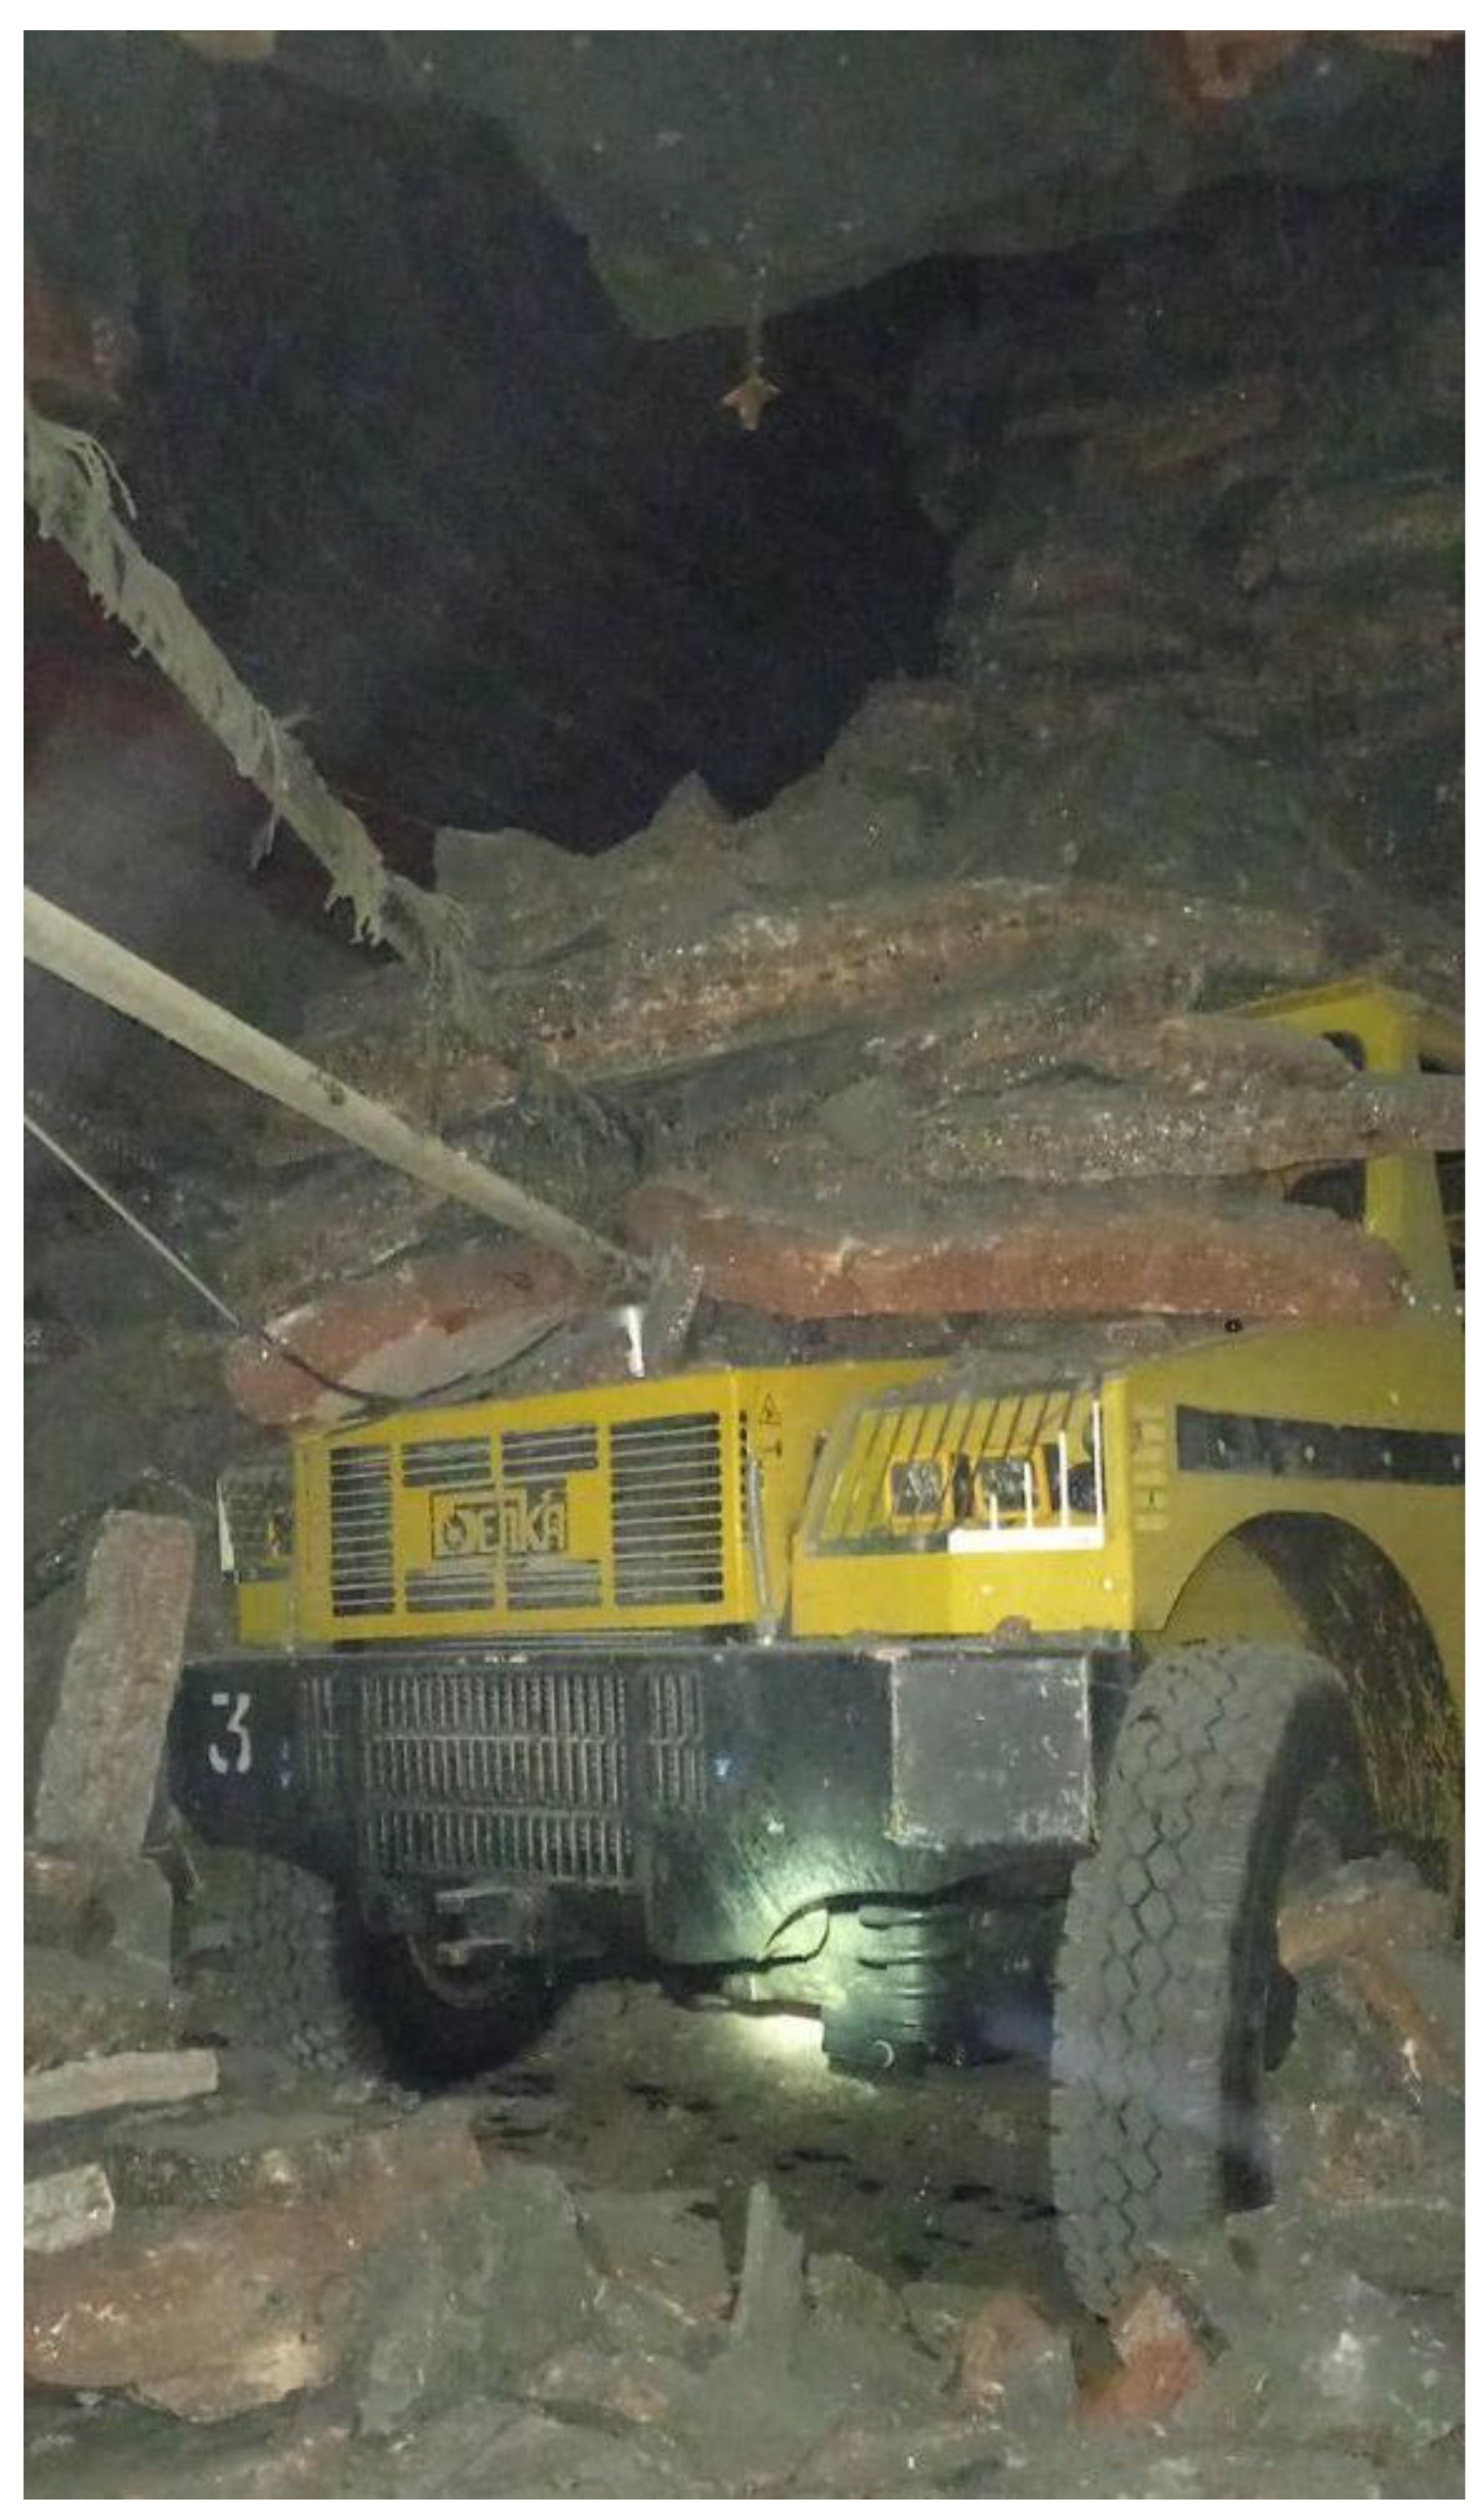
The processes of the displacement of the undermining were accompanied by the Rock foliation along the clay layers and the interlayers. This made it possible to form the gas accumulations in the resulting foliation. Such technogenic gas accumulations in the roof or the floor rocks can be the trap of the rockburst. It is accompanied by the gas release. Thus, a rockburst from the roof onto the car happened in 2021 (Figure 1). The car was intended for personnel. This happened in Mine 3 on the Second potash bed in the camera where the vehicle turns around.
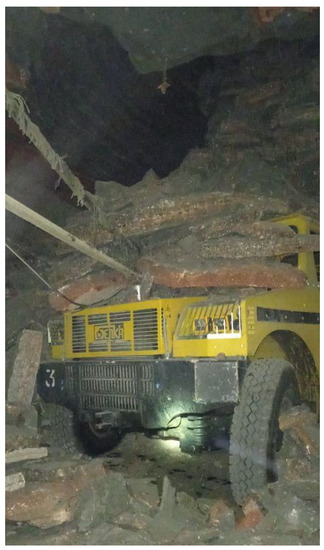
Figure 1.
Rockburst, accompanied by gas release from camera K2 where the vehicle turns around (Mine 3, Second potash bed).
It was found that one of the reasons for the rockburst may be the pressure in the gas accumulations. It is based on the results of studying the place of the rockburst, as well as studying the structure of the roof and the cases of rockburst (Scheme 1). It may be due to the undermining of the Second potash bed by the extraction on the Third potash bed. Because the sharpness deformation state of the salt rock mass was changed, the intensification of the Rock foliation of the roof happened and the free gas was supplied in the resulting foliation. Therefore, the purpose of this work is the study of the underworking effect on the gas content and the gas-dynamic characteristics. A rockburst poses a threat to miners’ lives, breaks driving and wide equipment, and stops the working activity of the mines. Therefore, the study of the underworking effect on the gas content and the gas-dynamic characteristics are relevant problems in mining science. The literature does not show an underworking effect on the gas content and the other gas-dynamic characteristics [1,2,3,4,5,6,7,8,9,10,11,12]. Thus, the underworking effect is the novel aspect of the study.
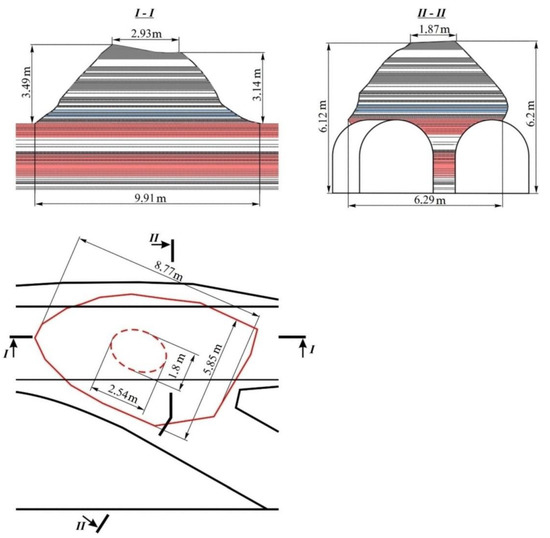
Scheme 1.
Rockburst in camera K2. I—horizontal section, II—vertical section.
A comparative statistical analysis of the data of the experimental studies was performed. The analysis was performed to study the effect of underworking on the gas content and the gas-dynamic characteristics of the rocks. The analysis was conducted for the conditions without and with the underworking.
2. Materials and Methods
At the first stage of the analysis, the samples of the obtained data were evaluated. It was needed for homogeneity in order to eliminate the so-called “outliers”. The obtained data included the free gas content, the starting gas release and the free gas pressure. The “outliers” may be associated with the measurement errors, the violation of the measurement conditions, the malfunction of the measuring instruments and equipment used, etc.
The τ criterion is used for testing the data samples. It is based on the fact that in a normal distribution, the appearance of the variant is small and can be calculated in advance. The variant is far from the mean value. This is described in detail in the works of Miller R., Alekseev F.A. and Mitropolsky A.K. [13,14,15].
The numerical value of the τ criterion is determined by the formulas:
The value of the dispersion S is determined by the expression:
The mean value of the parameter is found by the formula:
where xi is the parameter evaluated for the homogeneity;
- mi is the number of the measurements of the parameter with the value xi;
- N is the number of the observations (the parameter measurements).
Formula (3) serves to test the maximum value of the sample, and Formula (4) serves to test the minimum.
Alekseev F.A. calculated and tabulated the critical values of the τ criterion [14]. It was for the different values of the inference reliability α = 1 – and the different sample sizes N.
The sample is homogeneous if the inequality is true:
The index “05” indicates that we are using the 95% significance level.
Therefore, the value samples can be considered homogeneous. In addition, the obtained data can be used in a comparative statistical analysis of the results of the experimental studies.
At the second stage of the comparative statistical analysis, two hypotheses H0 and H1 were accepted which were later subjected to verification using Student’s t-test. Student’s t-test has been successfully used in the works of a statistical analysis of data in geology by such authors as Ryzhov P.A., Kalosha V.K., Afifi A. S. Eizen., Davis J.S, Bazhenova S.G., Bazhenova S.G., E. Lloyd, W. Lederman., Protasov K.V. and others [15,16,17,18,19,20,21,22,23].
The hypotheses were accepted as follows:
H0.
The samples of the experimental data are changed only by the random variations.
H1.
The samples of the experimental data obtained are taken from two general sets. They were with the different distribution laws. Therefore, they characterized the zones of the Second potash bed with the significantly different parameters, i.e., the undermining effect was admitted.
The experimental data were obtained during the experimental studies of the free gas content, the starting gas release and the free gas pressure in the rock mass of the Second potash bed, with and without undermining of the extraction on the Third potash bed.
Student’s t-test was calculated using the following formula:
where and are the mean values in the data samples.
S2p is the combined dispersion of two samples, calculated by the formula:
where n1 and n2 are the sizes of the experimental data samples.
S21 and S22 are the dispersions of the experimental data samples.
After substituting the numerical values into Formula (5), we obtain the calculated value of the Student’s t-test. The condition for not accepting the null hypothesis is the fulfillment of the inequality t tcr, where tcr is the critical value. At the significance level of 5%, we find the critical value. It is found from the table of the Student’s t-test values. If t tcr, we cannot accept the null hypothesis. It is with the probability of 0.95.
3. Results
The scope of the work is limited to recruiting 216 measurements of the gas content, 216 measurements of the starting gas release and 216 measurements of the gas pressure. The measurements were conducted in the drifts and the cameras where the vehicle turns around, without and with the underworking. The intervals (the depth) of the measurements are from 0 to 5 m. A total of 16 research wells were drilled in the areas without undermining, 8 in the roof of the workings and 8 in the soil. In each well, six measurements of the free gas content, the free gases pressure and the starting gas release were carried out. In total, 48 measurements were carried out in the roof and soil, with a total of 96. Ten research wells were drilled into the roof and soil of the workings on the areas with undermining. Six measurements were carried out in each well. In total, there were 60 measurements in the roof and 60 measurements in the soil, with a total of 120 measurements.
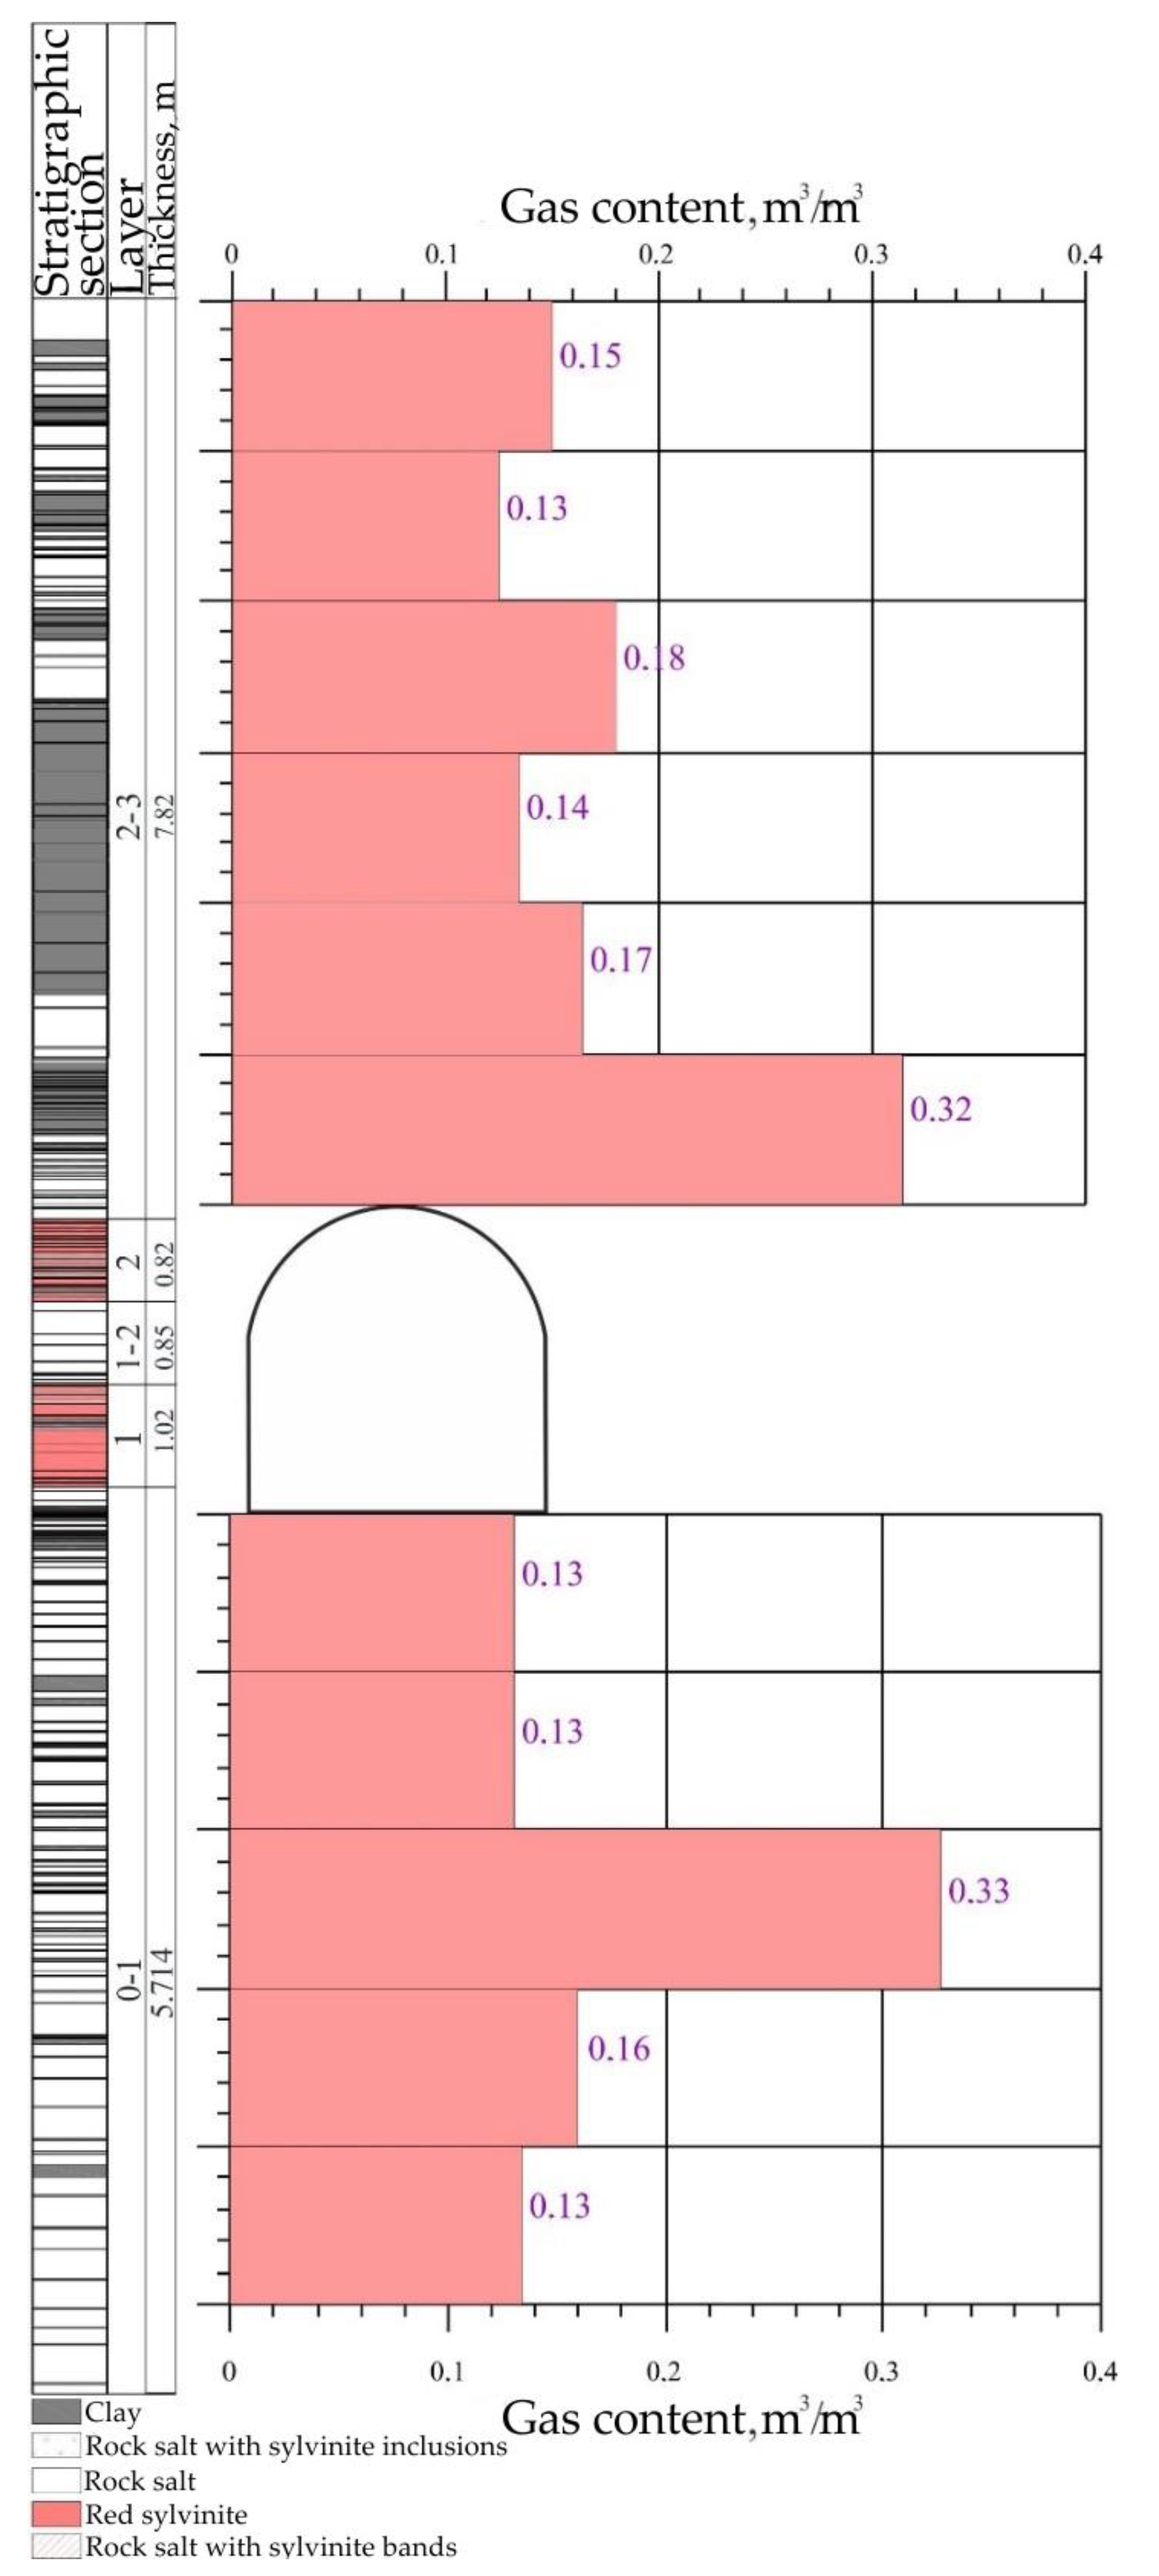
For example, Figure 2 shows the gas content of the drift roof and soil without the underworking. In addition, Figure 3 shows the gas pressure of the camera roof and soil with the underworking.

Figure 2.
The gas content of the drift roof and soil without the underworking.
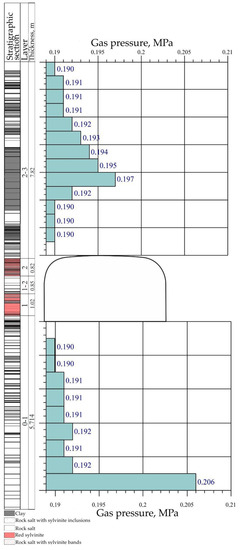
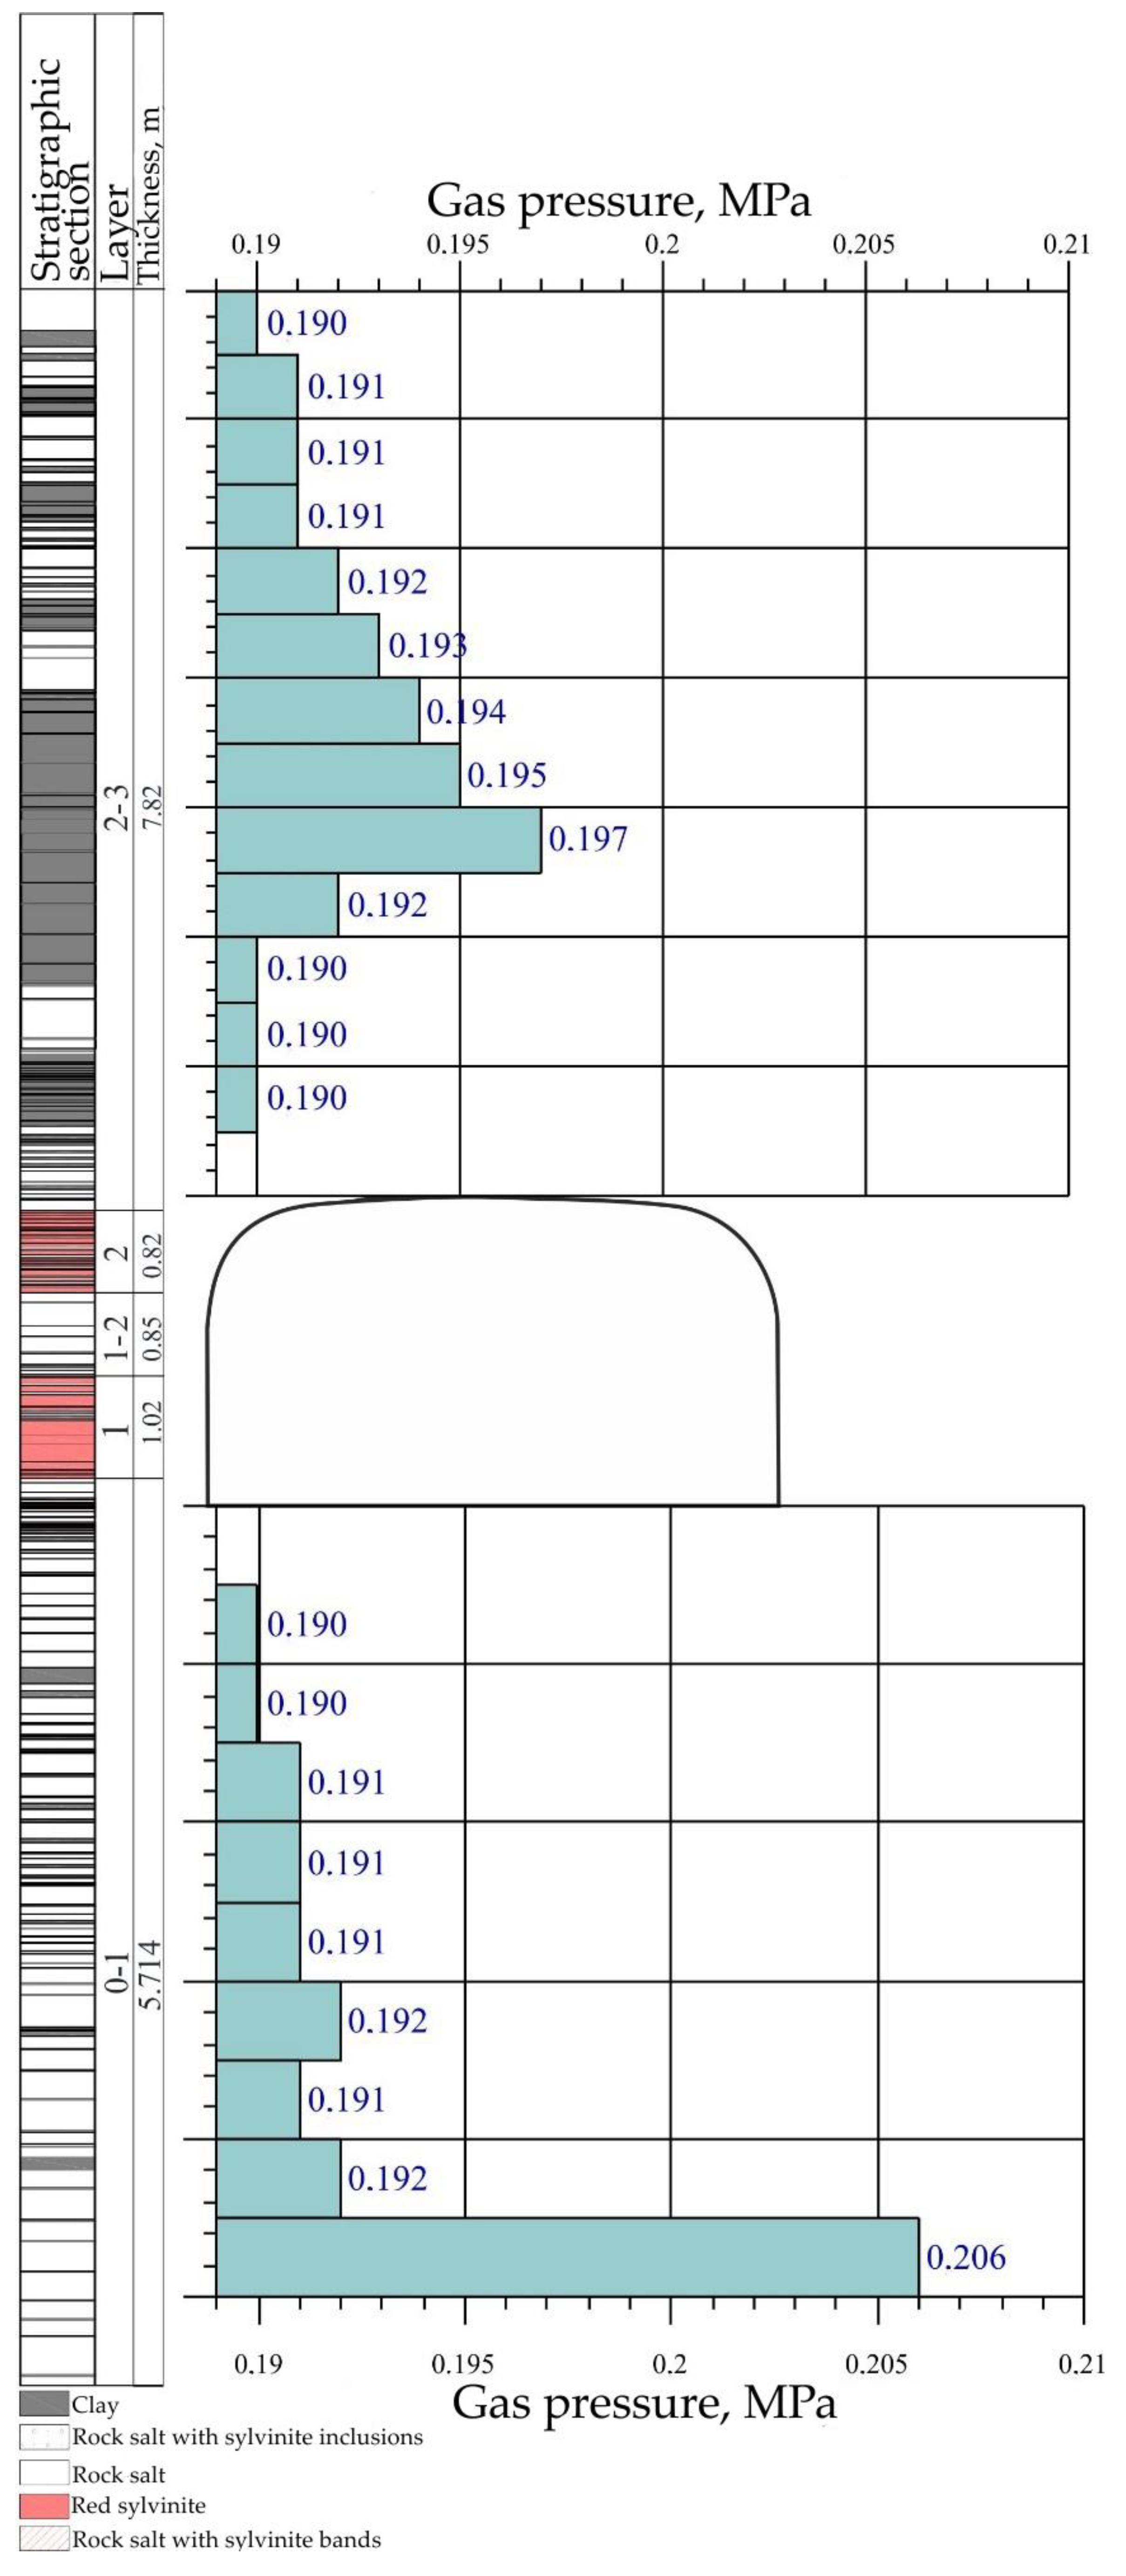
Figure 3.
The gas pressure of the camera roof and soil with the underworking.
The results of these measurements were taken for statistical processing.
3.1. The Results of the Statistical Analysis of the Experimental Studies of the Gas Content of the Second Potash Bed
Table 1 shows the gas content of the drift roof without and with the underworking.

Table 1.
The results of the statistical analysis of the experimental studies of the gas content of the drift roof.
Table 1 does not show a significant change in the gas content of the roof of the drift. The hypothesis H0 is accepted. It means that the samples of the experimental data are changed only by the random variations. The hypothesis is based on the results of the analysis. Therefore, the effect of the rocks’ underworking does not significantly change the gas content.
Table 2 shows the gas content of the drift floor without and with the underworking.
Table 2.
The results of the statistical analysis of the experimental studies of the free gas content of the drift floor.
Table 2 does not show a significant change in the gas content of the floor of the drift. The hypothesis H0 is accepted. It means that the samples of the experimental data are changed only by the random variations. The hypothesis is based on the results of the analysis. Therefore, the effect of the rocks’ underworking does not significantly change the gas content.
Table 3 shows the gas content of the camera roof without and with the underworking.
Table 3.
The results of the statistical analysis of the experimental studies of the gas content of the camera roof.
Table 3 does not show a significant change in the gas content of the camera roofs. The hypothesis H0 is accepted. It means that the samples of the experimental data are changed only by the random variations. The hypothesis is based on the results of the analysis.
Table 4 shows the gas content of the camera floor without and with the underworking.
Table 4.
The results of the statistical analysis of the experimental studies of the gas content of the camera floor.
As can be seen from Table 4, a significant change in the gas content of the camera floor installed by the intervals: 2.0–3.0, 3.0–4.0 and 4.0–5.0 m. Apparently, the processes of the displacement and the deformation of the floor rocks during the underworking were accompanied by the Rock foliation of the floor and, accordingly, led to the free gases’ redistribution along the stratigraphic section and to a change in the gas-dynamic characteristics. In this mining situation, two geomechanical processes overlap. The first process is due to the overworking of the camera floor. It was accompanied by the formation of the primary Rock foliation in the floor rocks and the free gas accumulations. The additional (secondary) Rock foliation could form at the floor rocks during the rock underworking, which led to the free gases’ redistribution along the stratigraphic section of the floor rocks. These geomechanical processes and the geological structure of the floor rocks could cause a significant change in the gas content in the indicated measurement intervals.
3.2. The Results of the Statistical Analysis of the Experimental Studies of the Starting Gas Release of the Second Potash Bed
Table 5 shows the starting gas release of the drift roof without and with the underworking.
Table 5.
The results of the statistical analysis of the experimental studies of the starting gas release of the drift roof.
As can be seen from Table 5, the significant change in the starting gas release of the roof of the drift installed by the interval 4.0–5.0 m. Apparently, it is due to the geological structure of the roof rocks in this interval, the effect of the rock underworking and the redistribution of the free gases along the stratigraphic section
Table 6 shows the gas pressure of the drift floor without and with the underworking.
Table 6.
The results of the statistical analysis of the experimental studies of the free gas pressure of the drift floor.
Table 6 does not show a significant change in the starting gas release of the floor of the drift. The hypothesis H0 is accepted. It means that the samples of the experimental data are changed only by the random variations. The hypothesis is based on the results of the analysis. Therefore, the effect of the rocks’ underworking does not significantly change the starting gas release.
Table 7 shows the starting gas release of the camera roof without and with the underworking.
Table 7.
The results of the statistical analysis of the experimental studies of the starting gas release of the camera roof.
Table 7 does not show a significant change in the starting gas release of the camera roofs. The hypothesis H0 was accepted. It means that the samples of experimental data are changed only by the random variations. The hypothesis is based on the results of the analysis.
Table 8 shows the starting gas release of the camera floor without and with the underworking.
Table 8.
The results of the statistical analysis of the experimental studies of the starting gas release of the camera floor.
As can be seen from Table 8, there is a significant change in the starting gas release of the floor of the cameras which were installed by the intervals: 1.0–2.0, 2.0–3.0 and 4.0–5.0 m. Apparently, the processes of the displacement and the deformation of the floor rocks during the underworking were accompanied by the Rock foliation of the floor and, accordingly, led to the free gases’ redistribution along the stratigraphic section and to the change in gas-dynamic characteristics. The additional (secondary) Rock foliation could form at the floor rocks during the rock underworking, which led to the free gases’ redistribution along the stratigraphic section of the floor rocks. These geomechanical processes and the geological structure of the floor rocks could cause a significant change in the starting gas release in the indicated measurement intervals.
3.3. The Results of the Statistical Analysis of the Experimental Studies of the Free Gas Pressure of the Second Potash Bed
Table 9 shows the gas pressure of the drift roof without and with the underworking.
Table 9.
The results of the statistical analysis of the experimental studies of the free gas pressure of the drift roof.
Table 9 does not show a significant change in the gas pressure of the roof of the drift. The hypothesis H0 is accepted. It means that the samples of the experimental data are changed only by the random variations. The hypothesis is based on the results of the analysis. Therefore, the effect of the rocks’ underworking does not lead to an increase in the gas pressure.
Table 10 shows the gas pressure of the drift floor without and with the underworking.
Table 10.
The results of the statistical analysis of the experimental studies of the free gas pressure of the drift floor.
Table 10 does not show a significant change in the gas pressure of the floor of the drift. The hypothesis H0 is accepted. It means that the samples of the experimental data are changed only by the random variations. The hypothesis is based on the results of the analysis. Therefore, the effect of the rocks’ underworking does not lead to an increase in the gas pressure.
Table 11 shows the gas pressure of the camera roof without and with the underworking.
Table 11.
The results of the statistical analysis of the experimental studies of the free gas pressure of the camera roof.
Table 11 does not show a significant change in the gas pressure of the camera roofs. The hypothesis H0 is accepted. It means that the samples of the experimental data are changed only by the random variations. The hypothesis is based on the results of the analysis.
Table 12 shows the gas pressure of the camera floor without and with the underworking.
Table 12.
The results of the statistical analysis of the experimental studies of the free gas pressure of the camera floor.
As can be seen from Table 12, there is a significant change in the gas pressure of the floor of the cameras which were installed by the intervals: 1.0–2.0, 2.0–3.0 and 3.0–4.0 m. Apparently, the processes of the displacement and the deformation of the floor rocks during the underworking were accompanied by the Rock foliation of the floor and, accordingly, led to the free gases’ redistribution along the stratigraphic section and to the change in gas-dynamic characteristics. The additional (secondary) Rock foliation could form at the floor rocks during the rock underworking, which led to the free gases’ redistribution along the stratigraphic section of the floor rocks [6]. These geomechanical processes and the geological structure of the floor rocks could cause a significant change in the free gases’ pressure in the indicated measurement intervals.
4. Discussion
In general, summing up the results, it is necessary to dwell on a number of the important points. The obtained statistical conclusions are valid for the drift and the floor of the camera. It was despite the correctness and the rigor of the Student’s t-criterion used in the comparative statistical analysis. Thereby, the parameters for the deep preventive drilling were developed and implemented at Mine 3. It was conducted to prevent the rockburst from the roof in the camera and in the conjugating of the drift in the southeastern section of the mine field at the depth of 420 m. It was straightaway after the rockburst from the roof in camera K2. It was the drilling of drainage holes into the roof. Its depth is 6.0 m with a drilling step of no more than 6.0 m. One deep degassing hole was drilled, when the roof area of the conjugating of the drifts is up to 80.0 m2. In addition, two degassing holes were drilled when the roof area is more than 80 m2. Thus, the roof of the K1, K3 and K4 cameras were partially degassed by the prophylactic degassing drilling of the deep holes into the roof. In addition, the roof of K2 was partially degassed as a result of the rockburst. In this regard, “residual” indicators were measured. The roof was already partially degassed. It was at distances from the degassing holes of more than a “degassing drilling step” equal to 6.0 m. Which, ultimately, could lead to an artificial underestimation (“alignment”) of the gas content and the gas-dynamic characteristics. Therefore, the obtained statistical conclusions should be attributed to already partially degassed rocks. It was for the camera roof.
The validity of the effect of the undermining can be the intensive gas releases repeatedly recorded in the process of drilling research holes into the soil with the ejection of a piece of the rock. It was on the Second potash bed in the camera. Thus, the gas releases with the ejection of a piece of the rock were repeatedly noted. It was in the floor of K2 at a depth of more than 2.0 m. In addition, the intensive gas release was noted at a depth of 5.0 m.
5. Conclusions
The results of the statistical analysis of the free gas content, the starting gas release and the gas pressure showed:
- No the significant change in these gas parameters found by the roofs and the floors of the drift. The samples of the experimental data are changed only by the random variations. The effect of the rocks’ underworking does not significantly change these gas parameters.
- These gas parameter readings were not changed by the roofs of the cameras where the motor transport turns around. It happened because the degassing holes were drilled in the roof. The drilling was conducted before the start of the experimental studies.
- The readings of these gas parameters were changed by the camera floor. It was installed for the following intervals: the free gas content—(2.0–3.0), (3.0 m—4.0) and (4.0 m—5.0 m); the starting gas release—(1.0–2.0), (2.0–3.0) and (4.0–5.0 m); and the gas pressure—(1.0–2.0), (2.0–3.0) and (3.0–4.0 m). The effect of the rocks’ underworking leads to the formation of the additional Rock foliation of the floor and, accordingly, to the free gases’ redistribution along the stratigraphic section and, ultimately, to the significant changes in the free gas content, the starting gas release and the gas pressure.
The underground mining of all existing fields of potassium and magnesium salts is commonly complicated by the intense emission of combustible and toxic gases and also gas-dynamic phenomena of different types. These processes pose a threat to the miners’ lives, break driving and wide equipment and stop the working activity of the mines. Therefore, the received results of the statistical analysis of the free gas content, the starting gas release and the gas pressure are real novel data for mining science.
Author Contributions
Conceptualization, S.S.A. and N.L.; methodology, S.S.A. and N.L.; software, N.L. and A.P.; validation, S.S.A., A.P. and T.L.; formal analysis, N.L. and A.P.; investigation, S.S.A., N.L. and A.P.; resources, S.S.A.; data curation, S.S.A. and N.L.; writing—original draft preparation, N.L., A.P. and T.L.; writing—review and editing, S.S.A. and T.L.; visualization, A.P. and T.L.; supervision, S.S.A.; project administration, S.S.A.; funding acquisition, S.S.A. All authors have read and agreed to the published version of the manuscript.
Funding
The study was financially supported by the Ministry of Science and Education of the Russian Federation within the framework of the agreement on state task No. 075-03-2021-374 of 29 December 2020 (registration number 122012000396-6) and RFBR grant No. 20-45-596017.
Data Availability Statement
Not applicable.
Conflicts of Interest
The authors declare no conflict of interest.
References
- Kovalev, O.V.; Livensky, V.S.; Bylino, L.V. (Eds.) Features of the Safe Development of Potash Deposits; Polymya: Minsk, Belarus, 1982; 96p. [Google Scholar]
- Proskuryakov, N.M.; Kovalev, O.V.; Meshcheryakov, V.V. (Eds.) Management of Gas-Dynamic Processes in the Layers of Potash Ores; Nedra: Moscow, Russia, 1988; 239p. [Google Scholar]
- Polyanina, G.D.; Zemskov, A.N.; Paderin, Y.N. (Eds.) Technology and Safety of Development of the Verkhnekamskoye Potash Deposit; Perm Book Publishing House: Perm, Russia, 1990; 262p. [Google Scholar]
- Proskuryakov, N.M. (Ed.) Sudden Outbursts of Rock and Gas in Potash Mines; Nedra: Moscow, Russia, 1980; 263p. [Google Scholar]
- Andreiko, S.S. (Ed.) Gas-Dynamic Phenomena in Potash Mines: Methods of Forecasting and Methods of Prevention; Publishing House of Perm: Perm, Russia, 2007; 219p. [Google Scholar]
- Andreiko, S.S.; Litvinovskaya, O.V.I. (Eds.) Forecasting and Prevention of Gas-Dynamic Phenomena from the Soil during the Excavation of Development Workings in the Undermined Massif of Salt Rocks; Publishing House of Perm; National Research Polytechnic University: Perm, Russia, 2015; 159p. [Google Scholar]
- Nesterov, E.A. Analysis of the Geological and Mining Conditions for the Occurrence of Hydrodynamics in the Mine Field of the SKPRU-3 Mine; In Strategy and Processes of Development of Georesources; Publishing House of Perm: Perm, Russia, 2010; № 1; pp. 223–224. [Google Scholar]
- Litvinovskaya, N.A. Forecast and prevention of gas-dynamic phenomena from the soil of preparatory mine workings under undermining conditions. In Mining Information and Analytical Bulletin; MGGU: Moscow, Russia, 2010; pp. 180–186. [Google Scholar]
- Nesterov, E.A.; Andreiko, S.S.; Ivanov, O.V. (Eds.) Fight against Gas-Dynamic Phenomena in the Development of Verkhnekamskoye and Starobinskoye Potassium Salt Deposits; Scientific Research and Innovation: Moscow, Russia; Publishing House of Perm: Perm, Russia, 2010; Volume 3, pp. 34–37. [Google Scholar]
- Beresnev, S.P.; Senyuk, V.V.; Gonchar, V.I.; Andreiko, S.S.; Litvinovskaya, N.A. Investigation of the mechanism of formation of zones dangerous for gas-dynamic phenomena in the rocks of the potassium horizon. Mining Magazine, 2010; № 8. 31–33. [Google Scholar]
- Podlesny, I.A.; Beresnev, S.P.; Andreiko, S.S.; Nekrasov, S.V.; Litvinovskaya, N.A. Geomechanical modeling of sudden destruction of soil rocks in mine workings. Mining Magazine, 2010; № 8. 28–30. [Google Scholar]
- Nesterov, E.A. Improving the technology of degassing work during the development of sylvinite layers in the conditions of mine fields of the mines of OAO Silvinit. In Bulletin of PNIPU. Geology. Oil and Gas and Mining; Publishing House of Perm: Perm, Russia, 2013; pp. 120–127. [Google Scholar]
- Miller, R.; Kahn, D. (Eds.) Statistical Analysis in Geological Sciences; Nedra: Moscow, Russia, 1965; 383p. [Google Scholar]
- Alekseev, F.A. Fundamentals of Direct Geochemical Methods of Prospecting for Oil and Gas Fields: Temporary Methodological Instruction; Publisher: Moscow, Russian, 1967; 527p. [Google Scholar]
- Mitropolsky, A.K. Technique of Statistical Calculations; Science: Moscow, Russian, 1971; 576p. [Google Scholar]
- Ryzhov, P.A. Mathematical Statistics in Mining; Higher School: Minsk, Belarus, 1973; 287p. [Google Scholar]
- Kalosha, V.K.; Lobko, S.I.; Chikov, T.S. (Eds.) Mathematical Processing of Experimental Results; Higher School: Minsk, Belarus, 1982; 103p. [Google Scholar]
- Afifi, A.; Eizen, S. (Eds.) Statistical Analysis: A Computer-Assisted Approach; Mir: Moscow, Russia, 1982; 488p. [Google Scholar]
- Davis, J.S. Statistical Analysis of Data in Geology; Nedra: Moscow, Russia, 1990; 427p. [Google Scholar]
- Bazhenova, S.G. Practical Statistics; Publishing House of Moscow State University for the Humanities: Moscow, Russia, 1994; 86p. [Google Scholar]
- Bazhenova, S.G. Mathematical and Statistical Methods in the Mining Industry: Educational Allowance, 2nd ed.; Publishing House of the Moscow State Mining University: Moscow, Russia, 2001; 99p. [Google Scholar]
- Lloyd, E.; Lederman, W. (Eds.) Handbook of Applied Statistics; Finance and Statistics: Moscow, Russia, 1989; Volume 2. [Google Scholar]
- Protasov, K.V. Statistical Analysis of Experimental Data; Mir: Moscow, Russia, 2005; 142p. [Google Scholar]

Publisher’s Note: MDPI stays neutral with regard to jurisdictional claims in published maps and institutional affiliations. |
© 2022 by the authors. Licensee MDPI, Basel, Switzerland. This article is an open access article distributed under the terms and conditions of the Creative Commons Attribution (CC BY) license (https://creativecommons.org/licenses/by/4.0/).