Article

Stability Analysis of Concrete Block Anchor on Steep-Slope Floating Breakwater

1
Ocean Engineering, Institut Teknologi Sepuluh Nopember, Surabaya 60111, Indonesia
2
Marine Science, University of Maritime Raja Ali, Tanjungpinang 29111, Indonesia
*
Author to whom correspondence should be addressed.
Fluids 2022, 7(8), 259; https://doi.org/10.3390/fluids7080259
Submission received: 16 June 2022 / Revised: 22 July 2022 / Accepted: 25 July 2022 / Published: 29 July 2022

Abstract

:
The floating breakwater is a protective structure that can absorb waves and can be used effectively in coastal areas with moderate wave environmental conditions. The stability of the floating breakwater is affected by the tension of the mooring line and the weight of the anchor. This research was conducted experimentally with a model scale of 1:10 on a floating breakwater with mooring systems and concrete anchor blocks with three types of configurations. The experiment was carried out on irregular waves with the following variations: wave height and period, mooring angle, structure width, and anchor weight. The results of this study indicate that at a wave steepness of 0.02–0.025 floating breakwater, which is installed with a mooring angle of 45 deg, configuration 3 has the largest stability parameter among other configurations. However, if the structure is installed at a mooring angle of 90 deg and cross, configurations 2 and 3 have almost the same stability. The test results also show that the relative width will affect the stability parameters. Configuration 3 (B = 30 cm) has the largest stability-parameter value among other configurations (B = 10 cm and 20 cm).

1. Introduction

Damage to the coastal environment will increase over time, especially coastal abrasion. Coastal abrasion has reached an alarming level in almost all regions in Indonesia. At least 400 km of the 81,000 km of beaches in Indonesia have been damaged by abrasion. On the island of Java, 44 percent of the coastline is experiencing abrasion of the total coastline of 745 km [1]. In recent years, the coastline in several areas in Indonesia has narrowed, which is quite alarming.
Abrasion is the process of beach erosion by scouring seawater, either caused by rising sea levels or by the destructive power of ocean waves and ocean currents. Abrasion can cause the shoreline to protrude further inland, resulting in shoreline retreat. Therefore, constructing coastal structures to maintain the coastline is necessary, with the aim of protecting the shoreline from the onslaught of waves or by reducing wave energy. One of the coastal structures that can reduce wave energy is a breakwater structure.
Breakwater is a very effective wave barrier structure to use as a beach protector against abrasion and coastal erosion by destroying wave energy before it reaches the coast. Recently, many studies have developed effective wave-retaining coastal structures that can reduce wave energy and provide positive benefits to both conventional and floating systems. Breakwater is a wave-retaining structure widely used today for shallow water [2,3,4,5,6,7,8]. Coastal protection in practice will become more complex, requiring engineers to offer solutions friendly to natural, economic, and social elements in certain areas. Coastal structures designed to protect beaches can be integrated into various solutions depending on the available space, location, and the social urgency of their placement [9]. The use of breakwaters, apart from being a coastal protection structure, has also been developed as a wave-energy generator so that the structure becomes more effective and efficient [10,11].
The wave-retaining beach structure has undergone tremendous development. Floating breakwaters can be an alternative to fixed breakwaters in coastal areas with moderate wave environmental conditions. Poor soil and environmental conditions, deep sea depths, intense coastal erosion phenomena, and aesthetic considerations strongly support the application of this structure [12]. Compared to fixed breakwaters, floating breakwaters have many advantages, including the fact that the structure can be used in soft-subgrade conditions and sea depths of more than 10 feet. Floating breakwaters produce minimal interference with water circulation, sediment transport, and fish migration so that it does not cause scouring, effectively dampening waves of less than 2 m [13,14,15]. These structures can also be moved and rearranged easily with different layouts to other locations [16,17,18]. However, floating breakwaters also have disadvantages, including being less effective in reducing waves for short waves. Practically, the upper limit of the wave period is 6 s with a frequency of 1.6 radians/second, and if the mooring structure fails, it will lead to disaster [16]. These structures require high maintenance costs compared to conventional breakwaters [17].
The main principle of the floating breakwater in reducing waves is to use the reflected wave method and the wave-particle destruction motion. Its ability to reflect and interfere with waves depends on the surface design, dimensions, shape, and configuration. Floating breakwater will cause wave diffraction. The wave will break when it hits the structure, and then the structure will absorb the energy of the wave. The greater the absorbed wave energy, the higher the intensity of the structural motion. The amount of energy absorbed is determined by the cross-sectional area of the structure relative to the direction perpendicular to the incident wave [19,20,21,22].
Many researchers have researched floating breakwaters through numerical models and experimental studies. In the 1970s, more than 60 floating breakwaters were designed with different configurations [23,24,25]. Hales [13] reviewed various floating breakwaters and classified their configurations into eleven categories. Furthermore, McCartney [12] grouped floating breakwaters based on shape and performance against wave height reduction into four types: box, mat, pontoon, and tethered. A more general division is described by PIANC [26], based on two characteristics: (a) reflection and dissipation; and (b) analyzing four different configurations, namely pontoon, mat, a-frame, and tethered. Reflective structures will be able to reflect most of the incident waves, but dissipative structures can cause friction and turbulence to the energy of the incoming waves. Sawaragi [27] separates floating breakwaters based on the mechanism of wave damping, namely reflection, reflection and breaking waves, and friction. In a study by Dai et al. [18], floating breakwaters, based on their shape, are grouped into pontoons, boxes, frames, horizontal plates, tethered floats, and others.
As a result of this positive effect, various types of floating breakwaters have been identified. However, the pontoon is the most commonly used type, connected and moored by cables or chains to the seabed. The tethered floating breakwater must be properly designed so that the energy transmitted by the wave energy can effectively reduce its energy. The mooring used must be able to keep this structure in position because floating breakwaters are floating structures prone to shifting positions. Utilizing mooring system on floating breakwater must be carried out by taking into account several important aspects, including the failure of the mooring rope and the floaters and the interconnection between the mooring and floaters [28].
Meanwhile, the anchoring system must also follow the type of seabed in the area because the anchor plays an essential role in determining the stability of the floating breakwater. A suitable anchoring system can hold the floating breakwater in a stable position when the waves come. A concrete anchor block is one anchor used in the floating breakwater. The use of concrete as an anchor differs from the many types of steel anchors available commercially [15]. The use of concrete as an anchor is expected to function optimally to maintain the stability of the floating breakwater. Concrete anchors are more economical and easier to manufacture and maintain than steel anchors, and corrosion is one of the most supportive factors and concerns in choosing concrete as an anchor [29].
This research was conducted with a physical model test in the wave flume lab. The model comprises three different configurations of structures and mooring-angle directions. The test was tested on various variations of height (H) and period (T) of irregular waves with the Jonswap spectrum. The weight of the anchor is also varied to determine the optimization of the stability of the floating breakwater. The results of this study will be able to determine the weight of the anchor block concrete effectively in various configurations so that the floating breakwater is stable enough to be placed.

1.1. Mooring System

Floating breakwaters can be installed in three ways [12]: (a) an anchor pile system, where the floating breakwater moves up and down with the tide, but there is no lateral movement; (b) a concrete mass or anchor system with a mooring line; and (c) a stake pile and rope system. The floating breakwater with piles is limited to shallow areas or about 9.1 m depth, with suitable material for pile penetration and sufficient lateral strength. Generally, the pile is placed under the mud line with a drill to obtain the greatest strength and prevent damage to the pile made of wood. Piles are suitable for solid foundations with a water depth of fewer than 15.2 m. Anchors, such as concrete blocks or boat anchors, can be used at various water depths but work best if the seabed is sand or mud. Concrete beam anchors work on the principle of soil shear strength developed with a greater load capacity than concrete beam anchors with the same weight. Based on the research of Cox and Beach [30], floating breakwaters with pile systems are widely used in Australia because the anchoring and pile systems require inspection and maintenance costs that are not too high. However, anchors or posts are suitable options in cases where the water depth is too large [12].
Types of mooring lines can be used in nylon, chains, steel cables, or a combination thereof. The mooring lines’ elasticity must be considered to predict the load transferred to the anchor or pile. Two methods have been proposed to reduce the impact load on the anchor inserting the tire into the mooring line or by a weight suspended from the line. This method is intended as a shock absorber. However, the anchoring force will be higher with the clump weight than without the clump weight. In the rectangular box floating breakwater project in Puget Sound, Washington, the mooring lines are designed to be either crossed or not. The advantage of the cross-system is that it can provide additional keel clearance for vessels moored beside it. If cross lines are used, they must be balanced to prevent friction. The scope of the mooring line is usually between 3-1 and 5-1, regardless of the type of anchor.
The safety factor for normal conditions on the anchoring line ranges from 3 to 4 [31], which is stated in SF = R/S, where R = minimum breaking force; S = force in the line. The type and configuration of the mooring depend on the magnitude of the horizontal load received by the structure. The mooring system type is divided into three categories: a wire rope system, all chain system, and combination chain/wire rope system.

1.2. Concrete Block Anchor

A concrete block is a building material product in the form of a block and is made from a mixture of cement, water, stone ash, or cast concrete. Concrete blocks are usually known as paving blocks or bricks. The use of concrete blocks as anchors for floating breakwaters is now widely used. As an alternative to choosing the type of anchor that uses materials that are not easily corroded and also as an added stability to the floating breakwater, concrete block anchors will reduce anchor installation and maintenance costs. Due to its anti-corrosion properties, it is rare to replace concrete block anchors. Concrete block anchors have various shapes according to the desired design. In this study, a rectangular block-shaped design was chosen.
The anchor weight can be calculated by knowing the maximum tensile stress of the structure by considering the coefficient of friction to resist the horizontal pull from the seabed surface. The anchor weight can be calculated by the following equation [29]:
W T M ( S F sin φ + μ cos φ ) μ ( 1 w 0 σ G )
where W is the weight of the anchor block in the water (kg), σG is the weight per unit volume or specific gravity (kg/m3), μ is the coefficient of friction between the anchor and sea beds (0.5–0.6), SF is a safety factor, and TM is mooring tension (N).

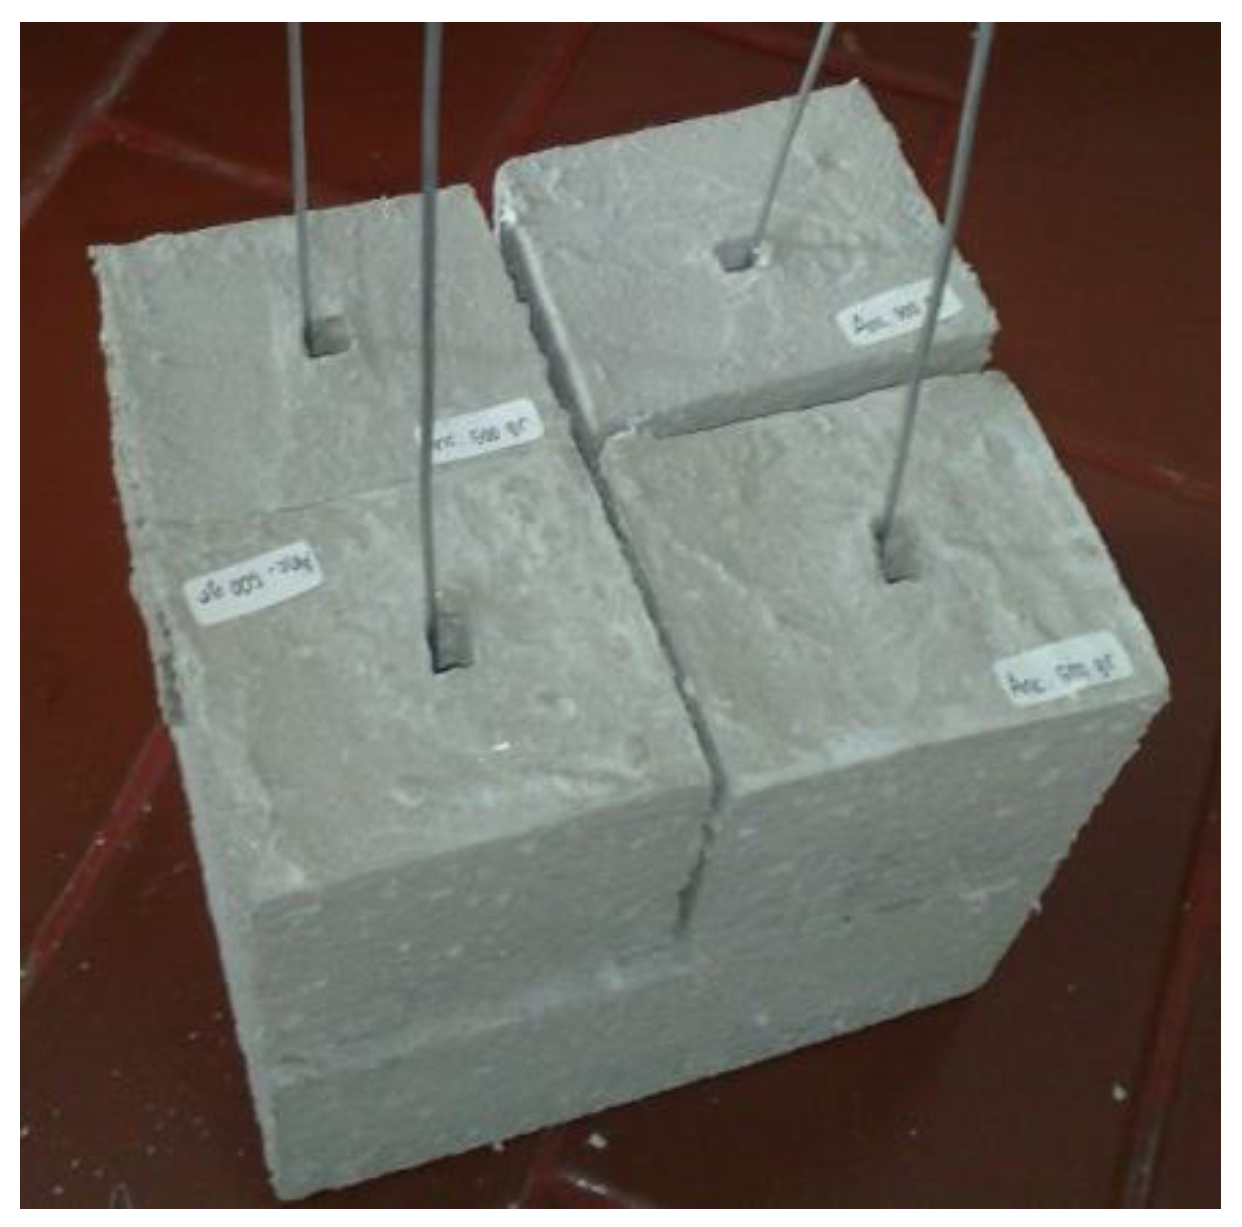
2. Materials and Methods

2.1. Dimensional Analysis

During the experiment in the wave flume, the wave hits the floating breakwater, resulting in hydrodynamic and frictional forces that affect the anchor as the stability of the floating breakwater. The variables related to the phenomenon of the stability of the concrete anchor on the floating breakwater are as follows:
W =   [   H ,   T ,   h , α ,   B ,   ρ ,   g   ]
where W is the weight of concrete anchor (kg), H is the wave height (m), T is the wave period (sec), h is the water depth (m), α is the angle between the mooring and floating breakwater (deg), B is the width of floating breakwater (m), ρ is the density of seawater (kg/m3), and g is the acceleration due to gravity (m/s2). The dimensional analysis of these variables is stated in Table 1.
In this study, the dimensional analysis uses the Buckingham pi theorem, which is solved by the matrix method. This method selects variables that represent each dimension as independent and dependent variables so that dimensionless numbers can be obtained [32]. Dimensional analysis for the stability phenomenon of anchor concrete block on floating breakwater obtained several solutions to dimensionless equations. To solve the dimensionless weight equation for concrete block anchors in floating breakwaters, where the weight of the concrete block anchor (W) is directly proportional to the density of water (ρ) and wave height (H):
W ρ H 3 = [ T g 0 , 5 H 0.5 , h H , B H , α ]
W ρ H 3 = [ gT 2 H , h H , B H , α ]
The solution to the dimensionless period equation is the equation of the wave period parameter (T) multiplied by the earth’s gravitational acceleration (g) and divided by wave height (H).
T g 0 , 5 H 0 , 5 = [ W ρ H 3 , h H , B H , α ]
gT 2 H = [ W ρ H 3 , h H , B H , α ]
H gT 2 = [ ρ H 3 W , H h , H B , 1 α ]
The solution to the dimensionless water depth equation is generated by the water depth parameter (h) against significant wave height (H).
h H = [ W ρ H 3 , T g 0 , 5 H 0 , 5 , B H , α ]
h H = [ W ρ H 3 , gT 2 H , B H , α ]
Meanwhile, the solution to the dimensionless floating breakwater width equation is the ratio between the width of the floating breakwater (B) to the significant wave height (H).
B H = [ W ρ H 3 , gT 2 H , h H , α ]

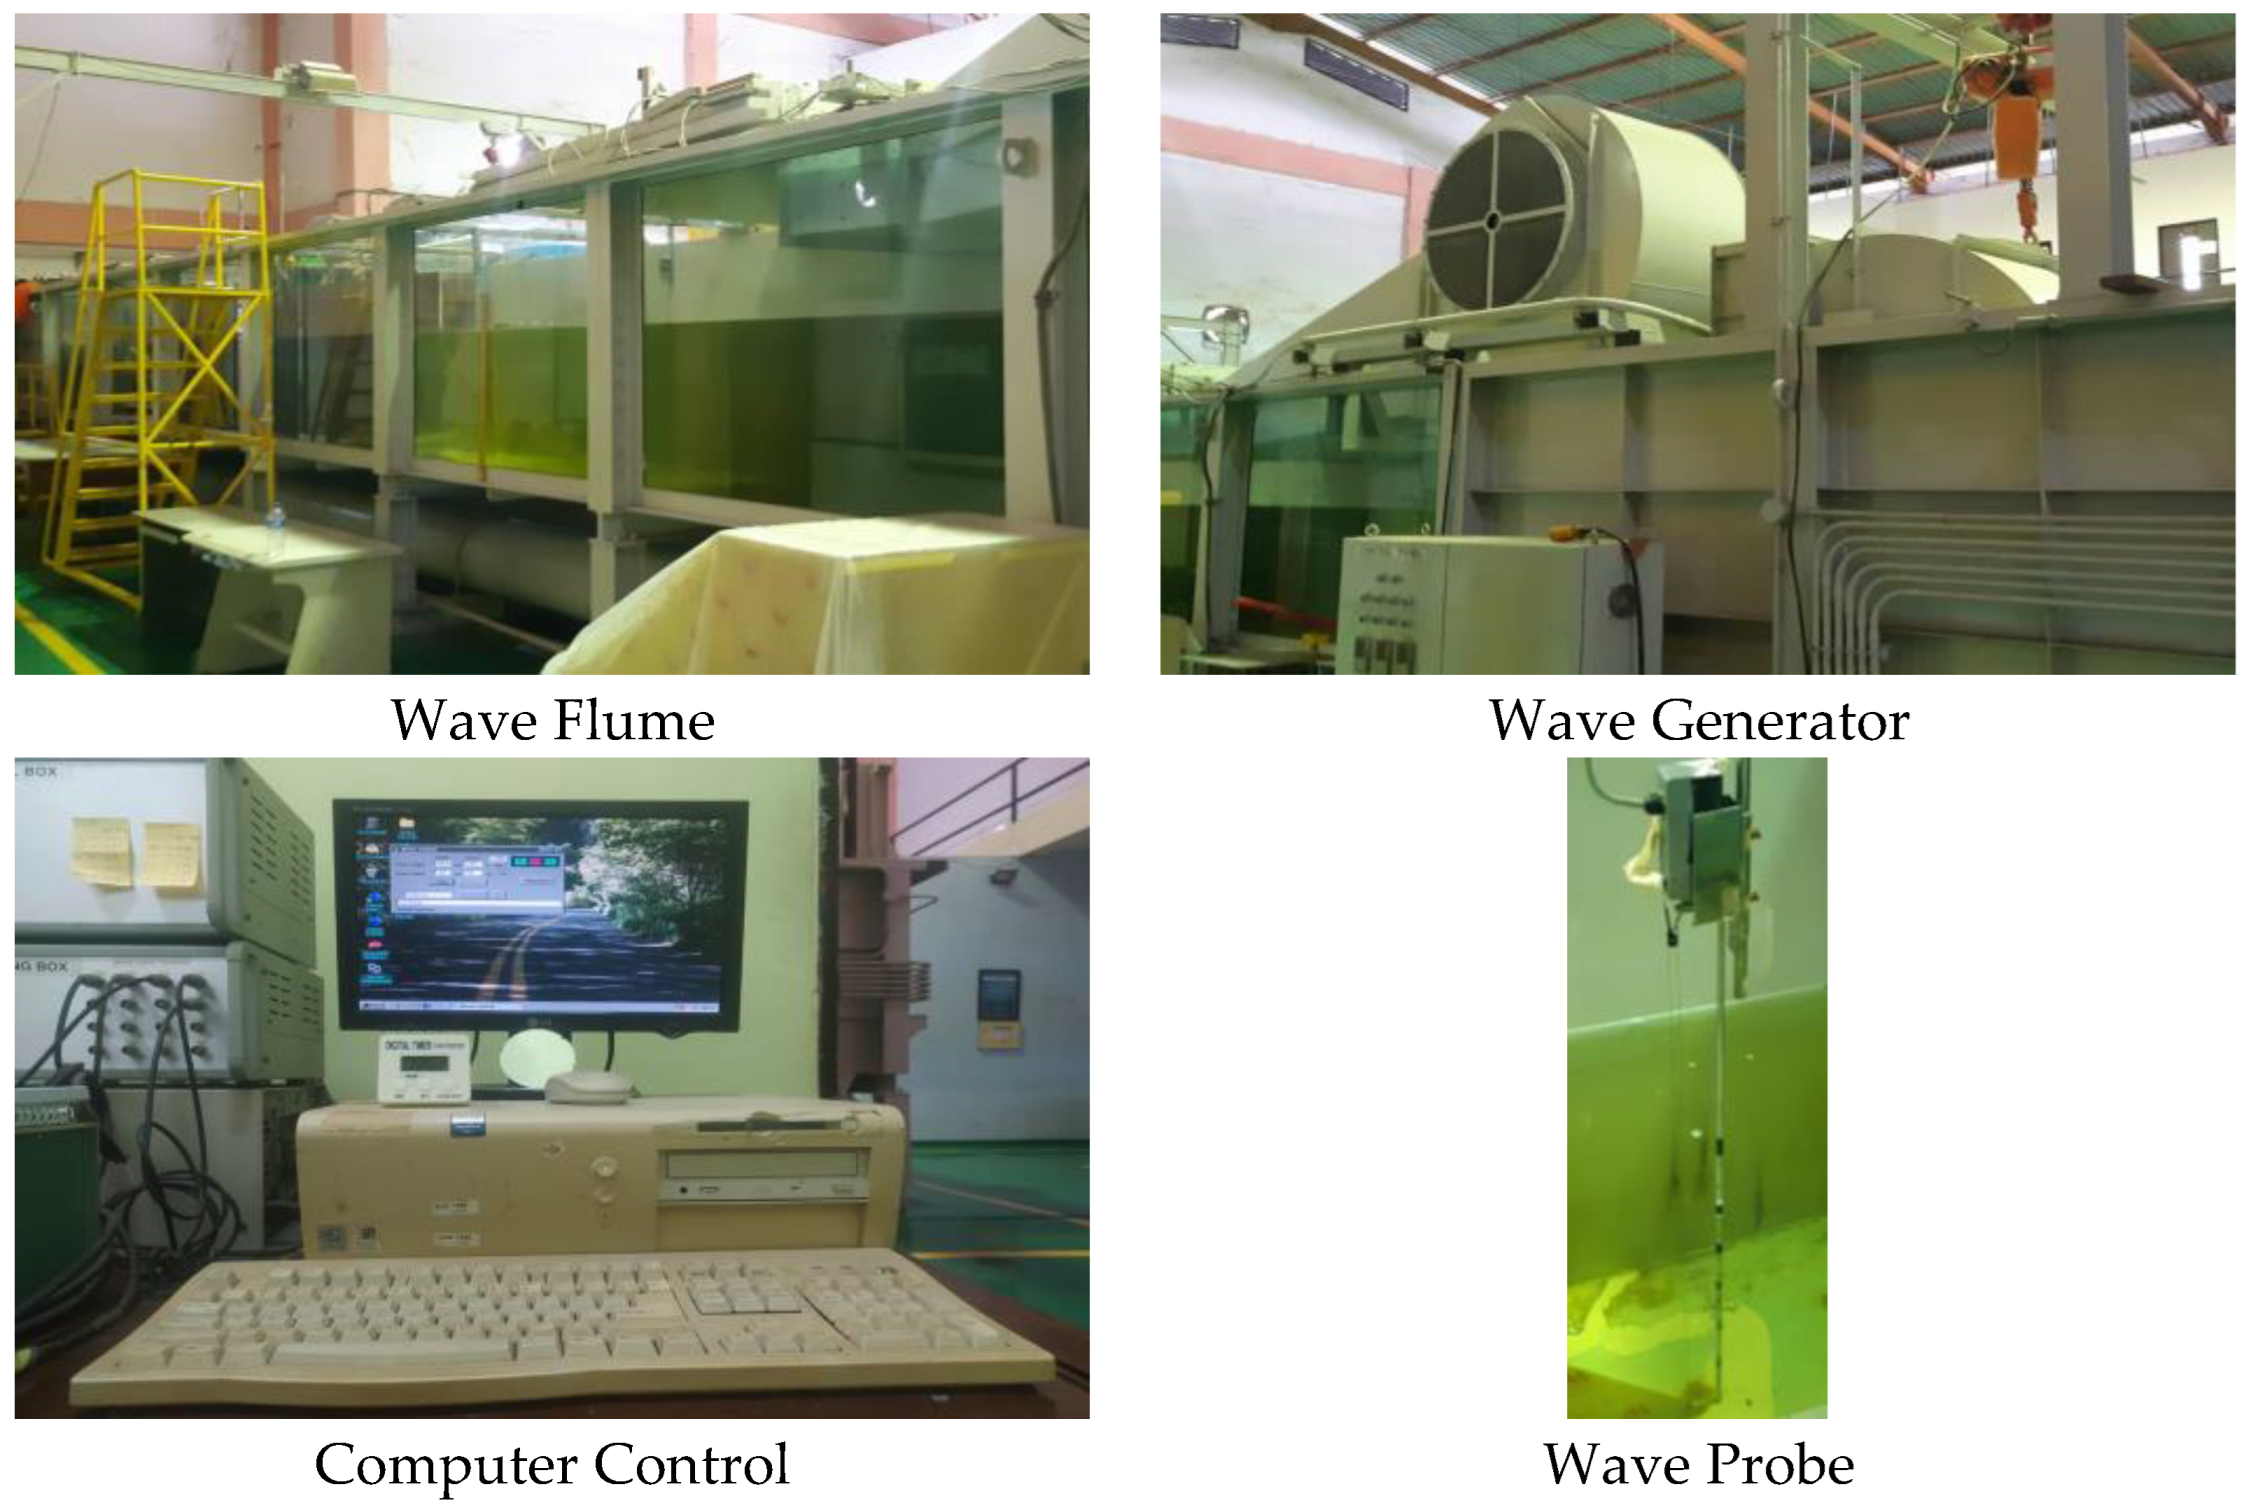
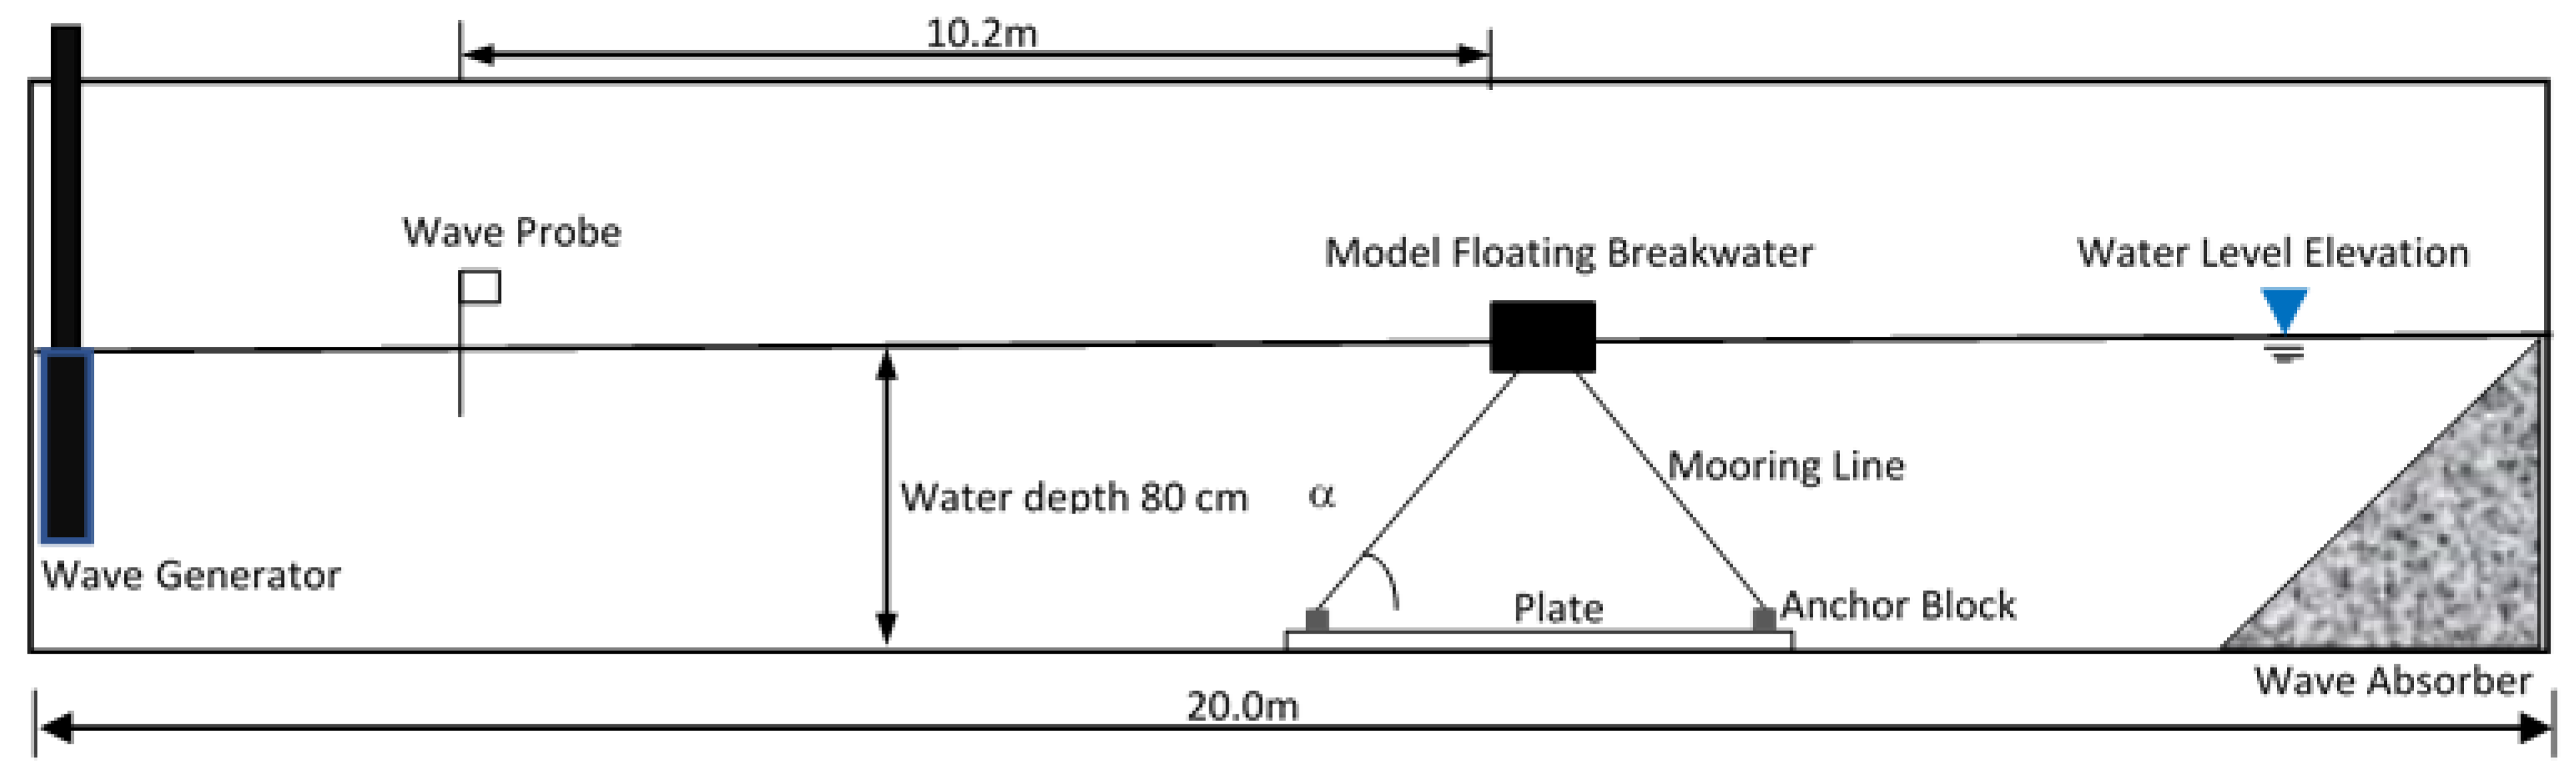
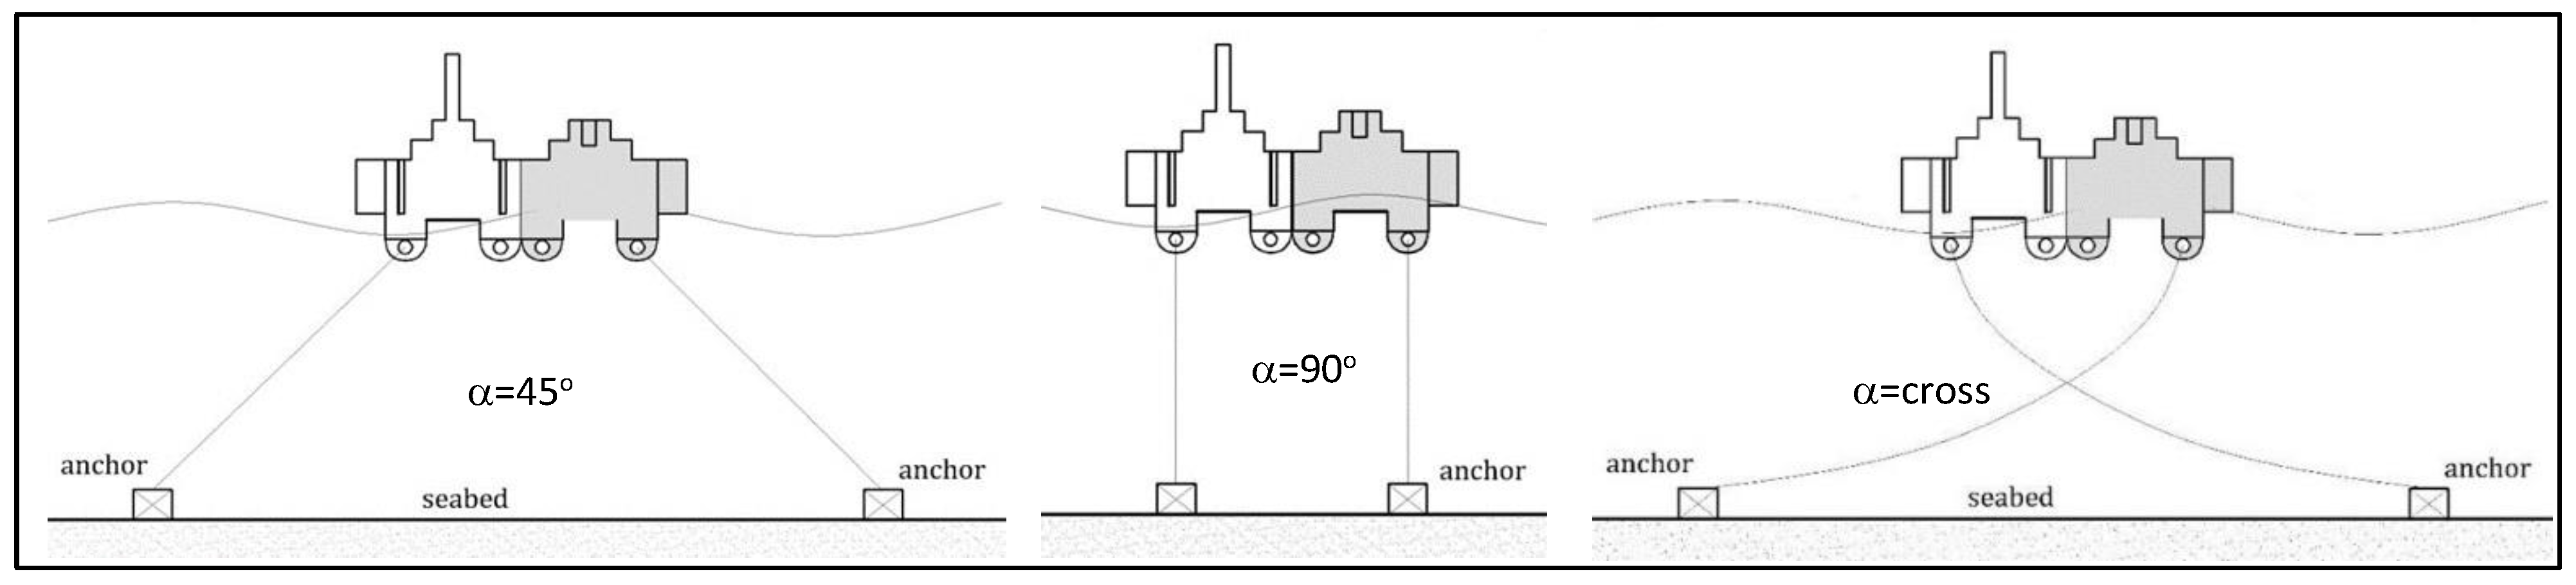
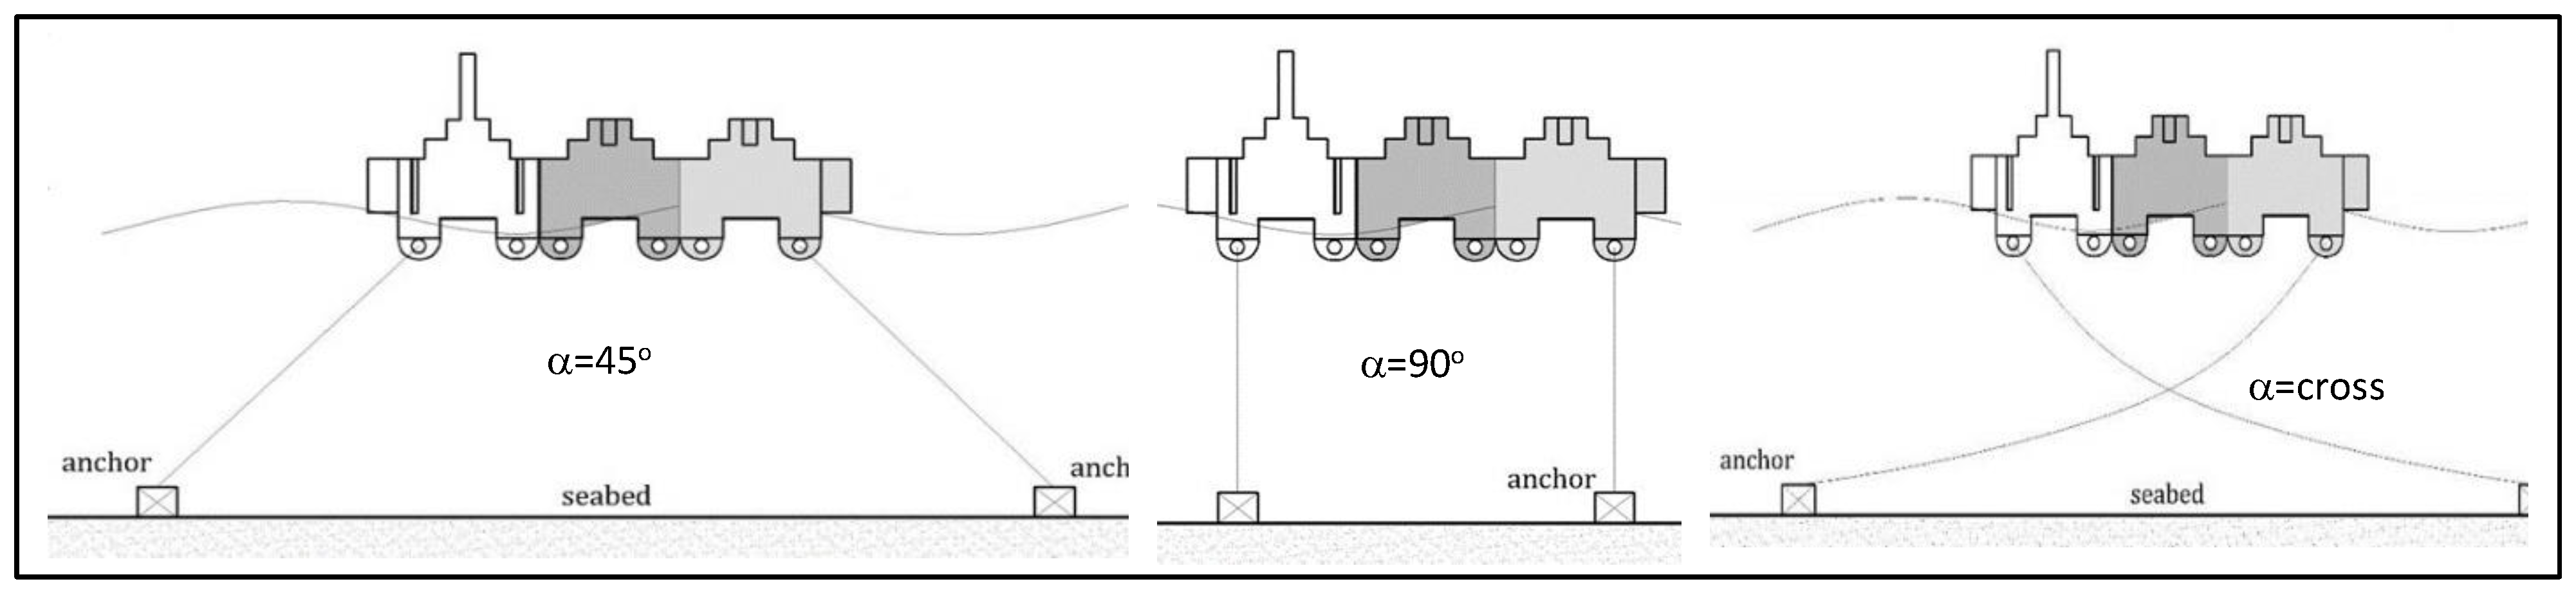
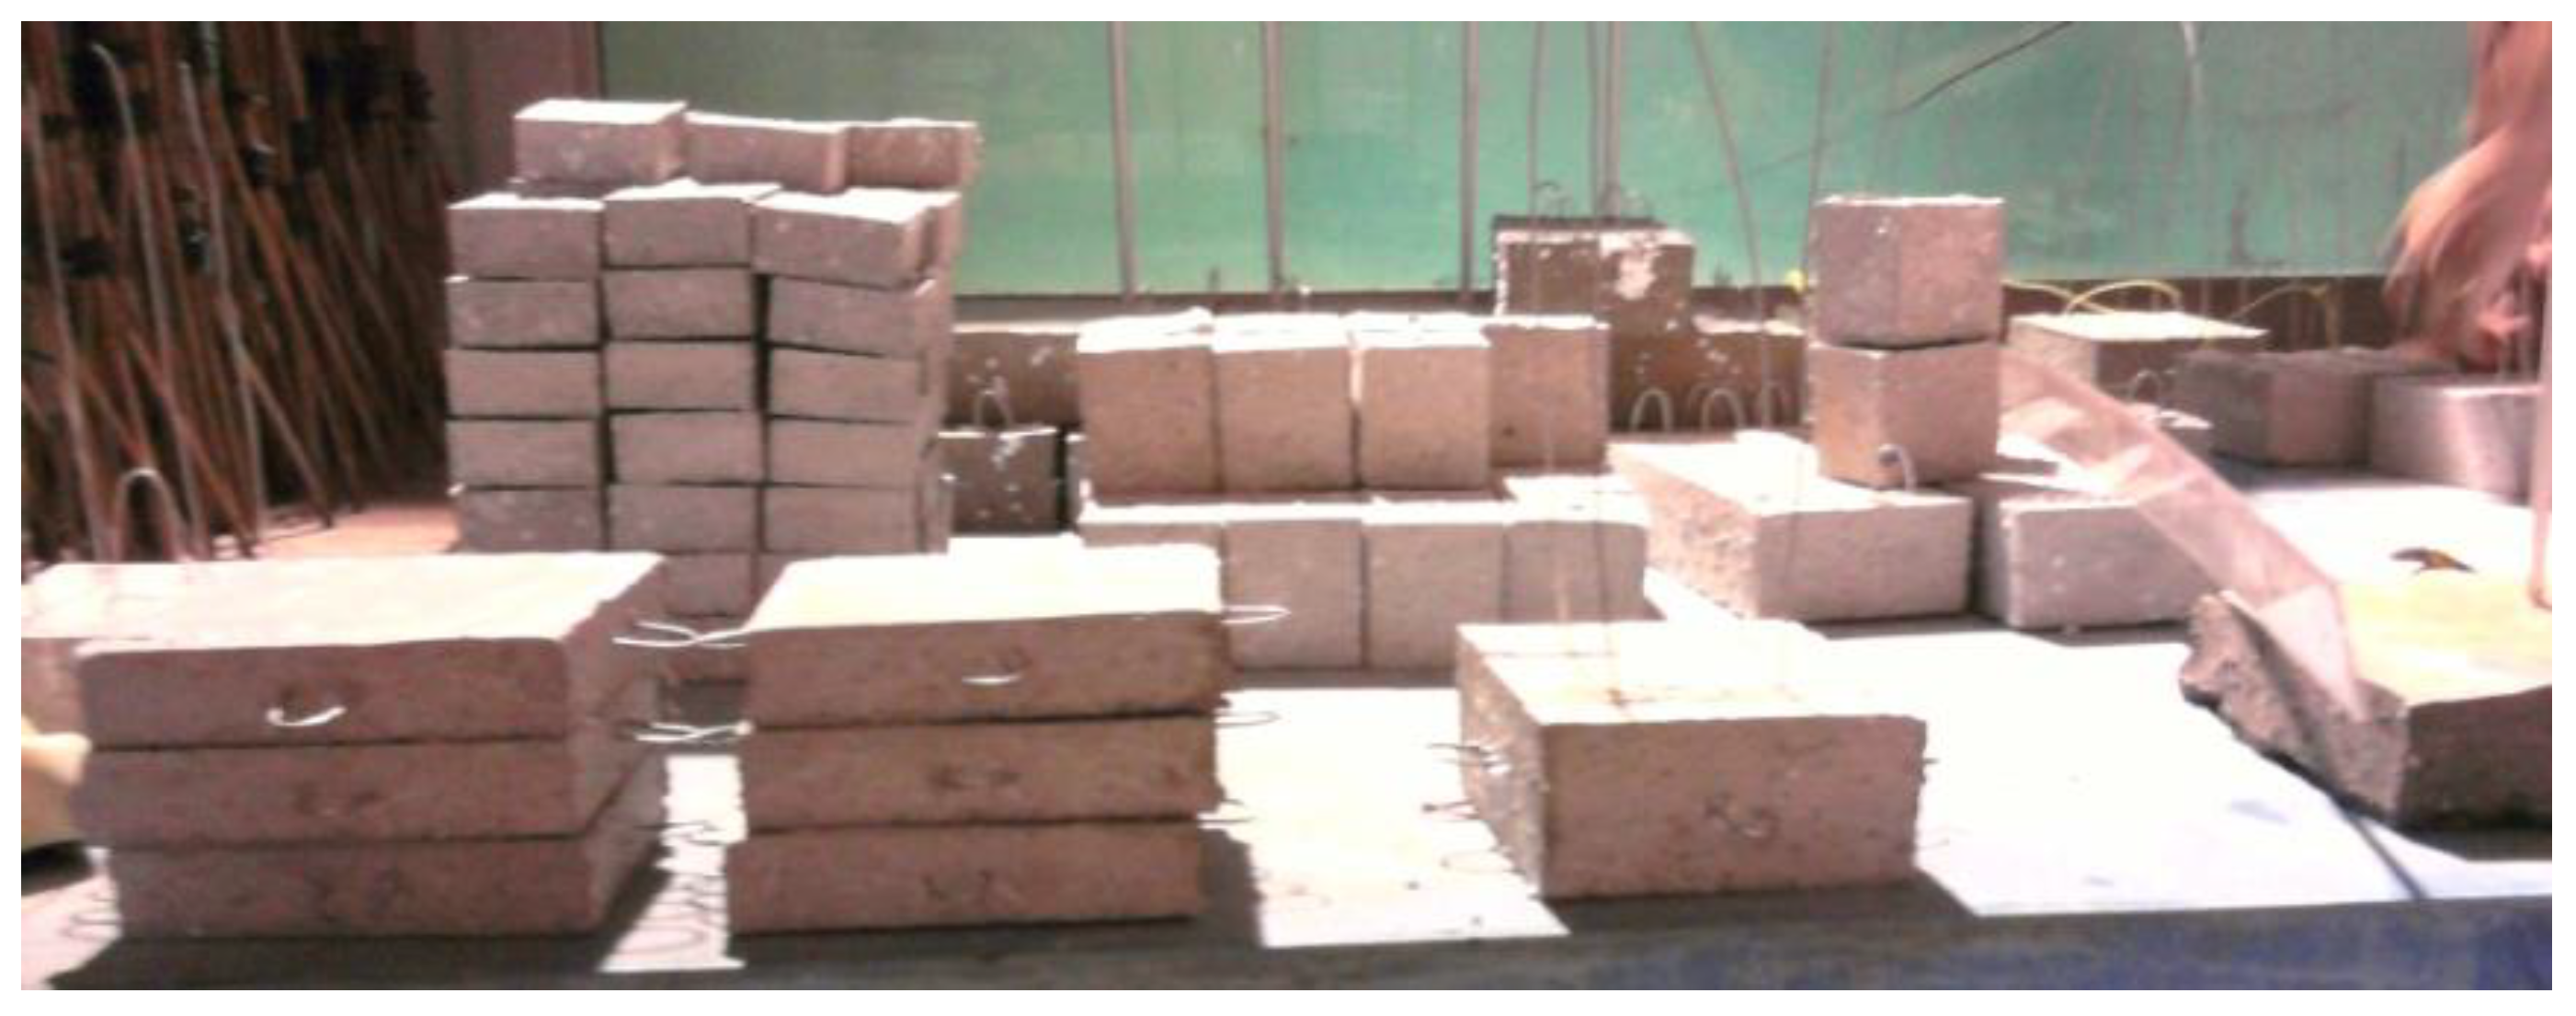
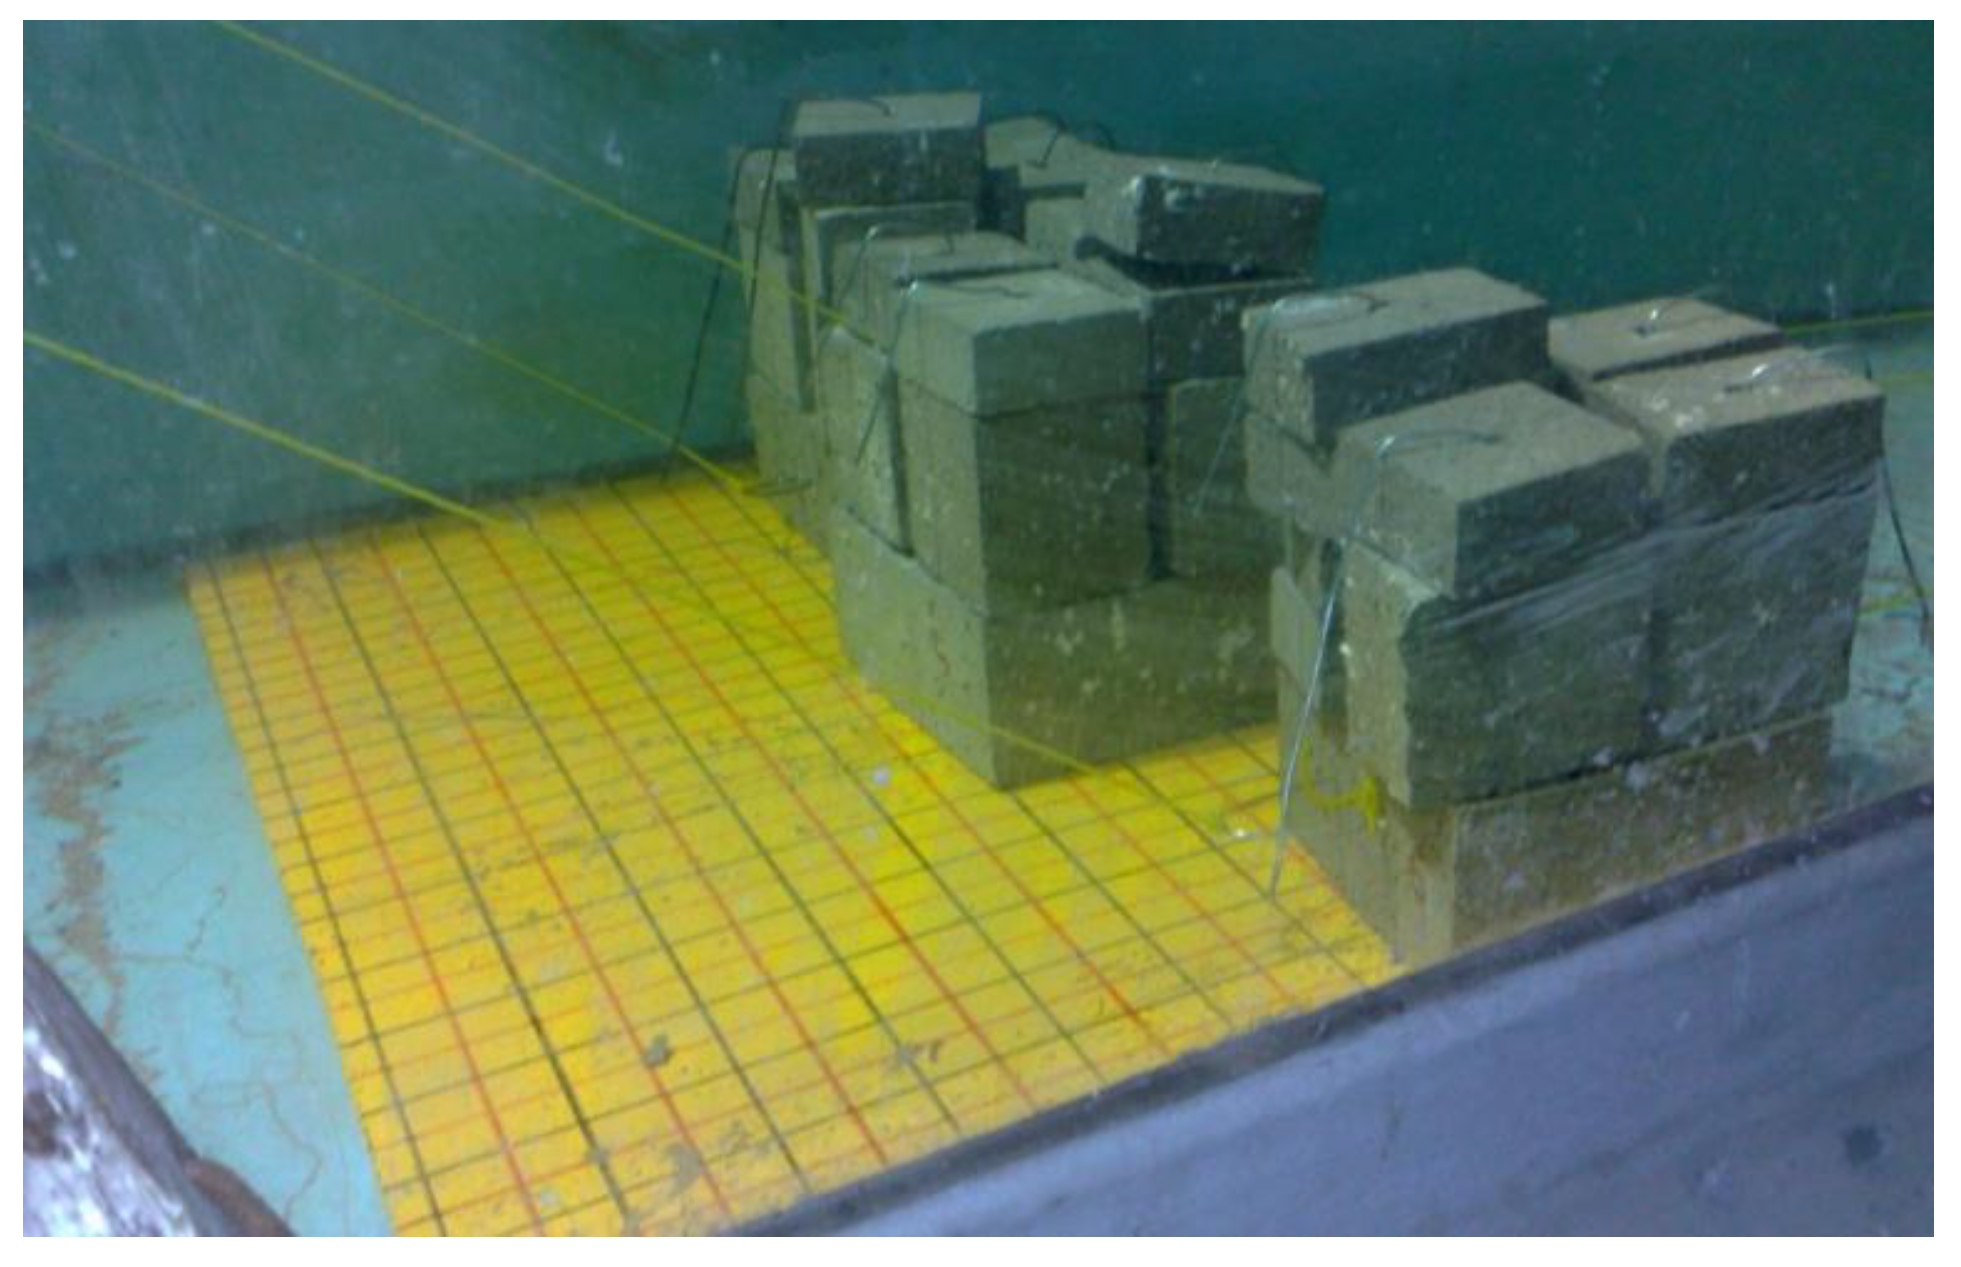
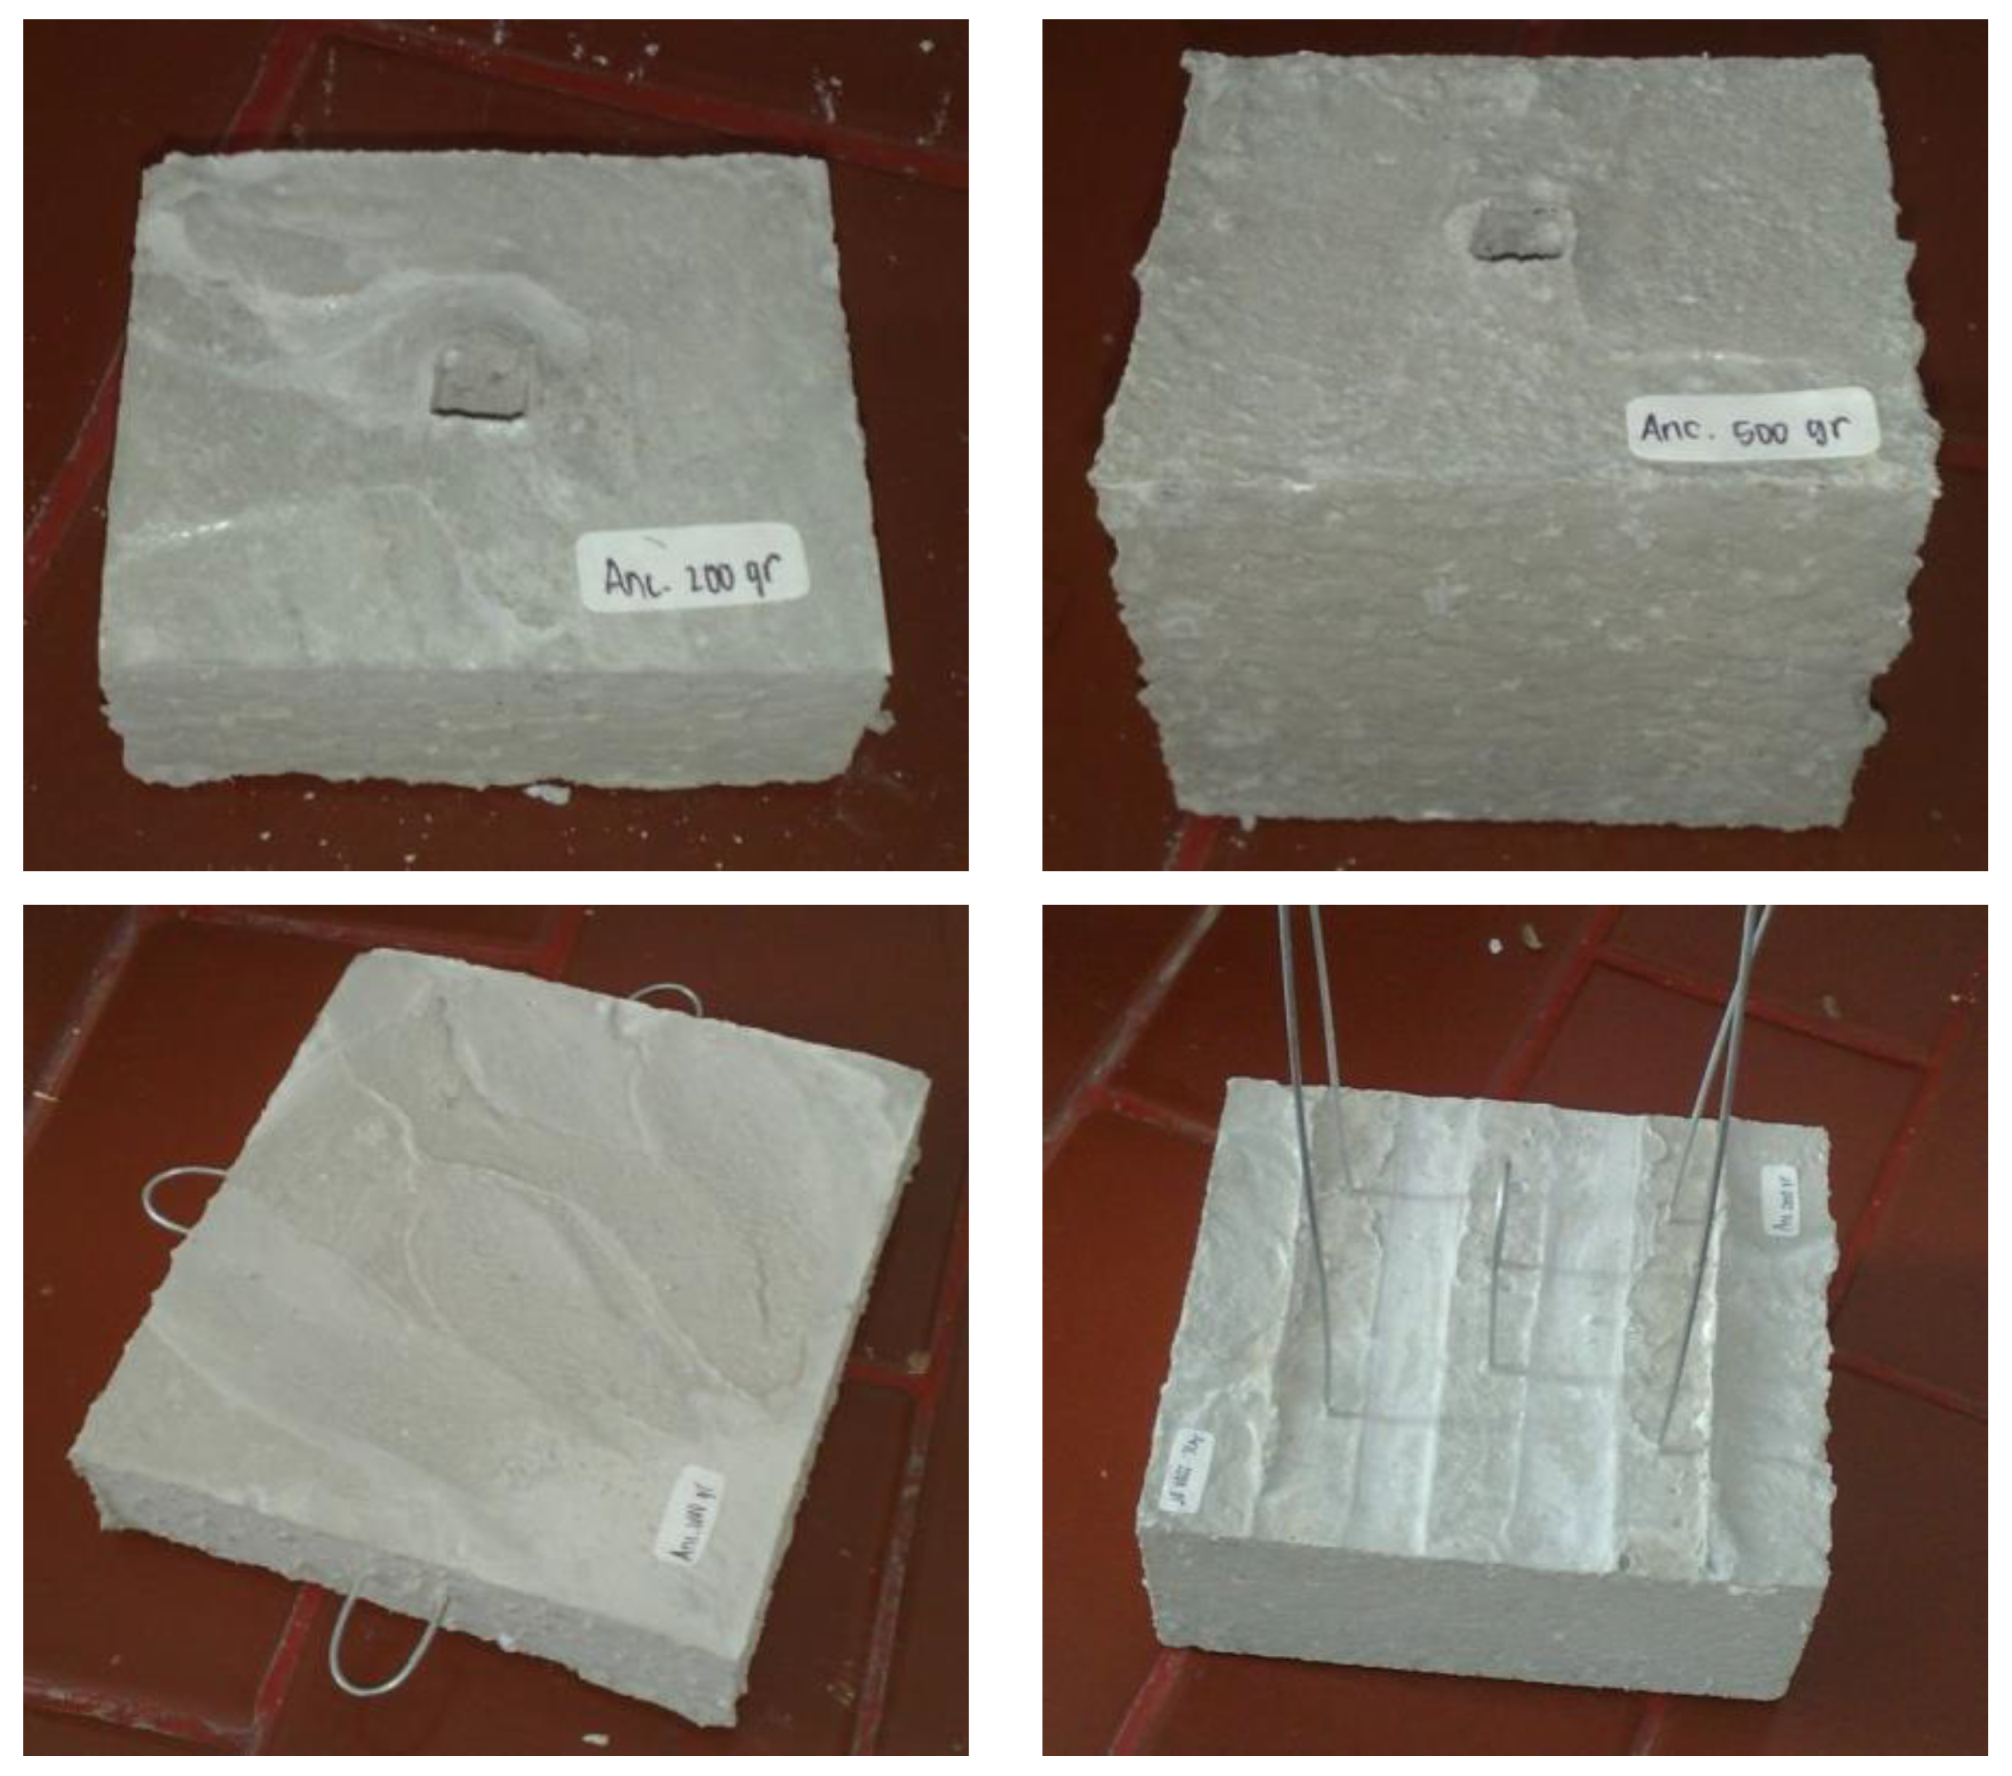
2.2. Experiment Setup

Scientists and engineers have widely used laboratory wave-flume experiments to understand coastal environments’ physical processes. Spatial and temporal variations of water surface elevation, transmission, reflection, wave force, and mooring line tension are important data frequently observed in this field, mainly measured by traditional capacitance, conductive, and resistance wave meters [33,34].
In this study, the floating breakwater model was tested on a wave flume (20 m × 2 m × 2 m) in ocean engineering, ITS, with a scale of 1:10 to determine the effects on the stability of concrete blocks. Physical-model tests were carried out on irregular waves with a Jonswap spectrum, with variations in wave height, H (3.5, 4.5, 5.5) cm, and wave period, T (1.1, 1.3, 1.5) seconds at a constant water depth of 80 cm. Physical-model tests were undertaken on irregular waves with a Jonswap spectrum. The gamma factor (γ) in this experiment for Indonesian waters was used as 2.0–2.5 [35]. Irregular waves were generated from one end of the flume, and wave absorbing was placed at the other end to minimize the reflected waves. The wave movement was controlled simultaneously by a computer control center equipped with an analog–digital converter interface to convert analog data from data recorded by the wave probe into digital data (Figure 1). The wave probe was installed 10.2 m from the floating breakwater (Figure 2).
This floating breakwater model is made of fiberglass with dimensions (10 × 10 × 10) cm in 3 different types. In the physical model test, the model was arranged in 3 configurations at mooring angles of 45 deg, 90 deg, and cross-system (Figure 3, Figure 4 and Figure 5). Concrete anchors on floating breakwaters were designed with various anchor weight variations of 200 gr, 500 gr, 1000 gr, and 2000 gr, with a concrete density of 2083.3 gr/cm3 (Figure 6). Based on this planned design, the volume can be known so that the geometry of the anchor structure can be determined, as shown in Table 2. The weight of the anchor was then calibrated with an electronic balance. This process was repeated until the anchor weight was the same as the design.

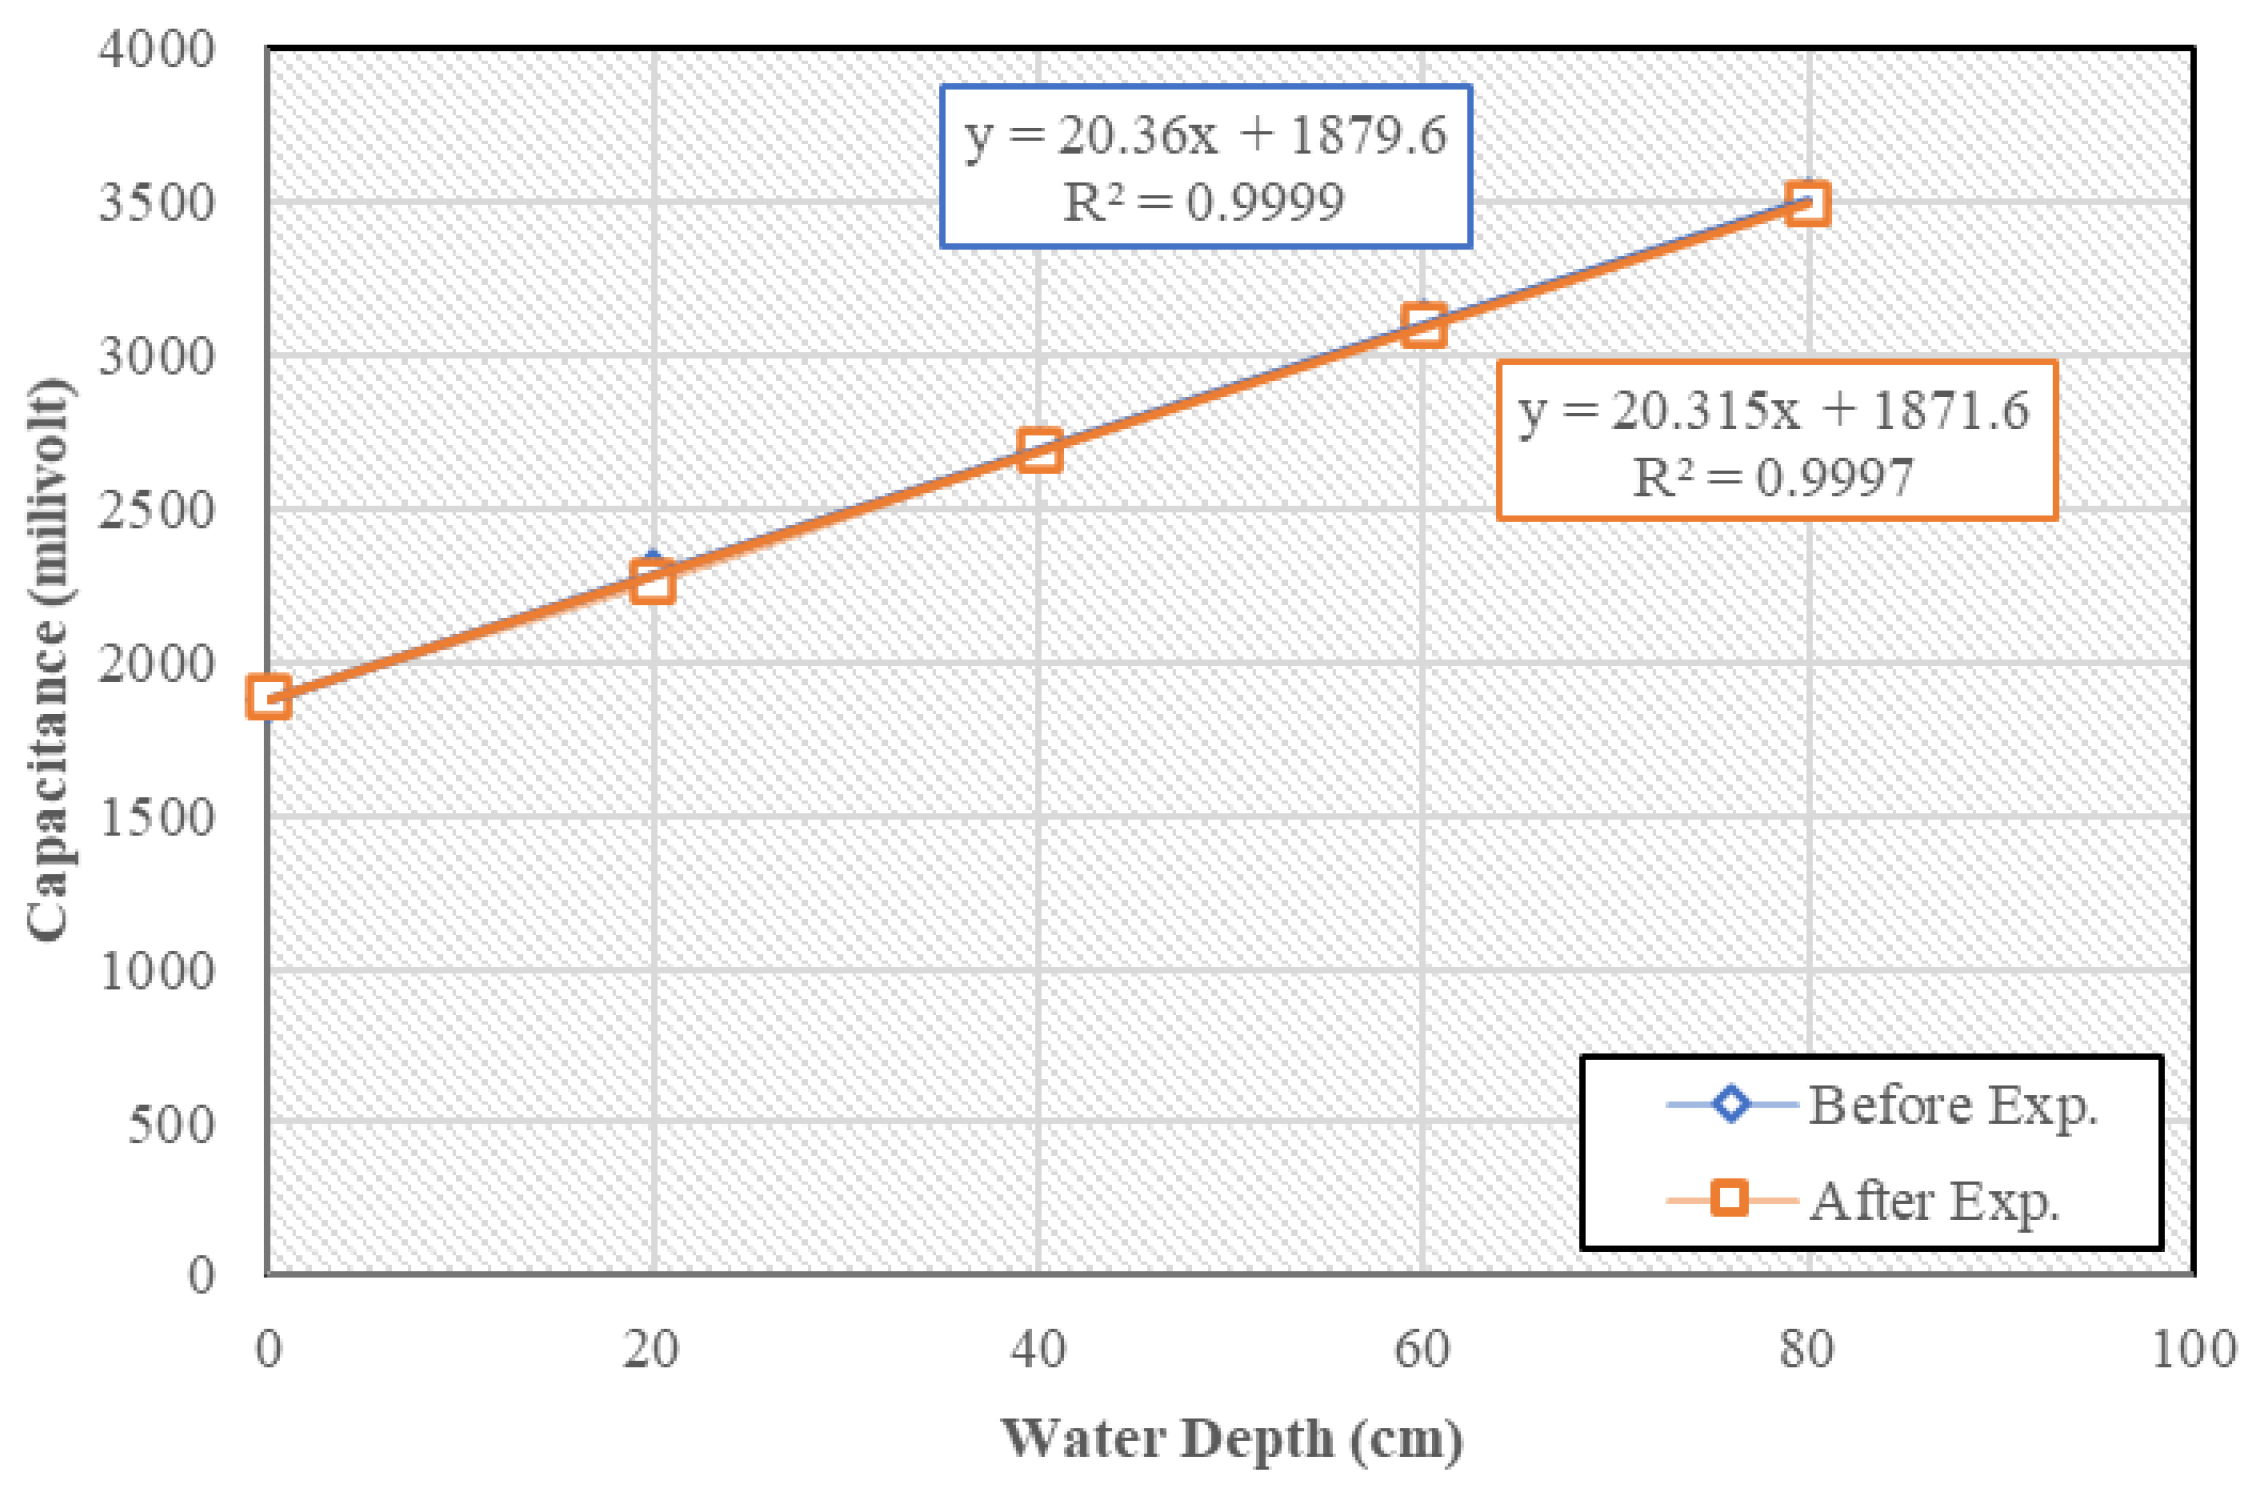
2.3. Wave Probe Calibration

The calibration was carried out by recording the zero-point position on the wave probe at several points in calm-water conditions. The first step of the calibration was to place the tip of the wave probe into the wave flume in calm water conditions until it touched the water surface so that the control computer will display arbitrary numbers. The average value is calculated from these arbitrary numbers. The average value will consider as the point 0. The next step was to repeat the first step but place the wave probe at several depths from the tip of the wave probe to the surface of the water. The calibration numbers on the wave probe obtained from this experiment are shown in Figure 7. This process was carried out before and after the experiment.

2.4. Data Analysis

The anchor displacement was analyzed using a plate as a measuring instrument for its displacement. The plates were painted and lined vertically and horizontally to form a 2 cm square. The anchor was considered stable if the displacement when tested was no more than one box contained in the plate (Figure 8). During the experiment, the displacement of each anchor was recorded by how far it moved. This process was repeated until a constant and stable anchor weight was obtained by adding the number of anchors at each point. The movement of the anchor during this experiment was carried out with underwater camera equipment, then the image obtained was analyzed to observe the movement of the anchor. This method refers to the experiment that has been conducted [33].
Concrete beams are made in various weight variations (Figure 9), thus facilitating the process of adding weight to the anchors at the anchorage point. For example, a concrete block weighing 4000 gr may consist of one 2000 g anchor unit and four 500 gr anchor units (Figure 10). Based on the experiment, the stability of the concrete anchor in all models is obtained. Furthermore, it is analyzed and searched for the optimal anchor in various floating breakwater configurations tested.

3. Result and Discussion

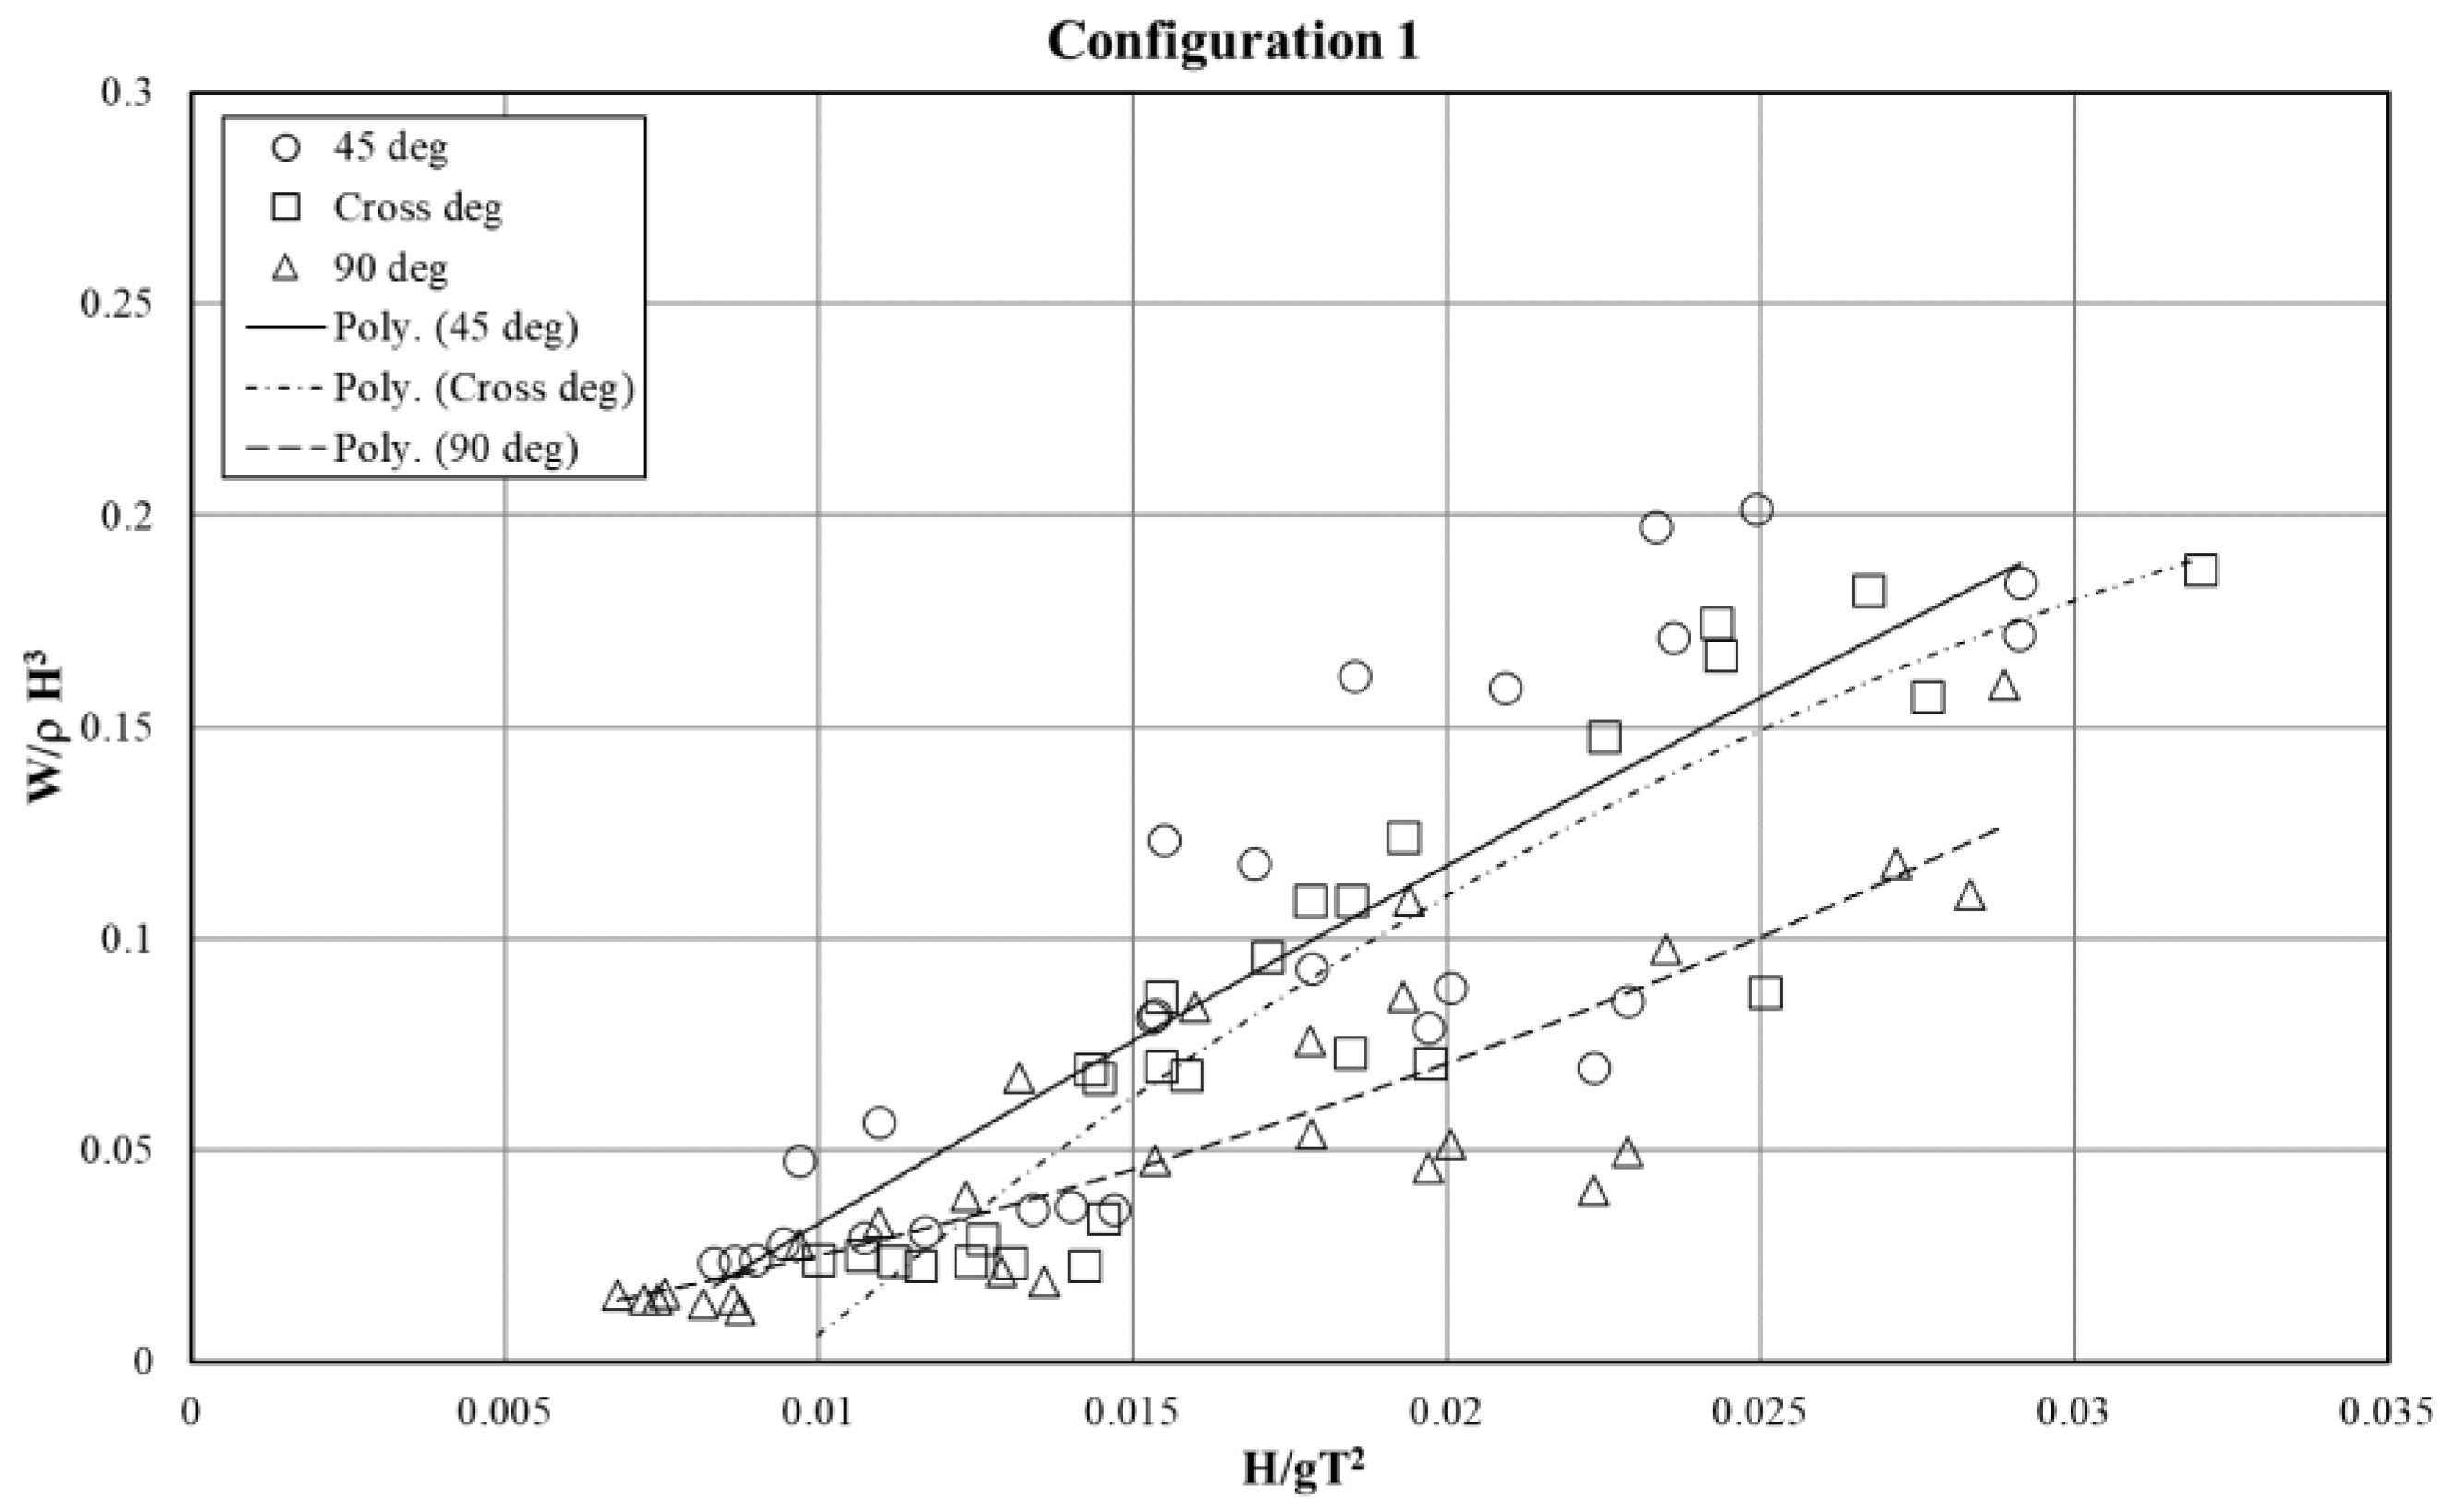
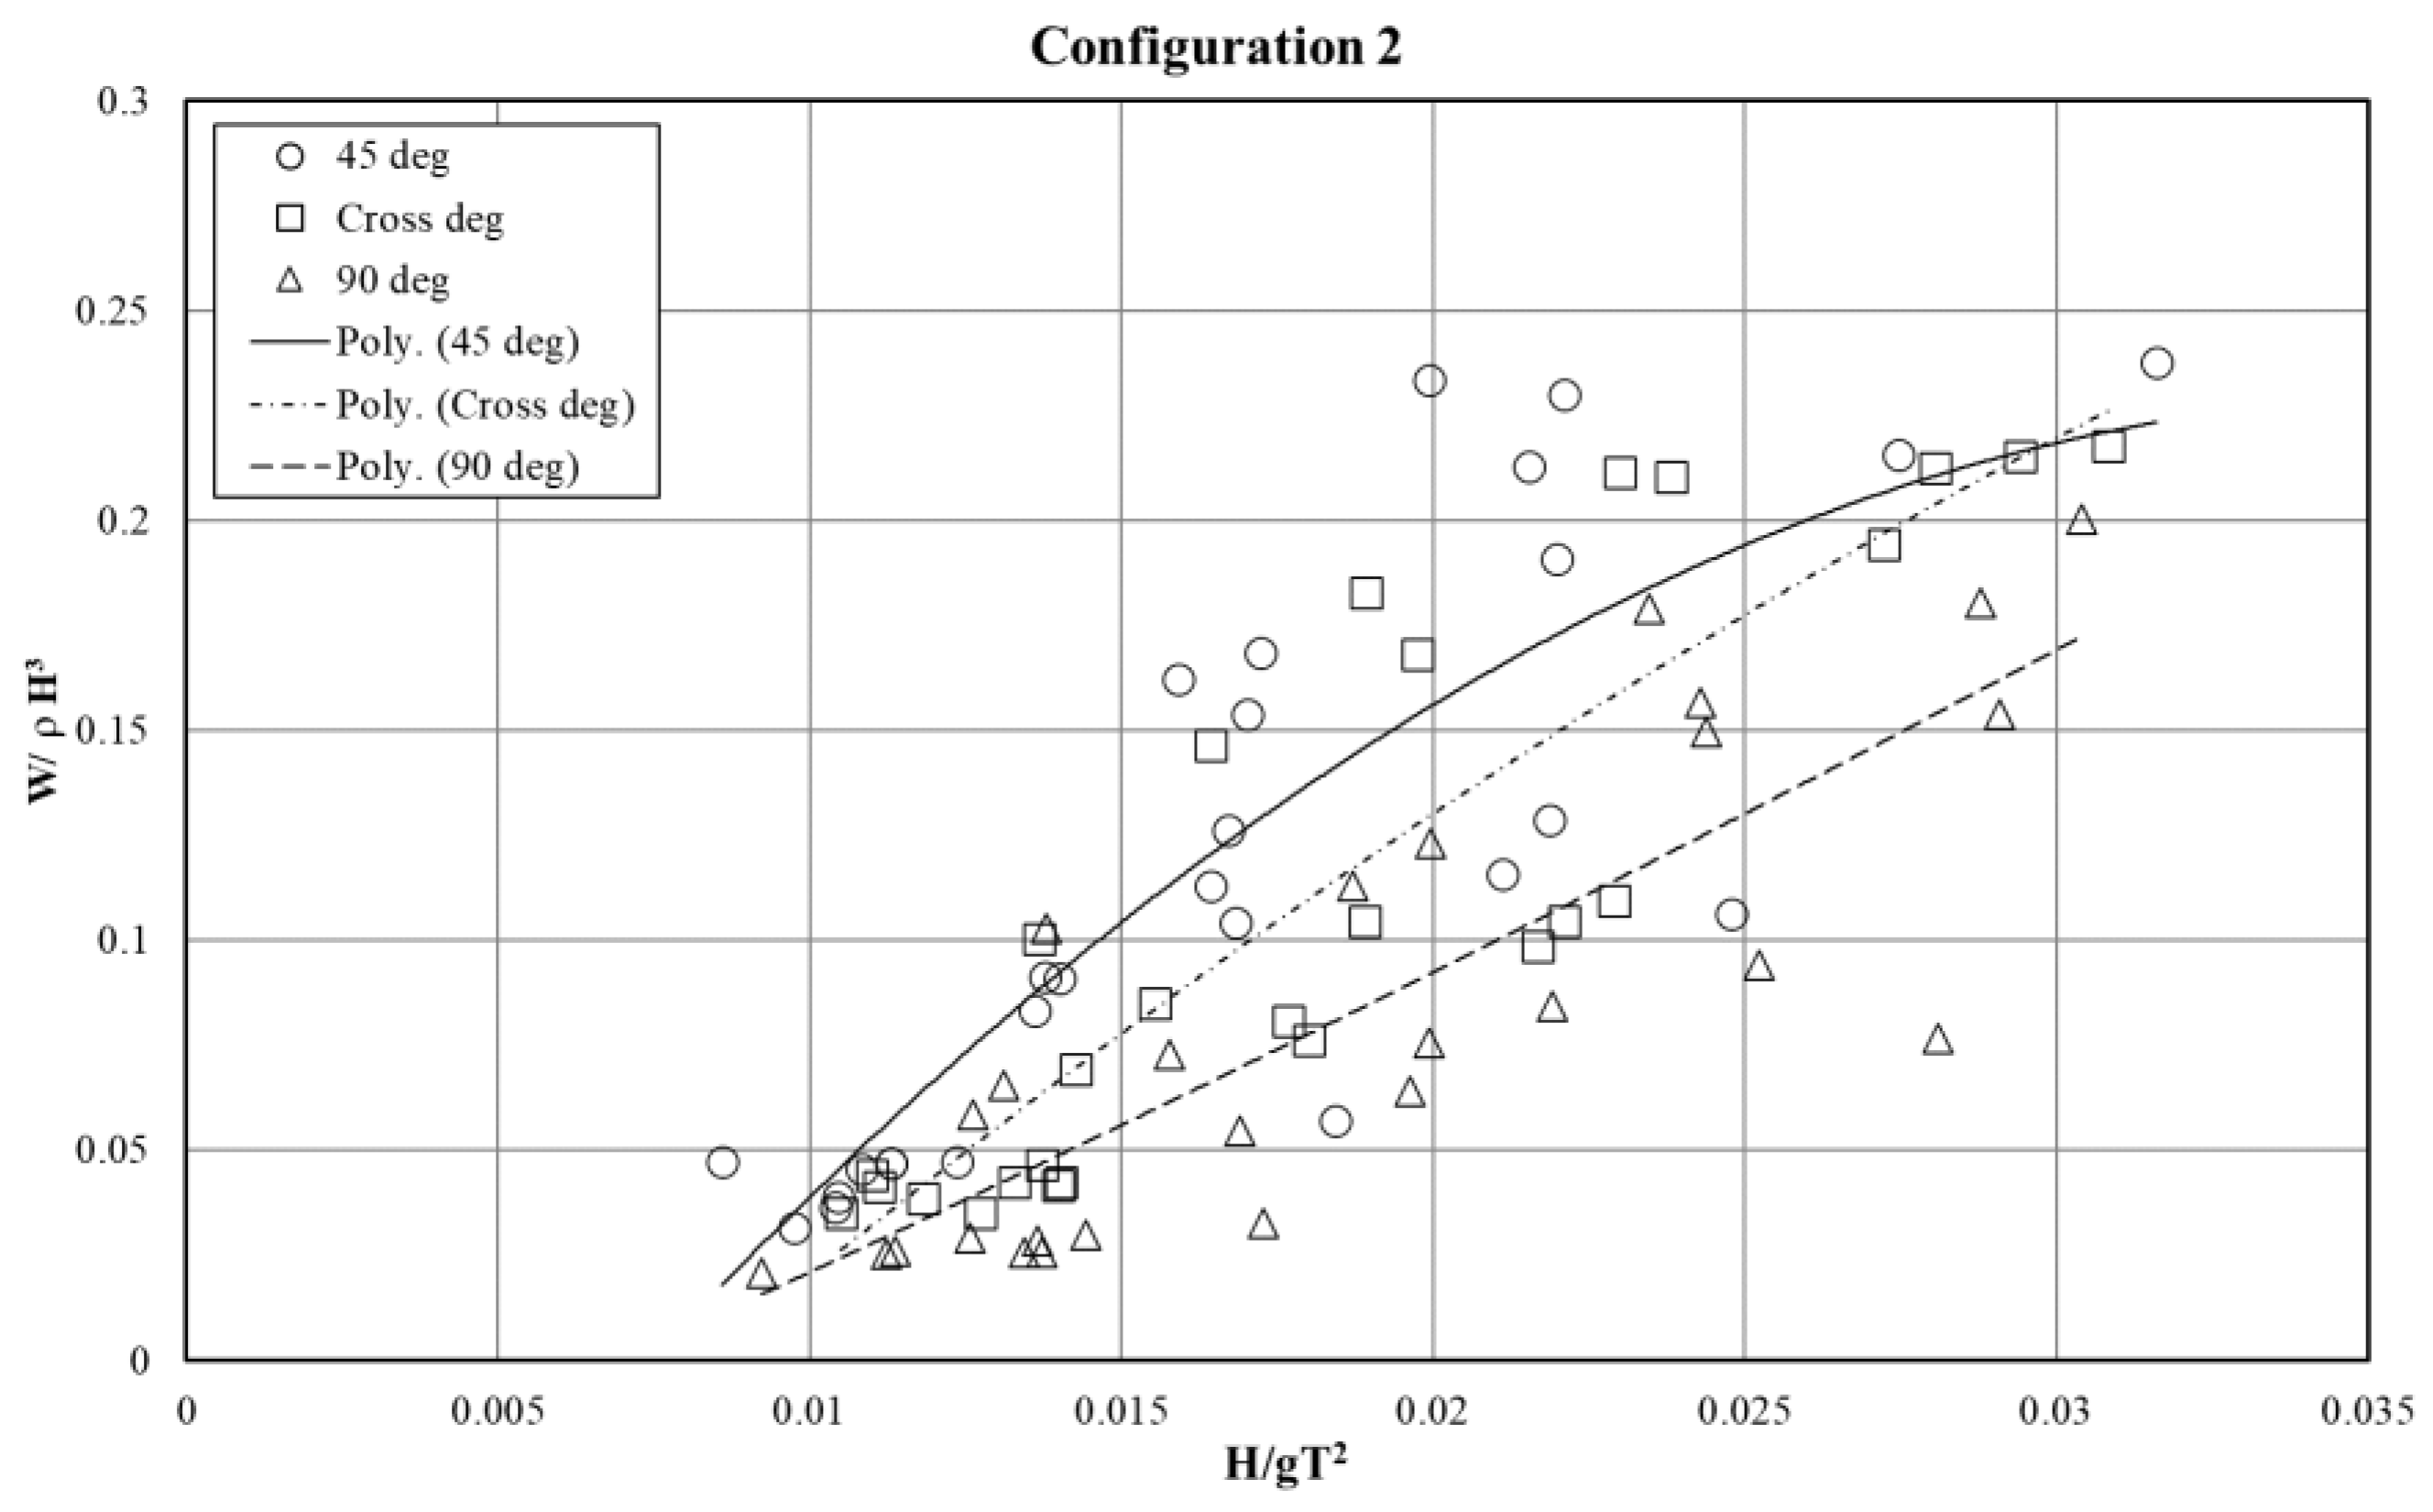
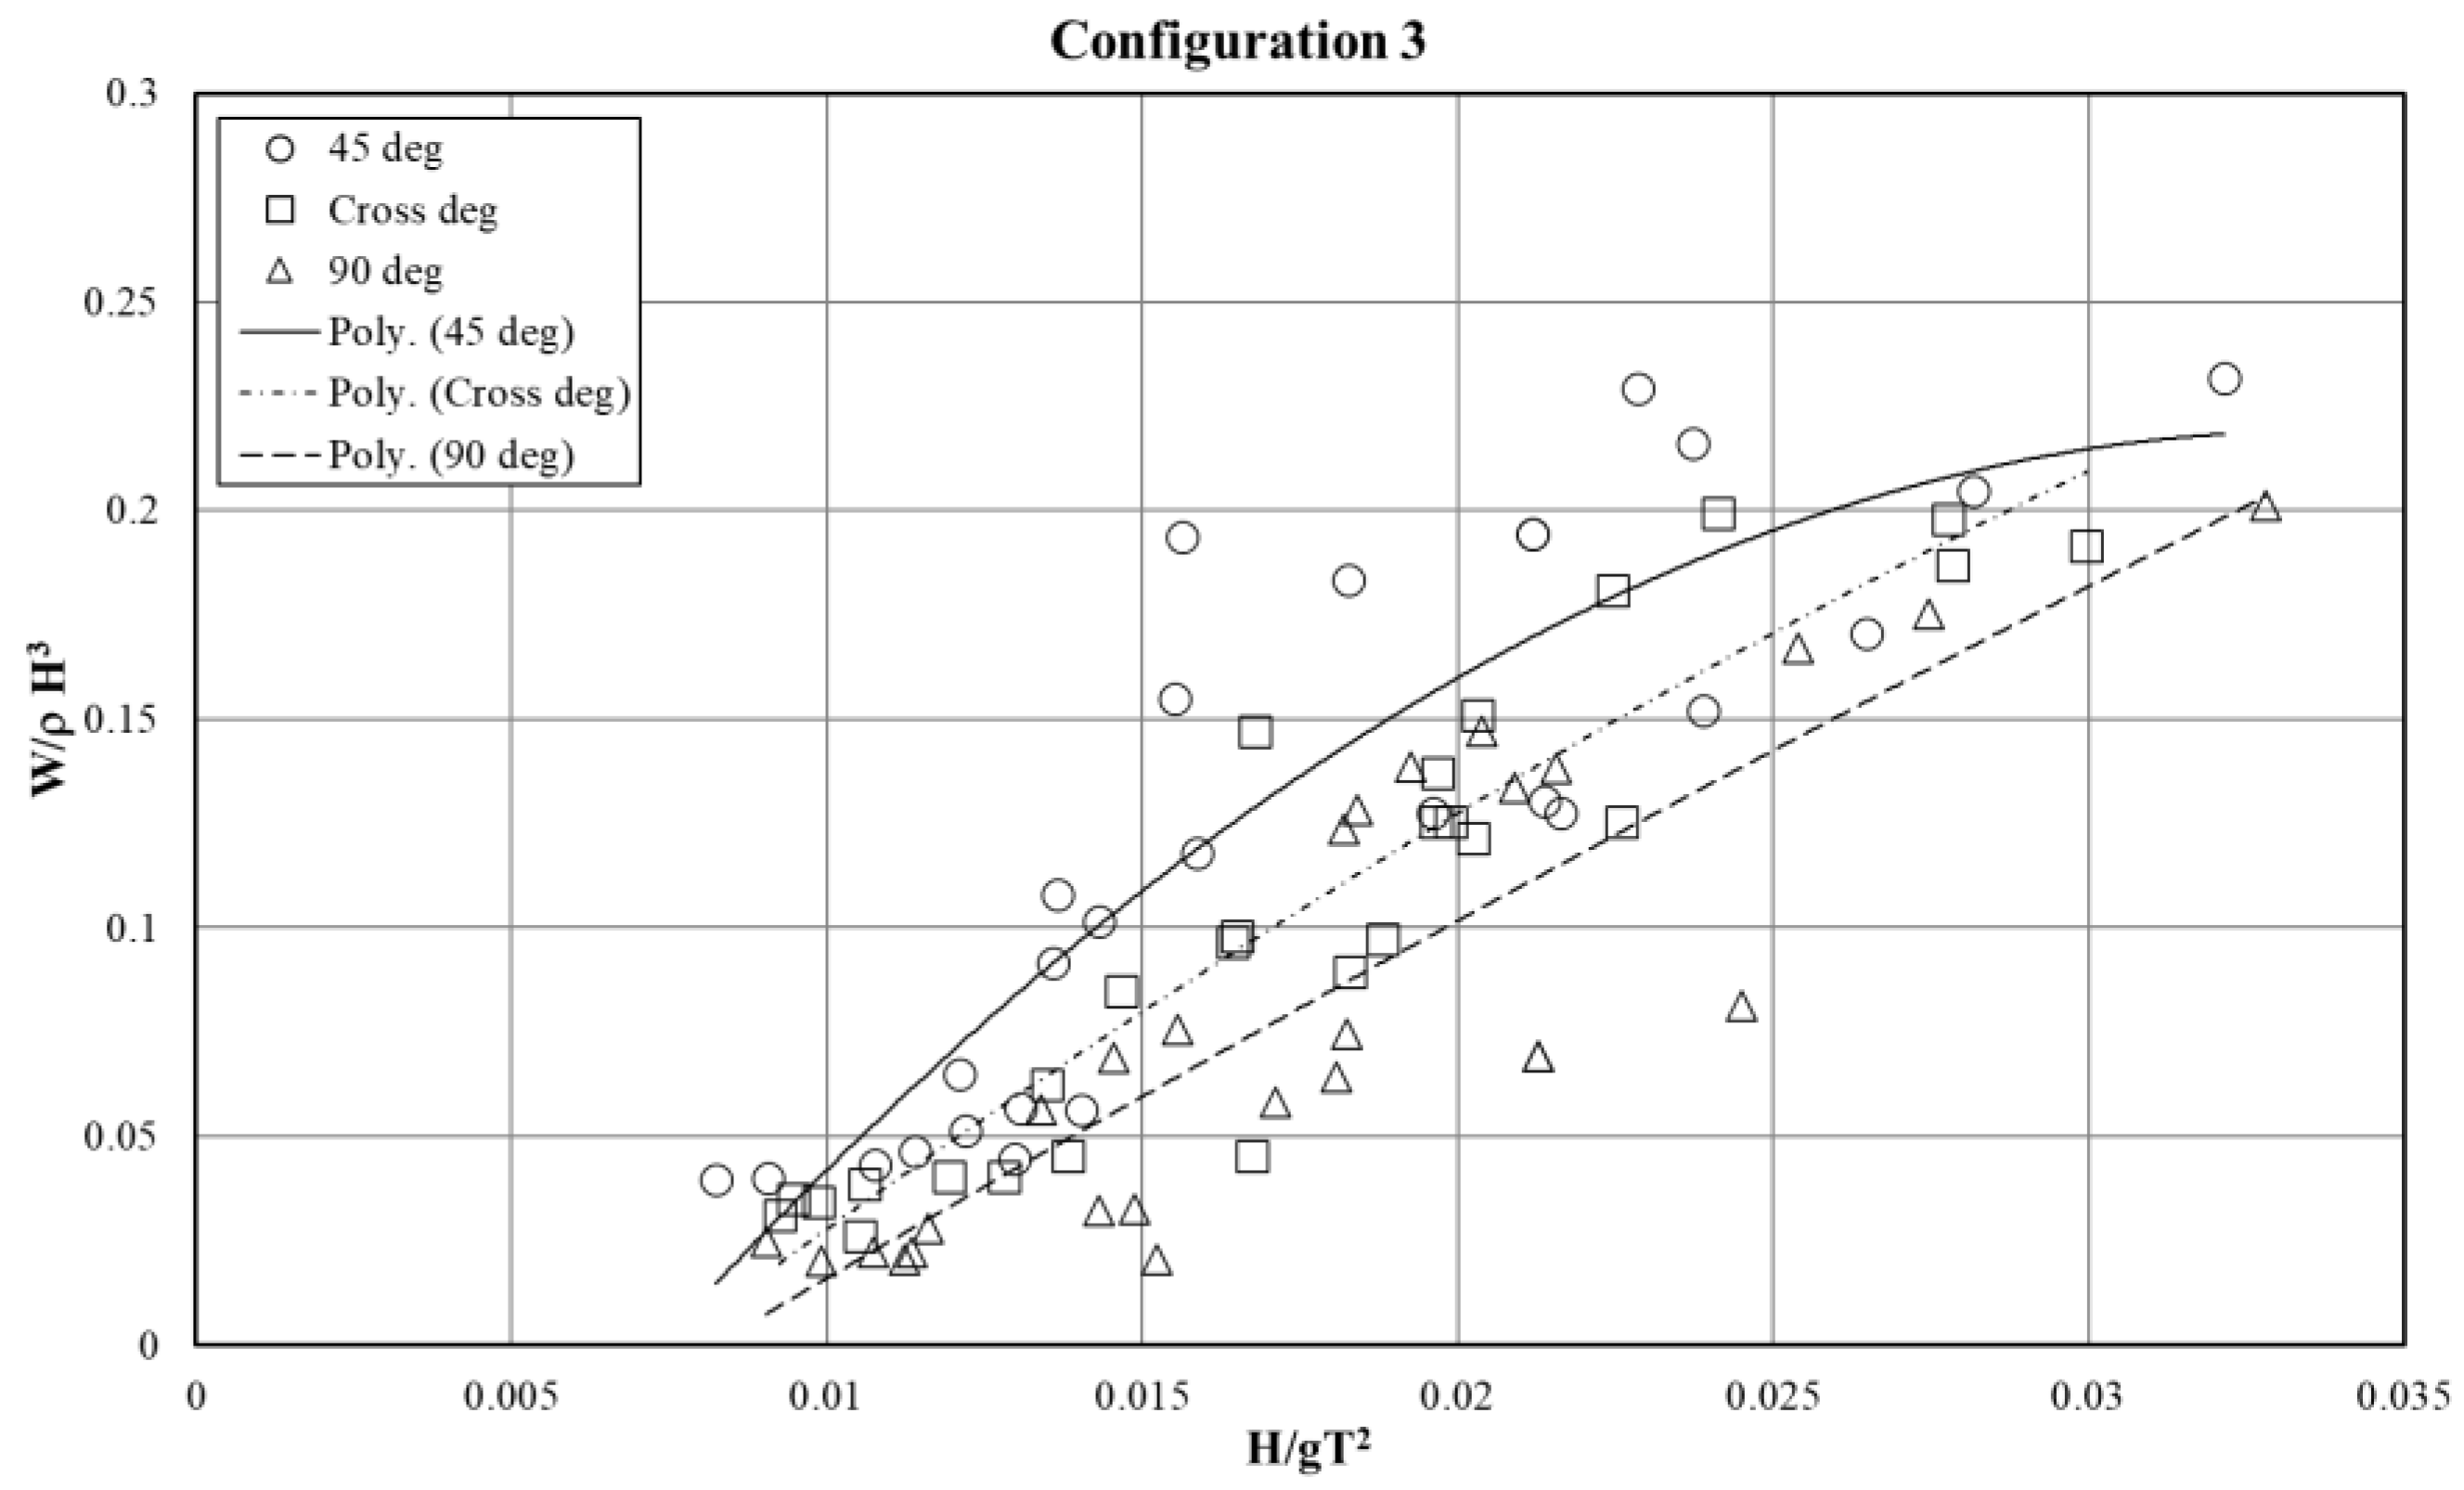
3.1. Effect of Anchor Stability Parameter (W/ρ H3) on Wave Steepness (H/gT2)

Based on Figure 11 on the floating breakwater configuration type 1, it can be seen that the mooring angle of 45° has a heavier anchor weight than the mooring, which is installed crosswise or at an angle of 90°. In the H/gT2 range from 0.02–0.025, the maximum value for W/ρH3 in the floating breakwater configuration 1 is 0.21, 0.17, and 0.13 with mooring angles of 45°, cross-system, and 90°, respectively. Configurations 2 and 3 (Figure 12 and Figure 13) behave similarly to configuration 1. The complete results of the maximum value of W/ρH3 are shown in Table 3.
It can be concluded that the concrete block anchor for each type of floating breakwater, which is installed at an angle of 45°, requires a heavier weight of the concrete anchor compared to the mooring angle, which is installed with a mooring configuration at an angle of 90° or is installed crosswise.
The results obtained above will certainly depend on the floating breakwater motion. This means that the greater the motion intensity of the floating breakwater motion, the greater the mooring line tension [13]. In this study, the effect of the floating breakwater motion was not studied. The researcher only analyzed the effect of the stability of the concrete block due to the wave force. The wave force was determined from the variation of wave height and period in this experiment. Therefore, the design of the floating breakwater plays a very important role so that it can produce more stable motions. Of course, this will require a more comprehensive study of various aspects of hydrodynamics.

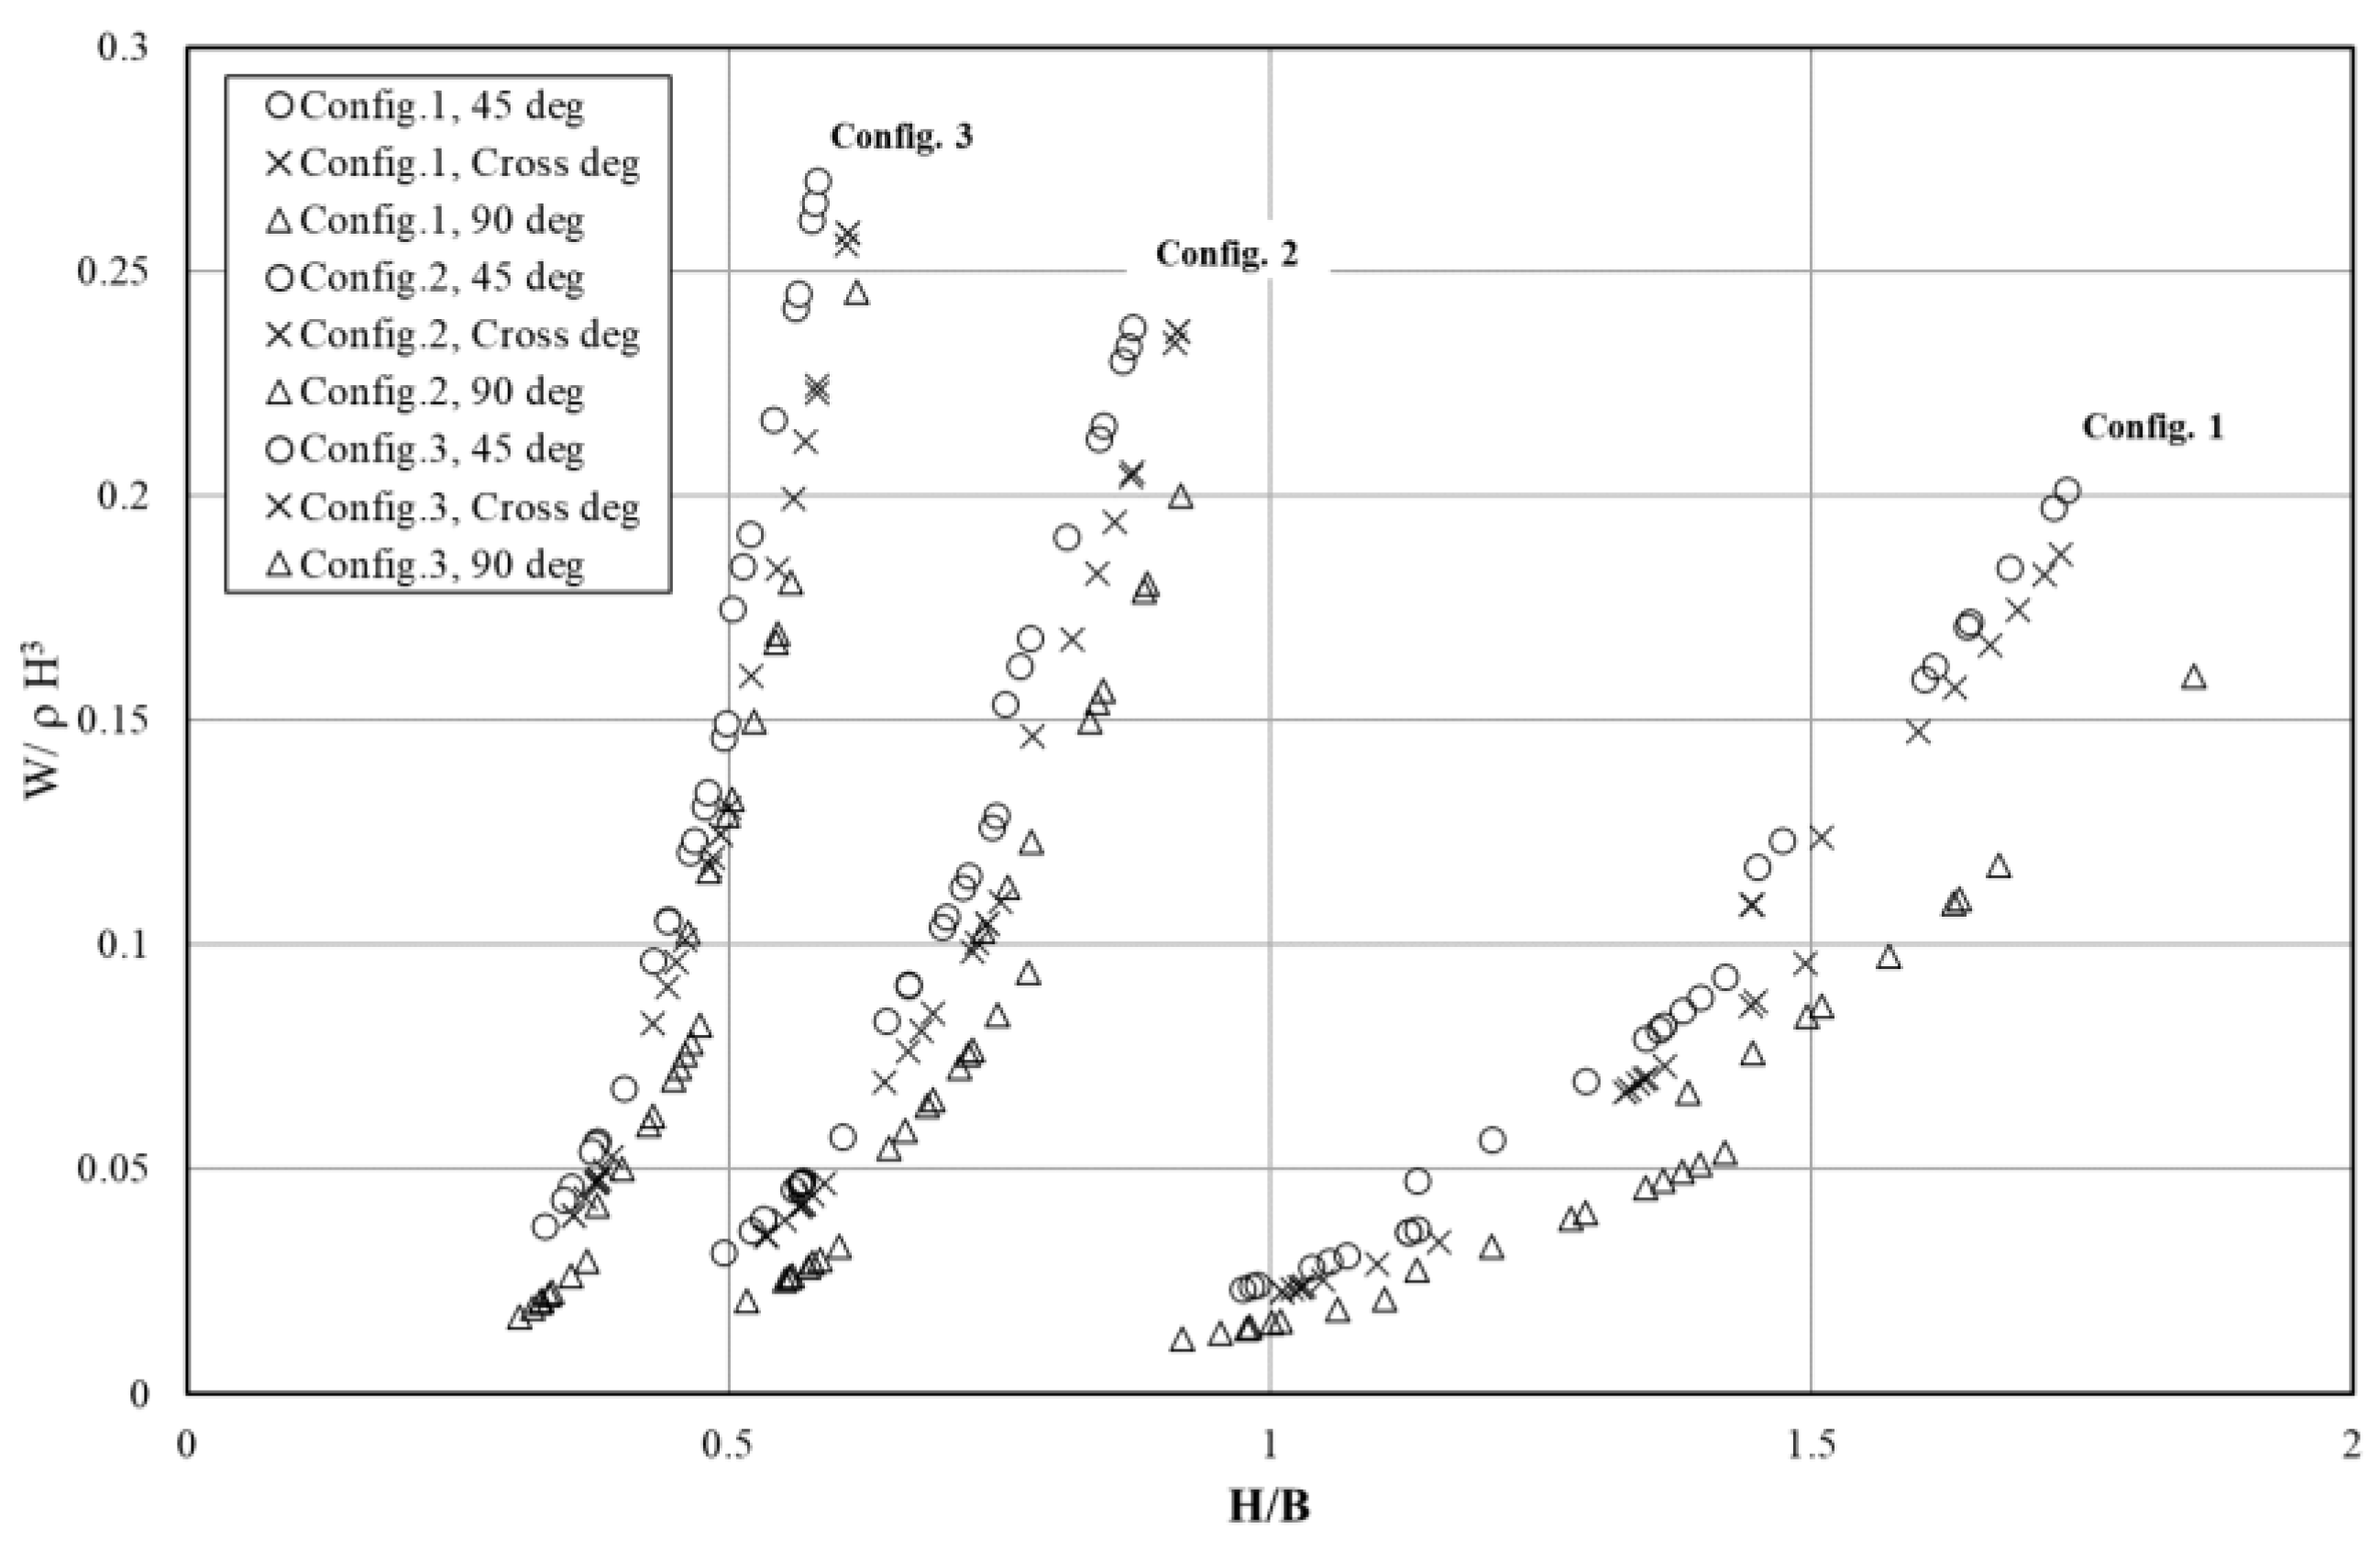
3.2. Effect of Anchor Stability Parameter (W/ρ H3) on H/B

The width of the floating breakwater structure will affect the weight of the concrete anchor. Based on the results of the physical-model test on the wave flume, it can be seen that the weight of anchor block concrete increases with the increasing width of the floating breakwater, B (Figure 14). In configuration 1 with B = 10 cm, the maximum value of the anchor weight dimension parameter W/ρH3 at a mooring angle of 45 deg is 0.202. This value will increase as the width of the floating breakwater increases. In configuration 2 (B = 20 cm), the anchor weight parameter value increases to 0.238, and the value increases at configuration 3 (B = 30 cm) by 0.271. The same phenomenon also occurs at the mooring cross angle and 90 deg. The complete results are shown in Table 4.

4. Conclusions

A series of experiments on the steep-slope floating breakwater model were carried out with irregular waves in the wave flume. Experiments were carried out with variations in wave height and period on three configurations of floating breakwater widths. The floating breakwater is constructed of fiberglass, and the concrete blocks are made of various weights making it easier to control the stability of the structure.
Analysis of the displacement of the concrete block was observed on the slab, which was given horizontal and vertical lines. Observations during the experiment using an underwater camera make it easier to determine the stability of the concrete block. This stability analysis is only based on the magnitude of the wave force received by the floating breakwater on the concrete block. The effect of floating breakwater movement due to the wave is not studied in this study.
In wave steepness (H/gT2) 0.02–0.025, if this steep-slope type of floating breakwater is installed with a mooring angle of 45 deg, configuration 3 has the largest stability parameter (W/ρH3) among other configurations. However, if the structure is installed at a mooring angle of 90 deg and cross, configurations 2 and 3 have almost the same stability parameters. This stability parameter is proportional to the wave height generated by the wave generator. Therefore, it can be said that this parameter reflects the weight of the concrete block required to hold the floating breakwater stable.
In each configuration of the steep-slope floating breakwater installed at various angles of the mooring rope (45 deg, 90 deg, cross), configuration 3 (B = 30 cm) has the largest stability parameter value among other configurations (B = 10 cm and 20 cm). This means that the relative width of the structure (H/B) will affect the stability parameters.

Author Contributions

Conceptualization, S. and R.D.P.; methodology, S. and H.D.A.; formal analysis, S. and R.D.P.; investigation, S., H.D.A. and E.B.D.; resources, R.D.P.; data curation, S. and R.D.P.; writing—original draft preparation, S. and R.D.P.; writing—review and editing, S.; visualization, S. and R.D.P.; supervision, H.D.A. and E.B.D.; project administration, S. and H.D.A.; funding acquisition, S. All authors have read and agreed to the published version of the manuscript.

Funding

Funding for publication was obtained from the Directorate of Research and Community Service. Institut Teknologi Sepuluh Nopember, Surabaya, Indonesia.

Institutional Review Board Statement

Not applicable.

Informed Consent Statement

Not applicable.

Data Availability Statement

Not applicable.

Acknowledgments

The authors gratefully acknowledge financial support from the Institut Teknologi Sepuluh Nopember for this work, under the project scheme of the Publication Writing and IPR Incentive Program (PPHKI) 2022.

Conflicts of Interest

The authors declare no conflict of interest.

References

  1. National Disaster Management Agency (BNPB). The Fate of Indonesia’s Coasts in the Middle of Abrasion Threats. 2019. (In Indonesian). Available online: https://foto.kompas.com/photo/read/2019/11/19/1574158801a47/1/nasibpesisir-pantai-indonesia-di-tengah-ancaman-abrasi (accessed on 11 November 2019).
  2. Armono, H.D.; Bromo, B.H.; Sholihin; Sujantoko. Numerical Study of Bamboo Breakwater for Wave Reduction. Fluids 2022, 7, 14. [Google Scholar] [CrossRef]
  3. Armono, H.D.; Winarto, A.; Sujantoko; Ketut Suastika, I.A. laboratory study on wave transmission over hexagonal artificial reef. IOP Conf. Ser. Earth Environ. Sci 2021, 799, 012011. [Google Scholar] [CrossRef]
  4. Hegde, A.V.; Rao, S.; Kumar, K. Run-up, run-down and reflection characteristics of semicircular breakwater for varying seaside perforations. ISH J. Hydraul. Eng. 2012, 18, 145–151. [Google Scholar] [CrossRef]
  5. Venkateswarlu, V.; Karmakar, D. Numerical investigation on the wave dissipating performance due to multiple porous structures. ISH J. Hydraul. Eng. 2019, 27, 202–219. [Google Scholar] [CrossRef]
  6. Zhao, E.; Mu, L.; Hu, Z.; Wang, X.; Sun, J.; Zhang, Z. Physical and Numerical Investigations on Wave Run-Up and Dissipation under Breakwater with Fence Revetment. J. Mar. Sci. Eng. 2021, 9, 1355. [Google Scholar] [CrossRef]
  7. Lee, I.-G.; Kim, D.-H. Load Resistance Factor for Vertical Caisson Breakwater in Korea. J. Mar. Sci. Eng. 2022, 10, 468. [Google Scholar] [CrossRef]
  8. Mares-Nasarre, P.; Argente, G.; Gómez-Martín, M.E.; Medina, J.R. Armor Damage of Overtopped Mound Breakwaters in Depth-Limited Breaking Wave Conditions. J. Mar. Sci. Eng. 2021, 9, 952. [Google Scholar] [CrossRef]
  9. Cardenas-Rojas, D.; Mendoza, E.; Escudero, M.; Verduzco-Zapata, M. Assessment of the Performance of an Artificial Reef Made of Modular Elements through Small Scale Experiments. J. Mar. Sci. Eng. 2021, 9, 130. [Google Scholar] [CrossRef]
  10. Konispoliatis, D.N. Performance of an Array of Oscillating Water Column Devices in Front of a Fixed Vertical Breakwater. J. Mar. Sci. Eng. 2020, 8, 912. [Google Scholar] [CrossRef]
  11. Konispoliatis, D.N.; Mavrakos, S.A. Hydrodynamic Efficiency of a Wave Energy Converter in Front of an Orthogonal Breakwater. J. Mar. Sci. Eng. 2021, 9, 94. [Google Scholar] [CrossRef]
  12. McCartney, B.L. Floating breakwater design. J. Waterw. Port Coast. Ocean. Eng. 1985, 111, 304–318. [Google Scholar] [CrossRef]
  13. Hales, L.Z. Floating Breakwater: State of the Art Literature Review; Technical Report No. 81-1; U.S. Army Coastal Engineering Research Center, Fort Belvoir: Fairfax County, VA, USA, 1981. [Google Scholar] [CrossRef] [Green Version]
  14. Kelly, H. Discussion about Floating Breakwaters; Naval Facilities Engineering Command: Norfolk, VA, USA, 1999. [Google Scholar]
  15. Tsinker, G.P. Marine Structures Engineering: Specialized Application; An International Thomson Publishing Company: New York, NY, USA, 1995. [Google Scholar]
  16. Fousert, M.W. Floating Breakwater: A Theoretical Study of a Dynamic Wave Attenuating System. Master’s Thesis, Delft University of Technology, Delft, The Netherland, 2006. [Google Scholar]
  17. Murali, K.; Mani, J.S. Performance of cage floating breakwater. J. Waterw. Port Coast. Ocean. Eng. 1997, 123, 172–179. [Google Scholar] [CrossRef]
  18. Dai, J.; Wang, C.M.; Utsunomiya, T.; Duan, W. Review of recent research and development on floating breakwaters. Ocean. Eng. 2018, 158, 132–151. [Google Scholar] [CrossRef]
  19. Sujantoko, S.; Djatmiko, E.B.; Wardhana, W.; Armono, H.D.; Wahyudi, W. Dynamic behavior analysis of porous saw floating breakwater under regular waves. In Proceedings of the 7th International Seminar on Ocean and Coastal Engineering, Environmental and Natural Disaster Management, ISOCEEN, Surabaya, Indonesia, 6–7 November 2019; pp. 236–241. [Google Scholar] [CrossRef]
  20. Sujantoko, S.; Djatmiko, E.B.; Wardhana, W.; Armono, H.D.; Sholihin; Ali, M.F. Experimental study on the effect of mooring angle on mooring tension of porous saw type floating breakwater. In Proceedings of the 7th International Seminar on Ocean and Coastal Engineering, Environmental and Natural Disaster Management, ISOCEEN, Surabaya, Indonesia, 6–7 November 2019; pp. 94–99. [CrossRef]
  21. Sujantoko, S.; Wardhana, W.; Djatmiko, E.B.; Armono, H.D.; Putro, W.D.; Haryono, R.A. Study on wave characteristics of floating breakwaters for piling and tethered type. J. Hydraul. Eng. 2021, 12, 39–52. (In Indonesian) [Google Scholar] [CrossRef]
  22. Sujantoko, S.; Djatmiko, E.B.; Wardhana, W. Experimental Investigation of the Performance of Porous-Slope Floating Breakwater. Int. J. Eng. Appl. 2022, 10, 149–157. [Google Scholar] [CrossRef]
  23. Nece, R.E.; Richey, E.P. Wave Transmission Tests of Floating Breakwater for Oak Harbor; Water Resources Series Tech. Report 32; Harris Hydraulics Laboratory, University of Washington: Seattle, DC, USA, 1972. [Google Scholar]
  24. Adee, B.H.; Richey, E.P.; Christensen, D.R. Floating Breakwater Field Assessment Program, Friday Harbor, Washington; Technical Report 76-17; U.S. Army, Corps of Engineers, Coastal Engineering Research Center, Fort Belvoir: Fairfax County, VA, USA, 1976. [Google Scholar] [CrossRef]
  25. Jones, D.B. An Assessment of Transportable Breakwaters with Reference to the Container Offloading and Transfer System (COTS); Technical Note No. N-1529; Civil Engineering Laboratory, Naval Construction Battalion Center: Gulfport, MS, USA, 1978. [Google Scholar]
  26. PIANC. Floating Breakwater: A Practical Guide for Design and Construction; Report of Working Group No. 13 of the Permanent Committee II, Supplement to Buletin 85; PIANC: Brussel, Belgium, 1994. [Google Scholar]
  27. Sawaragi, T. Coastal Engineering: Waves, Beaches, Wave-Structure Interactions; Elsevier Science: Armsterdam, The Netherlands, 1995. [Google Scholar]
  28. Loukogeorgaki, E.; Angelides, D.C. Stiffness of mooring lines and performance of floating breakwater in three dimensions. Appl. Ocean. Res. 2005, 27, 187–208. [Google Scholar] [CrossRef]
  29. Kim, C.G.; Kim, H.-S.; Kim, T.-H.; Baik, C.-I. Monitoring of Fish Reef Installed in Koje Coastal Waters. Ocean. Polar Res. 2001, 23, 305–310. [Google Scholar]
  30. Cox, R.; Beach, D. Floating breakwater performance—Wave transmission and reflection, energy dissipation, motions, and restraining forces. In Proceedings of the First International Conference on the Application of Physical Modeling to Port and Coastal Protection, Porto, Putugal, 8–10 May 2006; pp. 371–381. [Google Scholar]
  31. Le Tirant, P. Anchoring of Floating Structures; Technip: Paris, France, 1990. [Google Scholar]
  32. Hughes, S.A. Physical Models and Laboratory Techniques in Coastal Engineering; World Scientific: Singapore, 1993. [Google Scholar]
  33. Escudero, M.; Hernández-Fontes, J.V.; Hernández, I.D.; Mendoza, E. Virtual Level Analysis Applied to Wave Flume Experiments: The Case of Waves-Cubipod Homogeneous Low-Crested Structure Interaction. J. Mar. Sci. Eng. 2021, 9, 230. [Google Scholar] [CrossRef]
  34. Amaechi, C.V.; Wang, F.; Ye, J. Experimental Study on Motion Characterisation of CALM Buoy Hose System under Water Waves. J. Mar. Sci. Eng. 2022, 10, 204. [Google Scholar] [CrossRef]
  35. Djatmiko, E.B. Perilaku Dan Operabilitas Bangunan Laut di Atas Gelombang Acak; ITS Press: Surabaya, Indonesia, 2012. [Google Scholar]
Figure 1. Experimental equipment in a wave flume.
Fluids 07 00259 g001
Figure 2. Experimental design layout in a wave flume.
Fluids 07 00259 g002
Figure 3. Configuration-1 model floating breakwater.
Fluids 07 00259 g003
Figure 4. Configuration-2 model floating breakwater.
Fluids 07 00259 g004
Figure 5. Configuration-3 model floating breakwater.
Fluids 07 00259 g005
Figure 6. Concrete anchor with various designs for testing.
Fluids 07 00259 g006
Figure 7. Wave probe calibration.
Fluids 07 00259 g007
Figure 8. Plates and anchors on physical model test in a wave flume.
Fluids 07 00259 g008
Figure 9. Concrete anchors of various weights (200 gr, 500 gr, 1000 gr, 2000 gr).
Fluids 07 00259 g009
Figure 10. Concrete anchor 4000 gr.
Fluids 07 00259 g010
Figure 11. Relationship of W/ρ H3 to H/gT2 in floating breakwater configuration 1.
Fluids 07 00259 g011
Figure 12. Relationship of W/ρ H3 to H/gT2 in floating breakwater configuration 2.
Fluids 07 00259 g012
Figure 13. Relationship of W/ρ H3 to H/gT2 in floating breakwater configuration 3.
Fluids 07 00259 g013
Figure 14. Relationship of W/ρ H3 to H/B in floating breakwater configurations 1, 2, and 3.
Fluids 07 00259 g014
Table 1. Dimensional analysis variables of concrete block anchor.
SymbolParameterDimension
HSignificant wave height (m)L
TWave period (sec)T
hWater depth (m)L
αThe angle of the mooring (deg)-
BFloating breakwater width (m)L
ρWater density (kg/m3)ML−3
gEarth’s gravitational acceleration (m/det2)LT−2
WAnchor weight (kg)M
Table 2. The concrete block anchor geometry.
Density of ConcreteWeightVolumeLengthWidthHeight
(gram/cm3)(gram)(cm3)(cm)(cm)(cm)
2083.320096.00156.75.72.5
500240.00386.75.76.3
1000480.007714122.9
2000960.015414125.7
Table 3. Maximum values of W/ρH3 in the range H/gT2 (0.02–0.025).
Floating Breakwaterα = 45 degα = Crossα = 90 deg
Config 10.210.170.13
Config 20.230.210.18
Config 30.240.200.17
Table 4. Maximum values of W/ρH3 to H/B.
Floating Breakwaterα = 45 degα = Crossα = 90 deg
Config 10.2020.1870.160
Config 20.2380.2000.207
Config 30.2710.2590.246
Publisher’s Note: MDPI stays neutral with regard to jurisdictional claims in published maps and institutional affiliations.

