Abstract
This paper presents the results of an experimental investigation on the impact of dam-break-induced surges on a vertical wall. The instantaneous surge height and dynamic pressure on a vertical wall were measured for surges with different reservoir depths of H = 200 mm, 250 mm, and 300 mm. The time-histories of horizontal pressure on the wall were measured using the miniaturized pressure transducers, and the surge heights were recorded with an ultrasonic sensor. The relationships between dynamic pressure and surge height on the vertical wall and during the impact were obtained from recorded raw data. The experimental results highlighted detailed processes on the variation of impact pressure during the surge propagation, impact on the wall, runup, falling, and breakup of the turbulent flow. The time-histories of surge height and dynamic pressure were analyzed, and the results were compared with the hydrostatic pressure on the wall to study wave breaking mechanism of tsunami waves on the wall. Dynamic pressures at the impact instant were found to be approximately three times the corresponding static pressure in the bed, in good agreement with previous research Moreover, the maximum surge runup heights on the wall were between 2.1 and 2.3 times the corresponding initial reservoir depths. The vertical distributions of impact pressure were divided into two hydrodynamic regimes. Based on the impact duration, the first regime occurred less than 0.1 s after the impact with highly non-linear pressure distributions, and the second regime showed a semi-hydrostatic pressure distribution from 0.5 s to 0.7 s. The results presented in this study are suitable for the design of coastal infrastructures and can be used to validate numerical models.
1. Introduction
Tsunami waves have caused severe damage to coastal infrastructures and buildings and claimed many lives due to extreme hydrodynamic loading. Such events became more frequent and caused significant infrastructure damages in the past few decades, such as the 2010 Chile Tsunami, 2011 Japan Tsunami, 2013 Solomon Islands Tsunami, 2015 Central Chile Tsunami, and the 2018 Indonesia Tsunami. Numerous field surveys and laboratory experiments have been carried out to study the hydrodynamics of tsunami-like waves and to determine the tsunami’s loading on coastal structures [1,2,3,4,5]. Nistor et al. [6] provided a detailed evaluation of extreme hydrodynamic loading due to the propagation and impact of tsunami waves and recommended a revision of the design of coastal structures. They emphasized the necessity and importance of such extreme hydrodynamic loadings, such as pressure and force, for the adequate design and reconstruction of coastal infrastructures and buildings in tsunami-prone areas.
To reproduce tsunami waves and associated inundation in laboratory conditions, different wave generation mechanisms have been proposed in the literature, such as the sudden removal of a volume of water through vertical pipes [7,8], a dam-break mechanism using swing gates [9,10,11], vertical wall gates [12,13], and a pneumatic basin [14,15,16] for the physical modeling of tsunami-like waves. A wave generated by the dam-break mechanism showed similar wavefront shape and propagation characteristics as tsunami-induced inundation propagating overland [17]. Therefore, the dam-break model has been widely used to generate tsunami-like inundation in laboratory experiments and numerical simulations [9,18,19,20].
Based on shallow water theory, Ritter [21] initially derived the analytical solution for wave propagation on a frictionless horizontal bed generated by a dam-break mechanism. The bed friction effect was later included in the theoretical study of wave propagation, and the results were verified with experimental observations [22,23]. This model was demonstrated to be a good approximation and provided a reasonable prediction. By applying the method of characteristics in the treatment of bed resistance, Chanson [24] simplified and modified the solution for dam-break flow on the horizontal bed, where the free surface in the tip region showed the same convex upwards shape as the physical test. According to the presence of an initial water layer on the bed, dam-break waves are categorized into wet and dry bed conditions. The time-history of the water surface profile of dam-break induced waves on a dry bed showed that the maximum wave velocity was scaled by the square root of the reservoir height [25].
Using high-speed imaging, Hu et al. [26] captured free surface profiles of turbulent surges at wave impacting, runup, breaking, and air entrainment stages. Digitized surface profiles showed a horizontal jet in dry bed and a special mushroom-like jet in wet bed conditions at the initial stage of propagation. Based on the previous research of unbroken [27,28] and partially broken waves [29] generated by wet dam-break on a fixed structure, Hernández-Fontes et al. [30] developed and investigated this interaction via fully developed broken incident flow. In the experiment, a high-speed camera, water elevation, and force sensors were applied to record the overtopping behaviors, patterns, and loads. Regarding the overtopping pattern, a moving hydraulic jump was observed in the broken wave case, different from the stable undular bore in the unbroken case. As a result, the most violent interaction was observed in the fully developed broken wave case. At h0/h1 = 0.4, a large plunging wave was observed, which hit the deck end and formed large air cavities, which was similar to the behaviors of dam-break flow on the dry bed. Similar dam-break free surface studies were also reported to investigate the flow kinematics, for flow against an obstacle [31], over a mobile bed [32], and against a vertical wall [12,19].
Force and pressure transducers were used in the past to measure the time histories of force and dynamic pressure by dam-break induced waves impacting structural walls. The pressure transducers were embedded in the front and top surfaces of a small cubic block to measure the dynamic pressure around the block [33]. Good agreement was reported between the experimental and numerical results for the bottom front transducers. To investigate the complex interaction processes between hydraulic bores and structural models, Nouri et al. [9] measured the vertical pressure distributions on the wall of a cylindrical structure by installing a series of pressure transducers onto the frontal face of the cylinder, facing the incoming flow. The results presented the spatial pressure distribution during the short impact, including the peak value and pressure variation range. A comparison between the experiments and the Smoothed Particle Hydrodynamics (SPH) simulation indicated that the numerical predictions of the initial impact pressure were much higher than the experimental results for just the bottom transducer (i.e., h = 0.05 m). At higher locations (i.e., h = 0.15 m, 0.2 m, and 0.3 m), the numerical predictions agreed well with the experimental results. Furthermore, negative dynamic pressures due to the suction effect were observed in both the experimental and numerical data at h = 0.3 m [18].
A partially blocked cube was used as a model of a residential house to study the effects of hydrodynamic loadings induced by tsunami-like waves [34]. The impact loading of dam-break waves under both dry and wet bed conditions and for different impoundment depths was studied. The image analysis during wave propagation and the subsequent impact on the wall indicated that the bores propagating in wet bed conditions generated higher splashes than those propagating over the dry bed. The difference was due to the steeper wavefront generated in wet bed conditions. Similarly, the overtopping mechanism doubled in height onto the structural model [8]. The results showed that the overtopping of the shorter structure induced higher downstream water depths, leading to lower horizontal forces due to smaller water depth differences between the upstream and downstream [8].
The structures investigated for the interaction between tsunami-like waves and their walls were either fully blocked or partially blocked by the flume. During the impact of the dam-break wave with a vertical wall, the bore runs to a high level along the vertical wall and then moves backwards. Experimental and numerical studies in the literature showed that fully blocked walls absorb more impact loading than partially blocked walls [35]. Recent experimental studies showed that impact loading on coastal structures could be reduced in structures with large openings. Wuthrich et al. [36] designed several cubical structures with different openings (i.e., permeability) to investigate the effects of building openings on hydrodynamic loadings. Due to the presence of openings, lower upstream inundation depths were observed in comparison with the corresponding inundation depths occurring on impervious buildings. Moreover, a linear correlation was found between horizontal hydrodynamic forces and the area of the openings.
A series of dam-break experiments on a dry bed with reservoir depths of H = 300 mm and 600 mm were carried out to investigate the impact of dam-break waves on a vertical wall [12,37]. The miniaturized pressure transducers were installed on the left wall of the tank to capture the time-history of dynamic pressure [12]. Experiments were repeated 100 times, and the average pressure variations were analyzed. The quantitative and statistical analysis of pressure loads indicated a linear correlation between the impact pressure points at the bottom of the tank. The statistical pressure data above the bottom of the tank showed good agreements with other studies [38,39]. Some differences were also observed between experimental results and numerical simulations. The numerical results underestimated the experimental data, and the sudden pressure drop was the result of excessive diffusion and small bubble formation [19].
Extensive experimental and numerical studies were performed in the past to investigate the interaction of tsunami-like waves and walls by analyzing free surface profiles, surge height, and dynamic pressure variations with time. However, less attention has been paid to investigating the relationship between dynamic pressure and surge height at the location of the vertical wall during the wave impact, runup, falling, and breaking events. Image analysis and dynamic pressure data indicated that during the wave impact, dynamic pressure is relatively steady while the surge height rapidly changes. Therefore, it is hypothesized that during this short but rapidly changing process, the relationship between the dynamic pressure and surge height is not clear. The main objective of this study is to investigate the correlation between dynamic pressure and surge height in time and investigate the vertical distribution of the dynamic pressure on the wall. In this regard, the time-variant behavior of dam-break induced wave propagation on a dry bed and its impact on a vertical wall was studied in detail. Both the time-histories of surge heights and pressure distributions on a vertical wall were measured, and the correlations between water level variations and dynamic pressures were analyzed. The measurements were conducted using an array of pressure transducers installed in the centerline of the vertical wall and on both left and right sides of the centerline to capture the three-dimensional motion of the surge.
The present paper is organized as follows: This section contains an introduction presenting a literature review and the research needs and motivation for the study. A detailed description of the experimental setup and instrumentation is provided in Section 2. Section 3 deals with the repeatability and calibration tests. The time-histories of free surface water levels and dynamic pressures are presented in Section 4. Comparison with previous research and limitation of this study are discussed in Section 5. Finally, the outcomes of the present experimental study are concluded in Section 6.
2. Experimental Setup
A series of laboratory experiments were conducted in the Water Resource Engineering Laboratory of the University of Ottawa, Canada, to investigate the vertical distribution of water level and dynamic pressure on a vertical wall. Experiments were conducted in a rectangular, horizontal, glass-walled tank of 1.2 m long, 0.44 m wide, and 0.5 m high, as shown in Figure 1.
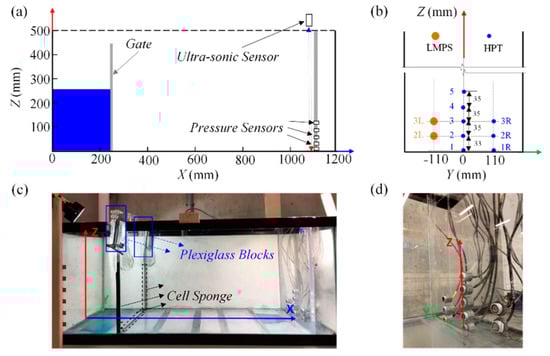
Figure 1.
Experimental setup and the adopted coordinates system: (a) schematic of the experimental setup in initial condition; (b) side view schematic of the experimental tank and the positioning of TE connectivity LM−series Pressure Transducers (LMPT) and Honeywell Pressure Transducers (HPT); (c) side-view image of the experimental tank; (d) pressure transducers’ location.
2.1. Tank Apparatus
A rail-guided vertical gate system was added 250 mm downstream of the tank wall; through rapid opening, this gate was used to generate dam-break waves (Figure 1a,c). Dam-break waves were generated by the rapid lifting of the vertical gate using three different impoundment water depths of H = 200 mm, 250 mm, and 300 mm. To prevent leakage, a thin layer of black cell sponge was fitted around the gate frame along the tank walls to reduce the gap between the gate and the flume walls. In order to generate a perfect dam-break wave, the maximum gate opening time, t, was measured and compared with the threshold normalized opening time of t(g/H)1/2 < 21/2 as suggested by Lauber et al. [40], where g is the acceleration due to gravity and H is the impoundment depth in the reservoir behind the gate. This required gate opening time, t, had to be less than 0.2 s, 0.23 s, and 0.25 s for H = 200 mm, 250 mm, and 300 mm, respectively. The actual opening times were verified using high-speed imaging for the tests with H = 200 mm, 250 mm, and 300 mm, and they were 0.11 s, 0.117 s, and 0.13 s, respectively. Thus, the measured gate opening times satisfied the opening criteria by Lauber et al. [40].
In total, 60 tests (including test repetitions) were conducted, among which 40 tests with an impoundment depth H = 300 mm were performed to test the repeatability and to validate the accuracy of pressure transducers. The tests with impoundment depths of H = 200 mm and 250 mm were repeated 10 times to obtain an accurate time-average water depth and dynamic pressure. Videos were recorded using GoPro cameras (Hero 5, GoPro Inc., San Mateo, CA, USA) with a resolution of 1080 × 1080 pixels. The videos were recorded in a linear mode to avoid any image distortion, and they were converted to images with a frequency of 60 frames per second. All the experimental tests presented in this study are shown in Table 1.

Table 1.
Experimental tests and surge properties.
2.2. Pressure Transducers
A Plexiglas wall was installed 1.1 m downstream of the tank to mount the pressure transducers in the wall (see Figure 1b,d). Two different types of pressure transducers (HPT, TBFLPNS001BGUCV, Honeywell Sensing and Productivity Solutions, Charlotte, NC, USA) and ASC-calibrated pressure transducers (LMPT, LM31-00000F-005PG, TE Connectivity-Measurement Specialties, Hampton, VA, USA) were employed to measure the time-histories of the dynamic pressure on the vertical wall. The Honeywell (HPT) pressure transducer had a diameter of 4 mm, showed stable and accurate measurement in the calibration in static water, and was used to capture the vertical distributions of dynamic pressure in the centerline of the vertical wall (Figure 2a). To provide support for the tiny transducer, make it easily mountable, and keep the sensing surface flush with the right wall, precise parts developed using 3D printing technology and screwed carp were used to assemble the transducer. Five HPT transducers were installed on the centerline of the wall in which the first transducer was located at the bed, while the other pressure transducers were located at 35 mm, 70 mm, 105 mm, and 140 mm above the bed. Three pressure transducers were also installed at the middle distance between the right wall and the wall centerline. These pressure transducers were installed at the same height as the first three transducers at the wall centerline, and they were employed to capture the three-dimensional motion of the wavefront (see Figure 1b,d).
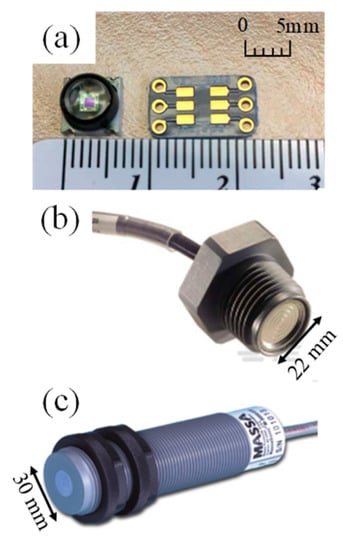
Figure 2.
Instrumentation used for pressure and surge height measurements: (a) Honeywell Pressure Transducer (HPT); (b) TH connectivity LM-series Pressure Transducer (LMPT); (c) MASSA M-5000/220 Ultra-sonic sensor (MUSS).
To evaluate the three-dimensional variations of surge waves and their impact on the wall and to validate the accuracy and reliability of pressure measurements, two ASC-calibrated LM pressure transducers with a sensing diameter of 22 mm were installed in the middle distance between the left wall and the wall centerline (see Figure 2b). The accuracy of the LM pressure transducer was examined by measuring hydrostatic pressures of known water depths. Accurate measurements were obtained with less than 0.5% error. The dynamic performance of the LM pressure transducers was also examined to test the effect of the pressure sensing area on the accuracy of pressure measurement. The left LM and right Honeywell pressure transducers were installed at the same levels, and they were symmetrical about the central line of the wall (see Figure 1b).
2.3. Ultrasonic Wave Sensor
The time-history of surge height close to the vertical wall was measured by an ultrasonic sensor (M-5000/220, MASSA, Hingham, MA, USA) which was placed above the tank next to the right wall at X = 1085 mm. The MASSA depth sensor is able to record water level with a frequency of 2400 Hz and has the capability of non-contact distance measurement over a nominal target range of 100 mm to 1000 mm with a measurement resolution of 0.25 mm. The depth sensor was installed facing down, at the top of the experimental tank and close to the vertical wall (see Figure 1a). The horizontal location of the depth sensor was adjusted to accurately capture the time-history of the surge height.
2.4. Data Acquisition System
Two data acquisition (DAQ) boards (8-channels, HBM QuantumX MX 840B, Marlborough, MA, USA) and (16-channels, HBM QuantumX MX 1601B, Marlborough, MA, USA) were employed for acquiring depth and pressure data. Both data acquisition systems have universal amplifiers with the capability of converting analog signals to 24-bit digital data with a sampling frequency of 2400 Hz. The maximum sampling frequency (i.e., f = 2400 Hz) was used to capture depth and pressure data. Data acquisition boards were integrated and synchronized using fire wires (1-KAB272-2, HBM, Marlborough, MA, USA) and then connected to the Cisco hub by Ethernet cables. A signal visualizer software (Catman-Easy, HBM, Marlborough, MA, USA) was used for sensor configuration, signal acquisition, data visualization, data analysis, and data storage during the measurements. The Honeywell Pressure Transducers (HPTs) were connected to DAQs, and they were calibrated by measuring the static pressure of a known water depth.
3. Pressure Data Analysis
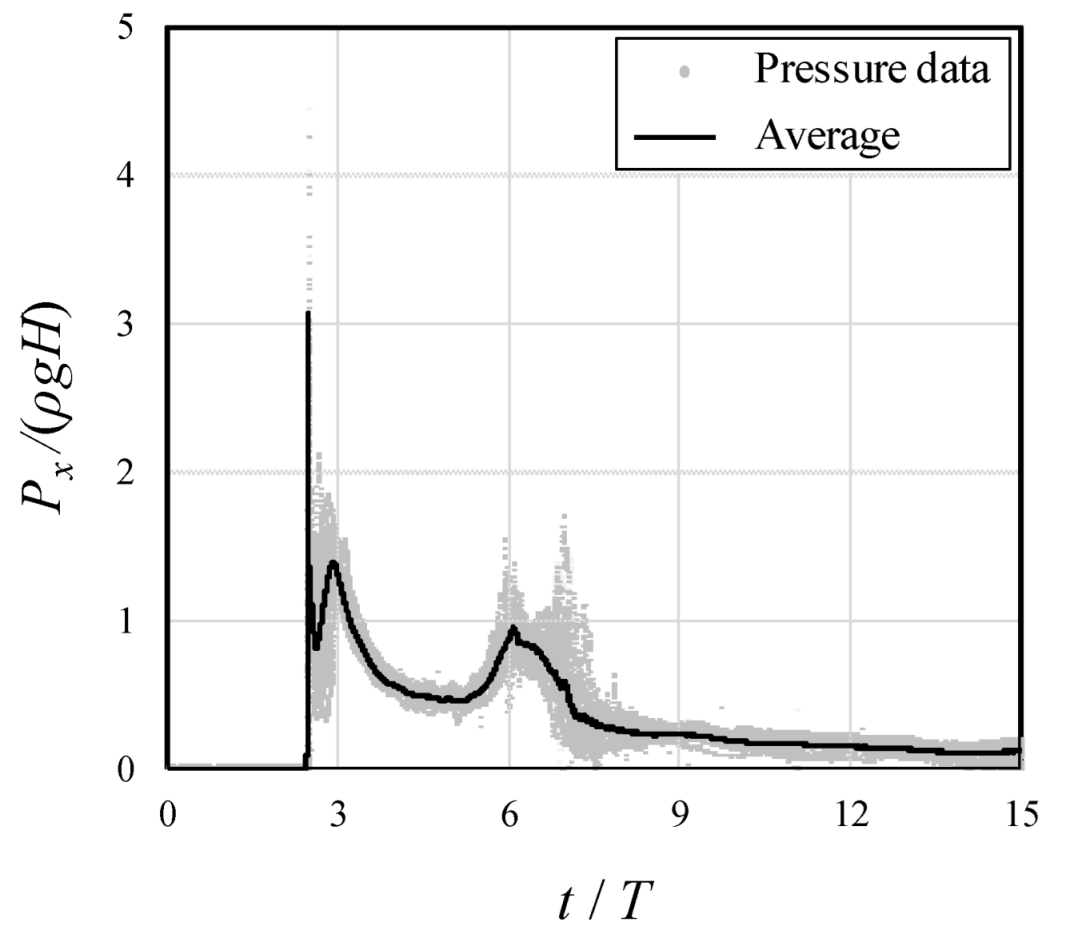
As mentioned, the experiment using the impoundment depth of H = 300 mm was repeated 40 times, and the time-history pressure data was captured with a sampling frequency of 2400 Hz, at which stable and detailed pressure data can be obtained, although lower than the frequency of 10 kHz by Kim et al. [41]. The results were used to calculate the time-history of average horizontal dynamic pressure, Px, and determine pressure fluctuations at the wall face at different elevations. Figure 3 show the variations of the normalized horizontal dynamic pressure with normalized time. The horizontal dynamic pressure, Px, was normalized by the static pressure at the initial condition, ρgH, where ρ is the density of water and time was normalized by the characteristic time scale, T = (H/g)1/2.
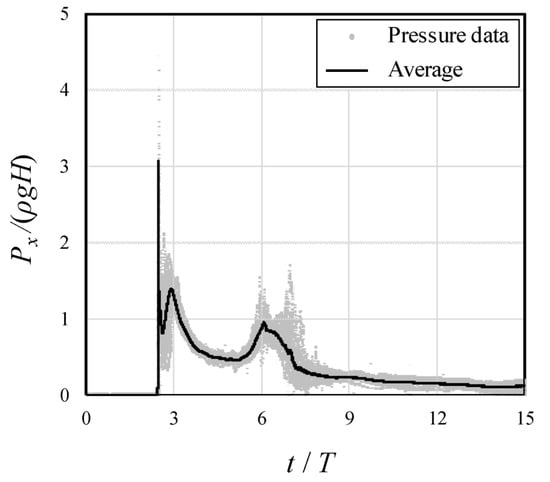
Figure 3.
Time-history of the normalized pressure measured by Transducer 1. The gray area shows the cloud of data for 40 repetitions, and the solid curve represents the average pressure.
As shown in Figure 3, the first peak in time-history of normalized pressure had a value of Px/(ρgH) = 3.18, and it occurred at approximately t/T = 2.3. After the first peak and at the initial impact, the normalized pressure decreased to Px/(ρgH) = 0.8 and then increased to 1.4 at t/T = 3.0. After the pressure spike, the normalized dynamic pressure followed a U-shaped trend and reached Px/(ρgH) = 1.0. The second pressure peak occurred at approximately t/T = 6.0.
A similar trend in the time-history of the dynamic pressure at the bed was reported in the experimental study of [19]. The first peak in their study was 16.7% lower than the present study since the bottom transducers were positioned 3 mm to 4 mm above the tank bed. In addition, the magnitude of the first non-dimensional pressure peak, Px/(ρgH), was 3.18, which was similar to the observations of [12], with a value ranging between 2.8 and 3.2. Despite the size variations between [12,19] and the present study, non-dimensional dynamic pressures were found to be approximately three times the initial static pressure in the reservoir. A similar relationship between dynamic and static pressures was also recommended by the SMBTR tsunami-design guideline as an estimate of the maximum hydrodynamic force due to tsunami loading [42]. A comparison of the normalized dynamic pressure with the literature indicated that the selected pressure transducers and data acquisition units accurately captured the pressure field.
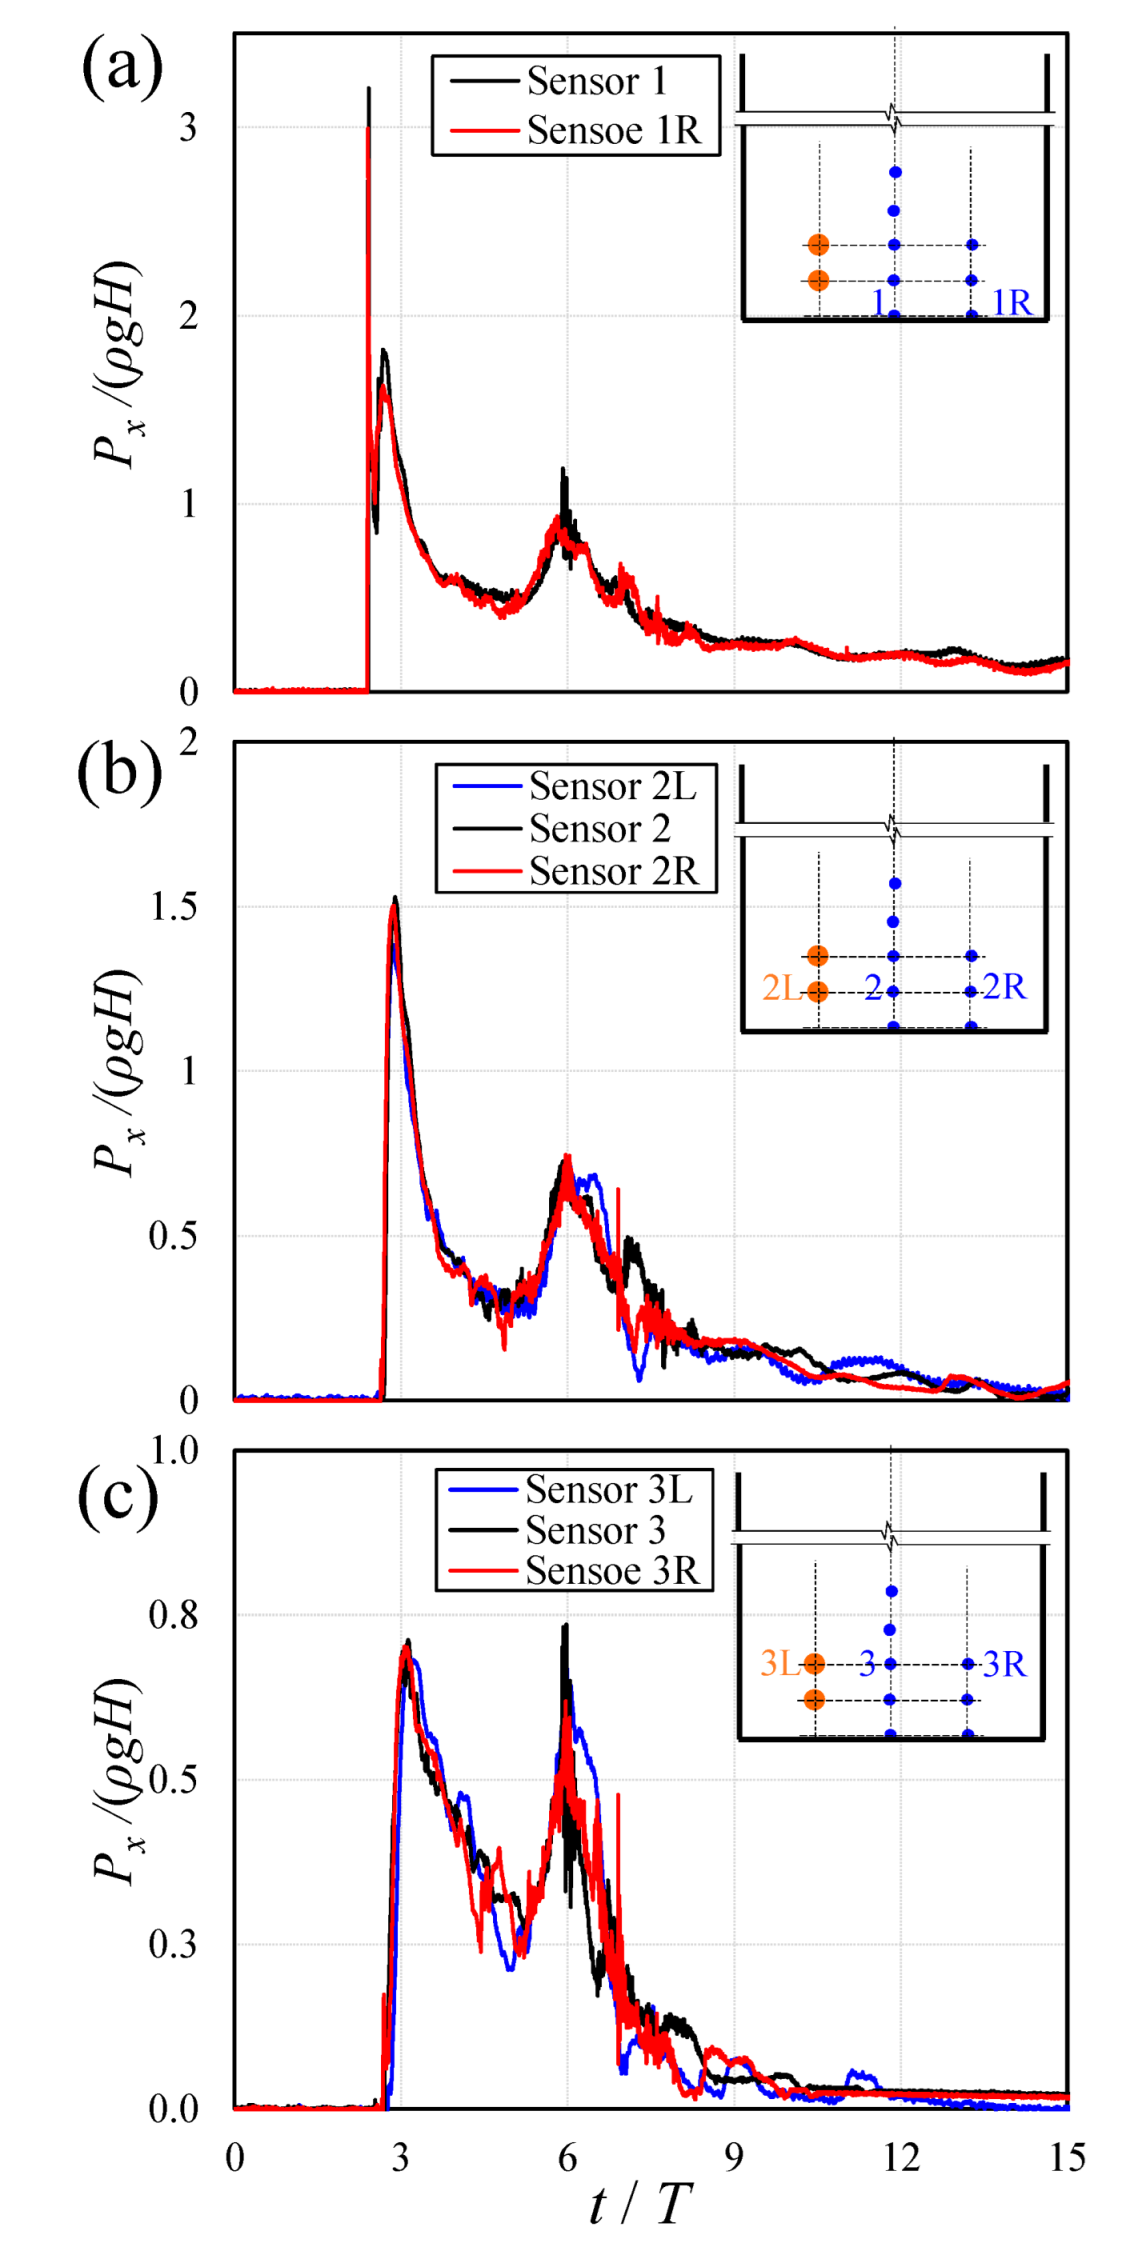
The time-histories of dynamic pressure at different locations on the wall were measured with pressure transducers on the centerline, left, and right sides of the centerline 110 mm apart (see Figure 1b,d). The recorded pressure data were further employed to investigate the three-dimensional motion and asymmetry in the surge front impact with a vertical wall (see Figure 4). It was indicated that pressure signals could be quite different when applying different transducers [41]. Thus, the dynamic pressure data, induced by a 300 mm dam-break surge on the vertical wall, was validated by comparing the pressure data from different transducers at the same level. As shown in Figure 4, the centerline pressure transducers were labeled with a number, and the left and right-side transducers were also labeled with L and R, respectively.
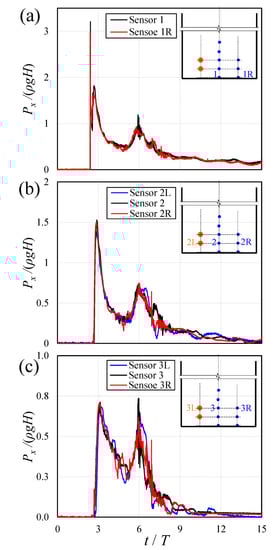
Figure 4.
Time-history of non-dimensional horizontal pressure at different levels from the flume bed: (a) z = 2 mm, transducer 1 and 1R; (b) z = 35 mm, transducer 2, 2L, and 2R; (c) z = 70 mm, transducer 3, 3L, and 3R.
Figure 4a show the variations of normalized horizontal pressure with non-dimensional time in the centerline and right side of the wall and close to the bed (i.e., transducers 1 and 1R). The time histories of dynamic pressure due to the impact of the surge generated by the impoundment depth of H = 300 mm with a vertical wall were recorded. The horizontal pressure data were normalized with the initial static pressure of the impounding reservoir (ρgH), and the time was normalized with the characteristic time scale (i.e., T = (H/g)1/2). The high similarity between the recorded pressure data from Transducers 1 and 1R indicated that the surge wave was two-dimensional at the bed location. The impact pressure at the centerline of the wall (transducer 1) was 7.8% higher than the first pressure peak recorded by the transducer 1R. The difference between the impact pressure at transducers 1 and 1R may be due to the side walls resistance effect, which slightly delayed the wave near the right wall, resulting in a lower impact pressure at the transducer 1R. Figure 4b show the time-history of dynamic pressure at z = 35 mm above the bed. As it can be seen, the time histories of dynamic pressures were identical for transducers placed at the same level, and the pressure data were similar in the centerline, on the left and right sides of the vertical wall. The pressure data indicated that both types of pressure transducers were able to capture the time-history of dynamic pressure accurately. In other words, the accuracy of micro pressure transducers was compared and validated with the larger LMPT. At this transducer level, the peak dynamic pressure was 1.5 times the initial static pressure at the reservoir. The second peak in the time-history of dynamic pressure occurred at t/T ≈ 6, and it was 70% of the initial static pressure at the reservoir.
Figure 4c show the variations of dynamic pressure with time at elevation z = 70 mm above the flume bed on the left, right, and centerline of the vertical wall. The peak pressures due to the surge impact were virtually identical for transducers located at the same elevation on the wall and 70% of the initial static pressure at the reservoir. The second peak in time-history of dynamic pressure had the same value as the first peak, around 0.7, and occurred at t/T ≈ 6. The difference between the second pressure peak in the sides and centerline of the vertical wall was −8.6%. As shown in Figure 4, the bottom transducers captured the highest pressure, which indicated the similarity between the recorded pressures in the sides and centerline. The small pressure differences at the bottom may be due to pressure fluctuations because of non-linear and non-uniform wave propagation along the right wall. Similar symmetry in the time-history of dynamic pressure at the bed was observed in tests with H = 200 mm and 250 mm as well.
The reliability and accuracy of the HP transducers were verified in the pressure comparison study. As a result, the miniaturized HPTs were employed for the dynamic pressure measurement.
4. Results
In this section, the experimental results of free surface profiles and dynamic pressure of dam-break wave were presented and discussed. All the data are available in the Supplementary Material.
4.1. Free Surface Profiles
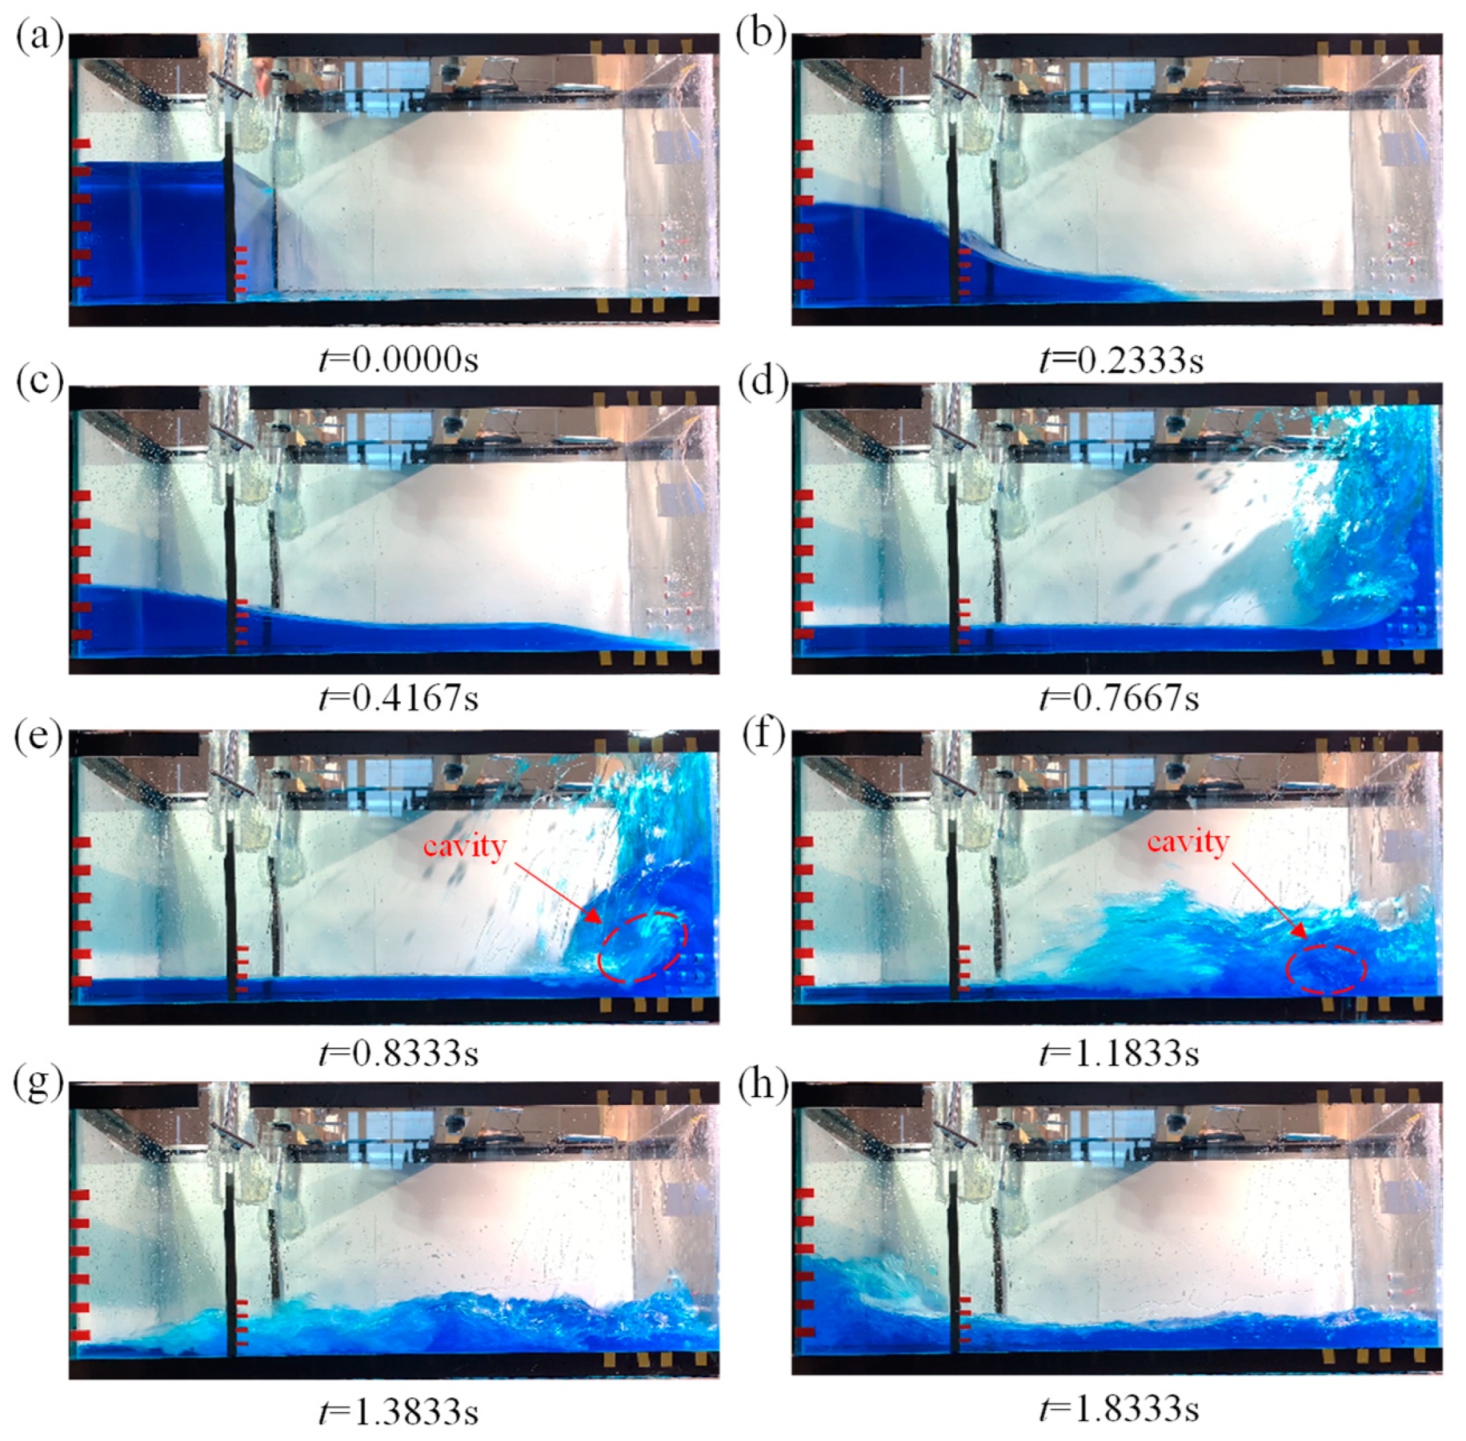
Free surface profiles of a dam-break-induced surge at different propagation instants can provide valuable information on the motion and kinematics of surge impact on a vertical wall. To differentiate the water from other components and better visualization, blue dye was used for coloring, similar to the research by Hernández et al. [43]. Figure 5 show the variations of free surface profiles with time for a surge with an impoundment depth of H = 250 mm.
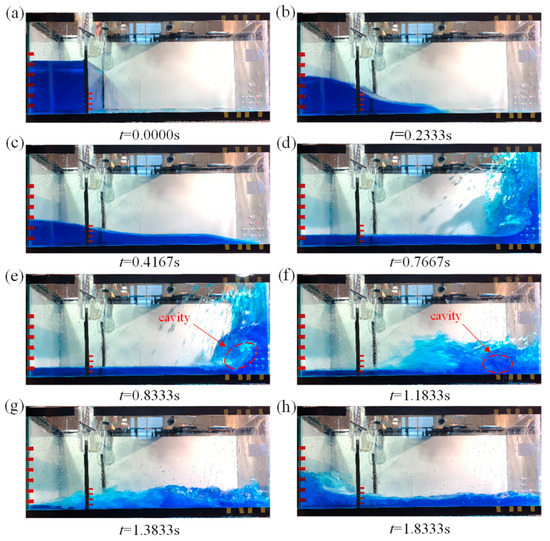
Figure 5.
Time series of raw images of the turbulent bore front propagation, impact on a vertical wall, and return wave for a bore generated from an impoundment depth of H = 250 mm: (a) t/T = 0; (b) t/T = 1.4614; (c) t/T = 1.7769; (d) t/T = 3.2694; (e) t/T = 3.5534; (f) t/T = 5.0458; (g) t/T = 5.8987; (h) t/T = 7.8176.
The interaction of a dam-break-induced surge with a wall can be studied through different stages of impact, runup, falling, and breaking. The wave–wall interaction stages are shown in Figure 5. Figure 5a show the initial condition, as water is stored in the reservoir, while Figure 5c show the surge impact on the wall at t = 0.4167 s.
After the impact, the water level close to the wall increased until all kinetic energy of the surge was converted to potential energy, and the wave reached the highest level of approximately two times that of the impoundment depth (see Figure 5d). The splashing of the surge front is correlated with the tank width, and splashing does not normally occur in relatively narrow tanks. No surge front splash was reported in the study of Lobovsky et al. [12], who used a tank width of w = 150 mm and Kamra et al. [19], who used a tank width of w = 200 mm. The splashed-up water returned to the tank and formed a water tongue (see Figure 5d). The water tongue rolled and formed a breaking wave or plunging breaker (see Figure 5e), and then a cavity volume formed between the frontal part and the delayed backwater (see arrow pointed Figure 5e,f). Afterwards, the surge impacted the bed and propagated backwards towards the reservoir and hit the left wall (see Figure 5g,h). The wave then runup, rolled water, and cavity formation was also observed in the experimental studies of Hu et al. [26] and Kamra et al. [19], as well as in the numerical study of Liu et al. [39].
The Froude number (ratio of gravitational and inertial force) of the wavefront was around 1.4 when the dam-break wave approached the right wall; however, a breaking wave was not observed when Fr exceeded the critical value of 1.0 [44], as shown in Figure 5c. Meanwhile, the maximum Weber number (ratio of inertial force and surface tension) in the experiment could reach around 5.0 × 10⁴ when the wave impacted the right wall and during the interaction. Therefore, the gravitational force became dominant in the propagation of the dam-break wave. Next, it can be observed in Figure 5d–g that the turbulent flow developed in the dam-break wave, with a Reynolds number (ratio of viscosity and inertial force) around 1.2 × 10⁶ exceeding the value of 1.0 × 10⁶, which is typically associated with tsunami wave inundation [16].
4.2. Time-History of the Water Surface Elevation
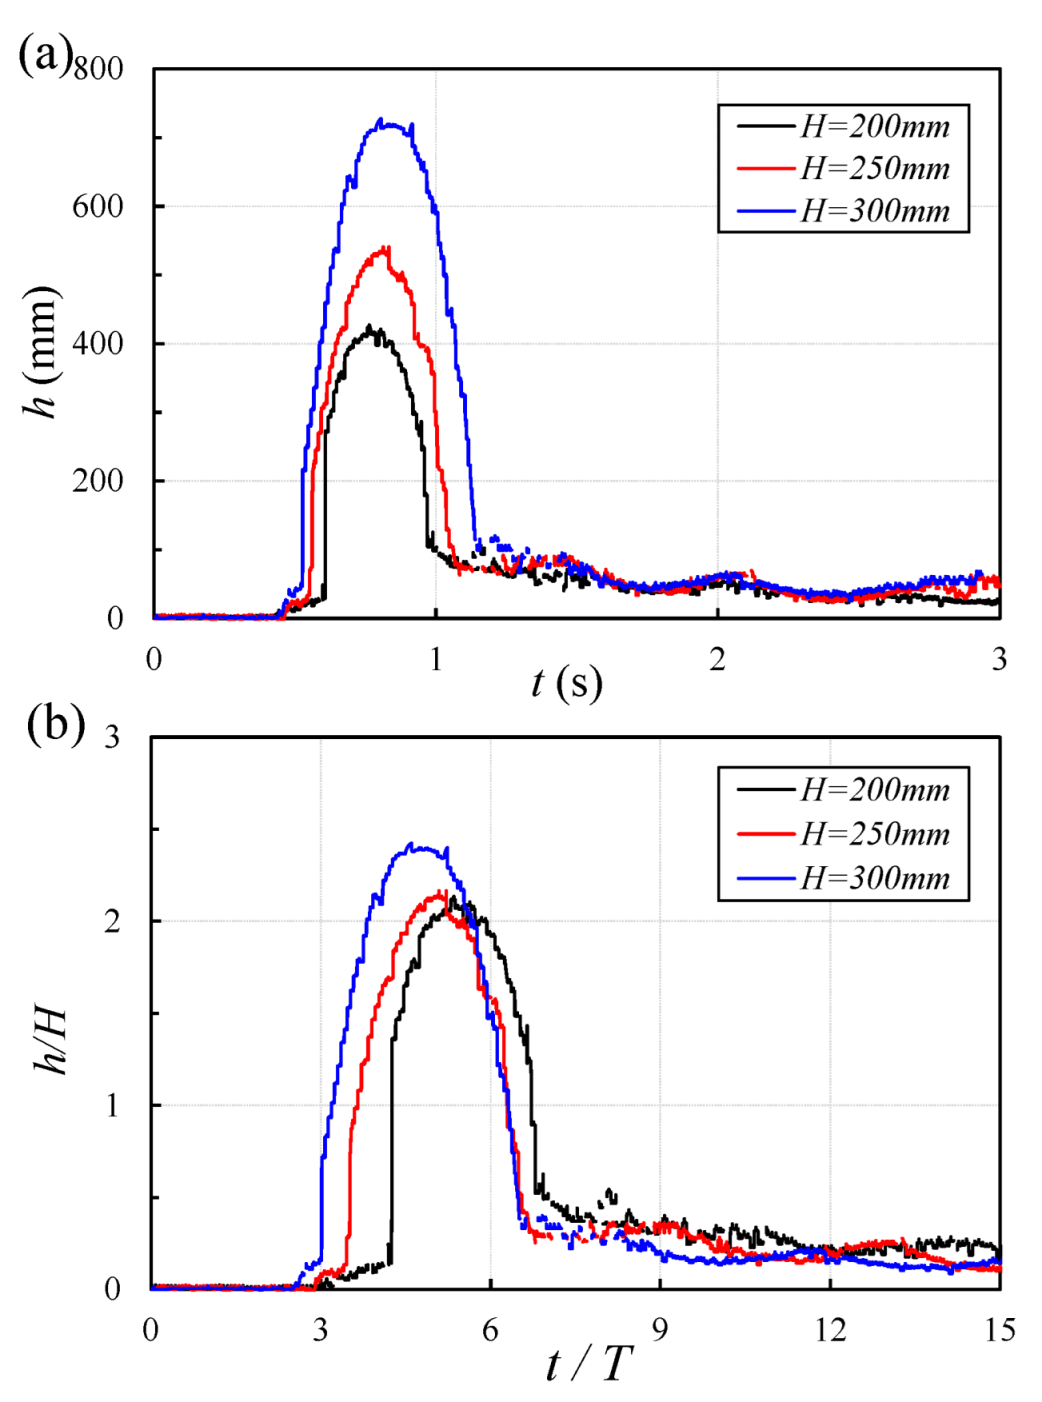
The time-histories of the water surface near the vertical wall and for different impoundment depths are shown in Figure 6. The measured water surface level at the wall varied from zero, then increased dramatically, reached the peak within a fraction of a second, and then decreased during the rolling-back stage.
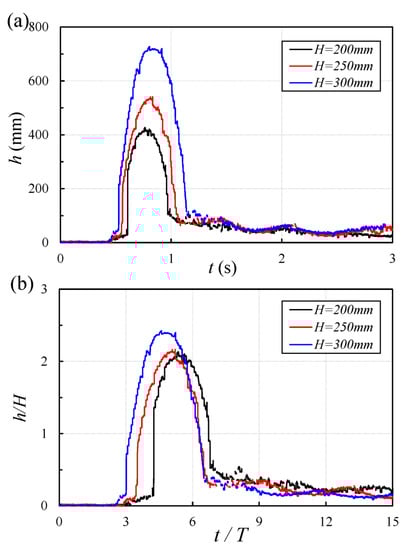
Figure 6.
Time-history of the surge runup height near the vertical wall for different impoundment depths: (a) variations of the surge height with time; (b) variations of the normalized runup height with the non-dimensional time.
Figure 6a show that the peak surge height increased with increasing impoundment depth, H, and the arrival time of the wavefront decreased as the impoundment depth increased. In addition, it took more time for the waves generated by higher impoundment depth to reduce the agitation. As a result, the rise and draw-down cycles are prolonged in waves with higher impoundment depths. Figure 6b show the correlation of normalized surge height with time. The surge height was normalized by the impoundment depth, H, and the time was normalized with the characteristics time scale, T. Higher impoundment depth generated higher momentum of flows, and the peak surge height increased non-linearly with the impoundment depth. The normalized peak surge heights were 2.03, 2.09, and 2.35 times the corresponding impoundment depths for H = 200 mm, 250 mm, and 300 mm, respectively. The duration between the wave runup and tongue collapse back onto the bed was labeled as τ in this study. The duration of the wave runup for H = 200 mm, 250 mm, and 300 mm was 0.60 s, 0.68 s, and 0.8 s, respectively.
4.3. Dynamic Pressure
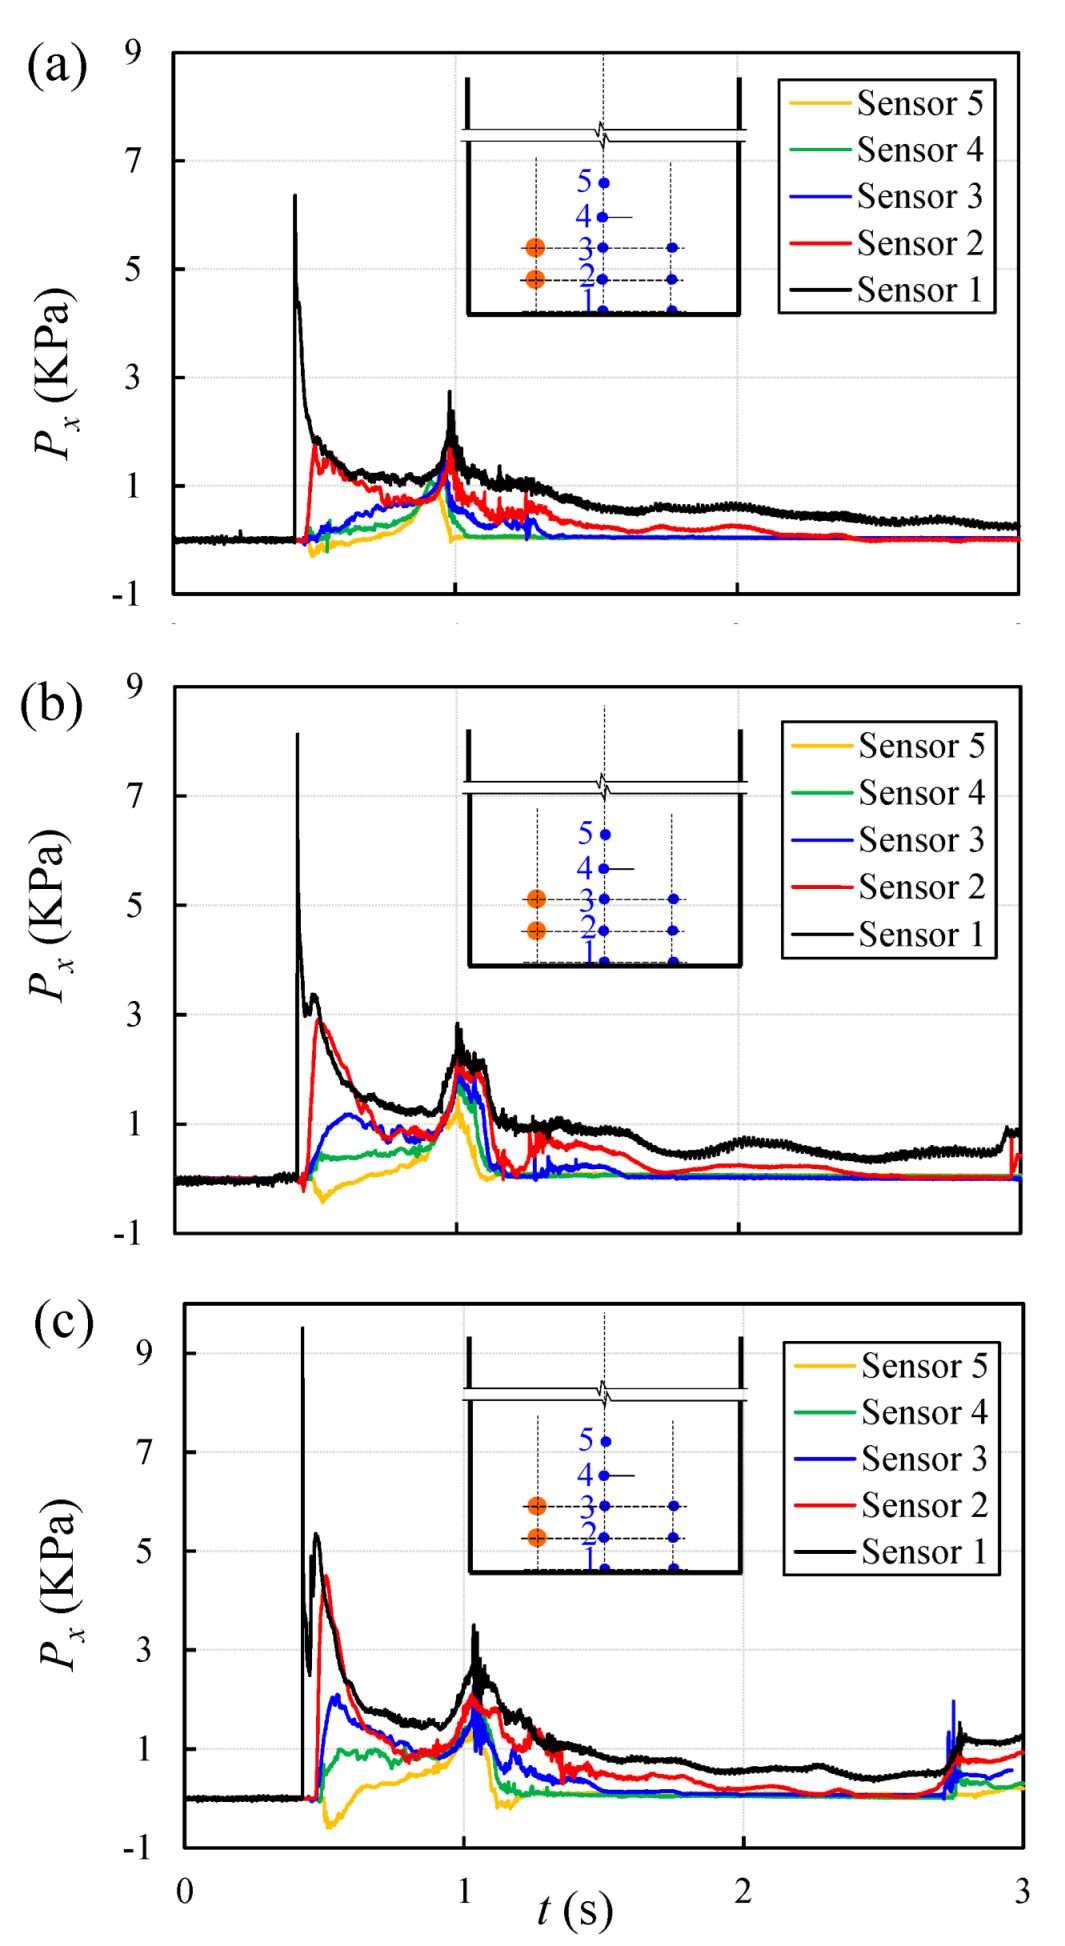
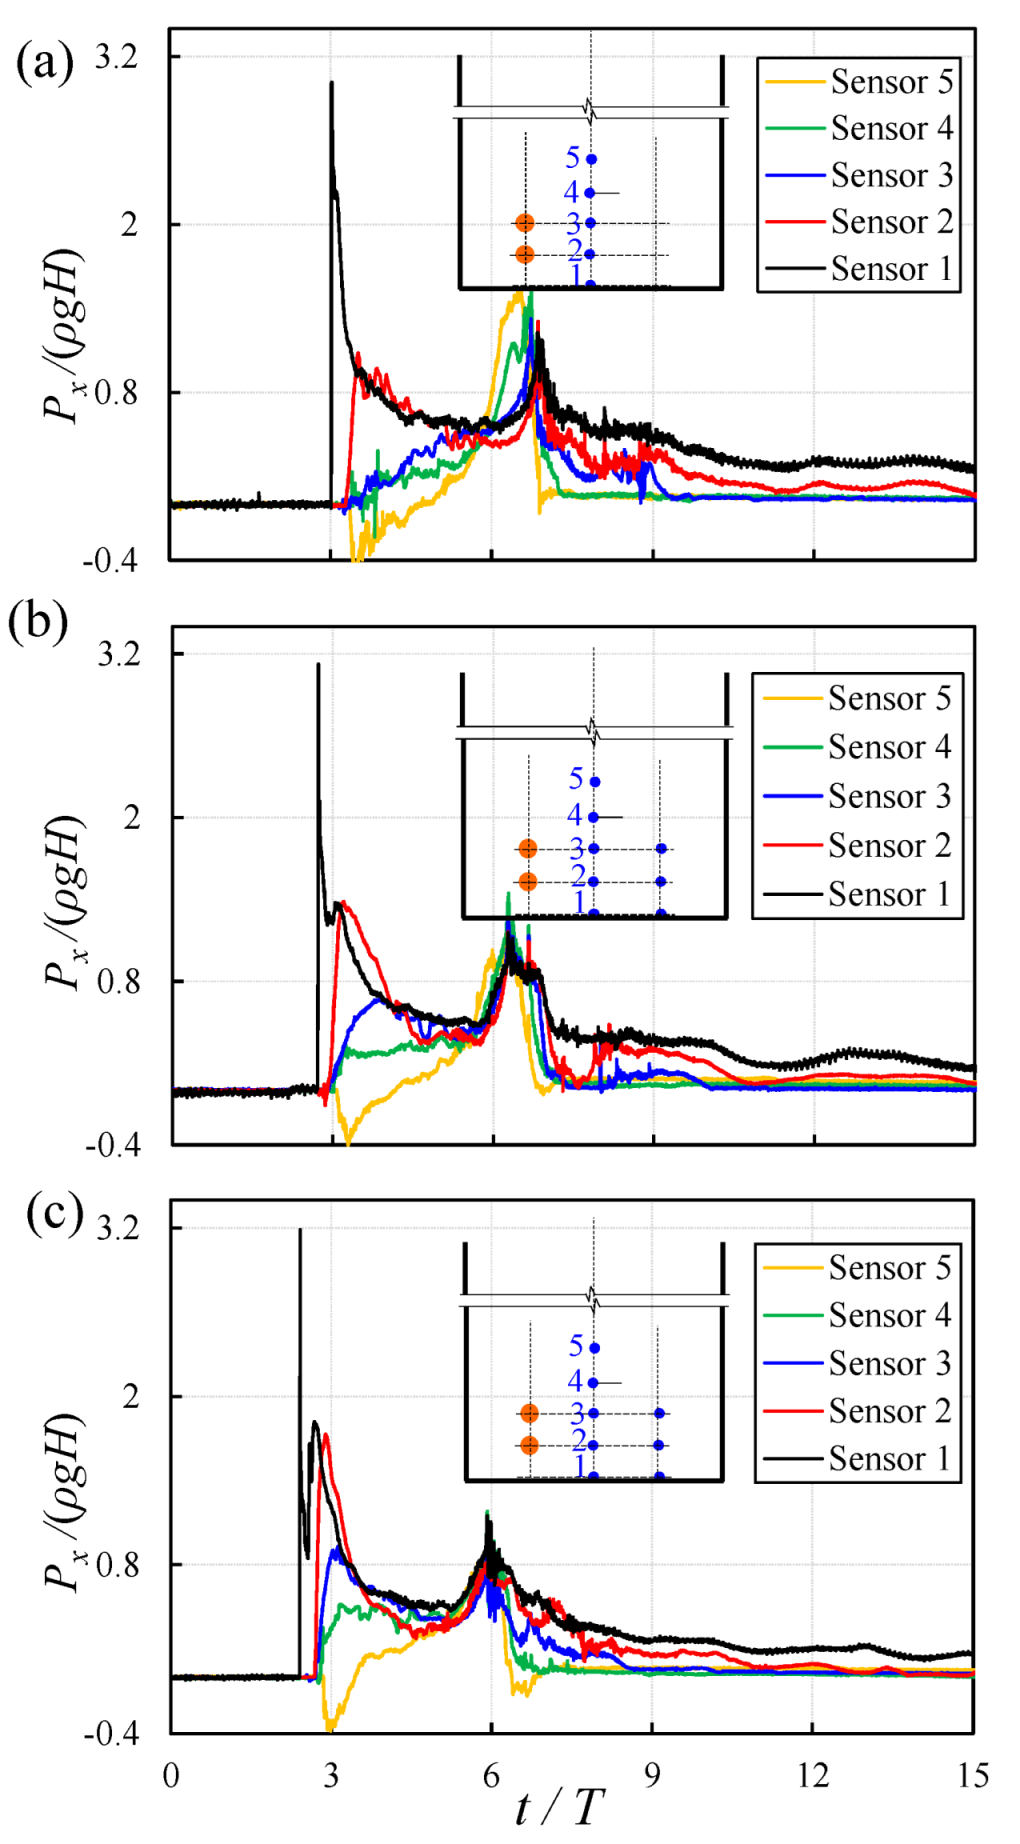
Figure 7 show the time-histories of dynamic pressure from five micro pressure transducers and for three different impoundment depths, with H = 200 mm, 250 mm, and 300 mm in Figure 7a, Figure 7b, and Figure 7c, respectively. The pressure transducers were installed in the centerline of a vertical wall and at five different heights from the bed upward. At the initial impact, the pressure data of the transducer closest to the bed immediately reached the first peak and rapidly decreased afterwards for all three cases. However, a small but sudden pressure spike after the peak around 0.41 s was observed for the surge generated by the higher impoundment depths, H = 250 mm and H = 300 mm, as shown in Figure 7b,c. Such pressure spikes were also found in the experimental observations of Nouri et al. [9] and Kamra et al. [19]. The peak dynamic pressure at the bed level transducer occurred due to the surge front impact onto the wall. Immediately after the first impact, the surge front was diverted vertically along the wall, and the horizontal pressure decreased. At this instant, the inertia of the remaining volume of water moving toward the wall generated a pressure wave, which resulted in a spike following the peak pressure. The current observations indicated that the magnitude of the spike was correlated with the volume of water and thus impoundment depth. As shown in Figure 7c, the magnitude of the pressure spike was slightly higher than 5 kPa for H = 300 mm whereas for H = 250 mm, the pressure spike was around 3 kPa.
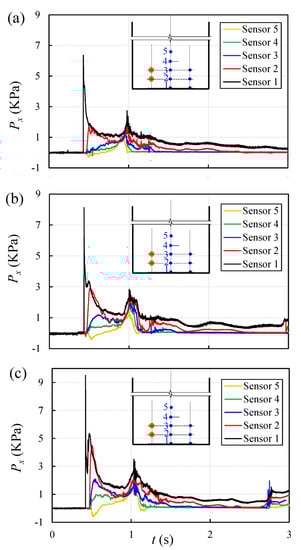
Figure 7.
Time-history of the horizontal dynamic pressure at different elevations along the vertical wall: (a) H = 200 mm; (b) H = 250 mm; (c) H = 300 mm.
The transducer closest to the flume bed recorded the highest dynamic pressure compared to the other transducers located at higher elevations on the wall. After the first pressure peak, the dynamic pressures of transducers 1 and 2 dropped and reached a plateau between 0.6 s and 0.8 s in all the three cases and also for transducer 3 in H = 250 mm and 300 mm cases. The second pressure peak increasing dynamic pressure was observed at transducers 4 and 5 from the initial impact until the second peak, which occurred during the downward and falling phase of the water tongue. This reduced the impact effects on the still advancing water surge, which continued to advance towards the wall. Negative pressure signals were recorded by the top transducer 5 at the initial interaction with runup wave. The formation of negative pressures was due to the suction effects generated the vertical motion of wave runup. The magnitude of the negative pressure increased with increasing impoundment depth. Afterwards, the wave broke and propagation slowed down; thus, dynamic pressure reached the quasi-steady state.
To investigate the relationship between dynamic pressure and initial hydrostatic pressure, pressure data were normalized with the initial static pressure, and the results were plotted using a non-dimensionalized time. Figure 8 show the experimental results in the form of normalized pressure and time for different reservoir depths of H = 200 m, 250 mm, and 300 mm. Transducer 1 experienced the largest pressure with values of 3.01, 3.12, and 3.18 times larger than the initial hydrostatic pressure for H = 200 mm, 250 mm, and 300 mm, respectively. The non-dimensional dynamic pressures in other transducers and for all impoundment depths were approximately below 1.5. After the second pressure peak, transducers 1 and 2 had only shown non-zero pressure, while the non-dimensional pressure in other transducers was close to zero. This indicated that all transducers, except transducers 1 and 2, were exposed to the atmosphere. The non-dimensional pressure data from transducer 1 showed that the dynamic pressures were equivalent to the initial static pressure at the reservoir, and they occurred at t/T = 6, which is consistent with observations of [12]. The pressure recorded by transducer 1 was steady after the second wave with a value between 0.51 and 0.52 of the initial static pressure, and they occurred at the non-dimensional time, t/T, between 4.3 and 5.3.
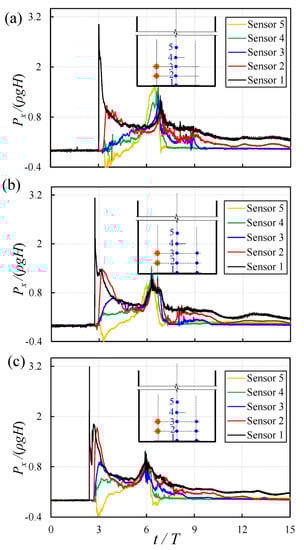
Figure 8.
Normalized horizontal dynamic pressure with non-dimensionalized time: (a) H = 200 mm; (b) H = 250 mm; (c) H = 300 mm.
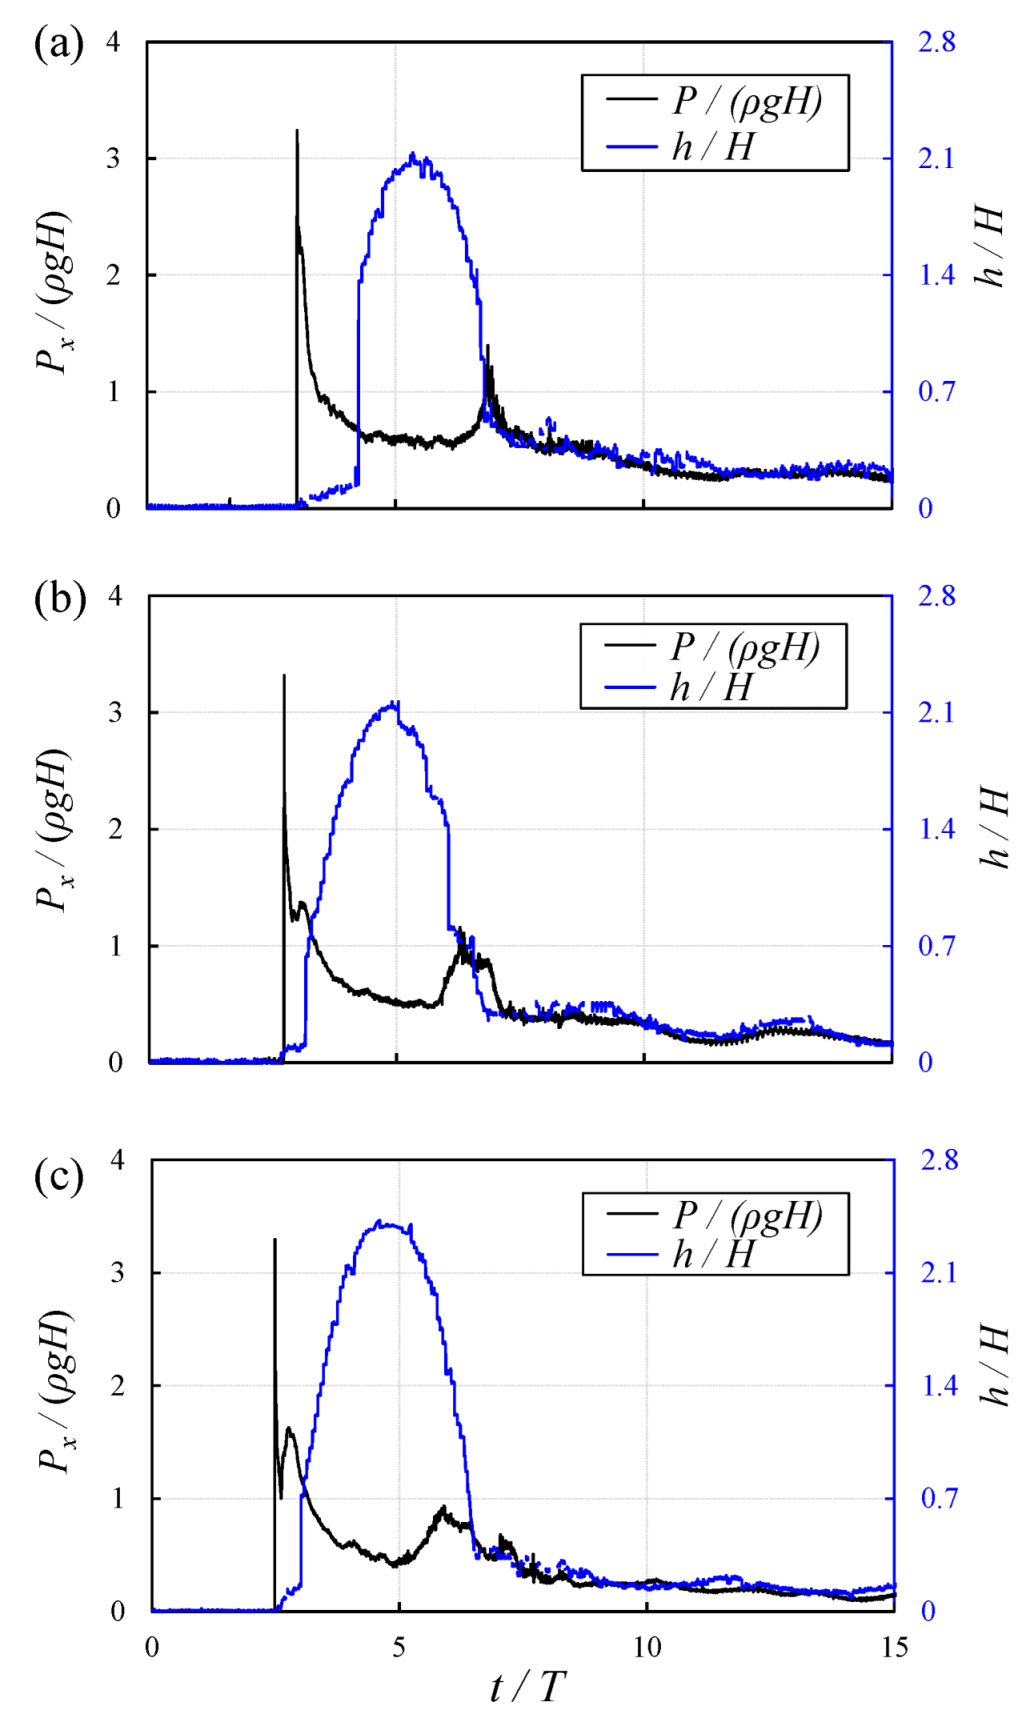
Previous experimental observations on hydrodynamic loading due to tsunami waves indicated that the maximum impact force occurred at initial impact [9,10]. Once the wavefront passes the structure, the tsunami-induced dynamic loading decreases rapidly despite the continuous propagation of the wave. Figure 9 show the correlation of the normalized dynamic pressure in the horizontal direction and surge height with time for three different impoundment depths of H = 200 mm, 250 mm, and 300 mm. The dynamic pressure instantly reached its peak value due to surge front impact, while the surge height only reached its peak afterwards. The surge runup and, over time, increasingly, the dynamic energy converted into potential energy, an observation confirmed by the reduction in flow velocity as it ran up the wall. The peak surge height reached its maximum once the pressure approached its minimum at t/T ≈ 5 (see Figure 9), as at this moment, the flow kinetic energy was fully converted into potential energy.
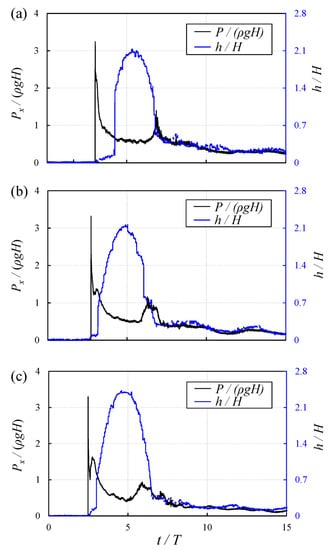
Figure 9.
Non-dimensional time-history of the horizontal dynamic pressure and surge height for different impoundment depths: (a) H = 200 m; (b) H = 250 mm; (c) H = 300 mm.
When the surge height decreased from the peak, dynamic pressure increased within a small range from its minimum value and the second pressure peak occurred around t/T = 6, with corresponding side surge view images shown in Figure 5e,f.
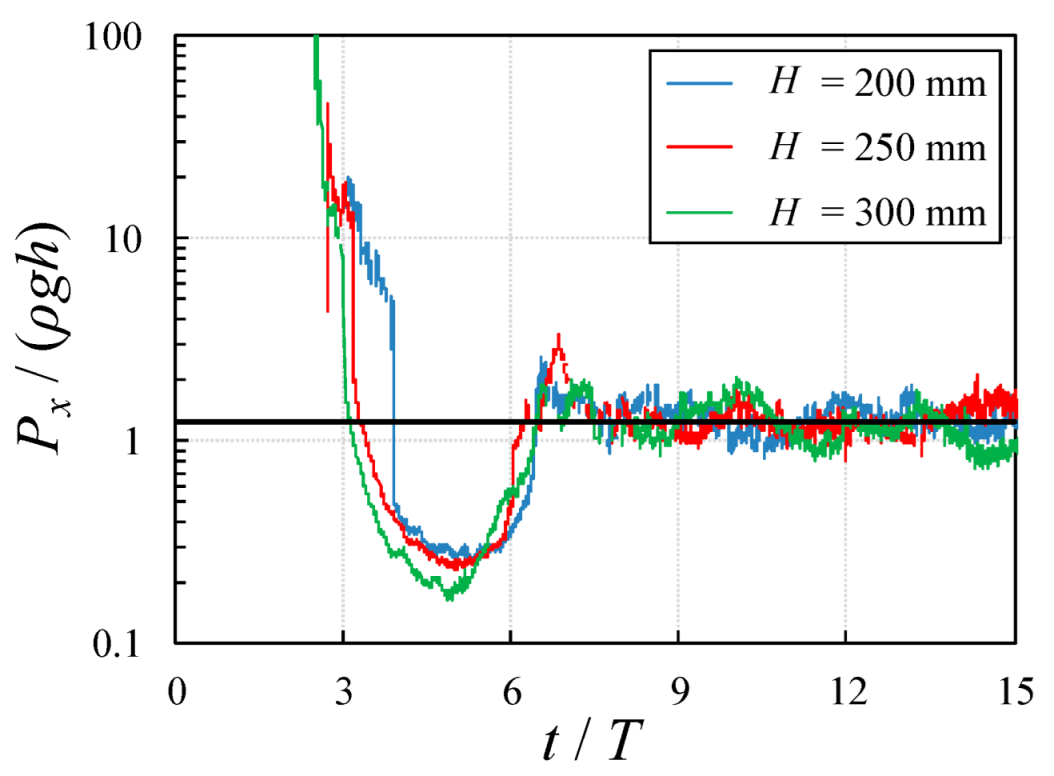
Figure 10 show the three different impoundment depths cases and the time-variable ratio of hydrodynamic pressure from transducer 1 to the instantaneous hydrostatic pressure caused by the inundation on it. For a better representation of the variation of the hydrodynamic to the hydrostatic pressure ratio, the vertical axis is logarithmic. The pressure data reached their peak values, and surge heights were nearly zero at the beginning of the tests. Therefore, the ratio of the dynamic to static pressure became infinitely large, and, as a result, the ratio data at the beginning of the tests were truncated for better data visualization.
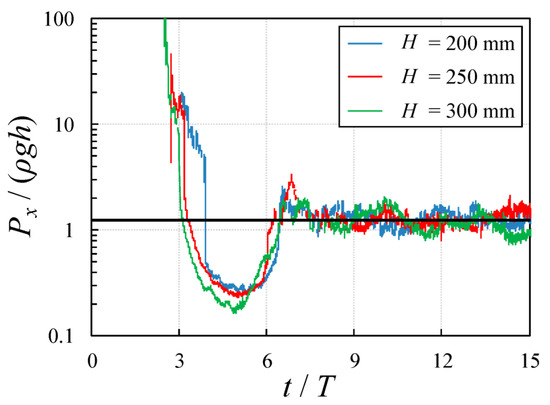
Figure 10.
Non-dimensionalized time-history of the ratio of dynamic pressure to instantaneous wave hydrostatic pressure for different impoundment depths. Pressure data from transducer 1.
The dynamic pressure was dominant at the time of impact, and it reached the equilibrium level for 3 ≤ t/T ≤ 4. It is noteworthy to mention that the ratio of dynamic to static pressure reached its minimum value at t/T = 5, and it was almost independent of impoundment depth. The minimum dynamic to static pressures ratio was between 0.15 ρgh and 0.3 ρgh. The dam-break waves reached their equilibrium at t/T = 6.5, from which the pressure in transducer 1 recorded static pressure, i.e., the second peak in the time-history of pressure data became comparable with the hydrostatic pressure (i.e., Px/(ρgH) ≈ 1). The downward acceleration of flow along the wall generated a suction force which led to the pressure drop in the horizontal direction.
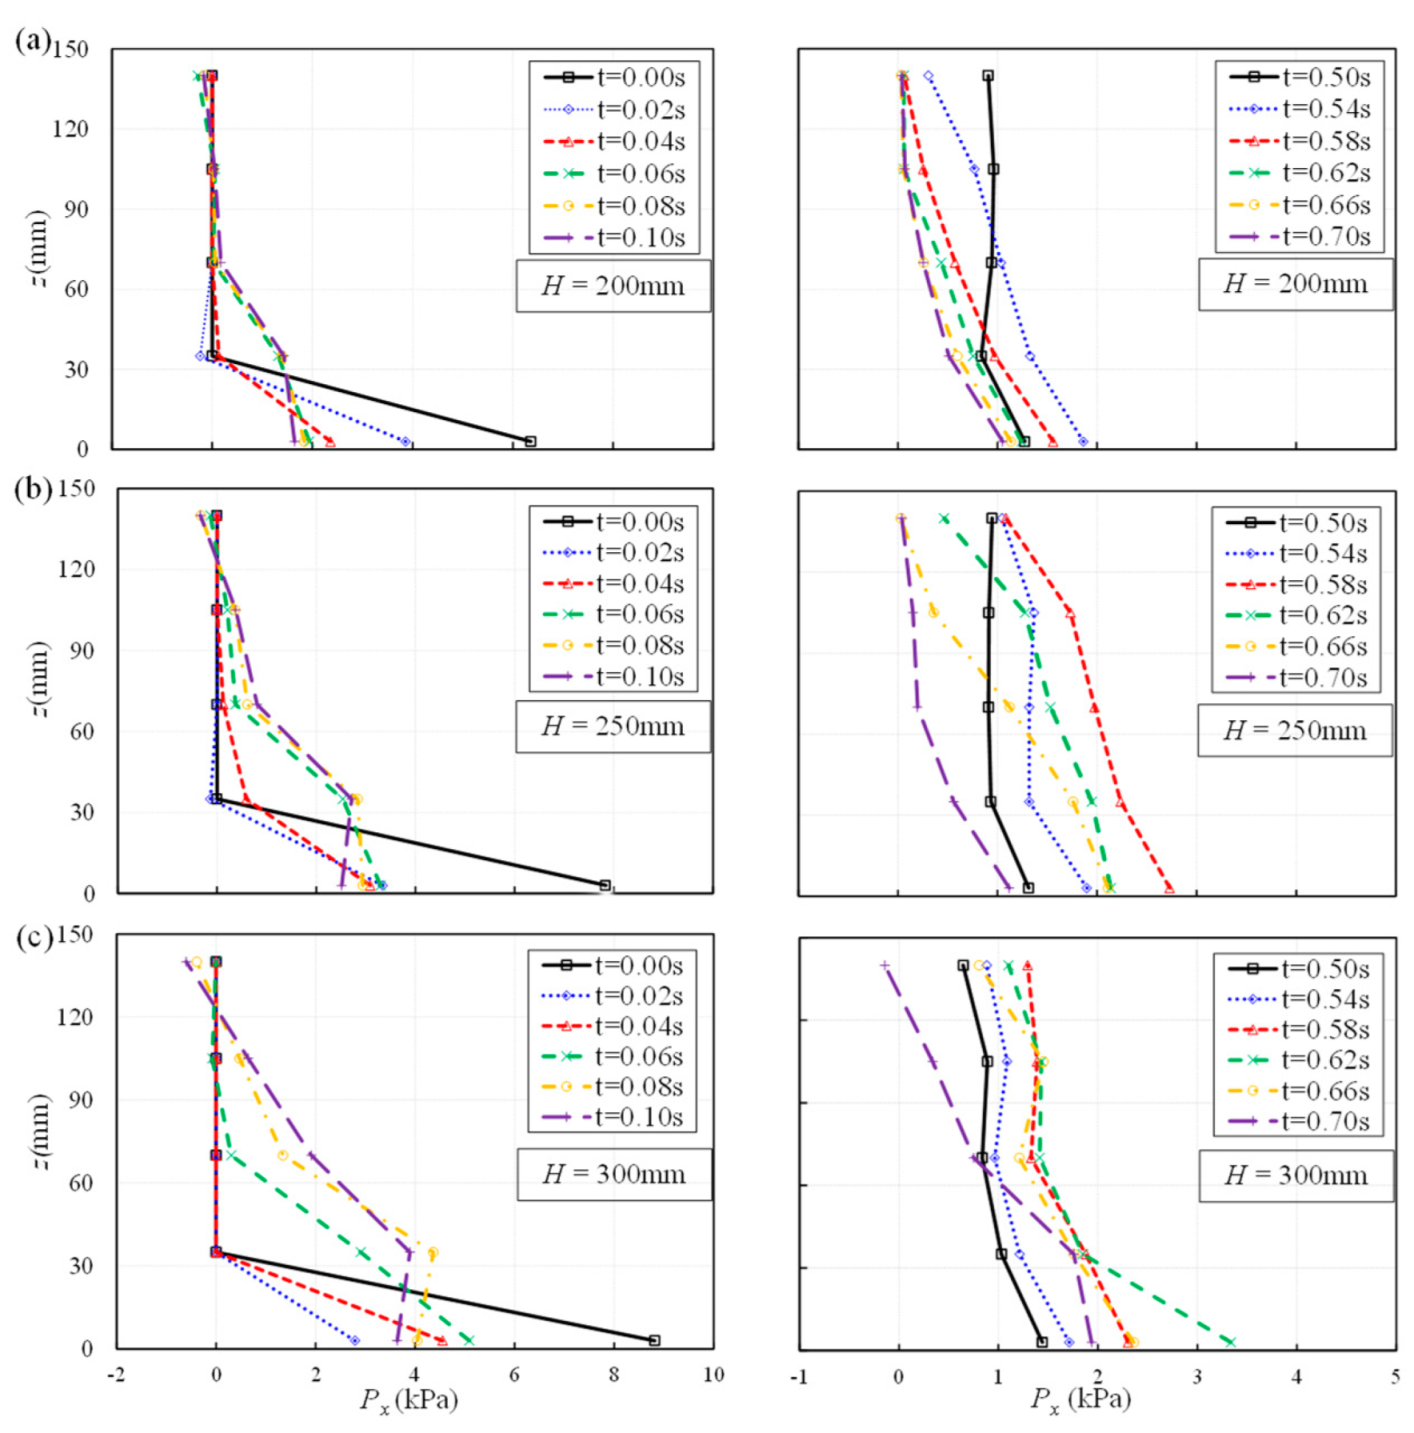
4.4. Vertical Distribution of Dynamic Pressure along the Wall
The vertical distribution of dynamic pressure along the wall can provide valuable information when structures are impacted by tsunami-induced hydrodynamic loadings. The information assists engineers in properly designing critical coastal infrastructure. The impact time was divided into two segments to study the vertical distribution of dynamic pressure along the wall. The time, tm, was selected as a time when the surge first hit the vertical wall. The first segment shows the variation of the dynamic pressure between the initial impact time (i.e., tm = 0 s) and 0.1 s after the impact. The second pressure peak occurred between tm = 0.5 s and 0.7 s after the initial impact (see Figure 7). Figure 11 show the vertical distribution of dynamic pressure for two segments of time and different impoundment depths.
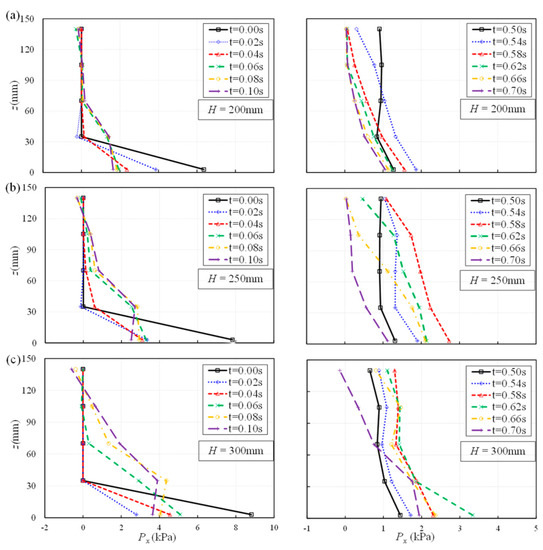
Figure 11.
Vertical distributions of the dynamic pressure on the wall around the initial impact and the second pressure peak for different impoundment depths: (a) H = 200 m; (b) H = 250 mm; (c) H = 300 mm. The tm = 0.00 s indicates the initial impact of the bore front with the vertical wall.
At H = 200 mm impoundment depth, the largest dynamic pressure that occurred in the first peak was observed close to the bottom of the tank (i.e., at transducer 1 shown in Figure 11a). From tm = 0.00 s to tm = 0.04 s, the peak pressure was at the bottom of the tank, and the bottom pressure values decreased with time. At tm = 0.06 s, the higher-level transducers recorded positive pressure values while transducers 3, 4, and 5 recorded zero pressure. Negative pressure values were recorded slightly after the initial impact, and their value increased with increasing impoundment depth. For H = 200 mm, the values of pressure at the bed decreased with time; however, for H = 250 mm, dynamic pressure values at the bed level decreased first and then increased at tm = 0.06 s. The difference between the bottom dynamic pressures was due to the spike dynamic pressure value described in Figure 4. The negative pressure in transducer 5 occurred at tm = 0.08 s and tm = 0.10 s and for higher impoundment depths. These negative pressures occurred due to the suction effect that was developed by the wave runup. Meanwhile, the pressure values at the bottom of the tank (i.e., transducer 1) dropped to around 25%, 30%, and 40% of the initial impacting pressure for H = 200 mm, 250 mm, and 300 mm, respectively.
The right column in Figure 11 show the vertical distribution of dynamic pressure in the second time segment (0.5 s ≤ tm ≤ 0.7 s). During the second time segment, a relatively uniform pressure distribution was recorded at tm = 0.5 s. Over time, the pressure distribution was changed to one similar to hydrostatic pressure distribution. As can be seen in the right column of Figure 11, the second peak pressure occurred when the maximum dynamic pressure distribution was recorded. The time to reach the peak pressure, tm, was delayed by 0.04 s when impoundment depth increased to tm = 0.54 s, 0.58 s, and 0.62 s for H = 200 mm, 250 mm, and 300 mm, respectively. A comparison between the first and second segments indicated that the pressure distributions changed less abruptly during the second time segment than the initial impact time. The spatial distribution of pressure increased before the peak pressure occurred, and it decreased after the peak pressure. For example, for a test with H = 250 mm and before the peak pressure (i.e., tm = 0.58 s), the pressure increased from tm = 0.50 s (i.e., black line) to tm = 0.54 s (i.e., blue line) and then the pressure decreased after the peak.
5. Discussion
The present experimental study demonstrated the variation between kinematic behaviors and dynamic pressure of dam-break flow impacting a vertical wall. The free surface profiles were found to be consistent with previous studies [19,26], and the ratio of maximum surge height to initial impoundment depth fitted well in a reasonable range, around 2.1–2.3, when compared with the experimental study [19] and numerical simulation [39]. Compared to the time-history of the dynamic pressures presented by Lobovsky et al. [12], it should be pointed out that the spike observed after the first peak pressure was observed in transducer 1. This was also exhibited in the experiments by Nouri et al. [9] and Kamra et al. [19]. A hypothesis was put forward that this phenomenon was caused by the pressure wave generated by the surge front during impacting. The analysis approach applied in the experimental study could be applied to investigate the loading on nearshore infrastructure.
This study provided new insight into the relationship between surge waves and the exerted dynamic pressure by dam-break flows. The authors acknowledge some limitations in their experimental study conducted in a laboratory tank with relatively small dimensions. Scale effects should be considered based on the prototype of coastal infrastructures for the design of practical engineering, which require further research.
6. Conclusions
In this experimental study, the dynamic behavior of dam-break-induced surge interactions with a vertical wall was investigated by means of pressure transducers, ultrasonic water level transducers, and video-camera images. Our conclusions are summarized as follows:
- Detailed analysis of time-history of the water surface profiles revealed four stages of surge motion during impact with a vertical wall. The four stages of wave–wall impact were (1) impact, (2) runup, (3) fallback, and (4) breaking. The recorded time-histories of the surge depth indicated that the runup depth and impact duration increased when the impoundment depth increased.
- Peak horizontal dynamic pressures were extracted from time-history for different water elevations to study the pressure distribution of the surge during the impact. It was found that the horizontal dynamic pressure at the bed was three times higher than the initial hydrostatic pressure at the reservoir location. Negative pressures generated by the suction effect generated during the fast runup were observed all the way up at the highest transducer level (i.e., z = 140 mm).
- The time lag between the horizontal dynamic pressure and surge height showed an inverse relationship between dynamic pressure and surge height curves during the impact. It was found that the horizontal dynamic pressure reached its maximum value when the wave runup height was at its minimum level. After the surge started falling off the wall and breaking at its base, on the bed, the magnitude of the dynamic pressure was close to that of the hydrostatic pressure. Additionally, a detailed analysis of the dynamic to static pressure ratio at transducer 1 showed that the normalized pressure was independent of impoundment depth.
Supplementary Materials
The following supporting information can be downloaded at: https://www.mdpi.com/article/10.3390/fluids7080258/s1.
Author Contributions
Funding acquisition, I.N. and A.M.; project concept: I.N., A.M., S.L. and A.H.A.; writing—original draft preparation, S.L.; writing—review and editing, I.N., A.M. and A.H.A. All authors have read and agreed to the published version of the manuscript.
Funding
This work was funded by the Natural Science and Engineering Research Council of Canada (NSERC Discovery Grants) of Ioan Nistor (210282) and Majid Mohammadian (210717). The first author received a scholarship from the China Scholarship Council (CSC, 201606060131), which is gratefully acknowledged.
Institutional Review Board Statement
Not applicable.
Informed Consent Statement
Not applicable.
Data Availability Statement
Data available in the Supplementary Material.
Conflicts of Interest
The authors declare no conflict of interest.
References
- Mikami, T.; Shibayama, T.; Esteban, M.; Takabatake, T.; Nakamura, R.; Nishida, Y.; Achiari, H.; Rusli, A.; Marzuki, A.G.; Marzuki, M.F.H.; et al. Field Survey of the 2018 Sulawesi Tsunami: Inundation and Run-up Heights and Damage to Coastal Communities. Pure Appl. Geophys. 2019, 176, 3291–3304. [Google Scholar] [CrossRef]
- Nistor, I.; Palermo, D.; Cornett, A.; Al-Faesly, T. Experimental and Numerical Modeling of Tsunami Loading on Structures. Coast. Eng. Proc. 2011, 1. [Google Scholar] [CrossRef] [Green Version]
- Palermo, D.; Nistor, I.; Saatcioglu, M.; Ghobarah, A. Impact and damage to structures during the 27 February 2010 Chile tsunami. Can. J. Civ. Eng. 2013, 40, 750–758. [Google Scholar] [CrossRef]
- Shibayama, A.; Kihara, N.; Miyagawa, Y.; Takabatake, D.; Kaida, H. Large Scale Experiments on Response of RC Tide Wall to Tsunami Debris Impact. In Proceedings of the Twenty-fifth International Ocean and Polar Engineering Conference, Kona, HI, USA, 21–26 June 2015. [Google Scholar]
- AAl-Faesly, T.; Palermo, D.; Nistor, I.; Cornett, A. Experimental modeling of extreme hydrodynamic forces on structural models. Int. J. Prot. Struct. 2012, 3, 477–505. [Google Scholar] [CrossRef]
- Nistor, I.; Palermo, D.; Nouri, Y.; Murty, T.; Saatcioglu, M. Tsunami-Induced Forces on Structures. In Handbook of Coastal and Ocean Engineering; Kim, Y.C., Ed.; World Scientific: Singapore, 2009; pp. 261–286. [Google Scholar]
- Wuthrich, D.; Pfister, M.; Nistor, I.; Schleiss, A.J. Experimental Study of Tsunami-Like Waves Generated with a Vertical Release Technique on Dry and Wet Beds. J. Waterw. Port Coast. Ocean. Eng. 2018, 144, 04018006. [Google Scholar] [CrossRef]
- Wuthrich, D.; Pfister, M.; Nistor, I.; Schleiss, A.J. Effect of building overtopping on induced loads during extreme hydrodynamic events. J. Hydraul. Res. 2019, 58, 289–304. [Google Scholar] [CrossRef]
- Nouri, Y.; Nistor, I.; Palermo, D.; Cornett, A. Experimental Investigation of Tsunami Impact on Free Standing Structures. Coast. Eng. J. 2010, 52, 43–70. [Google Scholar] [CrossRef]
- St-Germain, P.; Nistor, I.; Townsend, R.; Shibayama, T. Smoothed-Particle Hydrodynamics Numerical Modeling of Structures Impacted by Tsunami Bores. J. Waterw. Port Coast. Ocean. Eng. 2014, 140, 66–81. [Google Scholar] [CrossRef]
- Stolle, J.; Ghodoosipour, B.; Derschum, C.; Nistor, I.; Petriu, E.; Goseberg, N. Swing gate generated dam-break waves. J. Hydraul. Res. 2019, 57, 675–687. [Google Scholar] [CrossRef]
- Lobovsky, L.; Botia-Vera, E.; Castellana, F.; Mas-Soler, J.; Souto-Iglesias, A. Experimental investigation of dynamic pressure loads during dam break. J. Fluids Struct. 2014, 48, 407–434. [Google Scholar] [CrossRef] [Green Version]
- Häfen, H.V.; Stolle, J.; Goseberg, N.; Nistor, I. Lift and Swing Gate Modelling For Dam-break Generation with a Particle-Based Method. In Proceedings of the 7th IAHR International Symposium on Hydrolic Strcutures, Aachen, Germany, 15–18 May 2018. [Google Scholar]
- Rossetto, T.; Allsop, W.; Charvet, I.; Robinson, D.I. Physical modelling of tsunami using a new pneumatic wave generator. Coast. Eng. 2011, 58, 517–527. [Google Scholar] [CrossRef]
- Nistor, I.; Goseberg, N.; Stolle, J.; Mikami, T.; Shibayama, T.; Nakamura, R.; Matsuba, S. Experimental Investigations of Debris Dynamics over a Horizontal Plane. J. Waterw. Port Coast. Ocean. Eng. 2017, 143, 04016022. [Google Scholar] [CrossRef]
- Stolle, J.; Takabatake, T.; Hamano, G.; Ishii, H.; Iimura, K.; Shibayama, T.; Nistor, I.; Goseberg, N.; Petriu, E. Debris transport over a sloped surface in tsunami-like flow conditions. Coast. Eng. J. 2019, 61, 241–255. [Google Scholar] [CrossRef]
- Chanson, H. Tsunami Surges on Dry Coastal Plains: Application of Dam Break Wave Equations. Coast. Eng. J. 2006, 48, 355–370. [Google Scholar] [CrossRef] [Green Version]
- St-Germain, P.; Nistor, I.; Townsend, R. Numerical modeling of tsunami-induced hydrodynamic forces on onshore structures using SPH. In Proceedings of the 33rd International Coference on Coastal Engineering, Santander, Sapin, 1–6 July 2012; ASCE: Reston, VA, USA, 2012. [Google Scholar]
- Kamra, M.M.; Mohd, N.; Liu, C.; Sueyoshi, M.; Hu, C.H. Numerical and experimental investigation of three-dimensionality in the dam-break flow against a vertical wall. J. Hydrodyn. 2018, 30, 682–693. [Google Scholar] [CrossRef]
- Wuthrich, D.; Pfister, M.; Schleiss, A.J. Effect of bed roughness on tsunami-like waves and induced loads on buildings. Coast. Eng. 2019, 152, 103508. [Google Scholar] [CrossRef]
- Ritter, A. Die Fortpflanzung der Wasserwellen (The propagation of water waves). Z. Ver. Dtsch. Ing. 1892, 36, 947–954. [Google Scholar]
- Dressler, R.F. Hydraulic Resistance Effect Upon the Dam-Break Functions. J. Res. Natl. Bur. Stand. 1952, 49, 217–225. [Google Scholar] [CrossRef]
- Dressler, R.F. Comparison of theories and experiments for the hydraulic dam-break wave. Int. Assoc. Sci. Hydrol. 1954, 3, 319–328. [Google Scholar]
- Chanson, H. Application of the method of characteristics to the dam break wave problem. J. Hydraul. Res. 2009, 47, 41–49. [Google Scholar] [CrossRef] [Green Version]
- Martin, J.C.; Moyce, W.J. An Experimental Study of the Collapse of Liquid Columns on a Rigid Horizontal Plane. Philos. Trans. R. Soc. Lond. Ser. Math. Phys. Sci. 1952, 244, 312–324. [Google Scholar]
- Hu, C.H.; Sueyoshi, M. Numerical Simulation and Experiment on Dam Break Problem. J. Mar. Sci. Appl. 2010, 9, 109–114. [Google Scholar] [CrossRef]
- Hernández-Fontes, J.V.; Vitola, M.A.; Silva, M.C.; Esperança, P.d.T.T.; Sphaier, S.H. On the Generation of Isolated Green Water Events Using Wet Dam-Break. J. Offshore Mech. Arct. Eng. 2018, 140, 051101. [Google Scholar] [CrossRef]
- Hernández-Fontes, J.V.; Esperança, P.d.T.T.; Graniel, J.F.B.; Sphaier, S.H.; Silva, R. Green Water on A Fixed Structure Due to Incident Bores: Guidelines and Database for Model Validations Regarding Flow Evolution. Water 2019, 11, 2584. [Google Scholar] [CrossRef] [Green Version]
- Hernández-Fontes, J.V.; Vitola, M.A.; Esperança, P.T.T.; Sphaier, S.H.; Silva, R. Patterns and vertical loads in water shipping in systematic wet dam-break experiments. Ocean. Eng. 2020, 197, 106891. [Google Scholar] [CrossRef]
- Hernández-Fontes, J.V.; Esperança, P.T.T.; Silva, R.; Mendoza, E.; Sphaier, S.H. Violent water-structure interaction: Overtopping features and vertical loads on a fixed structure due to broken incident flows. Mar. Struct. 2020, 74, 102816. [Google Scholar] [CrossRef]
- Soares-Frazao, S.; Zech, Y. Experimental study of dam-break flow against an isolated obstacle. J. Hydraul. Res. 2007, 45, 27–36. [Google Scholar] [CrossRef]
- Soares-Frazao, S.; Canelas, R.; Cao, Z.X.; Cea, L.; Chaudhry, H.M.; Moran, A.D.; El Kadi, K.; Ferreira, R.; Cadorniga, I.F.; Gonzalez-Ramirez, N.; et al. Dam-break flows over mobile beds: Experiments and benchmark tests for numerical models. J. Hydraul. Res. 2012, 50, 364–375. [Google Scholar] [CrossRef]
- Kleefsman, K.M.T.; Fekken, G.; Veldman, A.E.P.; Iwanowski, B.; Buchner, B. A Volume-of-Fluid based simulation method for wave impact problems. J. Comput. Phys. 2005, 206, 363–393. [Google Scholar] [CrossRef] [Green Version]
- Wüthrich, D.; Pfister, M.; Schleiss, A. Example of wave impact on a residential house. In Sustainable Hydraulics in the Era of Globle Change. In Proceedings of the 4th IAHR European Congress, Liege, Belgium, 27–29 July 2016; CRC Press: Boca Raton, FL, USA, 2016. [Google Scholar]
- Karunya, R.; Rebeca Roldan, G.; Hocine, O.; Stefan, S.; Matthias, K.; Koen Van, D.; Julien De, R.; Tom, V.; Koen, T. Loading of Vertical Walls by Overtopping Bores using Pressure and Force Sensors—A Large Scale Model Study. In Proceedings of the Coastal Engineering Proceedings, Santander, Spain, 1–6 July 2012; ASCE: Reston, VA, USA, 2012. [Google Scholar]
- Wuthrich, D.; Pfister, M.; Nistor, I.; Schleiss, A.J. Experimental study on forces exerted on buildings with openings due to extreme hydrodynamic events. Coast. Eng. 2018, 140, 72–86. [Google Scholar] [CrossRef]
- Lee, T.H.; Zhou, Z.Q.; Cao, Y.S. Numerical simulations of hydraulic jumps in water sloshing and water impact. J. Fluids Eng. 2002, 124, 215–226. [Google Scholar] [CrossRef]
- Kocaman, S.; Ozmen-Cagatay, H. The effect of lateral channel contraction on dam break flows: Laboratory experiment. J. Hydrol. 2012, 432, 145–153. [Google Scholar] [CrossRef]
- Liu, S.; Nistor, I.; Mohammadian, M. Evaluation of the Solid Boundary Treatment Methods in SPH. Int. J. Ocean. Coast. Eng. 2018, 1, 1840002. [Google Scholar] [CrossRef]
- Lauber, G.; Hager, W.H. Experiments to dambreak wave: Horizontal channel. J. Hydraul. Res. 1998, 36, 291–307. [Google Scholar] [CrossRef]
- Kim, S.-Y.; Kim, K.-H.; Kim, Y. Comparative study on pressure sensors for sloshing experiment. Ocean. Eng. 2015, 94, 199–212. [Google Scholar] [CrossRef] [Green Version]
- Okada, T.; Sugano, T.; Ishikawa, T.; Ohgi, T.; Takai, S.; Hamabe, C. Structural Design Method of Buildings for Tsunami Resistance (SMBTR); The Building Center of Japan: Tokyo, Japan, 2005. [Google Scholar]
- Hernández, I.D.; Hernández-Fontes, J.V.; Vitola, M.A.; Silva, M.C.; Esperança, P.T.T. Water elevation measurements using binary image analysis for 2D hydrodynamic experiments. Ocean. Eng. 2018, 157, 325–338. [Google Scholar] [CrossRef]
- Kocaman, S.; Güzel, H.; Evangelista, S.; Ozmen-Cagatay, H.; Viccione, G. Experimental and Numerical Analysis of a Dam-Break Flow through Different Contraction Geometries of the Channel. Water 2020, 12, 1124. [Google Scholar] [CrossRef] [Green Version]


Publisher’s Note: MDPI stays neutral with regard to jurisdictional claims in published maps and institutional affiliations. |
© 2022 by the authors. Licensee MDPI, Basel, Switzerland. This article is an open access article distributed under the terms and conditions of the Creative Commons Attribution (CC BY) license (https://creativecommons.org/licenses/by/4.0/).