Abstract
This paper considers the artificial freezing of an argillite-like clay layer containing a NaCl salt solution in its pore space. The experimental results of the thermophysical properties of the clay with various salinities and water content in soil samples are presented. We determine the parameters of the soil freezing characteristic curves, the dependences of the specific heat capacity, and thermal conductivity based on temperature and salinity. These parameters are used in the formulation of a simple thermodynamic model for the artificial freezing of a clay layer with a single freezing pipe. The model includes diffusive transfer of heat and salt concentration, as well as salt precipitation when the eutectic point is reached. The motivation for using the simplified model is to understand the general patterns of soil freezing when considering the effect of salinity, as well as to test the proposed numerical finite-difference algorithm for solving the problem of freezing a clay layer based on the method of equivalent heat capacities. Using the algorithm, we analyzed the regularities of the redistribution of dissolved and precipitated salt in frozen soil, and also evaluated the effect of diffusive salt transfer on the numerical solution.
1. Introduction
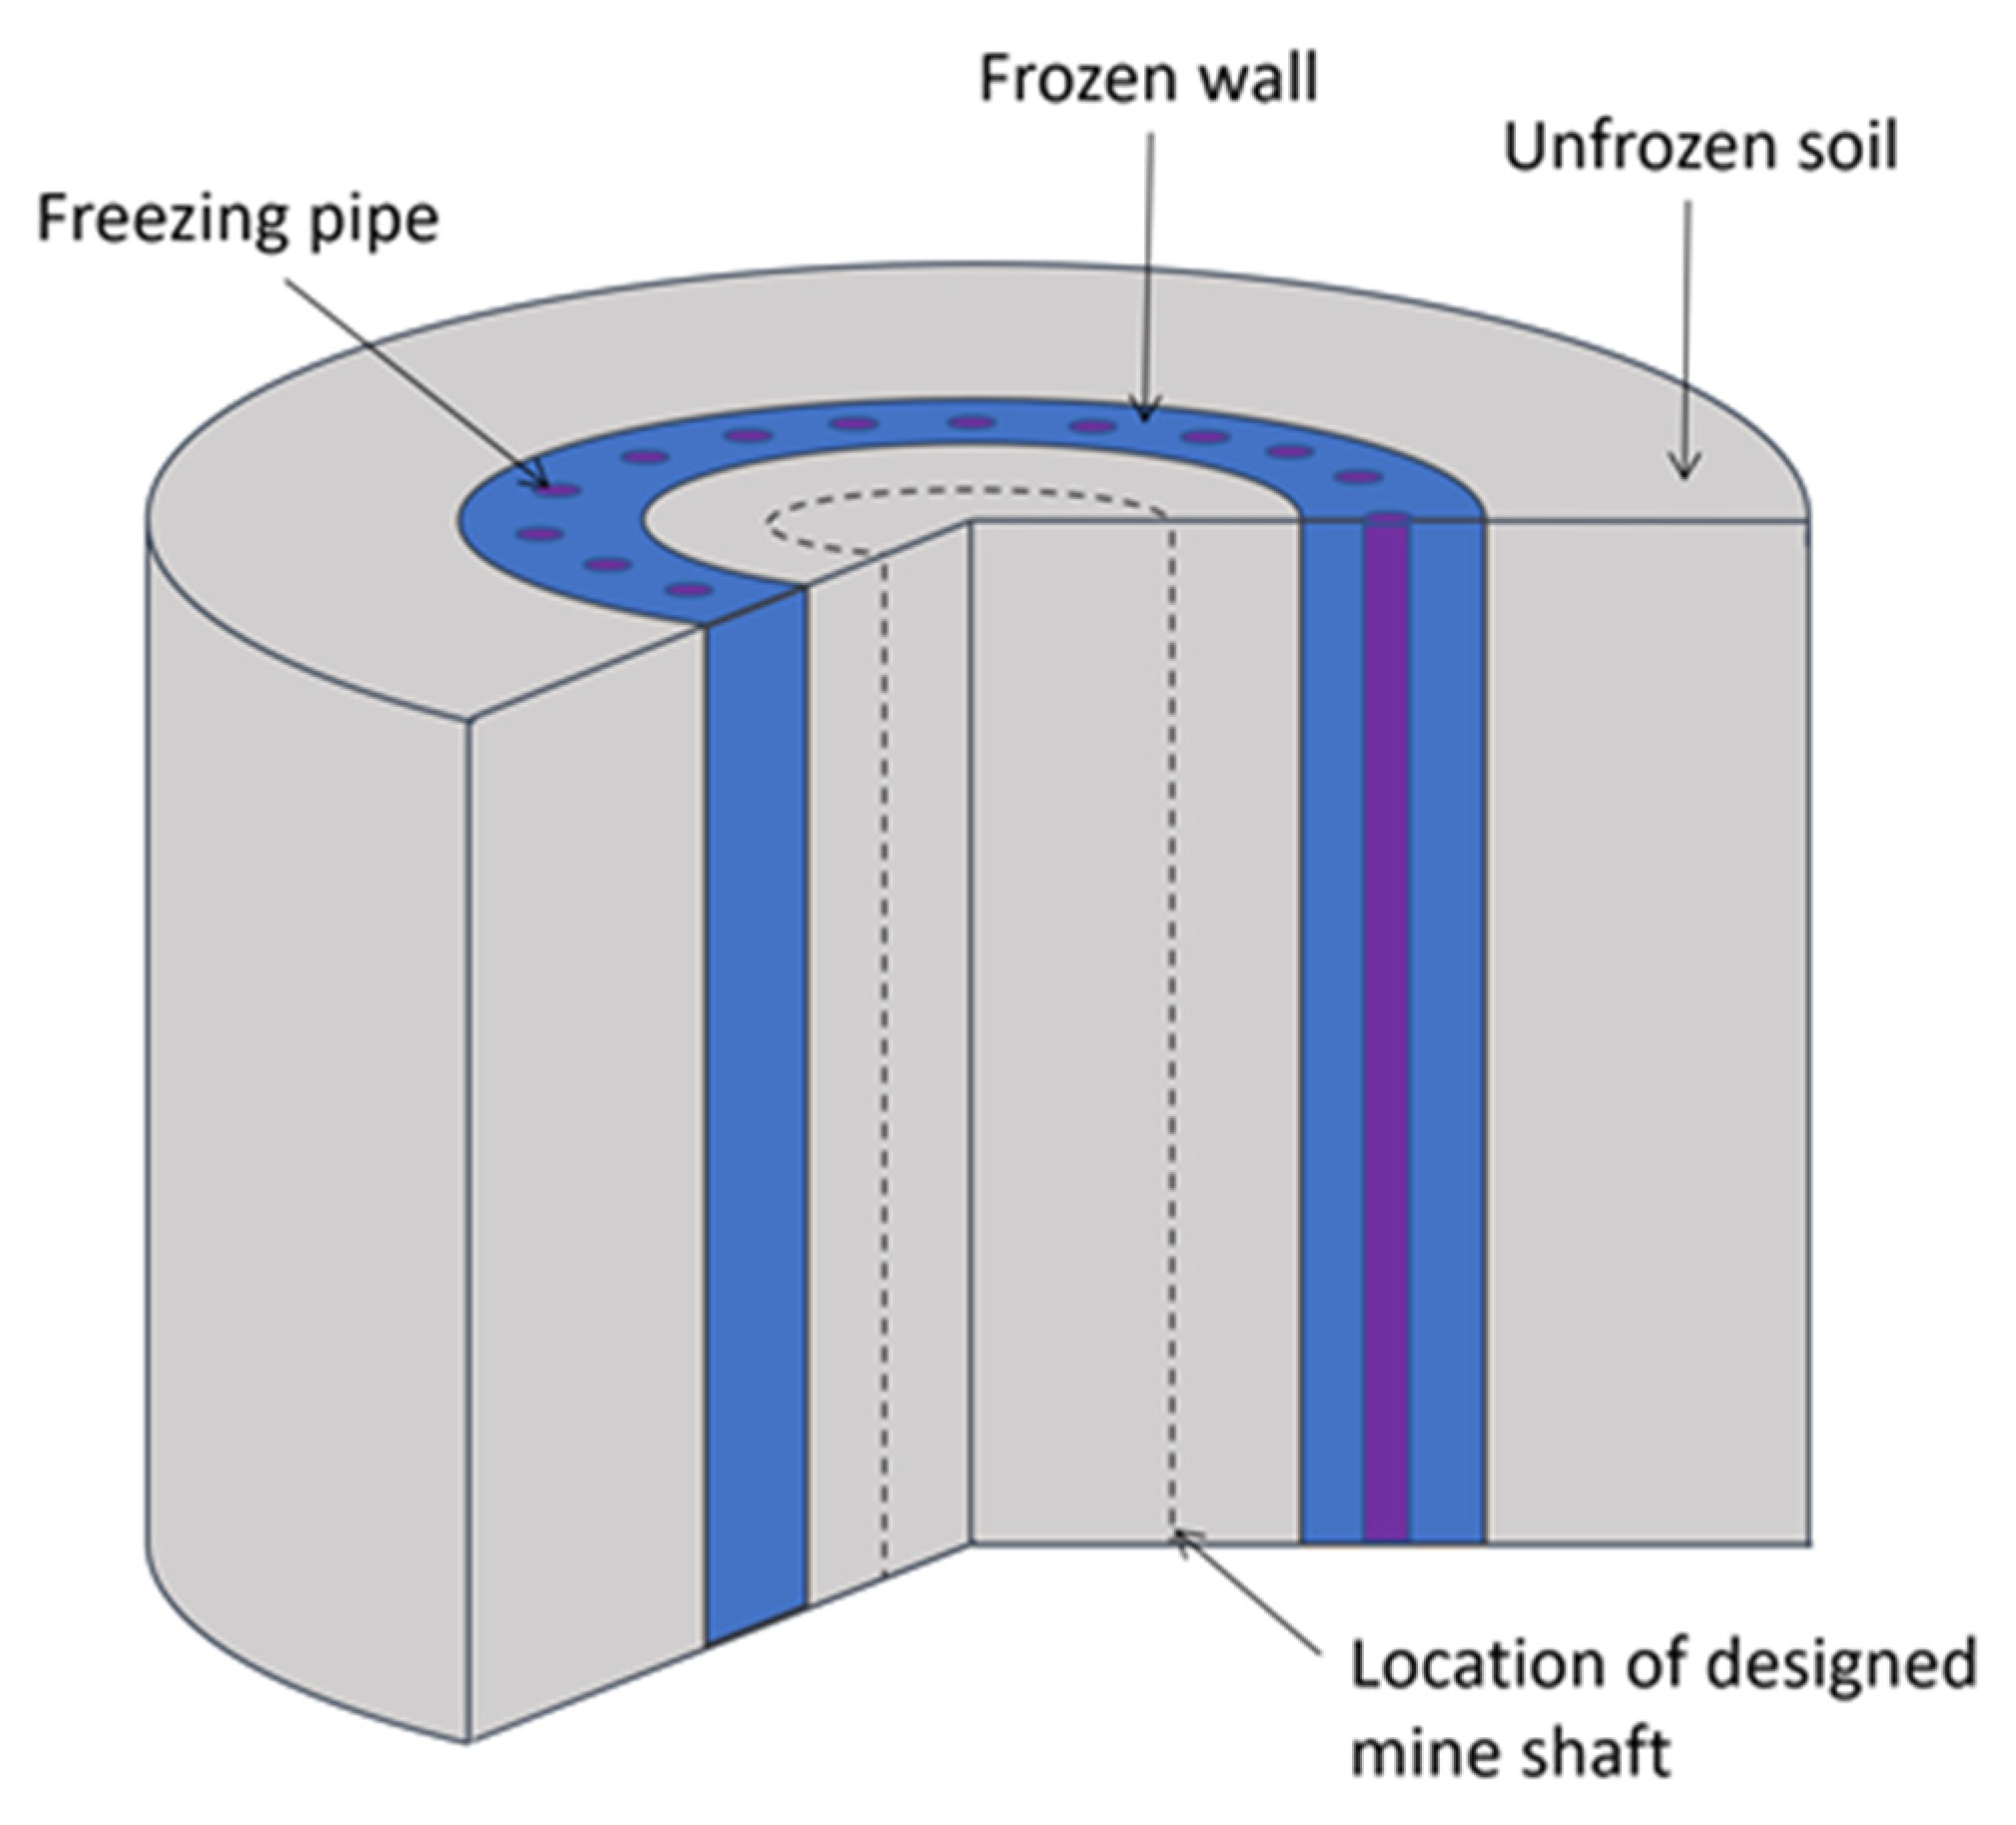
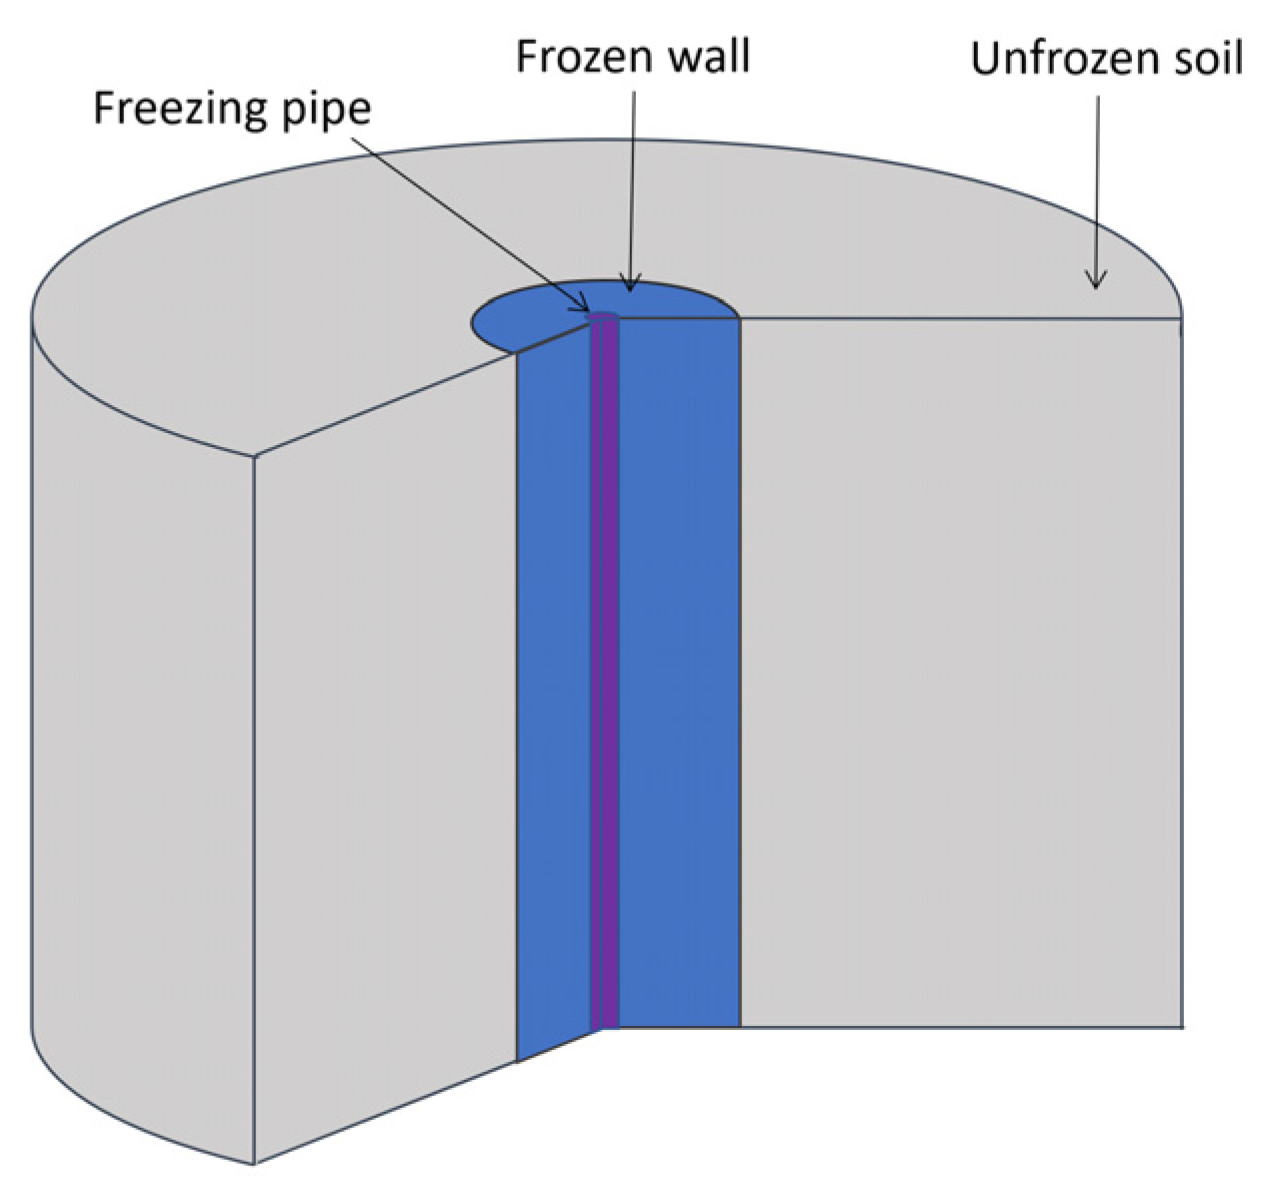
Artificial ground freezing (AGF) is a special method for the construction of mine shafts and subway tunnels in water-bearing strata [1]. The purpose of AGF is to form a protective frozen wall (FW) through which pore water cannot penetrate into the mine shaft or tunnel under construction (Figure 1). In addition, the FW bears the external loads from surrounding unfrozen soils and protects the shaft from being compromised or severely deformed. An important stage in the design of AGF is the simulation of heat and mass transfer processes occurring in frozen soils. This is necessary to determine the time it takes to reach the required thickness and continuity of the FW, as well as the corresponding parameters of the refrigeration plant.

Figure 1.
Schematic representation of FW [3].
One of the common features of mine shaft construction in the salt deposits is the salinity of pore water in the supra-salt strata near contact with salt rocks. Although it is more common to use the term “pore solution”, we will continue to use the term “pore water” hereafter, still implying that it may contain salt. Consequently, design engineers pay special attention to the properties of pore water, including the type and degree of salinity, hardness, acidity, and aggressiveness in relation to the expected materials of the mine shaft lining, pore water flow rate and direction, pore water temperature, and the chemical composition of pore water [2].
The main adverse effect of pore water salinity is that it leads to a shift in the freezing point. Many works have been devoted to this phenomenon [4,5,6,7,8,9]. Banin et al. [4] derived equations for calculating freezing point depression. Bing et al. [5] have experimentally shown that the freezing point decreases with increasing salt content and increases with increasing water content regardless of the kind of soil. Wan et al. [6] estimated the unfrozen water content based on the soil pore size distribution. The Pitzer ion model was used here to determine water activity in a soil solution. Chuvilin et al. [7] summarized experimental data using a novel water potential method for determining the freezing point and unfrozen water content.
Several works are devoted to the freeze-thaw hysteresis phenomenon of porous media containing salts [10,11,12]. Wang et al. [10] introduced a hysteretic coefficient to quantitatively describe the freezing-thawing hysteresis. Wang et al. [11] proposed an empirical equation for estimating the freezing point of saline loess with four parameters required to be determined. Zhou et al. [12] proposed several models describing the hysteresis behavior of unfrozen water in frozen soil.
The issues of water and salt transfer during soil freezing are considered in [13,14,15,16,17]. Lui et al. [13] studied water and salt migration during both freezing and thawing of water to migrate through the bound water film. Zhang et al. [14] described an experimental study on water migration through the bound water film. It was found that for the considered soil, temperature potential plays a decisive role in water migration. Jochem and Korber [15] experimentally show solute redistribution after the freezing of sodium chloride solution. Vasiliev et al. [16] described a simple model of diffusive transport of salts in the one-dimensional case. A self-similar solution is obtained for the linearized problem of heat and salt transfer. Lucas et al. [17] studied the simultaneous heat and mass transfer in porous soil for a wide range of temperatures and concentrations. This paper also provides a good classification of various mass transfer mechanisms in saline soils.
Most of the studies focus on sodium chloride [8] and sulfate [6] salts, while Watanabe and Mizoguchi [18] discuss the effect of three common chloride salts in the pore solution, i.e., NaCl, KCl, and MgCl2, on the freezing point of silty sand and clay.
However, few studies have focused on the effects of pore water salinity on the AGF process [19,20,21,22]. The most complex coupled thermo-hydro-mechanical (THM) model, taking into account the salinity, was built [21] using a macroscopic continuum approach based on the degree of liquid saturation to track phase transition fronts and the Terzaghi effective stress concept [23,24]. The works [25,26,27] devoted to the natural freezing of soils also contain descriptions of THM models, taking into account the presence of salt in frozen soils, the effects of pore pressure, and supersaturation of the salt solution. However, these studies cannot be fully extended to the case of artificial freezing due to the distinctive features involved in the AGF process: higher temperature differences in soils, increasing rates of change in temperature and ice content over time, and higher values of the lateral and hydrostatic pressure of the FW outer boundary due to greater depth.
Therefore, identifying the features of heat and mass transfer in artificially frozen saline soils remains an urgent scientific problem. The goal of the present study is to examine the changes in thermal properties of saline soils in the process of artificial freezing. Specifically, an example of argillite-like clay is investigated. In this paper, the experimental results are presented as well as the numerical simulation results of heat transfer in artificially frozen clay using a simple model parameterized according to the experimental data.
2. Experimental Study
2.1. Methods
Argillite-like clays are often present in the freezing depth interval during the mine shaft construction in potash mines. To parameterize the mathematical model of thermal processes during AGF, it was necessary to determine the thermophysical properties of the soil, argillite-like clay, at various negative temperatures, taking into account the presence of NaCl salt in the pore space. The current studies were carried out according to the well-known method [28], using samples with disturbed structures (pastes), comprising an initial water content and density corresponding to natural samples.
For each sample, the required amount of water was determined, which had to be added to obtain a given water content. Three values of water content were considered: 0.17 kg/kg, 0.21 kg/kg, and 0.26 kg/kg. Nine soil samples were studied. The samples were taken from the core material of exploratory wells, which were drilled at the stage of engineering and geological surveys for the construction of the shafts of a potash mine in the Republic of Belarus. The depth of occurrence of argillite-like clay ranged from 160 to 180 m. This corresponds to a section of the clayey-marly substrata, which refers to the Starobinsk layers of the Polessky Horizon of the Upper Famennian Substage of the Upper Devonian (D3pl).
Soil samples 1–3, with three different water contents, contain no salt. A given mass of sodium chloride (3.46 g/100 g of water) was added to soil samples 4–6, and a larger mass of sodium chloride (6.90 g/100 g of water) was added to soil samples 7–9.
All experiments were carried out in the laboratory of Physical and Chemical Mechanics of Natural Disperse Systems in the Institute of Nature Management at the National Academy of Sciences, Belarus. A calorimeter was used to determine the specific heat capacities and, subsequently, the amounts of unfrozen water in soil samples. The operation requires adiabatic conditions, or controlled heat transfer conditions, around the calorimetric vessel with the sample under study. The temperature measurement accuracy is 0.01 °C, and the relative error in determining the phase transition heat is 1%.
To determine the thermal conductivity, a unique device was used that forms a stationary thermal regime in thawed and frozen states. The main feature of the device is the use of original heat flow sensors mounted in the metal housings of heat exchangers. This makes it possible to average the temperature field in the measurement planes and protect the heat flux and temperature sensors from mechanical and physicochemical damage. The relative error in determining the thermal conductivity was 6%.
2.2. Results
The variable amount of unfrozen water w was determined by the formula:
where Gw is the mass of water in the soil sample, kg; Gi is the ice mass, kg; and Gs is the mass of dry soil particles, kg.
The results for the amount of unfrozen water regarding the extreme values of the initial water content w0 (0.17 and 0.26 kg/kg) are presented in Table 1, as well as the amounts of unfrozen water for the complete freezing cycle. The amount of unfrozen water was measured during the freezing and thawing of soil samples. The obtained amounts of unfrozen water during freezing and thawing did not coincide, which is indicative of freeze-thaw hysteresis [29,30]. At the same time, in the problems of artificial freezing, we are primarily interested in the freezing cycle. For this reason, we present the amounts of unfrozen water for the freezing cycle in Table 1. These quantities were further analyzed in this study.

Table 1.
Measured amounts of unfrozen water (kg/kg) in argillite-like clay at different temperatures and salt concentrations.
The density of each sample was 2070 kg/m3. The specific heat capacity of the dry soil was calculated by the following formula:
where cmeas is the measured effective specific heat of a soil sample (taking into account the phase transition of pore water), J/(kg·°C); cw and ci are heat capacities of water and ice, respectively, J/(kg·°C); w0 is the initial water content in the soil sample, kg/kg; L is the specific heat of water phase transition, J/kg; ΔQmeas is the amount of heat required to supply the calorimeter so that its temperature changes by ΔT, J; ccal is the heat capacity of an empty calorimeter, J/°C; and GΣ is the total mass of the soil sample (dry soil particles + water + ice), kg.
The measured specific heat capacity of the dry soil was 769–777 J/kg for the case of distilled water without additives, 754–761 J/(kg·°C) for when the mass of sodium chloride was 3.46 g/100 g of water, and 742–751 J/(kg·°C) for when the mass of sodium chloride was 6.9 g/100 g of water.
The thermal conductivity results for the extreme values of the initial water content (0.17 and 0.26 kg/kg) are presented in Table 2. These results were used when formulating a mathematical model of thermal processes in the frozen soil.
Table 2.
Measured heat conductivities (W/(m·°C)) in argillite-like clay at different temperatures and salt concentrations.
3. Mathematical Model
The process of soil freezing using one vertical freezing pipe was modeled (Figure 2). The pipe has a cylindrical shape, a constant radius, and a sufficiently large height. It was assumed that the considered horizontal clay layer in the vertical direction is sufficiently extended in all directions, and therefore the effect of vertical heat transfer on the temperature field of the middle section of this layer is negligibly small. The temperature of the brine moving in the freezing pipe has a uniform distribution. The soil is modeled as a homogeneous and isotropic material, and heat transfer only occurs due to thermal diffusion. Water in the pore space of the soil can transit from a liquid to a solid state, which is accompanied by the release of heat. In addition, local thermodynamic equilibrium of the phases at each point of the medium was assumed. The effect of supercooling of pore water was not considered. Due to the geometric symmetry in the physical properties and in the freezing pipe, it is sufficient to consider the change in the thermophysical properties of the frozen medium in only the radial direction. In this case, the non-stationary temperature field in the clay layer is described by the energy balance equation in the following form [31,32]:
where H is the specific enthalpy of the soil, J/m3; t is the physical time, s; r is the radial coordinate, m; λ is the heat conductivity of the soil, W/(m·°C); and T is the temperature, °C.
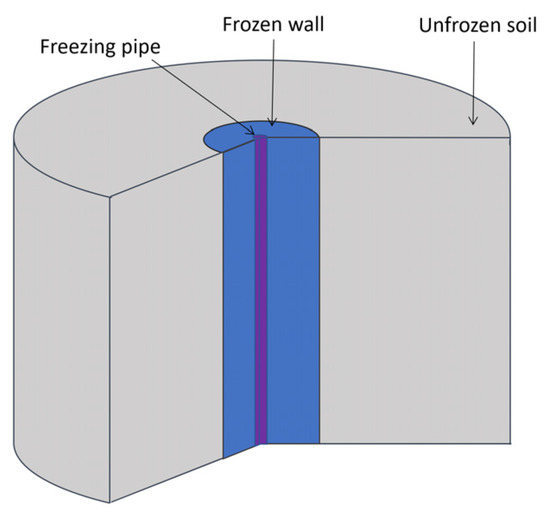
Figure 2.
Considered computational domain.
We do not consider convective heat transfer here because clays usually have relatively low, or even zero, hydraulic permeability. When considering other types of soils, such as sand, loam, marl, etc., consideration of convective heat transfer is relevant.
The specific enthalpy consists of two components, including the sensitive heat and the latent heat of the phase transition [32]:
where ρ is the density of the soil, kg/m3; cp is the specific heat capacity of the soil, J/(kg·°C); Tref is the reference temperature, °C; and γ is the volume fraction of unfrozen water, which can be determined by the empirical formula [33,34] (van Genuchten model):
where Tliq is the temperature at which pore water begins to freeze (freezing point), °C; ω is the characteristic freezing temperature associated with the most common pore radius, °C; and m is the index indicating the distribution of the pore radius relative to the average radius.
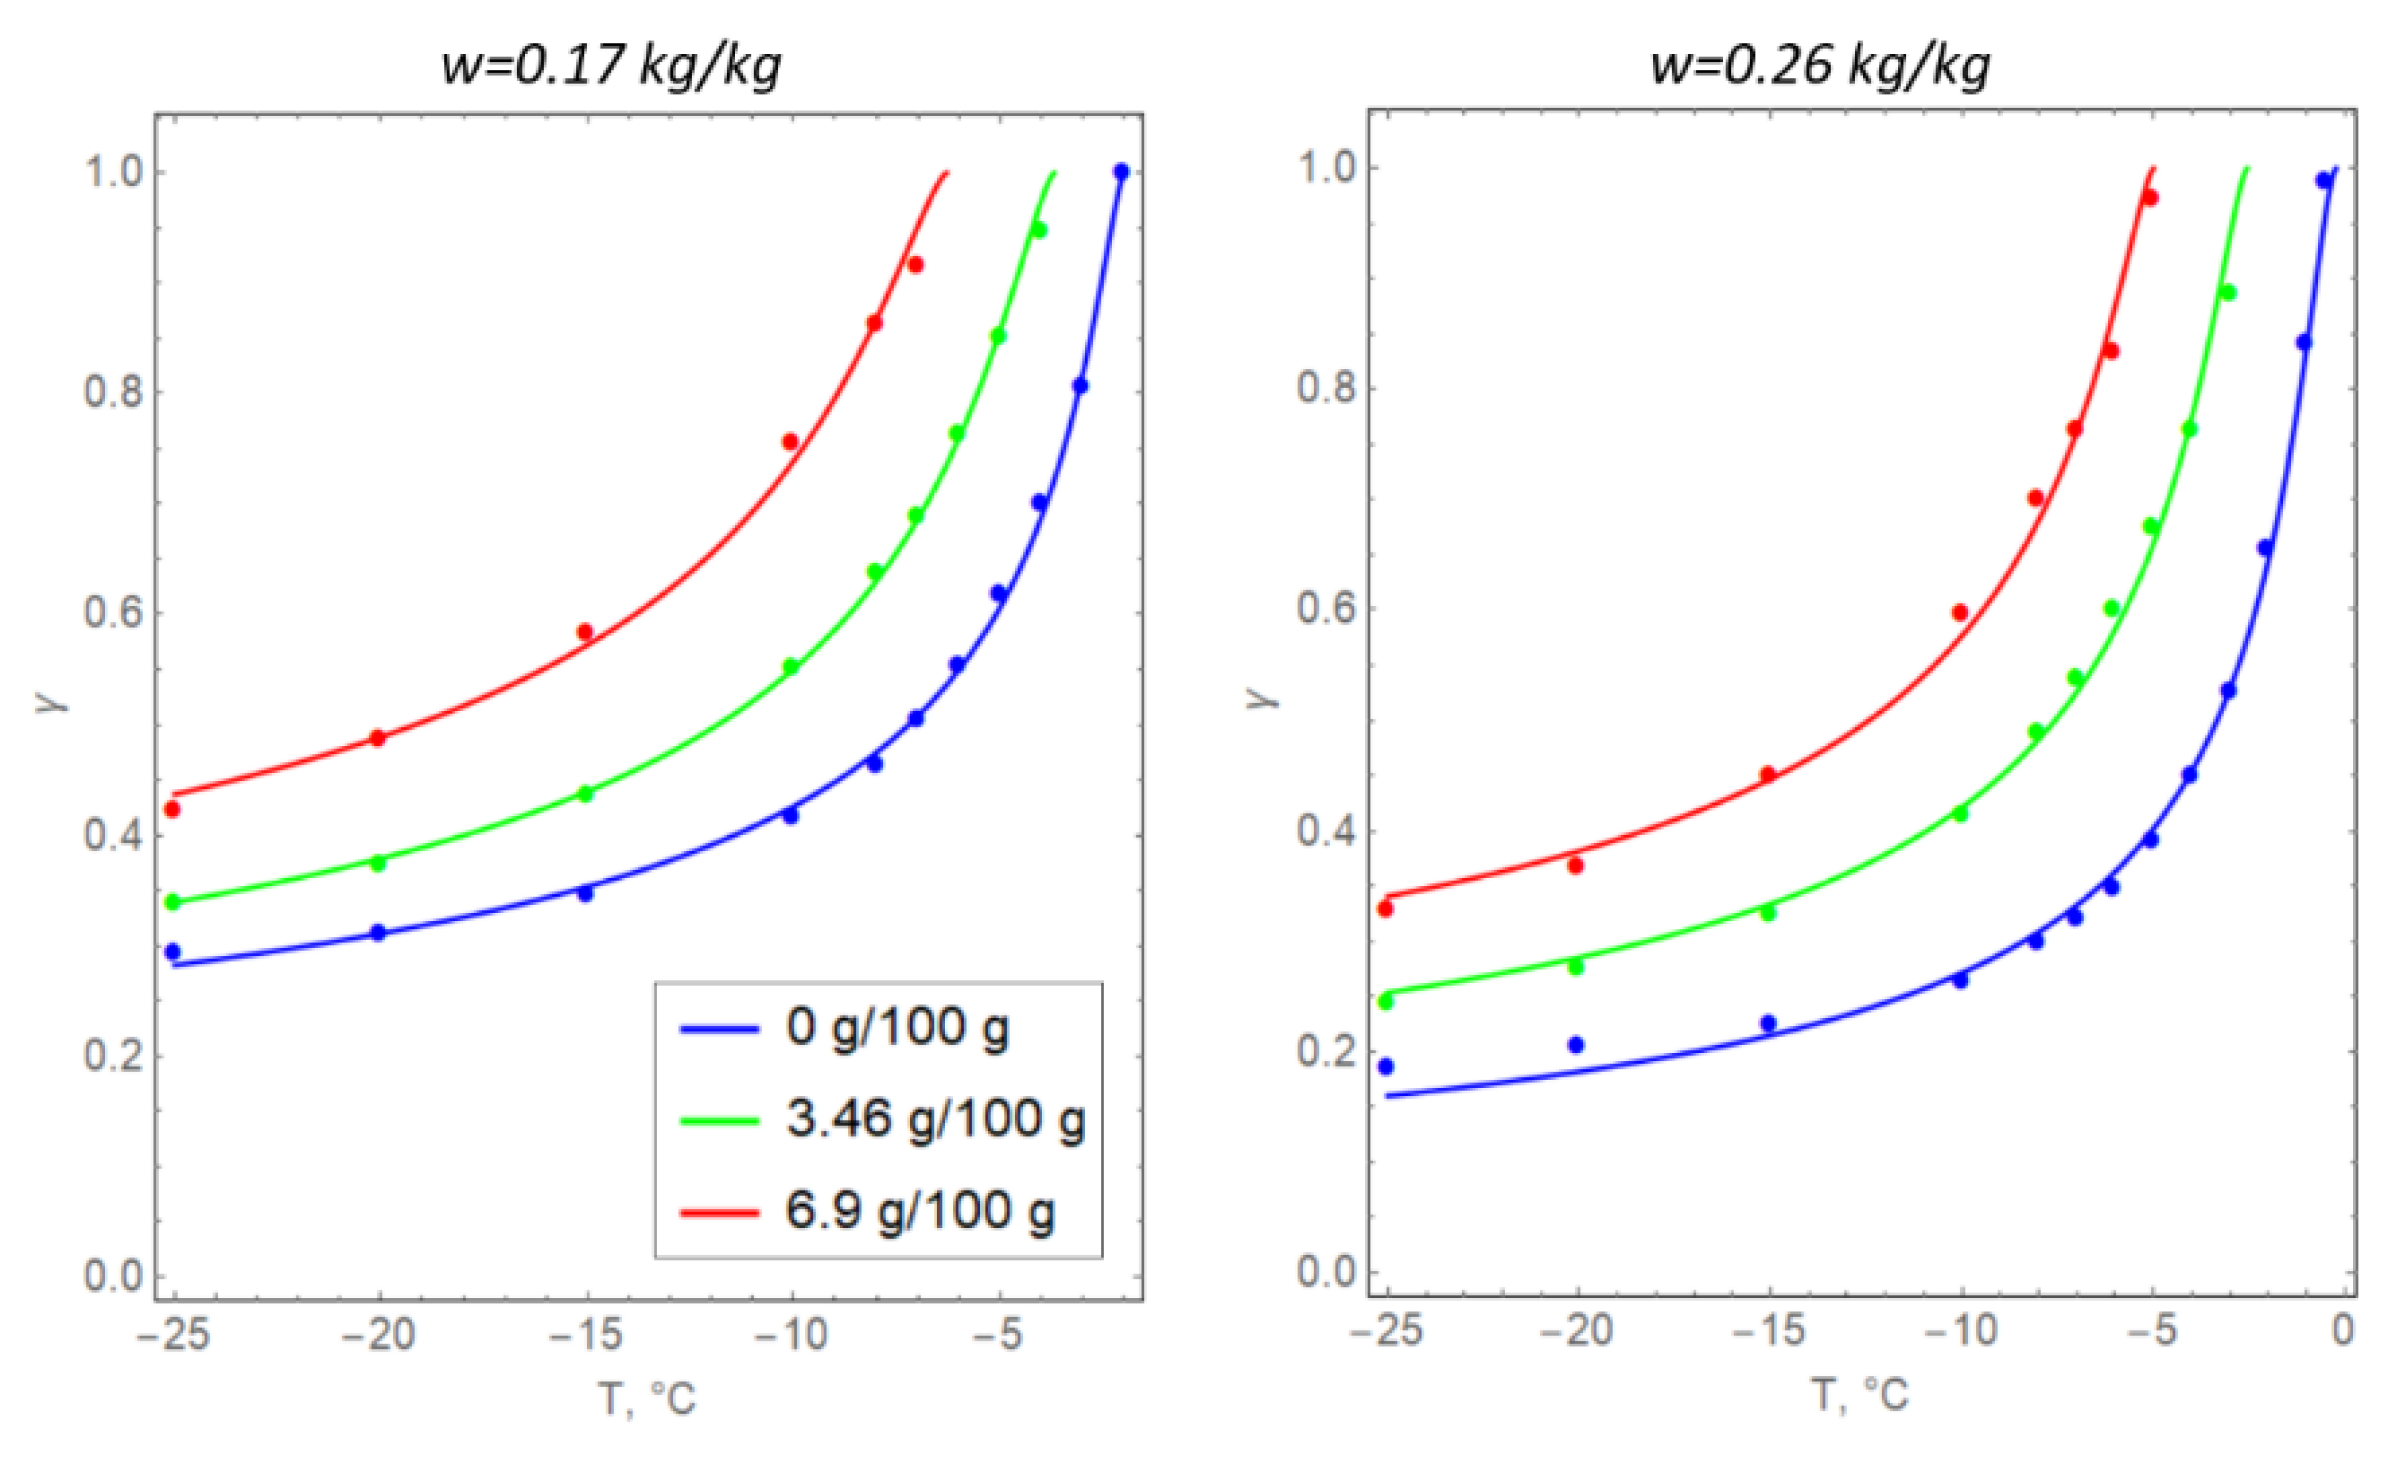
Formula (6) is usually determined from the experimental measurements of specific soil samples that are subject to artificial freezing [35]. In the present study, the values for the parameters in Formula (6) were selected based on the data in Table 1, including the initial moisture content w0 (converted to the volume fraction of unfrozen water) and clay salinity s (Figure 3). The unit of measurement of soil salinity is grams of NaCl per 100 g of water.
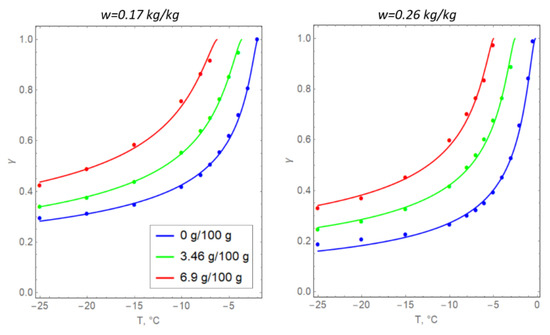
Figure 3.
Temperature dependences of the volume fraction of unfrozen water in argillite-like clay samples: solid lines represent theoretical dependence (6) and dots represent the experimental data.
The temperature dependences of the volume fraction of unfrozen water were used to determine the dependences for specific heat capacity and thermal conductivity [36,37]:
where n is the porosity; the index “s” corresponds to dry soil particles; the index “w” corresponds to water; and the index “i” corresponds to ice.
Theoretical Formulas (7) and (8) assume that the dependence of the specific heat capacity and thermal conductivity on the pore water salinity is realized indirectly through the volume fraction of unfrozen water γ and the initial water content w0 of soil samples. That is, we use the hypothesis that the salt content in the pore water is considered too low to directly affect the specific heat capacity and thermal conductivity of the soils.
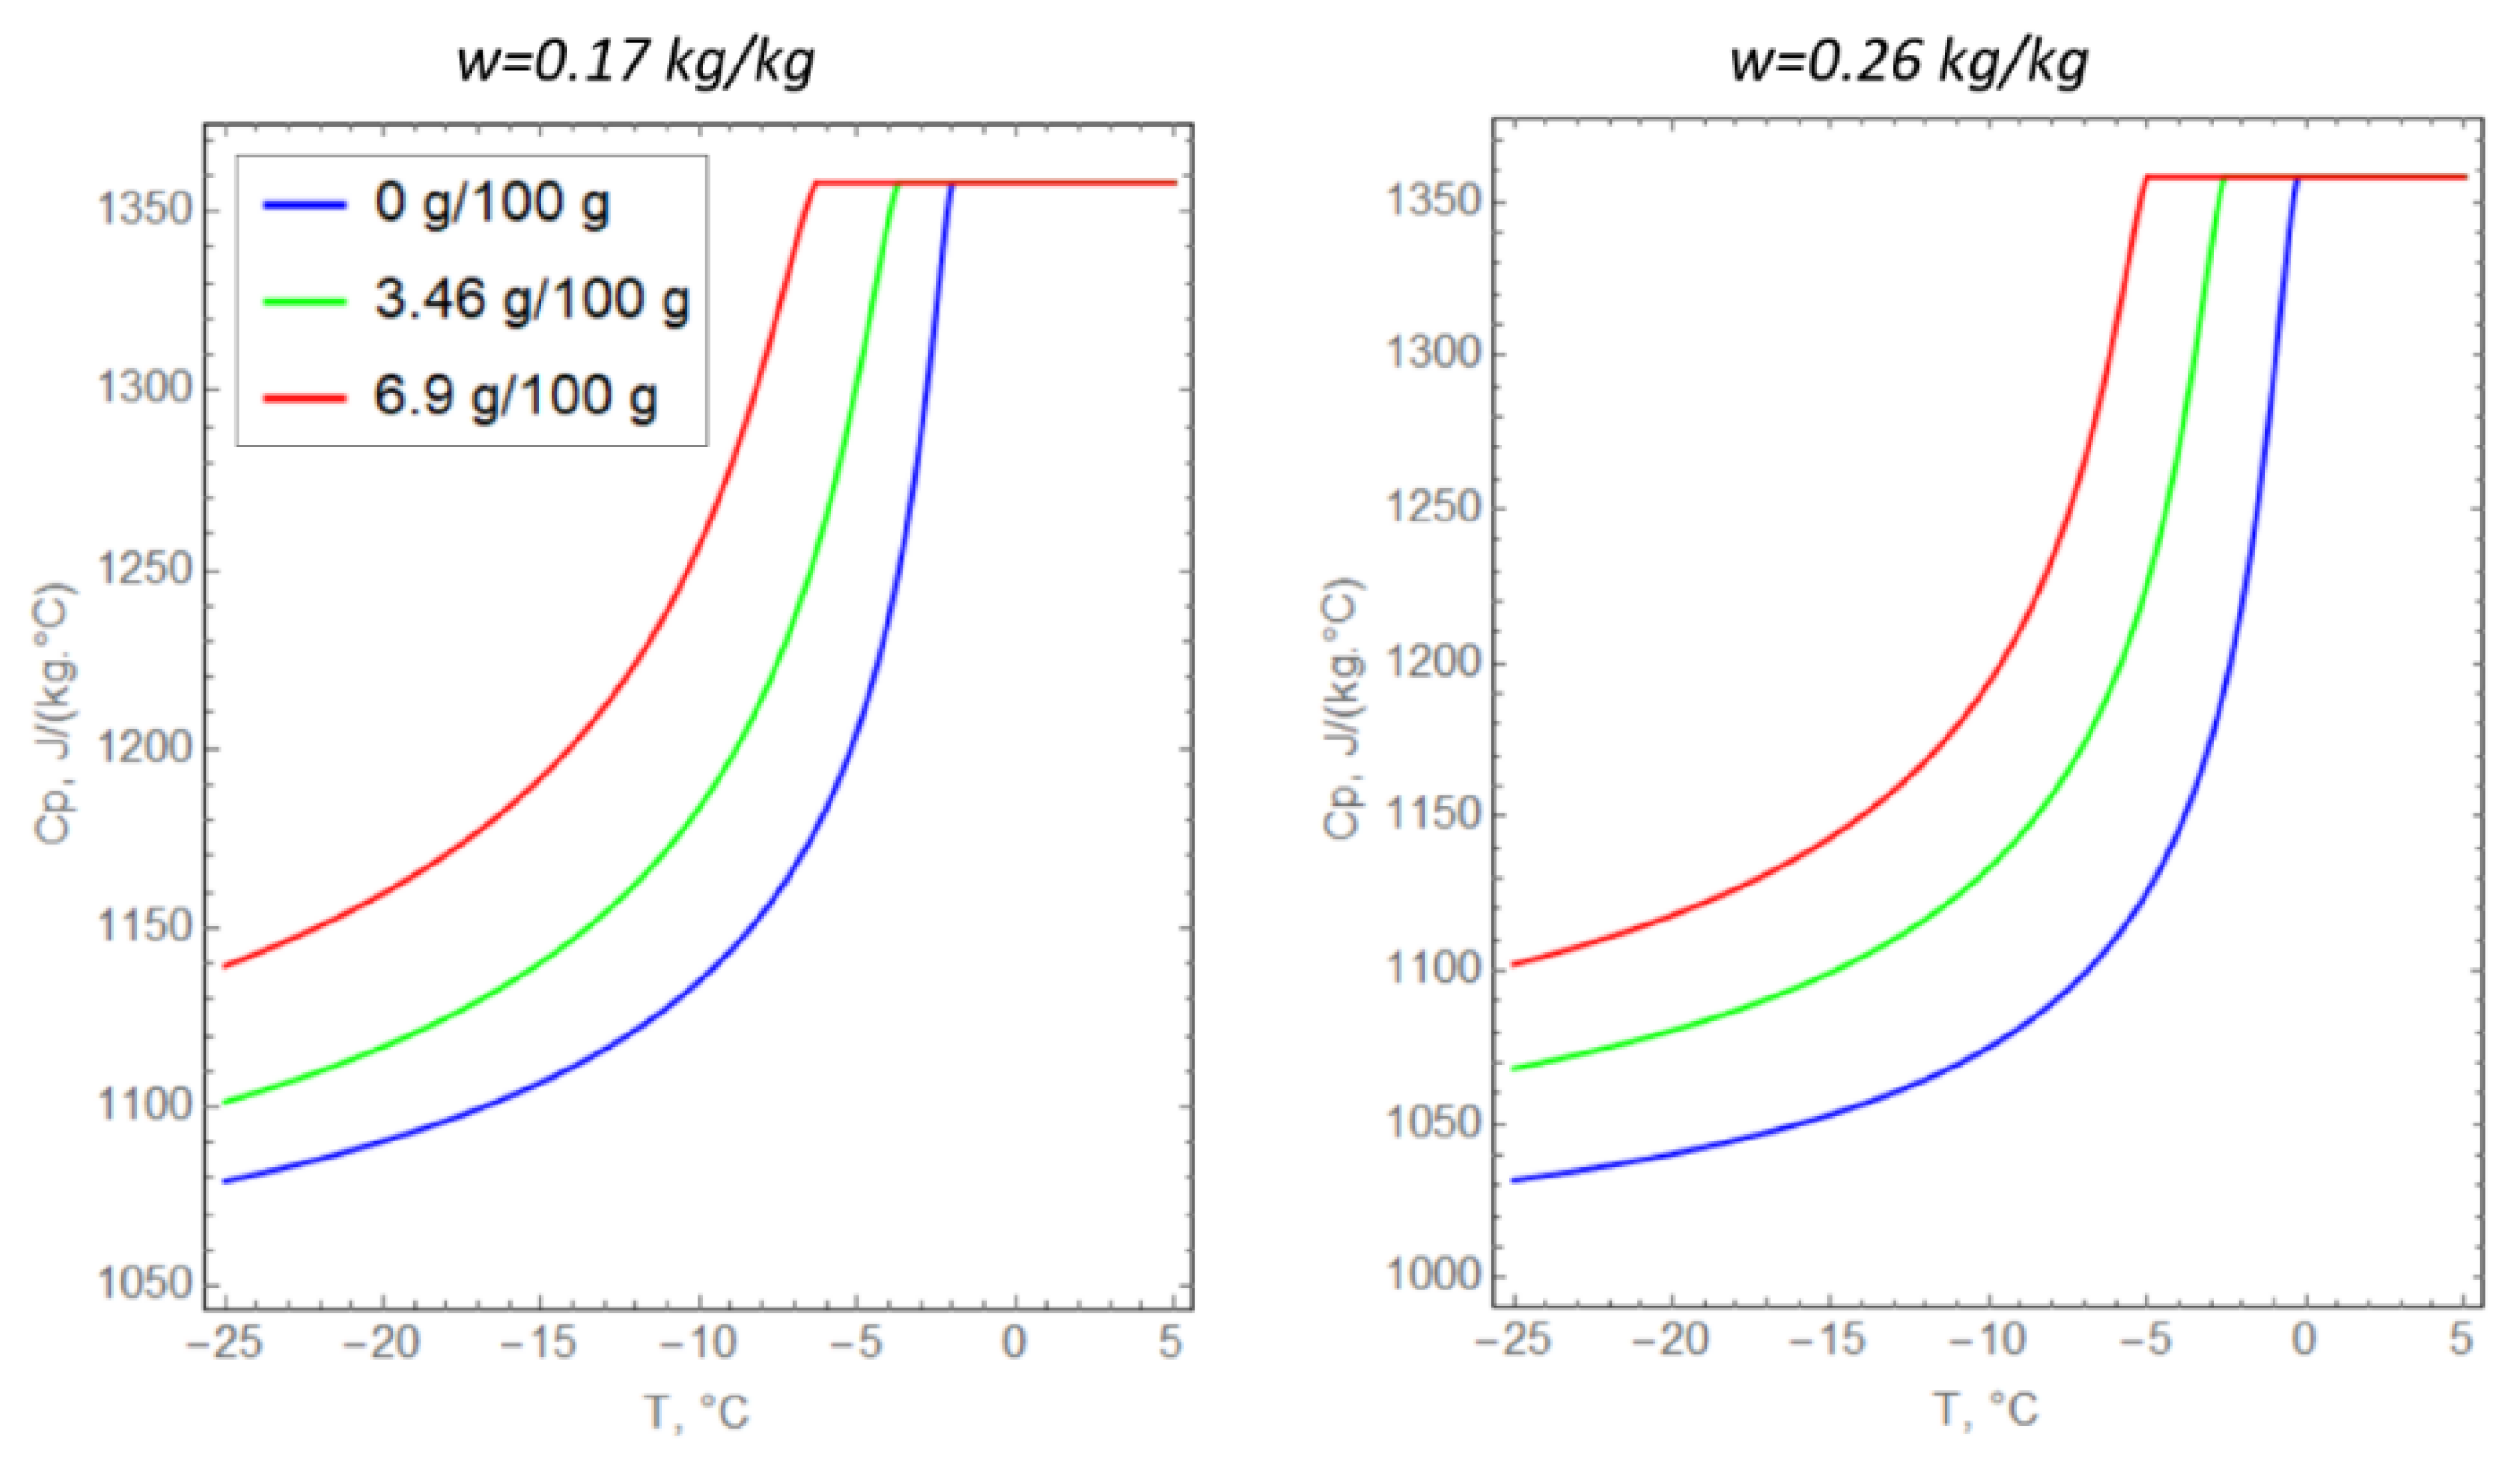
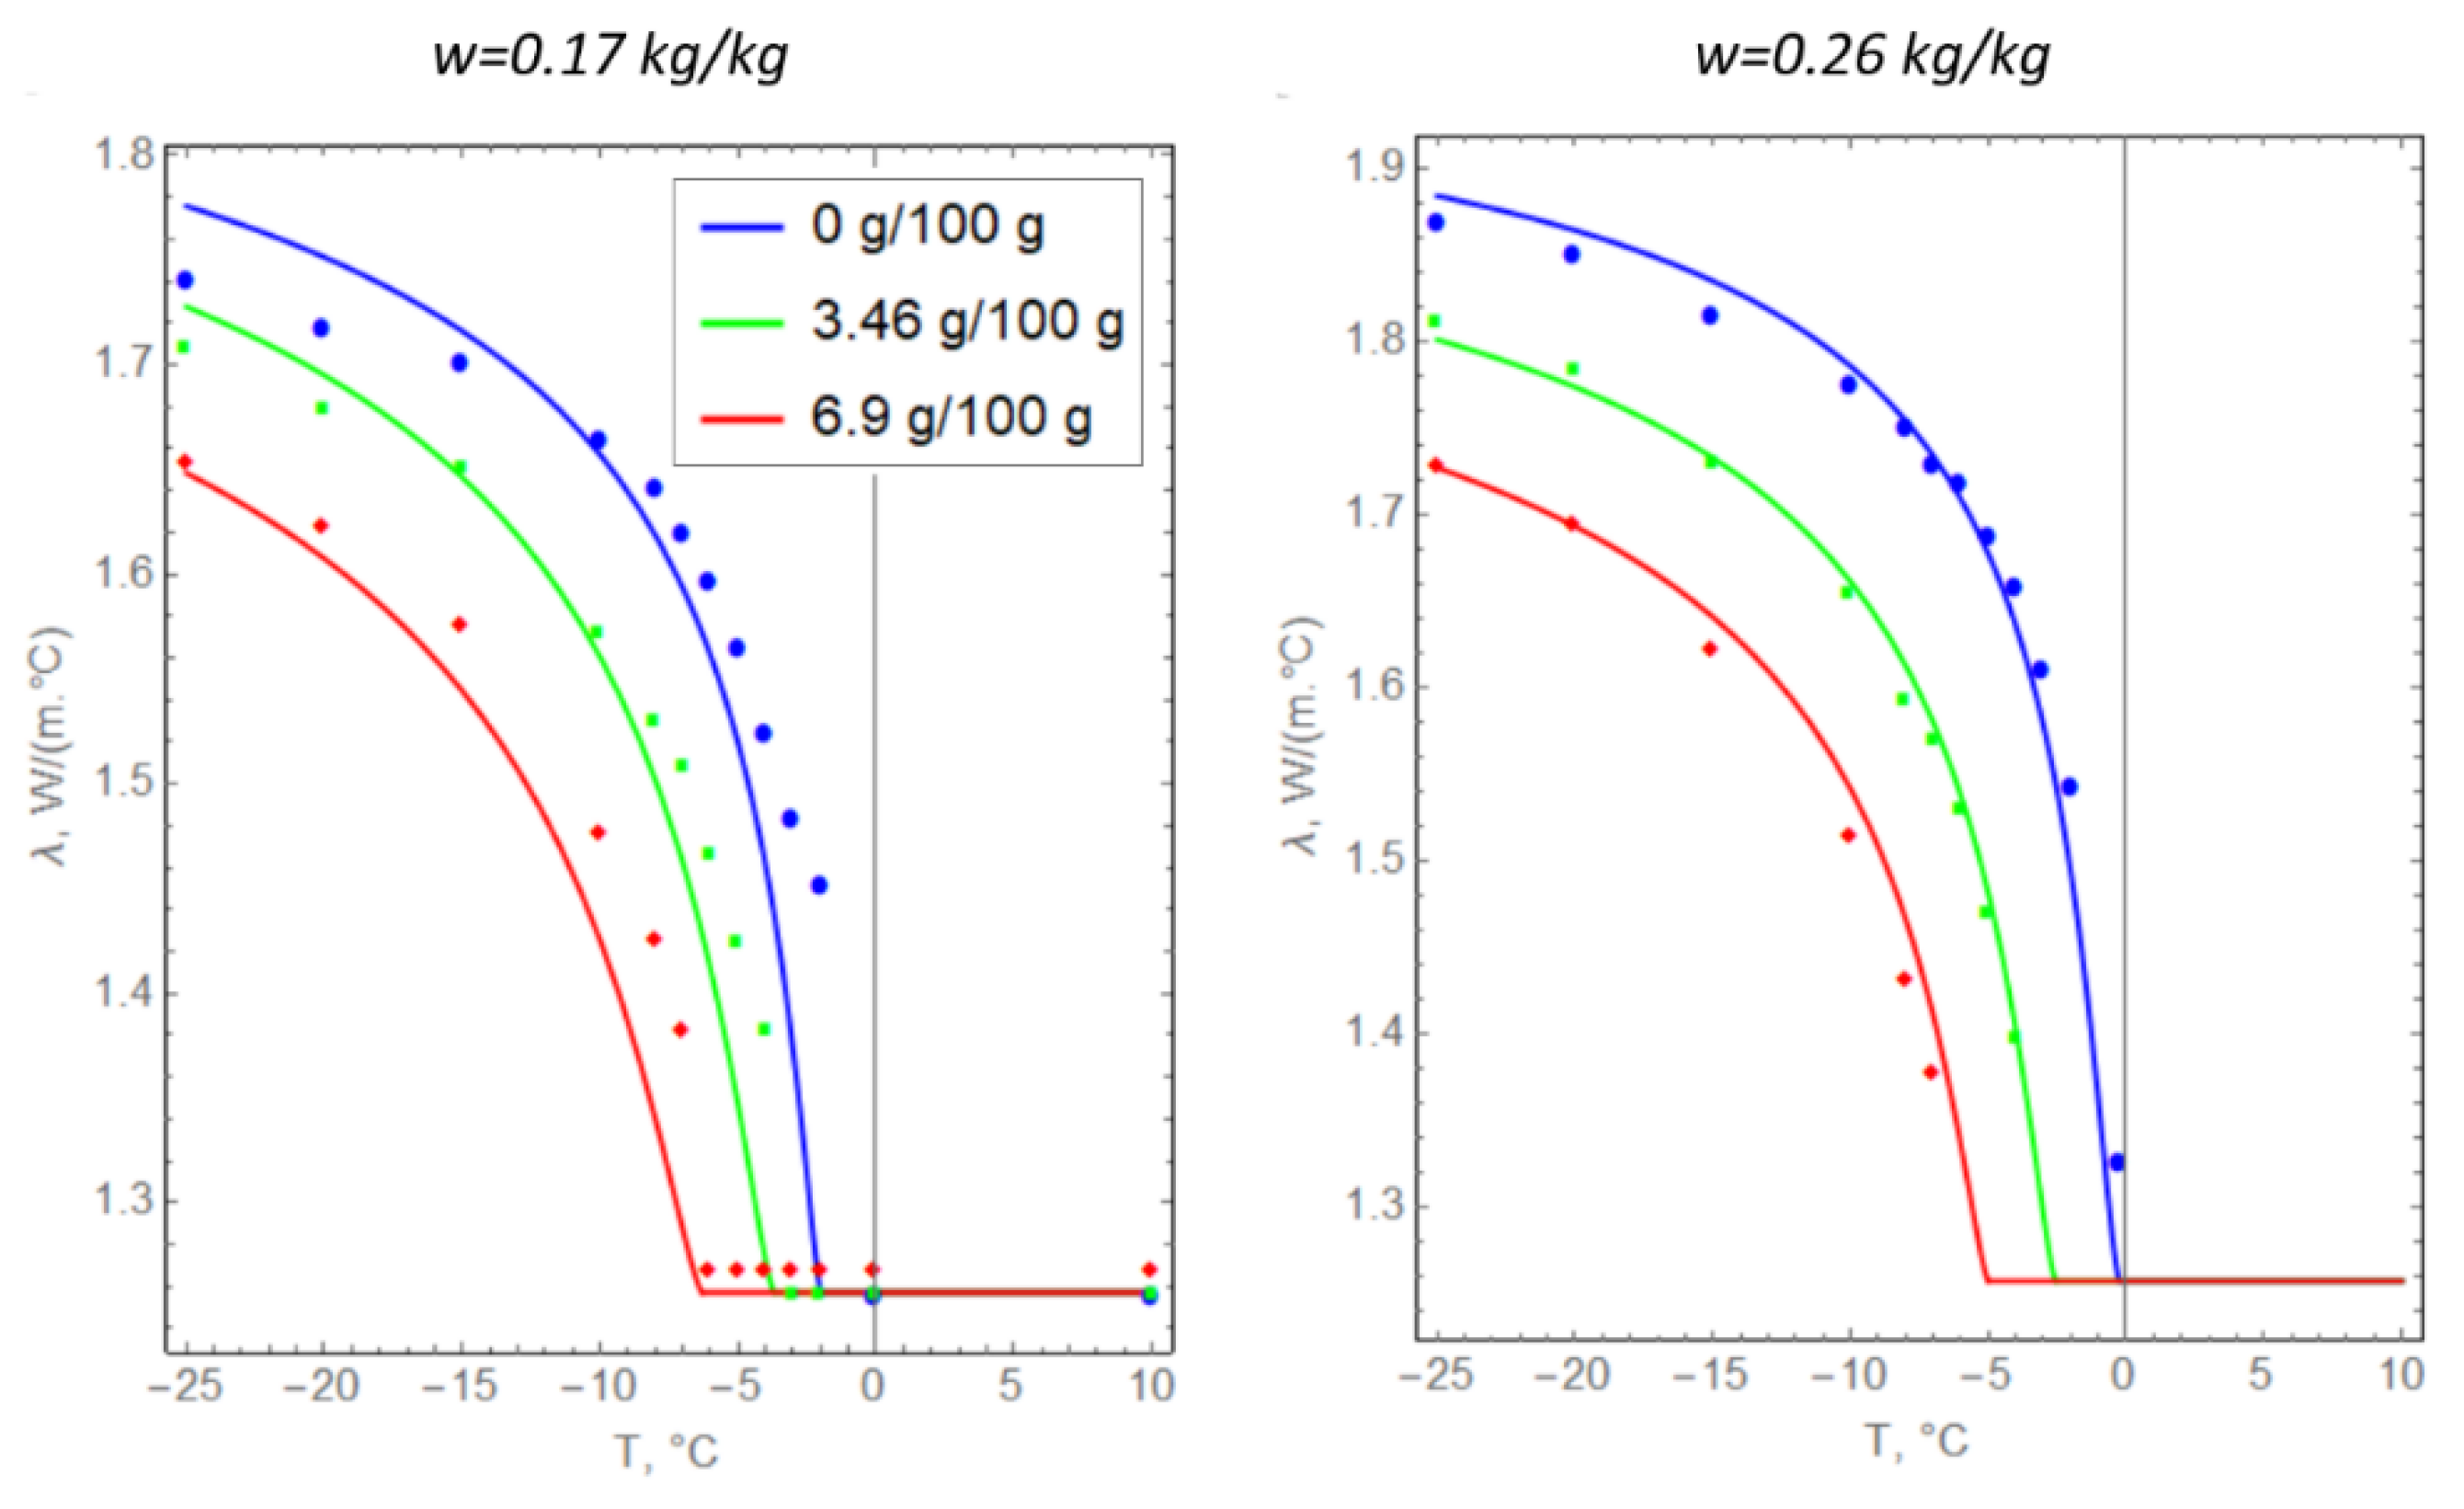
The specific heat capacities of saline soils were determined from the experimentally calculated porosity, the amount of unfrozen water, and the specific heat capacity of the dry soil particles (Figure 4). The thermal conductivity of the soil particles was selected to match the experimental observations (Table 2) at zero salinity of pore water. Next, Formula (8) was extrapolated to the case of saline soils. The correspondence of Formula (8) to the experimental data at nonzero pore water salinity was evaluated graphically (Figure 5).
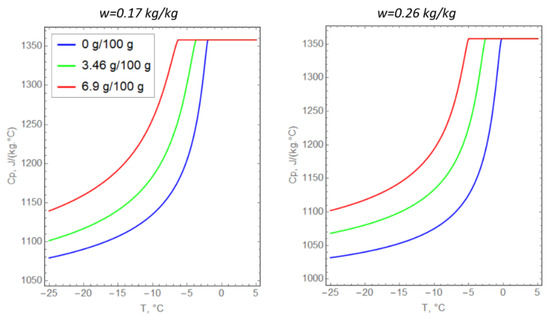
Figure 4.
Temperature dependences of the specific heat capacity of argillite-like clay.
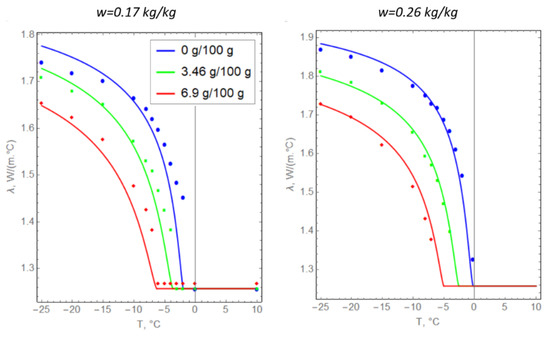
Figure 5.
Temperature dependences of the thermal conductivity of argillite-like clay: solid lines represent theoretical dependence (8) and dots represent experimental data.
In general, we can conclude that there is a good agreement between Formula (8) and the data from experimental measurements. This indicates that the hypothesis underlying Formula (8) is valid in the present case.
An important feature of the physical process of saline soil freezing is that only pure water crystallizes, while salt accumulates in unfrozen water until the eutectic point is reached [38,39]. After that, excess salt precipitates as a solid phase. The solution (water + salt) in this case is saturated. In the case of NaCl, a saturated solution corresponds to a mineralization of 23.2% [39]. During subsequent freezing, the complete freezing of the solution along with the precipitation of all the salt occurs at a temperature of −21.2 °C. Further in the paper, we will continue to use the term “pore water” to refer to a solution of water and NaCl, with rare exceptions when it comes to a saturated solution.
Therefore, the freezing point is constantly changing during AGF and is not distributed uniformly throughout the soil. This can be considered in our mathematical model by introducing the following corrective expression for salinity s:
where ε is a small value introduced to avoid division by zero; and ssat is the salinity of a saturated NaCl solution (23.2% or 50.3 g per 100 g of water).
The parameters Tliq, ω, and m at different initial soil water content and different salinities are presented in Table 3. The values of ω and m were obtained by approximating the experimental points with functions of Formula (6), and the values of Tliq were determined experimentally. Based on these points, linear dependences of Tliq, ω, and m on s are constructed for various w0 (indicated in the subscript):
Table 3.
Freezing Characteristic Curve Parameters.
When deriving Formula (10), it was assumed that there is no mass transfer in the frozen system. This is a logical assumption for clays, which usually have low hydraulic permeability. In a more general case, the diffusion transfer of salt mass in the pore space of the soil can be taken into account. To do this, Formula (10) should be changed to the following form:
where D is the diffusion coefficient of the dissolved salt (in the absence of ice in the pores), m2/s; is another small value introduced to avoid division by zero.
The system of Formulas (3)–(14) is closed by the following initial and boundary conditions:
The numerical solution of the system of Formulas (3)–(18) was carried out using the finite difference method in the Wolfram Mathematica computer algebra package. For the numerical solution of Formula (3), an explicit scheme of the first order of accuracy in time and the second order of accuracy in space was used. The time step is determined based on the Courant condition [40]. The spatial grid was assumed to be inhomogeneous, with a minimum step near the freezing pipe for the correct computation of high gradients of physical quantities [41].
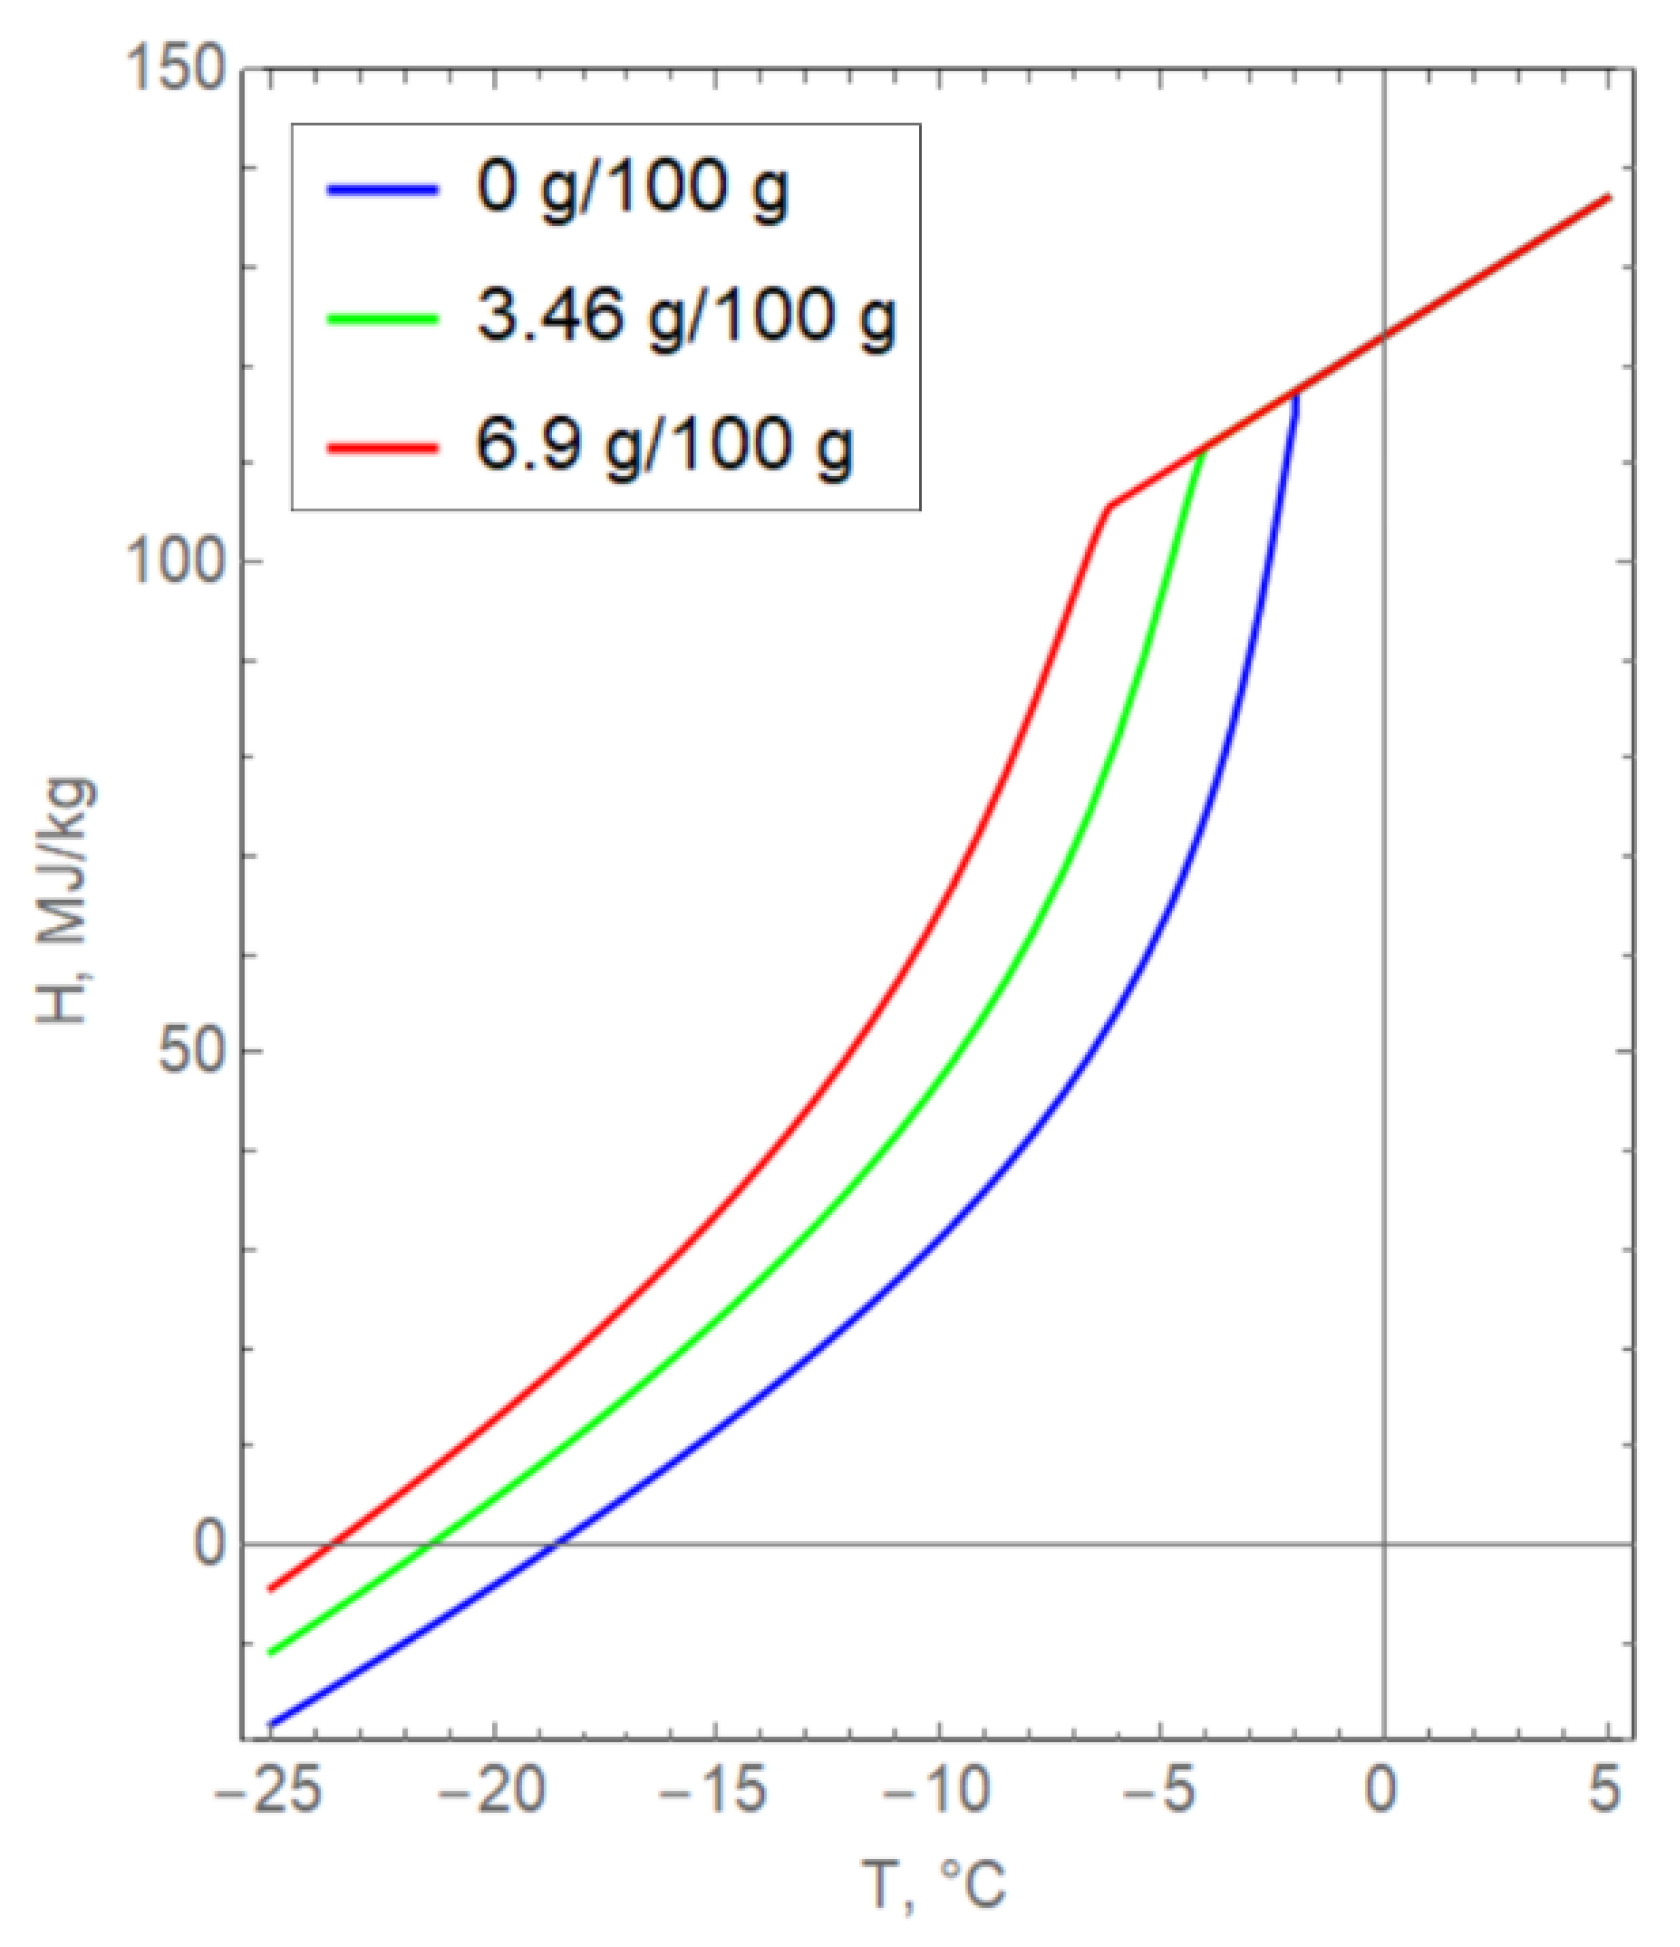
The main difficulty in the numerical implementation of the model, (3)–(18), was that the specific enthalpy H(T, s) changes with a change in the salinity of pore water (Figure 6). The curves presented in Figure 6 are obtained from the theoretical Formula (5) and experimental dependences for the volume fraction of unfrozen water and specific heat capacity. It was assumed that the density and specific heat of the phase transition of water were unchanged in Formula (5). It is important to note that the dependence of enthalpy on salinity is implemented in a complex way and cannot be taken into account by simply translating the curves along the axes.
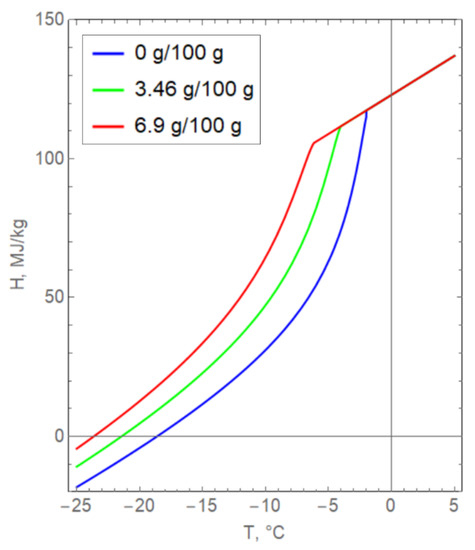
Figure 6.
Dependence of the specific enthalpy of clay on temperature for various values of pore water salinity.
With a non-uniform field of soil salinity, this means that the enthalpy is determined separately at each point of the soil. For this reason, the approach of effective heat capacities was used to simulate the phase transformation of water [42]. The essence of this approach includes two steps at each time iteration:
- The increments of the soil specific enthalpy ΔH in the internal nodes are calculated from Formula (3).
- The corresponding increments of nodal temperatures ΔT, volume fractions of unfrozen water Δγ, and salinity Δs are determined from the given enthalpy increment ΔH:
Local derivatives in Formulas (19) and (21) are determined based on Formulas (5), (6), and (11)–(13).
4. Simulation Results and Discussion
The main tasks of the numerical analysis involved debugging the numerical calculation algorithm and analysis of the dependence of the solution on pore water salinity. The main parameters used in the numerical simulation are summarized in Table 4. The initial soil salinity and the diffusion coefficient of the dissolved salt have several values.
Table 4.
Parameters for numerical simulation.
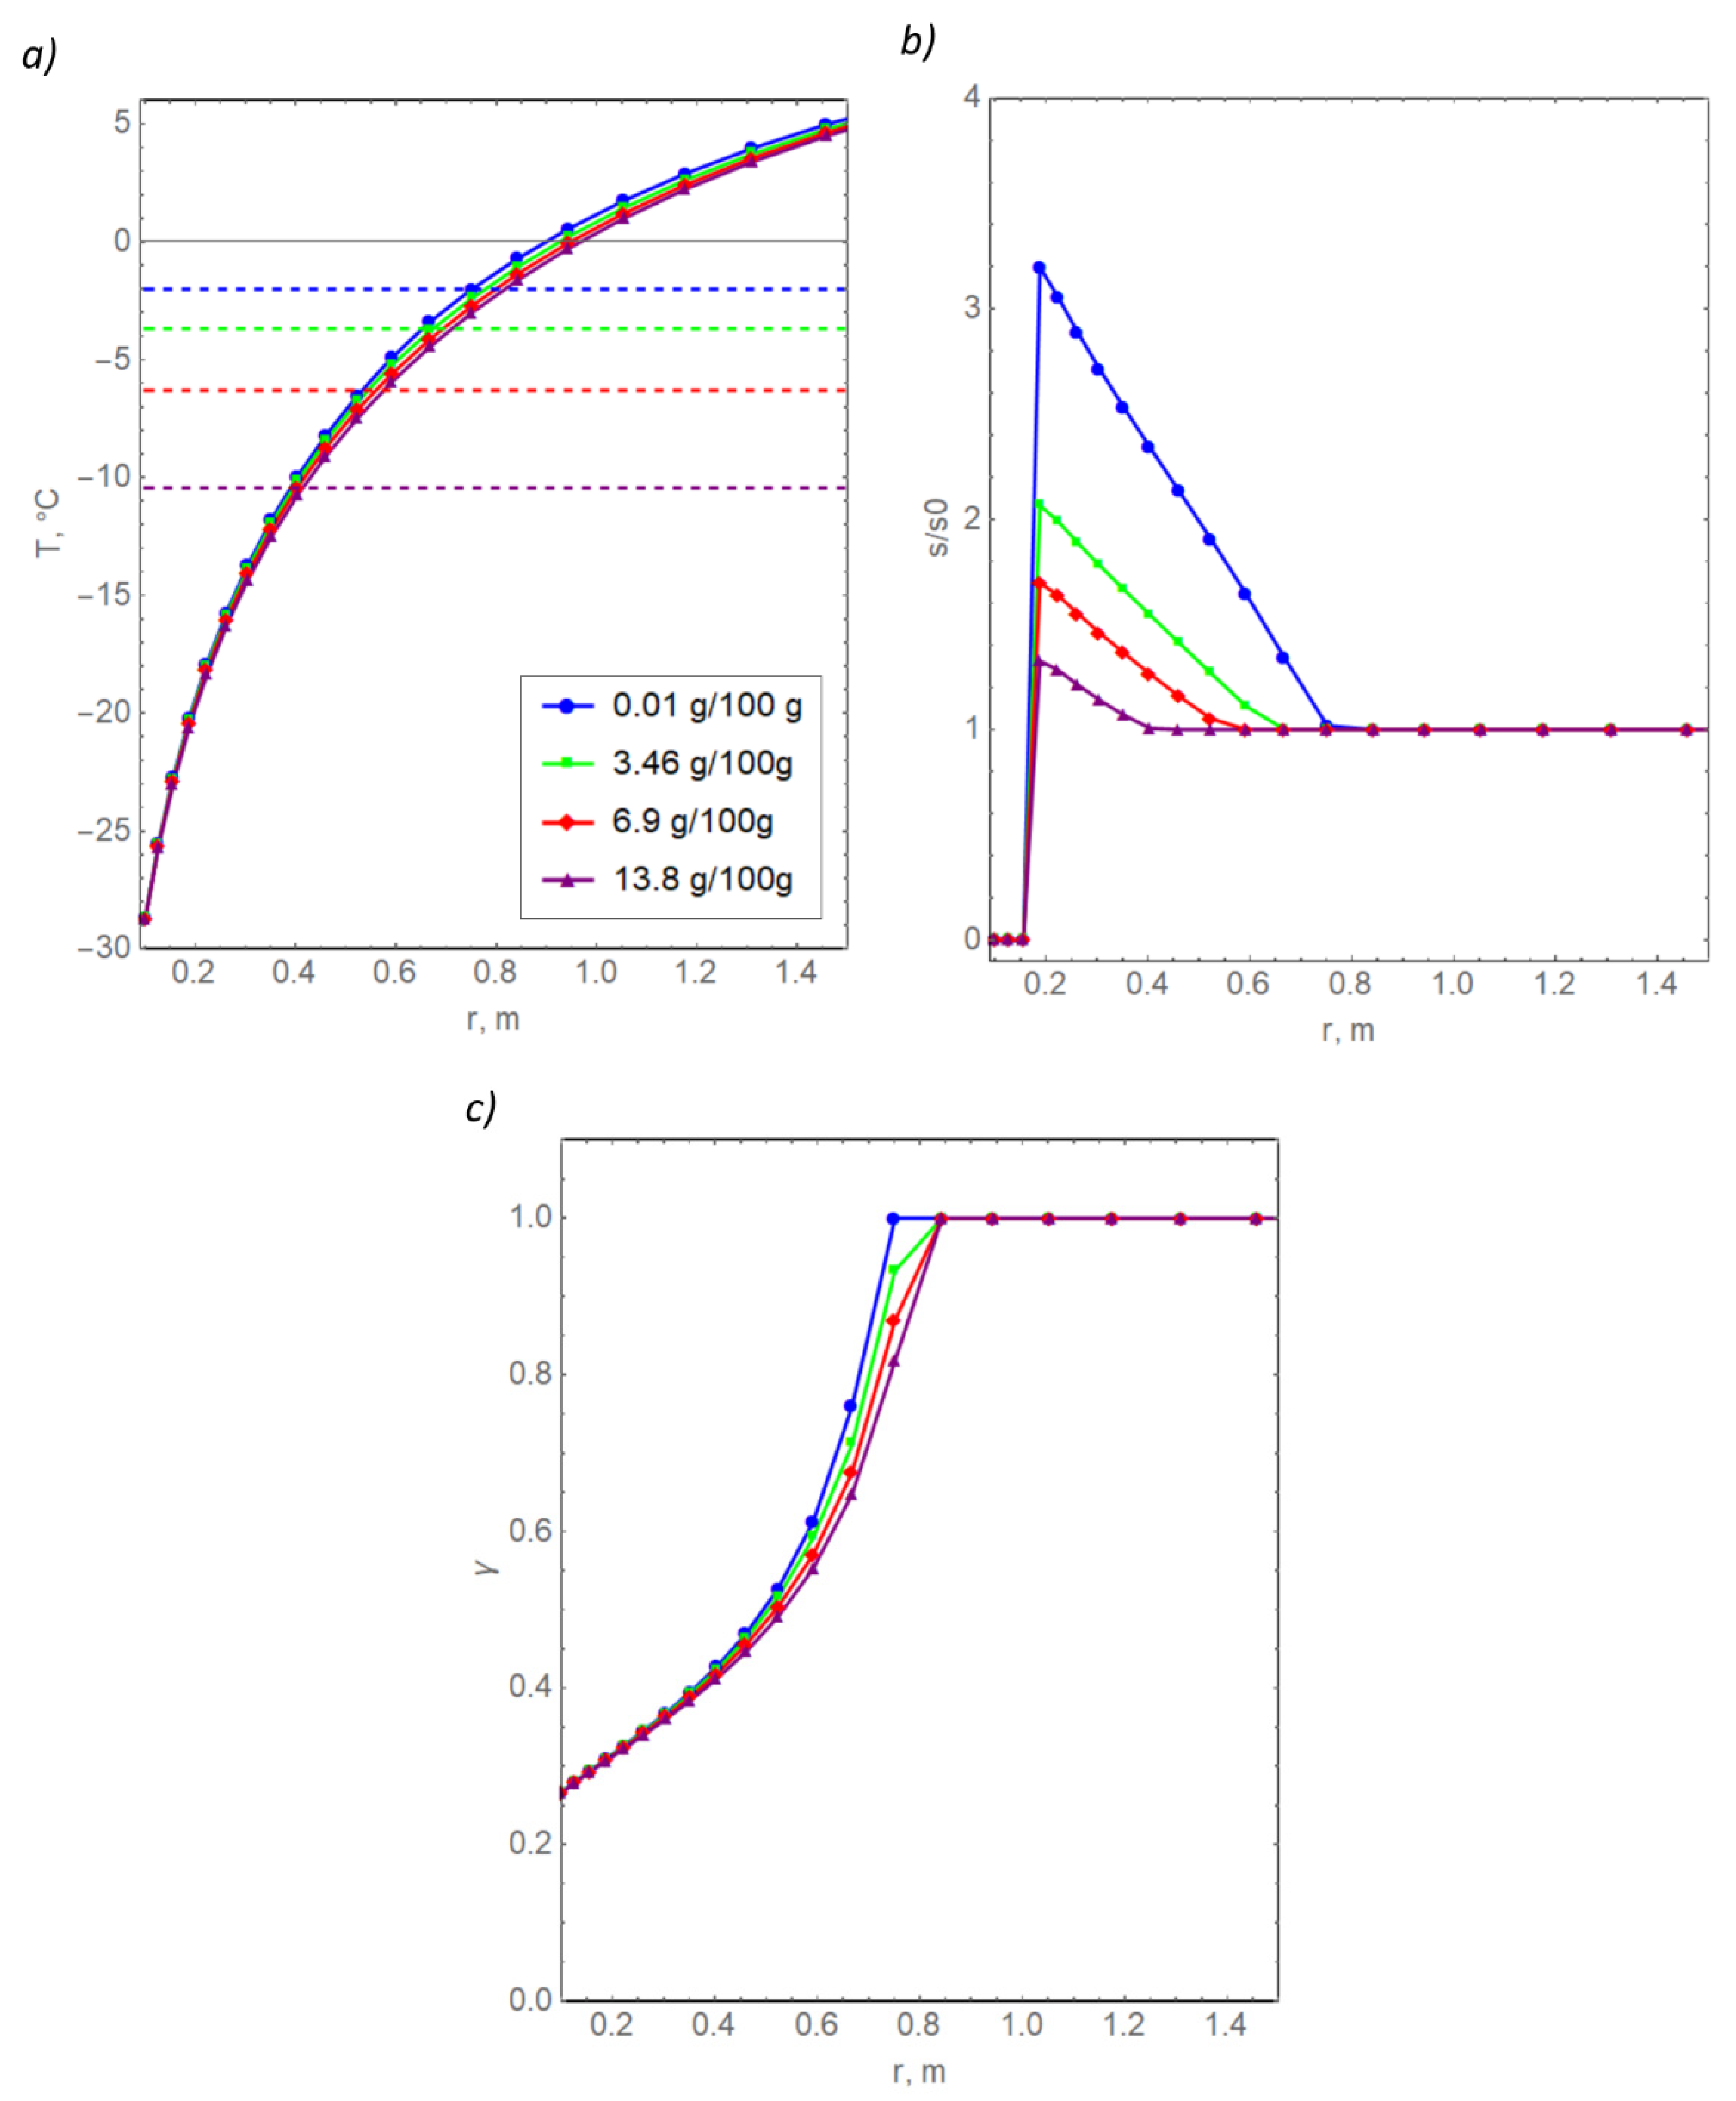
Figure 7a shows the temperature distributions at the final time (50 days) for the four selected concentrations of the initial pore water salinity. The dotted lines show the corresponding freezing points. Figure 7b shows the distributions of the relative pore water salinity calculated as the ratio of the dimensional salinity s to the initial dimensional salinity s0. The diffusion coefficient of the dissolved salt in the Figure 7 calculations is set equal to zero.
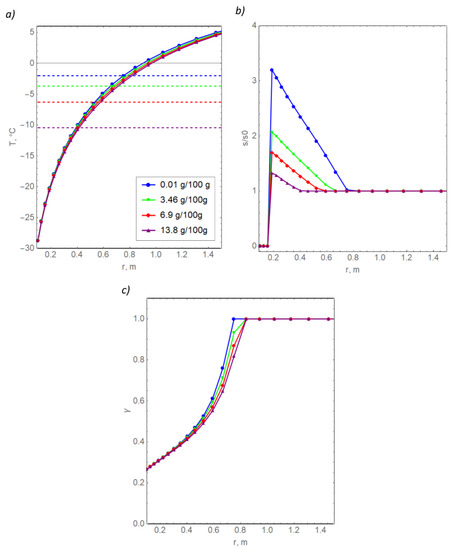
Figure 7.
Radial distributions of temperature (a), salinity (b), and the volume fraction of unfrozen water (c) in clay for various values of initial salinity.
In general, a natural result was obtained—with an increase in the initial salinity, pore water requires lower temperatures to freeze, known as freezing point depression. If the soil is more saline, then less heat must be removed from it to reduce its temperature by a given value, and a larger amount of unfrozen water remains in it. For this reason, the red temperature curve, corresponding to the highest salinity, is below the other three curves. The T(r) curves for the four salinity concentrations differ from each other by a maximum of 1.5 °C, which is significant. The maximum mismatches are observed at the beginning of the pore water crystallization. At the same time, the temperature differences are minimal near the freezing pipes, which is apparently due to the large thermal effect of the boundary condition, as expressed in Formula (14). The differences between the T(r) curves increase with an increase in the initial water content of the soil.
Curves of relative salinity differ from each other more greatly. The largest increase in relative salinity was obtained in the case of the smallest absolute value of salinity at the initial moment, as expected. According to Formula (9), the lower the minimum value of the relative amount of unfrozen water, the greater the maximum value of the relative salinity near the boundary of the freezing column. In the left region of the computational domain, salinity vanishes since the eutectic point of the water + salt solution is reached, and the temperature became lower than −21.2 °C. Additionally, the simulation data show that unfrozen water remains in this area, which is in a bound state, as follows from Figure 7c. In reality, the dissolved salt can be found in bound water even at temperatures below −21.2 °C; otherwise, the experimental dependences from Figure 3 would have had a significant jump at the transition to a temperature of −25 °C. Our model does not take into account that dissolved salt can remain in bound water because it is difficult to accurately estimate the remaining amount of salt.
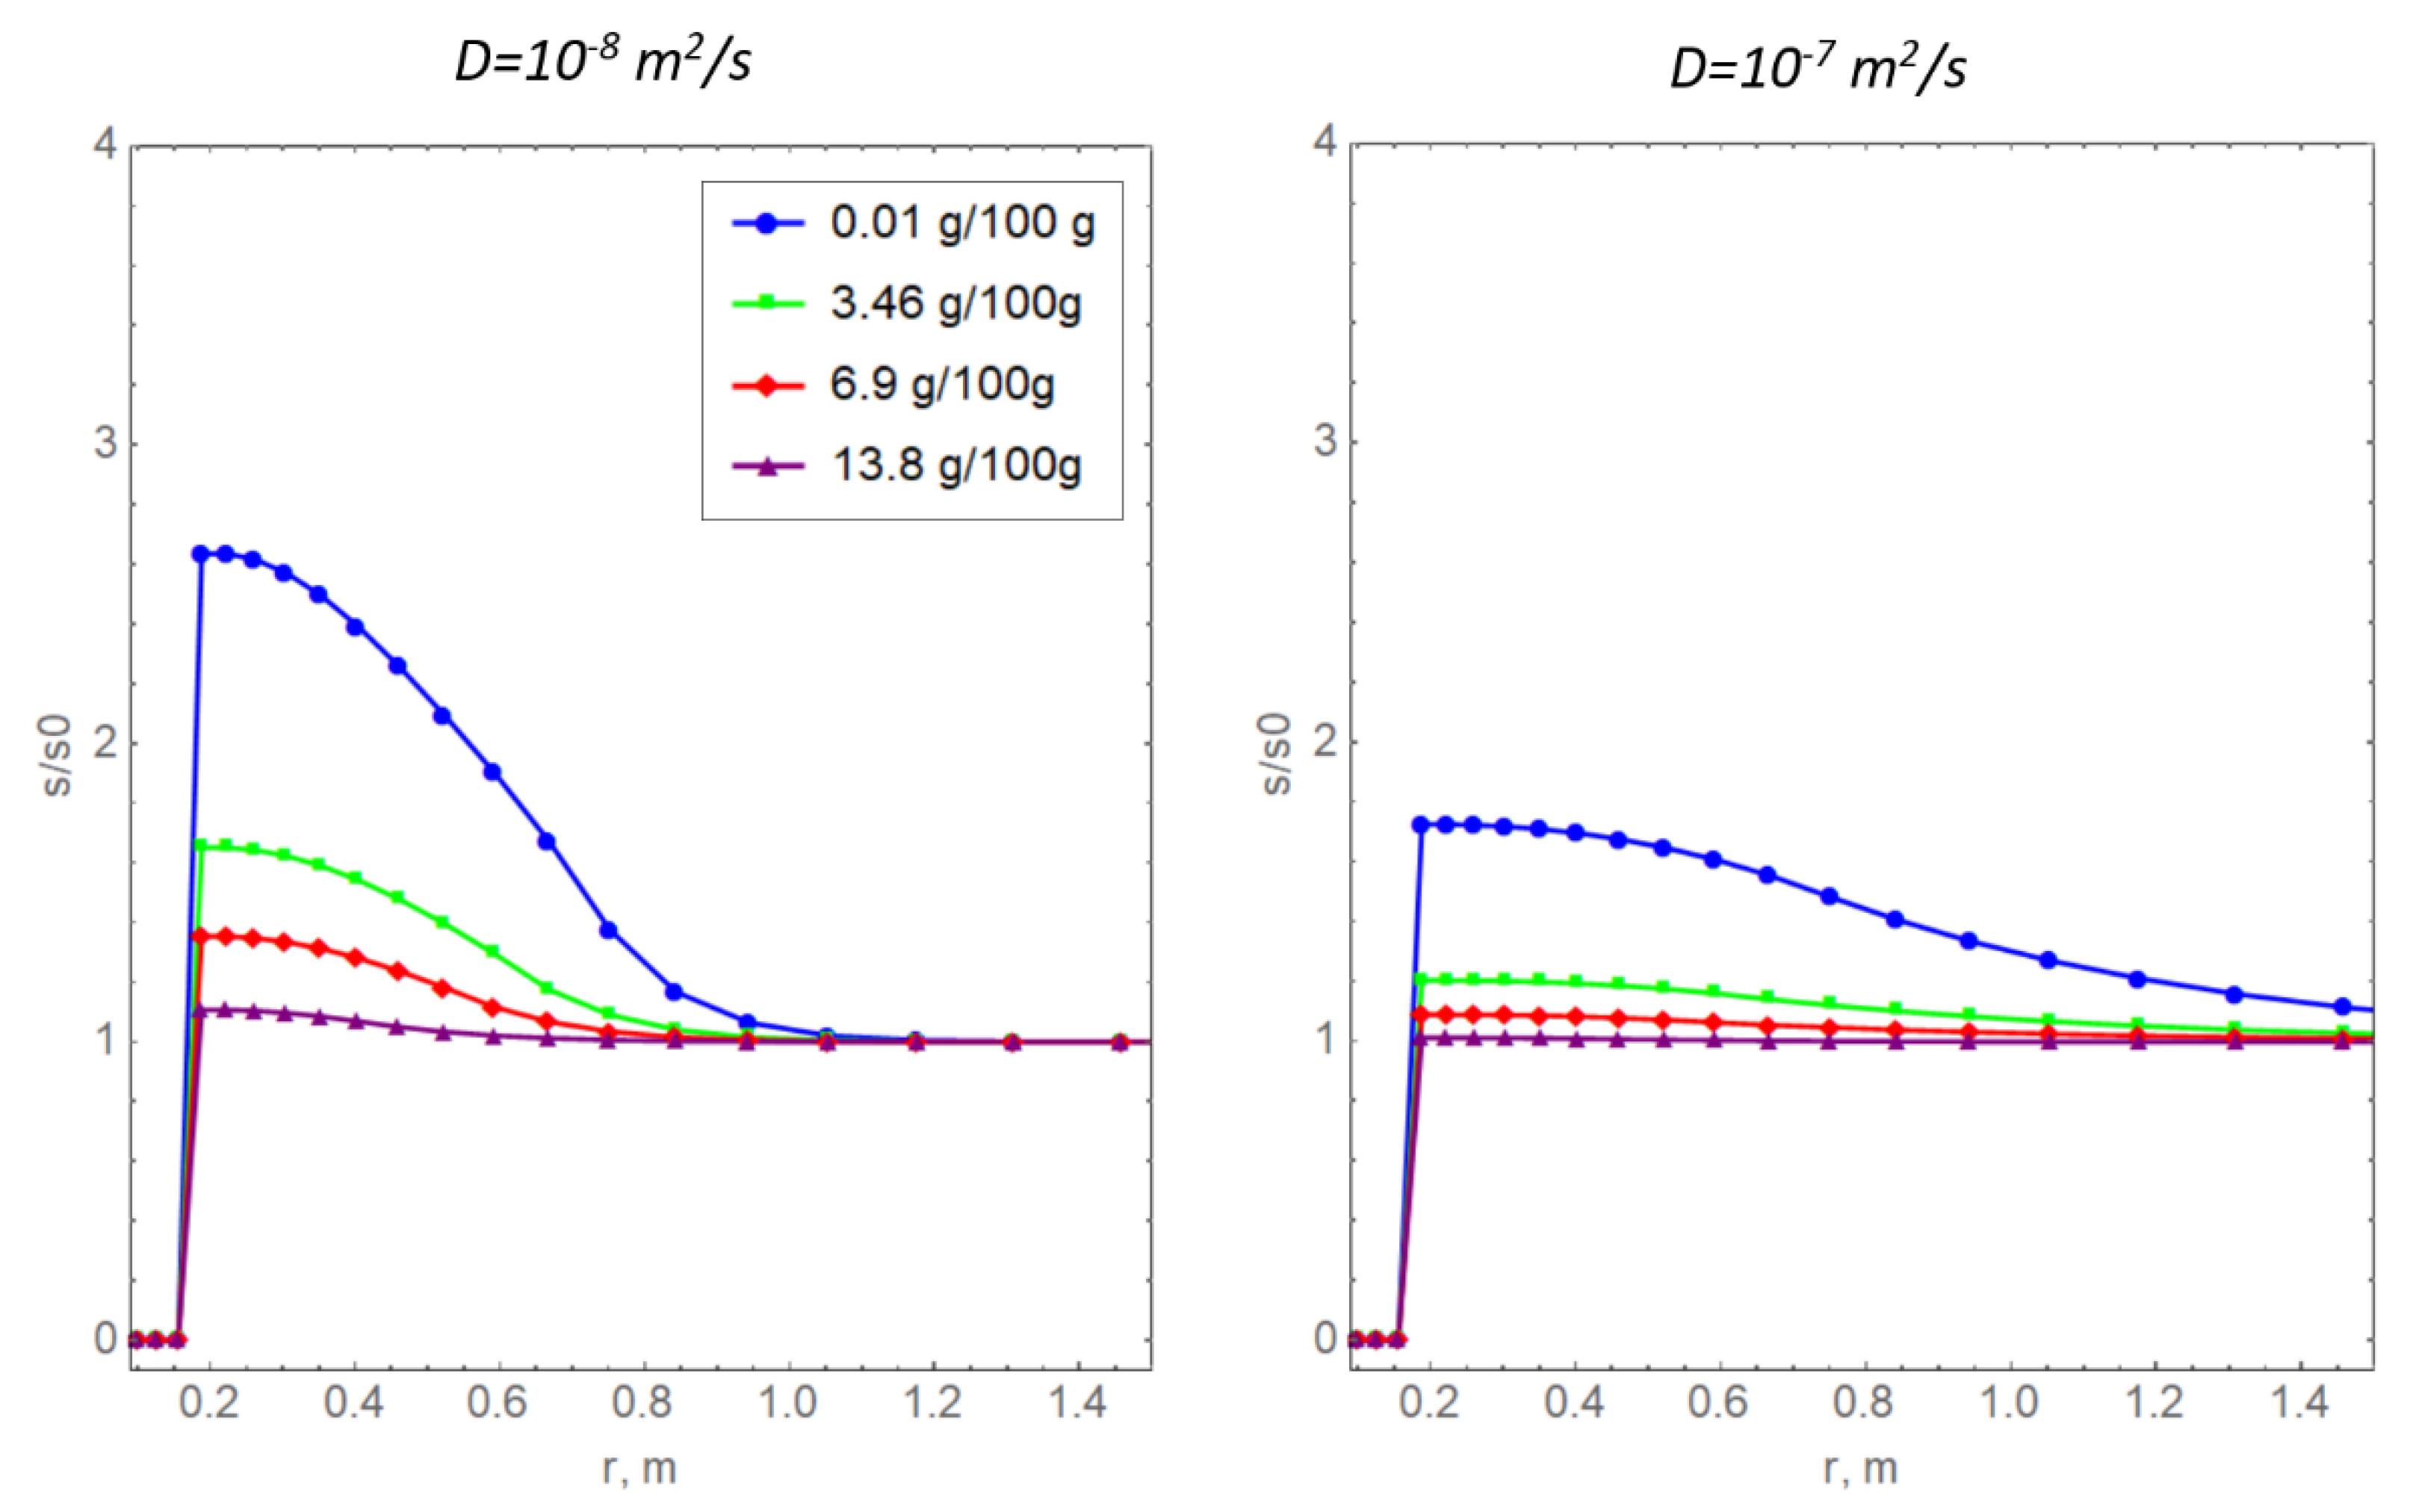
Figure 8 shows curves of relative salinity with non-zero values of the diffusion coefficient for the dissolved salt. Physically, the mechanism of diffusion mass transfer is due to the presence of a salt concentration gradient [17]. The soil temperature curves are not presented here because they slightly differ from the curves in Figure 7a. It is important to note that, in the calculations, it was assumed that the diffusion coefficient of the dissolved salt depends linearly on the amount of unfrozen water according to the approaches proposed previously [16,43]. Notably, this is not the only way to specify a complex dependence of the diffusion coefficient on water salinity. For example, in a previous report [44], an alternative power dependence was proposed.
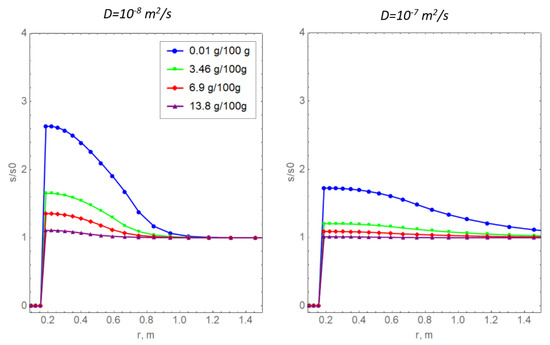
Figure 8.
Radial distributions of the relative salinity of pore water for two values of the diffusion coefficient of the dissolved salt and various values of initial salinity.
In the present study, the quantitative values of the diffusion coefficient are taken without reference to a particular type of soil. Generally, the obtained dependencies in Figure 8 are logical: diffusion has a smoothing effect, indicating the redistribution of salt in the pore space of the frozen medium.
5. Conclusions
Using the example of argillite-like clay, this study confirmed the significant impact of pore water mineralization on the process of artificial freezing of the rock mass. In the present study, this process was analyzed in the presence of high-temperature gradients formed by the freezing column. We found that the van Genuchten model for determining the amount of unfrozen moisture describes our experimental data well regarding the freezing of saline soil samples. A large amount of unfrozen bound water remains in the clay, even at relatively low soil temperatures (−25 °C). Moreover, when the amount of bound water is greater, more dissolved salt remains in the solution
This indicates that the classical concept of the frozen wall for such soils is inapplicable. At the same time, the required parameters for freezing the clay layer during the construction of mine shafts should not be determined based on the hydraulic properties of the soils but should be based on the rheological behavior of the clay, the critical values of the strain rate, and the deformations of the unsupported walls of the shaft in the clay layer. The exception is fractured clay layers, where seepage of pore water is also dangerous. Future studies are planned to answer questions about the nature of the deformation of the shaft walls, including a comprehensive experimental and theoretical analysis of frost heaving, redistribution of pore pressure in clay, and deformation in the presence of external loads. The thermodynamic model formulated and parameterized in this study is the starting point for further analysis of the process of artificial freezing of various types of soils on more complex objects.
Author Contributions
Conceptualization, L.L. and M.S.; methodology, G.B. and M.S.; software, S.B. and K.A.; validation, M.S. and S.B.; formal analysis, G.B. and M.S.; investigation, G.B. and A.B.; resources, G.B. and A.B.; data curation, L.L. and G.B.; writing—original draft preparation, M.S.; writing—review and editing, G.B.; visualization, M.S.; supervision, L.L.; project administration, L.L.; funding acquisition, L.L., M.S., S.B., G.B., A.B. and K.A. All authors have read and agreed to the published version of the manuscript.
Funding
This research was funded by the Ministry of Science and Higher Education of the Perm Territory of the Russian Federation (a project of international research groups) under agreement No. C-26/563.
Institutional Review Board Statement
Not applicable.
Informed Consent Statement
Not applicable.
Data Availability Statement
Not applicable.
Conflicts of Interest
The authors declare no conflict of interest.
References
- Levin, L.Y.; Semin, M.A.; Parshakov, O.S. Improving methods of frozen wall state prediction for mine shafts under con-struction using distributed temperature measurements in test wells. J. Min. Inst. 2019, 237, 268–274. [Google Scholar] [CrossRef]
- Olkhovikov; Yu, P. Support of Permanent Openings of Potash and Salt Mines; Nedra: Moscow, Russia, 1984; 238p. (In Russian) [Google Scholar]
- Semin, M.A.; Zaitsev, A.V.; Levin, L.Y. Numerical Solution of the Inverse Stefan Problem in the Analysis of the Artificial Freezing of a Rock Mass. Math. Model. Comput. Simul. 2021, 13, 877–886. [Google Scholar] [CrossRef]
- Banin, A.; Anderson, D.M. Effects of Salt Concentration Changes During Freezing on the Unfrozen Water Content of Porous Materials. Water Resour. Res. 1974, 10, 124–128. [Google Scholar] [CrossRef]
- Bing, H.; Ma, W. Laboratory investigation of the freezing point of saline soil. Cold Reg. Sci. Technol. 2011, 67, 79–88. [Google Scholar] [CrossRef]
- Wan, X.; Lai, Y.; Wang, C. Experimental Study on the Freezing Temperatures of Saline Silty Soils. Permafr. Periglac. Process. 2015, 26, 175–187. [Google Scholar] [CrossRef]
- Chuvilin, E.M.; Bukhanov, B.A.; Mukhametdinova, A.Z.; Grechishcheva, E.S.; Sokolova, N.S.; Alekseev, A.G.; Istomin, V.A. Freezing point and unfrozen water contents of permafrost soils: Estimation by the water potential method. Cold Reg. Sci. Technol. 2022, 196, 103488. [Google Scholar] [CrossRef]
- Yong, R.N.; Cheung, C.H.; Sheeran, D.E. Prediction of Salt Influence on Unfrozen Water Content in Frozen Soils. Dev. Geotech. Eng. 1979, 137–155. [Google Scholar] [CrossRef]
- Xiao, Z.; Lai, Y.; Zhang, M. Study on the freezing temperature of saline soil. Acta Geotechnica 2018, 13, 195–205. [Google Scholar] [CrossRef]
- Wang, C.; Lai, Y.; Yu, F.; Li, S. Estimating the freezing-thawing hysteresis of chloride saline soils based on the phase transition theory. Appl. Therm. Eng. 2018, 135, 22–33. [Google Scholar] [CrossRef]
- Wang, Q.; Qi, J.; Wang, S.; Xu, J.; Yang, Y. Effect of freeze-thaw on freezing point of a saline loess. Cold Reg. Sci. Technol. 2019, 170, 102922. [Google Scholar] [CrossRef]
- Zhou, Y.; Zhou, J.; Shi, X.-Y.; Zhou, G.-Q. Practical models describing hysteresis behavior of unfrozen water in frozen soil based on similarity analysis. Cold Reg. Sci. Technol. 2018, 157, 215–223. [Google Scholar] [CrossRef]
- Liu, J.; Yang, P.; Yang, Z.J. Water and salt migration mechanisms of saturated chloride clay during freeze-thaw in an open system. Cold Reg. Sci. Technol. 2021, 186, 103277. [Google Scholar] [CrossRef]
- Zhang, X.; Liu, S.; Wang, Q.; Wang, G.; Liu, Y.; Peng, W.; Liu, Y. Experimental investigation of water migration characteristics for saline soil. Pol. J. Environ. Stud. 2019, 28, 1495–1505. [Google Scholar] [CrossRef] [Green Version]
- Jochem, M.; Körber, C. A numerical solution of the coupled heat and mass transfer problem of non-planar solidification and melting of aqueous solutions. Warmeund Stoffubertrag. 1993, 28, 195–204. [Google Scholar] [CrossRef]
- Vasil’Ev, V.I.; Maksimov, A.M.; Petrov, E.E.; Tsypkin, G.G. Mathematical model of the freezing-thawing of saline frozen soil. J. Appl. Mech. Technol. Phys. 1995, 36, 689–696. [Google Scholar] [CrossRef]
- Lucas, T.; Chourot, J.; Bohuon, P.; Flick, D. Freezing of a porous medium in contact with a concentrated aqueous freezant: Numerical modelling of coupled heat and mass transport. Int. J. Heat Mass Transf. 2001, 44, 2093–2106. [Google Scholar] [CrossRef]
- Watanabe, K.; Mizoguchi, M. Amount of unfrozen water in frozen porous media saturated with solution. Cold Reg. Sci. Technol. 2002, 34, 103–110. [Google Scholar] [CrossRef]
- Qin, B.; Rui, D.; Ji, M.; Chen, X.; Wang, S. Research on influences of groundwater salinity and flow velocity on artificial frozen wall. Transp. Geotech. 2022, 34, 100739. [Google Scholar] [CrossRef]
- Plekhov, O.; Panteleev, I.; Kostina, A.; Levin, L. The effect of cryogenic suction on the monitoring data of ice barrier for-mation in a porous water-saturated soil. Procedia Struct. Integr. 2019, 17, 602–609. [Google Scholar] [CrossRef]
- Rouabhi, A.; Jahangir, E.; Tounsi, H. Modeling heat and mass transfer during ground freezing taking into account the salinity of the saturating fluid. Int. J. Heat Mass Transf. 2018, 120, 523–533. [Google Scholar] [CrossRef]
- Tounsi, H.; Rouabhi, A.; Jahangir, E. Thermo-hydro-mechanical modeling of artificial ground freezing taking into account the salinity of the saturating fluid. Comput. Geotech. 2019, 119, 103382. [Google Scholar] [CrossRef]
- Lade, P.V.; De Boer, R. The concept of effective stress for soil, concrete and rock. Geotechnique 1997, 47, 61–78. [Google Scholar] [CrossRef]
- Zhelnin, M.; Kostina, A.; Prokhorov, A.; Plekhov, O.; Semin, M.; Levin, L. Coupled thermo-hydro-mechanical modeling of frost heave and water migration during artificial freezing of soils for mineshaft sinking. J. Rock Mech. Geotech. Eng. 2021, 14, 537–559. [Google Scholar] [CrossRef]
- Zhang, X.; Wang, Q.; Yu, T.; Wang, G.; Wang, W. Numerical study on the multifield mathematical coupled model of hydraulic-thermal-salt-mechanical in saturated freezing saline soil. Int. J. Geomech. 2018, 18, 04018064. [Google Scholar] [CrossRef]
- Wu, D.; Lai, Y.; Zhang, M. Thermo-hydro-salt-mechanical coupled model for saturated porous media based on crystallization kinetics. Cold Reg. Sci. Technol. 2017, 133, 94–107. [Google Scholar] [CrossRef]
- Zhang, J.; Lai, Y.; Zhao, Y.; Li, S. Study on the mechanism of crystallization deformation of sulfate saline soil during the unidirectional freezing process. Permafr. Periglac. Process. 2020, 32, 102–118. [Google Scholar] [CrossRef]
- Brovka, A.G.; Brovka, G.P.; Dedyulya, I.V. The influence of salt concentration in a detached water of claystone-like clay on the ground freezing point and the dependence of the amount of unfrozen water on temperature. Min. Mech. Eng.-Ing Mach.-Build. 2022, 1, 14–23. [Google Scholar]
- Azmatch, T.F.; Sego, D.C.; Arenson, L.U.; Biggar, K.W. Using soil freezing characteristic curve to estimate the hydraulic conductivity function of partially frozen soils. Cold Reg. Sci. Technol. 2012, 83–84, 103–109. [Google Scholar] [CrossRef]
- Pardo Lara, R.; Berg, A.A.; Warland, J.; Parkin, G. Implications of measurement metrics on soil freezing curves: A simulation of freeze–thaw hysteresis. Hydrol. Processes 2021, 35, e14269. [Google Scholar] [CrossRef]
- Zhelnin, M.S.; Plekhov, O.A.; Semin, M.A.; Levin, L.Y. Numerical solution for an inverse problem about determination of volumetric heat capacity of rock mass during artificial freezing. PNRPU Mech. Bull. 2017, 4, 56–75. [Google Scholar]
- Voller, V.R.; Swaminathan, C.R.; Thomas, B.G. Fixed grid techniques for phase change problems: A review. Int. J. Numer. Methods Eng. 1990, 30, 875–898. [Google Scholar] [CrossRef]
- Nishimura, S.; Gens, A.; Olivella, S.; Jardine, R.J. THM-coupled finite element analysis of frozen soil: Formulation and application. Géotechnique 2009, 59, 159–171. [Google Scholar] [CrossRef] [Green Version]
- Zhou, M.M.; Meschke, G. A three-phase thermo-hydro-mechanical finite element model for freezing soils. Int. J. Numer. Anal. Methods Geomech. 2013, 37, 3173–3193. [Google Scholar] [CrossRef]
- Tsytovich, N.A. The Mechanics of Frozen Ground; McGraw-Hill: New York, NY, USA, 1975; 426p. [Google Scholar]
- Panteleev, I.; Kostina, A.; Zhelnin, M.; Plekhov, A.; Levin, L. Intellectual monitoring of artificial ground freezing in the flu-id-saturated rock mass. Procedia Struct. Integr. 2017, 5, 492–499. [Google Scholar] [CrossRef]
- Xiao, Z.; Hou, Z.; Zhu, L.; Dong, X. Experimental investigation of the influence of salt on the phase transition temperature in saline soil. Cold Reg. Sci. Technol. 2021, 183, 103229. [Google Scholar] [CrossRef]
- Wang, M.; Zhu, Y.; Zhao, T.; Cui, L.; Mao, W.; Ye, M.; Yang, J. Chemical characteristics of salt migration in frozen soils during the freezing-thawing period. J. Hydrol. 2022, 606, 127403. [Google Scholar] [CrossRef]
- Leys, J.; Losada-Pérez, P.; Glorieux, C.; Thoen, J. The melting behaviour of water and water–sodium chloride solutions studied by high-resolution Peltier-element-based adiabatic scanning calorimetry. J. Therm. Anal. 2017, 129, 1727–1739. [Google Scholar] [CrossRef]
- Tsai, T.-L.; Chiang, S.-W.; Yang, J.-C. Examination of characteristics method with cubic interpolation for advection–diffusion equation. Comput. Fluids 2006, 35, 1217–1227. [Google Scholar] [CrossRef]
- Semin, M.; Golovatyi, I.; Pugin, A. Analysis of Temperature Anomalies during Thermal Monitoring of Frozen Wall Formation. Fluids 2021, 6, 297. [Google Scholar] [CrossRef]
- Alzoubi, M.A.; Xu, M.; Hassani, F.P.; Poncet, S.; Sasmito, A.P. Artificial ground freezing: A review of thermal and hydraulic aspects. Tunn. Undergr. Space Technol. 2020, 104, 103534. [Google Scholar] [CrossRef]
- Wells, A.J.; Hitchen, J.R.; Parkinson, J.R. Mushy-layer growth and convection, with application to sea ice. Philos. Trans. R. Soc. A 2019, 377, 20180165. [Google Scholar] [CrossRef] [PubMed]
- Castellazzi, G.; De Miranda, S.; Grementieri, L.; Molari, L.; Ubertini, F. Multiphase model for hygrothermal analysis of porous media with salt crystallization and hydration. Mater. Struct. 2016, 49, 1039–1063. [Google Scholar] [CrossRef]
Publisher’s Note: MDPI stays neutral with regard to jurisdictional claims in published maps and institutional affiliations. |
© 2022 by the authors. Licensee MDPI, Basel, Switzerland. This article is an open access article distributed under the terms and conditions of the Creative Commons Attribution (CC BY) license (https://creativecommons.org/licenses/by/4.0/).