Abstract
The condition for the formation of droplet groups in liquid sprays is poorly understood. This study looks at a simplified model system consisting of two iso-propanol droplets of equal diameter, , in tandem, separated initially by a center-to-center distance, , and moving in the direction of gravity with an initial velocity, , where is the terminal velocity of an isolated droplet from Stokes flow analysis. A theoretical analysis based on Stokes flow around this double-droplet system is presented, including an inertial correction factor in terms of drag coefficient to account for large Reynolds numbers (≫1). From this analysis, it is observed that the drag force experienced by the leading droplet is higher than that experienced by the trailing droplet. The temporal evolutions of the velocity, , of the droplets, as well as their separation distance, , are presented, and the time at which the droplets come in contact with each other and their approach velocity at this time, , are calculated. The effects of the droplet diameter, , the initial droplet velocity, , and the initial separation, on and are reported. The agreement between the theoretical predictions and experimental data in the literature is good.
1. Introduction
A liquid spray, defined as a collection of liquid droplets moving in an ambient fluid, is commonly seen in many practical applications. Biofuel sprays in engines [1] and aqueous urea solution sprays in automotive Selective Catalytic Reduction (SCR) DeNOx systems [2,3,4] to control pollutant emissions, spray coating of surfaces in solar cell fabrication [5,6], pesticide sprays in agriculture [7], the role of ocean sprays in global climate [8], 3D ink-jet printing of biological entities (bio-printing) [9], nasal sprays to treat critical ailments [10], dynamics of pathogen-bearing droplets ejected while sneezing or coughing [11], and spray-on skin cells for burn treatment [12] are a few examples where liquid sprays play a key role in determining the outcome of emerging technologies as well as public health and environmental issues. In many of these cases, it may not be possible to modify the ambient fluid or the solid surface with which the liquid spray interacts to achieve the desired outcome. Hence, control of the liquid spray is needed, and this requires a deep understanding of the motion of the droplets comprising the liquid spray, leading to a ‘multi-body’ physical problem.
The motion of a collection of droplets is governed by the flow field around the droplets, which, in turn, is affected by the motion of the droplets, leading to coupled flow mechanics. This, in combination with the initial conditions, which can be specified by the size, the velocity, and the initial separation of the droplets upon injection into the ambient fluid, gives a model for predicting the motion of a collection of droplets. In the present study, we are broadly interested in understanding the conditions that lead to a localized formation of droplet clusters/groups due to the motion of a collection of droplets in liquid sprays. This phenomenon is referred to as ‘droplet grouping’ or ‘droplet clustering’. Such clustering of droplets in a spray leads to an unsteady spray structure and could be caused due to the inherent unsteadiness in the injection of droplets into the ambient medium and/or the interaction among the spray droplets mediated by the flow in the ambient medium [13].
Droplet grouping could potentially lead to collision among the droplets, which, in turn, could lead to coalescence, separation (bouncing, reflexive, or stretching), or shattering of the colliding droplets depending on the conditions under which they collide [14,15]. This, inevitably, leads to an alteration in the droplet size and velocity distribution of the liquid spray. Such an alteration of the liquid spray characteristics could be either beneficial or detrimental depending on the system/application under consideration. For example, an increase in droplet size is detrimental to combustion in aircraft and internal combustion engines due to less efficient vaporization and mixing of fuel droplets with an oxidizer, whereas it could be beneficial to filter out pollutant particles in exhaust systems [16]. In addition to this indirect effect, droplet grouping can directly alter evaporation/mixing characteristics of droplets/vapor [17], thereby affecting the combustion regime of the spray [18]. Hence, to control the droplet grouping process in order to benefit a particular application, a deeper understanding of the droplet grouping phenomenon is required.
Even though the configuration of a single droplet/sphere falling under gravity has been studied extensively (see, for example, the review article [19]), configurations involving two or more droplets/spheres have not been explored to a similar extent. Earlier studies focused on the motion of a pair of solid spheres, in a spatial arrangement similar to the one shown in Figure 1, falling from rest under gravity in a viscous ambient medium (see, for example, Refs. [20,21,22] and the references therein). These studies reported a reduction in the drag force experienced by the trailing sphere compared to that experienced by the leading sphere. This is in line with the analysis reported by Oseen [23]; however, the drag force experienced by the trailing sphere is not independent of the Reynolds number as predicted by Oseen [22,23]. An interesting numerical study on the motion of a pair of porous solid spheres in air reported the dependence of drag forces on leading and trailing spheres on the size and porosity of the spheres [24]. More recently, Katoshevski et al. [25,26] studied droplet grouping in an oscillating flow. A non-dimensional parameter was proposed in this study [25] to differentiate the conditions that lead to the grouping and non-grouping of droplets in an oscillating flow field. The authors reported that droplet grouping is dominantly seen for smaller droplets, evaporating droplets tend to group because of this, and the droplet-ambient coupling tends to inhibit droplet grouping [26]. Furthermore, since bigger droplets tend not to group, their evaporation rates are similar to that of smaller droplets that tend to form groups, resulting in less sensitivity of spray vaporization on droplet size [26]. To understand the physical principles governing droplet grouping phenomena, a fundamental experimental study on trains of double- and triple-droplet systems of iso-propanol droplets injected in tandem at high velocities into quiescent ambient air was reported by Roth et al. [27,28]. A direct numerical simulation was also reported by Roth et al. [28], which captures the motion of groups of two droplets observed in experiments when a wider computational domain is employed.
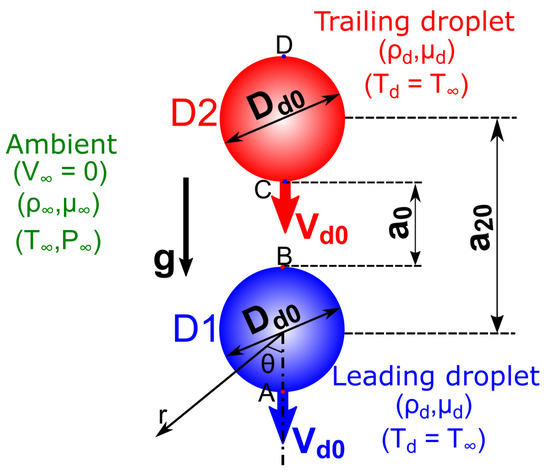
Figure 1.
Schematic illustration of the double-droplet system at the instant , highlighting the relevant parameters.
Even though the phenomenon of droplet–droplet collision has been studied quite extensively through experimental, theoretical, and numerical approaches [14], the conditions that lead to the collision of droplets as well as the calculation of the initial conditions at which droplets collide are not sufficiently addressed in the current literature. This is where the current study on droplet grouping becomes relevant. At this point, it is worth re-emphasizing that the current study explores the mechanism through which two droplets come closer together through a simple analytical study.
As a first step, we consider a simple one-dimensional model system of two droplets each of diameter in tandem, separated by a center-to-center distance of , injected with an initial velocity in the direction of gravitational acceleration g into quiescent ambient air (see Figure 1). Such double-droplet systems are relevant in one-dimensional droplet streams in typical ink-jet printing applications. Note that here we consider the injection velocity to be much larger than the terminal velocity attained by an isolated droplet freely falling under gravity; this is in contrast to the earlier studies that considered spheres either freely falling from rest or moving at equal and constant velocities [20,21]. The theoretical formulation for the motion of this double-droplet system in a Stokes flow regime is detailed in Section 2, listing the assumptions made. The theoretical formulation is validated by comparing with limited experimental data available in the literature. This is followed by Section 3 on the predictions of (i) the temporal evolution of the velocities and separation of the droplets, (ii) the time at which the droplet surfaces come in contact with each other, and (iii) the relative velocity with which the droplets contact each other, as well as the effects of , , and on these predictions. The concluding remarks from the present investigation and directions for further exploration are outlined in Section 4.
2. Theoretical Methodology
This section describes the theoretical approach followed to understand/predict the motion of the individual droplets in a double-droplet system, as shown in Figure 1. Both the leading and trailing droplets are assumed to have the same diameter and are injected into the ambient air at with the same initial velocity . The initial center-to-center separation between the droplets is denoted by (surface-to-surface separation, ). The underlying assumptions of this theoretical approach are listed below.
- The ambient pressure, temperature, and physical properties (density, viscosity, and surface tension) are assumed to be constant.
- Any effect due to droplet evaporation is assumed to be negligible (for example, the droplet diameter at any instant of time, ).
- The flow around the droplets is assumed to be Stokes flow, with the inertial effects incorporated through an expression for the coefficient of drag, , valid for a wide range of Reynolds numbers.
- Any deviation in the droplets’ shape from spherical, due to deformation, is assumed to be negligible. In general, this is valid at conditions of a low aerodynamic Weber number, ( and are, respectively, the density of the ambient fluid and the surface tension of the droplet liquid, is the instantaneous velocity of the droplet). For example, the transition from ‘no deformation’ to ‘non-oscillatory deformation’, characterized by a 10% change in the cross-stream droplet diameter, occurs at for an Ohnesorge number, [29]; and being the density and the dynamic viscosity of the droplet liquid, respectively.
- The effect of the skin friction component of the drag force on the motion of the droplets is neglected. Please refer to Appendix A.1 for a discussion on the importance of this assumption, with the help of direct numerical simulations (DNS) at typical flow conditions.
- The pressure field around the leading droplet is assumed to affect the motion of the trailing droplet, whereas the effect of the pressure field around the trailing droplet on the motion of the leading droplet is neglected. In other words, the effect of a two-way mutual interaction between the pressure fields around the leading and trailing droplets is neglected. Such mutual interaction effects have been studied for spheres/droplets moving at very low Reynolds numbers (≈O(1) and below) [20]; this leads to very complex mathematical equations that need to be solved with a strenuous computational effort [30,31]. Please refer to Appendix A.2 for a discussion on the importance of this assumption, with the help of DNS at typical flow conditions.
- The effect of the presence of other droplets around the double-droplet system, as in the case of a typical spray, on the motion of this system is neglected.
Within the framework of these assumptions, the theoretical approach is formulated. The pressure field for Stokes flow around a single isolated sphere is given as follows [32]:
Here, r and are the radial and azimuthal coordinates measured from the droplet’s center and from the direction of motion of the droplet, respectively (see Figure 1). and are, respectively, the ambient pressure far away from the droplets and the dynamic viscosity of the ambient fluid, is the instantaneous droplet velocity, and is the droplet diameter. This form of the pressure field, as predicted by Stokes flow, is adopted for the case of the double-droplet system considered in the present study. At any instant of time, the pressure difference across the leading droplet (D1 in Figure 1) is approximated as the pressure difference between the points A and B. Note that this is the maximum pressure difference acting on the surface of the droplet, whereas the viscous drag at the points A and B is zero. We further make a simplifying assumption that this maximum pressure difference acts all over the effective cross-sectional area of the droplet normal to the direction of its motion, . The instantaneous pressures at A and B ( and , respectively) can be calculated from Stokes flow approximation (Equation (1)) as follows:
Here, is the instantaneous velocity of the leading droplet. Hence, the pressure difference, acting on the leading droplet can be calculated from Equations (2) and (3) as follows:
Similarly, the pressure difference acting on the trailing droplet (D2 in Figure 1) at any instant of time is approximated as the instantaneous pressure difference between the points C and D. The pressures at C and D ( and , respectively) are calculated from Stokes flow approximation under the assumption of ‘linear superposition’. In other words, the pressure at C (or D) is expressed as the sum of the pressure at C (or D) due to flow over the leading droplet, (or ) and that at C (or D) due to the presence of the trailing droplet, (or ). Such an approach of superposition is somewhat similar to the one discussed by Smoluchowski [33]. This leads to
In the above equations, is the instantaneous surface-to-surface separation between the droplets. Now, the instantaneous pressure difference acting on the trailing droplet, can be calculated from Equations (5) and (6) as follows:
Comparing Equations (4) and (7), it is evident that at any instant of time, the pressure difference acting on the trailing droplet, is less than that on the leading droplet, . Now, it is assumed that both and act over an effective droplet surface area of . Applying a force balance on the leading and trailing droplets gives the following equations of motion for them.
For the leading droplet:
For the trailing droplet:
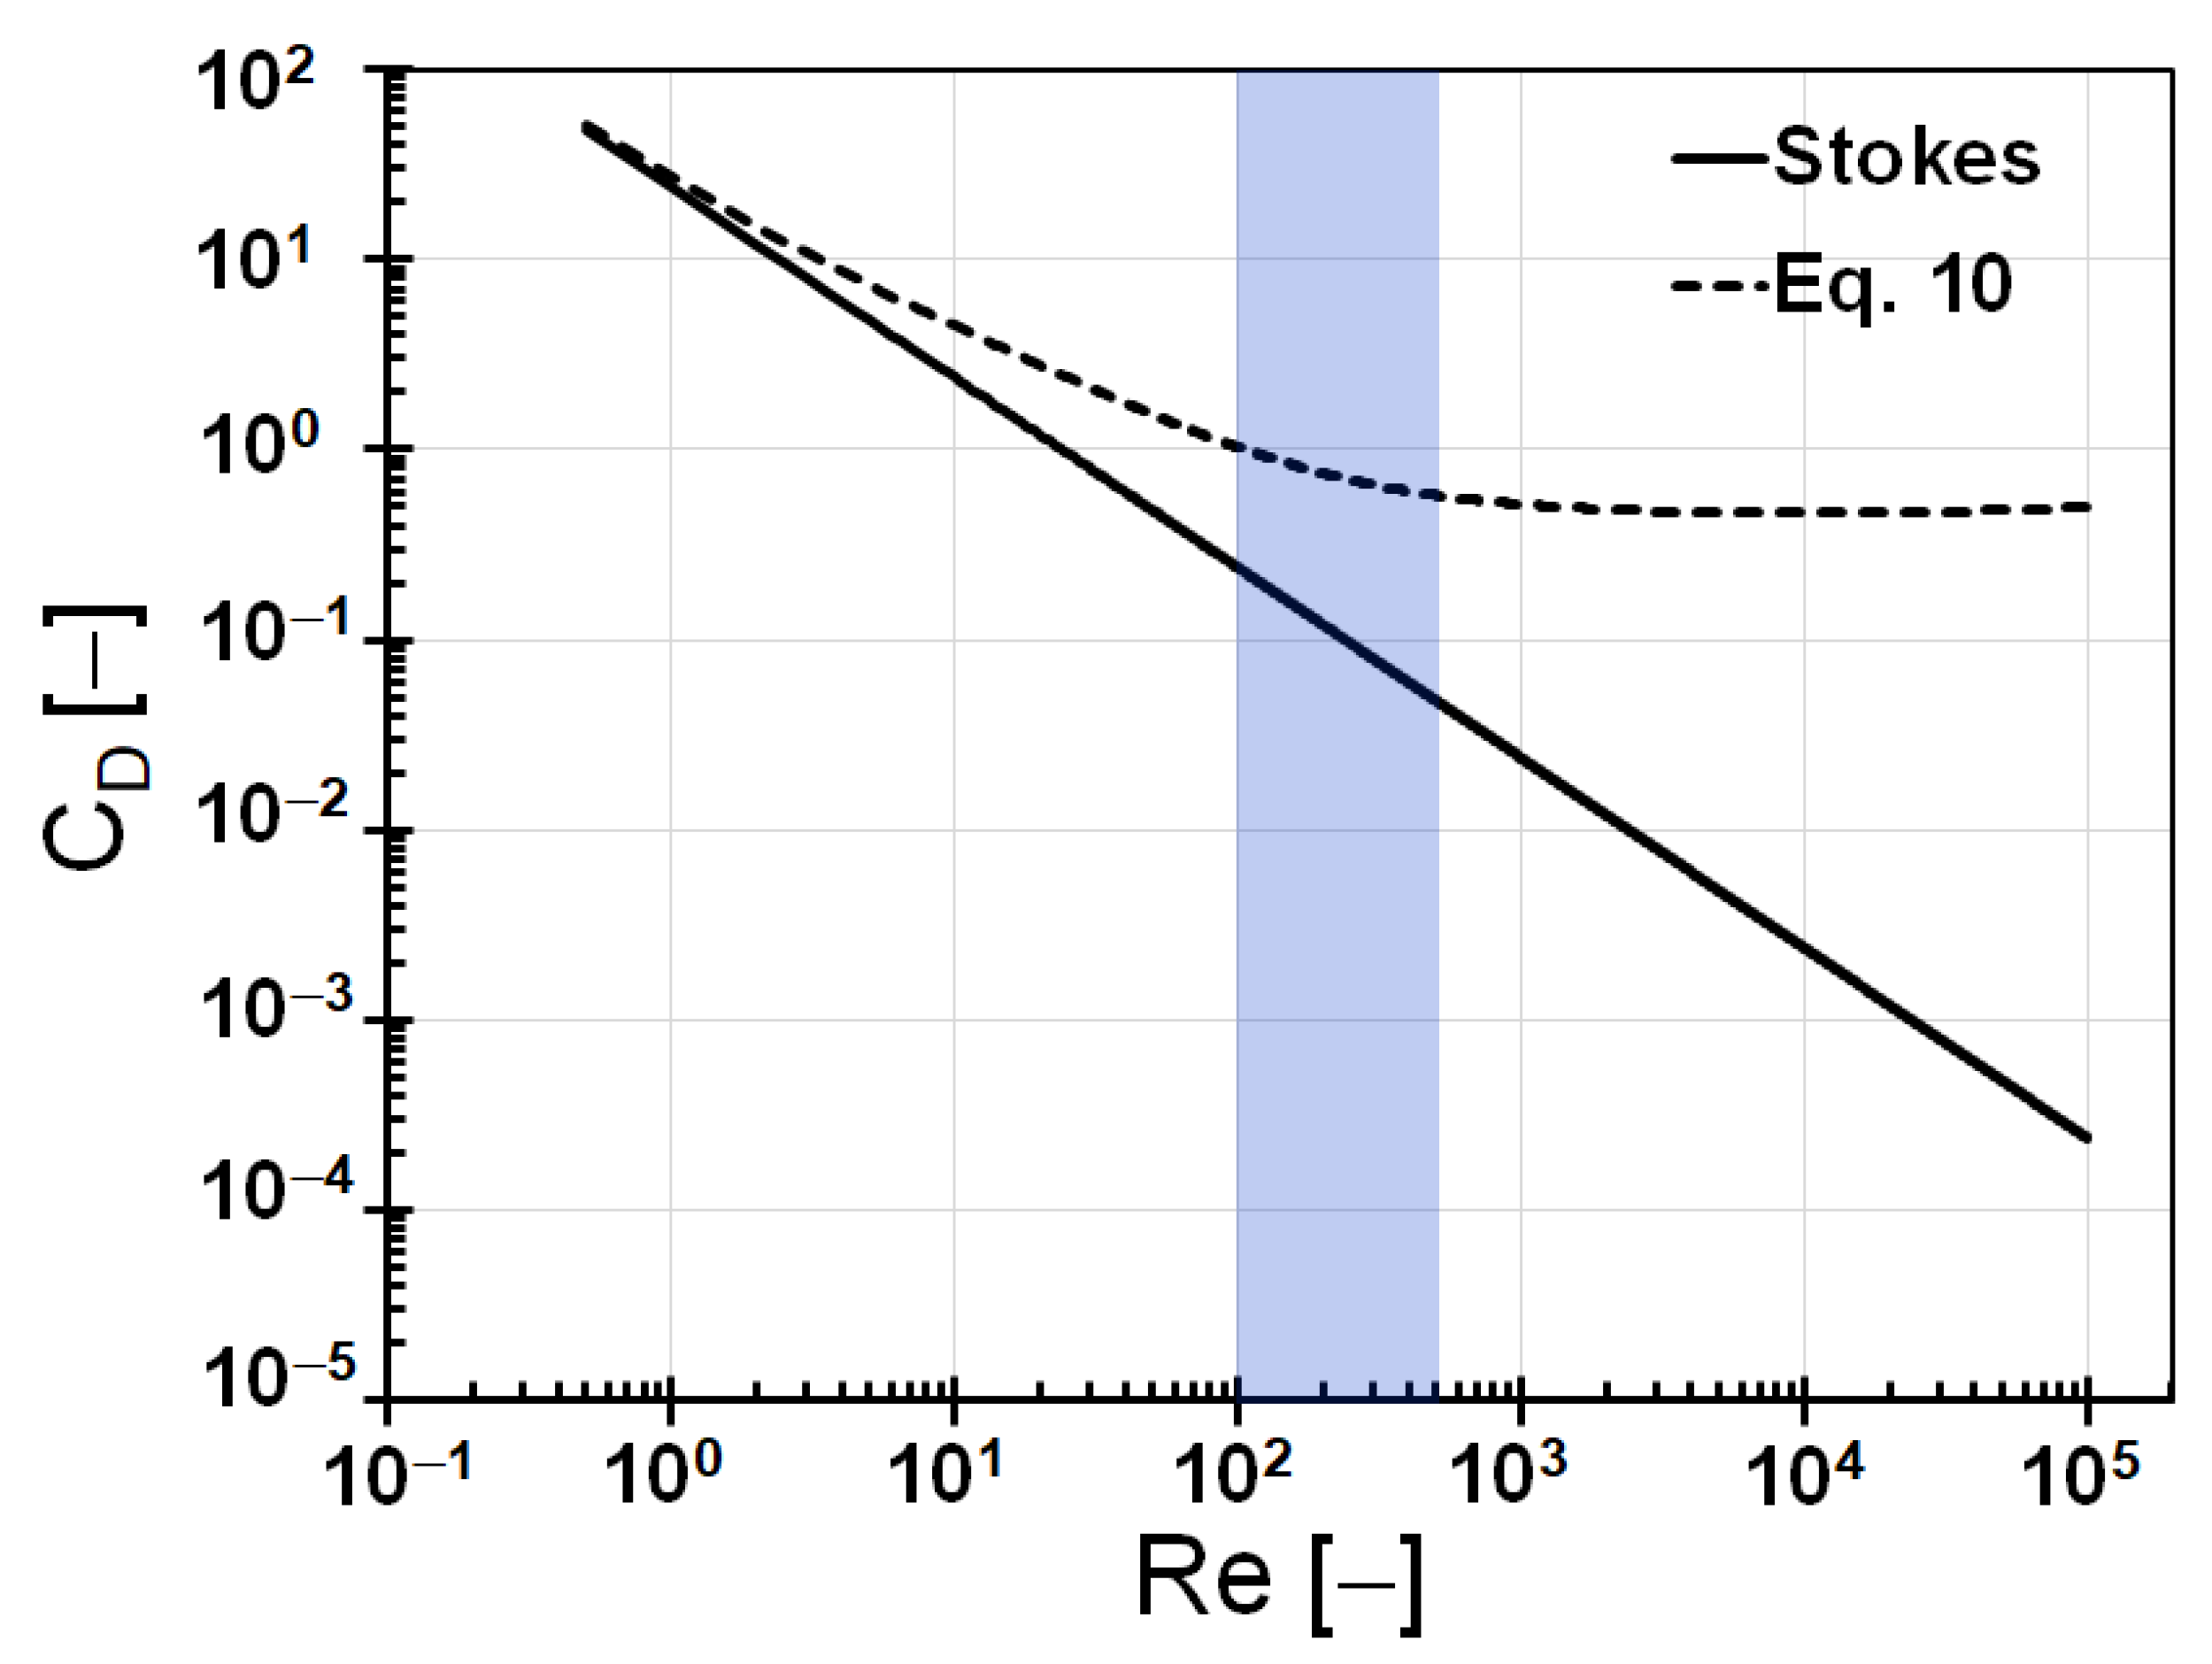
m is the mass of each droplet, the dependence of on is assumed to be the same for both the leading and trailing droplets, and equal to that for an isolated droplet of the same diameter and velocity falling vertically down, and m/s2 is the acceleration due to gravity. In the above equations, the term on the left-hand side is the net force acting on the droplet, and on the right-hand side, the first term is the weight of the droplet, the second term is the buoyancy force acting on the droplet, and the third term is the drag force acting on the droplet corrected for inertial effects through the coefficient of drag, (more details are given below). Note that the inertial correction factor (also referred to as the ‘drag factor’ [32]), () tends to unity for Stokes flow conditions at which (where (i = 1 or 2)). The coefficient of drag is, in general, a function of the Reynolds number. There are many correlations available for the dependence of on the Reynolds number [34]. Among the relations that do not diverge at low to moderate values of , the one reported by Mikhailov and Freire [34], given by Equation (10), is appropriate for the range of Reynolds numbers (≈O(100)) considered here. Note that Equation (10) is a modification of the Stokes drag coefficient, given by , by taking inertial terms into account. Hence, even though the governing equations are formulated from Stokes flow assumption, the inertial effect is incorporated in the calculation of using Equation (10), which is suitable at higher Reynolds number conditions (≫1, up to ) too. Mikhailov and Freire [34] showed that Equation (10) closely agrees with the experimental data on the coefficient of drag for an isolated solid sphere reported by Roos and Willmarth [35] and Brown and Lawler [36]. Please refer to Appendix B for a comparison between the drag coefficient given by Equation (10) and the Stokesian drag coefficient.
Using Equations (4) and (7) in Equations (8) and (9) gives the following equations for the rate of change of velocity of the leading and trailing droplets, respectively.
The time evolution of velocity of the leading and trailing droplets can be computed using Equations (11) and (12), respectively. Now, the time evolution of center-to-center separation of the droplets, at the nth time step () can be calculated from the above equations as follows.
Equation (13) is solved, together with Equations (11) and (12), by a forward marching in time with a time step = 0.1 ms, and the initial conditions , , , and . It was observed from our calculations that decreasing the time step from 0.1 to 0.001 ms resulted in a maximum deviation of ≈1.09% in the parameters of motion (, , , and ).
Validation of the Theoretical Approach
As mentioned in Section 1, there are very few experiments reported in the literature on double-/triple-droplet systems falling down vertically along their line of centers, especially at injection velocities much greater than the terminal velocity of free fall. This poses a constraint on the breadth of comparison of theoretical predictions with experimental data in terms of the number and range of parameters. Keeping this restriction in mind, the current theoretical predictions are compared with the very limited experimental data reported in the literature [27,28], as shown in Figure 2.
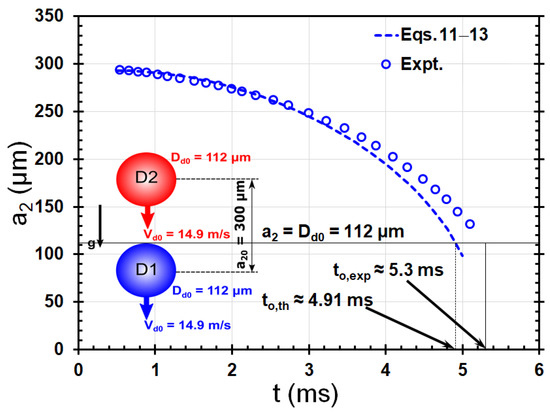
Figure 2.
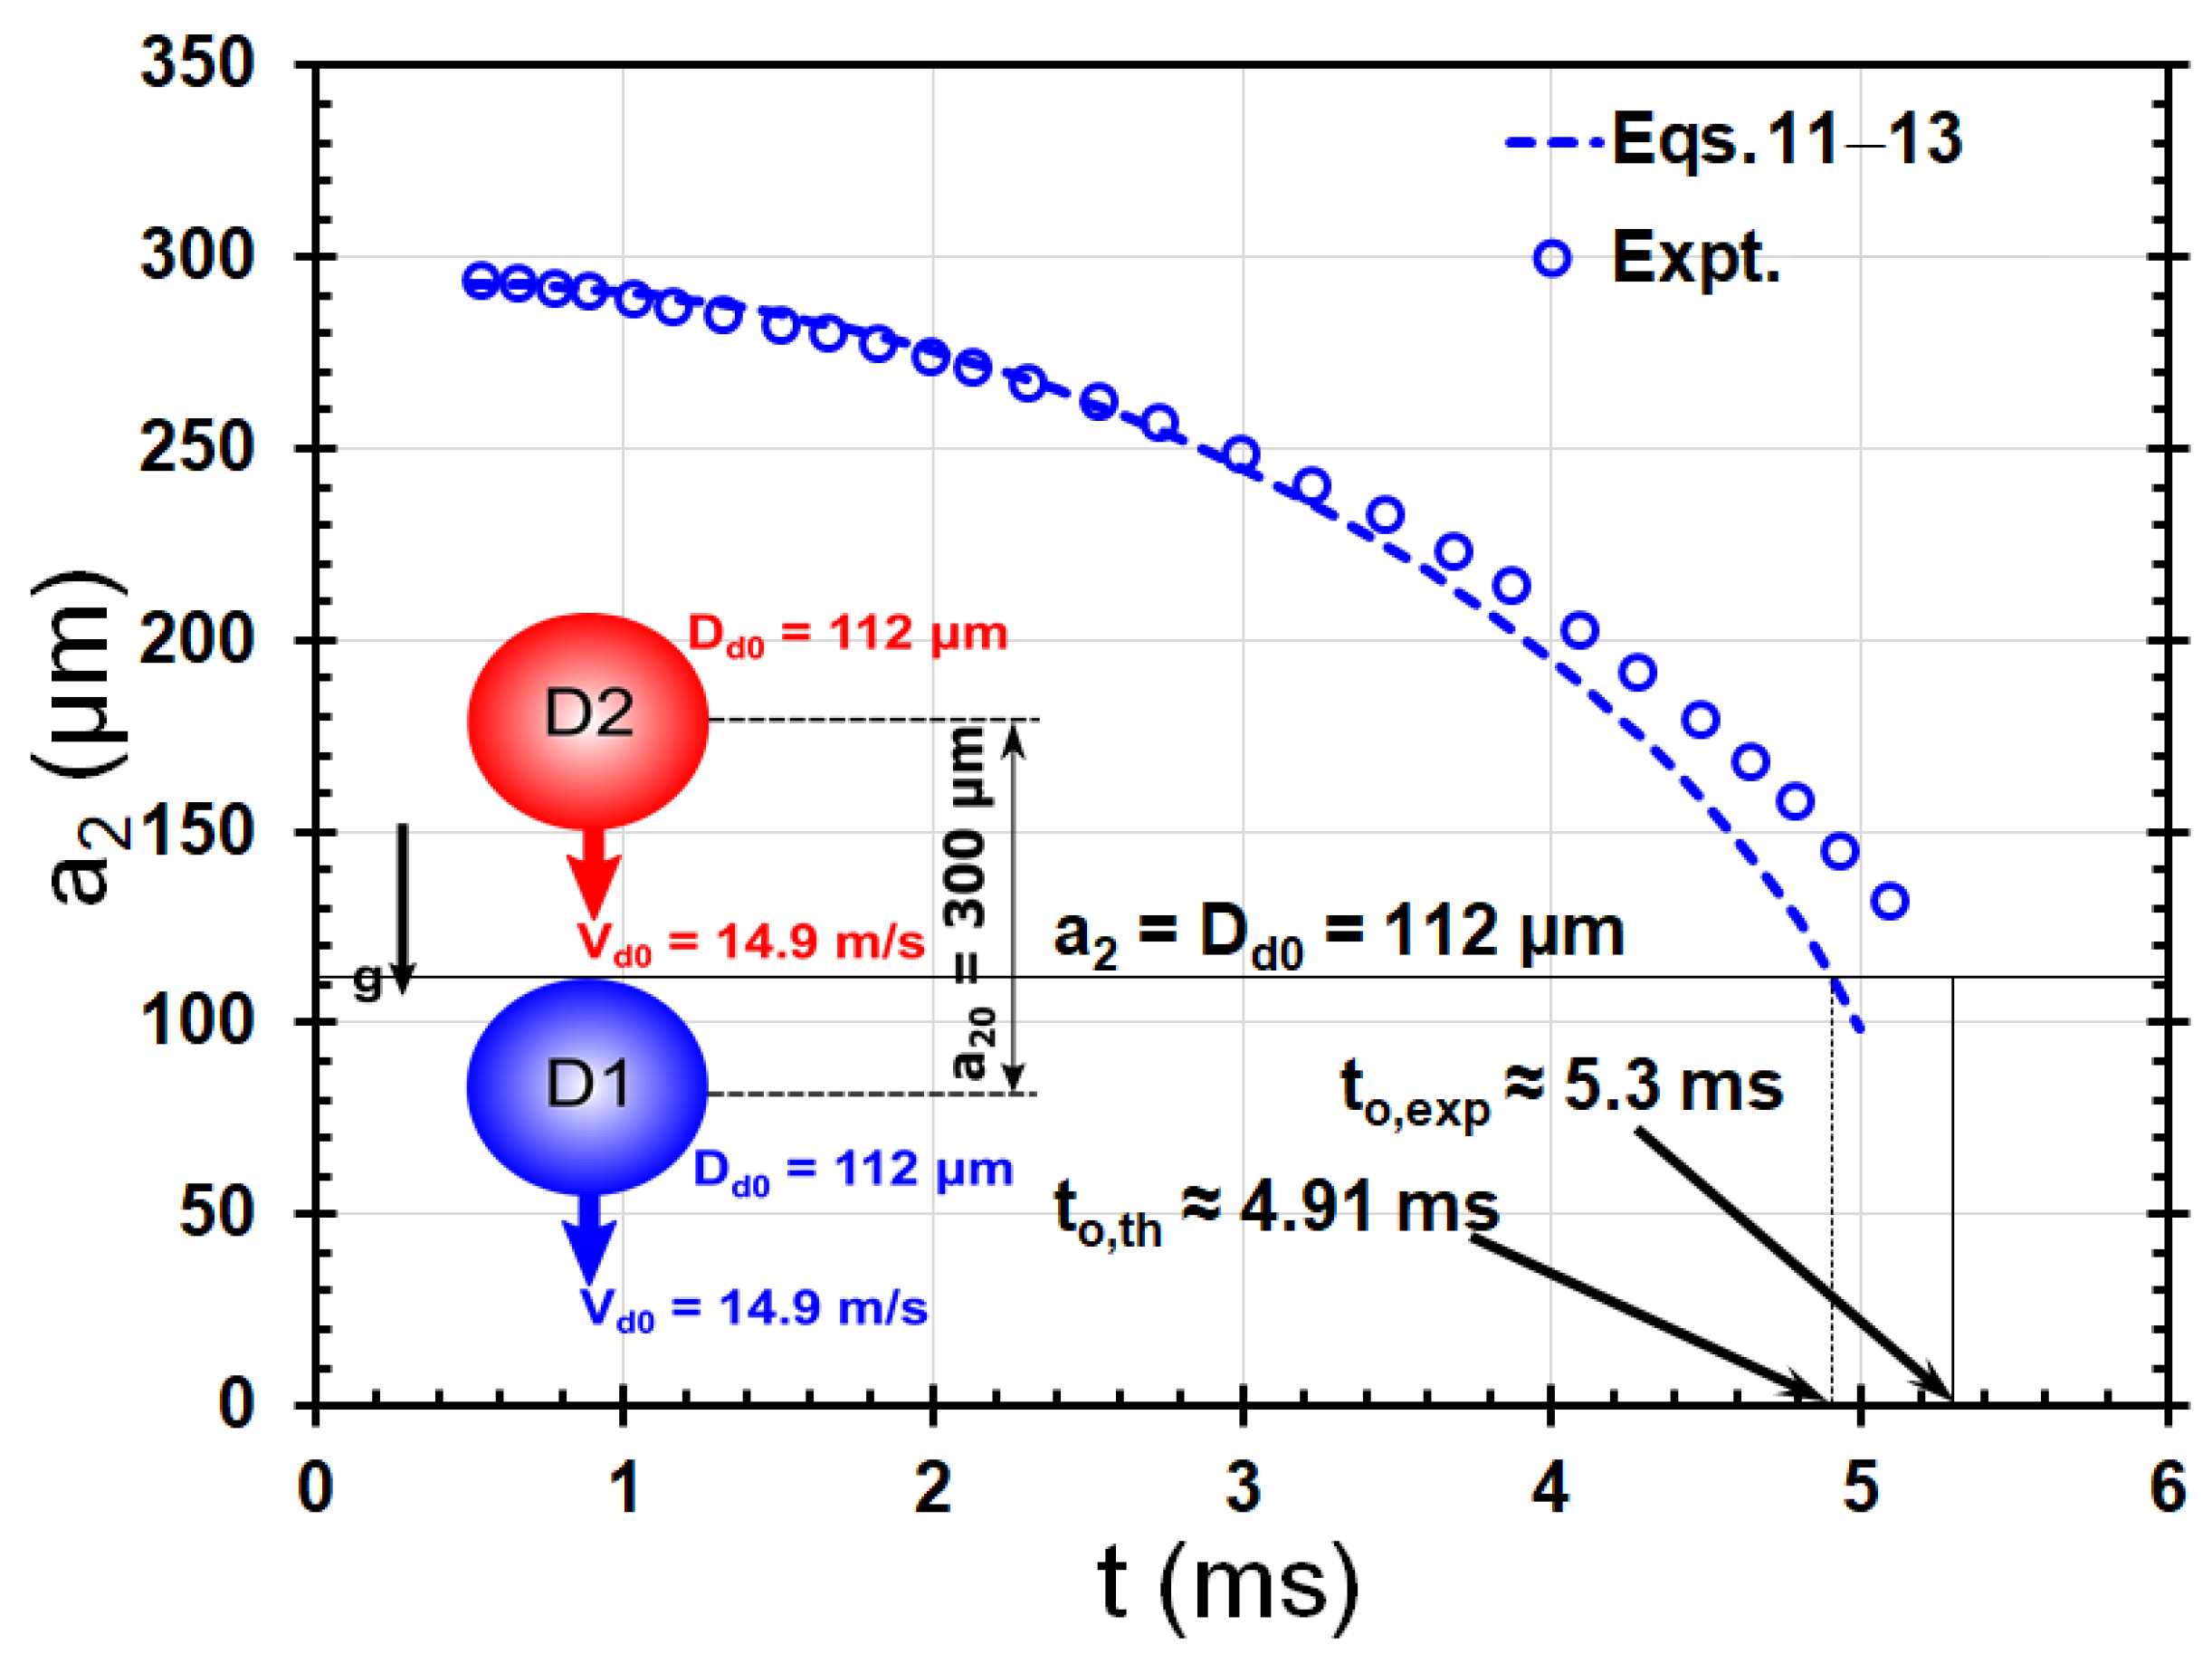
Typical time evolution of the center-to-center separation of an iso-propanol double-droplet system ( = 786 kg/m3) injected into ambient air ( = 1.2 kg/m3; = 1.81 × Pa·s), from experiments [27,28] (symbols) and as predicted by Equation (13) (line). Initial conditions (at t = 0.5 ms): = 112 m; = 293 m; = 14.9 m/s; is calculated using Equation (10). The initial values of Reynolds number and aerodynamic Weber number are 110.6 and 1.38, respectively. Adapted from [27,28].
Note that, in experiments, the droplets form a stream (see Figure 3), whereas in the model, an isolated double-droplet system is considered (see Figure 1). It should be noted here that the model double-droplet system is a special case of the droplet stream when (see Figure 3). Moreover, in the experiments, the initial velocities of leading and trailing droplets are different since they are not injected at the same time. However, the model presented in Section 2 assumes that the droplets are injected at the same velocity at ms. In reality, the velocity of the leading droplet will change when it travels a distance corresponding to the initial separation between the droplets . It can be shown using Equation (11) that, for the experimental conditions used for comparison here, this change in velocity of the leading droplet from the assumed velocity is only around 0.13%. For experimental conditions where the initial separation and/or the drag force is much larger, this deviation of assumed initial velocity from the actual velocity of the leading droplet could be larger. Keeping the above-mentioned points in mind, the comparison between theoretical predictions and experimental data, as shown in Figure 2, is discussed below.
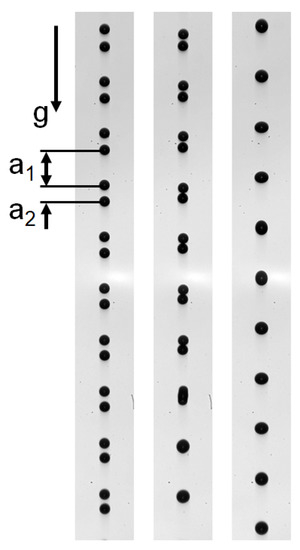
Figure 3.
Images showing a train of double-droplet systems falling vertically down under gravity at a time period in the vicinity of . The experimental conditions are the same as given in the caption of Figure 2. Each column corresponds to the image taken at a particular distance from the exit of the droplet generator, l; l increases from left to right and top to bottom. Adapted from [27].
The predictions obtained using Equations (11)–(13) seem to capture the overall trend of the experimental data. Even though the equations governing the droplet motion were formulated based on Stokes flow (), their predictions capture the trend of the experimental data at a value of (110.6), which is two orders of magnitude larger than the typical values of in the Stokes flow regime. A similar observation was reported in a recent study of the same problem using the homotopy analysis method [30]. The inclusion of inertial effects through an empirical drag coefficient in this study (Equation (10)) and through higher-order terms in in the previous study (see Equation (7) in [30]) could be potential reasons for the apparently surprising match between the predictions and the experimental data. The predictions, however, underestimate the temporal evolution of at larger values of t, and this leads to an underprediction of the time taken by the droplets to come in contact with each other, . The error in the prediction of for this experimental case is around 7.4%. The time-averaged error in the predictions relative to the experimental data presented in Figure 2 is 4.84%; this is 9.97% for ms, and close to ms, it is around 24.37 %.
Neglecting the skin friction drag component in the analysis could be one of the potential reasons for this under-prediction. Please refer to Appendix A.1 for a more detailed discussion on this matter. Another possible reason for the deviation of the prediction from experimental data is neglecting the ‘non-oscillatory deformation’ in the analysis. The aerodynamic Weber number at the experimental flow condition (1.38) is slightly larger than the critical value for the transition from ‘no deformation’ to ‘non-oscillatory deformation’ for an isolated droplet in an ambient flow (1.1) [29]. A third possibility is the difference in the configuration of the droplets between the experiments (droplet stream) and the model (double-droplet), as indicated before (compare Figure 1 and Figure 3). Results from DNS, where a droplet stream is considered (similar to that in experiments), showed that with an increase in the distance between the double-droplet and its neighboring droplets ( increases), droplet grouping happens faster ( decreases). This is qualitatively in line with the theoretical predictions in Figure 2, which correspond to a very large separation between the double-droplet and its neighboring droplets () and show a faster grouping than in the experiments.
The critical droplet Weber number for coalescence without further (‘stretching’) separation when two identical droplets undergo head-on collision is given by the following semi-empirical relation [37].
In Equation (14), is the droplet Ohnesorge number as defined in [37], and is the critical value of droplet collision Weber number, [38], calculated based on the approach velocity of the droplets at the instant they come in contact for the first time, ; for , the approaching droplets will coalesce without further undergoing separation due to shape oscillations associated with the coalescence process (‘stretching separation’) [14,38]. The approach velocity of the droplets at the instant for the experimental condition presented in Figure 2 is ≈0.14 m/s (see Figure 7). The corresponding value of is ≈0.080, which is much less than (from Equation (14)) and seems to be less than the critical Weber number above-which a transition from coalescence to ‘reflexive separation’ takes place [39,40,41]. The images close to the time corresponding to the experimental data in Figure 2 are shown in Figure 3. Indeed, the approaching droplets undergo coalescence and remain as one bigger droplet afterward.
3. Results and Discussion
The predictions from the simple model, as described in Section 2, are presented and discussed in this section. The effects of (i) initial droplet diameter, , (ii) initial droplet velocity, , and (iii) initial separation between the droplets, on (a) the temporal evolution of velocity of leading and trailing droplets, (b) the temporal evolution of the separation between the leading and trailing droplets, (c) the time taken for the droplet surfaces to come in contact with each other, and (d) the velocity of approach of droplets at the time of their first contact are looked into.
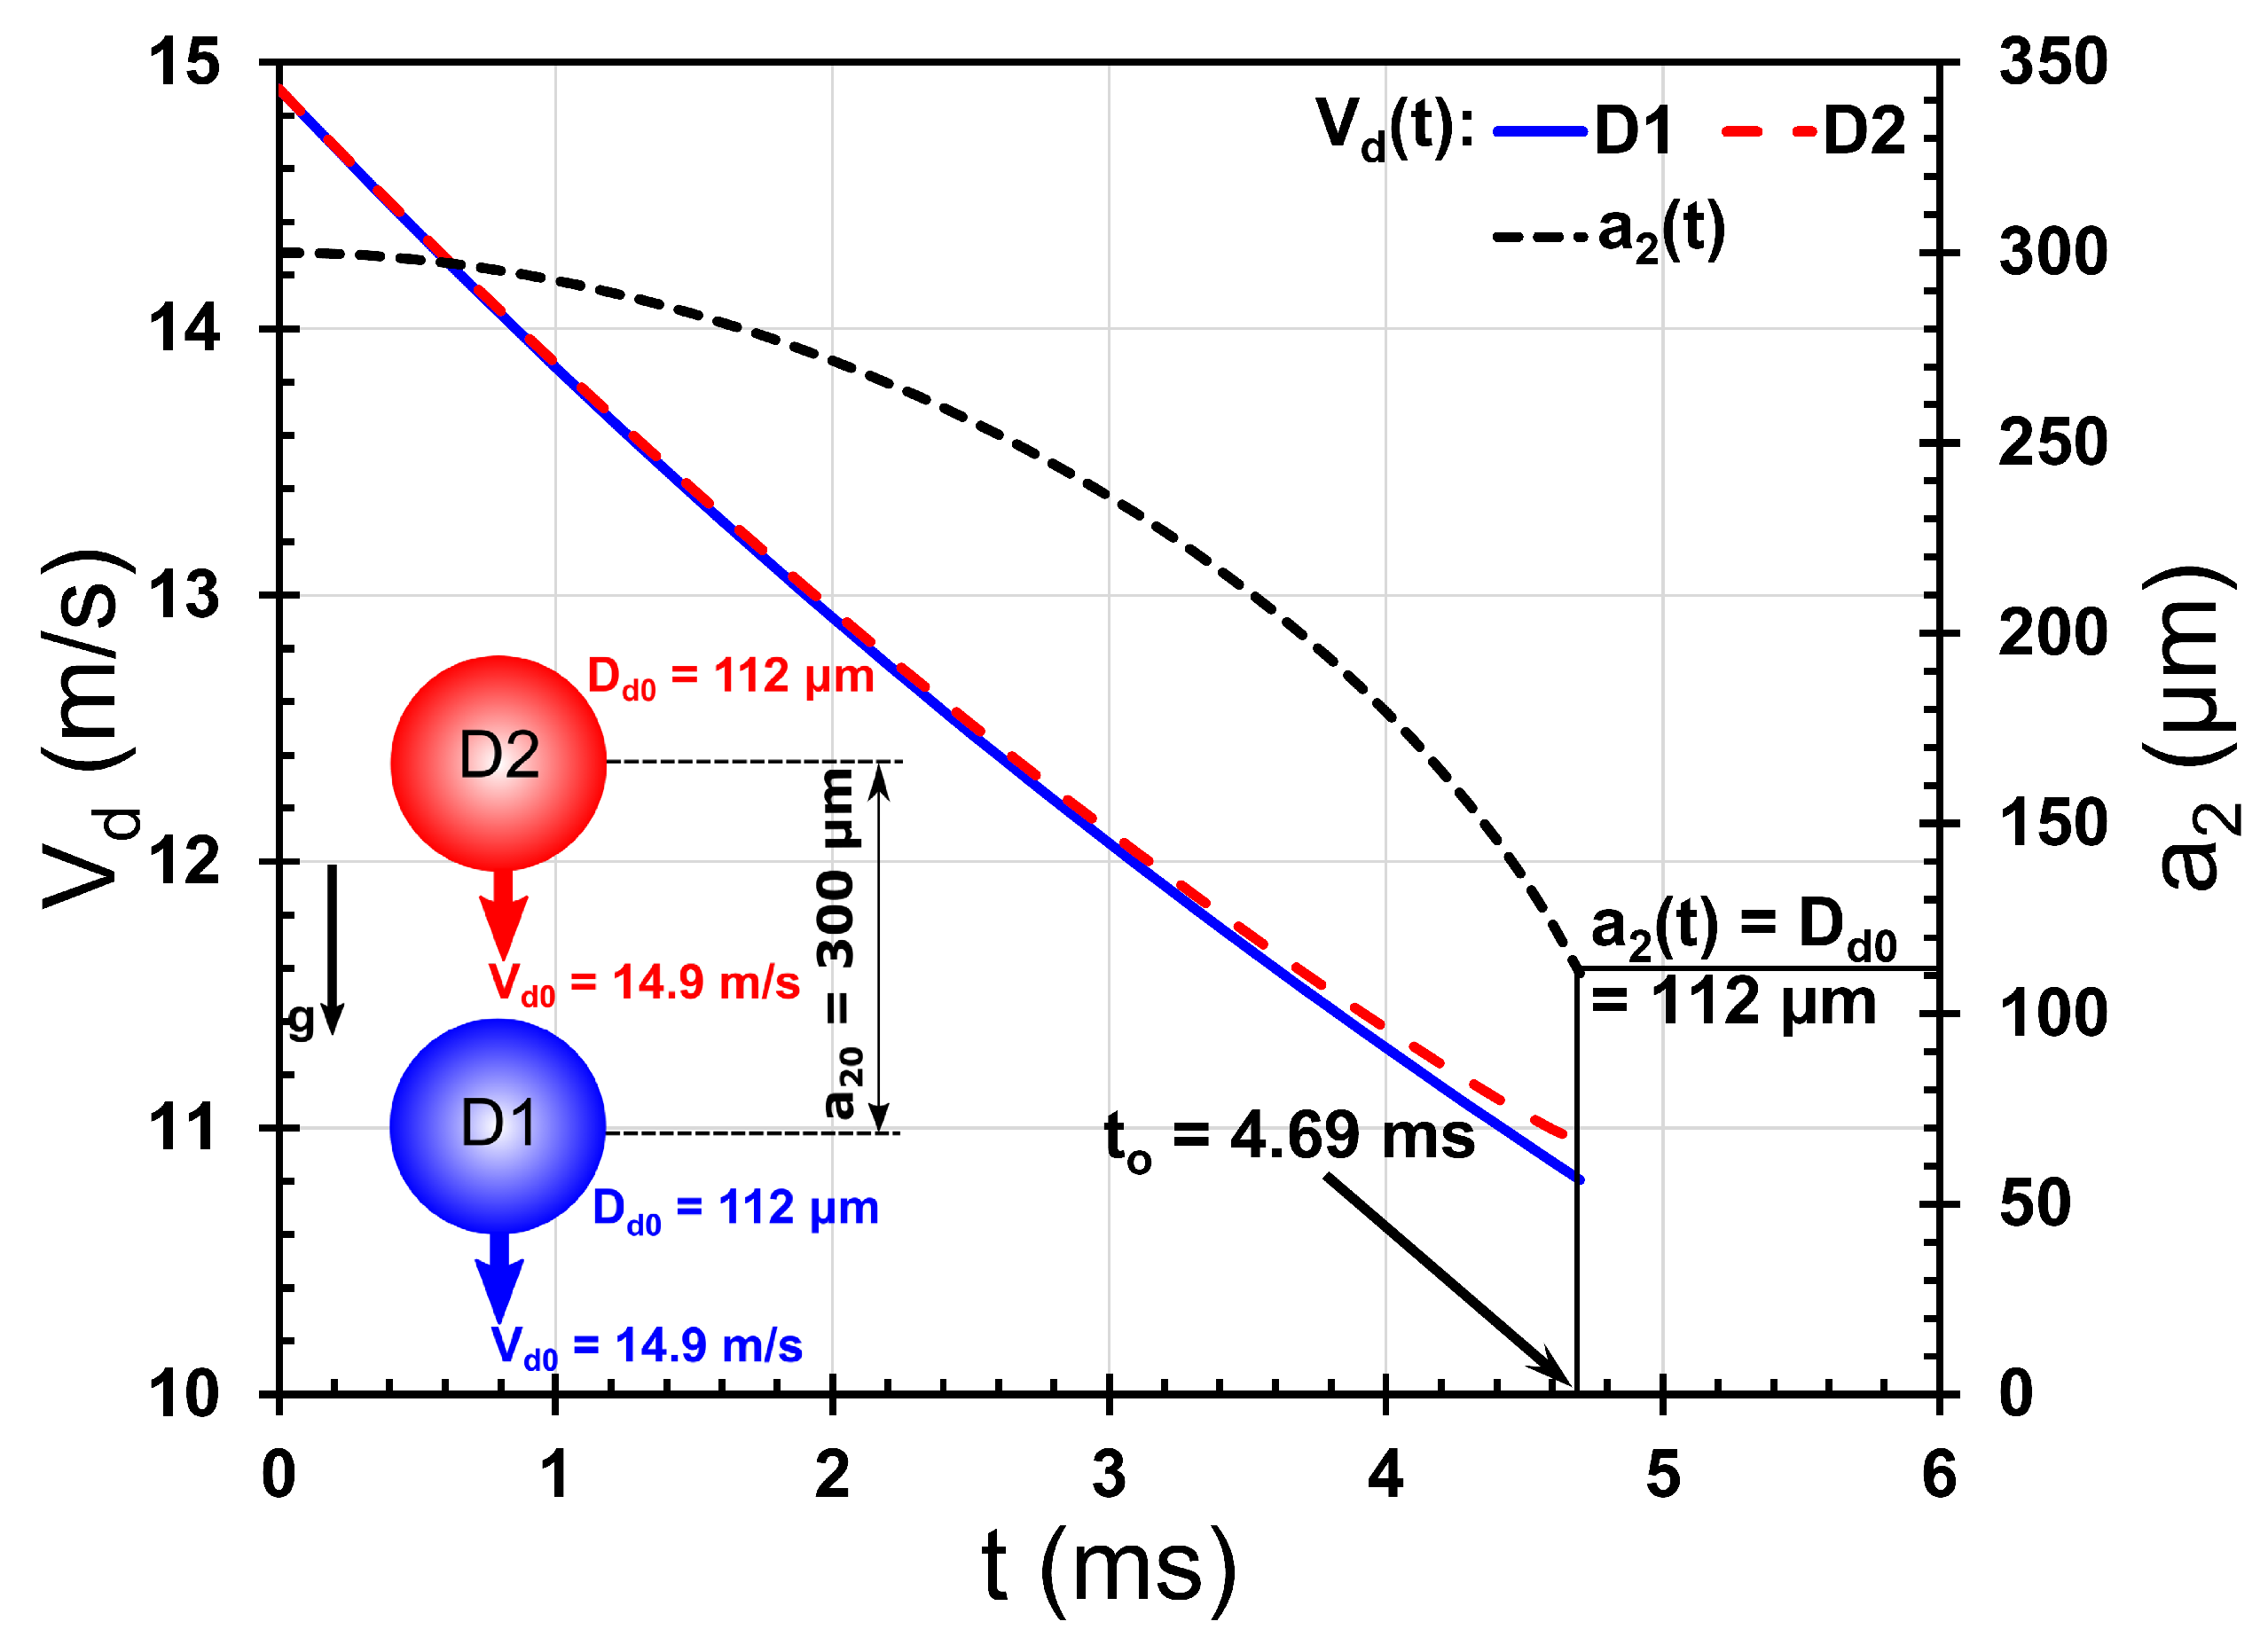
Figure 4 shows a typical time evolution of velocities of the leading (D1) and trailing (D2) iso-propanol ( = 786 kg/m3, = 2.38 mPa·s, = 21.7 mN/m) droplets of initial diameter, = 112 m, injected into ambient air ( = 1.2 kg/m3; = 1.81 Pa·s) at the same initial velocity, = 14.9 m/s. The corresponding time evolution of the center-to-center separation between the droplets, , is also shown in Figure 4. It is evident that as time progresses, the velocity of the leading droplet deviates from that of the trailing droplet, with the former decreasing faster than the latter. This clearly indicates that the drag force acting on the leading droplet is greater than that acting on the trailing droplet. This difference in velocity, which increases with time, leads to a decrease in the separation between the droplets with time, as shown by the temporal variation of . When the separation between the droplets becomes equal to the droplet diameter (), the droplets meet at their surface. This instant of time, , can be extracted from plots similar to Figure 4. The approach velocity of the droplets at this instant of time, , together with the droplet diameter and physical properties of the liquid and ambient, provide information to predict whether the droplets will undergo coalescence, bouncing, reflexive separation, stretching separation, or shattering after this instant.
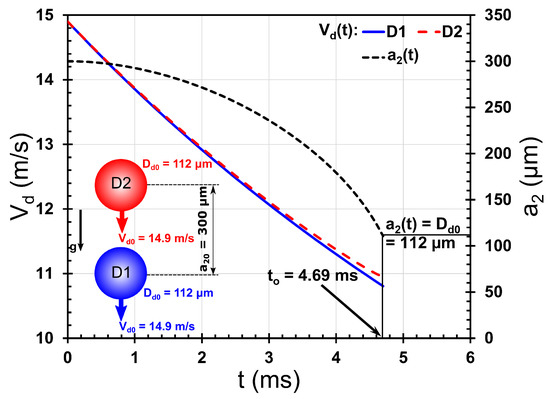
Figure 4.
, versus : Typical time evolution of the velocities and center-to-center separation of an iso-propanol double-droplet system ( = 786 kg/m3) injected into ambient air ( = 1.2 kg/m3; = 1.81 × Pa·s), as predicted by Equations (11)–(13). Initial conditions: = 112 m; = 300 m; = 14.9 m/s; is calculated using Equation (10). The initial values of Reynolds number and aerodynamic Weber number are 110.6 and 1.38, respectively.
3.1. Effect of Initial Droplet Diameter,
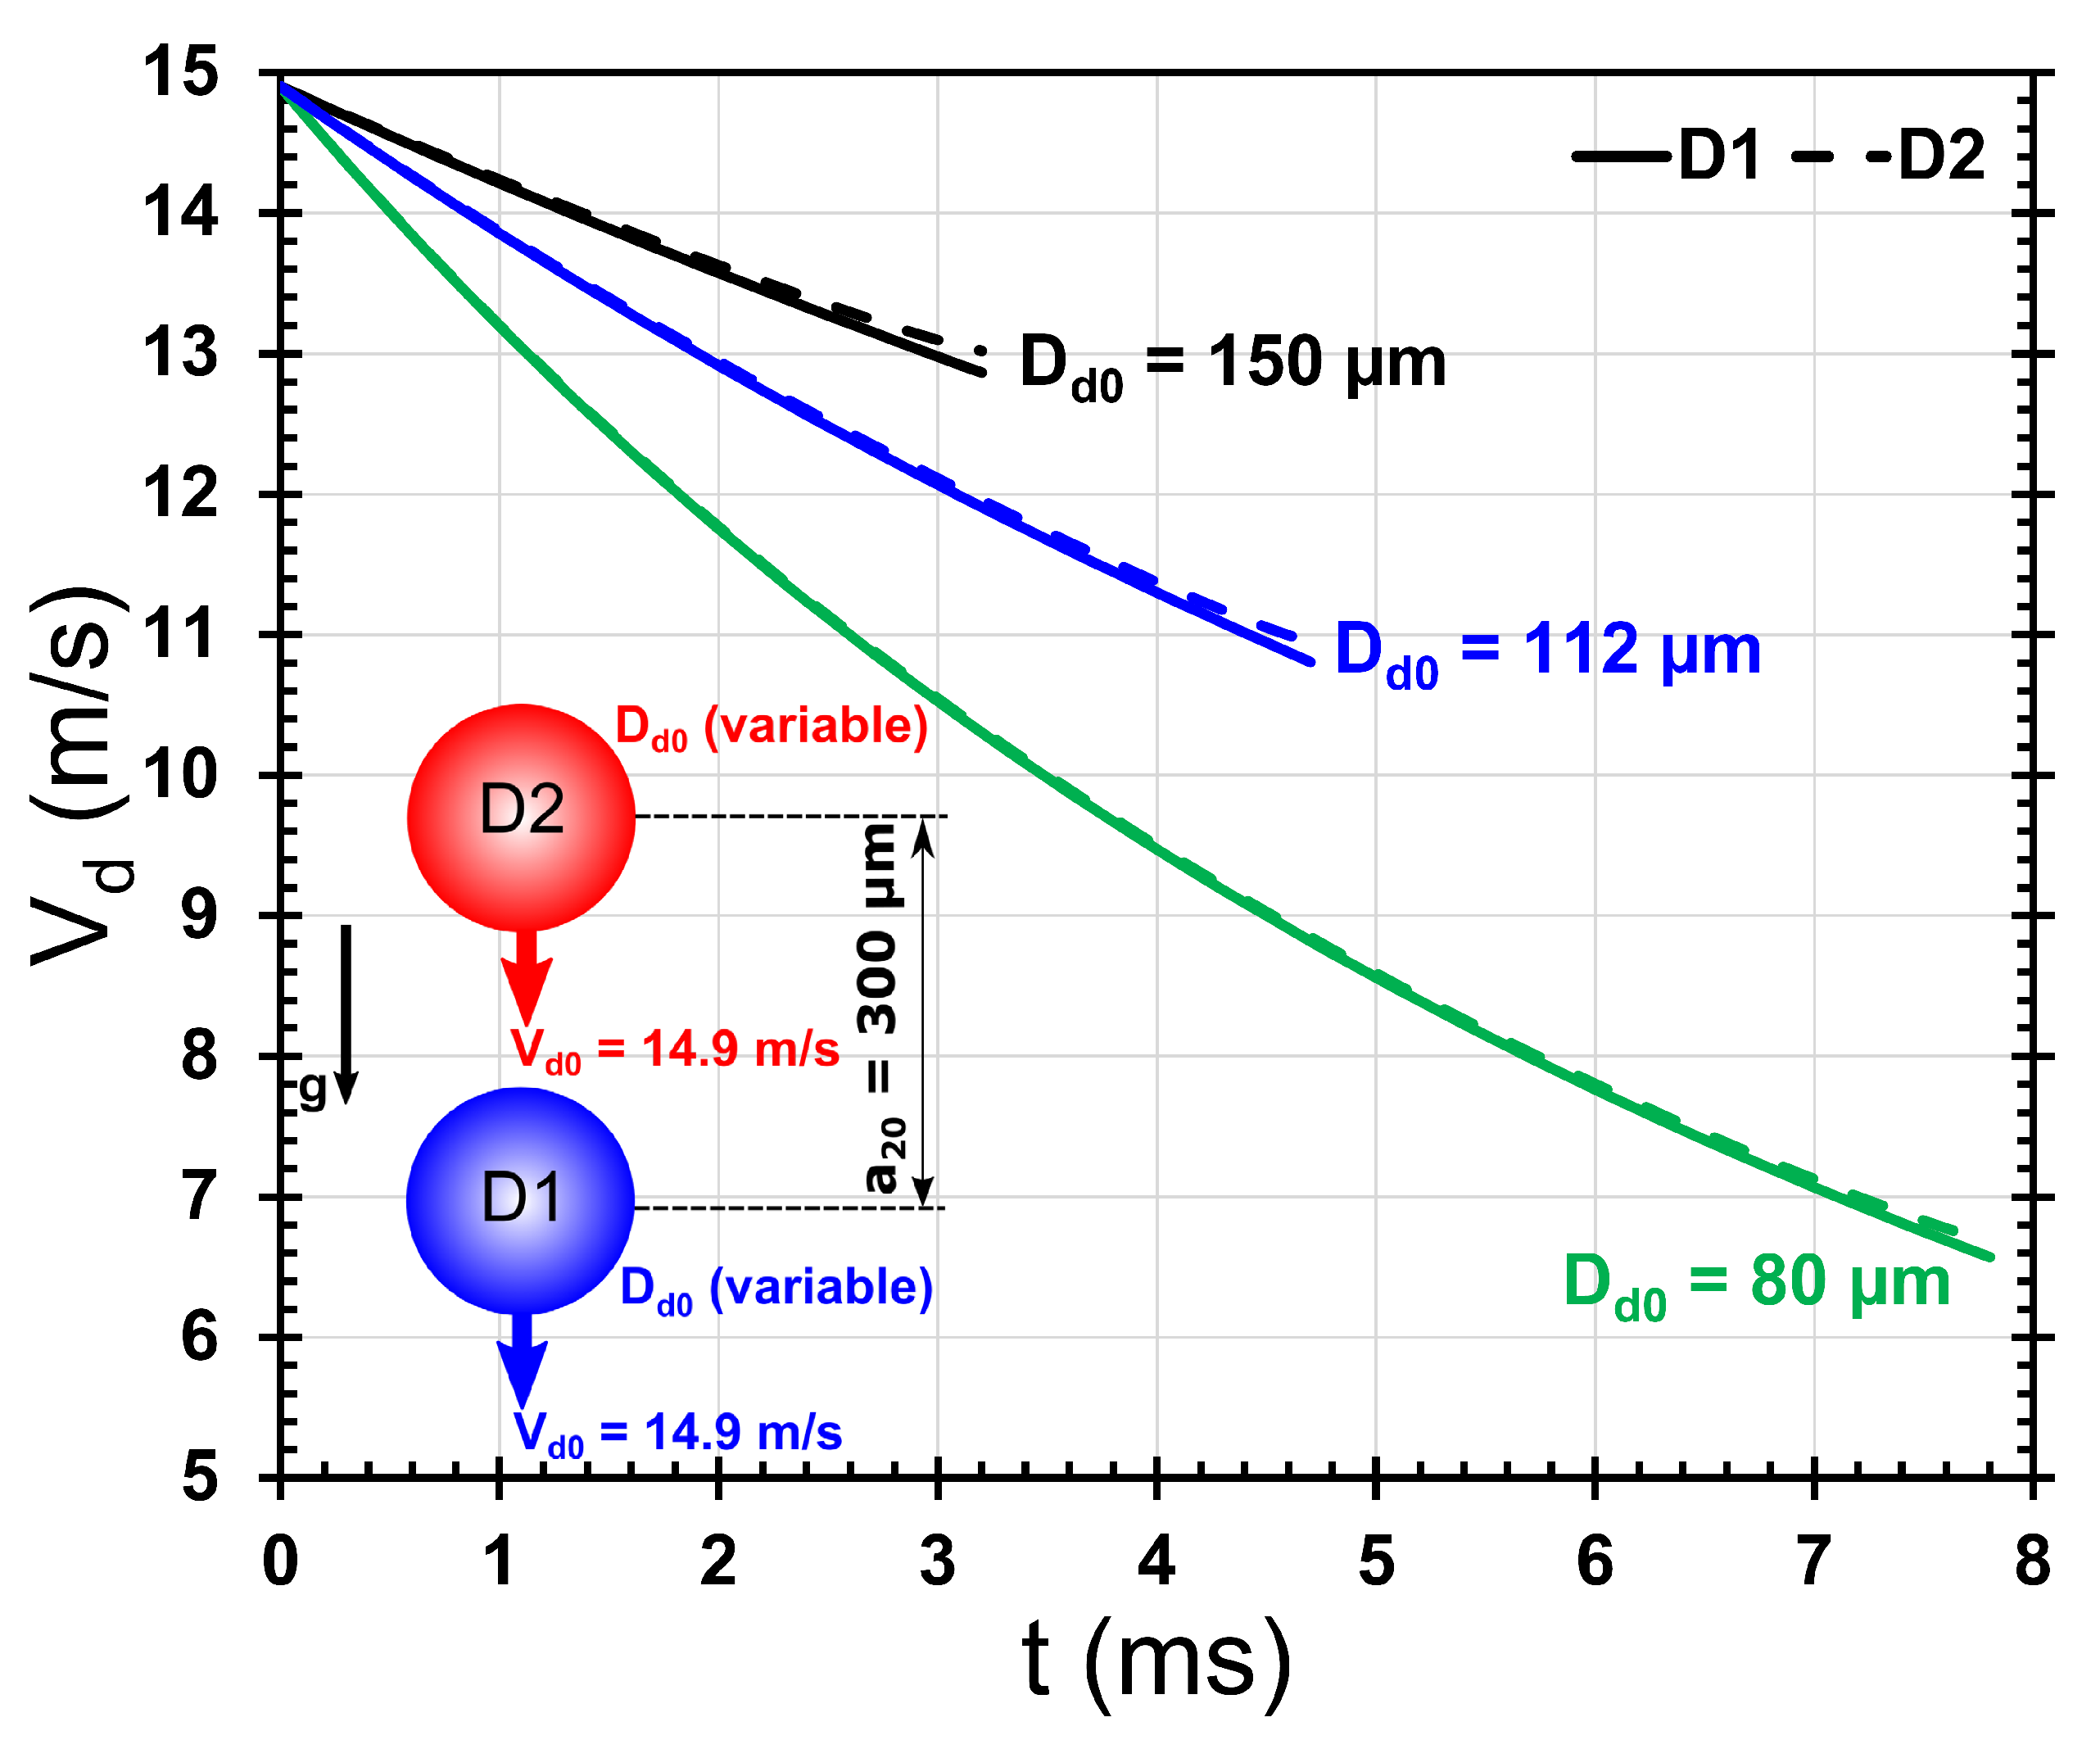
Figure 5 shows the time evolution of the velocities of the leading (D1) and trailing (D2) droplets for three typical cases of droplet diameters. Other initial conditions remain the same as in Figure 4. The difference in the time evolution of the velocities of leading and trailing droplets, as seen in Figure 4, is also observed at different droplet diameters in Figure 5. Injected at the same initial velocity with the same initial separation, smaller droplets experience a higher rate of change in their velocities with time (higher deceleration), as evident from the different slopes of curves in Figure 5. This is due to an interplay of the effects of the drag coefficient, Reynolds number, and droplet diameter on the deceleration due to the drag force experienced by the droplet (see the second term on the right-hand side of Equations (11) and (12)). A decrease in droplet diameter leads to a decrease in Reynolds number and a corresponding increase in drag coefficient, as given by Equation (10). Both of these effects counter-act, resulting in a net increase in drag force term in Equations (11) and (12) when the droplet diameter decreases. Furthermore, a decrease in droplet diameter directly results in an increase in deceleration due to the drag force term in Equations (11) and (12). Overall, decreasing the droplet diameter results in an increase in the deceleration due to the drag force experienced by the droplet, as observed in Figure 5.
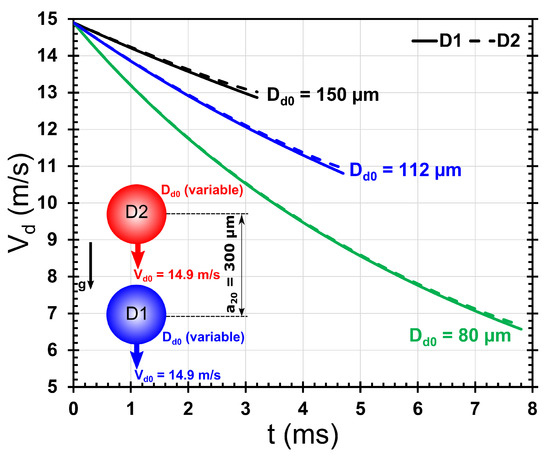
Figure 5.
Effect of on : Time evolution of the velocities of leading (D1) and trailing (D2) iso-propanol droplets for three typical cases of droplet diameters, = 80, 112, and 150 m, as predicted by Equations (11) and (12). Other input parameters are kept the same as in Figure 4: = 300 m; = 14.9 m/s; is calculated using Equation (10). The initial values of the Reynolds number and aerodynamic Weber number for the three cases (80, 112, 150) m are (79.0, 110.6, 148.2) and (0.98, 1.38, 1.84), respectively.
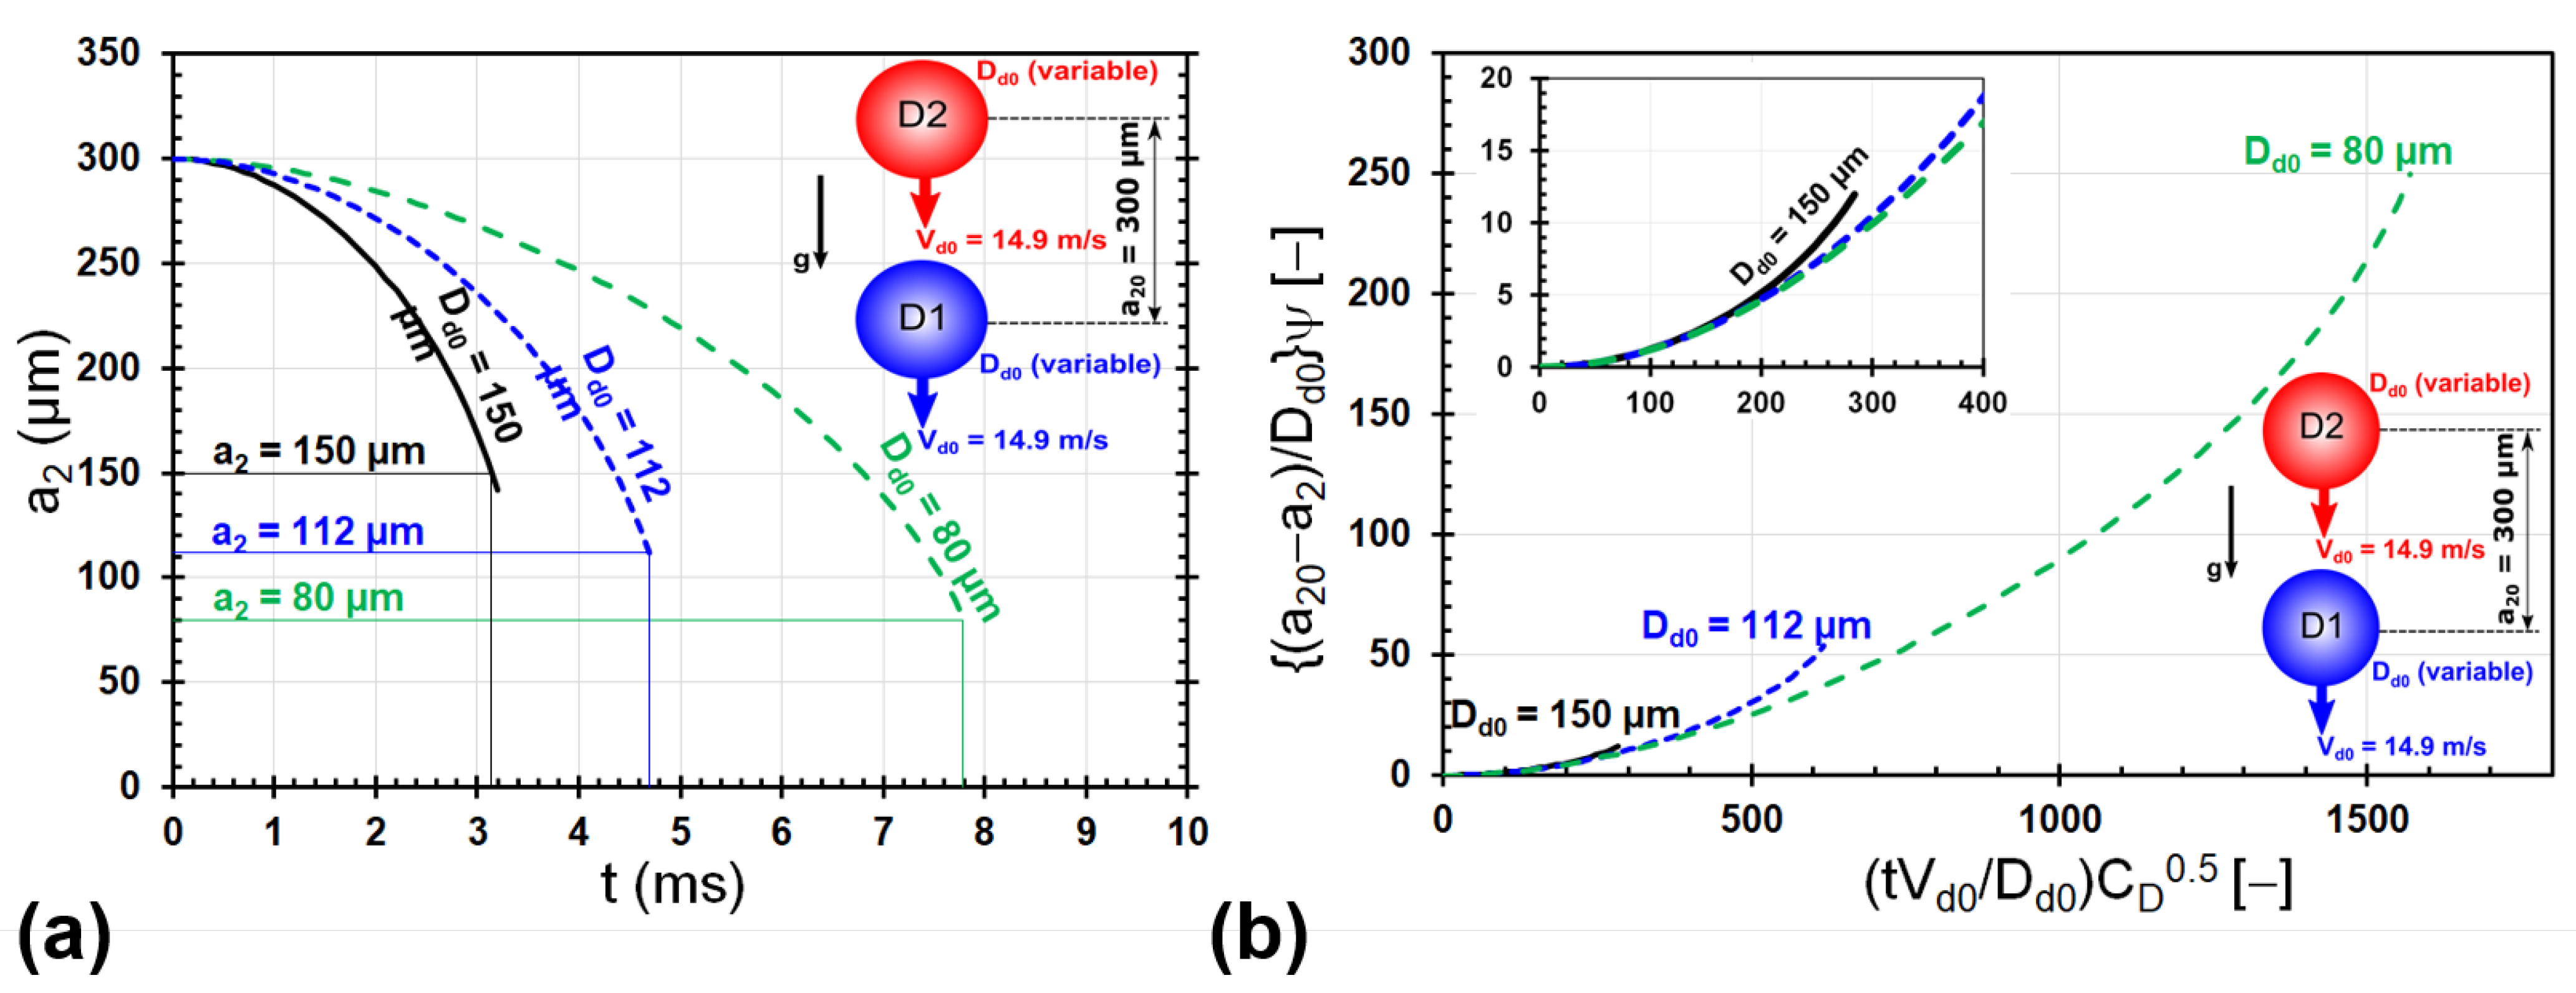
Figure 6a shows the time evolution of the center-to-center separation of the droplets for the cases shown in Figure 5. For smaller droplets, with other initial conditions remaining the same, the time evolution of the separation between them is slower, and it takes longer for the droplets to come in contact with each other (as indicated by the vertical lines in Figure 6a). This is due to the combined effect of the time evolution of their relative velocities and the smaller center-to-center separation at contact (due to smaller droplet diameters). The trends shown in Figure 6a are normalized using the non-dimensionalization discussed in Appendix C; the corresponding non-dimensional plot is shown in Figure 6b. It is clear that the non-dimensionalization is able to collapse the trends into one curve, except for the instants of time when the droplets are very close to each other (larger values of time in each case of ).
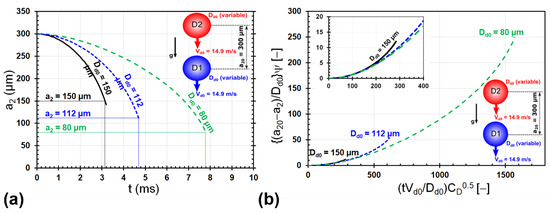
Figure 6.
Effect of on : (a) Time evolution of the center-to-center separation of iso-propanol droplets in the double-droplet system corresponding to the cases shown in Figure 5, as predicted by Equations (11–13). (b) Non-dimensionalized version of the plot shown in (a) using the non-dimensionalization discussed in Appendix C. In the vertical axis, the factor . The inset shows a magnified version to show the trend for = 150 m more clearly.
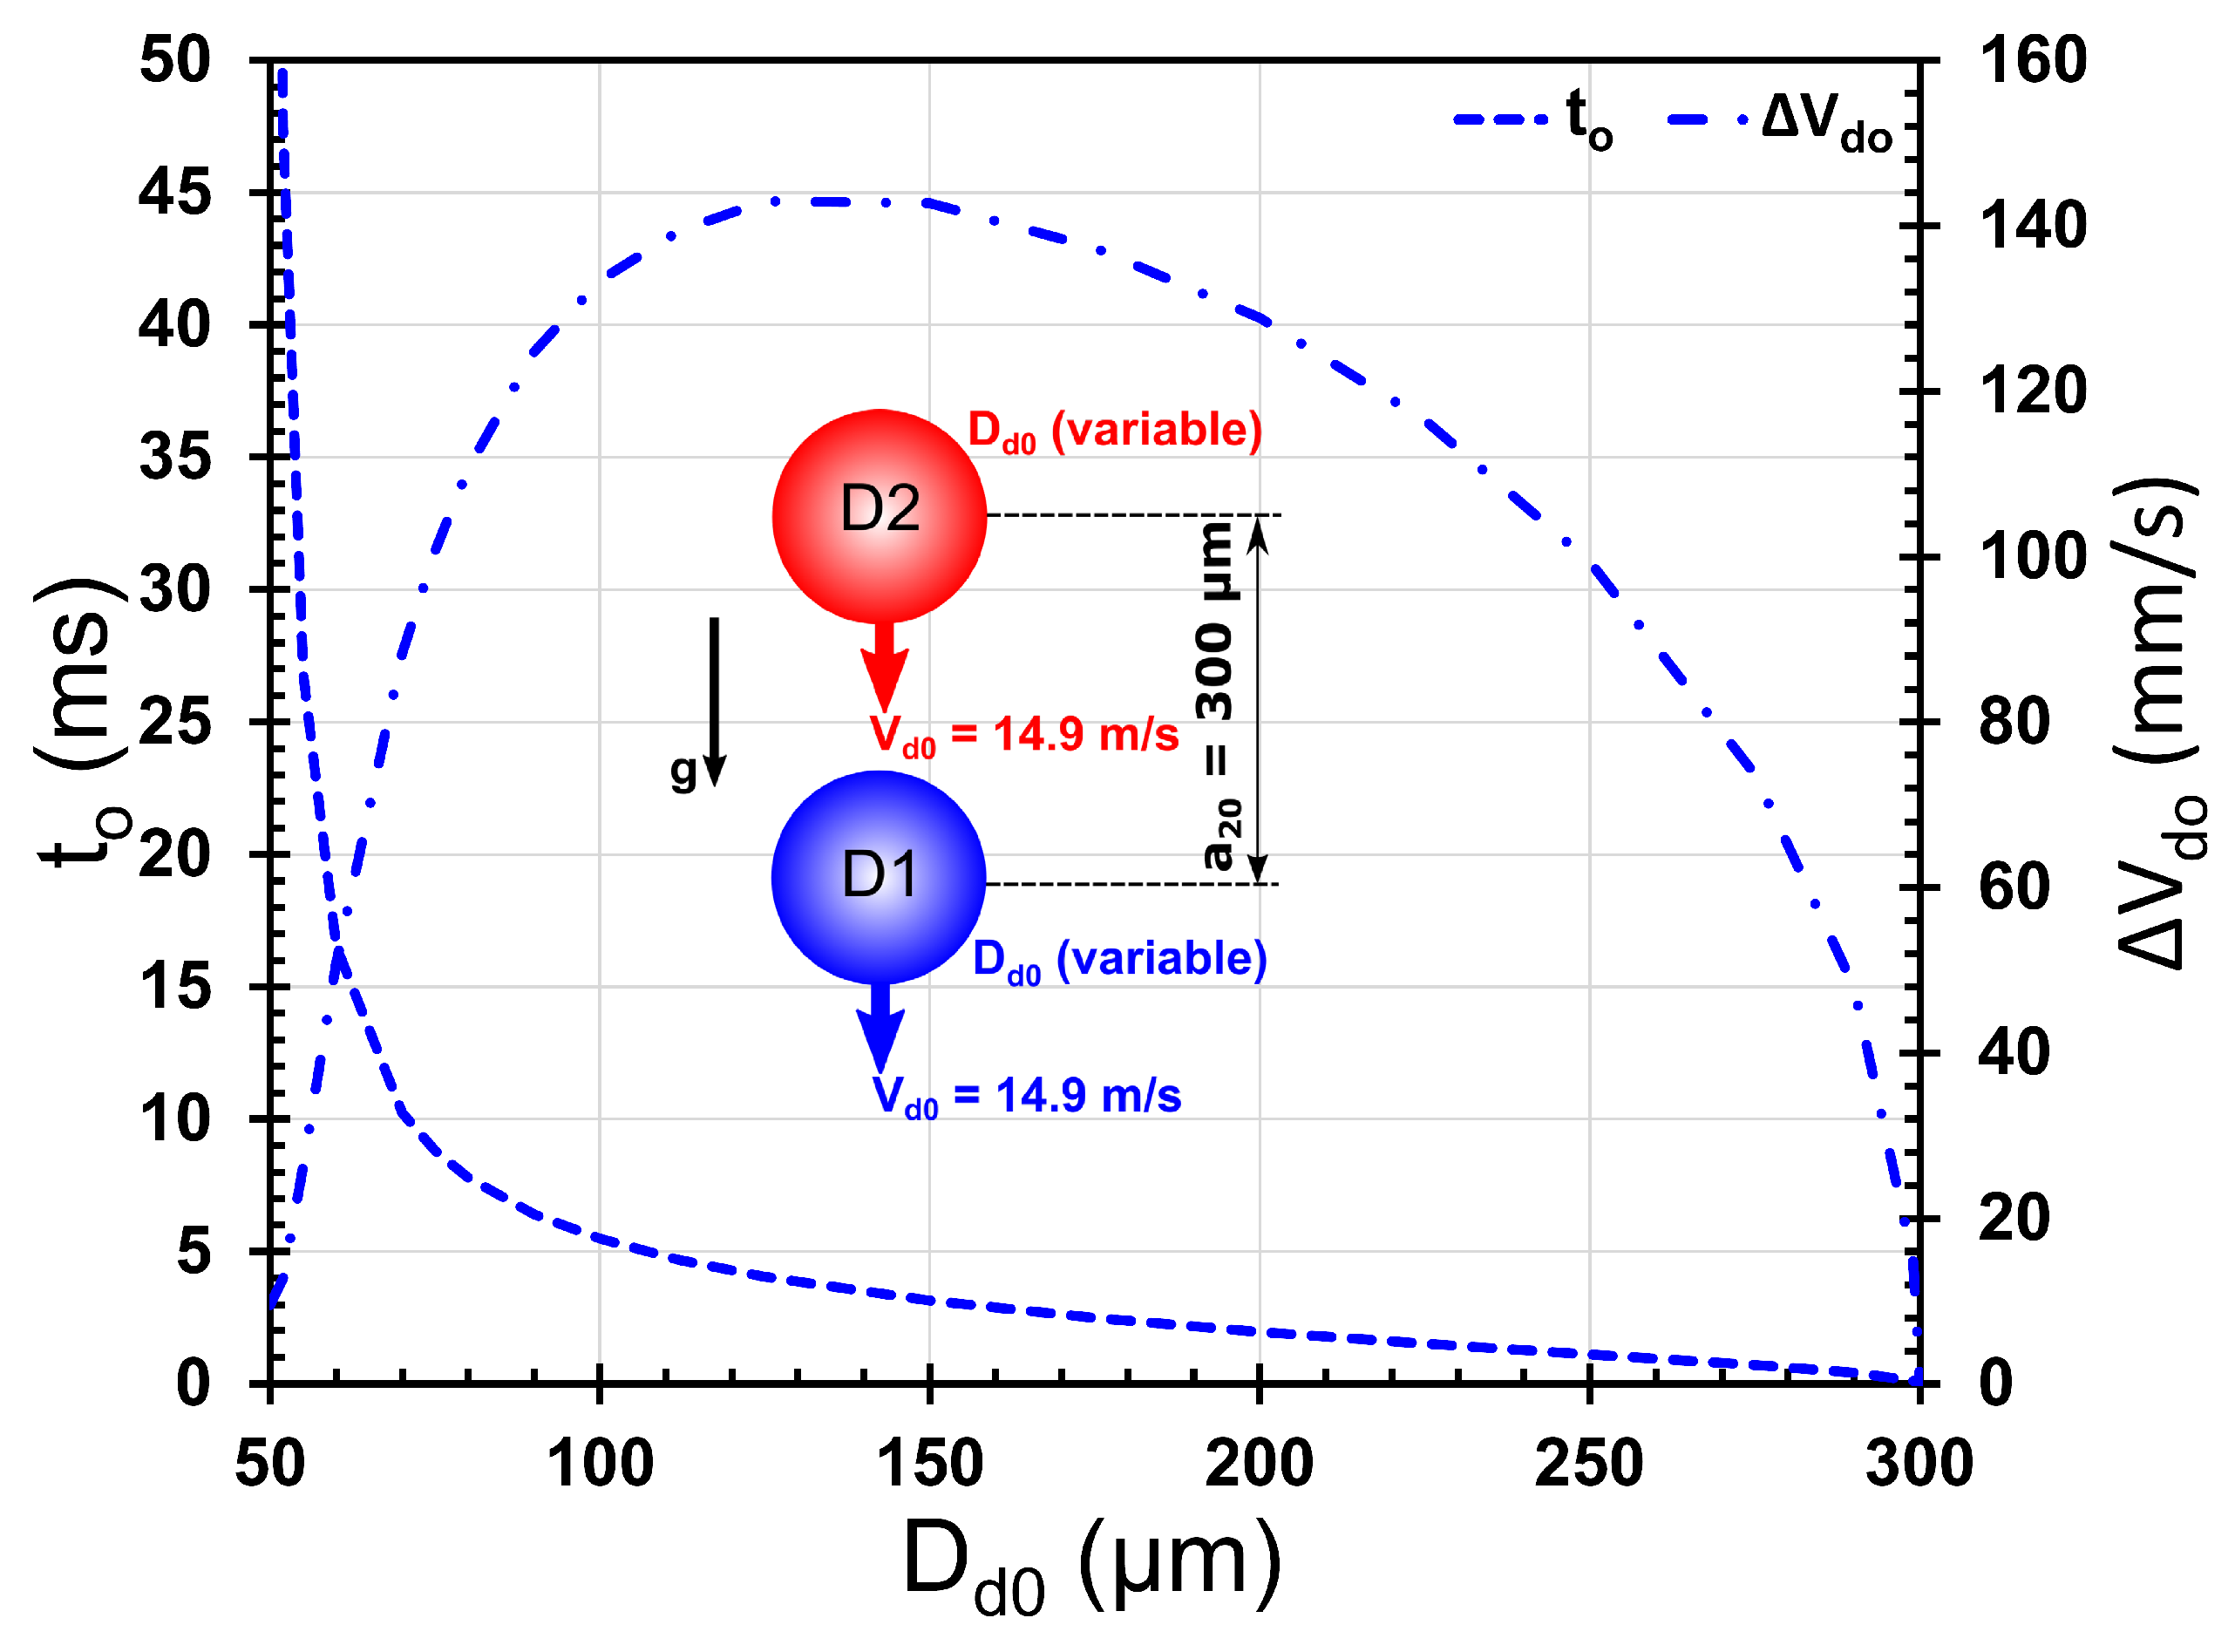
Figure 7 shows the effect of the initial droplet diameter on the time taken by the droplets to come in contact with each other for the first time and their approach velocity at this instant of time. The initial values of the droplet center-to-center separation and velocities are the same as in Figure 4. Both and have a non-linear dependence on the initial droplet diameter. For smaller droplets, decreases drastically with a small increase in droplet size, with a corresponding steep increase in the approach velocity. For droplets of size larger than a critical value, the approach velocity decreases with an increase in droplet diameter. Considering the extreme cases of droplet size: for very small droplets, is very large (compared to the time scale of flow around the droplets), resulting in an overall reduction in the velocity of the double-droplet system at a large , and hence, the approach velocity of droplets is also quite small; for very large droplets (of diameter the same as their center-to-center separation), vanishes, and hence, the relative velocity of the approach also becomes zero. This is a possible explanation for the non-linear trend of with exhibiting a maximum in Figure 7.
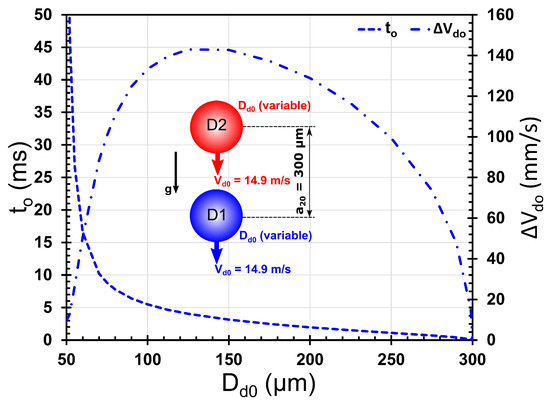
Figure 7.
Effect of on and : The effect of the initial droplet diameter on the time taken by the droplets to come in contact with each other for the first time and their approach velocity at this instant. Other parameters are the same as in Figure 4: = 300 m; = 14.9 m/s; is calculated using Equation (10). The ranges of the initial values of the Reynolds number and aerodynamic Weber number are 49.4–296.4 and 0.61–3.68, respectively.
It should be noted here that, at higher values of , the quantitative values of and in Figure 7 should be treated with caution since the aerodynamic Weber number calculated at could be significant enough to cause a ‘non-oscillatory deformation’ of the droplet [29]. For example, the range of aerodynamic Weber numbers, , in which ‘non-oscillatory deformation’ is observed for an isolated droplet exposed to an ambient air flow, is ∼1.1–5.0 for the range of Ohnesorge numbers 0.03–0.08 corresponding to the variation of from 50 to 300 m in Figure 7 (see Figure 1 in [29]). The range of aerodynamic Weber numbers, corresponding to the parameter range in Figure 7, is 0.61–3.68; for ∼90 m, , where ‘non-oscillatory deformation’ of the droplets may become increasingly significant [29]. Furthermore, in the range of Reynolds numbers shown in Figure 7 (49.4–296.4), it is known that for flow over an isolated sphere, the ring vortex in its wake starts oscillating for ∼130 [32], and hence, wake unsteadiness could become increasingly relevant as increases beyond 130. Hence, the predictions under these conditions should be treated with caution.
3.2. Effect of Initial Droplet Velocity,
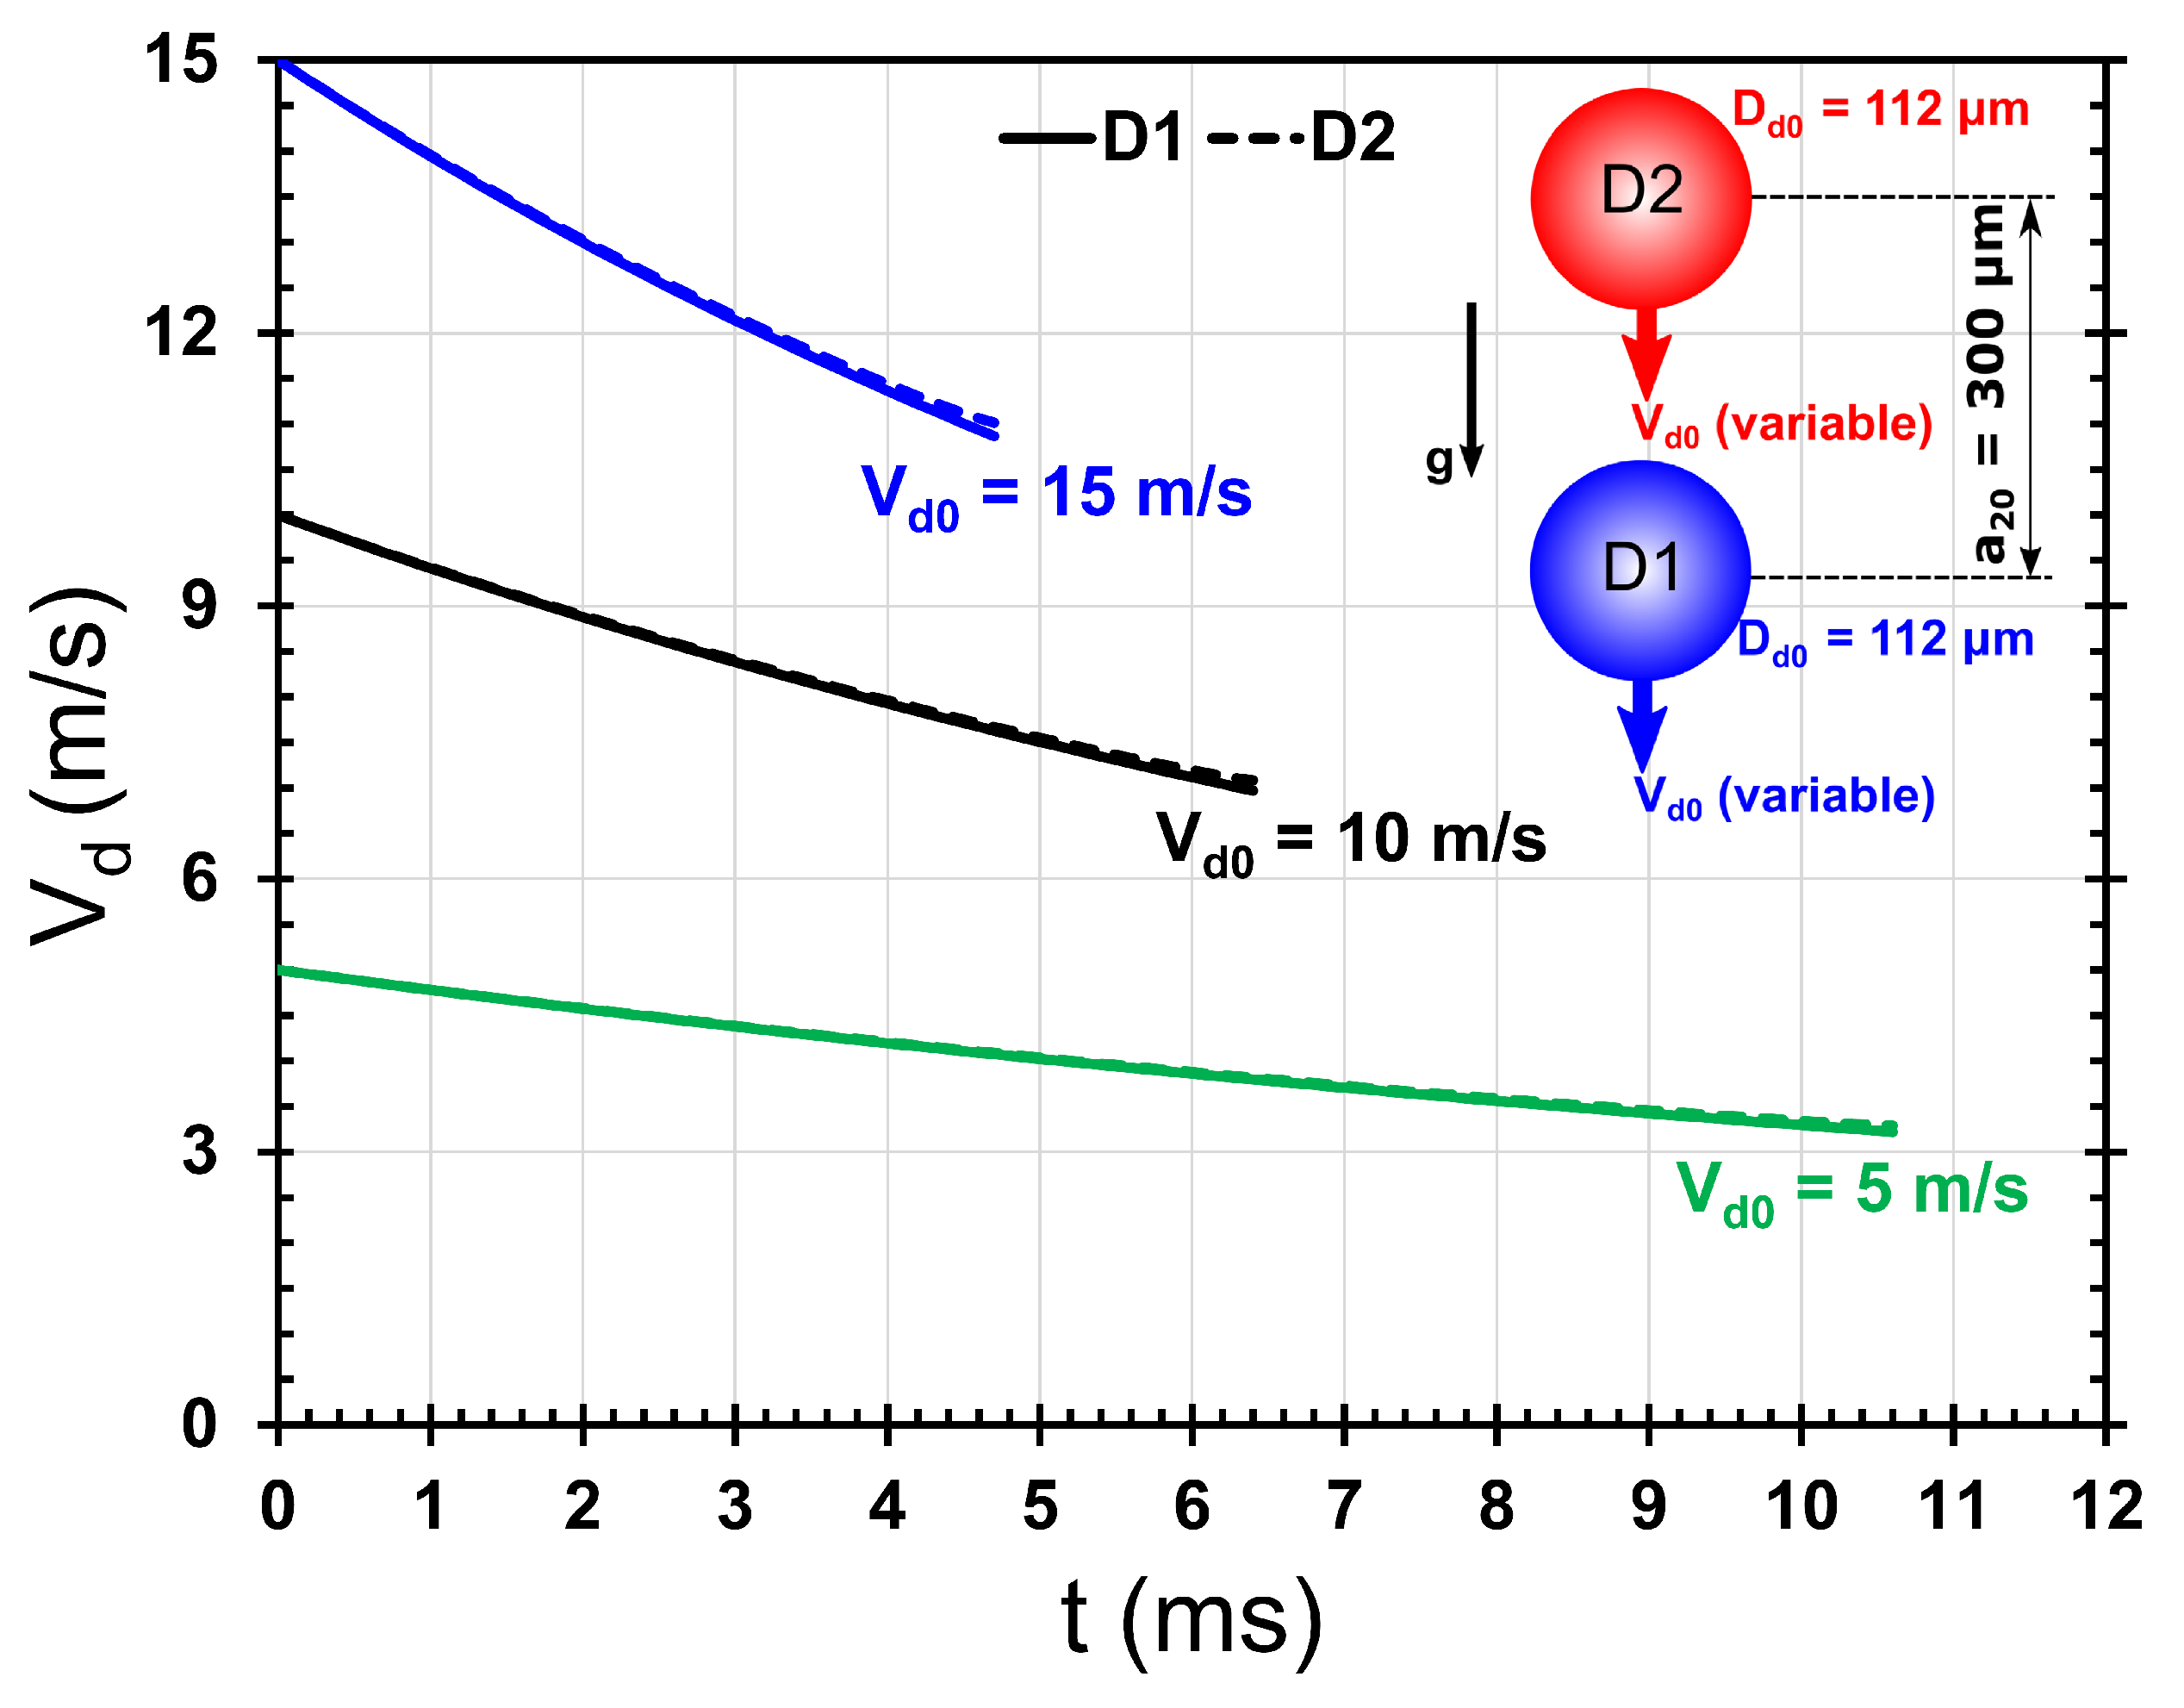
Figure 8 shows the effect of the initial droplet velocity, , on the time evolution of velocities of the leading and trailing droplets in the double-droplet system. The diameter and center-to-center separation of the droplets are kept the same as in Figure 4. The difference in the time evolution of the velocities of leading and trailing droplets, as seen in Figure 4, is also observed at different initial droplet velocities in Figure 8. Droplets injected at higher velocities tend to decelerate faster, as seen by an increase in the overall slope of the curves with an increase in . This can be explained in a similar manner as the trend of deceleration with droplet diameter, discussed in relation to Figure 5, where it was seen that smaller droplets exhibit a larger deceleration. Here, droplets injected at a higher velocity will experience a larger deceleration due to the combined influence of the factors in in the deceleration due to the drag term in Equations (11) and (12).

Figure 8.
Effect of on : Time evolution of the velocities of leading (D1) and trailing (D2) iso-propanol droplets for three typical cases of initial droplet velocities, = 15, 10, and 5 m/s, as predicted by Equations (11) and (12). Other parameters are kept the same as in Figure 4: = 112 m; = 300 m; is calculated using Equation (10). The initial values of the Reynolds number and the aerodynamic Weber number for the three cases (5, 10, 15) m/s are (37.1, 74.3, 111.4) and (0.15, 0.62, 1.39), respectively.
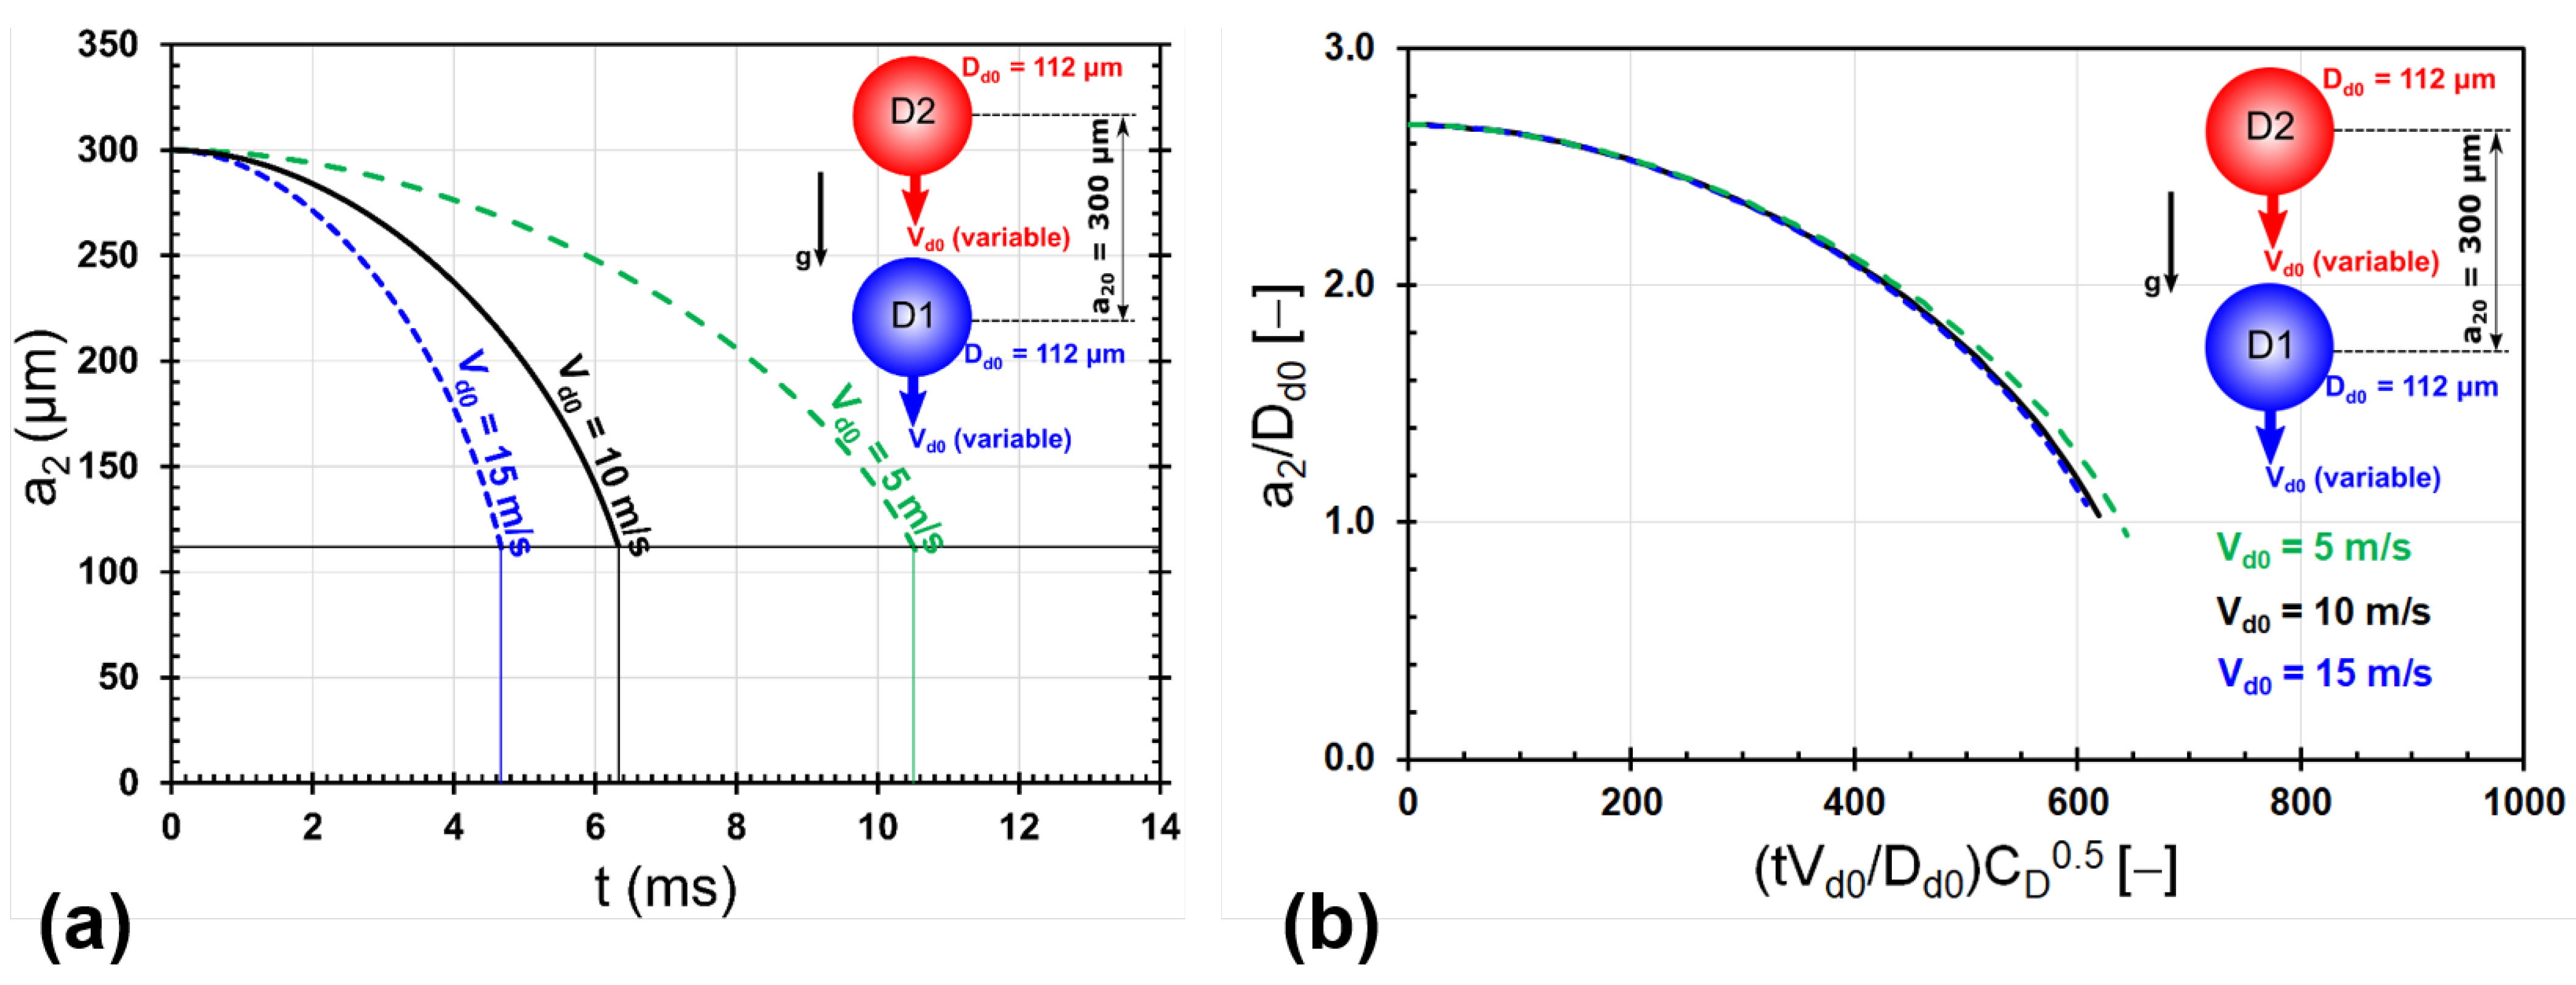
Figure 9a shows the effect of the initial droplet velocity, , on the time evolution of the center-to-center separation of the droplets in the double-droplet system. Other initial conditions remain the same as in Figure 8. Droplets injected at lower velocities tend to take more time to come in contact with each other as highlighted by the vertical lines in Figure 9a. The trends shown in Figure 9a are normalized using the non-dimensionalization discussed in Appendix C; the corresponding non-dimensional plot is shown in Figure 9b. It is clear that the non-dimensionalization is able to collapse the trends into one curve, except for the instants of time when the droplets are very close to each other (larger values of time in each case of ).

Figure 9.
Effect of on : (a) Time evolution of the center-to-center separation of iso-propanol droplets in the double-droplet system for three typical cases of initial droplet velocities, = 15, 10, and 5 m/s, as predicted by Equations (11)–(13). Other parameters are kept the same as in Figure 4: = 112 m; = 300 m; is calculated using Equation (10). (b) Non-dimensionalized version of the plot shown in (a) using the non-dimensionalization discussed in Appendix C.
Figure 10 shows the effect of the initial droplet velocity, , on the time taken by the droplets to come in contact with each other for the first time and their approach velocity at this time instant. The initial conditions are the same as in Figure 8. Droplets injected at higher velocities tend to take less time to come in contact with each other, and when they do so, their approach velocity is higher. Similar to the case of large droplet diameters in Figure 7, it should be noted here that the conditions at which is large in Figure 10 could lead to a significant ‘non-oscillatory deformation’ of the droplets during the initial stages of their motion. The aerodynamic Weber number lies in the range 1.39 ×–3.87 for varying between 0.15 and 25 m/s in Figure 10; for m/s, , where ‘non-oscillatory deformation’ of the droplets may become increasingly significant [29]. As discussed in Figure 7, the wake unsteadiness at Reynolds numbers larger than ∼130 should be kept in mind while interpreting the predictions under these conditions in Figure 10.
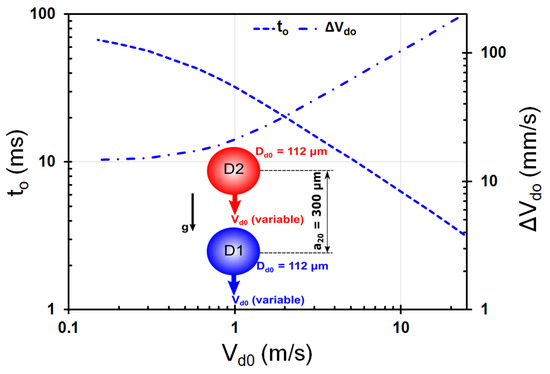
Figure 10.
Effect of on and : The effect of the initial droplet velocity on the time taken by the droplets to come in contact with each other for the first time and their approach velocity at this instant. Other parameters are the same as in Figure 4: = 112 m; = 300 m; is calculated using Equation (10). The ranges of the initial values of Reynolds number and aerodynamic Weber number are 1.1–185.6 and 1.39 ×–3.87, respectively.
3.3. Effect of Initial Droplet Separation,
Figure 11 shows the effect of the initial center-to-center droplet separation, , on the time evolution of velocities of the leading and trailing droplets in the double-droplet system. Other initial conditions are the same as in Figure 4. It is interesting to see that the initial separation between the droplets does not seem to have a significant influence on the time evolution of droplet velocities. However, the difference in the time evolution between the velocities of the leading and trailing droplets is still observed at a given value of initial separation.
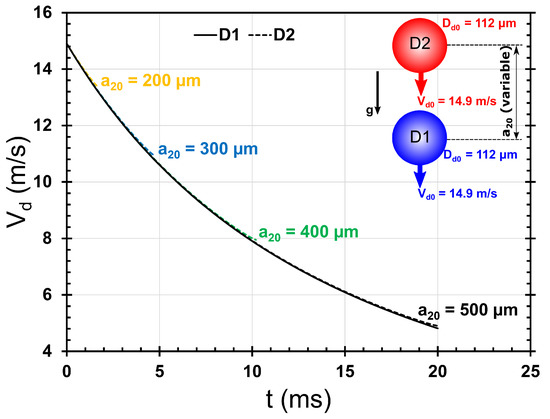
Figure 11.
Effect of on : Time evolution of the velocities of leading (D1) and trailing (D2) iso-propanol droplets, as predicted by Equations (11) and (12), for four typical cases of : 200, 300, 400, and 500 m. Other parameters are kept the same as in Figure 4: = 112 m; = 14.9 m/s; is calculated using Equation (10).
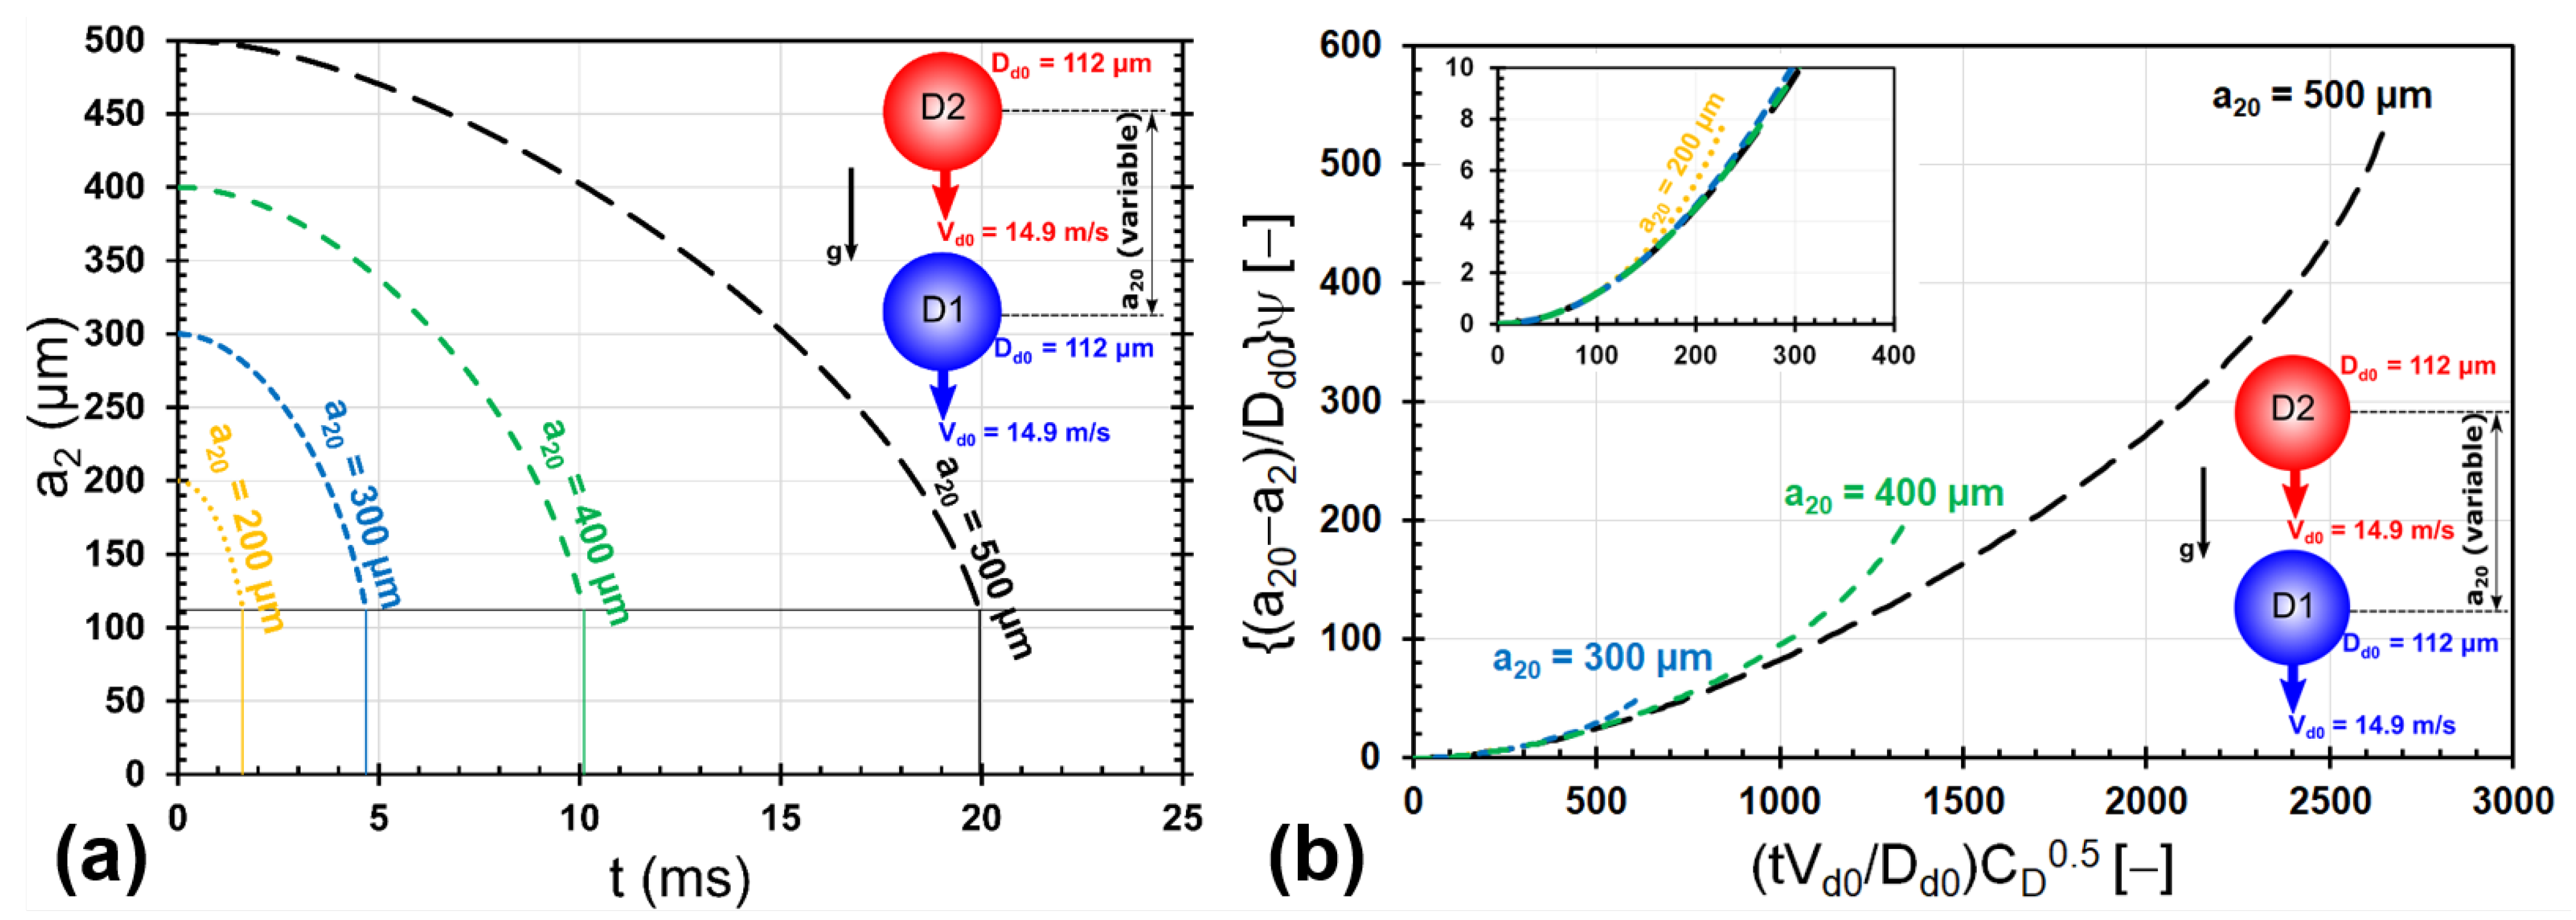
Figure 12a shows the effect of the initial center-to-center droplet separation, , on the time evolution of center-to-center separation of the droplets in the double-droplet system. Droplets that are initially separated by a larger distance tend to take a longer time to come in contact with each other (see Figure 12a and Figure 13). The trends shown in Figure 12a are normalized using the non-dimensionalization discussed in Appendix C; the corresponding non-dimensional plot is shown in Figure 12b. It is clear that the non-dimensionalization is able to collapse the trends into one curve, except for the instants of time when the droplets are very close to each other (larger values of time in each case of ).
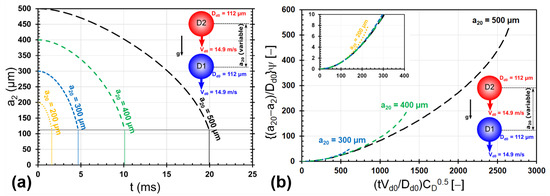
Figure 12.
Effect of on : (a) Time evolution of the center-to-center separation of iso-propanol droplets in the double-droplet system, as predicted by Equation (13), for four typical cases of : 200, 300, 400, and 500 m. Other parameters are kept the same as in Figure 4: = 112 m; = 14.9 m/s; is calculated using Equation (10). (b) Non-dimensionalized version of the plot shown in (a) using the non-dimensionalization discussed in Appendix C. In the vertical axis, the factor . The inset shows a magnified version to show the trend for = 200 m more clearly.
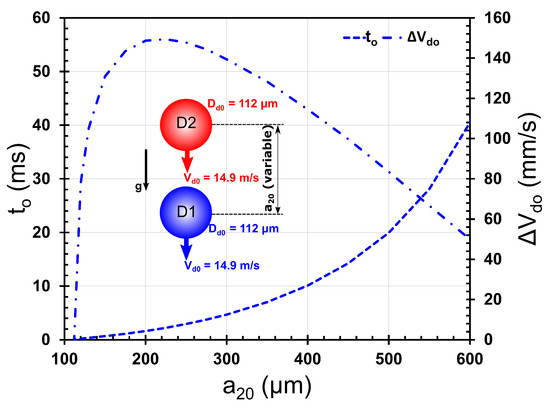
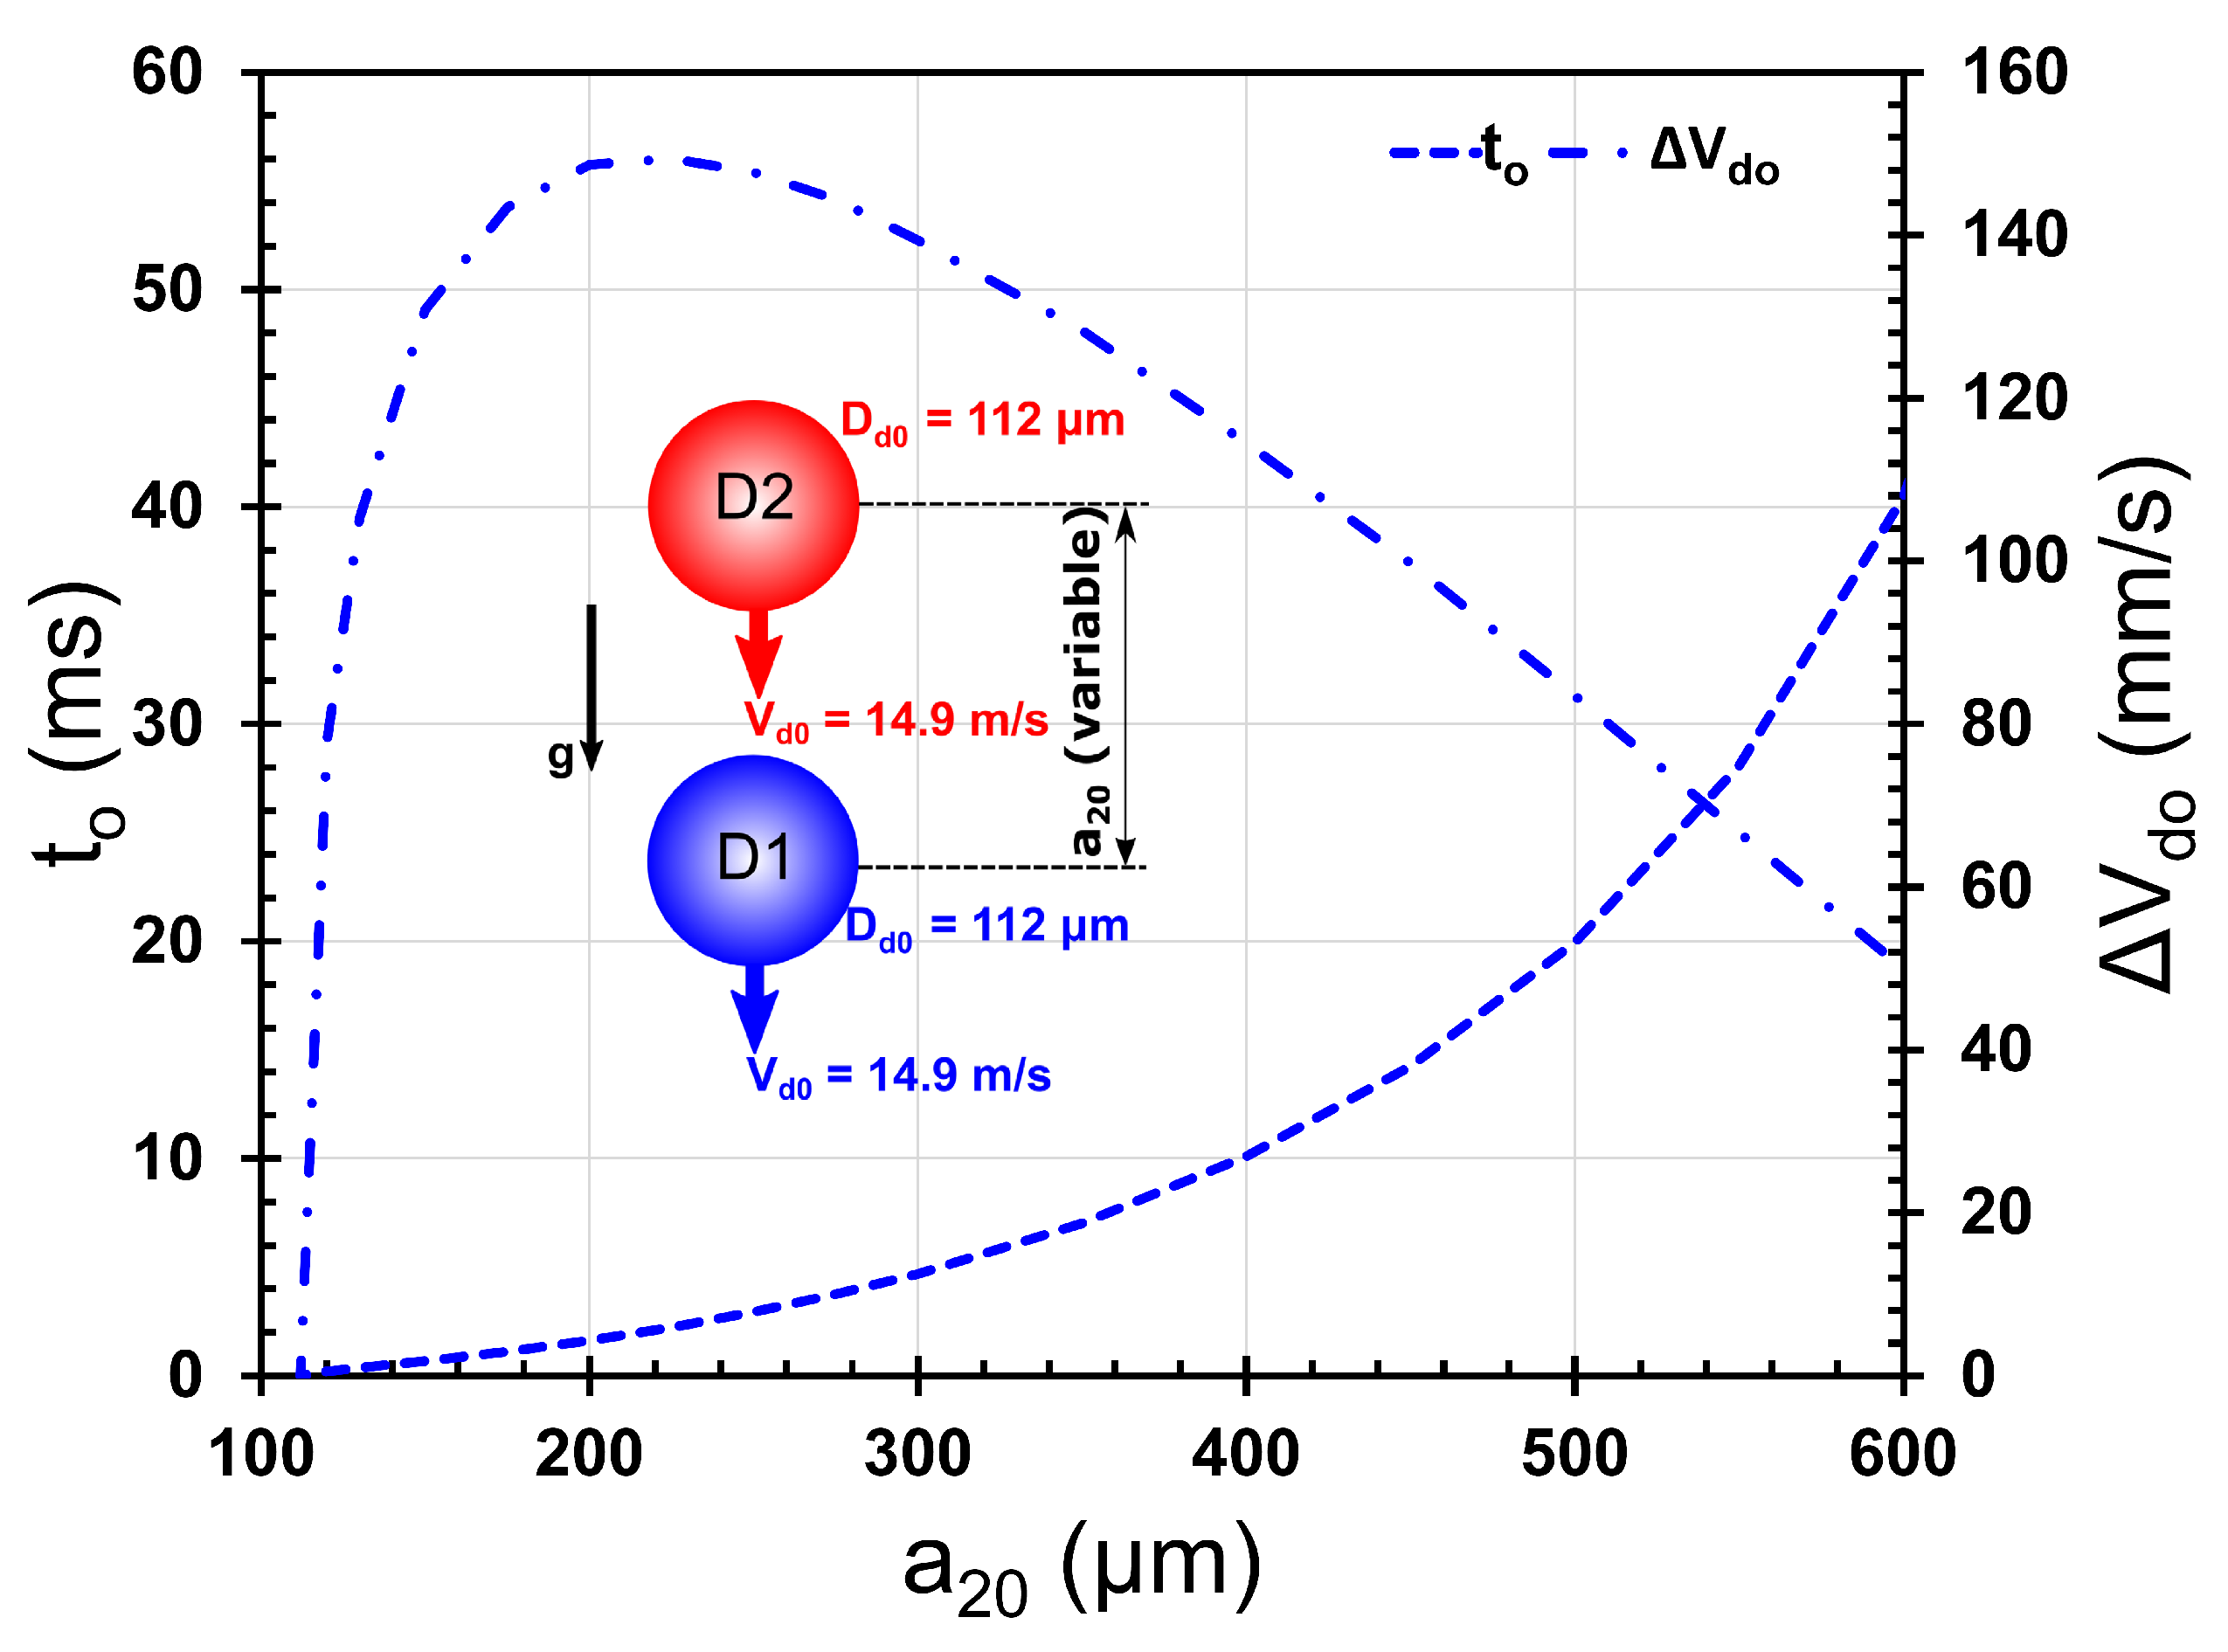
Figure 13.
Effect of on and : The effect of the initial center-to-center droplet separation on the time taken by the droplets to come in contact with each other for the first time and their approach velocity at this instant. Other parameters are the same as in Figure 4: = 112 m; = 14.9 m/s; is calculated using Equation (10).
The approach velocity of droplets at the instant they contact each other seems to have a non-monotonic dependence on their initial separation (see Figure 13). For initial droplet separations greater than two times the droplet diameter, the approach velocity decreases with an increase in their initial separation, whereas for initial separations less than this value, the approach velocity increases sharply with increasing the initial separation. A possible explanation for the non-linear trend of with is similar to the one discussed for a similar trend observed in Figure 7 for the effect of droplet diameter.
4. Conclusions
A simple theoretical approach based on the superposition of pressure fields due to Stokes flow around two droplets in a double-droplet system was developed to derive the equations governing the motion of a double-droplet system. The effect of inertial terms, neglected in the Stokes flow model, was incorporated through the use of a drag coefficient reported in the literature that fits the experimental data for an isolated sphere falling under gravity at Reynolds numbers ranging from 0.1 to 105. The developed model contains the dependence of the motion of droplets in the double-droplet system on the initial values of the droplet diameter, the center-to-center droplet separation, and the velocity of droplets.
A comparison of the model predictions with limited experimental data showed a good agreement between the experiments and predictions. The predicted time at which the droplets come in contact with each other showed a deviation of 7.4% from the experimental data. The time-averaged error in the predictions relative to the experimental data was 4.84%, with a higher error of 9.97% for the data at later times during the grouping process.
The predictions indicated that the trailing droplet experiences a reduced drag force compared to that experienced by the leading droplet. From the solution of the equations of motion of the droplets, the time required for them to come in contact with each other and their approach velocity at this instant were extracted. The dependence of these parameters on the initial conditions (diameter, center-to-center separation, and velocity) was discussed. Using appropriate normalizations involving these initial conditions, it was shown that the temporal variation of the inter-droplet distance during the grouping process collapsed into one single trend for parametric studies involving initial droplet diameter, initial droplet velocity, and initial inter-droplet separation. The time taken for the droplets to come in contact with each other () was seen to be a non-monotonous function of the initial droplet diameter () and the initial inter-droplet distance (), exhibiting a maximum in both the cases at ; whereas was seen to decrease monotonously with the initial droplet velocity.
Using the conditions at which the droplets contact each other, the criterion for droplet coalescence was checked, and this seemed to agree with the limited experimental observation. Further experiments at different values of initial conditions are needed to judge the validity of assumptions made in the current theoretical approach. In addition to this, data from direct numerical simulations were used to understand the validity of the pressure field assumptions made in the theoretical approach reported here.
Author Contributions
Conceptualization, V.V. and B.W.; methodology, V.V.; software, V.V. and M.I.; validation, V.V. and M.I.; formal analysis, V.V., M.I., A.A., D.K., J.B.G. and B.W.; investigation, V.V., M.I., A.A., X.C., D.K., J.B.G. and B.W.; resources, B.W.; data curation, V.V.; writing—original draft preparation, V.V.; writing—review and editing, V.V., M.I., A.A., X.C., D.K., J.B.G. and B.W.; visualization, V.V.; supervision, D.K., J.B.G. and B.W.; project administration, B.W.; funding acquisition, D.K., J.B.G. and B.W. All authors have read and agreed to the published version of the manuscript.
Funding
This study was performed with financial support from the Deutsche Forschungsgemeinschaft (DFG) through the project ‘Investigation of droplet motion and grouping’ (project number 409029509). The authors also acknowledge the support from the Stuttgart Center for Simulation Science (SimTech) EXC 2075 (project number 390740016).
Institutional Review Board Statement
Not applicable.
Informed Consent Statement
Not applicable.
Data Availability Statement
The data reported in this article are available from the corresponding author on reasonable request.
Conflicts of Interest
The authors declare no conflict of interest. The funders had no role in the design of the study; in the collection, analyses, or interpretation of data; in the writing of the manuscript, or in the decision to publish the results.
Appendix A. Discussion on the Assumptions in the Analysis with the Help of DNS Data
The effects of the assumptions v and vi in the theoretical model (Section 2) on droplet dynamics at Re ≈ O(100) are checked with the help of high-resolution direct numerical simulations (DNS) on a single droplet stream. For details on the DNS, please refer to [42].
Appendix A.1. Skin Friction Drag
The assumption v in Section 2 can be re-phrased as follows: The drag force due to skin friction (shear force) is neglected. The data from the DNS were used to extract the drag force components due to pressure and shear stress and the corresponding forces ( and ). In the current analysis, is neglected. Here, we try to understand the effect of this assumption with the help of DNS data. It is observed that at a typical Re of around 110 (corresponding to experiments used in Figure 2), the average values of from DNS are 2.02 and 1.97 for the leading and trailing droplets, respectively. However, since the droplet grouping process is related to the time evolution of the inter-droplet separation (rather than just the positions of the droplets), the terms in the governing equation of droplet grouping will depend on the difference in the force (or acceleration) between leading and trailing droplets (see the last term in Equation (13)). This means that the force term that would finally appear in the governing equation will be of the form (where the subscripts 1 and 2 denote the leading and trailing droplets, respectively). This term can be re-written as (where the average values of for the leading and trailing droplets from DNS are used). On simplification, this term becomes . This means that the forces on the leading and trailing droplets will respectively be, on average, 49.5% and 50.8% larger if skin friction is taken into account. However, the force difference, which governs the temporal evolution of the inter-droplet separation, can be calculated as follows: the averaged force difference in DNS, N; the averaged force difference predicted by the current model, N (from Equations (4), (7)–(10)). The drag force difference predicted by the current model is clearly larger than that calculated from the DNS. Hence, it could be expected that the inter-droplet separation, , will decrease faster with time in the model predictions than in reality. This line of reasoning could potentially explain the underprediction of the theoretical analysis in Figure 2.
Appendix A.2. Two-Way Interaction

Figure A1.
Comparison of the difference between the pressure differences acting across the leading and trailing droplets, in the current analysis (using Equations (4) and (7)) with the corresponding data from direct numerical simulation (DNS). The initial conditions are the same as given in Figure 2 for both the analytical predictions and the DNS. Please note that in DNS, an infinite single stream of droplets is considered.
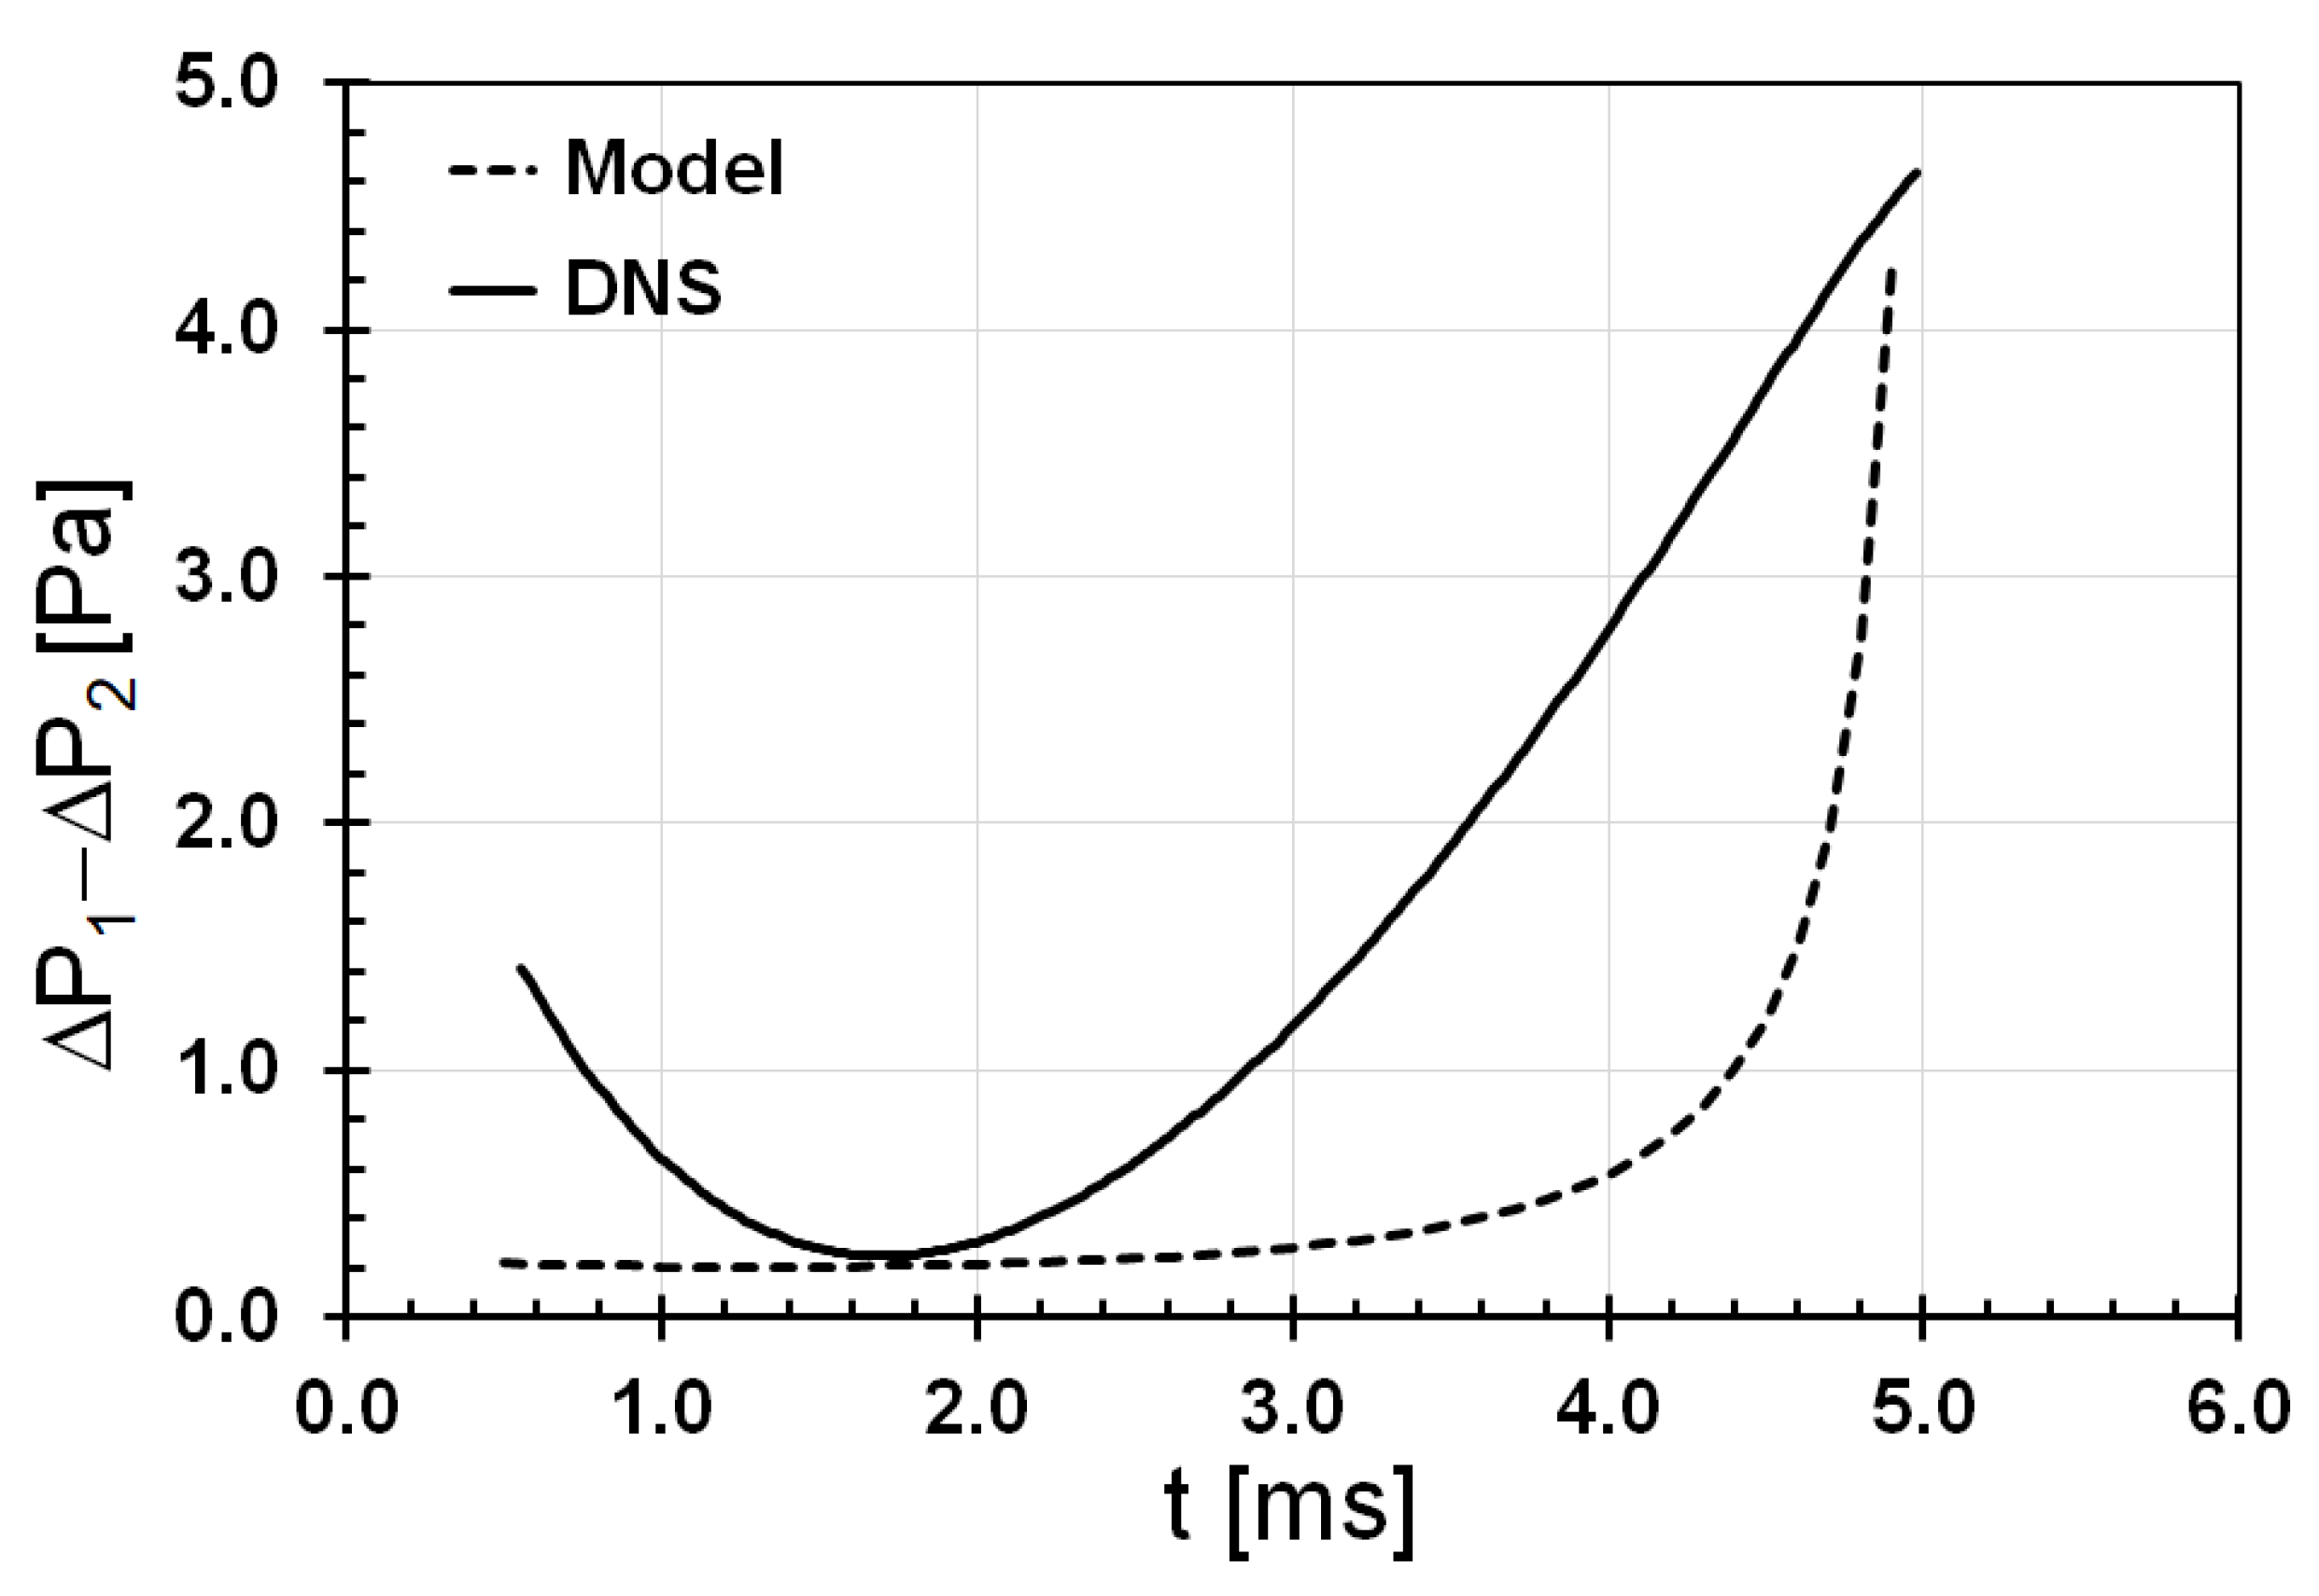
The assumption vi in Section 2 can be re-phrased as follows: The effect of the pressure field around the leading droplet on the motion of the trailing droplet is considered, whereas the effect of the pressure field around the trailing droplet on the motion of the leading droplet is neglected. Here, we try to understand the effect of this assumption on the analytical predictions with the help of data from DNS. The difference between and (given by Equations (4) and (7)) is related to the force term that governs the time evolution of the inter-droplet separation (see Equations (8), (9) and (13)). This difference is compared with the corresponding data extracted and calculated from DNS (see Figure A1). It is evident from Figure A1 that in the current analysis and that extracted from DNS are quantitatively in the same order of magnitude. Hence, the pressure differences obtained from the adopted pressure fields in the current analysis, neglecting a two-way interaction between the leading and trailing droplets, could be a reasonable first approximation of reality, at least for ≈ O(100).
Appendix B. Comparison of the Empirical Drag Coefficient (Equation (10)) with Stokesian Drag Coefficient

Figure A2.
Comparison of the empirical drag coefficient used in the current analysis, given by Equation (10), with the Stokesian drag coefficient, as a function of . The range of (100–500), which is explored in the ongoing experimental investigations of droplet grouping, is highlighted by the rectangular region.
Appendix C. Discussion on Non-Dimensionalization
For the case , Equation (A3) can be re-written as follows:
At , as per the assumption in the current model, . Equation (A4) can then be re-written as follows:
The difference between the acceleration of the leading droplet and that of the trailing droplet at , on the right-hand side of the Equation (A5), can be calculated from Equations (A1) and (A2) as given below, with the information that at , , and (given by Equation (10) in the manuscript).
Using Equation (A6) in Equation (A5), and arbitrarily choosing , gives the following relation between and t:
The dimensionless time, , on the right-hand side of Equation (A7), is modified by the factor for parametric studies where is varied. For parametric studies where or is varied, the appropriate dimensionless time could still be ; however, in these cases, the plots of should be modified to .
References
- Enagi, I.I.; Al-attab, K.A.; Zainal, Z.A. Liquid biofuels utilization for gas turbines: A review. Renew. Sustain. Energy Rev. 2018, 90, 43–55. [Google Scholar] [CrossRef]
- Birkhold, F.; Meingast, U.; Wassermann, P.; Deutschmann, O. Analysis of the injection of urea-water-solution for automotive SCR DeNOx-systems: Modeling of two-phase flow and spray/wall-interaction. SAE Tech. Pap. 2006, 13, 2006-01-0643. [Google Scholar] [CrossRef] [Green Version]
- Terzis, A.; Kirsch, M.; Vaikuntanathan, V.; Geppert, A.; Lamanna, G.; Weigand, B. Splashing characteristics of diesel exhaust fluid (AdBlue) droplets impacting on urea-water solution films. Exp. Therm. Fluid Sci. 2019, 102, 152–162. [Google Scholar] [CrossRef]
- Weingarten, E.; Bayer, T.; Chaineux, M.; Lueders, H.; Bareiss, S. Bosch AdBlue dosing technology for EU6-RDE and beyond. In 11. Tagung Einspritzung und Kraftstoffe 2018. Proceedings; Tschoeke, H., Marohn, R., Eds.; Springer: Wiesbaden, Germany, 2019. [Google Scholar] [CrossRef]
- Han, H.G.; Weerasinghe, H.C.; Kim, K.M.; Kim, J.S.; Cheng, Y.B.; Jones, D.J.; Holmes, A.B.; Kwon, T.H. Ultrafast fabrication of flexible dye-sensitized solar cells by ultrasonic spray-coating technology. Sci. Rep. 2015, 5, 14645. [Google Scholar] [CrossRef]
- Aziz, F.; Ismail, A.F. Spray coating methods for polymer solar cells fabrication: A review. Mater. Sci. Semicond. Process. 2015, 39, 416–425. [Google Scholar] [CrossRef] [Green Version]
- Hilz, E.; Vermeer, A.W.P. Spray drift review: The extent to which a formulation can contribute to spray drift reduction. Crop Prot. 2013, 44, 75–83. [Google Scholar] [CrossRef]
- Veron, F. Ocean Spray. Annu. Rev. Fluid Mech. 2015, 47, 507–538. [Google Scholar] [CrossRef]
- Shafiee, A.; Ghadiri, E.; Ramesh, H.; Kengla, C.; Kassis, J.; Calvert, P.; Williams, D.; Khademhosseini, A.; Narayan, R.; Forgacs, G.; et al. Physics of bioprinting. Appl. Phys. Rev. 2019, 6, 021315. [Google Scholar] [CrossRef]
- Alzheimer, C. Nasal spray to the rescue of neurons in stroke. Mol. Ther. 2018, 26, 1–2. [Google Scholar] [CrossRef] [Green Version]
- Bourouiba, L.; Dehandschoewercker, E.; Bush, J.W.M. Violent expiratory events: On coughing and sneezing. J. Fluid Mech. 2014, 745, 537–563. [Google Scholar] [CrossRef]
- ter Horst, B.; Moakes, R.J.A.; Chouhan, G.; Williams, R.L.; Moiemen, N.S.; Grover, L.M. A gellan-based fluid gel carrier to enhance topical spray delivery. Acta Biomater. 2019, 89, 166–179. [Google Scholar] [CrossRef] [PubMed]
- Heinlein, J.; Fritsching, U. Droplet clustering in sprays. Exp. Fluids 2006, 40, 464–472. [Google Scholar] [CrossRef]
- Sommerfeld, M.; Pasternak, L. Advances in modelling of binary droplet collision outcomes in sprays: A review of available knowledge. Int. J. Multiph. Flow 2019, 117, 182–205. [Google Scholar] [CrossRef]
- Baumgarten, C. Mixture Formation in Internal Combustion Engines; Springer: Berlin/Heidelberg, Germany, 2006; p. XVII 294. [Google Scholar] [CrossRef]
- Gallego-Juarez, J.A.; de Sarabia, E.F.; Rodriguez-Corral, G.; Hoffmann, T.L.; Galvez-Moraleda, J.C.; Rodriguez-Maroto, J.J.; Gomez-Moreno, F.J.; Bahillo-Ruiz, A.; Martin-Espigares, M.; Acha, M. Application of acoustic agglomeration to reduce fine particle emissions from coal combustion plants. Environ. Sci. Technol. 1999, 33, 3843–3849. [Google Scholar] [CrossRef] [Green Version]
- Reveillon, J.; Demoulin, F.X. Effects of the preferential segregation of droplets on evaporation and turbulent mixing. J. Fluid Mech. 2007, 583, 273–302. [Google Scholar] [CrossRef] [Green Version]
- Reveillon, J.; Demoulin, F.X. Evaporating droplets in turbulent reacting flows. Proc. Combust. Inst. 2007, 31, 2319–2326. [Google Scholar] [CrossRef]
- Dey, S.; Ali, S.Z.; Padhi, E. Terminal fall velocity: The legacy of Stokes from the perspective of fluvial hydraulics. Proc. R. Soc. A 2019, 475, 20190277. [Google Scholar] [CrossRef] [Green Version]
- Stimson, M.; Jeffery, G.B. The motion of two spheres in a viscous fluid. Proc. R. Soc. A 1926, 111, 110–116. [Google Scholar] [CrossRef] [Green Version]
- Happel, J.; Pfeffer, R. The motion of two spheres following each other in a viscous fluid. AIChE J. 1960, 6, 129–133. [Google Scholar] [CrossRef]
- Steinberger, E.H.; Pruppacher, H.R.; Neiburger, M. On the hydrodynamics of pairs of spheres falling along their line of centres in a viscous medium. J. Fluid Mech. 1968, 34, 809–819. [Google Scholar] [CrossRef]
- Oseen, C.W. Hydrodynamik; Akademische Verlagsgesellschaft: Leipzig, Germany, 1927. [Google Scholar]
- Wu, R.M.; Chung, H.Y.; Lee, D.J. Hydrodynamic drag forces on two porous spheres moving along their centerline. Chem. Eng. Sci. 2003, 59, 943. [Google Scholar] [CrossRef]
- Katoshevski, D. Characteristics of spray grouping/ non-grouping behavior. Aerosol Air Qual. Res. 2006, 6, 54–66. [Google Scholar] [CrossRef] [Green Version]
- Katoshevski, D.; Shakked, T.; Sazhin, S.S.; Crua, C.; Heikal, M.R. Grouping and trapping of evaporating droplets in an oscillating gas flow. Int. J. Heat Fluid Flow 2008, 29, 415–426. [Google Scholar] [CrossRef] [Green Version]
- Roth, N.; Weigand, B.; Katoshevski, D.; Greenberg, J.B. Basic studies on grouping effects in droplet streams. In Proceedings of the Workshop on Droplet Impact Phenomena and Spray Investigations (DIPSI), Bergamo, Italy, 29 May 2015. [Google Scholar]
- Roth, N.; Gomaa, H.; Livne, A.; Katoshevski, D.; Weigand, B. Theoretical and experimental study of grouping effects on droplet streams. In Proceedings of the 28th European Conference on Liquid Atomization and Spray Systems, Valencia, Spain, 6–8 September 2017. [Google Scholar] [CrossRef] [Green Version]
- Hsiang, L.-P.; Faeth, G.M. Near-limit drop deformation and secondary breakup. Int. J. Multiph. Flow 1992, 18, 635–652. [Google Scholar] [CrossRef] [Green Version]
- de Botton, E.; Greenberg, J.B.; Arad, A.; Katoshevski, D.; Vaikuntanathan, V.; Ibach, M.; Weigand, B. An investigation of grouping of two falling dissimilar droplets using the homotopy analysis method. Appl. Math. Model. 2022, 104, 486–498. [Google Scholar] [CrossRef]
- Batchelor, G.K.; Green, J.T. The hydrodynamic interaction of two small freely-moving spheres in a linear flow field. J. Fluid Mech. 1972, 56, 375–400. [Google Scholar] [CrossRef]
- Mashayek, A.; Ashgriz, N. Dynamics of liquid droplets. In Handbook of Atomization and Sprays; Ashgriz, N., Ed.; Springer: Boston, MA, USA, 2011; pp. 97–123. [Google Scholar] [CrossRef]
- Smoluchowski, M.A. On the Practical Applicability of Stokes’ Law of Resistance, and the Modifications of It Required in Certain Cases; Cambridge University Press: Cambridge, UK, 1912; Available online: https://pdfs.semanticscholar.org/a849/ca72ee4a159173f265039914b1dc05e119fe.pdf (accessed on 14 January 2022).
- Mikhailov, M.D.; Freire, A.P.S. The drag coefficient of a sphere: An approximation using Shanks transform. Powder Technol. 2013, 237, 432–435. [Google Scholar] [CrossRef]
- Roos, F.W.; Willmarth, W.W. Some experimental results on sphere and disk drag. AIAA J. 1971, 9, 285–290. [Google Scholar] [CrossRef]
- Brown, P.P.; Lawler, D.F. Sphere drag and settling velocity revisited. J. Environ. Eng. 2003, 129, 222–231. [Google Scholar] [CrossRef]
- Qian, J.; Law, C.K. Regimes of coalescence and separation in droplet collision. J. Fluid Mech. 1997, 331, 59–80. [Google Scholar] [CrossRef]
- Brenn, G. Droplet Collision. In Handbook of Atomization and Sprays; Ashgriz, N., Ed.; Springer: Boston, MA, USA, 2011; pp. 157–181. [Google Scholar] [CrossRef]
- Brenn, G.; Frohn, A. Collision and merging of two equal droplets of propanol. Exp. Fluids 1989, 7, 441–446. [Google Scholar] [CrossRef]
- Jiang, Y.J.; Umemura, A.; Law, C.K. An experimental investigation on the collision behaviour of hydrocarbon droplets. J. Fluid Mech. 1992, 234, 171–190. [Google Scholar] [CrossRef]
- Orme, M. Experiments on droplet collisions, bounce, coalescence and disruption. Prog. Energy Combust. Sci. 1997, 23, 65–79. [Google Scholar] [CrossRef]
- Ibach, M.; Schulte, K.; Vaikuntanathan, V.; Arad, A.; Katoshevski, D.; Greenberg, J.B.; Weigand, B. Direct numerical simulations of grouping effects in droplet streams using different boundary conditions. In Proceedings of the 15th Triennial International Conference on Liquid Atomization & Spray Systems, Edinburgh, UK, 29 August–2 September 2021. [Google Scholar] [CrossRef]


Publisher’s Note: MDPI stays neutral with regard to jurisdictional claims in published maps and institutional affiliations. |
© 2022 by the authors. Licensee MDPI, Basel, Switzerland. This article is an open access article distributed under the terms and conditions of the Creative Commons Attribution (CC BY) license (https://creativecommons.org/licenses/by/4.0/).