Article

Blood Flow Simulation to Determine the Risk of Thrombosis in the Fontan Circulation: Comparison between Atriopulmonary and Total Cavopulmonary Connections

1
Graduate School of Engineering, Chiba University, Chiba 263-8522, Japan
2
Graduate School of Science and Engineering, Chiba University, Chiba 263-8522, Japan
3
Department of Cardiovascular Surgery, Chiba Kaihin Municipal Hospital, Chiba 261-0012, Japan
*
Author to whom correspondence should be addressed.
Fluids 2022, 7(4), 138; https://doi.org/10.3390/fluids7040138
Submission received: 18 January 2022 / Revised: 31 March 2022 / Accepted: 8 April 2022 / Published: 13 April 2022
(This article belongs to the Special Issue Computational Biofluiddynamics: Advances and Applications)

Abstract

:
Three-dimensional computational fluid dynamics (CFD) simulations were performed in the anastomotic region of the Fontan route between the venae cava and pulmonary arteries to investigate the risk of thrombosis due to blood stasis in the Fontan circulation. The finite volume method based on the time-averaged continuity and Navier–Stokes equations combined with the k-ω SST turbulent model was used in the CFD simulations. Low shear rate (SR) and SR on the wall (WSR) of <10 s−1 were used as markers to assess blood stasis as a cause of blood coagulation. Simulated blood flow velocity and both SR and WSR were reduced in the right atrium (RA) as the cavity of a flow channel in the atriopulmonary connection (APC) Fontan model, whereas the values increased in the total cavopulmonary connection (TCPC) Fontan model, which has no cavity. The volume of SR <10 s−1 and wall surface area of WSR <10 s−1 were, respectively, 4.6–261.8 cm3 and 1.2–38.3 cm2 in the APC Fontan model, and 0.1–0.3 cm3 and 0.1–0.6 cm2 in the TCPC Fontan model. The SR and WSR increased in the APC model with a normal-sized RA and the TCPC model as the flow rate of blood from the inferior vena cava increased with exercise; however, the SR and WSR in the RA decreased in the APC model with a dilated RA owing to the development of a recirculating flow. These findings suggest that the APC Fontan has a higher risk of thrombosis due to blood stasis than the TCPC Fontan and a higher RA dilation is associated with a higher risk of thrombosis from a fluid mechanics perspective.

1. Introduction

The Fontan procedure is performed as the final-stage surgery in patients with a single ventricle, which is a type of congenital heart disease; in this procedure, venous blood flow from the venae cava is surgically redirected to the pulmonary arteries to improve cyanosis [1,2]. The surgery to establish atriopulmonary connection (APC) is a classical Fontan procedure in which venous blood from the venae cava flows through the right atrium (RA) to the pulmonary artery. The APC Fontan frequently causes the RA to dilate, resulting in supraventricular arrhythmia. For patients with a failed APC Fontan, a conversion to the total cavopulmonary connection (TCPC) Fontan is performed, in which venous blood from the venae cava directly flows into the pulmonary arteries without passing through the RA to achieve better results.
The high occurrence of thrombosis in the Fontan route [1,2,3,4], where venous stagnation is likely to induce blood coagulation, is a crucial issue in the Fontan circulation. The risk of thrombosis is lower in TCPC Fontan than in APC Fontan [1,3]. However, based on clinical observational research alone, it is difficult to explain the reason for the difference in the occurrence of thrombosis between the two types of Fontan and reflect the findings on the prevention and treatment of thrombosis.
Computational fluid dynamics (CFD) simulation aids in the understanding of blood flow details in the Fontan circulation [5]. Yoganathan et al. conducted a series of pioneering CFD studies on the Fontan circulation to understand the physiological state of blood flow in the Hemi-Fontan and TCPC and apply them to pre- and postoperative planning and evaluation [6,7]. Regarding thrombosis in Fontan circulation, Kung et al. [8] used a CFD simulation to propose a blood flow prediction method in the Hemi-Fontan procedure and quantitatively evaluated low shear rate (SR) as a risk factor for thrombosis. Sughimoto et al. [9] used two-dimensional computer simulations to demonstrate that the SR of blood flow in the RA of the APC Fontan is lower than that in the TCPC Fontan, indicating that blood stasis in the APC Fontan is more likely to induce thrombosis than that in the TCPC Fontan.
A three-dimensional CFD simulation for blood flow in the Fontan route was performed in this study by developing models of the blood flow channels for the APC and TCPC Fontan based on the reported measurements of geometries and flow conditions. The finite volume method (FVM) is used in the CFD simulations, which assumes incompressible viscous flow. The low SR and SR on the wall (WSR) were used as markers to assess blood stasis as a cause of blood coagulation. At rest and during exercise, flow rate conditions are considered. Following the flow channel geometries, flow rate conditions, and simulated blood flow velocity, SR and WSR are characterized; this characterization demonstrates how a region of low SR indicates the risk of thrombosis.

2. Methods

Idealized three-dimensional models of blood flow channels were developed for the anastomotic regions of the Fontan route in adults, which included the RA, inferior vena cava (IVC), superior vena cava (SVC), and pulmonary arteries (PAs) (Figure 1). An APC flow channel comprises the RA, IVC, SVC, and main PA. The APC Fontan was modeled for two types of RAs: normal-sized RA (APC-NRA) and dilated RA (APC-DRA). For the RAs, the maximum diameters in the anterior–posterior, left–right, and superior–inferior directions were 45.0, 35.0, and 62.5 mm [10,11,12,13] in APC-NRA, respectively; the diameters were doubled in APC-DRA. The RA’s cross-sectional shape was determined using two semi-ellipses with different diameters. The RA was set to be noncontractile, with the shape and length remaining constant throughout the cardiac cycle. IVC, SVC, and PA shapes were modeled as straight pipes with diameters of 22.0, 14.0, and 26.0 mm, respectively [14,15]; the lengths were 50.0 mm for both IVC and SVC and 150.0 mm for PA. The extracardiac conduit from the IVC (hereinafter called IVC-ECC) and SVC were connected to the left and right PAs in the TCPC model. Diameters were set as 22.0, 14.0, and 16.0 mm for IVC-ECC, SVC, and PA, respectively [14,16,17]; the lengths were 50.0 mm for both IVC-ECC and SVC, and 150.0 mm for PA, modeled as the straight pipes. Because the PAs in the TCPC model are the left and right PAs, whereas the PA in the APC is the main PA, the diameter of the PA is smaller in the TCPC model than in the APC model. The central axis of the SVC and IVC-ECC was offset by 18.0 mm in the left–right direction. At junctions between the RA, IVC or IVC-ECC, SVC, and PAs, the wall surfaces were chamfered with a 5.0–20.0 mm radius to make them smooth.
CFD simulations for blood flow were based on time-averaged equations for an incompressible viscous flow. The governing equations are the equation of continuity:
u i x i = 0 ,  
and the Reynolds-averaged Navier–Stokes equations:
u i t + u j u i x j = 1 ρ p x i + ( ν + ν t ) 2 u i x j x j   .
In Equations (1) and (2) described in the Einstein notation, u i represents the velocity in the direction x i ( x 1 = x , x 2 = y , x 3 = z ), p represents the pressure, ρ represents the density, ν represents the kinematic viscosity, and ν t represents the kinematic eddy viscosity. The k - ω SST turbulence model [18] is used to determine ν t . Based on previous studies, the physical properties of the fluid blood were set as ρ = 1.06 × 10 3 kg/m3 [19] and ν = 4.43 × 10 6 m2/s [20]. The turbulence model parameters were set to 1% in the turbulence intensity and 0.07 D , mixing lengths for inflow, at the IVC or IVC-ECC and SVC, where D is the diameter of the vena cava. The free software OpenFOAM8 (The OpenFOAM Foundation, https://openfoam.org/, 15 August 2020) was used for numerical calculations based on the FVM, and the PIMPLE algorithm that combines the PISO [21] and SIMPLE [22] algorithms were used to solve pressure–velocity coupling equations.
Constant flow rates and corresponding mean velocities for the flow of blood from the IVC or IVC-ECC and SVC as the inlets were determined (Table 1) based on the measurement data obtained under three conditions: rest, mild exercise, and moderate exercise [23]. The Reynolds number ( Re   = U D / ν ), defined using the diameter D and mean velocity U in the IVC or IVC-ECC, was 641–1302. The mainstream velocity was set to a parabolic profile, assuming fully developed flow. A zero pressure and a zero-velocity gradient were applied to the end of the PAs as the outlets. Notably, outlet pressure at a PA in the APC model was arbitrary because the APC has a single outlet and that at both PAs in the TCPC model was set at the same value because the flow conditions at the right and left PAs are assumed to be the same because of the symmetrical vessel geometries. The wall was placed under a no-slip condition. The velocity and pressure fields were both set to zero for the initial conditions.
The unstructured computational meshes used for FVM in CFD were created using the free software cfMesh v1.1 (Creative Fields, https://cfmesh.com/, 5 August 2020), in which most meshes were hexahedral. According to the mesh convergence test (Appendix A), the edge length of a mesh, Δ x [mm], in the luminal region was set at 0.5 mm, except for the APC-NRA and APC-DRA models at rest where Δ x was set at 0.3 mm. The edge length of a mesh in the direction normal to the surface of the wall was set at 0.5 Δ x . The total numbers of computational meshes were 1.53 ( Δ x = 0.5   mm ) and 6.71 (0.3 mm) million in the APC-NRA, 4.66 (0.5 mm) and 20.82 (0.3 mm) million in the APC-DRA, and 91.9 (0.5 mm) million in the TCPC. The simulation results of flow velocity, SR, and WSR mentioned in the following section converged to specified numbers regarding the lengths of IVC or IVC-ECC, SVC, and PAs as the blood flow inlets and outlets. An SR and a WSR of <10 s−1 were used as markers to assess blood stasis as a cause of blood coagulation.

3. Results

3.1. Velocity and SR in APC and TCPC at Rest

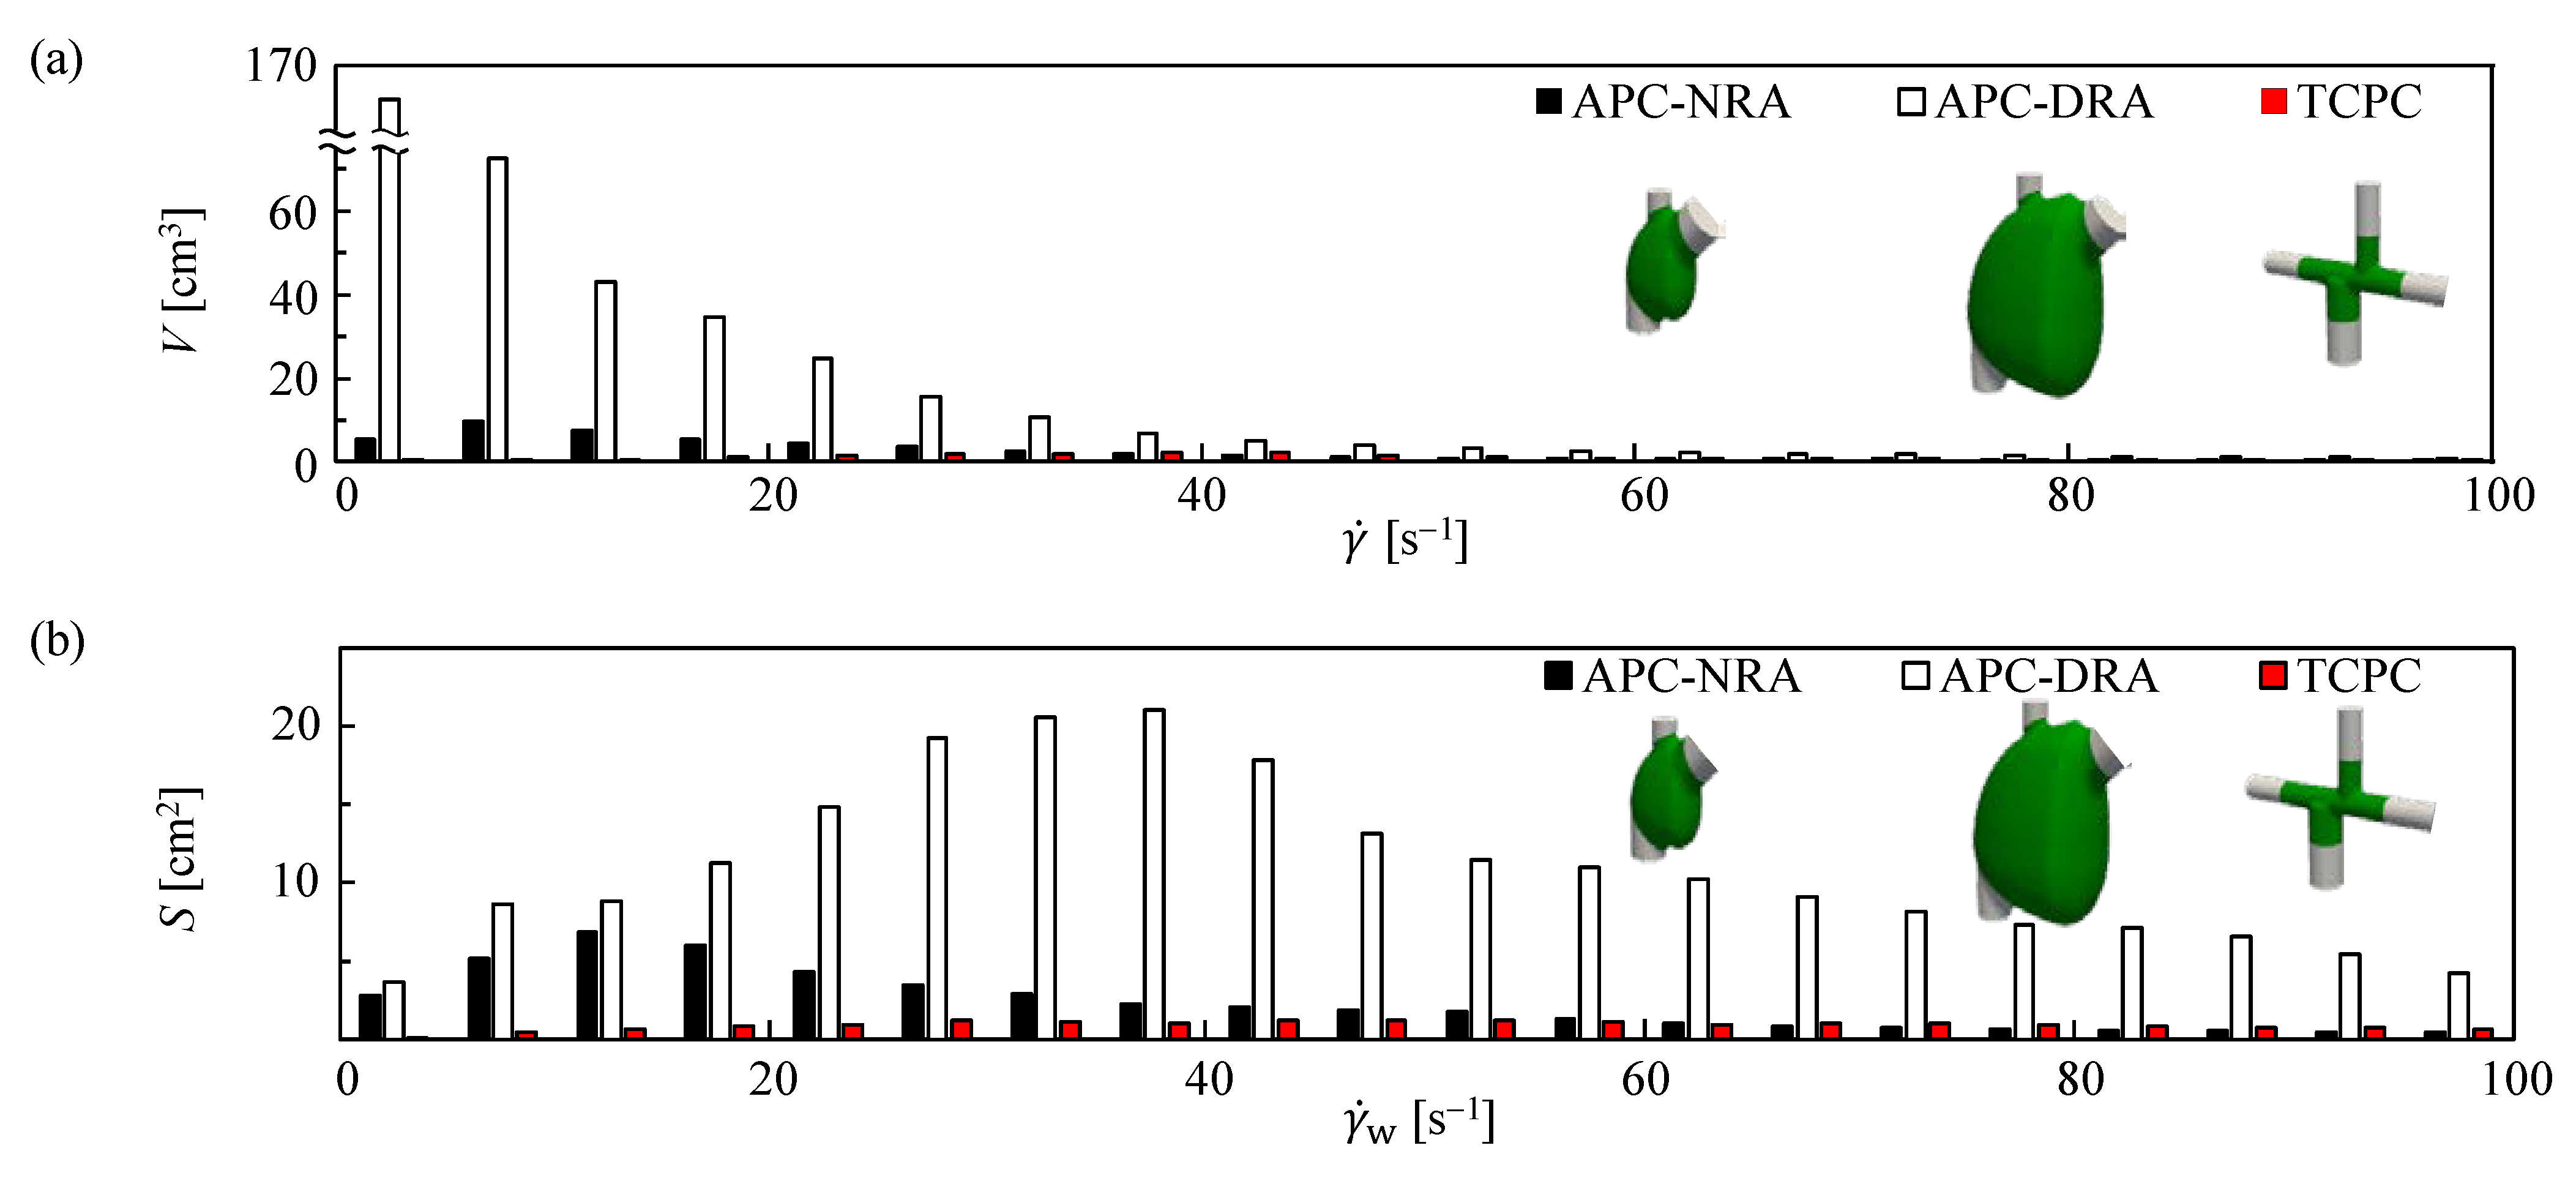
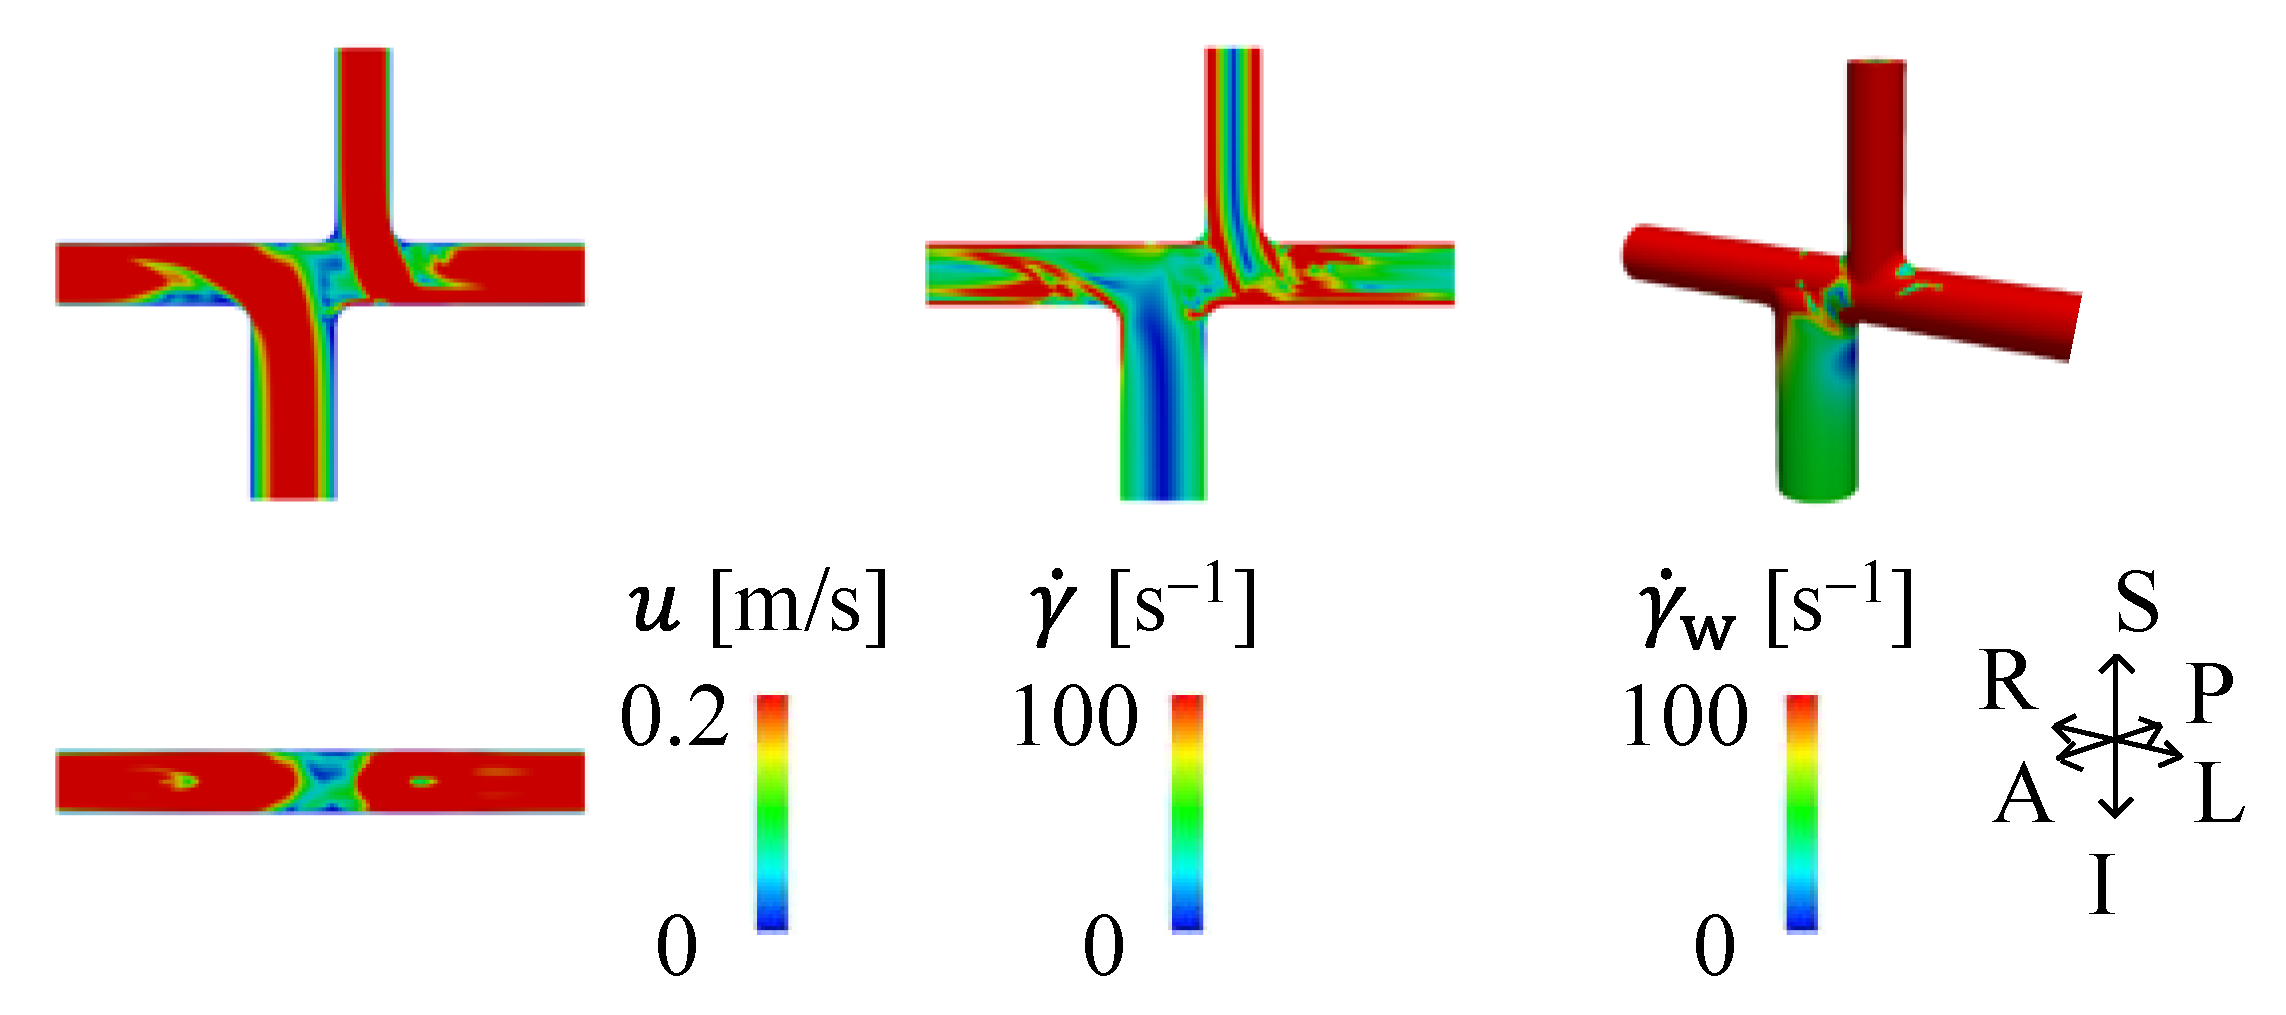
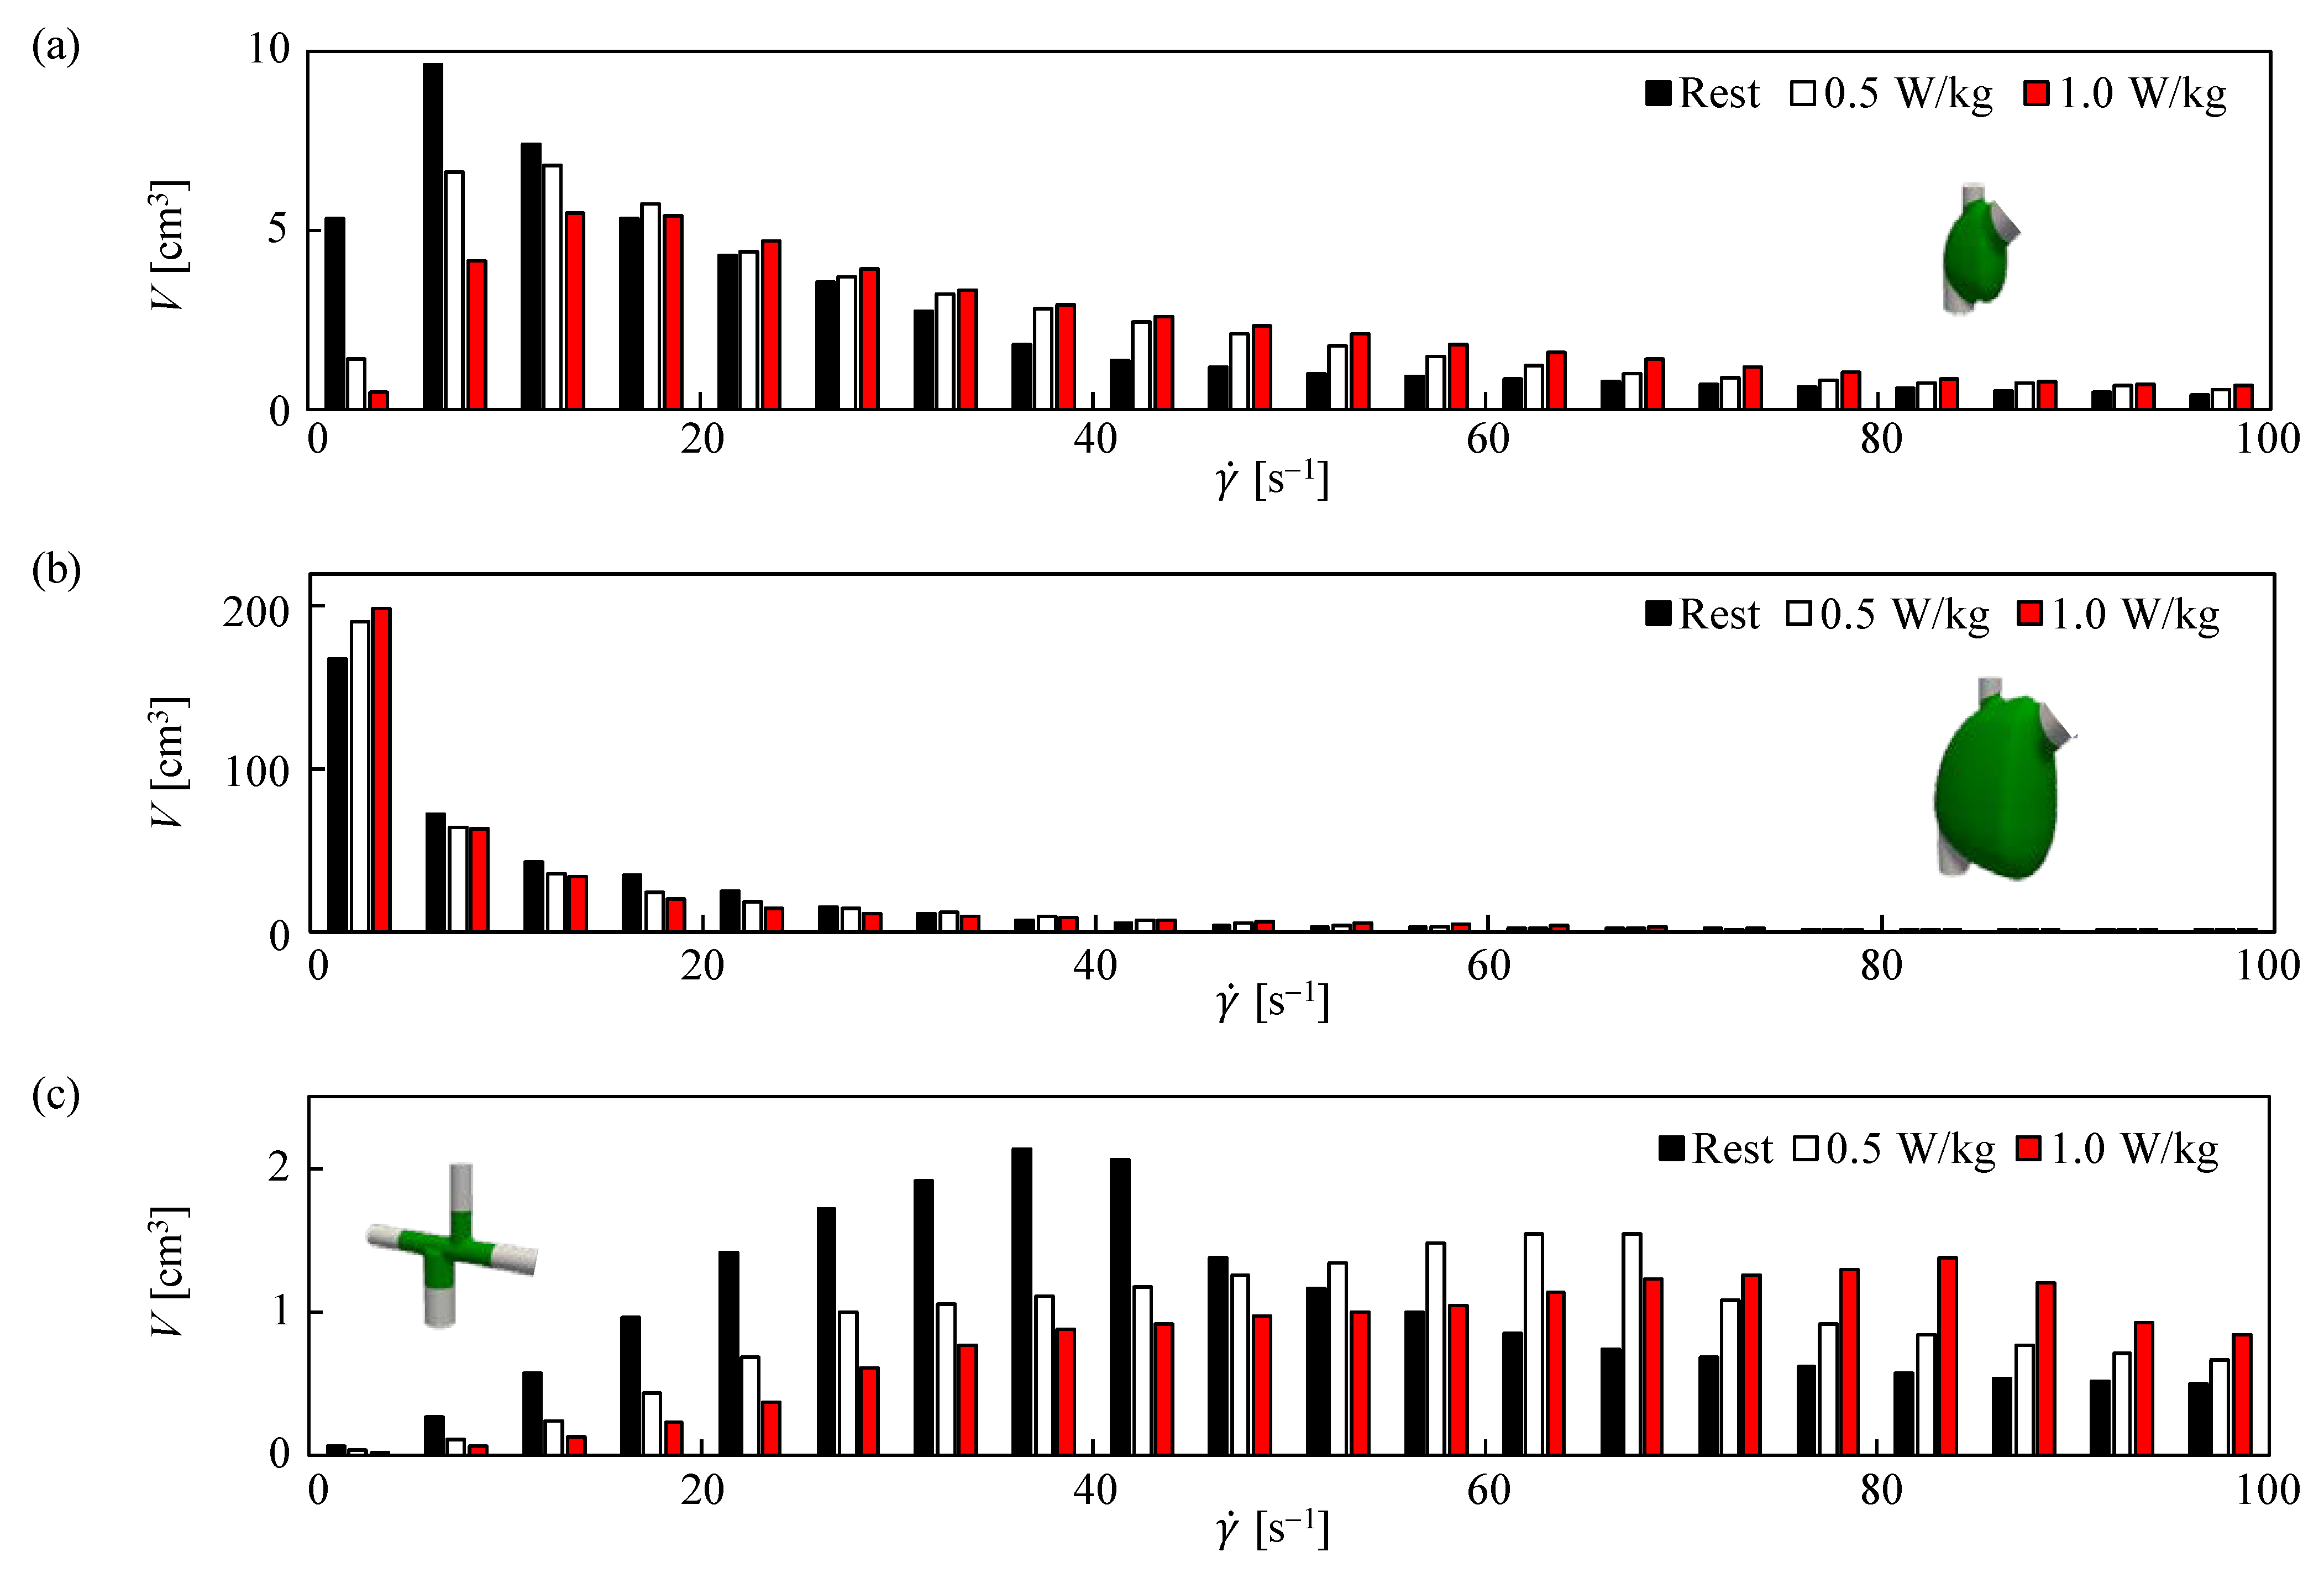
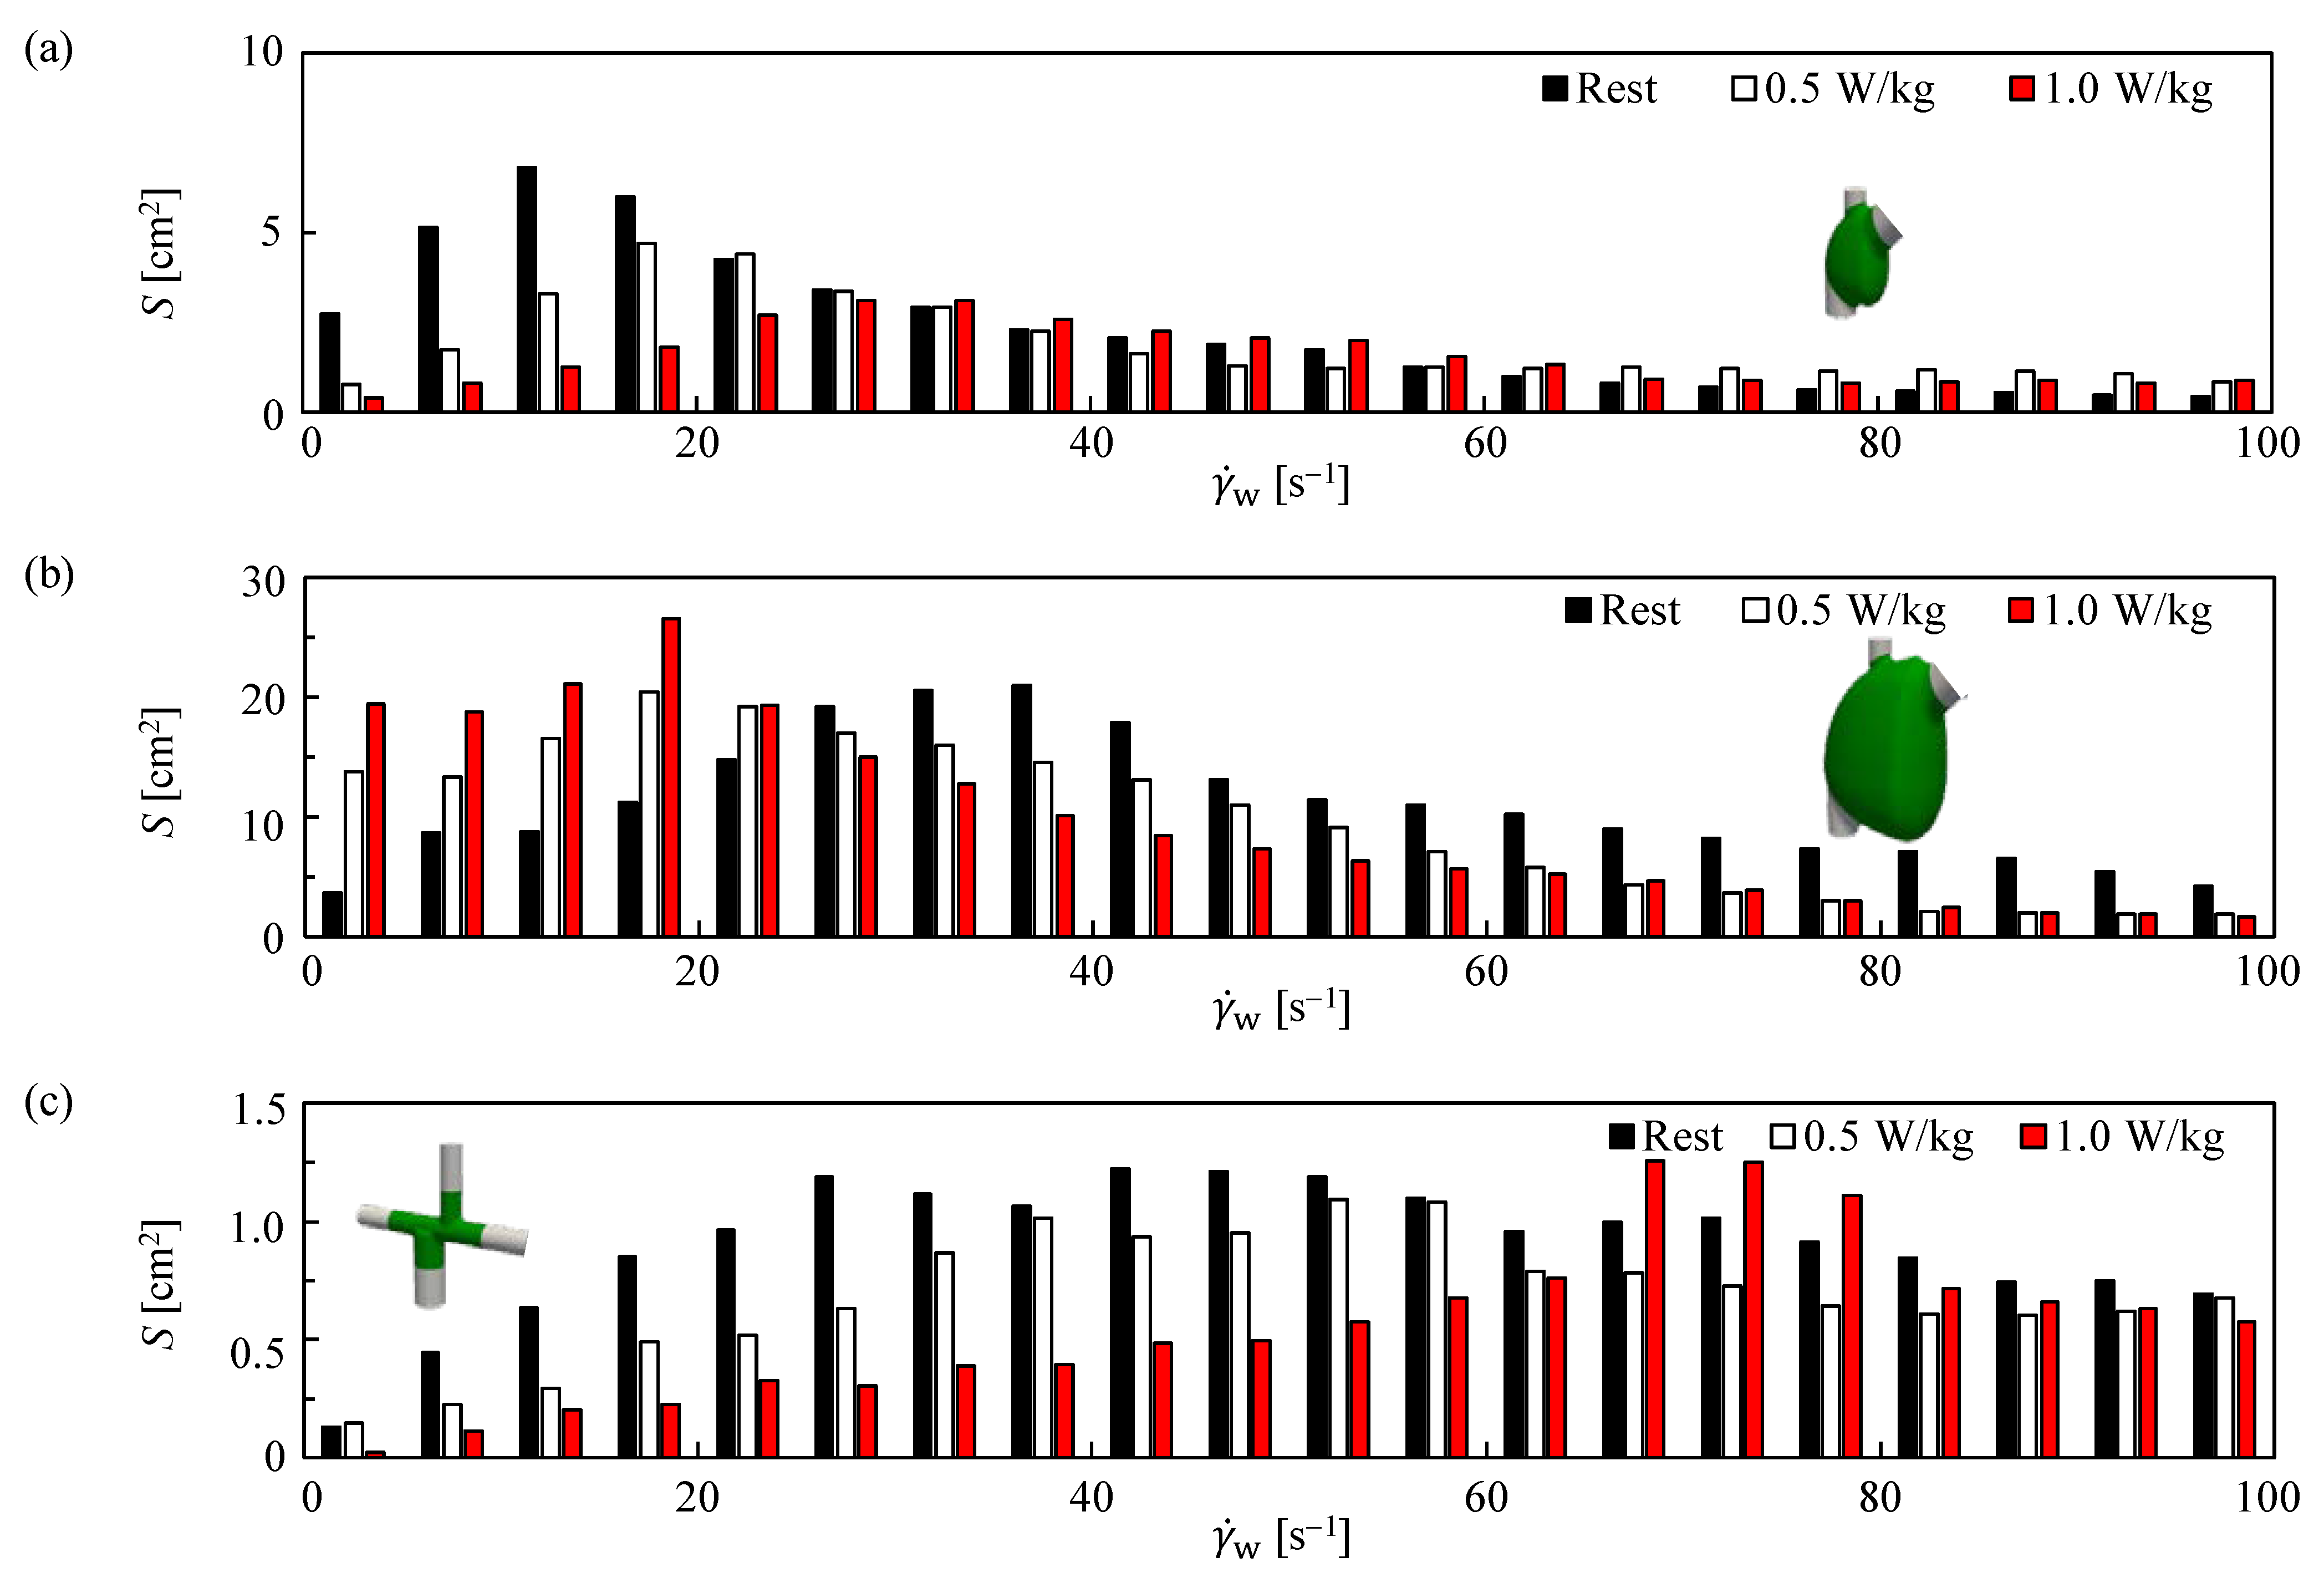
Under the rest flow condition, blood flow simulations for the APC and TCPC routes exhibited blood flow characteristics that differed depending on the channel geometry. The blood flow in the RA was characterized by two parts in the APC model: one was mainstream from the IVC and SVC toward the PA, and the other was a low-velocity region in the distended portion of the RA that served as a cavity in the flow channel, which was accompanied by a low SR γ ˙ [s−1] (Figure 2). The histograms of SR γ ˙ and WSR γ ˙ w (Figure 3) indicated that the volume with an SR γ ˙ of <10 s−1, V < 10   s 1 [cm3], and the wall surface area with a WSR γ ˙ w of <10 s−1, S < 10   s 1 [cm2], were, respectively, 15.0 cm3 and 7.9 cm2 in the APC-NRA, and 240.0 cm3 and 12.3 cm2 in the APC-DRA. Flow separation occurred near the junction among the IVC-ECC, SVC, and PAs in the TCPC, which was accompanied by low SR γ ˙ and WSR γ ˙ w (Figure 4). The magnitudes of γ ˙ and γ ˙ w were much higher than those noted in the APC model; V < 10   s 1 = 0.3 cm3 and S < 10   s 1 = 0.6 cm2 were less than 2% and 8%, respectively, of the values observed in the APC-NRA.

3.2. Velocity and SR in APC and TCPC during Exercise

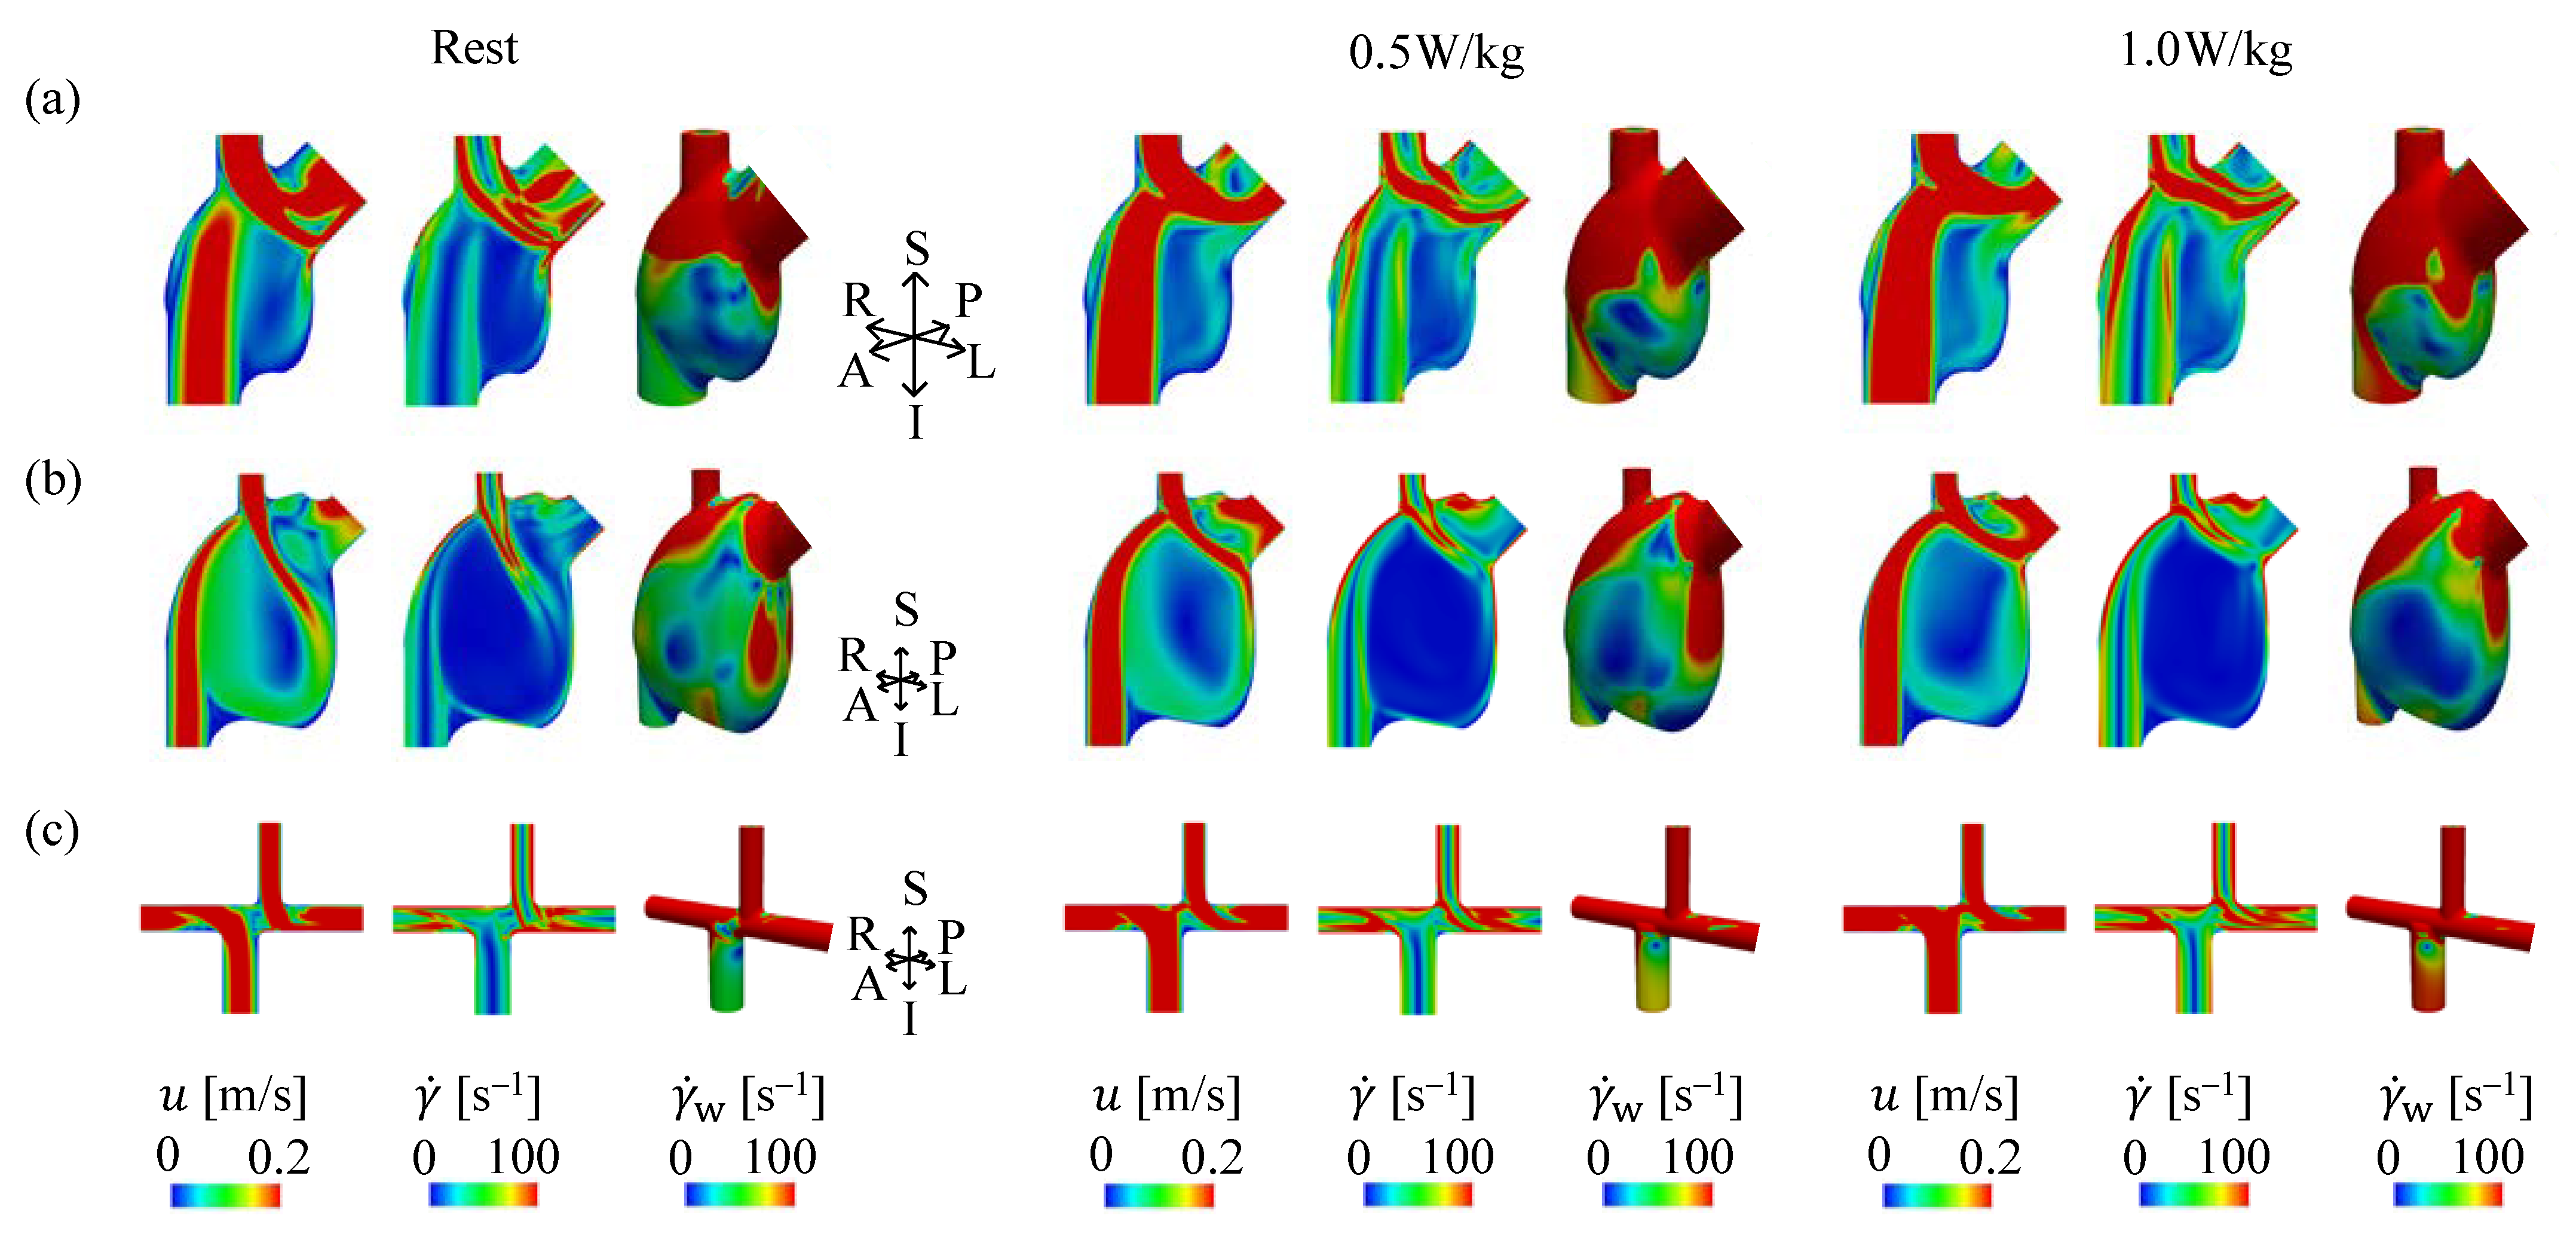
The flow rate increase in the IVC and IVC-ECC because of exercise led changes in blood flow compared with rest, as follows. The flow velocity increased in the distended portion of the RA (Figure 5a) in the APC-NRA and the PAs of the TCPC (Figure 5c). Consequently, SR γ ˙ and WSR γ ˙ w increased overall in both the APC-NRA and TCPC models (Figure 6a,c and Figure 7a,c); the low SR volume V < 10   s 1 and WSR surface area S < 10   s 1 during moderate exercise were 4.6 cm3 (31% of the resting flow condition) and 1.2 cm2 (15%), respectively. However, in the APC-DRA, the strong mainstream from the IVC to the PA blocked the blood flow from SVC to the distended portion of the RA (Figure 5b). Therefore, the recirculating flow was enhanced to increase the low SR volume V < 10   s 1 and low WSR surface area S < 10   s 1 by, respectively, 1.06 (254.5 cm3) and 2.2 (27.2 cm2) times during mild exercise and 1.09 (261.8 cm3) and 3.1 (38.8 cm2) times during moderate exercise (Figure 6b and Figure 7b). Thus, in APC, the effects of IVC flow rate on RA blood flow differed between normal-sized and dilated RAs.

4. Discussion

For the Fontan circulation, three-dimensional CFD simulations were performed to characterize the blood flow according to the flow channel geometries. Flow velocity was lower in the distended portion of the RA in the APC model than in the TCPC model, resulting in lower SR and WSR. Flow velocity and both SR and WSR increased overall in the APC-NRA and TCPC models when the flow rate in the IVC and IVC-ECC increased because of exercise. However, they decreased in the APC-DRA due to enhanced recirculating flow. Therefore, the APC Fontan may have a higher risk of thrombosis due to blood stasis than the TCPC Fontan. Furthermore, the risk of thrombosis within the APC is higher in the dilated RA than in the normal-sized RA. This finding supports the notion that conversion to TCPC Fontan effectively prevents thrombosis, and it further provides useful information on how soon the conversion surgery should be performed based on the degree of RA dilation.
Increasing the flow rate in the IVC reduced SR and WSR in the APC-DRA. This result was not observed when the Re was reduced to a value of <10 at the IVC (data not shown) or in the APC-NRA. When assessing low SR and WSR and the associated risk of thrombosis, this emphasizes the importance of Re and simultaneous consideration of the RA size and the flow rate balance between the IVC and SVC.
In the case of expansion flow, transient flow between the laminar and turbulent states can occur if the Reynolds number exceeds a few hundred. With a limited number of computational meshes available, such flow may be numerically simulated using a turbulent model [24,25]. Among several types of turbulent models, the k - ω SST model is appropriate for relatively low Reynolds number to estimate shear strain/stress close to the wall. It should also be noted that the SST model successfully simulates laminar flow [24].
This study has some limitations. First, the APC and TCPC as blood flow channels had their geometries simplified. Our models may not accurately reflect geometrical properties in detail, such as the curved shapes of IVC, SVC, and PAs as well as the local distortion of the RA compared with an image-based model [26]. Second, for simplicity, the RA shape was fixed as a noncontractile model, whereas the RA frequently contracts to support efficient cardiac output in the Fontan circulation [27]. Third, it was assumed that the venous-return blood flow rate in the TCPC was the same as that in the APC and the mainstream velocity profile was parabolic and constant in time. Finally, owing to the limited computational cost, the turbulence model was used. These factors might have affected the blood flow properties such as recirculating flow in the APC model and separation flow at the TCPC model’s junction, which might have further affected the SR and WSR values and distribution. However, because the present study’s geometry models and flow rate conditions are based on the measurement data obtained from previous studies, we believe the findings represent fundamental characteristics of blood stasis in the Fontan routes.
Based on Virchow’s triad, blood stasis can be considered as a significant cause of thrombosis [28]. SR and WSR were used as markers to assess blood stasis as a cause of thrombosis in this study. The threshold value of 10 s−1 assumed for low SR and WSR was based on the SR values reported in previous in vitro experiments [29,30]; below this threshold, fibrin monomer formation and polymerization occur. It also corresponds to the fact that on the basis of canine blood flow velocity and vessel size [31], time-averaged WSR is 20–30 s−1 in the ascending aorta, and smaller blood vessels have higher WSR. In contrast, SR and WSR values may not be sufficient to assess the thrombus formation in vivo. For instance, recent CFD simulations in a left auricular appendage, where thrombus occurs more frequently in atrial fibrillation than in a normal sinus rhythm, revealed a difference in volume-averaged SR [32] and residence time [33,34], whereas WSR is unlikely to change between a normal sinus rhythm and atrial fibrillation [35]. Jiang et al. [36] used a two-phase flow simulation to demonstrate the importance of the accurate estimation of blood residual as a cause of thrombosis. This is an unsolved task for future studies, leading to the establishment of references for anticoagulation therapy [3,4] in the Fontan circulation. Because the difference in blood flow is relatively large between the APC and TCPC, the simulation results of the present study suggest that SR and WSR represent the risk of thrombosis in Fontan routes due to blood stasis.

Author Contributions

Conceptualization, K.-i.T. and K.S.; Data curation, H.S.; Formal analysis, H.S.; Funding acquisition, K.-i.T.; Investigation, K.-i.T., H.S., K.S. and H.L.; Methodology, K.-i.T. and H.S.; Project administration, K.-i.T., K.S. and H.L.; Resources, K.-i.T.; Supervision, K.-i.T., K.S. and H.L.; Validation, K.-i.T. and H.S.; Visualization, H.S.; Writing—original draft, K.-i.T. and H.S.; Writing—review & editing, K.-i.T., K.S. and H.L. All authors have read and agreed to the published version of the manuscript.

Funding

This research was partly funded by a Research Grant from Terumo Life Science Foundation.

Conflicts of Interest

The authors declare no conflict of interest.

Appendix A

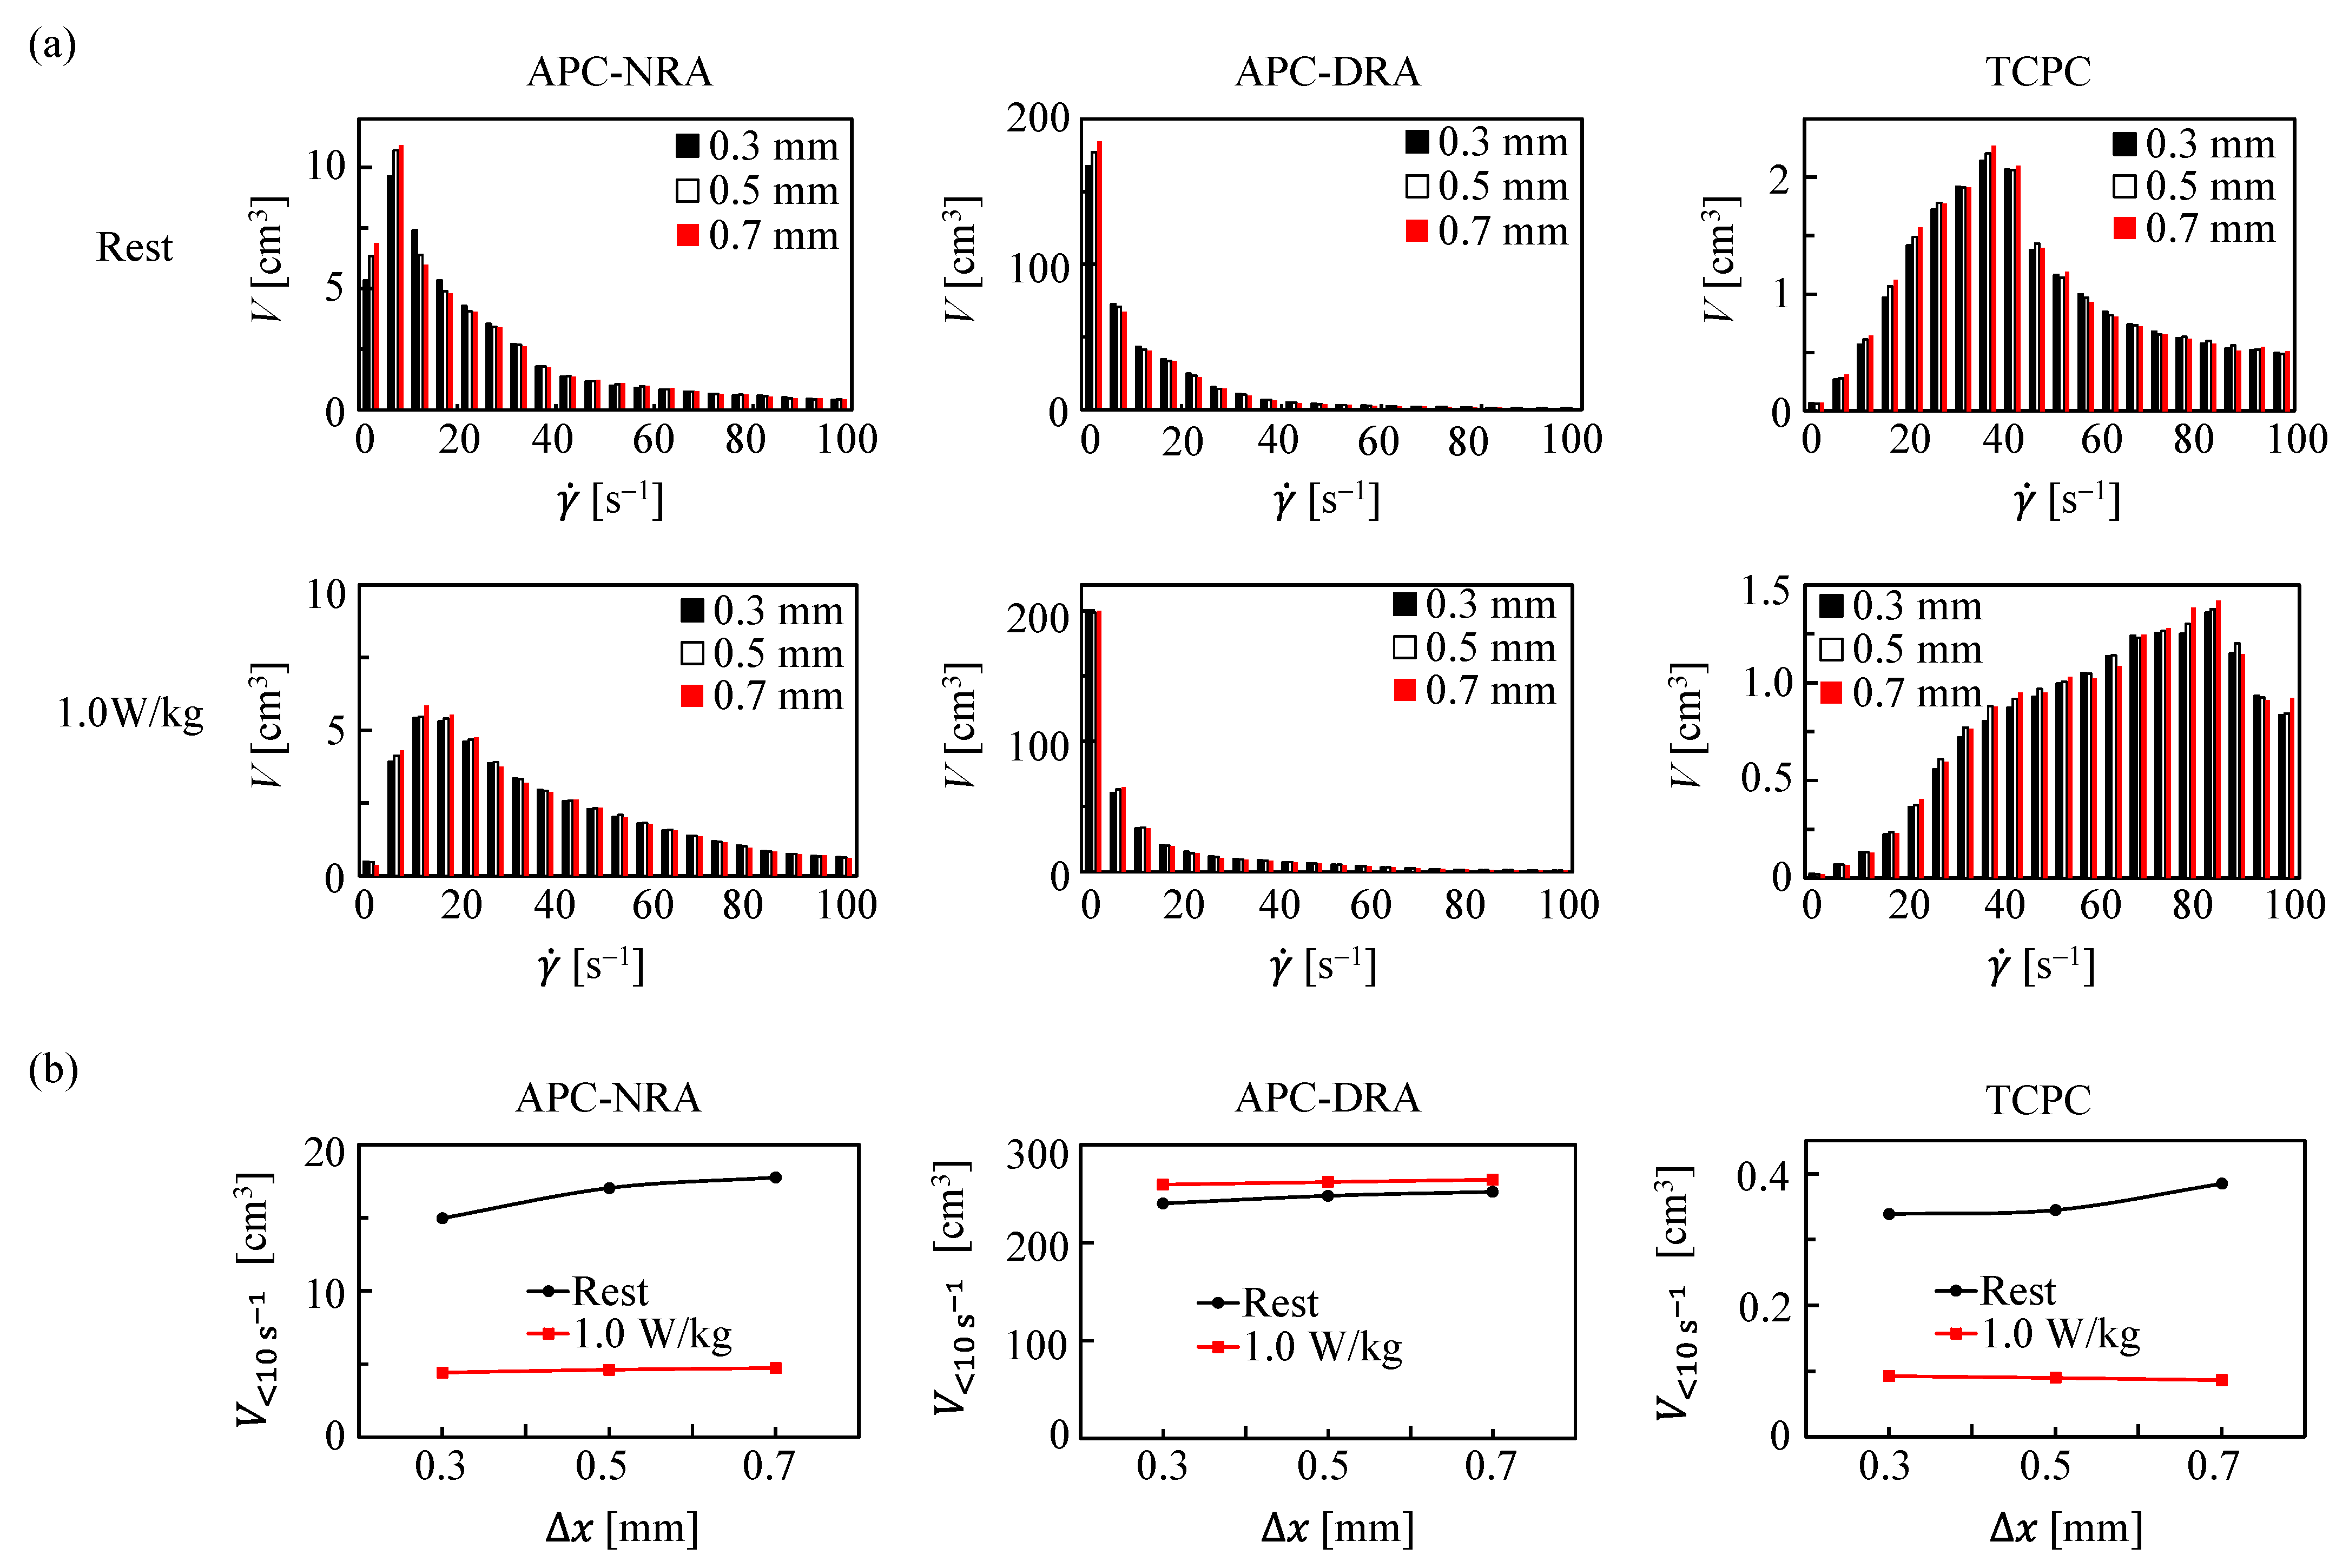
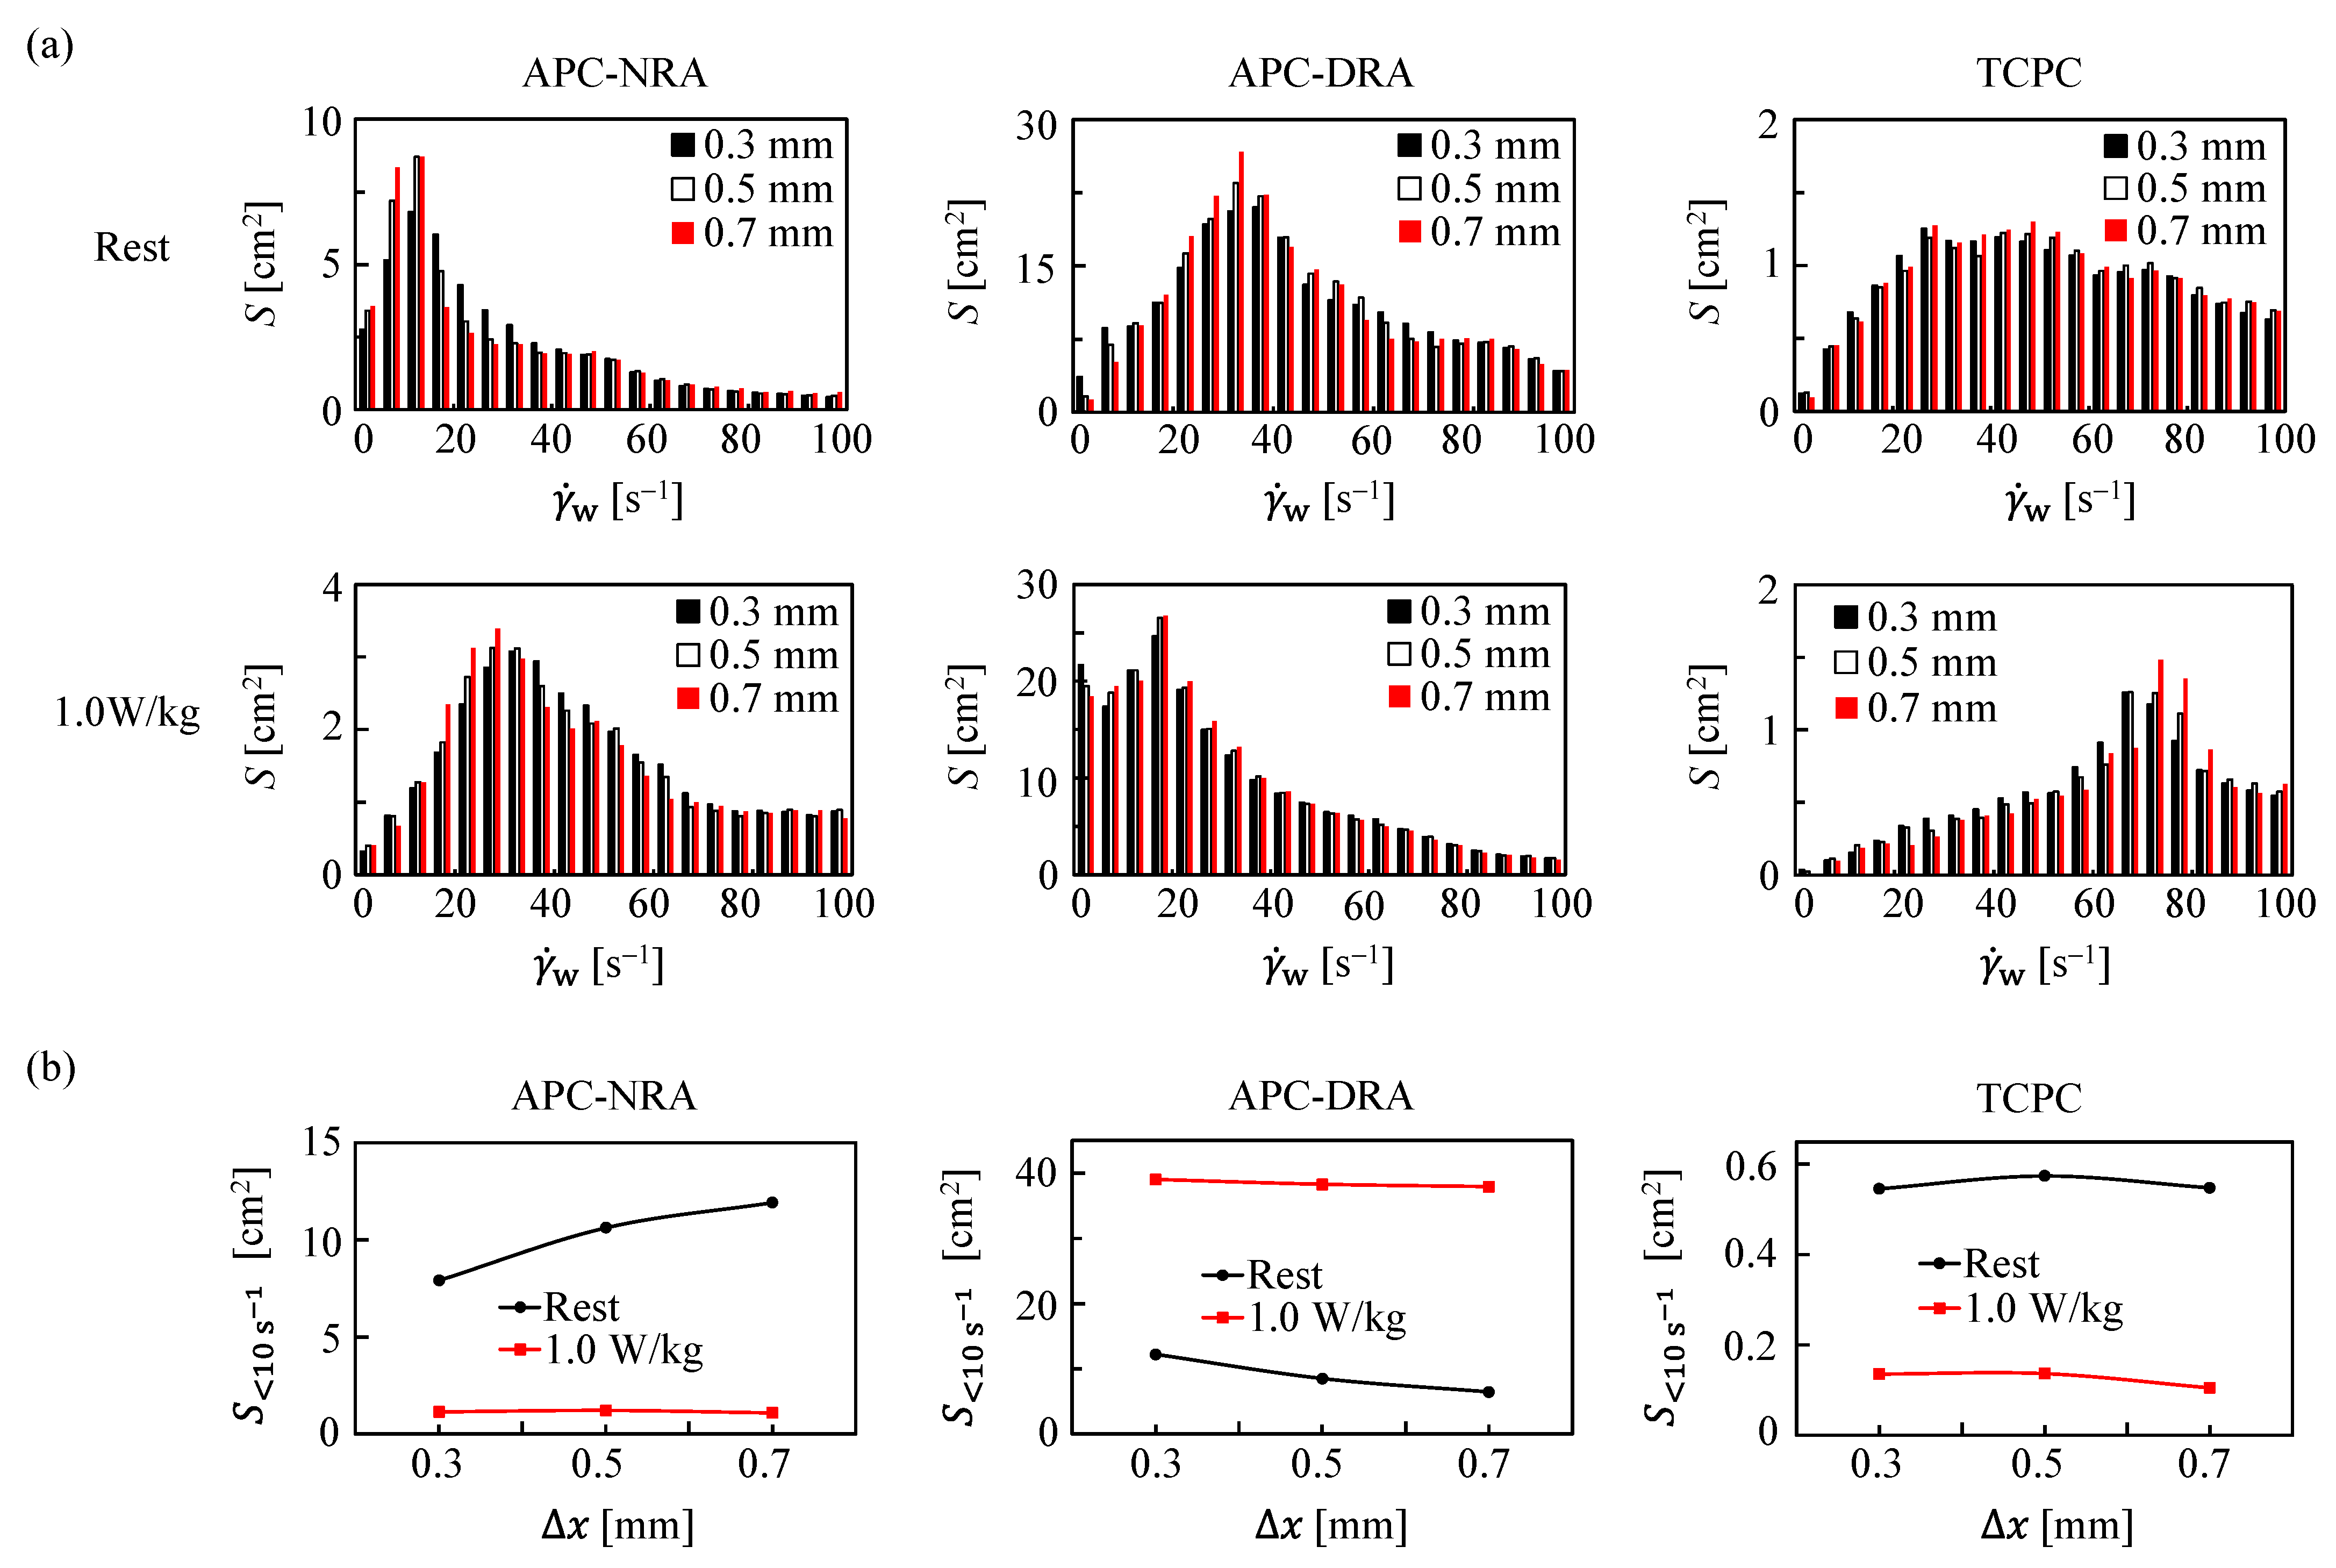
Mesh convergence properties were examined for SR γ ˙ and WSR γ ˙ w using the APC-NRA, APC-DRA, and TCPC models in two flow rate conditions of rest and moderate exercise (1.0 W/kg). The mesh size Δ x varied from 0.7 and 0.5 mm to 0.3 mm, where Δ x = 0.3 mm was the finest mesh size with which simulations were feasible in our computational resources available. The histograms of SR γ ˙ and low SR volume V < 10   s 1 (Figure A1) and those of WSR γ ˙ w and low WSR surface area S < 10   s 1 (Figure A2) indicate that simulated SR γ ˙ and WSR γ ˙ w essentially converged at Δ x = 0.5 mm, such that V < 10   s 1 and S < 10   s 1 varied between Δ x = 0.5 and 0.3 mm by <5%. As an exception, V < 10   s 1 and S < 10   s 1 in the APC-NRA at rest varied between Δ x = 0.5 and 0.3 mm by 12% and 25%, respectively, and S < 10   s 1 in the APC-DRA at rest varied between Δ x = 0.5 and 0.3 mm by 31%. According to these results, the mesh size Δ x was set at 0.5 mm, except for the APC-NRA and APC-DRA models in the resting flow rate condition where Δ x was set at 0.3 mm.
The mesh convergence test indicates that the current simulation results of the APC-NRA and APC-DRA at rest are not numerically convergent. However, the difference between the current simulation results and numerically convergent ones would not alter the conclusions of the present study because it does not affect the magnitude relations among the simulation conditions. For instance, in the case of volume V < 10   s 1 in the APC-NRA at rest, judging from the decreasing tendency of V < 10   s 1 with decreasing Δ x (in the left column of Figure A1), simulated V < 10   s 1 appears to converge to a certain value V < 10   s 1 C that is smaller than V < 10   s 1 of the current simulation ( Δ x = 0.3 mm) and V < 10   s 1 C is likely to be greater than a half value of V < 10   s 1 of the current simulation. Thus, V < 10   s 1 C in the APC-NRA at rest is likely to be greater than that of the TCPC and smaller than that of the APC-NRA during moderate exercise, which is same with V < 10   s 1 of the current simulation.
Figure A1. Mesh convergence test on SR γ ˙ [s−1] using APC-NRA, APC-DRA and TCPC models in flow rate conditions of rest and moderate exercise (1.0 W/kg). (a) Histograms of γ ˙ [s−1] and (b) low SR volume V < 10   s 1 [cm3] as the function of mesh size Δ x [mm].
Fluids 07 00138 g0a1
Figure A2. Mesh convergence test on WSR γ ˙ [s−1] using APC-NRA, APC-DRA and TCPC models in flow rate conditions of rest and moderate exercise (1.0 W/kg). (a) Histograms of γ ˙ [s−1] and (b) low WSR surface area S < 10   s 1 [cm2] as the function of mesh size Δ x [mm].
Fluids 07 00138 g0a2

References

  1. de Leval, M.R.; Deanfield, J.E. Four decades of Fontan palliation. Nat. Rev. Cardiol. 2010, 7, 520–527. [Google Scholar] [CrossRef] [PubMed]
  2. Rychik, J.; Atz, A.M.; Celermajer, D.S.; Deal, B.J.; Gatzoulis, M.A.; Gewillig, M.H.; Hsia, T.Y.; Hsu, D.T.; Kovacs, A.H.; McCrindle, B.W.; et al. Evaluation and management of the child and adult with Fontan circulation: A scientific statement from the American Heart Association. Circulation 2019, 140, e234–e284. [Google Scholar] [CrossRef] [PubMed]
  3. Kosmidis, D.; Arvanitaki, A.; Kartas, A.; Karvounis, H.; Giannakoulas, G. Thrombosis and thromboprophylactic strategies in the adult with Fontan circulation. Int. J. Cardiol. Congenit. Heart Dis. 2020, 1, 100054. [Google Scholar] [CrossRef]
  4. Monagle, P.; Karl, T.R. Thromboembolic problems after the Fontan operation. Semin. Thorac. Cardiovasc. Surg. Pediatr. Card. Surg. Annu. 2002, 5, 36–47. [Google Scholar] [CrossRef] [PubMed]
  5. Mittal, R.; Seo, J.H.; Vedula, V.; Choi, Y.J.; Liu, H.; Huang, H.H.W.; Jain, S.; Younes, L.; Abraham, T.; George, R.T. Computational modeling of cardiac hemodynamics: Current status and future outlook. J. Comput. Phys. 2016, 305, 1065–1082. [Google Scholar] [CrossRef]
  6. Haggerty, C.M.; de Zelicourt, D.A.; Restrepo, M.; Rossignac, J.; Spray, T.L.; Kanter, K.R.; Fogel, M.A.; Yoganathan, A.P. Comparing pre- and post-operative Fontan hemodynamic simulations: Implications for the reliability of surgical planning. Ann. Biomed. Eng. 2012, 40, 2639–2651. [Google Scholar] [CrossRef]
  7. Hammer, P.E.; Hoganson, D.M.; del Nido, P.J. A tribute to Ajit Yoganathan’s Cardiovascular Fluid Mechanics Lab: A survey of its contributions to our understanding of the physiology and management of single-ventricle patients. Cardiovasc. Eng. Technol. 2021, 12, 631–639. [Google Scholar] [CrossRef]
  8. Kung, E.; Baretta, A.; Baker, C.; Arbia, G.; Biglino, G.; Corsini, C.; Schievano, S.; Vignon-Clementel, I.E.; Dubini, G.; Pennati, G.; et al. Predictive modeling of the virtual Hemi-Fontan operation for second stage single ventricle palliation: Two patient-specific cases. J. Biomech. 2013, 46, 423–429. [Google Scholar] [CrossRef] [Green Version]
  9. Sughimoto, K.; Okauchi, K.; Zannino, D.; Brizard, C.P.; Liang, F.Y.; Sugawara, M.; Liu, H.; Tsubota, K. Total cavopulmonary connection is superior to atriopulmonary connection Fontan in preventing thrombus formation: Computer simulation of flow-related blood coagulation. Pediatr. Cardiol. 2015, 36, 1436–1441. [Google Scholar] [CrossRef]
  10. D’Oronzio, U.; Senn, O.; Biaggi, P.; Gruner, C.; Jenni, R.; Tanner, F.C.; Greutmann, M. Right heart assessment by echocardiography: Gender and body size matters. J. Am. Soc. Echocardiogr. 2012, 25, 1251–1258. [Google Scholar] [CrossRef] [Green Version]
  11. Moreno, J.; de Isla, L.P.; Campos, N.; Guinea, J.; Dominguez-Perez, L.; Saltijeral, A.; Lennie, V.; Quezada, M.; de Agustin, A.; Marcos-Alberca, P.; et al. Right atrial indexed volume in healthy adult population: Reference values for two-dimensional and three-dimensional echocardiographic measurements. Echocardiography 2013, 30, 667–671. [Google Scholar] [CrossRef] [PubMed]
  12. Peluso, D.; Badano, L.P.; Muraru, D.; Dal Bianco, L.; Cucchini, U.; Kocabay, G.; Kovacs, A.; Casablanca, S.; Iliceto, S. Right atrial size and function assessed with three-dimensional and speckle-tracking echocardiography in 200 healthy volunteers. Eur. Heart J. Cardiovasc. Imaging 2013, 14, 1106–1114. [Google Scholar] [CrossRef] [PubMed] [Green Version]
  13. Zuckerman, W.A.; Richmond, M.E.; Singh, R.K.; Chen, J.M.; Addonizio, L.J. Use of height and a novel echocardiographic measurement to improve size-matching for pediatric heart transplantation. J. Heart Lung. Transpl. 2012, 31, 896–902. [Google Scholar] [CrossRef] [PubMed]
  14. Deng, Y.J.; Dong, J.; Zhou, J.R.; Chen, D.; Chen, J. Dynamic assessment of the central vein throughout the cardiac cycle in adults with no right heart disease by cardiac CT. Clin. Imaging 2021, 69, 120–125. [Google Scholar] [CrossRef]
  15. Lee, S.H.; Kim, Y.J.; Lee, H.J.; Kim, H.Y.; Kang, Y.A.; Park, M.S.; Kim, Y.S.; Kim, S.K.; Chang, J.; Jung, J.Y. Comparison of CT-determined pulmonary artery diameter, aortic diameter, and their ratio in healthy and diverse clinical conditions. PLoS ONE 2015, 10, e0126646. [Google Scholar] [CrossRef] [Green Version]
  16. Restrepo, M.; Mirabella, L.; Tang, E.; Haggerty, C.M.; Khiabani, R.H.; Fynn-Thompson, F.; Valente, A.M.; McElhinney, D.B.; Fogel, M.A.; Yoganathan, A.P. Fontan pathway growth: A quantitative evaluation of lateral tunnel and extracardiac cavopulmonary connections using serial cardiac magnetic resonance. Ann. Thorac. Surg. 2014, 97, 916–923. [Google Scholar] [CrossRef] [Green Version]
  17. Restrepo, M.; Tang, E.; Haggerty, C.M.; Khiabani, R.H.; Mirabella, L.; Bethel, J.; Valente, A.M.; Whitehead, K.K.; McElhinney, D.B.; Fogel, M.A.; et al. Energetic implications of vessel growth and flow changes over time in Fontan patients. Ann Thorac. Surg. 2015, 99, 163–170. [Google Scholar] [CrossRef]
  18. Menter, F.R.; Kuntz, M.; Langtry, R. Ten years of industrial experience with the SST turbulence model. In Turbulence, Heat and Mass Transfer 4: Proceedings of the Fourth International Symposium on Turbulence, Heat and Mass Transfer, Antalya, Turkey, 12–17 October, 2003; Hanjalić, K., Nagano, Y., Tummers, M.J., Eds.; Begell House: Danbury, CT, USA, 2003; pp. 625–632. [Google Scholar]
  19. Kenner, T. The measurement of blood density and its meaning. Basic Res. Cardiol. 1989, 84, 111–124. [Google Scholar] [CrossRef]
  20. Nader, E.; Skinner, S.; Romana, M.; Fort, R.; Lemonne, N.; Guillot, N.; Gauthier, A.; Antoine-Jonville, S.; Renoux, C.; Hardy-Dessources, M.D.; et al. Blood rheology: Key parameters, impact on blood flow, role in sickle cell disease and effects of exercise. Front. Physiol. 2019, 10, 1329. [Google Scholar] [CrossRef] [Green Version]
  21. Issa, R.I. Solution of the implicitly discretised fluid flow equations by operator-splitting. J. Comput. Phys. 1986, 62, 40–65. [Google Scholar] [CrossRef]
  22. Patankar, S.V.; Spalding, D.B. A calculation procedure for heat, mass and momentum transfer in three-dimensional parabolic flows. Int. J. Heat Mass Transf. 1972, 15, 1787–1806. [Google Scholar] [CrossRef]
  23. Hjortdal, V.E.; Emmertsen, K.; Stenbog, E.; Frund, T.; Schmidt, M.R.; Kromann, O.; Sorensen, K.; Pedersen, E.M. Effects of exercise and respiration on blood flow in total cavopulmonary connection-A real-time magnetic resonance flow study. Circulation 2003, 108, 1227–1231. [Google Scholar] [CrossRef] [PubMed]
  24. Lee, T.S.; Liao, W.; Low, H.T. Numerical simulation of turbulent flow through series stenoses. Int. J. Numer. Methods Fluids 2003, 42, 717–740. [Google Scholar] [CrossRef]
  25. Linge, F.; Hye, M.A.; Paul, M.C. Pulsatile spiral blood flow through arterial stenosis. Comput. Methods Biomech. Biomed. Eng. 2014, 17, 1727–1737. [Google Scholar] [CrossRef] [PubMed] [Green Version]
  26. de Zelicourt, D.A.; Marsden, A.; Fogel, M.A.; Yoganathan, A.P. Imaging and patient-specific simulations for the Fontan surgery: Current methodologies and clinical applications. Prog. Pediatr. Cardiol. 2010, 30, 31–44. [Google Scholar] [CrossRef] [Green Version]
  27. Sughimoto, K.; Ueda, T.; Fujiwara, T.; Kabasawa, M.; Liu, H. Impact of atrial fibrillation on Fontan circulation: Fontan computational model. Ann. Thorac. Surg. 2021; in press. [Google Scholar] [CrossRef]
  28. Wolberg, A.S.; Aleman, M.M.; Leiderman, K.; Machlus, K.R. Procoagulant activity in hemostasis and thrombosis: Virchow’s triad revisited. Anesth. Analg. 2012, 114, 275–285. [Google Scholar] [CrossRef] [Green Version]
  29. Kaibara, M. Thrombus formation and blood flow-Focusing on venous thrombus. J. Jpn. Soc. Biorheol. 2004, 18, 82–90. (In Japanese) [Google Scholar] [CrossRef]
  30. Neeves, K.B.; Illing, D.A.R.; Diamond, S.L. Thrombin flux and wall shear rate regulate fibrin fiber deposition state during polymerization under flow. Biophys. J. 2010, 98, 1344–1352. [Google Scholar] [CrossRef] [Green Version]
  31. Caro, C.G.; Pedley, T.J.; Schroter, R.C.; Seed, W.A. The Mechanics of the Circulation; Oxford University Press: Oxford, UK, 1978. [Google Scholar]
  32. Bosi, G.M.; Cook, A.; Rai, R.; Menezes, L.J.; Schievano, S.; Torii, R.; Burriesci, G. Computational fluid dynamic analysis of the left atrial appendage to predict thrombosis risk. Front. Cardiovasc. Med. 2018, 5, 34. [Google Scholar] [CrossRef] [Green Version]
  33. Garcia-Villalba, M.; Rossini, L.; Gonzalo, A.; Vigneault, D.; Martinez-Legazpi, P.; Duran, E.; Flores, O.; Bermejo, J.; McVeigh, E.; Kahn, A.M.; et al. Demonstration of patient-specific simulations to assess left atrial appendage thrombogenesis risk. Front. Physiol. 2021, 12, 596596. [Google Scholar] [CrossRef] [PubMed]
  34. Otani, T.; Al-Issa, A.; Pourmorteza, A.; McVeigh, E.R.; Wada, S.; Ashikaga, H. A Computational framework for personalized blood flow analysis in the human left atrium. Ann. Biomed. Eng. 2016, 44, 3284–3294. [Google Scholar] [CrossRef] [PubMed]
  35. Koizumi, R.; Funamoto, K.; Hayase, T.; Kanke, Y.; Shibata, M.; Shiraishi, Y.; Yambe, T. Numerical analysis of hemodynamic changes in the left atrium due to atrial fibrillation. J. Biomech. 2015, 48, 472–478. [Google Scholar] [CrossRef] [PubMed]
  36. Jiang, X.D.; Li, D.; Wu, P.; Li, X.Q.; Zheng, T.H. A two-fluid blood stasis model for false lumen thrombosis after type B dissection repair. Comput. Methods Biomech. Biomed. Eng. 2021. published online. [Google Scholar] [CrossRef]
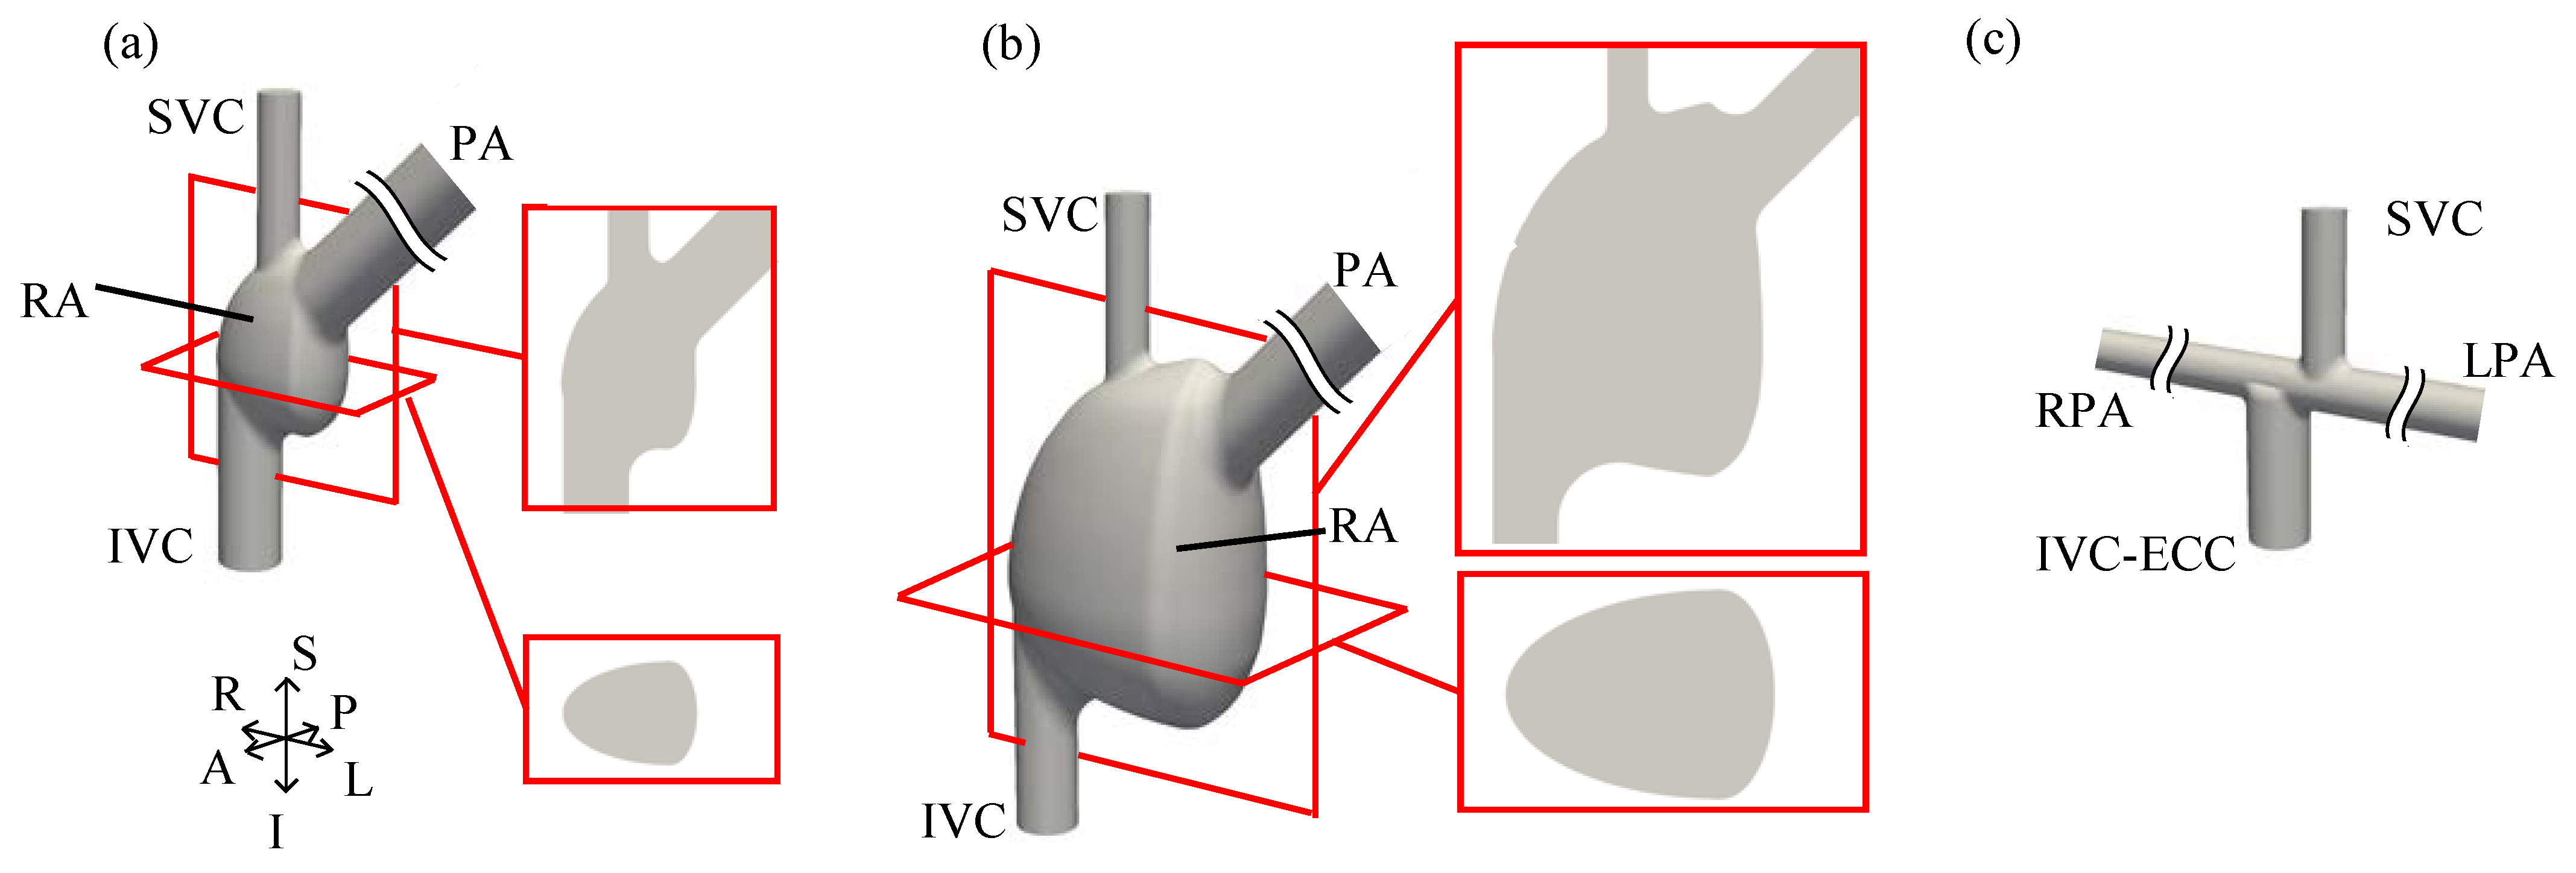
Figure 1. Models of blood flow channels involving the anastomotic regions of the venae cava and pulmonary arteries. (a) Atriopulmonary connection (APC) with normal-sized right atrium (APC-NRA), (b) APC with dilated right atrium (APC-DRA), and (c) total cavopulmonary connection (TCPC). The coordinate axes indicate the superior(S)–inferior(I), anterior(A)–posterior(P), and left(L)–right(R) directions, in which the lengths of axes indicate 4 cm.
Fluids 07 00138 g001
Figure 2. Simulated blood flow in (a) APC-NRA and (b) APC-DRA at a flow rate condition of the rest state. Flow velocity u [m/s] in the coronal and horizontal cross-sections, shear rate (SR) γ ˙ [s−1] in the coronal cross-section and wall shear rate (WSR) γ ˙ w [s−1] are shown from right to left.
Fluids 07 00138 g002
Figure 3. Histograms of (a) SR γ ˙ [s−1] and (b) WSR γ ˙ w [s−1] in the anastomotic regions of the vena cava and pulmonary arteries. Green surfaces in the schematic drawings of the APC and TCPC models illustrate evaluation regions for this histogram. The class interval for both γ ˙ and γ ˙ w was set as 5 [s−1], and corresponding volume V [cm2] in (a) and wall surface area S [cm2] in (b), as the frequency, were calculated at each γ ˙ or γ ˙ w value.
Fluids 07 00138 g003
Figure 4. Same as Figure 2a,b but in the TCPC model.
Fluids 07 00138 g004
Figure 5. Effects of a flow rate condition on blood flow. For three flow rate conditions of rest (left), mild exercise (0.5 W/kg, mid), and moderate exercise (1.0 W/kg, right), velocity magnitude u [m/s] (left) and SR γ ˙ [s−1] (mid) in the coronal cross-section and WSR γ ˙ w [s−1] (right) are shown for (a) APC-NRA, (b) APC-DRA, and (c) TCPC models.
Fluids 07 00138 g005
Figure 6. Histograms of SR γ ˙ [s−1] in three flow rate conditions of rest, mild exercise (0.5 W/kg), and moderate exercise (1.0 W/kg) for (a) APC-NRA, (b) APC-DRA, and (c) TCPC.
Fluids 07 00138 g006
Figure 7. Histograms of WSR γ ˙ w [s−1] in three flow rate conditions of rest, mild exercise (0.5 W/kg), and moderate exercise (1.0 W/kg) for (a) APC-NRA, (b) APC-DRA, and (c) TCPC.
Fluids 07 00138 g007
Table 1. Blood flow rate [23] from the venae cava and mean velocity.
IVC and IVC-ECCSVC
Flow Rate
[μm3/s]
Mean Velocity
[m/s]
Flow Rate
[μm3/s]
Mean Velocity
[m/s]
rest49.10.12938.60.251
0.5 W/kg79.10.20838.90.253
1.0 W/kg99.70.26238.90.253
Publisher’s Note: MDPI stays neutral with regard to jurisdictional claims in published maps and institutional affiliations.