Abstract
Insect wings are generally constructed from veins and solid membranes. However, in the case of the smallest flying insects, the wing membrane is often replaced by hair-like bristles. In contrast to large insects, it is possible for both bristled and membranous wings to be simultaneously present in small insect species. There is therefore a continuing debate about the advantages and disadvantages of bristled wings for flight. In this study, we experimentally tested bristled robotic wing models on their ability to generate vertical forces and scored aerodynamic efficiency at Reynolds numbers that are typical for flight in miniature insects. The tested wings ranged from a solid membrane to a few bristles. A generic lift-based wing kinematic pattern moved the wings around their root. The results show that the lift coefficients, power coefficients and Froude efficiency decreased with increasing bristle spacing. Skin friction significantly attenuates lift production, which may even result in negative coefficients at elevated bristle spacing and low Reynolds numbers. The experimental data confirm previous findings from numerical simulations. These had suggested that for small insects, flying with bristled instead of membranous wings involved less change in energetic costs than for large insects. In sum, our findings highlight the aerodynamic changes associated with bristled wing designs and are thus significant for assessing the biological fitness and dispersal of flying insects.
1. Introduction
In the course of evolution, insect species have gone through a process of significant reduction in body size. The size difference between insects of a single order may span two orders of magnitude, with body lengths varying between several centimeters to the fractions of a millimeter. The process of miniaturization is a result of ancestral genetic traits leading to structural reduction and, in many cases, morphological novelty [1]. Although many small insect species rely on flapping flight for locomotion, they suffer from their small size in different ways. They include a reduction in neurons for sensing and motor control and a decrease in flight muscle efficiency. It also makes wing flapping more energetically costly because of added skin friction at low Reynolds numbers [2,3]. The Reynolds number in flying insects is the ratio between the product of wing speed and characteristic length divided by the kinematic viscosity of the fluid. In this study, we used wing tip velocity and wing length for calculation (see the Materials and Methods in Section 2). Reynolds numbers of below ~10 predict low lift-to-drag ratios of unity or less, leading to a sharp decline in the ability to support body weight and carry out maneuvering flight. Very small insects therefore avoid airfoil action and can be said to swim in air [4]. This is surprising, given that rowing wings in flows near the change from high to low Reynolds numbers encounter high costs to overcome viscous friction. This friction is so pronounced that some of the smallest insects can use their wings as parachutes in order to delay their descent during wind dispersal [5].
With air viscosity being more important for flight at low Reynolds numbers, special morphological adaptions can be found in small flying insects that are not seen in larger species [2]. One such adaptation, ptiloptery, refers to wings with long bristles attached to a narrow membrane (Figure 1) [6,7,8]. Ptiloptery is commonly, but not exclusively, observed in small insects. The two types of wings, solid and bristled, can co-occur in insects with typical body sizes below a few millimeters. On the other hand, larger insects tend to have solid wings. The geometry of insect wing bristles is highly variable among different species. It remains largely unknown how bristle geometry, solidity ratio and their compliance affect flight performance and energetic costs (Figure 1). Ptiloptery has the advantage of lowering the mass of the wing, thereby saving inertial power during wing flapping [9]. However, bristled wings produce fewer aerodynamic forces compared to solid wings as air can pass through the wing surface [8,10]. Overall, there is relatively little known about the aerodynamic performance of bristled insect wings and their co-occurrence with solid wings.
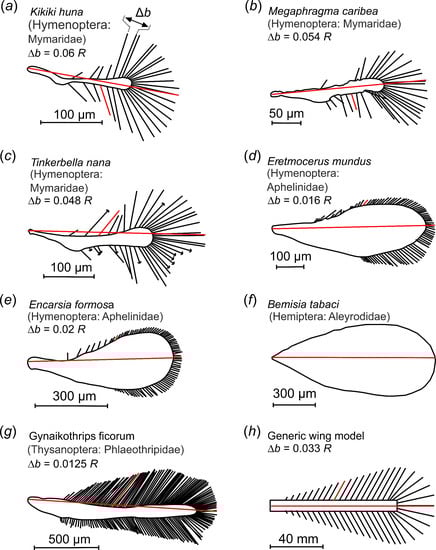
Figure 1.
Examples of insect bristled wings and an experimental wing model. (a–g) Bristled wings occurring in small insects, taken from the literature. Wings are scaled to equal size; red lines indicate the wings’ longitudinal axes and length R. (h) Wing model with mean bristle spacing. Bristle spacing Δb was defined as the mean distance between two bristle tips of natural wings, excluding 20% of the smallest and largest bristles. Model wings ranged in mean bristle spacing from 0.016 R to 0.163 R. The characteristic angle between lateral bristles and the wing’s longitudinal axis at the shaft’s midpoint is highlighted for a single bristle (red). The length of the tested wings was 125 mm.
In contrast to solid wings, bristled wings produce complex fluid flows. At Reynolds numbers below unity, these include flows around individual bristles, while at low-to-medium Reynolds numbers, the flows encompass the entire wing [8,11]. According to analytical studies, flow between adjacent bristles depends on the bristles’ diameter and the space between them, as well as airflow velocity [12]. As bristle spacing strongly affects how much air passes through the wings, this is a dominant factor in determining force production in bristled wings [10,13,14]. Wings with a suitable distance between bristles could even act in a similar way to those with a solid membrane [12]. Although an experimental study on translating rectangular wings with bristles confirmed this hypothesis [15], these results cannot be applied easily to insect flight because of the differences in kinematics and wing shape. As force production is attenuated by the amount of air able to pass through the wing, bristled wings may be more beneficial in gusty exterior flows by dampening large shifts in aerodynamic force production compared to solid wing surfaces [16]. Bristles may also augment the lift-to-drag ratio during flapping flight, as it has been reported that the largest lift-to-drag ratios are produced by wing areas combining 15–30% solid membrane and 70–85% bristles [17].
Descriptions of wing kinematics in miniature insects are rare and limited to studies on the parasitoid wasp Encarsia formosa [18], small thrips and wasps [5,19], whiteflies Bemisia tabaci during take-off [20] and several species of the parasitoid wasp Nasonia [21]. The details of the changes in the wing kinematics of different species of small insects have been summarized previously [22]. In small flying insects, the wing tip path often follows a figure-of-eight kinematic while exhibiting a strong heaving motion, often relying on drag for propulsion [23,24]. The wing motion pattern of the ~1 mm parasitoid wasp Encarsia formosa may, therefore, be an adaptation to high viscous friction acting on the wings and body [18]. In this species, drag-based rowing produces ~70% of the vertical force for weight support while the clap-and-fling mechanism provides the remaining ~30% lift [25,26]. Most research has focused on the clap-and-fling wing kinematics of bristled wings [5,10,27], with bristled wings being suggested to require less force to separate the wings during the fling motion [28].
Most previous studies on bristled wing aerodynamics have not addressed the power requirements of flapping flight, leaving the question unanswered as to why bristle and solid wings co-occur in small insects but not in larger insects. A recently published numerical study suggests that Froude efficiency is key to the latter finding [29]. This experimental study employed the same kinematic pattern and wing design as the numerical study testing parameterized wing models with bristle densities that are typical of small insects. The approach assessed the aerodynamic forces and moments, aerodynamic power and Rankine–Froude efficiency of flight for root flapping wings. Our findings are similar to the previous results and highlight the decrease in aerodynamic performance and efficiency in bristled wings with decreasing Reynolds numbers.
2. Materials and Methods
2.1. Wing Design and Kinematics
This study used generic wings with bristle spacing similar to that of small insects (Figure 1a–g, Table 1) [29] instead of testing the bristled wings of any single specific species. Our synthetic wing shapes were constructed to consider three aspects: a resemblance to natural flapping bristled wings; a one-parameter family that determined wing permeability (bristle spacing); and an emphasis on aerodynamics and power. Natural bristled wings vary in the relative area of the central membranous shaft, as well as in bristle diameter, outgrowths present on the bristles and asymmetry between the leading and the trailing edges. Animals can optimize these parameters in terms of material investment, inertial costs during flapping and the wings’ structural stiffness, as well as aerodynamic performance. Although the tested wings were simplified, our models explored the major effects of flows through bristles at low Reynolds numbers.
As real wings have a narrow root and circular wing tips, the tested wings were given a snow-cone-like shape. One wing was solid (∆b = 0) and eight wings had bristles with various bristle spacing (∆b), attachment sites, area coverage and number of bristles, normalized to the wing length (Figure 2). Wing thickness was ~2.0 mm at the base and ~1.3 mm at the end of the membranous core. The wings were printed from polyvinyl alcohol plastic (PVA) on a high-resolution Ultimaker3 3D printer (Ultimaker, Utrecht, The Netherlands) using Cura 4.8 software. Bristle diameter was ~1.1 mm or ~8.8 × 10⁻³ wing length and the bristle angle αb relative to the wing’s longitudinal axis was ~29° (Figure 1h and Figure 2e). The model wing was comparatively rigid as direct measurements have recently shown that real wing bristles are remarkably stiff [30] and we also numerically showed that bristle bending is likely to be negligible during wing flapping in tiny insects [29]. The wings had little weight under the tested conditions because of neutral buoyancy resulting from the similar densities of the PVA (~1190–1310 Kg m−3) and the fluid used (glycerin, ~1260 Kg m−3).
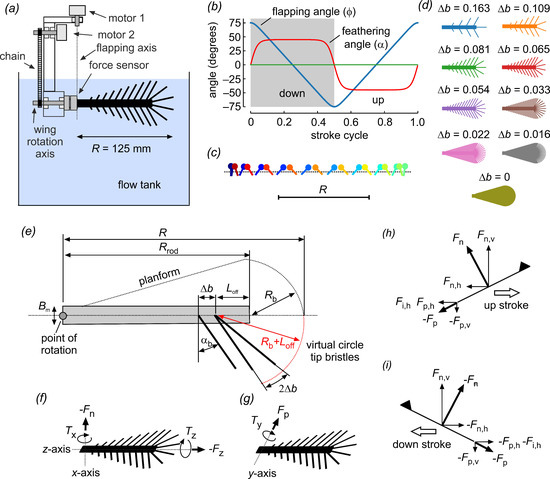
Figure 2.
Experimental setup for wing testing and wing kinematics. (a) Wings were mounted on a 6-degree force transducer. A servo motor (motor 2) controlled the wings’ angle of attack via a chain and gears. Flapping motion in the horizontal direction (feathering angle) was driven by a second servo motor (motor 1) around a rotational axis that was aligned with the transducer’s coordinate system. The wings were immersed in a 60 × 40 × 36 cm3 tank filled with glycerin. The stroke plane was ~6 cm below the fluid surface to avoid wave generation. (b) Generic wing motion of a lift-based kinematic, showing the wing’s feathering angle (red), horizontal flapping angle (blue) and vertical heaving angle (green). (c) Lollipop diagram of a wing chord in xy-space; markers indicate the leading edge of the wing. Different times of the stroke cycle are shown in color. (d) Cartoons of the tested solid (membranous) and bristled wings. (e) Wing design: R = 125 mm, wing length; Rrod = 100 mm, length of membranous core; Bm = 8.6 mm, width of wing base; αb = 29°, bristle angle; and ∆b bristle spacing. (f–i) Definition of forces and moments. Triangles indicate the wing’s leading edge and dorsal surface. Fn, force normal to wing surface; Fp, force parallel to wing surface; Fz, force axial to wing surface (parallel to the wing’s longitudinal axis); Fn,v (Fp,v), vertical lift from normal (parallel) force; Fn,h (Fp,h), horizontal drag from normal (parallel) force; Fi,h, horizontal inertia of wing mass, not including inertia due to the fluid’s added mass; TX, Ty, Tz, moments as shown in (f,g).
Our model was an advance on earlier numerical studies on comb wings with two-dimensional rectilinear motion. The model wings were flapped back and forth around the root in the horizontal direction with constant velocity and at 150° amplitude. Stroke reversals were performed by symmetrical wing rotation, each lasting ± 10% cycle time (Figure 2b,c). The wing’s feathering angle was 45° during the up and down strokes and 0° (vertical position) at the stroke reversals. Tested stroke cycle periods were 2.19, 1.49, 3.88, 5.67 and 10.1 s. The wings were flat, owing to the finding of a previous study that the wings’ three-dimensional structure can be divided into large-scale camber-twist and small-scale corrugation components [31]. In comparison to the important role bristle density was expected to have on performance, the contribution by the corrugation component on net aerodynamic forces was minimal for small wings (fruit fly [31]). Although secondary microstructures on bristles may have a significant effect on bristle drag, more realistic 3D printed bristles with cylindrical cores and secondary outgrowths generate the same aerodynamic drag as simple cylindrical rods with a wider diameter. More details on the development of wing design and kinematics were published previously [29].
To allow comparisons to previous studies in insect flight, the Reynolds number Re is typically determined from velocity u at the wing tip and wing length R. Following a numerical study on bristled wings [29], however, we here defined the Reynolds number as:
where f is the wing flapping frequency and ν = 1184 cSt is the kinematic viscosity of glycerin. The above stroke cycle times resulted in Reynolds numbers of approximately 8.87, 6.06, 3.42, 2.34 and 1.32 (see Equation (1)). For comparison, these numbers compare to approximately 13.6, 9.29, 5.24, 3.58 and 2.02 for Reynolds numbers based on average wing tip speed and mean wing chord instead of on wing length [32].
2.2. Experimental Setup
The tested wings flapped in a tank with a size of ~60 cm width, ~36 cm height and ~40 cm depth (Figure 2a). The tank was filled with pure glycerin and the experimental temperature was approximately 24 °C. To avoid the production of elevated waves at the surface, the stroke plane was ~6 cm below the surface. We mounted the wings to a 6-degrees-of-freedom force transducer (ATI, Nano 17, Apex, NC, USA) so that all rotational axes for wing motion ran through the sensor’s measurement coordinate system. The sensor was newly calibrated by the manufacturer (Schunk GmbH, Lauffen, Germany). We again checked the calibration with 20 g, 30 g and 50 g loads at three different wing locations for force components normal (Fn) and parallel (Fp, chordwise) to the wing surface. The measured forces typically differed less than 1% from the expected values. Crosstalk between Fn and Fp was ~1.5%, ~1.7% and ~0.5% on average, and ~6.1%, 5.7% and 5.4% between Fn and the spanwise component (Fz, Figure 2) for the three loads, respectively. Sensor noise was calculated from the standard deviation of the Fn component and was broadly independent of the load. It varied for the unloaded sensor and different constant loads between ~10.4 mN and ~10.7 mN. We calculated the signal-to-noise ratio (SNR) from the ratio between the measured force and noise, which yielded ~76 for force peaks of 800 mN and ~9.5 for the mean force of the solid wing during wing translation (100 mN). However, due to the high force sampling rate of 800Hz, we could effectively smooth out noise by a low-pass Butterworth filter (see below).
A servo motor controlled the wings’ angle of attack via a chain and two gears (motor 2; Graupner DS368, Kirchheim unter Teck, Germany, Figure 2a). Back and forth flapping motion was controlled by a second servo motor (motor 1, Figure 2a). Both motors were powered and position-controlled by an ATmega16L micro-controller on a STK500 board (Microchip AVR, Chandler, AZ, USA). The micro-controller flapped the wing for 10 consecutive cycles, then stopped wing motion for ~15 s to allow the fluid to rest and then repeated the cycle train again. To average the performance, we repeated the measurements five times for each wing. Our data show that the first stroke cycle always produces higher forces than the following strokes. In addition, the last cycle may also produce force peaks at the end of the flapping motion. For analysis, we thus averaged only the forces measured in the third to eighth stroke cycles.
2.3. Power and Coefficients
In addition to the measured aerodynamic forces, we present wing performance and power consumption as dimensionless coefficients. All coefficients were calculated for the translational up and down stroke, ignoring the forces during wing acceleration at the beginning and end of each half stroke. This was due to the large force peaks at the stroke reversals that resulted from the combined effect of a high angle of attack and wing inertia (Figure 3). As we could not reliably determine the added mass inertia of each bristled wing, we excluded the contribution of forces during these times and derived the coefficient for the translational phase only. Lift and drag coefficients were calculated from:
and
where Fn,v,trans (Fp,v,trans) is the vertical force derived from forces normal (parallel) to the wing surface during translation, Fn,h,trans (Fp,h,trans) is the horizontal force derived from forces normal (parallel) to the wing surface during translation, Fi is the inertia of the wings’ own mass, ρ = 1260 Kg m−3 is the density of glycerin, u is the mean wing tip velocity and Aw = 4.58 × 10⁻³ m2 is the wing area of the solid wings. Although wing weight was near zero in glycerin, we had to subtract the weight of the metal wing holder (~6.67 g) from Fn and Fp. As exact values depend on buoyancy, we experimentally determined these forces in a control experiment (Fn = 0.067 N, Fp = 0.0665 N) and subtracted them from the force measurements. In Figure 4d and Table 2, we also show the lift and drag coefficients as a function of the relative wetted (covered) wing area. Controls suggested only small differences in the lift and drag coefficients calculated from forces with and without inertia, amounting to ~0.9% (CL) and 1.0% (CD, n = 9 wings), and ~2.5% (maximum, CL, wing ∆b = 0.081) and ~6.0% (maximum, CD, wing ∆b = 0.163).
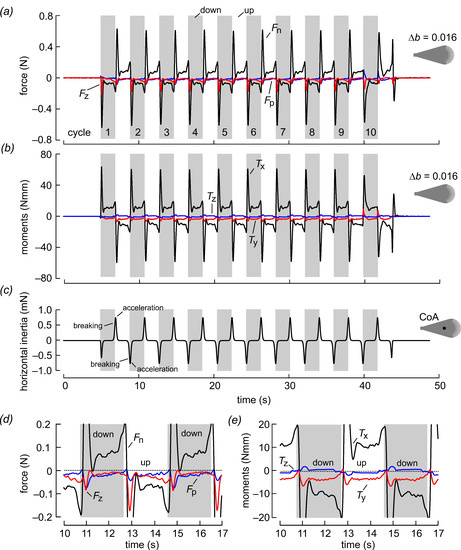
Figure 3.
Forces and moments during wing flapping at Re = 3.42 for a bristled wing with ∆b = 0.016. The wings were flapped for 10 stroke cycles with ~3.86 s cycle duration. The elevated inertial force peaks at the beginning of each half stroke were due to the combined effect of wing mass inertia, added mass inertia and aerodynamic drag at a high angle of attack. (a) Forces with respect to the wing (see Figure 2), (b) moments and (c) horizontal inertia due to wing mass. Data in (c) show force due to wing mass (3.34 g) without considering added mass inertia. Note the different scale in (c) compared to data shown in (a). CoA, center of area. (d) Enlarged data traces shown in (a). (e) Enlarged data traces shown in (b).
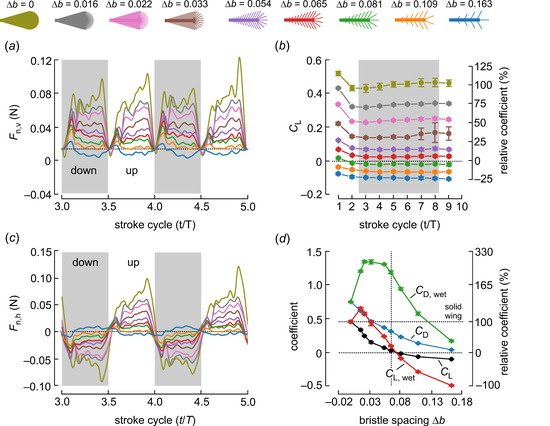
Figure 4.
Time development of aerodynamic lift production during wing translation (Re = 3.42) derived from forces measured normal to the wing surface. As added mass inertia may not be reliably determined in bristled wings, we excluded the forces at the beginning and the end of each half stroke (~ ±0.9 cycle) from the data shown in this graph. (a) The vertical component (lift) of Fn was approximately zero at the stroke reversal when the wing was held vertically (angle of attack = 0 deg). (b) Lift coefficients for the translating phase of wing motion. Due to negative Fp throughout the stroke cycle and the small upward force, lift coefficients were negative for bristled wings with ∆b ≤ 0.081 (green, orange, blue). Coefficients relative to solid wing performance (100%) are shown on the right-hand scale. (c) The horizontal component (drag) of Fn reversed at the half stroke reversals (see Figure 2). (d) Lift coefficients for solid (CL, CD) and wetted (covered) wing area (CL,wet; CD,wet). Coefficients relative to solid wing performance (~0.45%, broken line) are shown on the right-hand scale. Colors in (a–c) indicate the bristled wings shown above the graphs and down strokes are indicated by grey areas. T, stroke cycle; t, fraction of stroke cycle. Data in (b,d) are means ± standard deviations, averaged from five runs.
The coefficient of aerodynamic power during wing translation was:
where Paero is the product of total horizontal drag from the sum of Fn,h and Fp,h times wing velocity at 0.56 wing length [33]. Rankine–Froude efficiency is the ratio between the theoretically smallest and the actual aerodynamic power for lift production assuming an idealized, homogeneous and turbulence-free jet downward wake in the vertical direction. We computed this parameter according to Ellington [34] as:
where ρ is the density of air, is the cycle-averaged sum of Fn,v and Fp,v and A0 is the appropriate actuator disc area for one wing, i.e.,:
where Φ is the stroke amplitude in radians.
All data were analyzed using custom-written routines in the open-source software GNU Octave® version 6.1.0 and further processed and plotted in Origin 8.5.1 (OriginLab, Northampton, MA, USA). The recorded data were filtered using a second order, phase-correcting, low-pass Butterworth filter (‘filtfilt’, Octave). As explained above, we removed the data for 8% cycle time prior and 10% cycle time after the reversal for the calculations of forces and coefficients to exclude added mass acceleration forces. Thus, the latter approach slightly reduced our estimates for vertical lift and also aerodynamic power for wing flapping compared to the corresponding numerical study [29]. Inertia due to the wings’ and holder’s own masses, by contrast, was calculated from the kinematics and subsequently subtracted from the data (see above). Data including the measured force peaks during the stroke reversals are shown in Figure 3. The removed data were interpolated from measurements recorded before and after the stroke reversals and transients were smoothed.
3. Results and Discussion
Figure 3 shows the time evolution of forces and moments at Reynolds number Re = 3.42 for 10 consecutive stroke cycles in the root flapping robotic wing. The example shows the performance of a bristled wing with bristle spacing ∆b = 0.016. The wing developed elevated forces normal to the wing surface of up to ~0.6 N at the stroke reversals as a result of a high angle of attack and added mass effects. The peak coincided with the phase at which the wing chord was normal to the direction of wing motion, wherefore drag reached a maximum. Forces normal to the wing surface (Fn) changed sign between up and down strokes due to wing rotation (see Figure 2h,i). Forces parallel to the wing surface (Fp) are always negative in both half stroke cycles due to skin friction at low Reynolds numbers. These forces significantly attenuate vertical lift production and also increase drag in the horizontal direction. For the bristled wing in Figure 3, for example, the cycle-averaged absolute parallel force in the horizontal (vertical) amounted to 0.0117 N (0.0138 N) and normal force to 0.0411 N (0.0372 N). The parallel force was thus ~29% of the normal force in the horizontal and ~37% in the vertical direction. Axial forces that act parallel to the wing’s longitudinal axis are likely due to the centrifugal acceleration of the fluid and remain negative (“pulling” towards the wing tip) during wing flapping. These forces have little significance for lift and drag but may be relevant for side slipping forces in a freely flying insect. As mentioned in the Material and Methods in Section 2, inertial forces due to wing mass were small and typically amounted to approximately 1% of total force balance (Figure 3c). The details of the force development during flapping are highlighted in Figure 3d,e, which show the forces and moments on a magnified scale.
To investigate the significance of bristle spacing, we plotted the time evolution of the vertical component of Fn shown in Figure 4a, its horizontal component shown in Figure 4c and the lift coefficients for all stroke cycles and bristle spacing shown in Figure 4b,c, respectively. As already explained in the Materials and Methods in Section 2, we removed the combined force peaks during the wing acceleration and deceleration phases at the stroke reversals because of the difficulty in estimating the added mass forces. Therefore, in Figure 4 and Figure 5, these short moments are removed and the data interpolated. Figure 4a shows that vertical lift production decreased with increasing bristle spacing at Reynolds number Re = 3.42. Most of the wings produced positive lift for weight support. Only the wing with ∆b = 0.163 and only five bristles was no longer capable of producing positive lift (blue, Figure 4a). Similar to lift, the horizontal drag decreased with increasing bristle spacing and reversed direction due to the back and forth flapping.
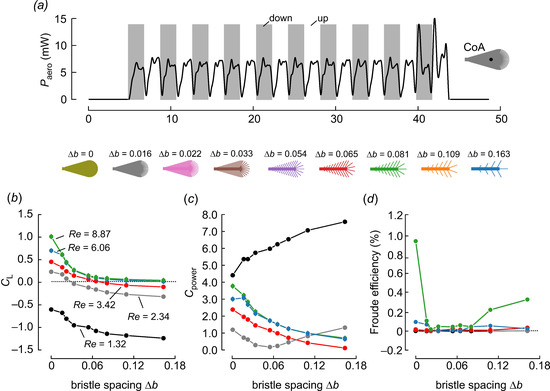
Figure 5.
Aerodynamic power and cycle-averaged (stroke cycles 3–8) performance of a single wing plotted against bristle spacing at five Reynolds numbers. (a) Time evolution of aerodynamic power after removing transient force peaks during stroke reversals at Reynolds number Re = 3.42. Elevated force peaks in the last stroke cycle were measurement artifacts resulting from the motor control software. (b) Lift coefficients based on wing surface of the solid wing. (c) Aerodynamic power coefficients and (d) Rankine–Froude efficiency of bristled wings. Colors in (b–d) indicate Reynolds numbers as shown in (b). Data in (b,d) are means ± standard deviations, averaged from five runs.
The total vertical lift was the sum of the vertical components in Fn and Fp. From these values and using Equations (2) and (3), we derived lift and drag coefficients for both the wing area of a solid wing and the covered (wetted) wing area. The first estimate followed the methods of our numerical study on bristle wing performance [29], while the second approach considered the performance with respect to the amount of wing material (cuticle) required for wing development. Making a bristled wing is thought to consume less chemical energy than the development of a solid surface, which may favor the evolution of bristled wings for flight. Previous studies have reported an energy requirement of 1197–1303 Jg−1 body biomass in the tobacco hornworm and a low value of 336 Jg−1 dry mass in the larvae of Vanessa cardui (painted lady) [35]. Our recent estimate of bristled wing mass in the beetle Paratuposa placentis (body length 395 µm) was approximately 0.024 µg, which corresponds to an energy of ~28.8 µJ for the development of a single wing. This may be of significance to small insect species, many of which do not feed as adults. It is therefore worthwhile to compare wing aerodynamic performance to the energetic costs required during its development. Assuming that these costs are proportional to the amount of wing cuticle, a lift coefficient based on the wetted area may be a valuable parameter for the comparison of differently bristled wings. Figure 4c shows that lift coefficients quickly stabilized after the motion onset of the wing. A wing that started in a resting fluid (first stroke cycle) produced ~13% (CL; 1st cycle, 0.519; 3rd–8th cycle, 0.452) more vertical lift than in the subsequent stroke cycle. Horizontal drag, by contrast, changed only a little (CD; 1st cycle, 0.751; 3rd–8th cycle, 0.747). Lift coefficients were typically smallest in the second stroke cycle and stabilized afterwards. We therefore estimated the total wing performance shown in Figure 4d and Figure 5 from the means of stroke cycles 3–8. Bristled wings may lose their ability to produce positive lift due to skin friction (Figure 4b,d). This effect results from an elevated negative Fp throughout wing flapping, which pulls the wing downward. Figure 4b shows that CL was approximately zero in a wing with ∆b = 0.065 and turned negative at larger bristle spacing (∆b > 0.080). By contrast, CD remained positive in all tested wings as a result of pressure and viscous forces.
Figure 4d shows that lift coefficients based on the wetted wing area (CL,wet) increased more compared to the solid wing at low bristle spacing (0 < ∆b < 0.03), implying that these wings generate higher lift per unit of wing area. An insect may thus benefit from a reduction in membranous wing area if the energetic costs of wing development is high compared to the cost of wing flapping throughout the animal’s lifetime. However, the drag coefficient (CD,wet) also increases with the transition from a solid to a bristled wing, keeping the ratio between CL/CD (or CL,wet/CD,wet) highest for the solid wing. As a consequence, there was no difference in coefficient ratio between CL/CD and CL,wet/CD,wet (ratios; 0.60, 0.54, 0.43, 0.32, 0.18, 0.08, −0.10, −0.51, −3.0 for ∆b = 0, 0.016, 0.022, 0.033, 0.054, 0.065, 0.081, 0.109, 0.163, respectively). As expected, Figure 5b shows that lift coefficients decreased with decreasing Reynolds numbers. Due to the limits of the experimental apparatus, the range of tested Reynolds numbers was comparatively small. Nevertheless, Figure 5b shows that positive lift production in all tested bristled wings only occurred at Reynolds numbers Re = 8.89 and Re = 6.06. In these cases, the vertically-orientated fraction of Fn always outscored skin friction, which manifested itself in negative Fp during wing flapping (Figure 3). At Reynolds numbers below 6.06, bristled wings may not produce positive lift with our simple lift-based kinematics. For example, our data suggest that at Re = 2.34, a bristled wing requires a maximum of ∆b = 0.022 for positive lift production. At the lowest tested Re = 1.34, skin friction was larger (negative Fp) than Fn in all tested wings. These finding are consistent with the minimum body size and Reynolds numbers of flying insects described so far (Table 1). Despite the variety of bristle spacing in insects (Figure 1), the smallest Reynolds numbers are scattered around 7—higher than the Reynolds number at which elevated bristle spacing may cause negative lift coefficients (Table 1).
To determine the cost of force production during wing flapping, we also calculated aerodynamic power and its coefficients (Figure 5a,c). On the whole, power requirements over time corresponded to the structure of vertical force production and reached its maximum at the stroke reversals. However, as we removed the force transients to calculate the coefficients, aerodynamic power shown in Figure 5a was near zero during the stroke reversals. Animal locomotor systems are influenced by evolutionary pressure to keep the costs of propulsion as low as possible [36]. The relative costs of weight-supporting lift production in insect flapping flight relies on the efficiency with which flight muscle power is converted into aerodynamic lift. In flight systems, this performance is characterized as Rankine–Froude efficiency (figure-of-merit, η), [37]). Figure 5 shows that the vertical force, aerodynamic power and efficiency typically decreased with increasing bristle spacing, except at very small Reynolds numbers (Re = 1.32). A solid wing (∆b = 0) was most efficient at Re = 8.87 and quite inefficient at Re = 2.34, owing to an increase in viscous drag (Figure 5d). These values are somewhat below the value found in a corresponding numerical study with the same wing kinematics and design, which reported a minimum efficiency of η = 3.0% at Re = 4 for drag-based kinematics [29]. This is expected because aerodynamic power here mainly resulted from the translational part of wing motion. We also expected that our measured efficiencies would be relatively low compared to insect wings flapping at larger Reynolds numbers. For example, efficiency in the blowfly Calliphora vomitoria (Re ~1000) amounts to ~23% [31]. Similar to our numerical study on bristled wings, however, the experimental data typically show a decrease in Froude efficiency with increasing bristle spacing, except for at the highest Reynolds number.
The rate of performance decrease with increasing bristle spacing may perhaps explain why bristled and solid wings co-occur in small insects but not in large ones. It means that large insects should fly with fully membranous wings and not bristled wings to avoid an elevated drop in efficiency. The change in efficiency with changing bristle spacing, by contrast, is less pronounced in very small insects (small Reynolds numbers), which might explain why these animals use membranous and bristled wings for flight. The sharp decline in the performance of bristled wings may reflect a strong evolutionary pressure in favor of solid wing surfaces for large flying insects. For small insects, on the other hand, the more gradual effect on efficiency lessens this pressure and allows for more variety in wing surface designs. It is important to note that, due to simplifying both their geometry and kinematics, the wing models used in this study might produce less lift than naturally occurring insect wings of a similar size. For example, the coefficients for weight-supporting lift in Paratuposa placentis [38] are 1.5 and 0.7 during lift- and drag-based flight, respectively. The latter values were not attained in this study.
The results in our study applied to a wing moving in the horizontal direction without out-of-plane (heaving) motion. In this case, drag in the horizontal direction did not produce vertical force for weight support and only contributed to energetic costs during flapping motion. In many small insects, however, wings may undergo elevated heaving motion. For example, a recent study on the small beetle Paratuposa placentis with 395 µm body length has shown that bristled wings follow a pronounced figure-of-eight loop [39]. Each half stroke is divided into a downward-directed power stroke that uses drag for lift production and a recovery stroke at the end of each half stroke. A numerical simulation of the air flow has suggested only small down-dragging forces during the recovery motion. This use of drag-based mechanisms is consistent with many previous assumptions on flight at low Reynolds numbers (see the Introduction in Section 1) and also with the poor performance of wings flapping in the horizontal direction as tested in this study.
4. Conclusions
Although numerous previous experimental studies have focused on insect flight, most data investigating wing motion and aerodynamics were acquired from larger insects. This is due in part to the difficulty of using tiny flying insects in behavioral assays and the limits of high-speed videography for moving wings. Moreover, most wings that were previously tested in robotic apparatus or simulated numerically used flow past simple geometries of evenly spaced cylinder lattices to demonstrate how aerodynamic force production is reduced in bristled wings [13,14]. It is evident that this reduction is mostly due to the added costs in overcoming viscous drag when wings flap at low Reynolds numbers. This study broadly confirmed our previous numerical study on bristled wing performance using the same kinematics and wings [29]. Although our data differ from the numerical solution in some respects, they are in line with the idea that the co-occurrence of bristled and solid wings in miniature insects results from aerodynamic efficiency rather than maximizing force production. Thus, assuming that wings evolved from gills [40], small insects with bristled wings may have retained the comb-like structure of the gills of their ancestors while membranous wings evolved with the development of larger body sizes [36]. Numerical and experimental data support this assumption, suggesting that aerodynamic efficiency may be a key factor for wing design in flying insects.

Table 1.
Wing morphology, kinematics and Reynolds numbers considered in this study (see Figure 1). Bristle length was measured at the wing tip, while bristle angle with respect to the wing’s longitudinal axis was measured at the shaft’s midpoint (red, Figure 1). For model wings, bristle spacing and wingbeat frequencies varied as described in 2.1 of the Materials and Methods. t.s., this study; n.a., not applicable or unknown; Ref, reference; Re, Reynolds number based on Rf with R the wing length and f the flapping frequency.
| Species | Ref | Wing Type | Wing Length (µm) | Bristle Number | Bristle Angle (Degrees) | Bristle Spacing ∆b | Bristle Length LB | Wingbeat Frequency (Hz) | Re |
|---|---|---|---|---|---|---|---|---|---|
| Kikiki huna | [41] | bristled | 245 | 30 | 61.6 | 0.06 R | 0.310 R | n.a. | n.a. |
| Megaphragma caribea | [42] | bristled | 286 | 32 | 77.9 | 0.054 R | 0.280 R | n.a. | n.a. |
| Tinkerbella nana | [41] | bristled | 354 | 40 | 50.6 | 0.048 R | 0.289 R | n.a. | n.a. |
| Eretmocerus mundus | [43], t.s. | hybrid | 600 | 78 | 46.6 | 0.016 R | 0.057 R | 273 | 7 |
| Encarsia formosa | [18,25] | hybrid | 642 | 82 | 64.8 | 0.02 R | 0.055 R | 361 | 10 |
| Bemisia tabaci | t.s. | solid | 1012 | 0 | n.a. | n.a. | n.a. | 131 | 7 |
| Gynaikothrips ficorum | t.s. | bristled | 1460 | 173 | 54.9 | 0.0125 R | 0.101 R | 196 | 24 |
| Model wing | t.s. | bristled | n.a. | 9–99 | 61 | see text | 0.224 R | see text | 1.3–8.9 |
Table 2.
Geometric and aerodynamic parameters of the tested wings. Bristle spacing relates to the long side of the inner membranous area of the model wings (see Figure 1 and Figure 2). Covered area equates to wetted wing area during motion. The table shows aerodynamic forces and moments at an intermediate Reynolds number Re = 3.42 (see text). The values are means of stroke cycles 3–8 including force transients at the stroke reversals (Figure 3, see text). By contrast, coefficients during wing translation were calculated from the data from which we removed the force transients at each half stroke reversal (see text). Paero, aerodynamic power for wing flapping; Cwet, lift and drag coefficients with respect to covered (wetted) wing area; Cpower, coefficient of aerodynamic power. See Figure 1 for nomenclature.
| Bristle Spacing ∆b | 0.163 | 0.109 | 0.081 | 0.065 | 0.054 | 0.033 | 0.022 | 0.016 | 0 (Solid) |
|---|---|---|---|---|---|---|---|---|---|
| Area coverage | 0.21 | 0.23 | 0.24 | 0.26 | 0.28 | 0.34 | 0.42 | 0.51 | 1.0 |
| Number of bristles | 9 | 14 | 19 | 24 | 29 | 49 | 74 | 99 | 0 |
| Wing mass (g) | 1.58 | 1.71 | 1.79 | 1.89 | 1.99 | 2.33 | 2.83 | 3.34 | 12.7 |
| Fp,v (N) | −0.005 | −0.010 | −0.012 | −0.014 | −0.015 | −0.015 | −0.016 | −0.014 | −0.014 |
| Fn,v (N) | −0.005 | 0.003 | 0.010 | 0.016 | 0.021 | 0.030 | 0.040 | 0.047 | 0.059 |
| Tx (mNm) | 0.229 | 0.269 | 0.333 | 0.412 | 0.436 | 0.420 | 0.463 | 0.592 | 0.409 |
| Ty (mNm) | −2.48 | −3.21 | −3.65 | −3.95 | −4.06 | −3.84 | −3.84 | −3.49 | −3.61 |
| Paero (mW) | 0.358 | 1.30 | 2.30 | 3.20 | 3.70 | 4.70 | 5.80 | 6.30 | 7.60 |
| CL | −0.104 | −0.067 | −0.022 | 0.024 | 0.066 | 0.147 | 0.241 | 0.331 | 0.452 |
| CD | 0.035 | 0.131 | 0.226 | 0.309 | 0.365 | 0.455 | 0.564 | 0.613 | 0.747 |
| CL,wet | −0.495 | −0.292 | −0.092 | 0.092 | 0.235 | 0.431 | 0.574 | 0.650 | 0.452 |
| CD,wet | 0.167 | 0.571 | 0.940 | 1.19 | 1.31 | 1.34 | 1.34 | 1.20 | 0.747 |
| Cpower | 0.112 | 0.419 | 0.719 | 0.984 | 1.17 | 1.45 | 1.80 | 1.96 | 2.38 |
Author Contributions
Conceptualization, F.O. and F.-O.L.; methodology, F.O.; software, F.-O.L.; validation, F.O. and F.-O.L.; formal analysis, F.-O.L.; investigation, F.O.; resources, F.-O.L.; data curation, F.-O.L.; writing—original draft preparation, F.O. and F.-O.L.; writing—review and editing, F.O., A.S., G.R. and F.-O.L.; visualization, F.O. and F.-O.L.; supervision, F.-O.L.; project administration, G.R. and F.-O.L.; funding acquisition, G.R. and F.-O.L. All authors have read and agreed to the published version of the manuscript.
Funding
This research was funded by Deutsche Forschungsgemeinschaft (DFG) grants Le-905/16-1 to FOL and Le-905/18-1 to GR and FOL.
Informed Consent Statement
Informed consent was obtained from all subjects involved in the study.
Data Availability Statement
Data are available on request from the corresponding author.
Conflicts of Interest
The authors declare no conflict of interest.
Nomenclature
| αb | Bristle angle with respect to rod |
| A0 | Area of actuator disc |
| Aw | Wing area |
| Bm | Width of solid wing rod |
| f | Wing flapping frequency |
| Re | Reynolds number |
| CL | Lift coefficient for wing translation based on solid wing area |
| CL,wet | Lift coefficient for wing translation based on wetted wing area |
| CD | Drag coefficient for wing translation based on solid wing area |
| CD,wet | Drag coefficient for wing translation based on wetted wing area |
| Cpower | Coefficient of aerodynamic power |
| Mean horizontal force (drag) | |
| ∆b | Bristle spacing |
| Fi | Wing inertia |
| Fn | Force normal to the wing surface |
| Fp | Force parallel to wing surface (chordwise direction) |
| Fn,v | Vertical force normal to wing surface |
| Fp,v | Vertical force parallel to wing surface |
| Fn,h,trans | Horizontal force component of Fn for wing translation |
| Fp,h,trans | Horizontal force component of Fp for wing translation |
| Φ | Wing beat amplitude |
| Cycle-averaged vertical force (lift) | |
| Loff | Distance between bristle root and rod tip |
| ν | Kinematic viscosity of the fluid |
| utip | Cycle-averaged wing tip velocity |
| uCoF | Cycle-averaged wing velocity at center of force |
| Paero,trans | Aerodynamic power for wing translation |
| R | Wing length |
| Rb | Bristle length |
| Rrod | Length of solid wing rod |
| ρ | Fluid density |
| Tx | Moment about the wing’s x-axis |
| Ty | Moment about the wing’s y-axis |
| Tz | Moment about the wing’s z-axis |
References
- Nijhout, H.; Davidowitz, G.; Roff, D. A quantitative analysis of the mechanism that control body size in Manduca sexta. J. Biol. 2006, 5, 16. [Google Scholar] [CrossRef]
- Polilov, A.A. Small is beautiful: Features of the smallest insects and limits to miniaturization. Annu. Rev. Entomol. 2015, 60, 103–121. [Google Scholar] [CrossRef] [PubMed]
- Lehmann, F.-O. The efficiency of aerodynamic force production in Drosophila. Comp. Biochem. Physiol. A 2001, 131, 77–88. [Google Scholar] [CrossRef]
- Horridge, G.A. The flight of very small insects. Nature 1956, 178, 1334–1335. [Google Scholar] [CrossRef]
- Santhanakrishnan, A.; Robinson, A.K.; Jones, S.; Low, A.A.; Gadi, S.; Hedrick, T.L.; Miller, L.A. Clap and fling mechanism with interacting porous wings in tiny insect flight. J. Exp. Biol. 2014, 217, 3898–3909. [Google Scholar] [CrossRef] [PubMed]
- Sane, S.P. Neurobiology and biomechanics of flight in miniature insects. Curr. Opin. Neurobiol. 2016, 41, 158–166. [Google Scholar] [CrossRef]
- Yavorskaya, M.I.; Beutel, R.G.; Farisenkov, S.E.; Polilov, A.A. The locomotor apparatus of one of the smallest beetles—The thoracic skeletomuscular system of Nephanes titan (Coleoptera, Ptiliidae). Arthropod Struct. Dev. 2019, 48, 71–82. [Google Scholar] [CrossRef]
- Kolomenskiy, D.; Farisenkov, S.; Engels, T.; Lapina, N.; Petrov, P.; Lehmann, F.-O.; Onishi, R.; Liu, H.; Polilov, A.A. Aerodynamic performance of a bristled wing of a very small insect. Exp. Fluids 2020, 61, 194. [Google Scholar] [CrossRef]
- Weihs, D.; Barta, E. Comb wings for flapping flight at extremely low Reynolds numbers. AIAA J. 2007, 46, 285–288. [Google Scholar] [CrossRef]
- Kasoju, V.T.; Terrif, C.L.; Ford, M.P.; Santhanakrishnan, A. Leaky flow through simplified physical models of bristled wings of tiny insects during clap and fling. Fluids 2018, 3, 44. [Google Scholar] [CrossRef]
- Davidi, G.; Weihs, D. Flow around a comb wing in low-Reynolds-number flow. AIAA J. 2012, 50, 249–253. [Google Scholar] [CrossRef]
- Cheer, A.Y.L.; Koehl, M.A.R. Paddles and rakes: Fluid flow through bristled appendages of small organisms. J. Theor. Biol. 1987, 129, 17–39. [Google Scholar] [CrossRef]
- Lee, S.H.; Lahooti, M.; Kim, D. Aerodynamic characteristics of unsteady gap flow in a bristled wing. Phys. Fluids 2018, 30, 071901. [Google Scholar] [CrossRef]
- Lee, S.H.; Lee, M.; Kim, D. Optimal configuration of a two-dimensional bristled wing. J. Fluid Mech. 2020, 888, A23. [Google Scholar] [CrossRef]
- Sunada, S.; Takashima, H.; Hattori, T.; Yasuda, K.; Kawachi, K. Fluid-dynamic characteristics of a bristled wing. J. Exp. Biol. 2002, 2737–2744. [Google Scholar] [CrossRef]
- Lee, S.; Kim, D. Aerodynamic response of a bristled wing in gusty flow. J. Fluid Mech. 2021, 913, A4. [Google Scholar] [CrossRef]
- Ford, M.P.; Kasoju, V.T.; Gaddam, M.G.; Santhanakrishnan, A. Aerodynamic effects of varying solid surface area of bristled wings performing clap and fling. Bioinsp. Biomim. 2019, 14, 046003. [Google Scholar] [CrossRef] [PubMed]
- Cheng, X.; Sun, M. Very small insects use novel wing flapping and drag principle to generate the weight-supporting vertical force. J. Fluid Mech. 2018, 855, 646–670. [Google Scholar] [CrossRef]
- Shyy, W.; Lian, Y.; Tang, J.; Viieru, D.; Liu, H. Aerodynamics of Low Reynolds Number Flyers; Cambridge University Press: Cambridge, UK, 2008. [Google Scholar]
- Ribak, G.; Dafni, E.; Gerling, D. Whiteflies stabilize their take-off with closed wings. J. Exp. Biol. 2016, 219, 1639–1648. [Google Scholar] [CrossRef] [PubMed]
- Lehmann, F.-O.; Heymann, N. Dynamics of in vivo power output and efficiency of Nasonia asynchronous flight muscle. J. Biotechnol. 2006, 124, 93–107. [Google Scholar] [CrossRef] [PubMed]
- Lyu, Y.Z.; Zhu, H.J.; Sun, M. Flapping-mode changes and aerodynamic mechanisms in miniature insects. Phys. Rev. E 2019, 99, 012419. [Google Scholar] [CrossRef] [PubMed]
- Ristroph, L.; Bergou, A.J.; Guckenheimer, J.; Wang, Z.J.; Cohen, I. Paddling mode of forward fligth in insects. Phys. Rev. Lett. 2011, 106, 178103. [Google Scholar] [CrossRef] [PubMed]
- Jones, S.K.; Laurenza, R.; Hedrick, T.L.; Griffith, B.E.; Miller, L.A. Lift vs. drag based mechanisms for vertical force production in the smallest flying insects. J. Theor. Biol. 2015, 7, 105–120. [Google Scholar] [CrossRef] [PubMed]
- Weis-Fogh, T. Quick estimates of flight fitness in hovering animals, including novel mechanisms for lift production. J. Exp. Biol. 1973, 59, 169–230. [Google Scholar] [CrossRef]
- Chen, S.; Li, H.; Guo, S.; Tong, M.; Ji, B. Unsteady aerodynamic model of flexible flapping wing. Aero. Sci. Tech. 2018, 80, 354–367. [Google Scholar] [CrossRef]
- Santhanakrishnan, A.; Jones, S.K.; Dickson, W.B.; Peek, M.; Kasojo, V.T.; Dickinson, M.H.; Miller, L.A. Flow structure and force generation on flapping wings at low reynolds numbers relevant to the flight of tiny insects. Fluids 2018, 3, 45. [Google Scholar] [CrossRef]
- Jones, S.K.; Yun, Y.J.J.; Hedrick, T.L.; Griffith, B.E.; Miller, L.A. Bristles reduce the force required to ‘fling’ wings apart in the smallest insects. J. Exp. Biol. 2016, 219, 3759–3772. [Google Scholar] [CrossRef]
- Engels, T.; Kolomenskiy, D.; Lehmann, F.-O. Flight efficiency is a key to diverse wing morphologies in small insects. J. R. Soc. Interface 2021, 18, 20210518. [Google Scholar] [CrossRef]
- Jiang, Y.; Zhao, P.; Cai, X.; Rong, J.; Dong, Z.; Chen, H.; Wu, P.; Hu, H.; Jin, X.; Zhang, D. Bristled-wing design of materials, microstructures and aerodynamics enables flapping flight in tiny wasps. iScience 2021, 103692. [Google Scholar] [CrossRef] [PubMed]
- Engels, T.; Wehmann, H.-N.; Lehmann, F.-O. Three-dimensional wing structure attenuates aerodynamic efficiency in flapping fly wings. J. R. Soc. Interface 2020, 17, 20190804. [Google Scholar] [CrossRef]
- Lehmann, F.-O.; Dickinson, M.H. The control of wing kinematics and flight forces in fruit flies (Drosophila spp.). J. Exp. Biol. 1998, 201, 385–401. [Google Scholar] [CrossRef]
- Ramamurti, R.; Sandberg, W.C. A three-dimensional computational study of the aerodynamic mechanisms of insect flight. J. Exp. Biol. 2002, 205, 1507–1518. [Google Scholar] [CrossRef] [PubMed]
- Ellington, C.P. The aerodynamics of hovering insect flight. V. A vortex theory. Phil. Trans. R. Soc. Lond. B 1984, 305, 115–144. [Google Scholar]
- Ferral, N.; Gomez, N.; Holloway, K.; Neeter, H.; Fairfield, M.; Pollman, K.; Huang, Y.-W.; Hou, C. The extremely low energy cost of biosynthesis in holometabolous insect larvae. J. Insect Physiol. 2020, 120, 103988. [Google Scholar] [CrossRef]
- Dudley, R. The Biomechanics of Insect Flight: Form, Function, Evolution; Princeton University Press: Princeton, NJ, USA, 2000. [Google Scholar]
- Usherwood, J.R.; Lehmann, F.-O. Phasing of dragonfly wings can improve aerodynamic efficiency by removing swirl. J. R. Soc. Interface 2008, 5, 1303–1307. [Google Scholar] [CrossRef]
- Farisenkov, S.E.; Kolomenskiy, D.; Petrov, P.N.; Lapina, N.A.; Engels, T.; Lehmann, F.-O.; Onishi, R.; Liu, H.; Polilov, A.A. A novel flight style allowing the smallest featherwing beetles to excel. bioRxiv 2021. [CrossRef]
- Farisenkov, S.E.; Kolomenskiy, D.; Petrov, P.N.; Engels, T.; Lapina, N.A.; Lehmann, F.-O.; Onishi, R.; Liu, H.; Polilov, A.A. Novel flight style and light wings boost flight performance of tiny beetles. Nature 2022, 602, 96–100. [Google Scholar] [CrossRef] [PubMed]
- Tomoyasu, Y. What crustaceans can tell us about the evolution of insect wings and other morphologically novel structures. Curr. Opin. Genet. Dev. 2021, 69, 48–55. [Google Scholar] [CrossRef]
- Huber, J.T.; Noyes, J.S. A new genus and specied of fairyfly, Tinkerbella nana (Hymenoptera, Mymaridae), with comments on its sister genus Kikiki, and discussion on small size limits in arthropods. J. Hymenopt. Res. 2013, 32, 17–44. [Google Scholar] [CrossRef]
- Polilov, A.A. First record of Megaphragma (Hymenoptera, Trichogrammatidae) in Columbia, and third animal species known to have anucleate neurons. J. Hymenopt. Res. 2017, 60, 181–185. [Google Scholar] [CrossRef][Green Version]
- Barro, P.J.D.; Driver, F.; Naumann, I.D.; Schmidt, S.; Clarke, G.M.; Curran, J. Descriptions of three species of Eretmocerus Haldeman (Hymenoptera: Aphelinidae) parasitising Bemisia tabaci (Gennadius) (Hemiptera: Aleyrodidae) and Trialeurodes vaporariorum (Westwood)(Hemiptera: Aleyrodidae) in Australia based on morphological and molecular data. Aust. J. Entomol. 2000, 39, 259–269. [Google Scholar]


Publisher’s Note: MDPI stays neutral with regard to jurisdictional claims in published maps and institutional affiliations. |
© 2022 by the authors. Licensee MDPI, Basel, Switzerland. This article is an open access article distributed under the terms and conditions of the Creative Commons Attribution (CC BY) license (https://creativecommons.org/licenses/by/4.0/).