Abstract
Many studies have been devoted to single drop impacts onto liquid films and pools, while just a few are available about double drop or drop train impacts, despite the fact that the latter are more realistic situations. Thus, computational fluid dynamics with a volume-of-fluid approach was used here to simulate the impact of multiple drops into deep pools. The aim was to verify if multiple drop impacts significantly differ from single drops ones, and if the models available in the literature for the crater depth in the case of single impacts are reliable also for the multiple drop cases. After validation against experimental data for single and double drop impacts, simulations for four to 30 drops, with a diameter of 2.30 mm, impact velocities 1.0, 1.4, 1.8, and 2.2 m/s, and random initial positions in the domain were performed. The results showed that the time evolution of the crater depth for multiple impacts is similar to the single drop case during the inertial phase, while the following behavior is very different. Consequently, the available models for the maximum crater depth during single drop impacts can still predict the upper and lower bounds of the values of the crater depth during multiple drop impacts within 5% deviation.
1. Introduction
Many phenomena, both of natural and technological interest, involve the interaction between liquid drops and an interface, in most cases between a solid and a gas or a liquid and a gas. The interaction may be mechanical, thermal, or chemical, and it may start with the generation of the drop on the interface (as during condensation) or with the impact of the drop onto the same. In the latter case, the impact velocity may be low (down to practically zero when the drop is gently deposed) or high, normal, or oblique. In most situations, a series of drops impact the interface at nearly the same time. A first example is obviously rain, with its effects on the Earth’s water surfaces (oceans, seas, lakes, rivers, etc.) and on, e.g., fields, buildings, monuments, planes, and wind turbines. This also happens in many other scenarios, e.g., internal combustion engines, firefighting systems, surface cooling, spray painting, inkjet printing, pesticide distribution in agriculture, and blood sprays in crime scenes. Therefore, the importance of a deep understanding of this phenomenon is evident, which is far from being a simple one, up to the point that despite more than a century of investigation it is still not fully explained.
In the literature, many studies can be found, dealing either with the impact of a single drop (onto dry solid surfaces, onto surfaces wetted by liquid films of different thicknesses, still or moving, and onto gas–liquid interfaces alone in deep pools), or with the behavior of sprays, where the multitude of drops in the spray is considered in statistical terms. Such literature is so vast that it is impossible to cite all the relevant papers. Detailed introductory information and reviews about the single drop impact onto liquid surfaces can be found in [1,2], onto both solid and liquid surfaces in [3], and onto solid surfaces with the different possible scenarios in [4]. An in-depth analysis of sprays is described in [5]. Specifically on single drop impacts into deep pools, the work by Cole [6] is a valuable reference.
On the contrary, the studies about the impact of a limited number of drops, but not one, are quite scarce. Concerning drops in parallel with simultaneous or delayed impacts, the impact of two gemini drops onto a deep pool is analyzed in [7,8,9], of two gemini drops onto a thin liquid film in [10], and of three gemini drops onto a thin liquid film in [11,12]. Concerning drops in a series, the impact onto a dry surface is described in [13] and in [14] where heat transfer is also analyzed; the impact onto deep pools is described in [15,16] and in [17], in which the creation of a funnel is also reported.
To mitigate the lack of information about the impact of more than one drop, in the present work computational fluid dynamics (CFD) with a finite volume, volume-of-fluid approach was used to simulate the unsynchronous impact of multiple water drops into a deep pool of the same liquid and having the same temperature of the drops.
In fact, drop impact is a two-phase or three-phase (if the surface is of a solid) fluid dynamics phenomenon, in which inertial, viscous, and capillary forces merge their effects. It also becomes a multi-physics problem when heat transfer, mass transfer, or chemical reactions play a significant role (e.g., for hot or cold drops or surfaces, for drops impacting onto a chemically different liquid, and for reactive wetting). Therefore, the analytical solution of the resulting models is not viable, and very simplified models built on experimental results have been for a long time the only tool for analysis and prediction. In relatively recent years, CFD have also become commonly used. Many remarkable studies were developed, implementing the different CFD approaches: from the pioneering works [18], to developments with in-house software tools [19,20,21], to the most recent ones mainly using open-source packages [22,23,24], in addition to some of the previously cited papers. More specifically, Eulerian models using the finite volume method and the volume-of-fluid modelling technique [25] are the most used algorithms, followed by level-set [26], markers [27], interface capturing and tracking [28,29], combined volume-of-fluid and level-set [30,31] also with the ghost fluid method [32] and adaptive mesh refinement [33], Lattice Boltzmann [34,35], and molecular dynamics simulations (suitable up to the scale of nanodrops only) [36].
Specifically concerning multiple drop impacts—whose study is the major point of originality of the present work—onto deep pools, their outcomes depend on a multiplicity of factors: the fluids (drop, pool, surrounding atmosphere), the temperatures, the drop diameters, impact velocity, drop positions and mutual distances, and the time delay between the impacts of the single drops. Consequently, the number of simulations needed to uniformly cover all the space of the governing parameters would be extremely large. The approach here was therefore the following:
- A single fluid (water) at a fixed temperature was selected.
- Validation of the simulations against previously acquired experimental data [8,9] for single and double drop impacts was performed.
- Repeated simulations about the impact of four to 30 drops were performed, with the drops having the same diameter and impact velocity, but random positions in the domain, including the vertical distance from the pool, so that they hit the liquid–gas interface at slightly different time instants.
The aim was to statistically evaluate the effect of the mutual interactions between the craters formed by the single drops, particularly in terms of crater depth, to check if the latter is significantly affected by them, and consequently if the many models available in the literature for such a quantity during a single drop impact can be reliable also for the more realistic case of multiple drop impacts.
2. Materials and Methods
2.1. Experimental Setup
Validation of the numerical simulations was performed against the experimental results acquired in previous campaigns [8]. In such experiments, drop impacts were analyzed by means of high-speed videos of the drop-pool system seen in back illumination. The experimental set-up and procedures, including the uncertainty analysis for the main parameters, were described in full detail by the authors of [8,9].
2.2. Numerical Simulations
The numerical simulations were performed using the interFoam solver of the OpenFOAM® open source CFD toolbox [37]. interFoam is a finite volume solver based on the volume-of-fluid (VOF) method and implementing the continuum surface force model to include the effects of surface tension at the interface [38]. OpenFOAM® was selected as it is free and open-source, and because of the many favorable reviews [39,40,41,42] and successful cases of use described in the literature both about drop impacts onto solid surfaces [43], normal impacts onto liquid surfaces for single drops [16,44,45], oblique impacts of single drops [46], drop trains [47], and other Eulerian-Eulerian two-phase fluid dynamics applications [48]. The model implemented in interFoam includes the continuity and momentum equations for a Newtonian and incompressible fluid [49,50], whose density and viscosity are calculated as a weighted average of the corresponding properties of the single phases, on the basis of an indicator function named volume fraction. The latter assumes a value of 0 for one phase, 1 for the other, and between 0 and 1 in the interfacial regions, and it is transported by the fluid velocity field. Volume tracking and interface reconstruction is then performed (typically as the isosurface at a volume fraction equal to 0.5), with no explicit interface tracking. With respect to the original VOF formulation, the interFoam model includes an additional term in the volume fraction equation, aiming at “compressing” the interface (even down to just 2–4 cells). In strict terms, such a term is a mass source, but both literature results [48] and verification by the authors proved that mass variation is completely negligible.
The complete system of equations solved by interFoam is constituted by the continuity equation (Equation (1)), the Navier-Stokes equation (Equation (2)) and the equation for the transport of the volume fraction (Equation (3)), as follows:
where u is the flow velocity; ur is the relative velocity at the interface (uliquid–ugas); x is the local coordinate vector; g is the gravity vector; σ is the interface tension between the phase (water–air surface tension in the present work); κ is the curvature of the interface; Pd is a modified pressure term, removing the hydrostatic contribution (); , ρ, and μ are the average velocity in the interfacial region and the fluid density and viscosity, respectively, all calculated as weighted averages of the single-phase quantities (even though this has a physical basis only for the density):
The advantage of the VOF method with respect to the two-fluid models is that a single set of equations must be solved. Further details about the interFoam solver and models can be found in [48,51], and in [52], where the source code can also be found. Very promising modified versions of interFoam were also presented in the literature [46,53], but the source code was not made publicly available, so the version included in the official OpenFOAM® distribution was used.
Concerning the discretization schemes and solution algorithms, the implicit Euler scheme (first-order accurate) was used for the time derivative, as it proved to offer better results in comparison with the second-order Crank-Nicholson discretization schemes that were tested during preliminary simulations, selecting different blending factors between 0.5 and 1. The conventional advection term was discretized using Gauss schemes: limited Van Leer for the volume fraction and limited linear for the velocity. For the latter, variations of the limiter parameter were tested, but the best results were obtained when keeping it equal to 1. Finally, the OpenFOAM® specific interfaceCompression scheme [54] was selected for the discretization of the compression term. In fact, the other possible scheme, isoAdvector, did not offer significant improvements, despite the good performances reported in the literature [55,56]. Adaptive time stepping was used, limiting the allowed Courant-Friedrichs-Lewy (CFL) number to 0.3, according to the recommendations for 3D cases [39,54]. Some volume fraction sub-cycles were also performed to further improve the accuracy.
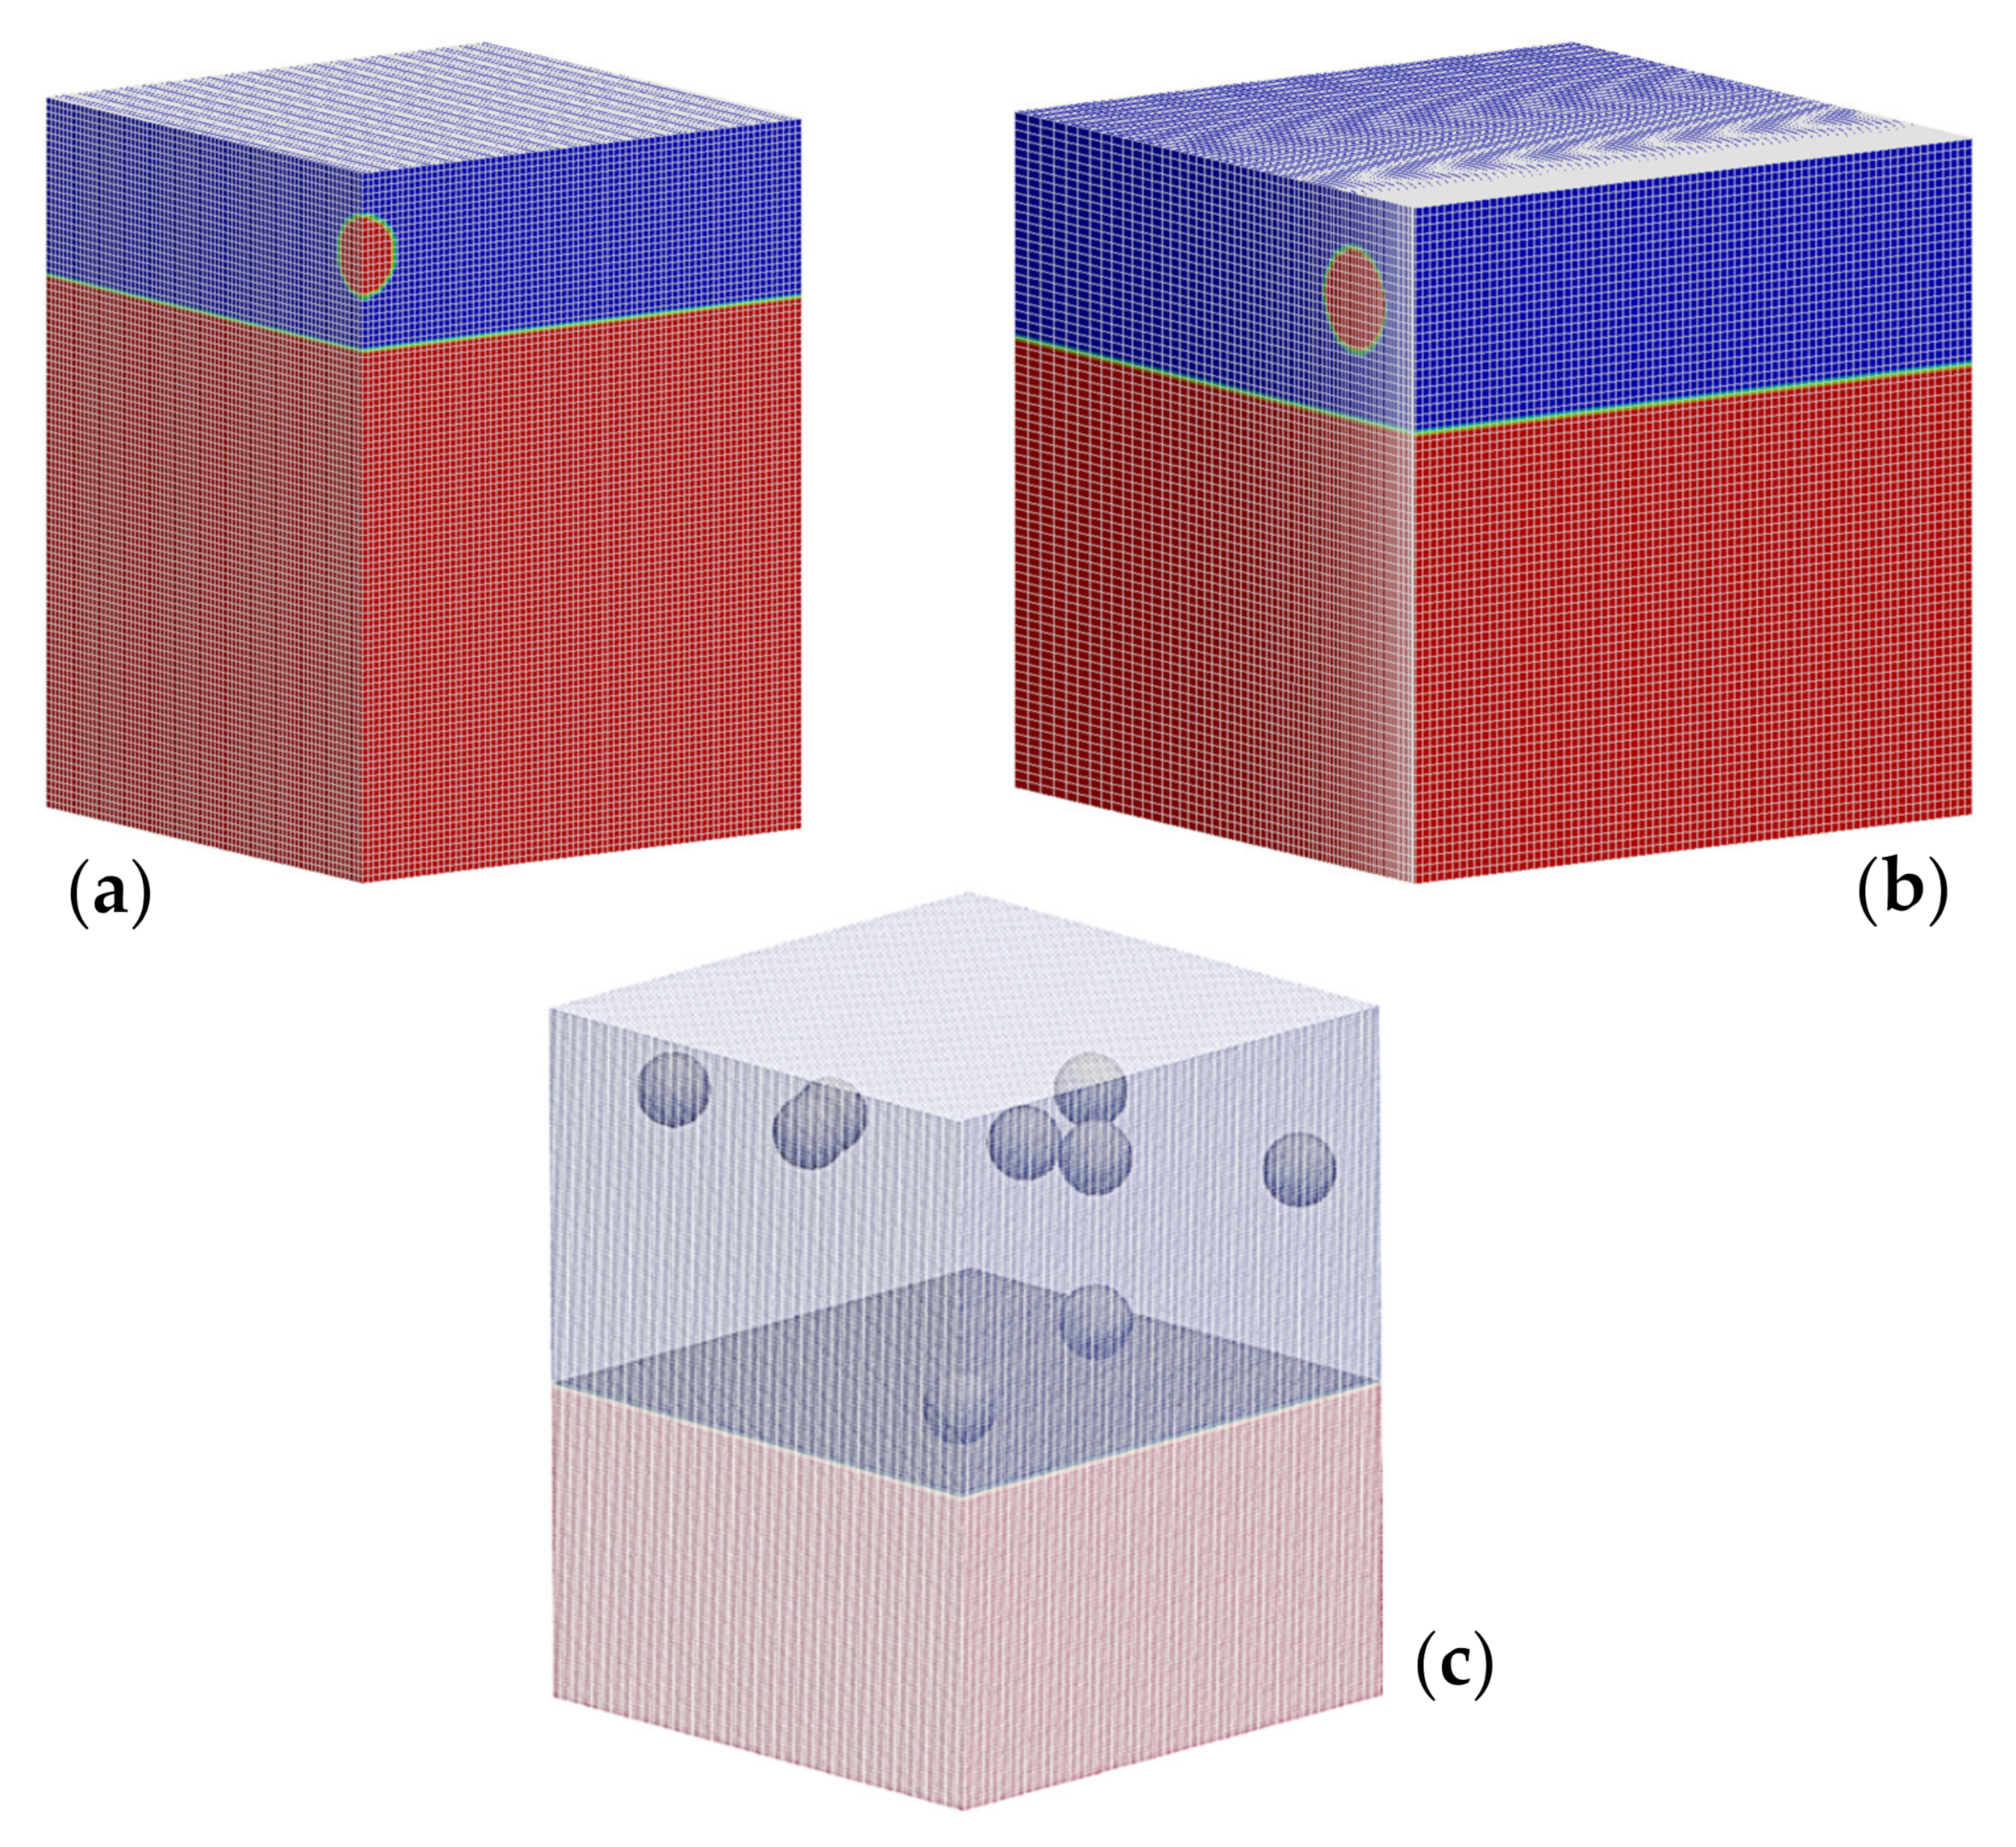
Three-dimensional domains shaped as rectangular cuboids were used for the simulations, as shown in Figure 1.

Figure 1.
Domain and mesh (drawn at half the real refinement level, for better visualization) for the single (a), double (b), and multiple (c) impact simulations.
Concerning the boundary conditions, for all the simulated cases:
- The bottom boundary was set as a wall, i.e., fixed value equal to 0 for the velocity, zero gradient for the pressure, volume fraction equal to 1 (water always present).
- The top boundary was set as an open boundary, i.e., zero gradient for the velocity, fixed value equal to 0 for the pressure, volume fraction equal to 0 (air always present).
- The side boundaries were set as symmetry boundaries for all the variables, to reduce the computational effort for single and double drop impacts, and to model the control volume as a “tile” of a larger physical domain for multiple drop impacts.
To reduce the height of the domain, the detachment of the drops from the generator and their fall towards the pool surface were not simulated: the drops were directly initialized as spheres near the free surface of the pool, with an initial velocity corresponding to the selected one. This approach has a point of weakness in the fact that drop oscillations after the detachment from the needle are not considered. In general, drop shape and oscillatory behavior may be an important influence on the impact outcomes, but in this case the shapes of the drops in the experiments were nearly spherical, so this approximation seemed acceptable. The mesh was purely structured, with hexahedral cells. Grading was used for the double drop simulations to better capture the “neck” between the two craters [9], while uniform meshes were used for the single and the multiple drop simulations. Adaptive remeshing is very slow in OpenFOAM® for 3D cases, so static meshes were used in all cases.
As the investigated impact velocities were low, laminar flow was assumed for both phases, in agreement with all the previously cited papers in this field. For each phase, the values of all the relevant thermophysical properties were taken at 28°C (average value from the experiments described in [8]).
At the beginning of the simulations, the pool height and the positions, diameters, and velocities of the drops within the domain were set using the setFields OpenFOAM® utility. Outside from the drops, the initial velocity was set to 0 for the whole domain. Given the assumption of incompressibility for both phases, pressure was initialized at 0. For the single and double drop impact cases, drop diameter and velocities were set according to the experimental values, in the range 2.27–2.32 mm and 1.0–2.0 m/s, respectively, as reported in [8,9]. For the multiple drop impacts, drop diameter was set to 2.30 mm for all cases, this value being the rounding of the average of the drop diameters in the experiments for single and double drop impacts. Drop impact velocities for the multiple impacts were set at 1.0, 1.4, 1.8, and 2.2 m/s, respectively. A total of 10 configurations were tested, 9 of them with a number of drops randomly chosen between 4 and 9, and 1 including 30 drops. For half of the simulations, the initial positions of the drops in the domain were randomly set independently for each impact velocity; for the other half (including the cases with 30 drops), the initial positions of the drops in the domain were randomly set for the cases at 1.0 m/s and then kept fixed for the other impact velocities. Two restrictions to the randomness of position were imposed: the distance from the domain boundaries cannot be less than 1.2 mm and the distance between two drop centers must be larger than 1.2 mm, so that at the beginning no drop touches the symmetry boundaries or another drop.
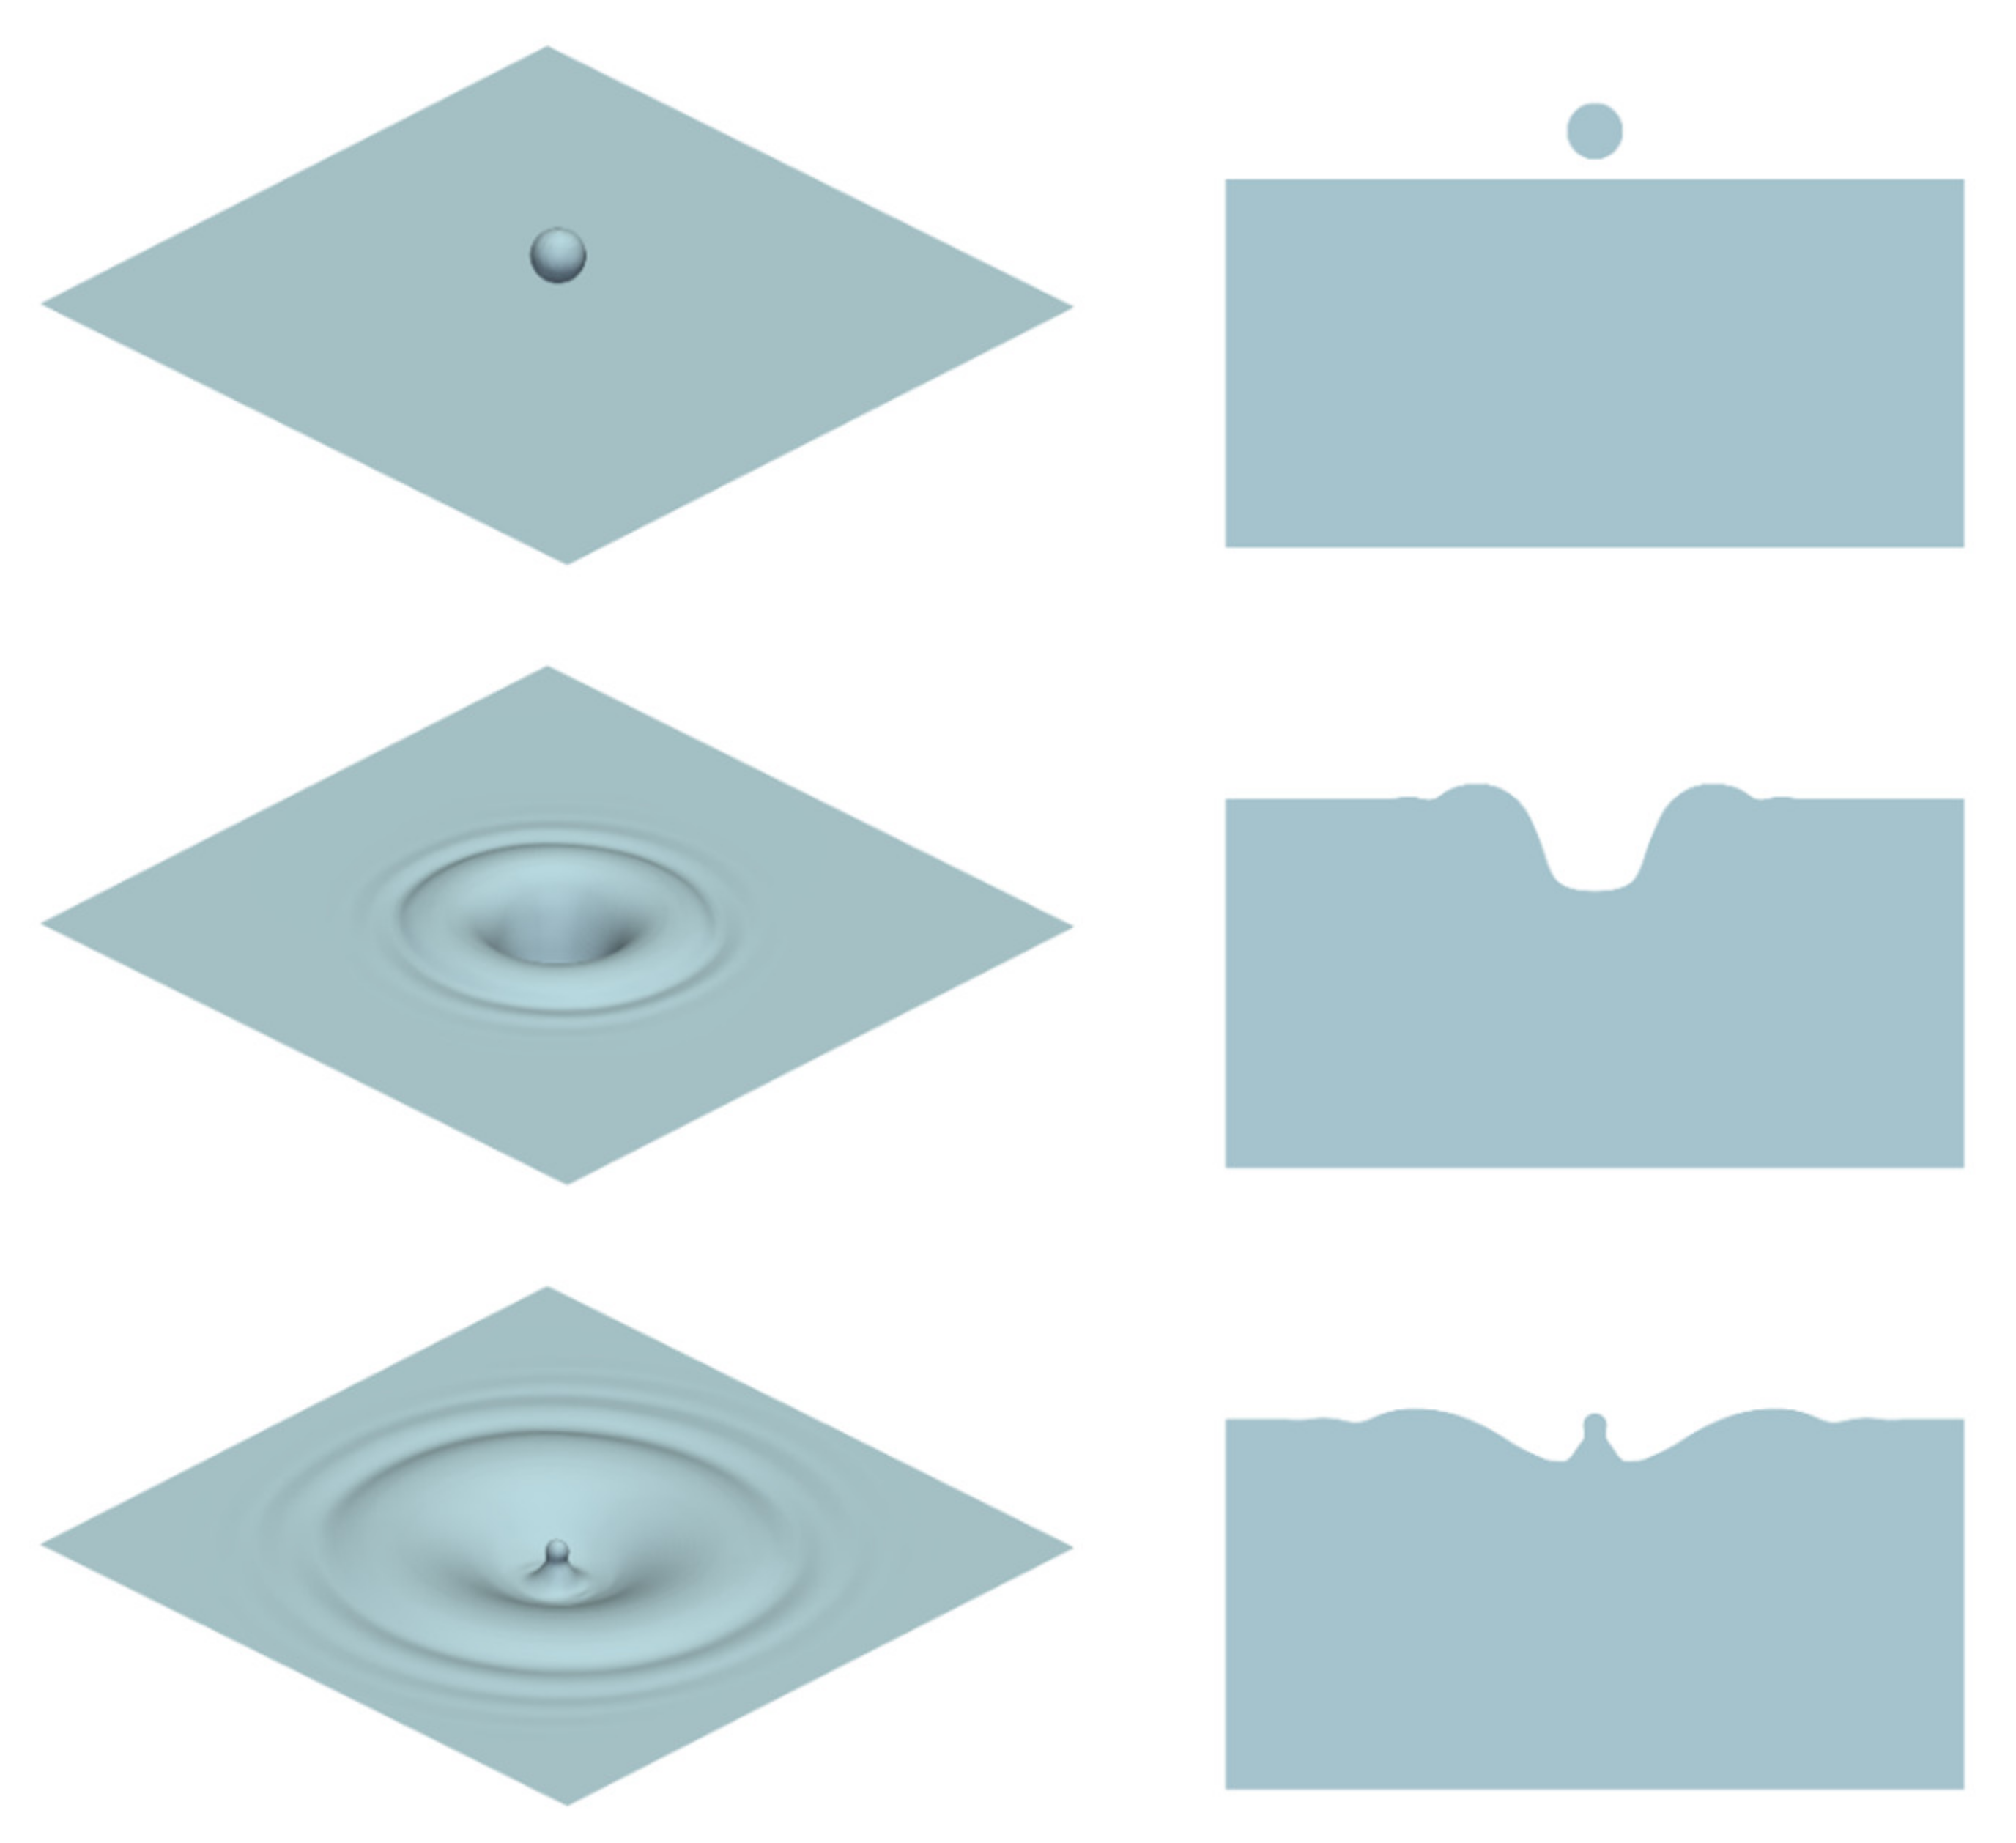
Figure 2, Figure 3 and Figure 4 show some examples of the initial positions of the drops and of some frames extracted from the results of the numerical simulations (both as 3D views and as 2D views used to extract the crater depth), for a case of single drop impact and two cases of multiple drop impacts with 5 and 30 drops, respectively, impact velocity 1.4 m/s. Time t = 0 is set at the instant in which the first drop touches the pool free surface.
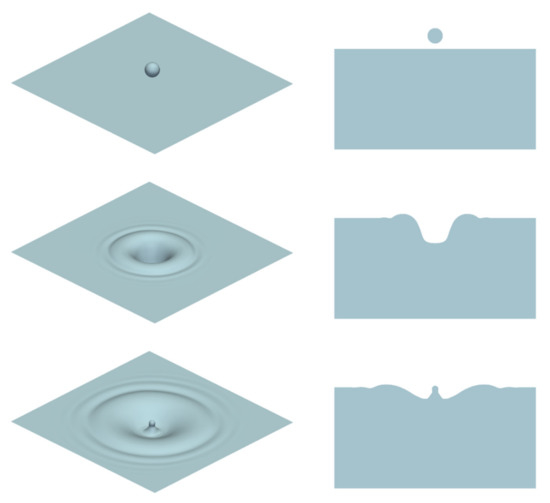
Figure 2.
Examples of frames (3D and 2D used to extract the crater depth) showing the evolution of the craters and of the free surface of the pool for a case of single drop impact, impact velocity 1.4 m/s.
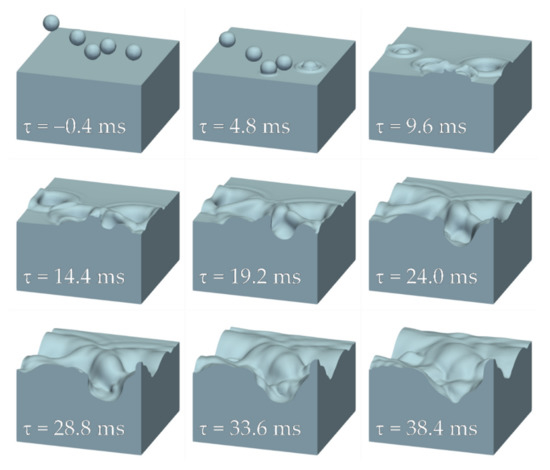
Figure 3.
Examples of frames (3D and 2D used to extract the crater depth) showing the evolution of the craters and of the free surface of the pool for a case of multiple drop impacts with 5 drops, impact velocity 1.4 m/s.
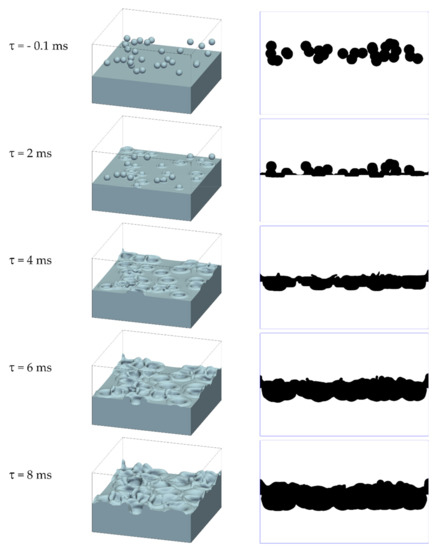
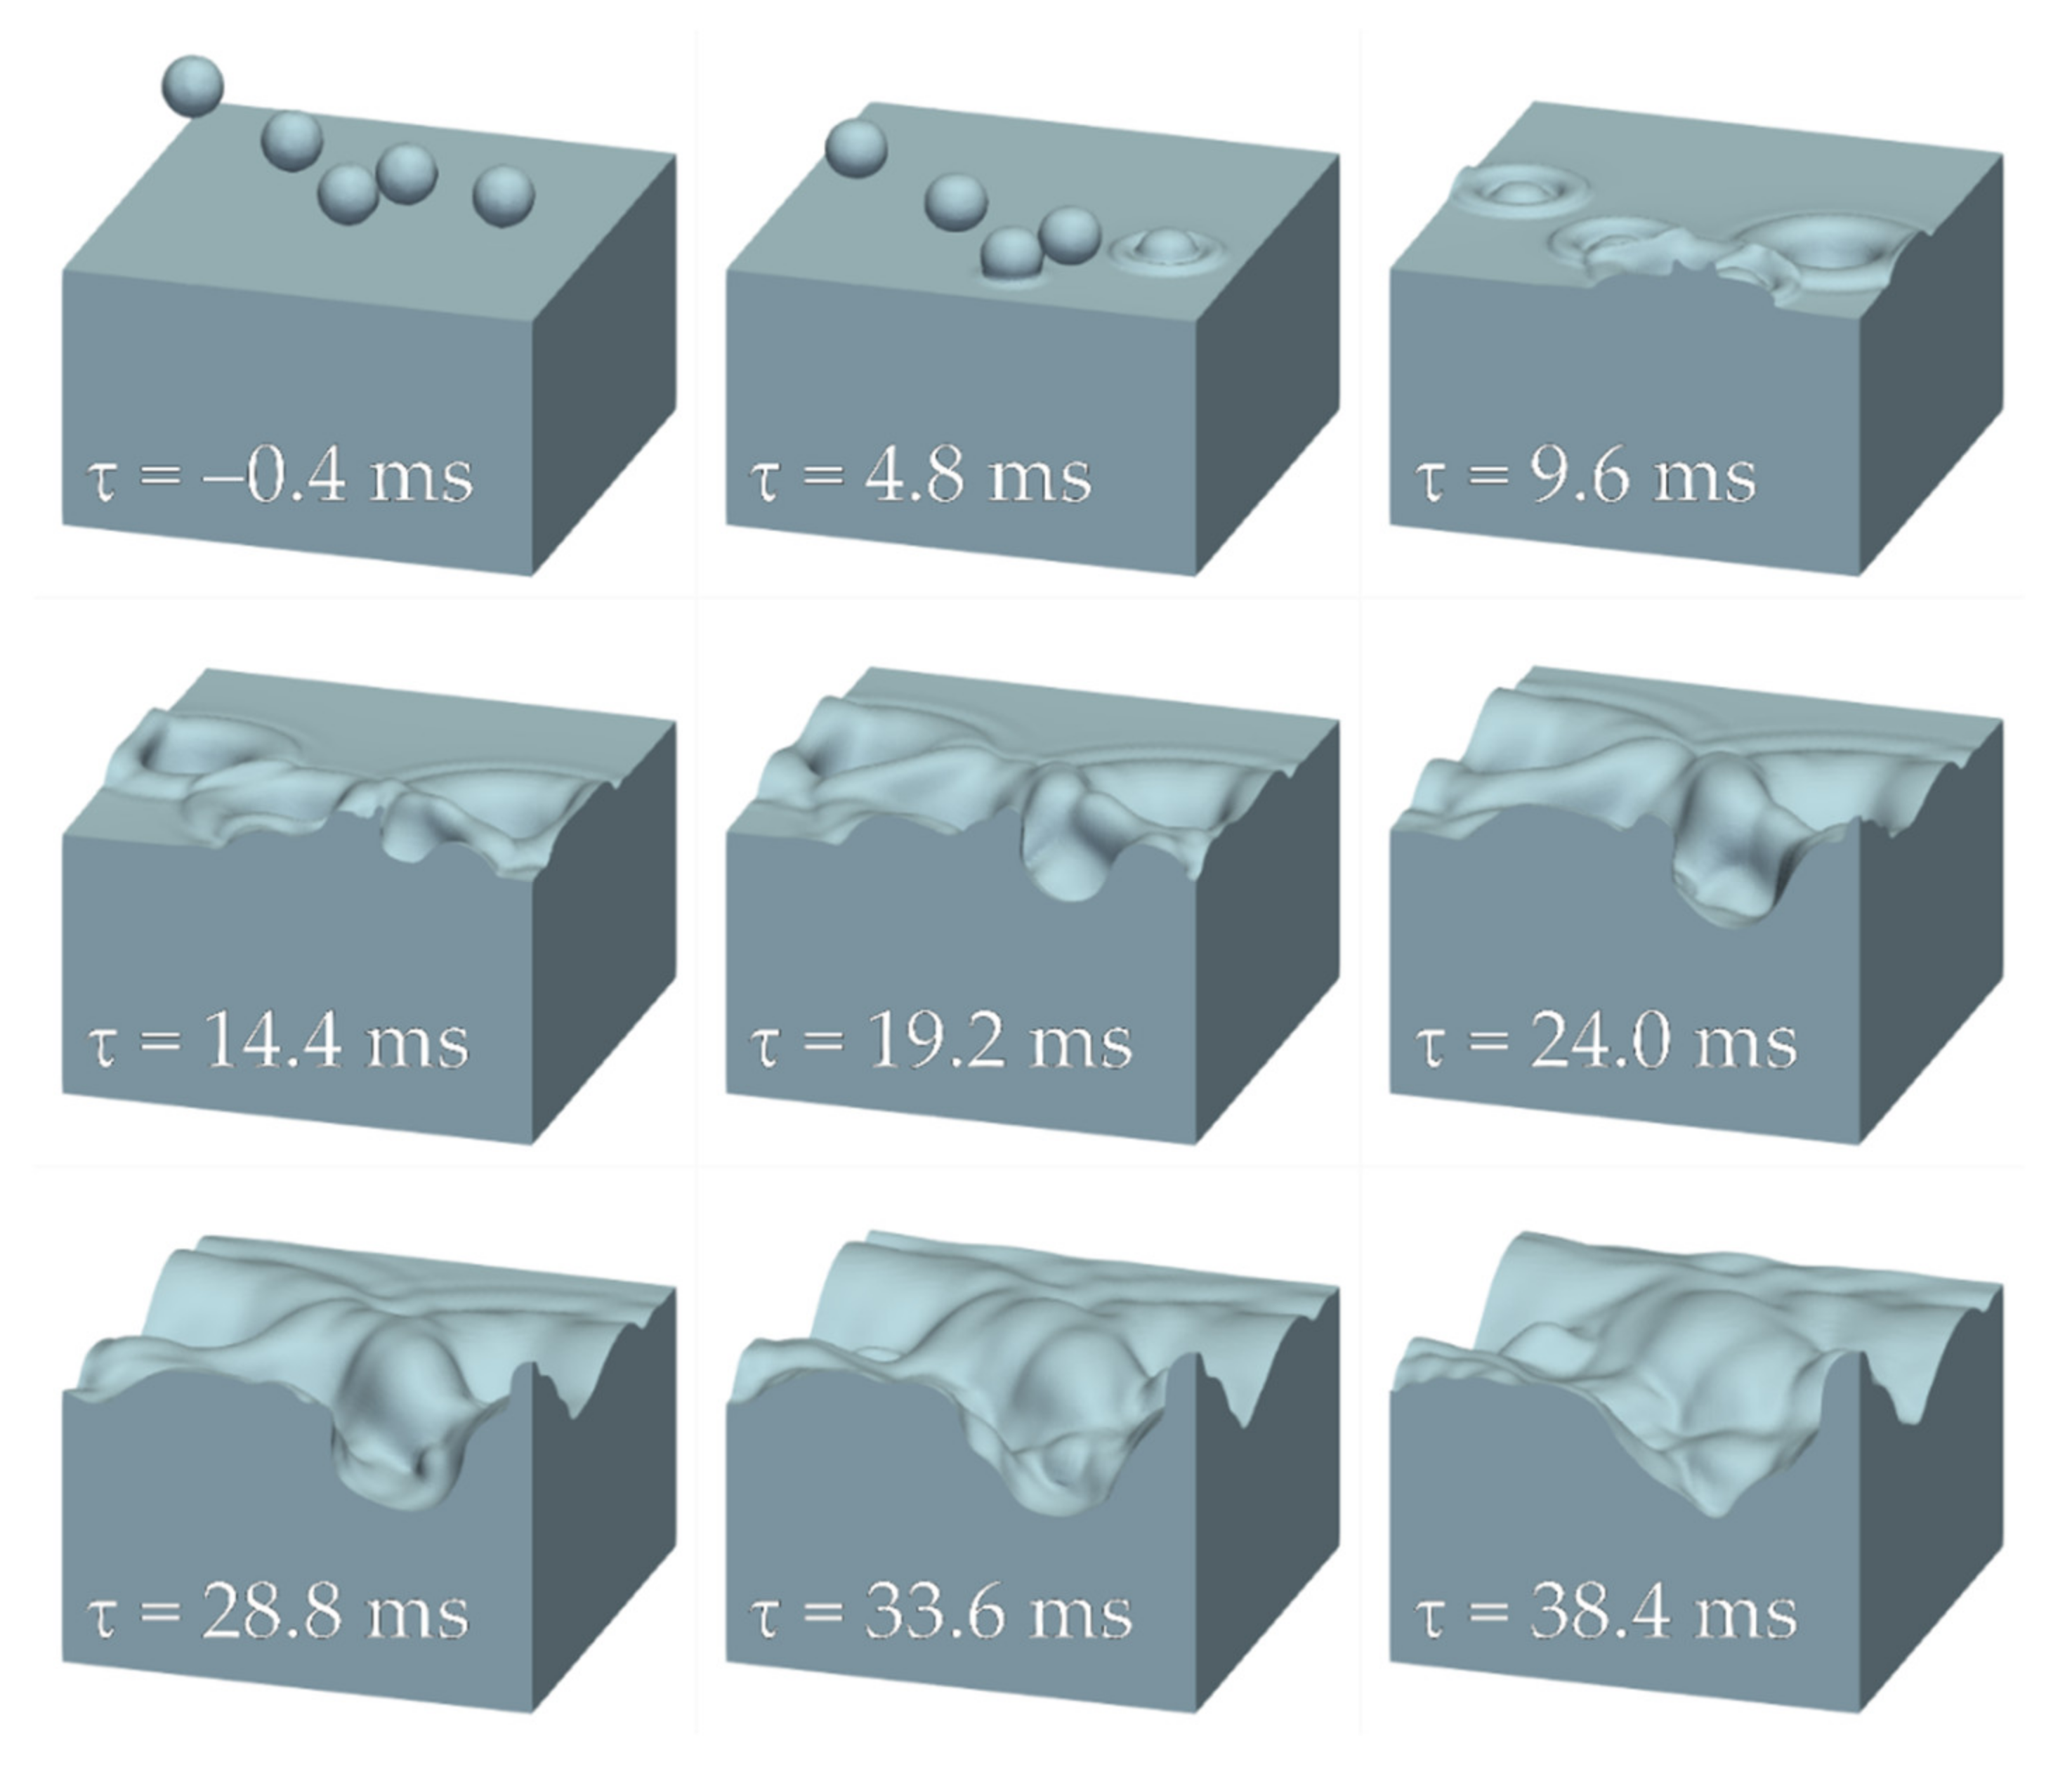
Figure 4.
Examples of frames (3D and 2D used to extract the crater depth) showing the evolution of the craters and of the free surface of the pool for a case of multiple drop impacts with 30 drops, impact velocity 1.4 m/s.
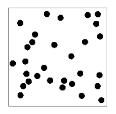
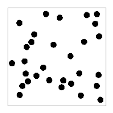
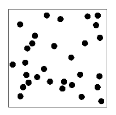
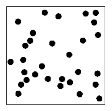
Table 1 reports the number and initial positions of the drops in all the multiple impact cases, by showing top views of the simulated domain. Cases from 5 to 9 are those with the same drop positions for all the velocities, while the cases from 1 to 4 are with drop positions different for each velocity. In some cases, the difference between the cases is only in the vertical positions of the drops, so it cannot be appreciated by the top view; still, it results in different crater interactions.

Table 1.
Top views of the simulated domain showing the initial positions of the drops in all the performed simulations about multiple impacts.
The dimensions of the domain selected after the preliminary simulations were 18 × 18 (horizontal) × 22 (vertical) mm for the cases with 1 to 9 drops, and 36 × 36 (horizontal) × 22 (vertical) mm for the cases with 30 drops; the cells were cubic with side 0.125 mm in all cases.
It is worth noting that in the VOF approach, regions of the same fluids coming into contact merge instantaneously, because the underlying model is not able to represent retarded coalescence (modified models would be needed, e.g., see [57]). On the other hand, real-world interfaces may resist even with direct contact—at least for a certain time—if the pressure of the contacting regions is not too different (that is why it is possible to have bouncing bubbles or drops [58]). These aspects cannot be reproduced in the simulations; for the present case this should influence the results only in a very limited number of cases during multiple drop impacts, in which two drops merge before impact, while in reality they may continue to fall touching each other, but without coalescence.
3. Results and Discussion
As already said, among the many parameters (depth, width, shape, capillary waves) that characterize the crater, expanding and then receding after the drop impact, the crater depth was selected as the quantity of interest for this study, even if it must be kept in account that the drop water was also transported towards much lower depths than the crater’s bottom [8,9,59]). Therefore, crater depth evolution in time and maximum reached crater depth were analyzed. The aim was to evaluate the effect of the mutual interactions between the drops and the craters and particularly to check how they alter the maximum depth reached by the craters.
The results were also compared with the most credited models available in the literature, to quantify the discrepancies with respect to the simulated results and assess their reliability for multiple drop impacts.
3.1. Mesh Independence and Validation against Experimental Data
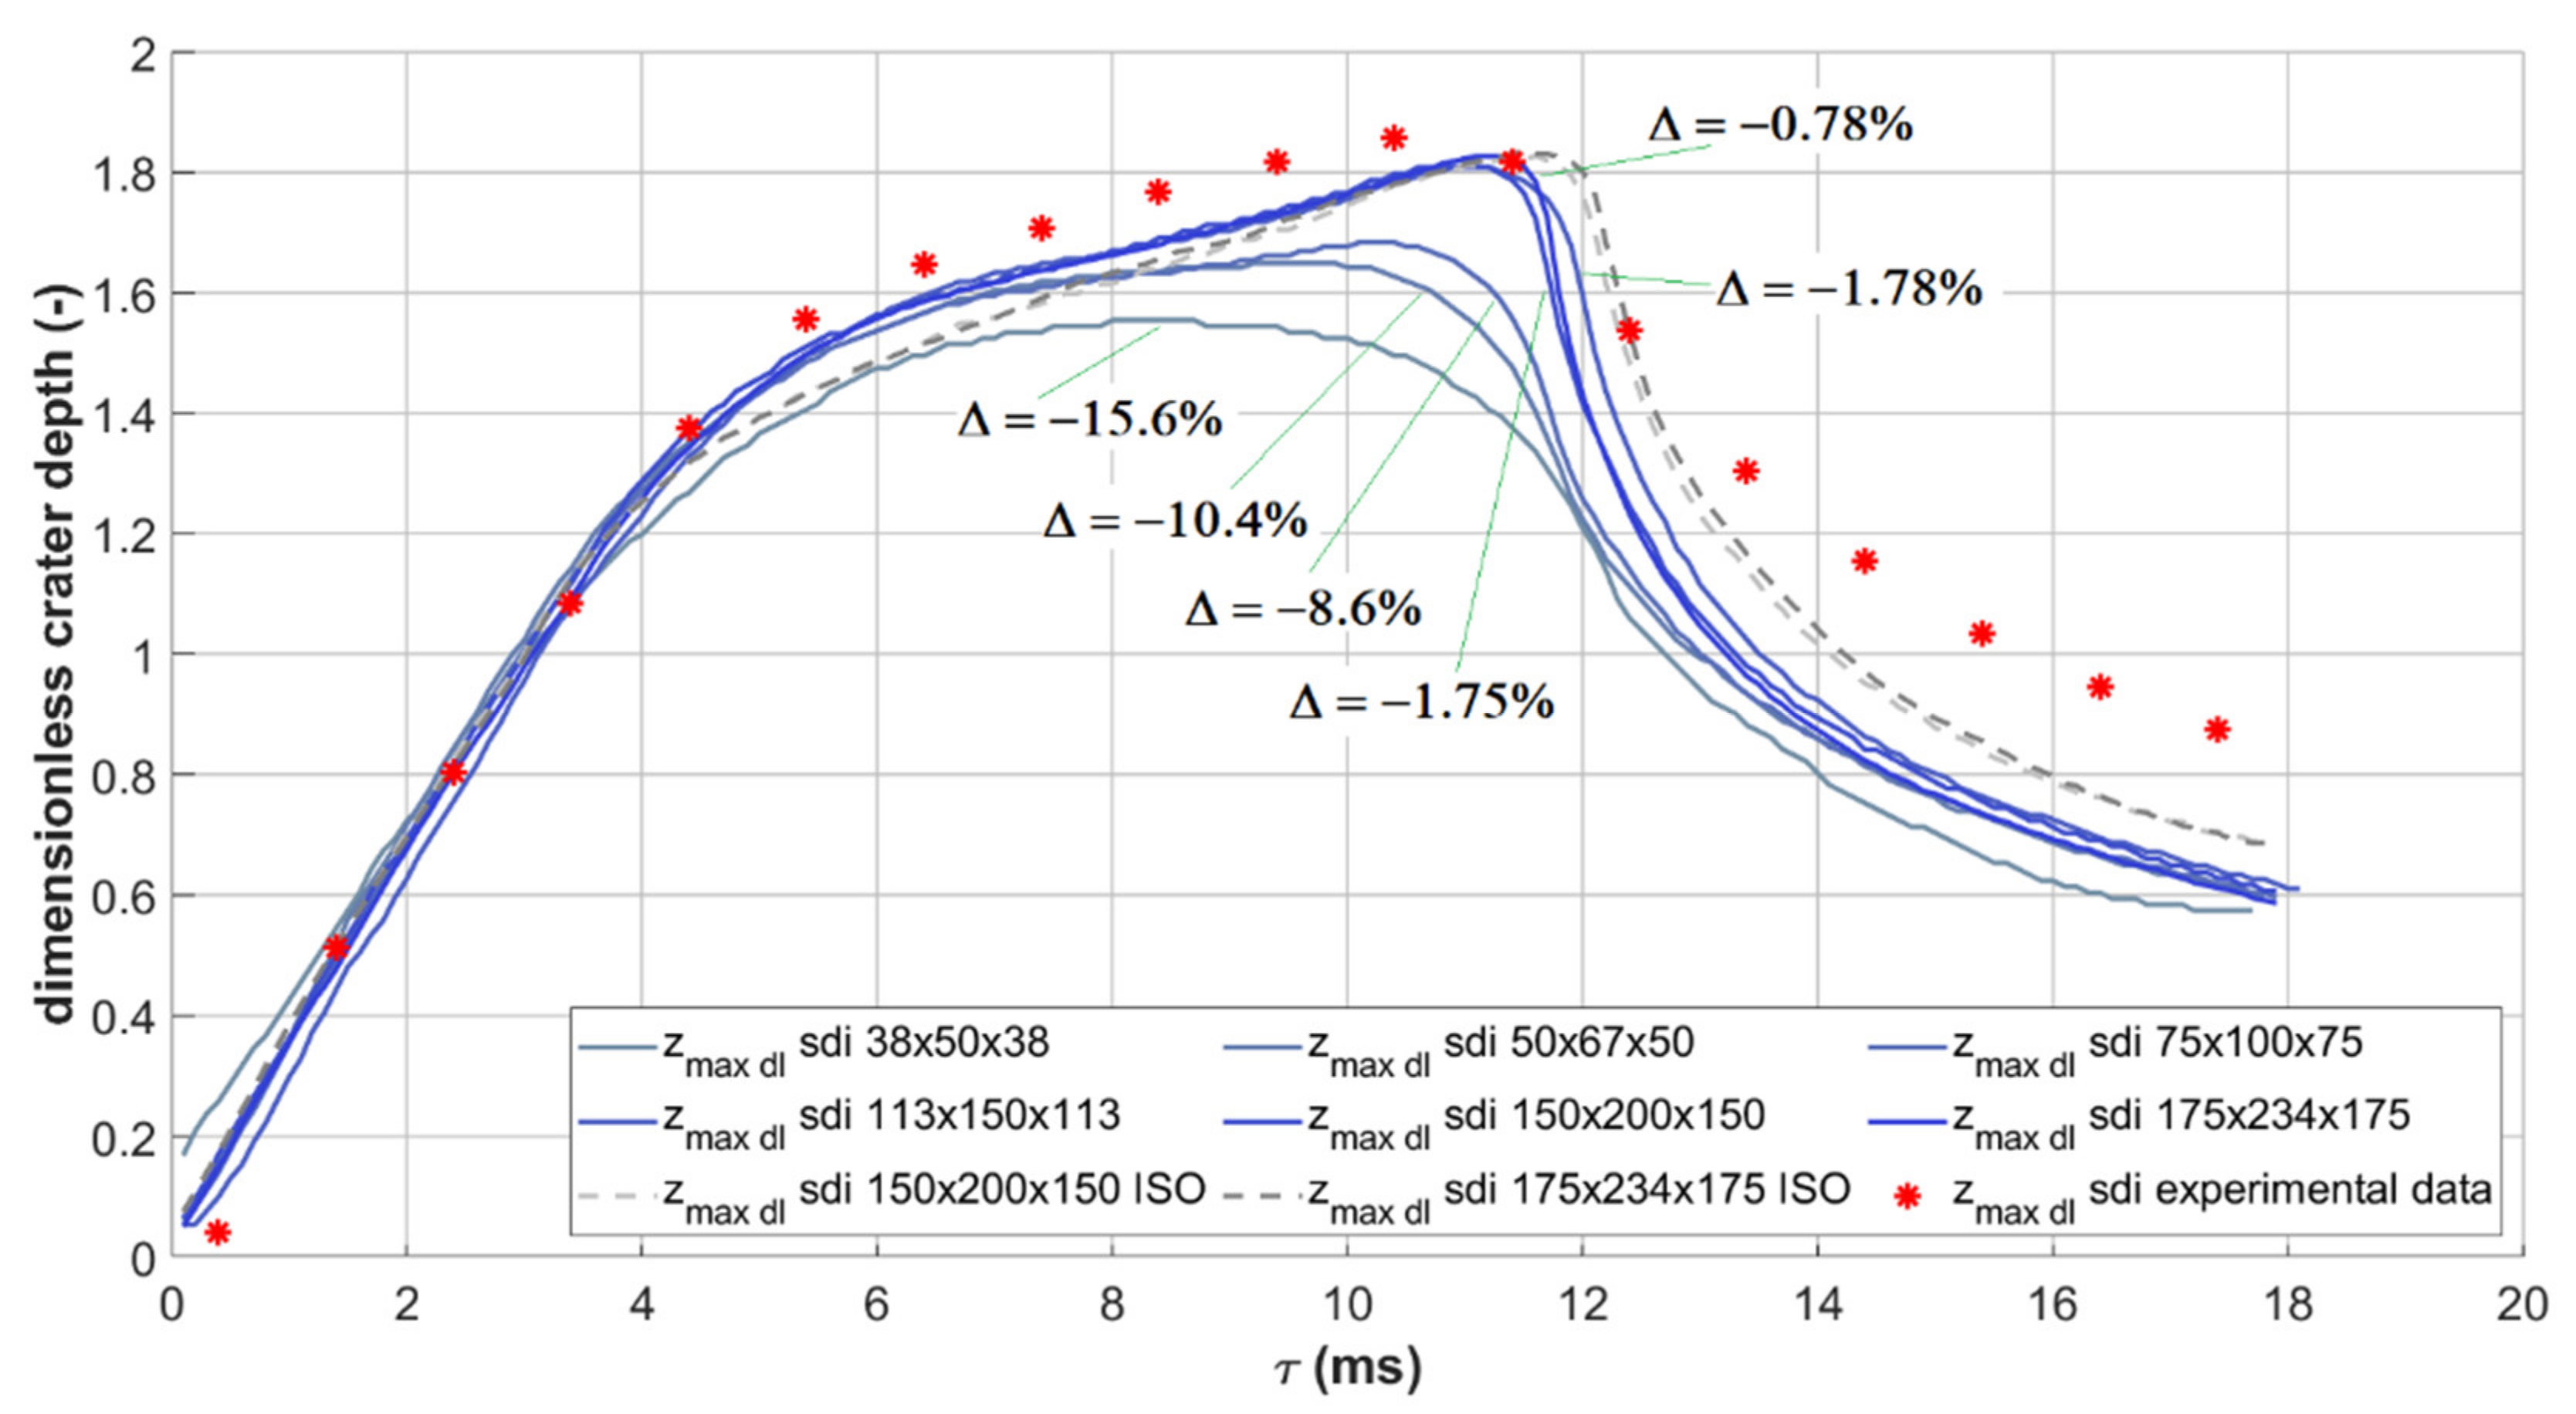
The validation of the numerical setup and procedure was performed by comparing the crater depth profiles as a function of time with respect to the experimental ones reported in [8]. Mesh independence was verified by performing numerical simulations with mesh sizes between 72,200 and 7,166,250 cells, as shown in Figure 5 for the case of the single drop impact at 1.4 m/s. The results with the different tested meshes and the interfaceCompression scheme are shown with continuous lines, while the results with the isoAdvector scheme are shown with dashed lines. The experimental data are evidenced with asterisk markers.
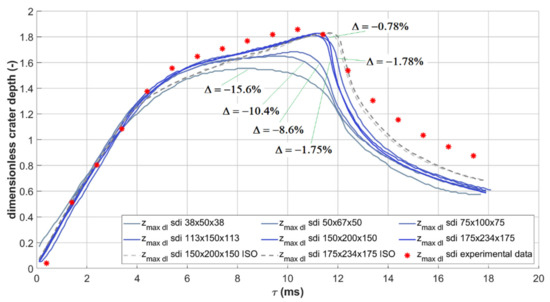
Figure 5.
Dimensionless crater depth as a function of time for single drop impact at 1.4 m/s, simulations vs. the experiments reported in [8]. The results with different mesh resolutions are shown to evidence the mesh independence. The percent deviations between the simulated and experimental maximum crater depths with the selected meshes are also indicated.
In Figure 5 and in all of the following charts, the crater depth is shown in its dimensionless version zmax dl, calculated as the ratio between the depth and the drop diameter before impact. In the same figure, the percent deviations in terms of maximum depth when using some of the tested meshes are also indicated. For single drop impacts, the percent deviations on the maximum crater depth were −10.33%, −0.78% and −9.87% for the velocities w = 1.0 m/s, 1.4 m/s, and 2.0 m/s, respectively; for double drop impacts, they were −6.10%, −1.70%, and −0.14% for the velocities w = 1.0 m/s, 1.4 m/s, and 2.0 m/s, respectively. Thus, the maximum crater depth was predicted within 10% accuracy, and less in the majority of cases; therefore, the agreement can be considered satisfactory.
During the inertial phase, in which the crater expands until it reaches the maximum depth, the mean absolute percentage difference between the simulation results with the 175 × 234 × 175 mesh and the experimental data was 3.31% for the single drop impact cases and 3.79% for the double drop cases. The corresponding median values of the percentage deviation were 3.75% and 2.96%, respectively. As can be seen also in Figure 5, the agreement was much worse for the following capillary phase, in which the crater closes, with mean deviation 24.96% and median deviation 28.83% for the single impacts, and 16.30% and 14.72%, respectively, for the double impacts. No final explanation could be given for the significant difference in the performance of the simulations during the capillary phase between the single and double drop impacts.
On the basis of the simulations performed for validation, the domain was reduced to its already described final dimensions, and consequently the final mesh sizes selected for the simulations were 144 × 144 × 176 (3.65 million cells) for the simulations with one to nine drops, and 288 × 288 × 176 (14.6 million cells) for the simulations with 30 drops.
3.2. Results for Multiple Drop Impacts
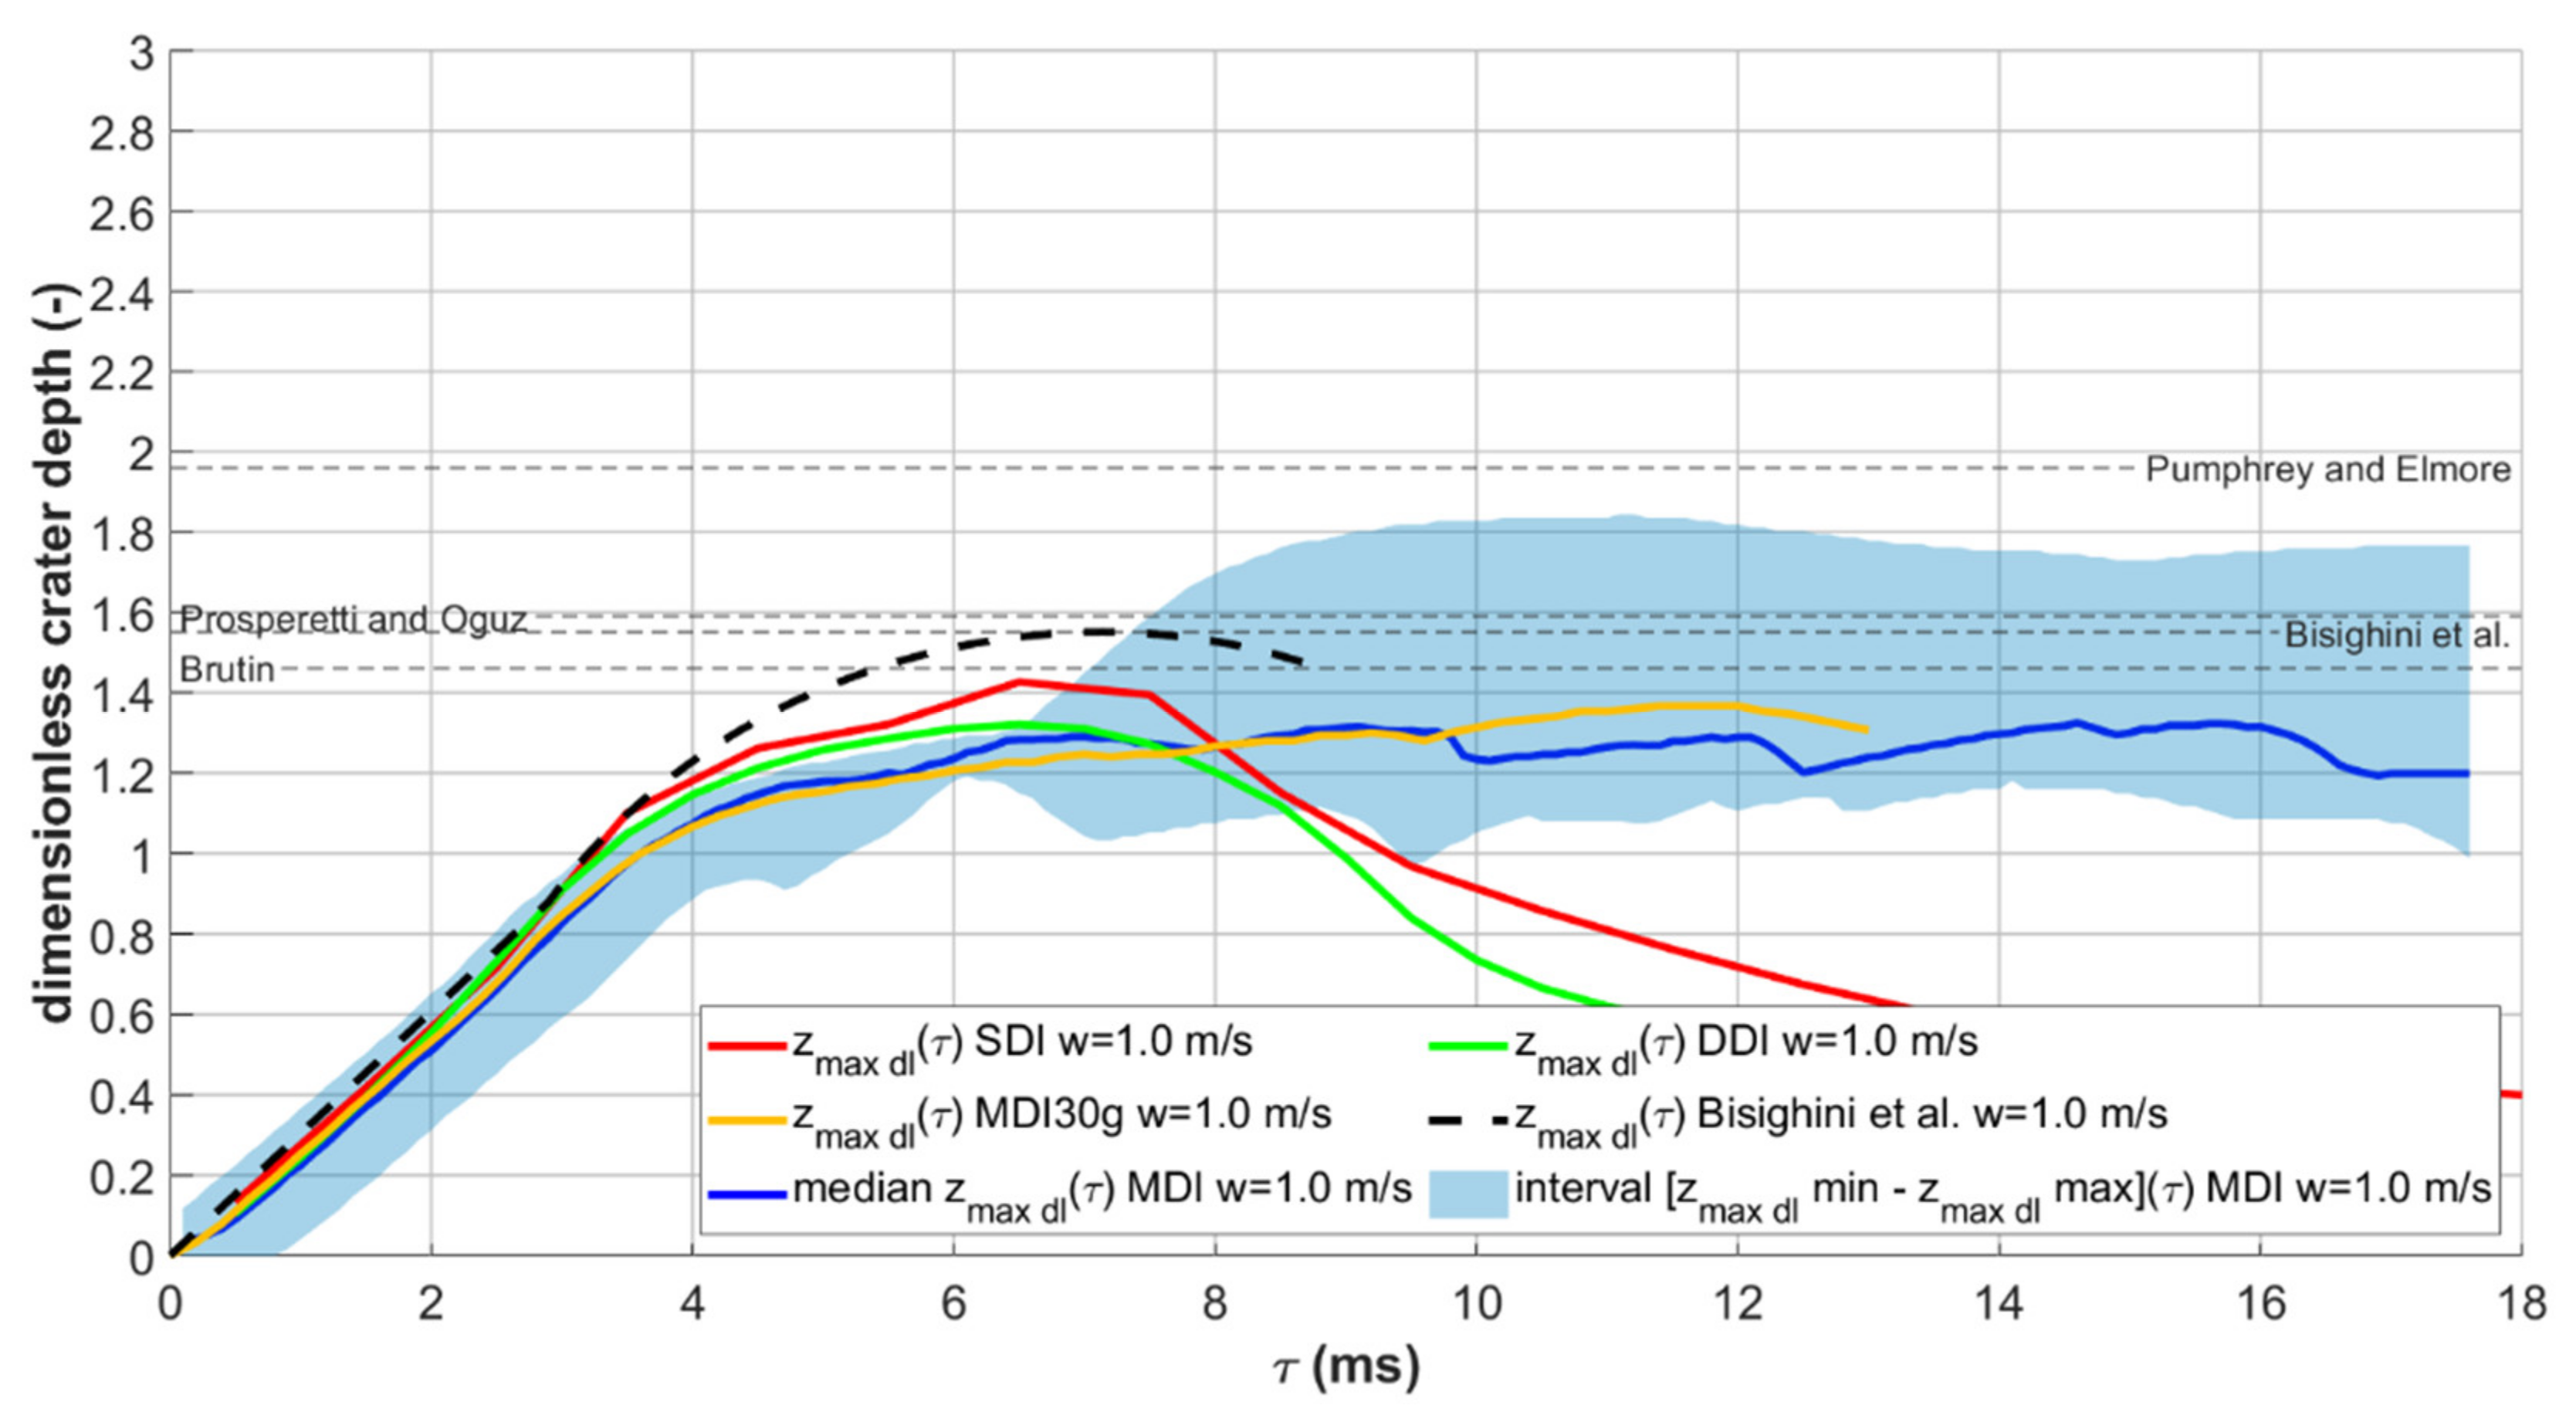
Figure 6, Figure 7, Figure 8 and Figure 9 report the results of the simulations in terms of time evolution of the dimensionless crater depth for the multiple drop impacts. In the same figures, the results for the single and double drop impacts and the prediction from some of the most credited literature models for the crater depth evolution and for the maximum crater depth are also shown. The equations and the references of the selected literature models are reported in Table 2.
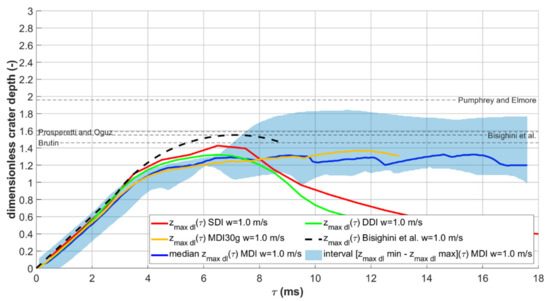
Figure 6.
Dimensionless crater depth as a function of time for single, double, and multiple drop impacts at 1.0 m/s. Predictions from some of the most credited literature models are also shown.
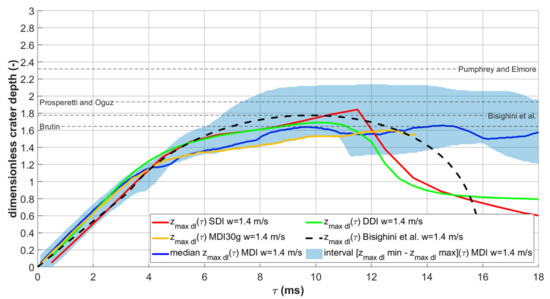
Figure 7.
Dimensionless crater depth as a function of time for single, double, and multiple drop impacts at 1.4 m/s. Predictions from some of the most credited literature models are also shown.
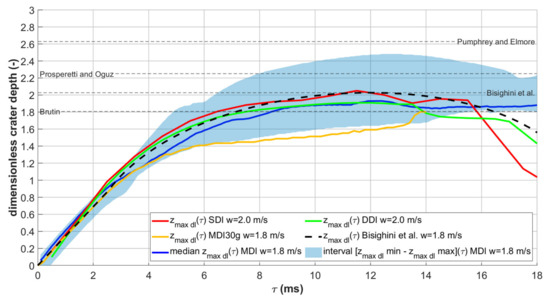
Figure 8.
Dimensionless crater depth as a function of time for single, double, and multiple drop impacts at 1.8 m/s. Predictions from some of the most credited literature models are also shown.

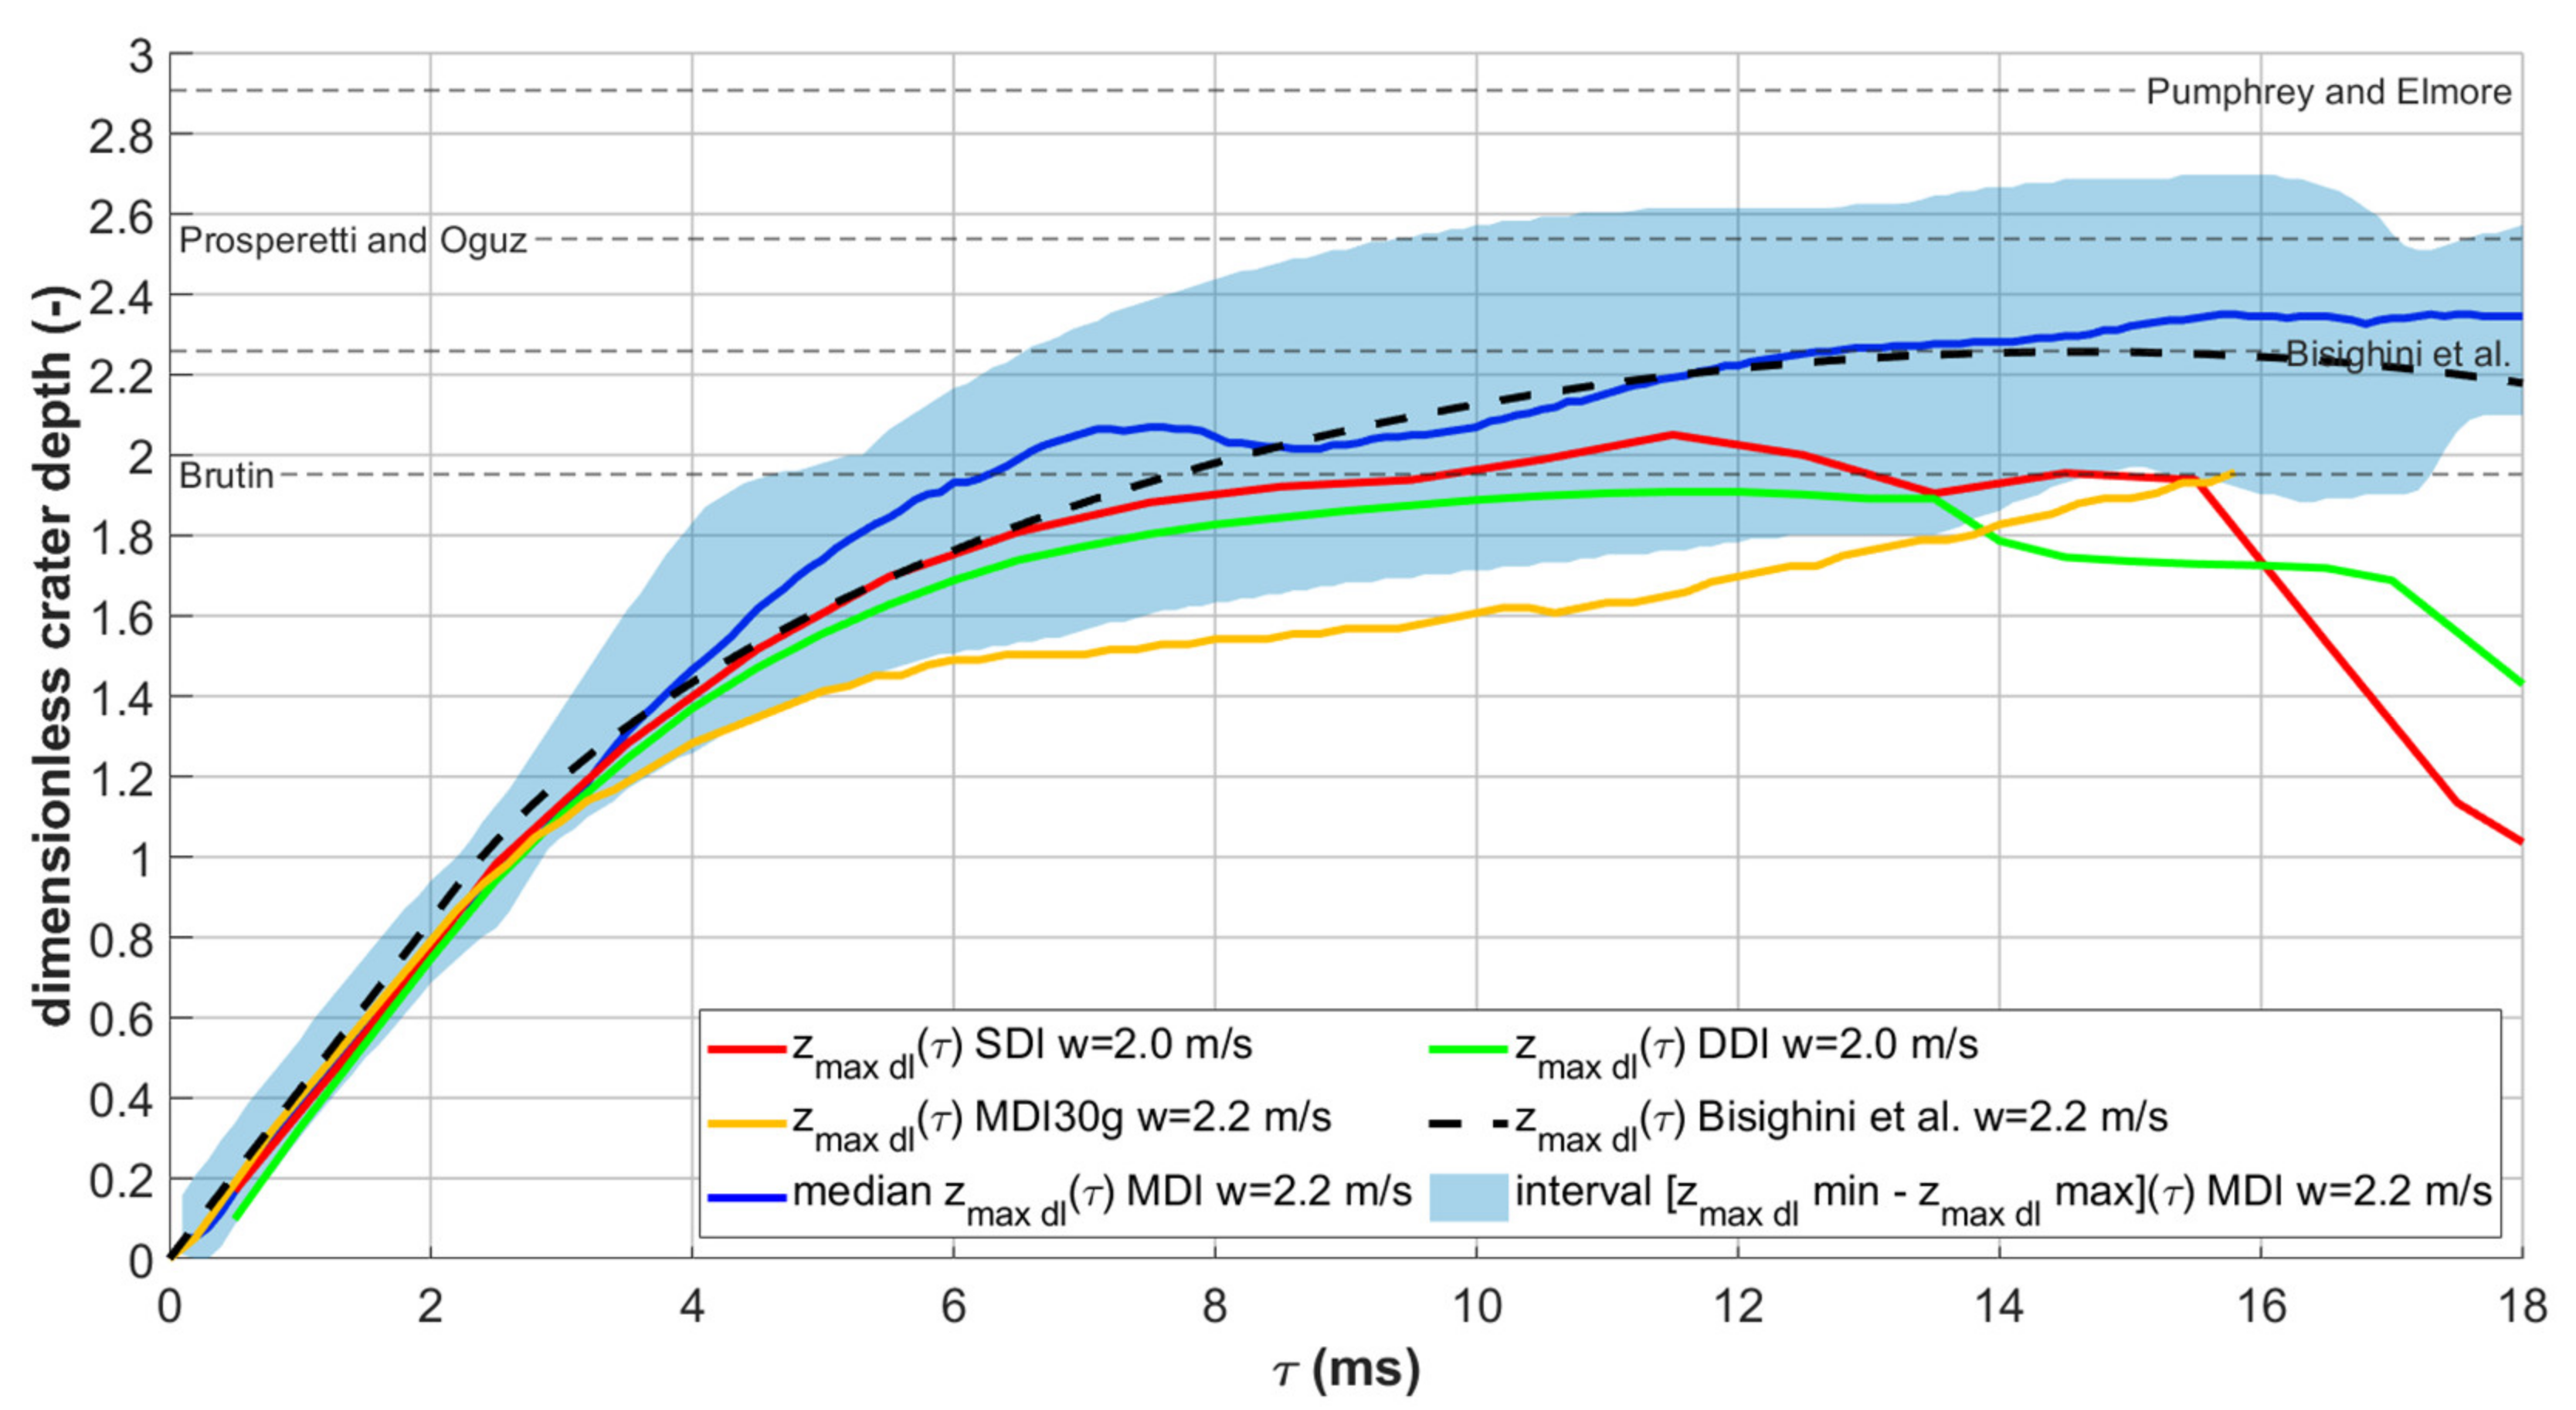
Figure 9.
Dimensionless crater depth as a function of time for single, double, and multiple drop impacts at 2.2 m/s. Predictions from some of the most credited literature models are also shown.
Table 2.
Literature models for the dimensionless crater depth evolution and maximum crater depth.
The profiles in the multiple impact cases with four to nine drops enclosed a region, depending on the mutual interaction between the drops, that depended on the drop positions. Such a region is evidenced in the charts with a filled band, to better underline this aspect in comparison with the results of single and double drop impacts, that are drawn as continuous lines. The median of the crater depths for the multiple impact cases and the values for the 30 drops simulations are also shown as continuous lines, while the prediction from the model by Bisighini et al. is represented with a dashed line.
From the graphs it can be seen how, in the first part, the time histories of the crater depth for single, double, and multiple drop impacts are very similar. On the contrary, in the second part the profiles are different, particularly for the multiple drops where there is not the tendency of the crater to close as it does after single and double impacts. This can be seen from the last part of the plots, where the crater depth for multiple drop impacts tends to remain constant for a long time.
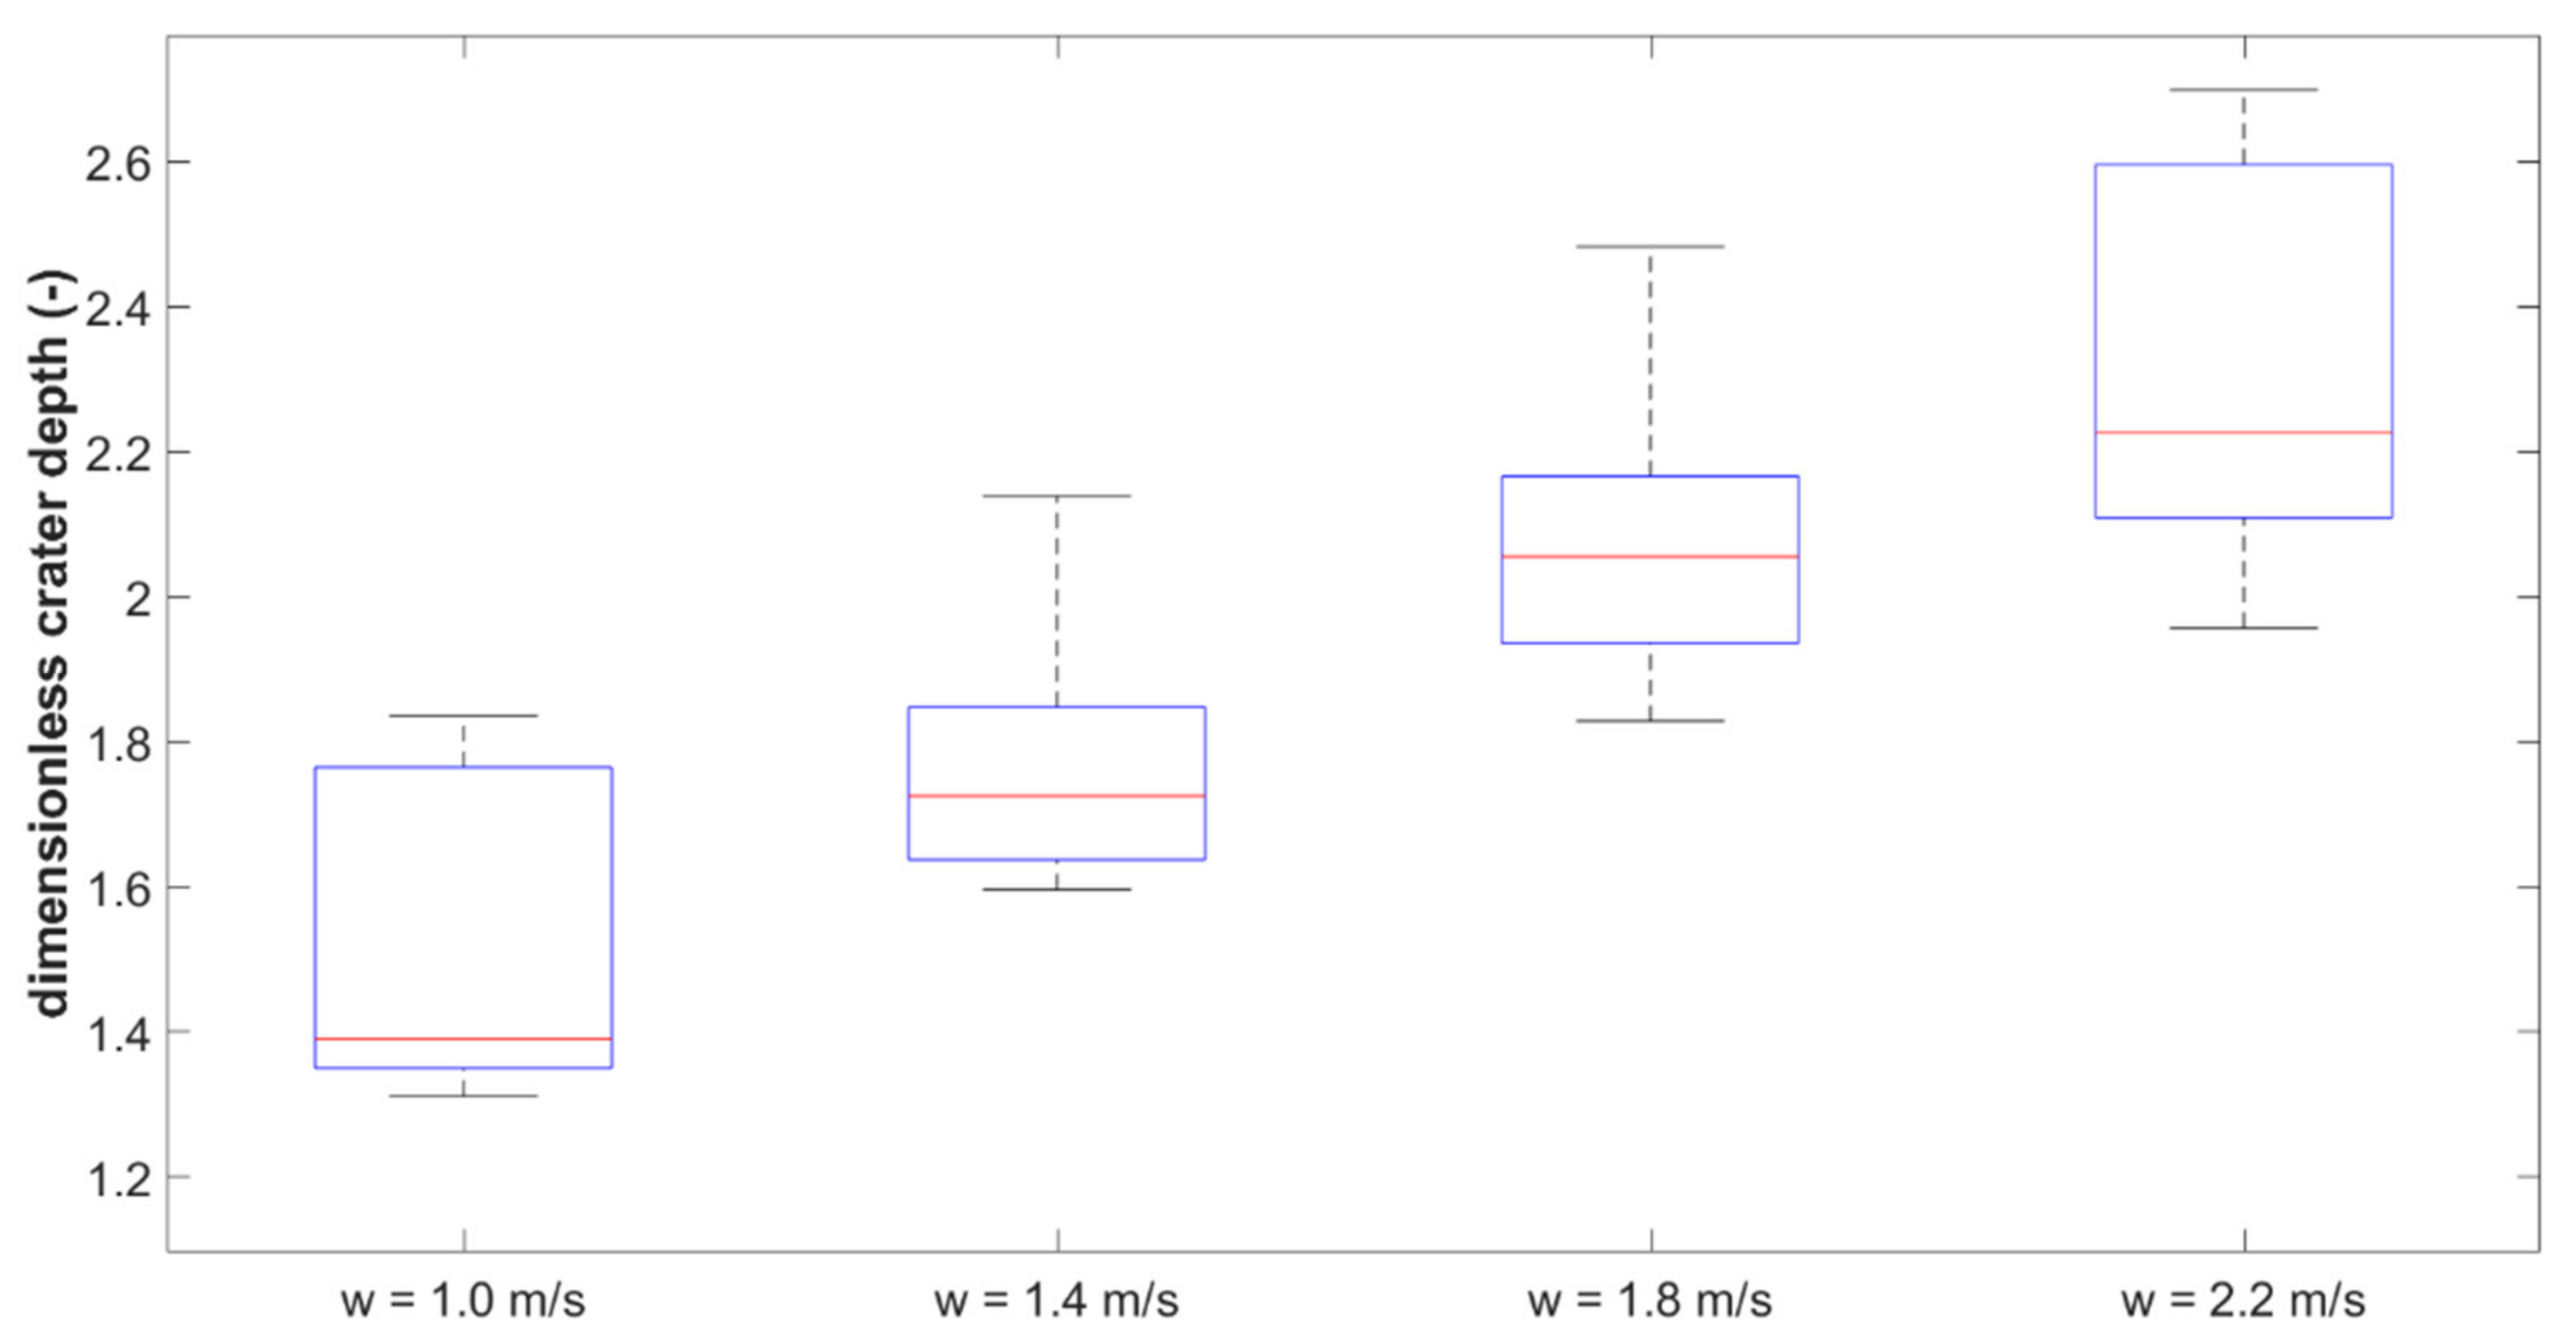
Figure 10 shows the maximum crater depths reached during multiple drop impacts as box plots, for the four investigated impact velocities.
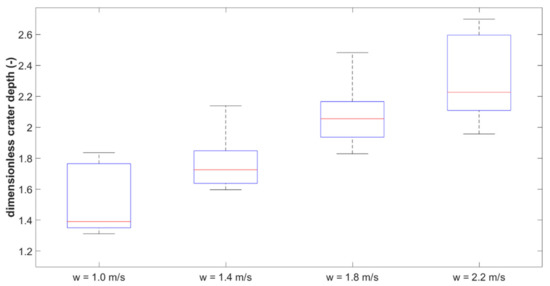
Figure 10.
Box plots of the maximum dimensionless crater depth for multiple drop impacts, at the different impact velocities.
Table 3, Table 4 and Table 5 report the quantitative comparison between the simulation results and the predictions of the selected literature models, in terms of percent deviation of the model prediction with respect to the minimum, median, and maximum values of the maximum crater depth for each of the investigated impact velocities. Other literature models (e.g., those by Fedorchenko and Wang [65]) returned similar values.
Table 3.
Deviation between the maximum dimensionless crater depths predicted from the literature models and the minimum values of the quantity calculated from the simulations at the different velocities.
Table 4.
Deviation between the maximum dimensionless crater depths predicted from the literature models and the median values of the quantity calculated from the simulations at the different velocities.
Table 5.
Deviation between the maximum dimensionless crater depths predicted from the literature models and the maximum values of the quantity calculated from the simulations at the different velocities.
As can be seen from the tables, the models by Leng and by Brutin offer the best performance in predicting the median values of the maximum crater depths at the lowest impact velocities, while the model by Bisighini becomes the best at the highest ones.
The models by Leng and by Brutin are also the best in predicting the minimum values of the maximum crater depths at the different impact velocities. The model by Pumphrey and the model by Prosperetti and Oguz are overestimating the minimum and median values, particularly the first one, that then turns to give the best results in terms of the maximum values of the maximum crater depths at the lowest impact velocities.
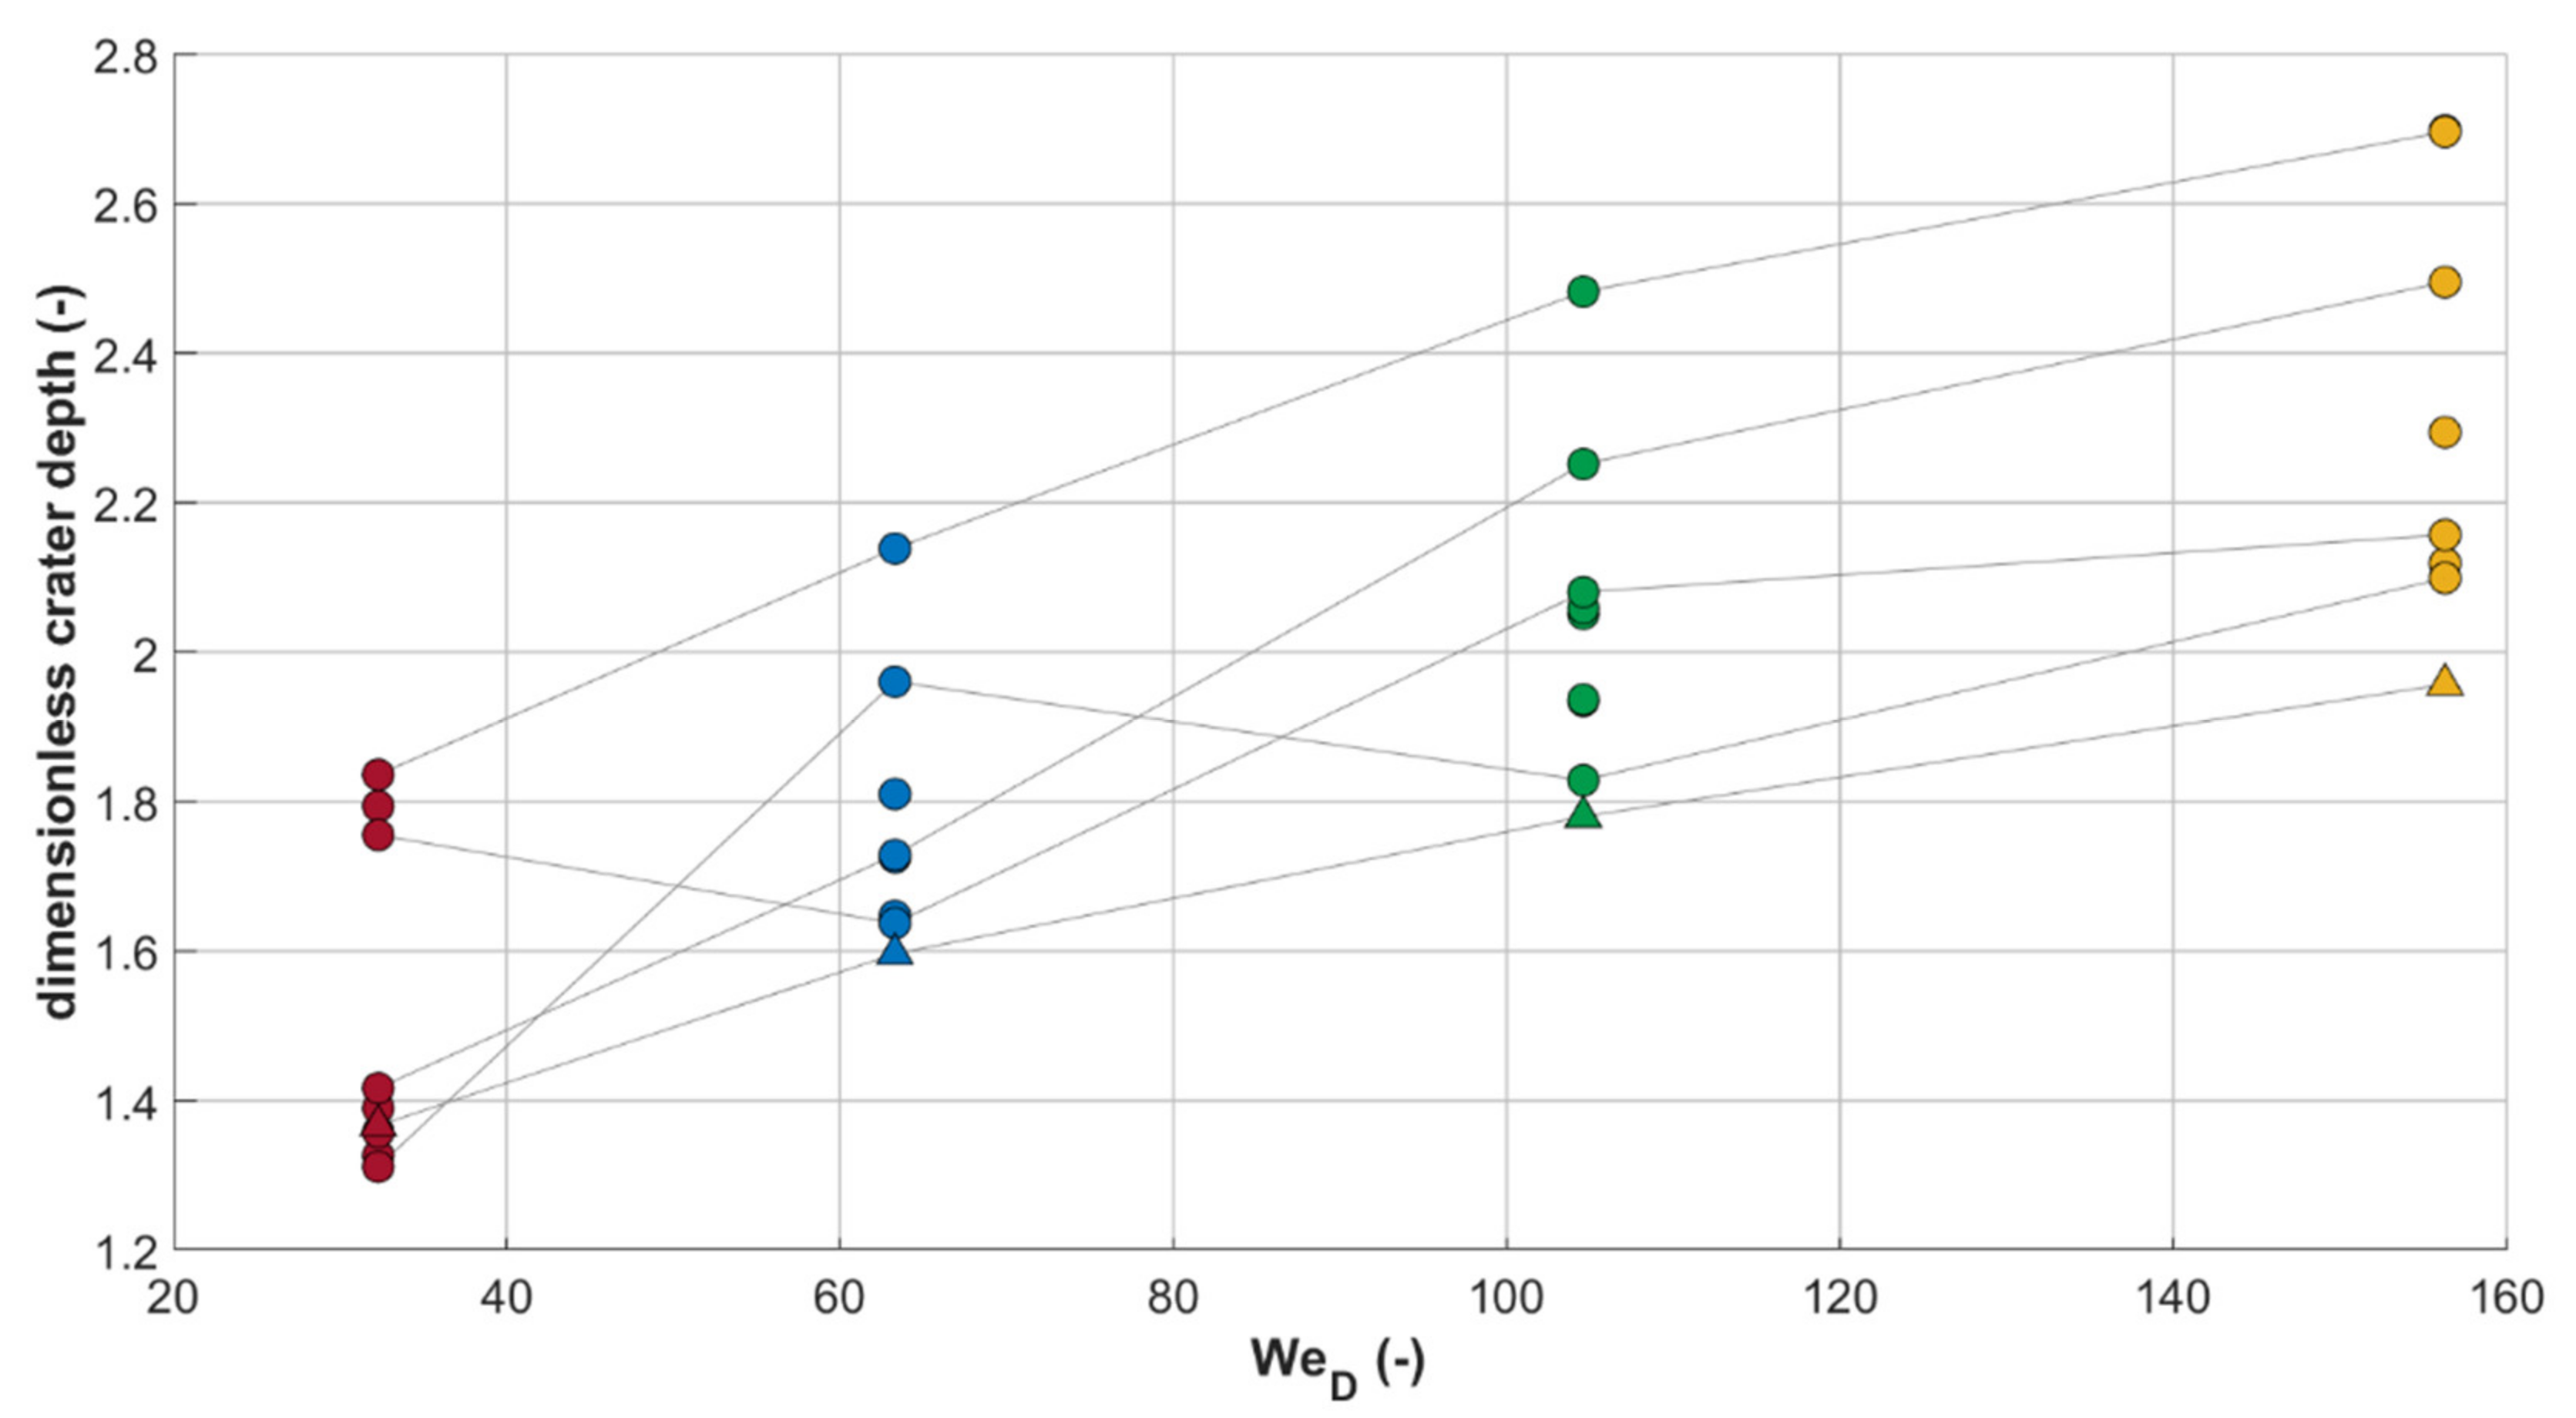
Figure 11, Figure 12 and Figure 13 show the maximum crater depths as a function of the dimensionless groups typically used to characterize drop impacts, the Reynolds ReD, the Weber WeD, and the Froude FrD numbers:
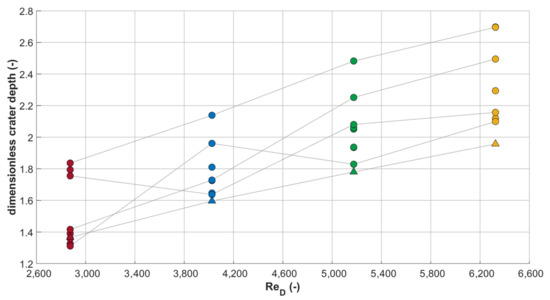
Figure 11.
Maximum dimensionless crater depths for multiple drop impacts as a function of the Reynolds number. Circle markers are used for the points corresponding to the simulations with between four and nine drops, while the triangle markers for the results from the 30 drop simulations; the colors are related to the different impact velocities (brown 1.0 m/s, dark cyan 1.4 m/s, green 1.8 m/s, yellow 2.2 m/s).
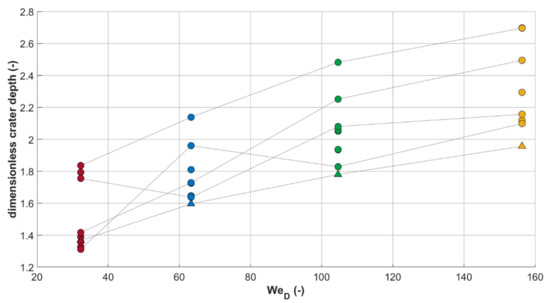
Figure 12.
Maximum dimensionless crater depths for multiple drop impacts as a function of the Weber number. Circle markers are used for the points corresponding to the simulations with between four and nine drops, while the triangle markers for the results from the 30 drop simulations; the colors are related to the different impact velocities (brown 1.0 m/s, dark cyan 1.4 m/s, green 1.8 m/s, yellow 2.2 m/s).
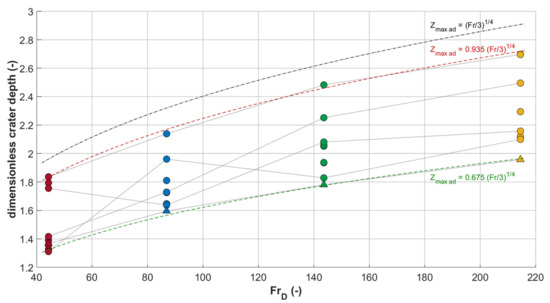
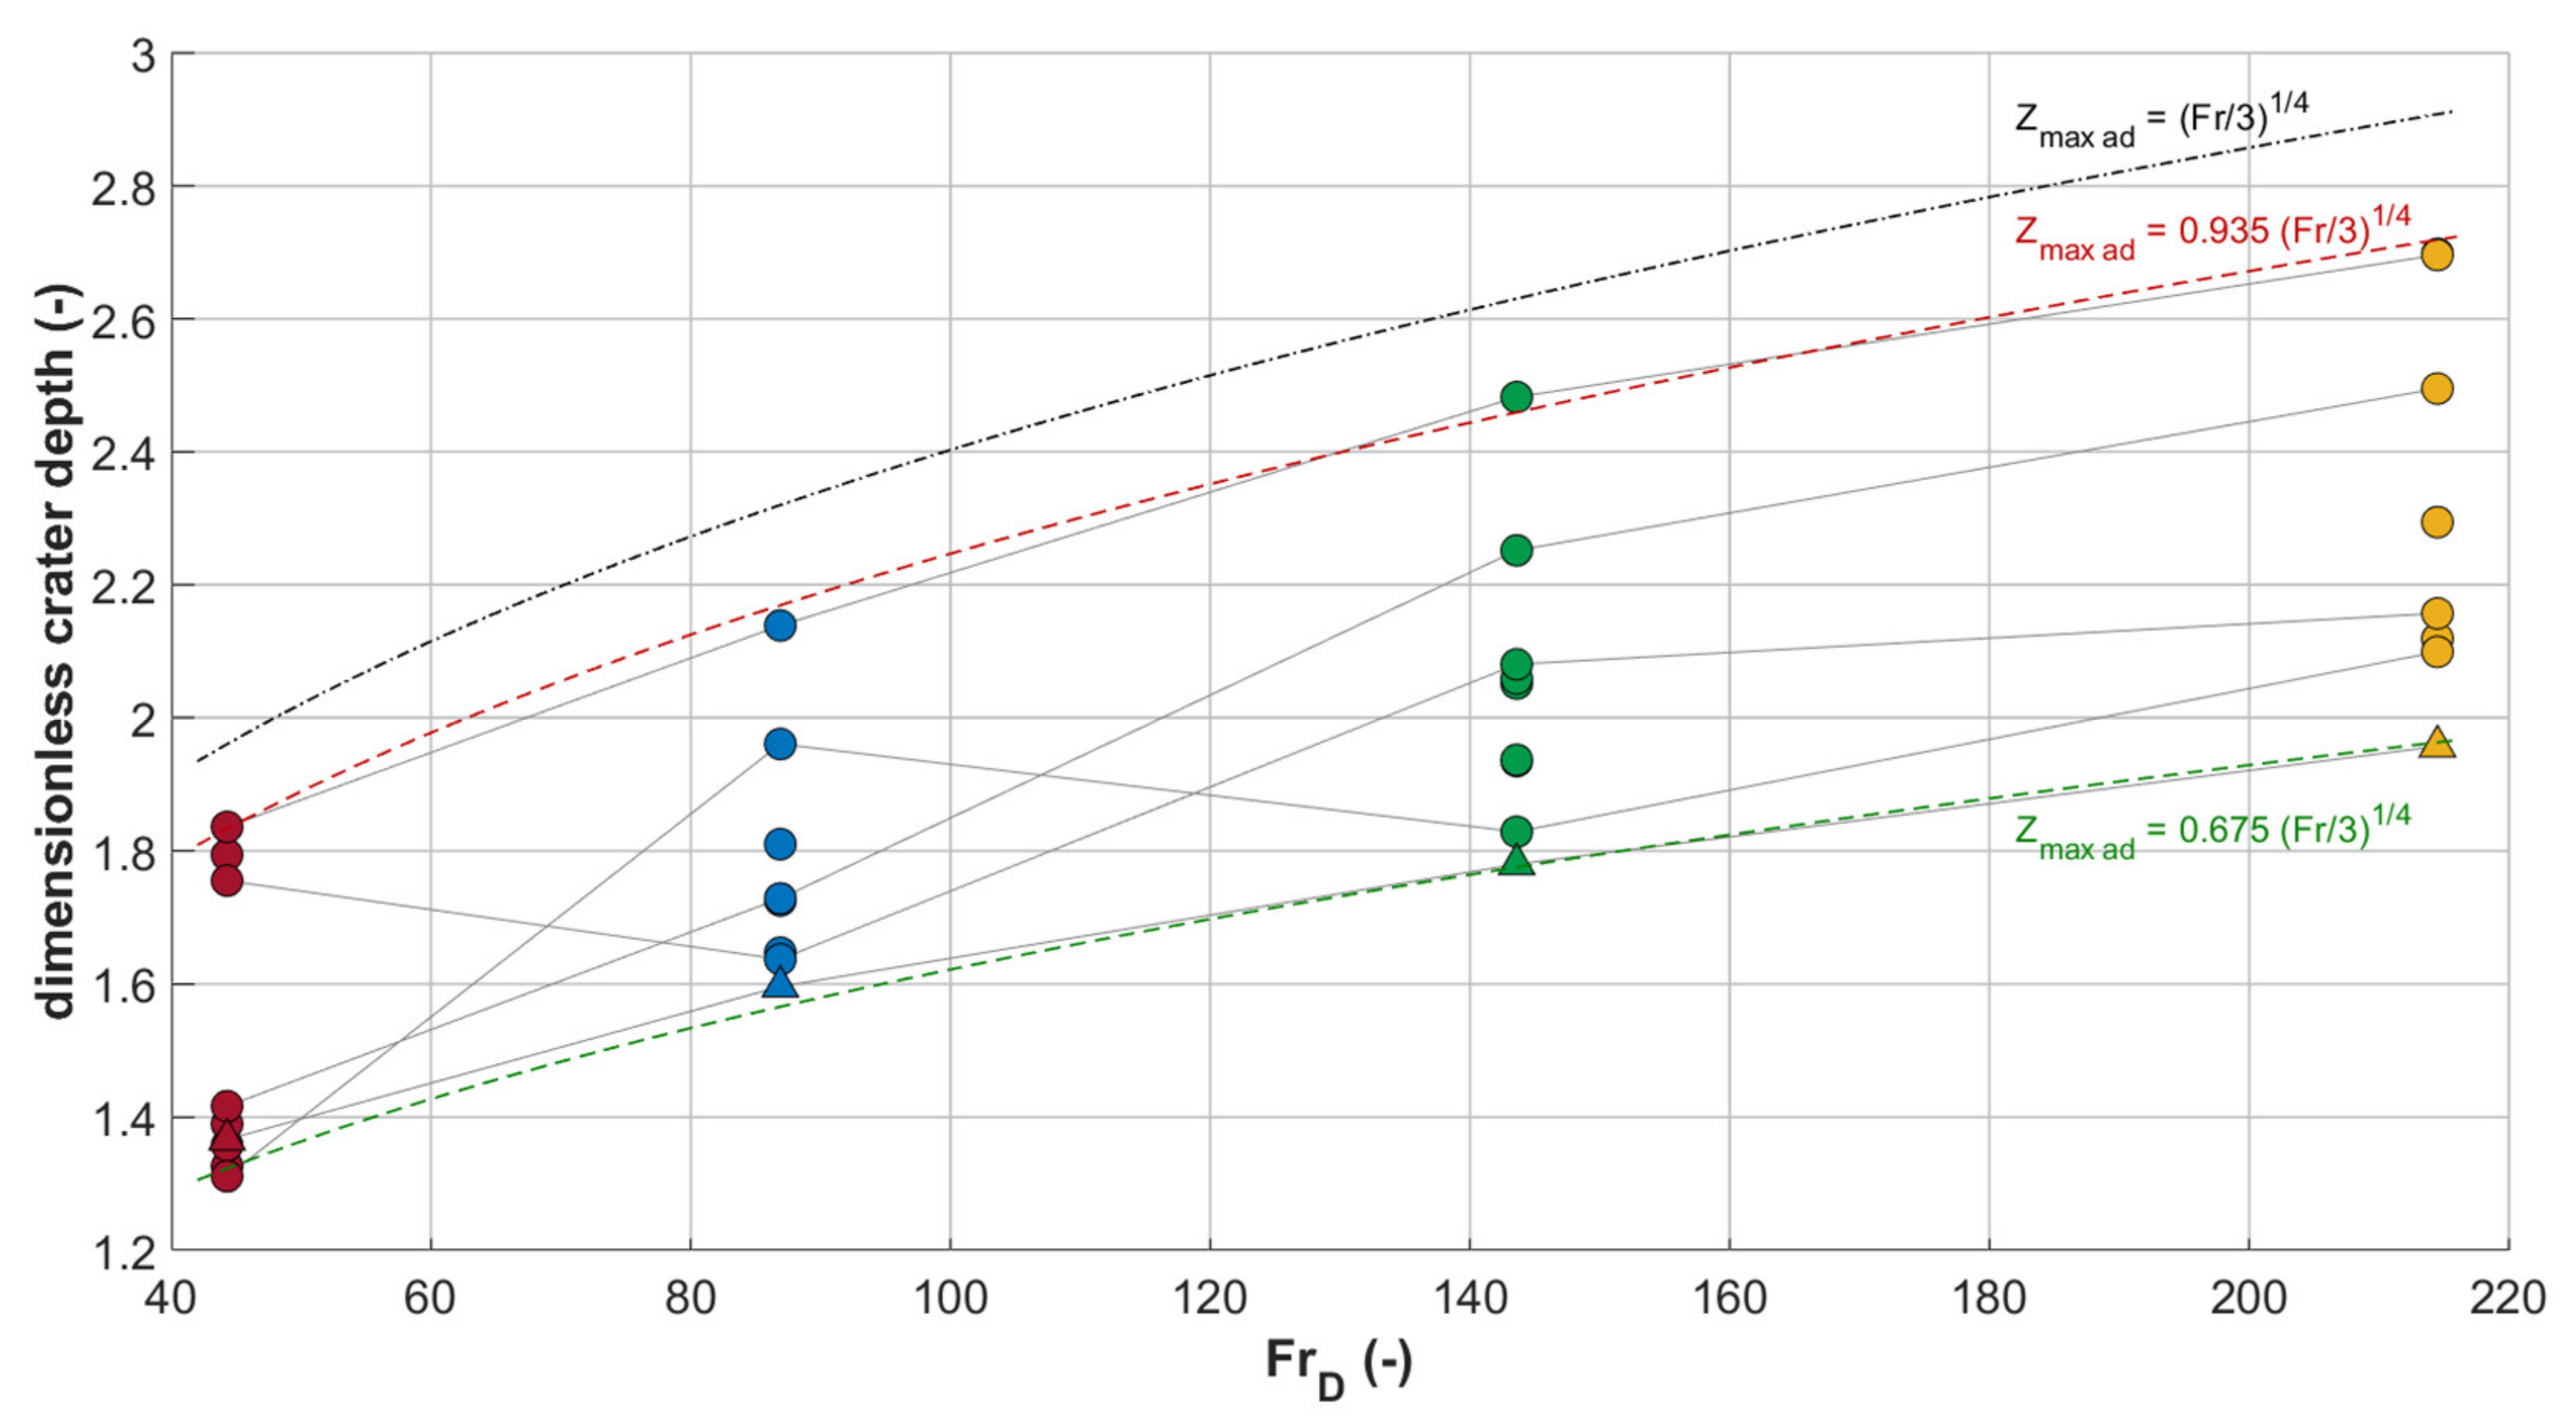
Figure 13.
Maximum dimensionless crater depths for multiple drop impacts as a function of the Froude number. Circle markers are used for the points corresponding to the simulations with between four and nine drops, while the triangle markers for the results from the 30 drop simulations; the colors are related to the different impact velocities (brown 1.0 m/s, dark cyan 1.4 m/s, green 1.8 m/s, yellow 2.2 m/s).
The trends in the charts are obviously the same, but the latter helps in contextualizing the investigated conditions. The points corresponding to the simulations with between four and nine drops are shown with circle markers, while the triangle markers evidence the results from the 30 drop simulations. The cases in which the drop number and positions were the same in the simulations at the different impact velocities are connected by a line. In the last chart, some additional lines are also traced:
- the line corresponding to Zmax ad = (FrD/3)1/4—that, as already said, is the “basis” of many of the literature models—is also shown as a dash-dot line.
- the two lines corresponding to Zmax ad = 0.675 (FrD/3)1/4 and Zmax ad = 0.935 (FrD/3)1/4, that can be used as “rounded” boundaries of the simulation results. A larger number of simulations would be needed to perform a significant fitting of the minimum, maximum, and median values of the maximum crater depths in order to propose a new model with reliable coefficients.
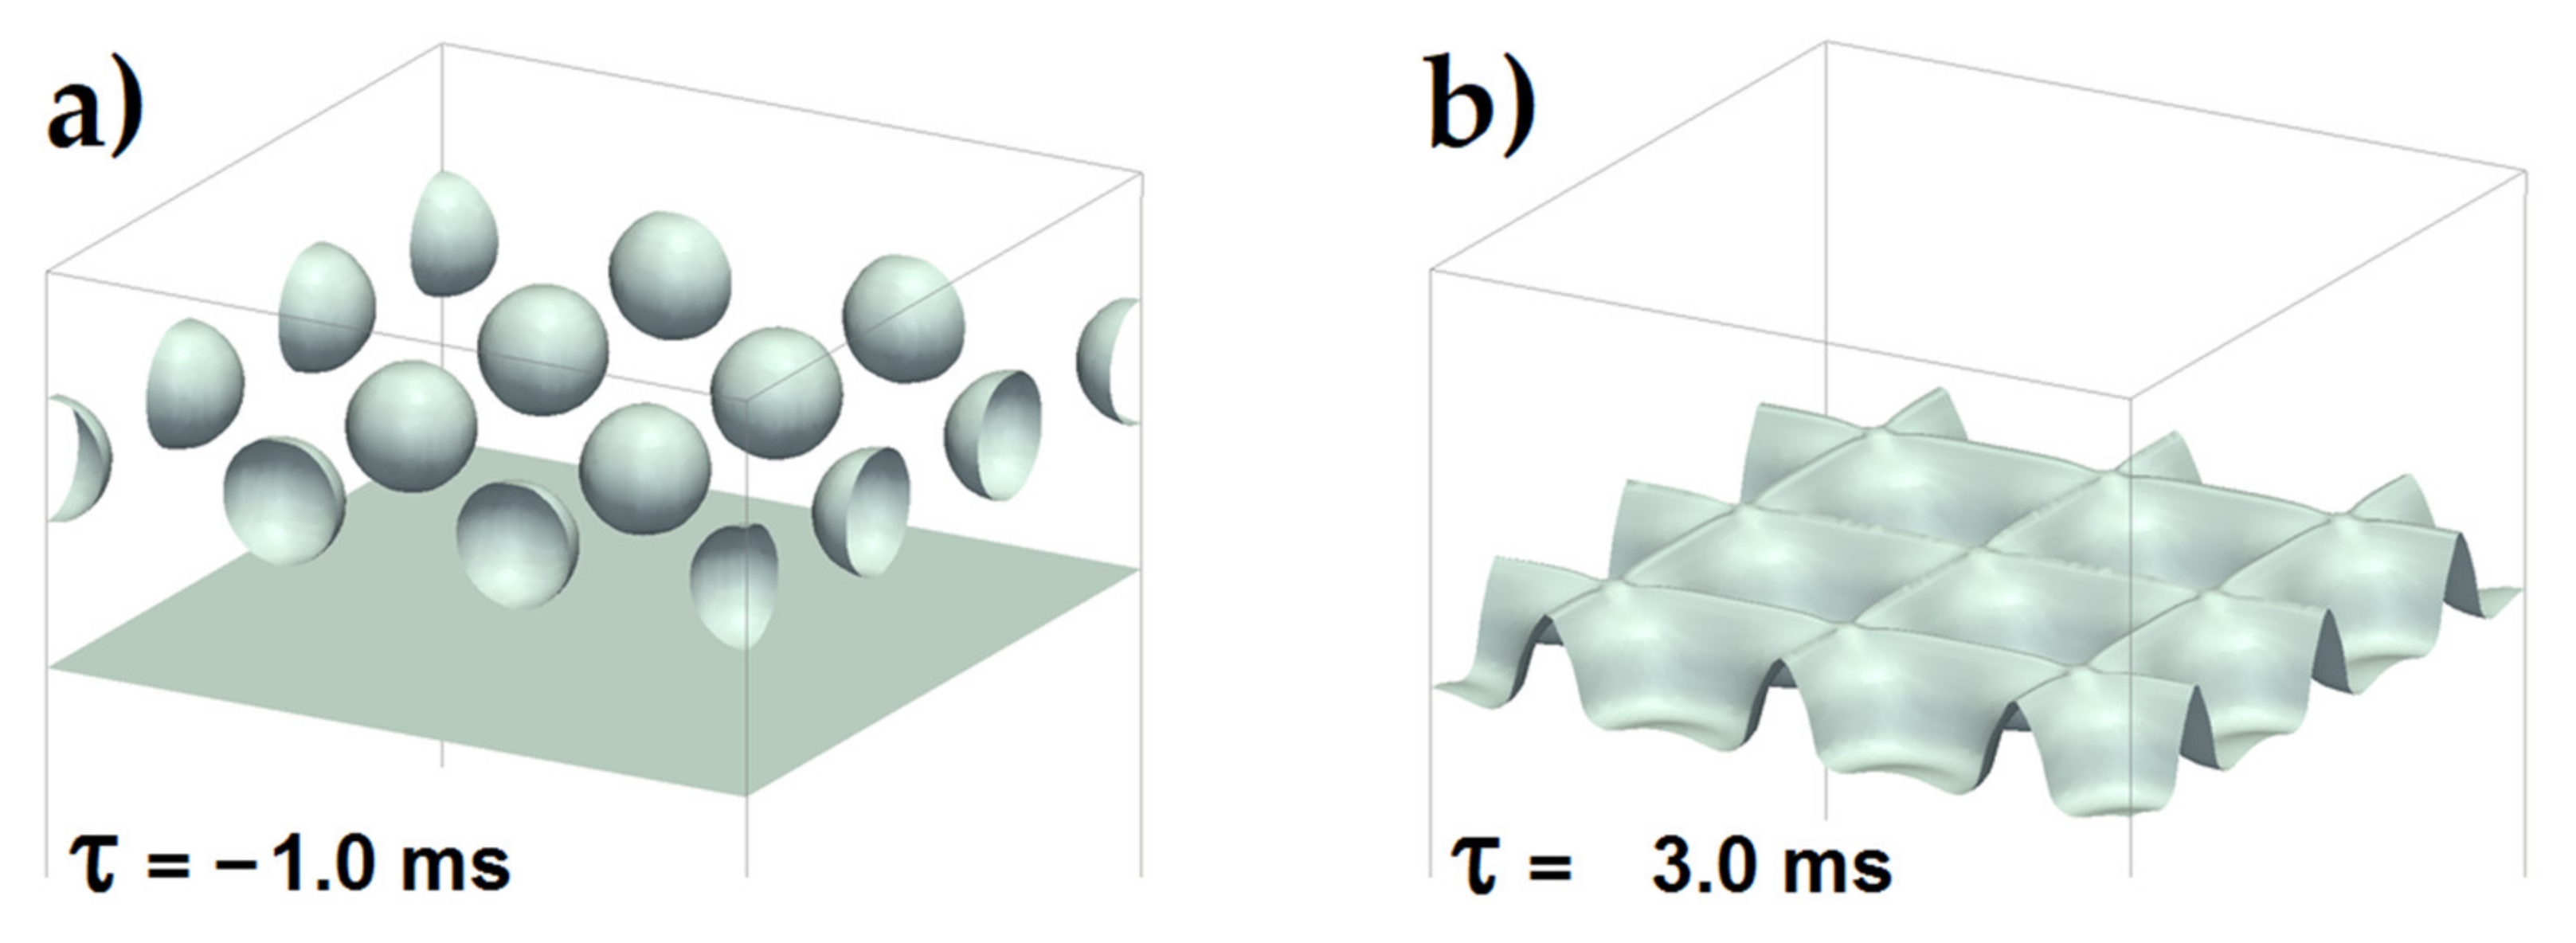
Concerning the influence of the distances between the drops, from the results it seems that the crater depth tends to reduce when increasing the number of drops, e.g., the results with 30 drops are those with the lowest values. Such a finding is not surprising, as when many drops are present and their mutual distance is relatively short, each crater “disturbs” the others during the inertial expansion phase. This is due both to the effect of pressure, as expanding craters displace water that is pushed towards the other craters, opposing their growth, and of surface tension when craters merge. To further verify this effect, an additional simulation was performed, with 16 drops uniformly distributed in the domain, synchronously impacting the pool at 1.4 m/s. This is an unrealistic situation, that was simulated as an extreme case. As can be seen from Figure 14, the craters arrive to “block” each other.
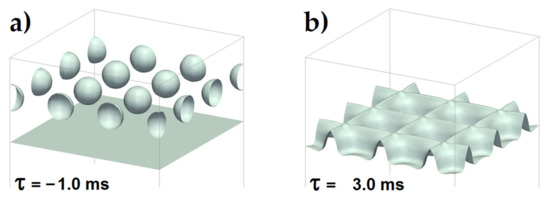
Figure 14.
Three-dimensional view of the initial drop positions (a) 1 ms before the impact, and of the free surface configuration (b) 3 ms after the impact for a case with 16 drops uniformly distributed in the domain, impact velocity 1.4 m/s.
4. Conclusions
Numerical simulations of single, double, and multiple and not synchronous water drop impacts onto deep pools were performed in a finite volume framework, using the two-phase, incompressible interFoam solver of the OpenFOAM® open-source CFD package. After validation against the experimental data for single and double drop impacts, the focus was on the evolution in time and maximum value of the crater depth. Four impact velocities, namely 1.0 m/s, 1.4 m/s, 1.8 m/s, and 2.2 m/s were investigated, performing nine simulations for each of them with a random number (between four and 30) and positions of the drops in the domain.
The results were compared with some of the most credited literature models for the crater depth after single drop impacts, with the aim to assess the reliability of such models to predict such a quantity also for multiple impacts. The models by Leng, Brutin, and Bisighini offer very good performances in predicting the minimum value of the maximum crater depths at the different impact velocities, while the model by Pumphrey has the best agreement in terms of the maximum value of such a quantity. Thus, it can be concluded that some of the models available in the literature for the crater maximum depth can also be used as the upper and lower bounds of the values of the crater depth during multiple drop impacts. Moreover, the results show that in the presence of many drops the maximum depth is reduced, as the water displaced by each crater hampers the expansion of the others.
A larger number of simulations would be needed to perform a significant fitting and to provide a new model, e.g., for the median values of the maximum crater depth. This is foreseen as one of the future works for the research activity, included in a more extensive simulation campaign performed on the basis of a rigorous design of experiment, aimed at systematically exploring the effects of the separated variations of the single governing parameters. Additionally, the validation with experimental data directly acquired for multiple drop impacts and an extension of the investigation (both numerical and experimental) to drops having smaller diameters and higher velocities—to match more closely, e.g., those of rain drops—are needed to draw more in-depth conclusions about the differences between single and multiple drop impacts, in relation to the specific scenarios.
Author Contributions
Conceptualization, M.G.; formal analysis, G.F. and M.G.; investigation, G.F. and M.G.; methodology, M.G.; software, G.F. and M.G.; validation, G.F. and M.G.; visualization, G.F. and M.G.; writing—original draft preparation, G.F. and M.G.; writing—review and editing, G.F. and M.G. All authors have read and agreed to the published version of the manuscript.
Funding
This research received no external funding.
Data Availability Statement
The results of the numerical simulations are available from the authors upon reasonable request.
Conflicts of Interest
The authors declare no conflict of interest.
References
- Worthington, A.M. On impact with a liquid surface. Proc. R. Soc. Lond. 1882, 34, 217–230. [Google Scholar] [CrossRef] [Green Version]
- Worthington, A.M. A Study of Splashes; Longmans Green and Co.: London, UK, 1908. [Google Scholar]
- Rein, M. Phenomena of liquid drop impact on solid and liquid surfaces. Fluid Dyn. Res. 1993, 12, 61–93. [Google Scholar] [CrossRef]
- Yarin, A.L. Drop impact dynamics: Splashing, spreading, receding, bouncing. Annu. Rev. Fluid Mech. 2006, 38, 159–192. [Google Scholar] [CrossRef]
- Ashgriz, N. (Ed.) Handbook of Atomization and Sprays: Theory and Applications; Springer Science & Business Media: Berlin, Germany, 2011; ISBN 9781441972644. [Google Scholar] [CrossRef]
- Cole, D. The Splashing Morphology of Liquid-Liquid Impacts. Ph.D. Thesis, James Cook University, Townsville, Australia, 2007. [Google Scholar]
- Bisighini, A.; Cossali, G.E. High-speed visualization of interface phenomena: Single and double drop impacts onto a deep liquid. J. Vis. 2011, 14, 103–110. [Google Scholar] [CrossRef]
- Santini, M.; Fest-Santini, S.; Cossali, G.E. Experimental study of vortices and cavities from single and double drop impacts onto deep pools. Eur. J. Mech. B Fluids 2017, 62, 21–31. [Google Scholar] [CrossRef]
- Guilizzoni, M.; Santini, M.; Fest-Santini, S. Synchronized Multiple Drop Impacts into a Deep Pool. Fluids 2019, 4, 141. [Google Scholar] [CrossRef] [Green Version]
- Guo, Y.; Chen, G.; Shen, S.; Zhang, J. Double Droplets Simultaneous Impact on Liquid Film. IOP Conf. Ser. Mater. Sci. Eng. 2015, 88, 012016. [Google Scholar] [CrossRef]
- Santini, M.; Cossali, G.E.; Marengo, M. Splashing characteristics of multiple and single drop impacts onto a thin liquid film. In Proceedings of the International Conference on Multiphase Flows, Leipzig, Germany, 9–13 July 2007. [Google Scholar]
- Fest-Santini, S.; Steigerwald, J.; Santini, M.; Cossali, G.E.; Weigand, B. Multiple drops impact onto a liquid film: Direct numerical simulation and experimental validation. Comput. Fluids 2021, 214, 104761. [Google Scholar] [CrossRef]
- Roisman, I.V.; Prunet-Foch, B.; Tropea, C.; Vignes-Adler, M. Multiple Drop Impact onto a Dry Solid Substrate. J. Colloid Interface Sci. 2002, 256, 396–410. [Google Scholar] [CrossRef]
- Trujillo, M.F.; Lewis, S.R. Thermal boundary layer analysis corresponding to droplet train impingement. Phys. Fluids 2012, 24, 112102. [Google Scholar] [CrossRef]
- Ray, B.; Biswas, G.; Sharma, A.; Welch, S.W.J. CLSVOF method to study consecutive drop impact on liquid pool. Int. J. Numer. Methods Heat Fluid Flow 2013, 23, 143–158. [Google Scholar] [CrossRef]
- Bouwhuis, W.; Huang, X.; Chan, C.U.; Frommhold, P.E.; Ohl, C.-D.; Lohse, D.; Snoeijer, J.H.; van der Meer, D. Impact of a high-speed train of microdrops on a liquid pool. J. Fluid Mech. 2016, 792, 850–868. [Google Scholar] [CrossRef] [Green Version]
- Lee, J.H.; Kim, S.; Kim, J.; Kim, H.; Kim, H.-Y. From an elongated cavity to funnel by the impact of a drop train. J. Fluid Mech. 2021, 921, A8. [Google Scholar] [CrossRef]
- Oguz, H.N.; Prosperetti, A. Bubble entrainment by impact of a liquid drop on liquid surfaces. J. Fluid Mech. 1990, 219, 143–179. [Google Scholar] [CrossRef] [Green Version]
- Rieber, M.; Frohn, A. A numerical study on the mechanism of splashing. Int. J. Heat Fluid Flow 1999, 20, 455–461. [Google Scholar] [CrossRef]
- Bussmann, M.; Mostaghimi, J.; Chandra, S. On a three-dimensional volume tracking model of droplet impact. Phys. Fluids 1999, 11, 1406. [Google Scholar] [CrossRef]
- Morton, D.; Rudman, M.; Liow, J.M. An investigation of the flow regimes resulting from splashing drops. Phys. Fluids 2000, 12, 747. [Google Scholar] [CrossRef]
- Thoraval, M.-J.; Takehara, K.; Etoh, T.G.; Popinet, S.; Ray, P.; Josserand, C.; Zaleski, S.; Thoroddsen, S.T. von Karman Vortex Street within an Impacting Drop. Phys. Rev. Lett. 2012, 108, 264506. [Google Scholar] [CrossRef] [Green Version]
- Thoraval, M.-J.; Li, Y.; Thoroddsen, S. Vortex-ring induced large bubble entrainment during drop impact. Phys. Rev. E 2016, 93, 033128. [Google Scholar] [CrossRef] [Green Version]
- Reijers, S.A.; Liu, B.; Lohse, D.; Gelderblom, H. Oblique droplet impact onto a deep liquid pool. arXiv 2019, arXiv:1903.08978. [Google Scholar]
- Hirt, C.W.; Nichols, B.D. Volume of Fluid (VOF) Method for the Dynamics of Free Boundaries. J. Comput. Phys. 1981, 39, 201–225. [Google Scholar] [CrossRef]
- Sussman, M.; Smereka, P.; Osher, S.J. A level set approach for computing solutions to incompressible two-phase flow. J. Comput. Phys. 1994, 114, 146–159. [Google Scholar] [CrossRef]
- Popinet, S.; Zaleski, S. A front tracking algorithm for accurate representation of surface tension. Int. J. Numer. Methods Fluid 1999, 30, 775–793. [Google Scholar] [CrossRef]
- Bonometti, T.; Magnaudet, J. An interface-capturing method for incompressible two-phase flows. Validation and application to bubble dynamics. Int. J. Multiph. Flow 2007, 33, 109–133. [Google Scholar] [CrossRef] [Green Version]
- Tryggvason, G.; Bunner, B.; Esmaeeli, A.; Juric, D.; Al-Rawahi, N.; Tauber, W.; Han, J.; Nas, S.; Jan, Y.-J. A Front-Tracking Method for the Computations of Multiphase Flow. J. Comput. Phys. 2001, 169, 708–759. [Google Scholar] [CrossRef] [Green Version]
- Albadawi, A.; Donoghue, D.B.; Robinson, A.J.; Murray, D.B.; Delauré, Y.M.C. Influence of surface tension implementation in Volume of Fluid and coupled Volume of Fluid with Level Set methods for bubble growth and detachment. Int. J. Multiph. Flow 2013, 53, 11–28. [Google Scholar] [CrossRef]
- Taqieddin, A.; Liu, Y.; Alshawabkeh, A.N.; Allshouse, M.R. Computational modeling of bubbles growth using the coupled Level Set—Volume of Fluid method. Fluids 2020, 5, 120. [Google Scholar] [CrossRef] [PubMed]
- Menard, T.; Tanguy, S.; Berlemont, A. Coupling level set/VOF/ghost fluid methods: Validation and application to 3D simulation of the primary break-up of a liquid jet. Int. J. Multiph. Flow 2007, 33, 510–524. [Google Scholar] [CrossRef]
- Fuster, D.; Agbaglah, G.; Josserand, C.; Popinet, S.; Zaleski, S. Numerical simulation of droplets, bubbles and waves: State of the art. Fluid Dyn. Res. 2009, 41, 065001. [Google Scholar] [CrossRef]
- Zheng, H.W.; Shu, C.; Chew, Y.T.; Sun, J.H. Three-dimensional lattice Boltzmann interface capturing method for incompressible flows. Int. J. Numer. Methods Fluids 2008, 56, 1653–1671. [Google Scholar] [CrossRef]
- Huang, J.J.; Shu, C.; Chew, Y.T. Lattice Boltzmann study of bubble entrapment during droplet impact. Int. J. Numer. Methods Fluids 2011, 65, 655–682. [Google Scholar] [CrossRef]
- Gentner, F.; Rioboo, R.; Baland, J.P.; De Coninck, J. Low Inertia Impact Dynamics for Nanodrops. Langmuir 2004, 20, 4748–4755. [Google Scholar] [CrossRef] [PubMed]
- OpenFOAM®. Available online: https://openfoam.org (accessed on 5 December 2021).
- Brackbill, J.U.; Khote, D.B.; Zemach, C. A Continuum Method for Modeling Surface Tension. J. Comput. Phys. 1992, 100, 335–354. [Google Scholar] [CrossRef]
- Gopala, V.R.; van Wachem, B.G.M. Volume of fluid methods for immiscible-fluid and free-surface flows. Chem. Eng. J. 1998, 141, 204–211. [Google Scholar] [CrossRef]
- Deshpande, S.S.; Anumolu, L.; Trujillo, M.F. Evaluating the performance of the two-phase flow solver interFoam. Comput. Sci. Discov. 2012, 5, 014016. [Google Scholar] [CrossRef]
- Deshpande, S.S.; Trujillo, M.F. Distinguishing features of shallow angle plunging jets. Phys. Fluids 2013, 25, 082103. [Google Scholar] [CrossRef]
- Costa, A.B.; Graham Cooks, R. Simulated splashes: Elucidating the mechanism of desorption electrospray ionization mass spectrometry. Chem. Phys. Lett. 2008, 464, 1–8. [Google Scholar] [CrossRef]
- Roisman, I.V.; Weickgenannt, C.M.; Lembach, A.N.; Tropea, C. Drop impact close to a pore: Experimental and numerical investigations. In Proceedings of the ILASS—Europe 2010, 23rd Annual Conference on Liquid Atomization and Spray Systems, Brno, Czech Republic, 6–9 September 2010. [Google Scholar]
- Berberovic, E.; van Hinsberg, N.P.; Jakirlic, S.; Roisman, I.V.; Tropea, C. Drop impact onto a liquid layer of finite thickness: Dynamics of the cavity evolution. Phys. Rev. E 2009, 79, 036306. [Google Scholar] [CrossRef]
- Castillo-Orozco, E.; Davanlou, A.; Choudhury, P.K.; Kumar, R. Droplet impact on deep liquid pools: Rayleigh jet to formation of secondary droplets. Phys. Rev. E 2015, 92, 053022. [Google Scholar] [CrossRef]
- Brambilla, P.; Guardone, A. Automatic tracking of corona propagation in three-dimensional simulations of non-normal drop impact on a liquid film. Computing 2013, 95, 415–424. [Google Scholar] [CrossRef]
- Trujillo, M.F.; Alvarado, J.; Gehring, E.; Soriano, G.S. Numerical simulations and experimental characterization of heat transfer from a periodic impingement of droplets. J. Heat Transf. 2011, 133, 122201. [Google Scholar] [CrossRef]
- Deshpande, S.S.; Trujillo, M.F.; Wu, X.; Chahine, G. Computational and experimental characterization of a liquid jet plunging into a quiescent pool at shallow inclination. Int. J. Heat Fluid Flow 2012, 34, 1–14. [Google Scholar] [CrossRef]
- Kundu, P.K.; Cohen, I.M.; Dowling, D.R.; Tryggvason, G. Fluid Mechanics, 6th ed.; Academic Press: New York, NY, USA, 2015; ISBN 9780124059351. [Google Scholar] [CrossRef]
- Ferziger, J.H.; Peric, M. Computational Methods for Fluid Dynamics; Springer: Berlin/Heidelberg, Germany, 2002; ISBN 9783540420743. [Google Scholar] [CrossRef]
- Márquez Damián, S. Description and Utilization of InterFoam Multiphase Solver. Universidad Nacional del Litoral, Argentina. Available online: http://infofich.unl.edu.ar/upload/5e6dfd7ff282e2deabe7447979a16d49b0b1b675.pdf (accessed on 5 December 2021).
- InterFoam. in the Unofficial OpenFOAM Wiki. Available online: https://openfoamwiki.net/index.php/InterFoam (accessed on 5 December 2021).
- Raeini, A.Q.; Blunt, M.J.; Bijeljic, B. Modelling two-phase flow in porous media at the pore scale using the volume-of-fluid method. J. Comput. Phys. 2012, 231, 5653–5668. [Google Scholar] [CrossRef]
- Jasak, H.; Weller, H.G. Interface-Tracking Capabilities of the InterGamma Differencing Scheme; Technical Report; Imperial College of Science, Technology and Medicine, University of London: London, UK, 1995. [Google Scholar]
- Roenby, J.; Bredmose, H.; Jasak, H. A computational method for sharp interface advection. R. Soc. Open Sci. 2016, 3, 160405. [Google Scholar] [CrossRef] [PubMed] [Green Version]
- Gamet, L.; Scala, M.; Roenby, J.; Scheufler, H.; Pierson, J.-L. Validation of volume-of-fluid OpenFOAM® isoAdvector solvers using single bubble benchmarks. Comput. Fluids 2020, 213, 104722. [Google Scholar] [CrossRef]
- Krause, F.; Li, X.; Fritsching, U. Simulation of droplet-formation and -interaction in emulsification processes. Eng. Appl. Comput. Fluid Mech. 2011, 5, 406–415. [Google Scholar] [CrossRef] [Green Version]
- Wu, Z.; Hao, J.; Lu, J.; Xu, L.; Hu, G.; Floryan, J.M. Small droplet bouncing on a deep pool. Phys. Fluids 2020, 32, 012107. [Google Scholar] [CrossRef]
- Rodriguez, F.; Mesler, R. The penetration of drop-formed vortex rings into pools of liquid. J. Colloid Interface Sci. 1988, 121, 121–129. [Google Scholar] [CrossRef]
- Pumphrey, H.C.; Elmore, P.A. The entrainment of bubbles by drop impacts. J. Fluid Mech. 1990, 220, 539–567. [Google Scholar] [CrossRef]
- Prosperetti, A.; Oguz, H.N. The impact of drops on liquid surfaces and the underwater noise of rain. Annu. Rev. Fluid Mech. 1993, 25, 577–602. [Google Scholar] [CrossRef]
- Leng, J.L. Splash formation by spherical drops. J. Fluid Mech. 2001, 427, 73–105. [Google Scholar] [CrossRef]
- Brutin, D. Drop impingement on a deep liquid surface: Study of a crater’s sinking dynamics. C. R. Mec. 2003, 331, 61–67. [Google Scholar] [CrossRef]
- Bisighini, A.; Cossali, G.E.; Tropea, C.; Roisman, I.V. Crater evolution after the impact of a drop onto a semi-infinite liquid target. Phys. Rev. E 2010, 82, 036319. [Google Scholar] [CrossRef] [PubMed]
- Fedorchenko, A.I.; Wang, A.-B. On some common features of drop impact on liquid surfaces. Phys. Fluids 2004, 16, 1349–1365. [Google Scholar] [CrossRef]


Publisher’s Note: MDPI stays neutral with regard to jurisdictional claims in published maps and institutional affiliations. |
© 2022 by the authors. Licensee MDPI, Basel, Switzerland. This article is an open access article distributed under the terms and conditions of the Creative Commons Attribution (CC BY) license (https://creativecommons.org/licenses/by/4.0/).