Article

On the Rarefied Thermally-Driven Flows in Cavities and Bends

1
High Performance Computing (HPC) Laboratory, Department of Mechanical Engineering, Ferdowsi University of Mashhad, Mashhad 91775-1111, Iran
2
State Key Laboratory for Strength and Vibration of Mechanical Structures, International Center for Applied Mechanics (ICAM), School of Aerospace Engineering, Xi’an Jiaotong University (XJTU), Xianning West Road, Beilin District, Xi’an 710049, China
*
Author to whom correspondence should be addressed.
Fluids 2022, 7(11), 354; https://doi.org/10.3390/fluids7110354
Submission received: 6 October 2022 / Revised: 14 November 2022 / Accepted: 16 November 2022 / Published: 18 November 2022

Abstract

:
This study examined rarefied thermally-driven flow in a square cavity (Case 1) and rectangular bend (Case 2), with various uniform wall temperatures in two dimensions. We employed the direct simulation Monte Carlo (DSMC) to solve problems with a wide range of Knudsen numbers Kn = 0.01 to 10, and the discrete unified gas kinetic scheme (DUGKS) solver was used at Kn = 0.01. The scenario was that, in case 1, the bottom side and its opposite were set hot, and the other sides were set cold. Diffuse reflector boundary conditions were set for all walls. The imposed temperature differences created four primary vortices. The results of the continuum set of equations of the slow non-isothermal flow (SNIT) solver proved that the primary vortices in the square cavity were caused by nonlinear thermal stress effects, and other smaller vortices appearing at Kn = 0.01, 0.1 were brought about by thermal creep processes. As the Kn increased, vortices generated by thermal creep disappeared, and eddies created by nonlinear thermal stress occupied the cavity. In case 2, i.e., a rectangular bend, two sides were set cold, and the others were hot. Two primary vortices were formed, which were caused by nonlinear thermal stress effects. The direction of streamlines in the two main vortices was opposite, from the warm to the cold zone, as some eddies on the left were counterclockwise, and others were clockwise.

1. Introduction

A thorough understanding of the flow and heat pattern process in small-scale devices is crucial, due to the rapid development seen in the production of these devices. Broad categories of flow rarefaction regimes, including continuum, slip, transition, and free molecular regimes may occur in extra-small devices. The ratio of the gas mean free path to its characteristic length, in gas conduits or Kn = λ/L, is used to calculate the Knudsen number. This is the most crucial parameter for determining the rarefaction in a gas flow. A Knudsen number magnitude classification governs the rarefied gas flow regime [1]. If Kn < 0.001, the continuum theory is accurate. The slip regime is defined as 0.001 < Kn < 0.1, and the range of 0.1 < Kn < 10 is the transition regime. If Kn > 10, the flow is classified as free molecular. This categorization is based on the flow in long isothermal tubes; i.e., the border between above mentioned the regimes should be determined numerically or empirically for any given geometry, because it is not strictly defined [2].
The conventional Navier–Stokes–Fourier equations start to vary from the accurate solution when the deviation from equilibrium starts [1]. The Navier–Stokes–Fourier (NSF) equations can be used in conjunction with appropriate boundary conditions for the temperature jump and slip velocity at the slip regime in simple geometries. When the Knudsen number increases, employing the NSF equations yields an incorrect answer, necessitating the use of more accurate strategies, based on the Boltzmann equation. Rarefied gas flows can be modeled at various rarefaction conditions using the direct simulation Monte Carlo (DSMC) technique [3,4,5,6,7,8].
In recent years, thermally-driven flows in rarefied regimes have drawn widespread attention from researchers. Different types of thermally driven flows, including thermal edge flow, nonlinear thermal stress flow, thermal stress slip flow, and thermal creep flow (in the first-order and second-order modes), were seen and documented in rarefied flow regimes [9]. The rarefied flow produced near a sharp edge was considered by Aoki et al. [10]. Inside a vessel container a cold plate was placed. They demonstrated that a steady temperature field causes a constant flow field in this domain. Thermal edge flow is the name given to the induced flow [9]. Another attempt was made by Aoki et al. [11], who considered the flow caused by alternative wall temperatures. In this case, gas was contained within a square hollow, and the left and right walls of the cavity were each set to a different temperature. They discovered that as the Knudsen numbers decrease, the flow field is inclined to transform into a limiting area. The significant flow zone is constrained to a single location when the wall temperature changes, moving away from the continuum limit.
Han et al. [12] used various techniques to study flow, driven by different temperature gas flows in micro/nano-scale conduits. In two scenarios, Taguchi and Aoki [13] examined thermally driven gas flow next to a heated flat plate placed in a container: In the first instance, the plate was heated on both sides, causing thermal edge flow. In the second instance, the plate was only heated on one side, while remaining cool on the other, creating radiometric flow. They discussed the normal stress behavior and the causes of the radiometric force. Another attempt was made by Taguchi and Aoki [14], who employed several plates to simulate rarefied gas flowing down a long channel. The array moves toward the cold side when each plate heats up, due to the radiometric force acting on one side of each plate. Taguchi and Tsuji [15] used kinetic theory to investigate how a small channel impacted the motion of a mildly rarefied gas with a discontinuous surface temperature. They developed a Stokes set of equations to describe the macroscopic behavior of the gas in the channel. The flow of gas around a pair of cold/hot arms was examined by Wang et al. [16] using the DSMC technique, and a sophisticated surface–gas interaction model. Zeng et al. [17] suggested a double-plate arrangement as an alternative to a single radiometric plate. They used molecular kinetics and DSMC to study the flow around the double plate for a range of gap-to-radius ratios and plate temperatures.
Roohi and colleagues looked into a variety of thermally driven flows in diverse situations [18,19,20,21,22,23], such as the thermal creep flow in a square cavity [18], radiometric flow around ratchets and plates with varying surface qualities [19,20,21,22], and nonlinear thermal stress flow in an elliptical conduit [23].
Several shapes of cavity flow have been used in numerous industrial applications, among the varied geometries in MEMS/NEMS (micro/nano-electro-mechanical systems). In the rarefied regime, various lid-driven cavity flows were considered [24,25,26,27,28,29,30,31,32,33,34]. The authors presented simulation results for lid-driven square [24,25,26,27,28,30,31], lid-driven trapezoidal [32], and lid-driven triangular [29] cavities. There have been reports on the behavior of textured microchannels and micro-ridges [33,34].
The current work initially considered the thermally-driven flow in two cases: in a square cavity and in a rectangular bend, as a continuation of the two streams mentioned above. A few research works [11,18,27] have already reported the investigation of thermally-driven flow in square cavities and rectangular enclosures; however, there has been no analysis of the thermally-driven flows in rectangular bends and square cavities with different wall temperatures on the lateral sides. There are different temperatures on the lateral sides of the cavity, as the opposite sides have the same temperature in the cavity and geometry of the rectangular bend, which has not been investigated. As a result, the issue is significantly more unique than the example of coaxial elliptic cylinders with a smooth border described in [23].
Two different cases were considered in this paper: first, in a square cavity, the opposite sides (top and bottom) were heated, while the two other sides were kept cool. As a result, as the flow moves from the cavity’s top or bottom to its lateral sides, the temperature changes. In the second case, a new geometry was investigated, as two sides were set hot and the others were cold. Every wall is a diffusive reflector in both cases. In both cases, all walls had no outside forces and zero velocity. The slow non-isothermal (SNIT) solver, DSMC method, and discrete unified gas kinetic scheme (DUGKS) were applied to obtain the solution. Although the DSMC technique is applicable to the entire flow rarefaction range, the DUGKS solver was used at low Knudsen numbers, because the DSMC method is time-consuming in the low Kn range. The DUGKS family solver [35] was compared to Navier–Stokes equations in the cavity [36], and the results matched well. To detect the origin of the primary vortices that appeared in both cases, we employed the SNIT solver to show that these vortices are caused by nonlinear thermal stress. Monatomic argon gas’s hydrodynamic and thermal properties are reported. The literature review mentioned above indicated that there have been no previous studies on the flow field and thermal behavior in rarefied thermally-driven geometries considered in both cases in this paper. Thermally-driven square cavities with the same temperature on opposite sides and the geometry of rectangular bends with different side temperatures have not been studied. The rarefied flow in these geometries exhibits interesting physical phenomena that make their study crucial for the research community.

2. Techniques

2.1. DSMC, or Direct Simulation Monte Carlo Method

Here, a molecular-based method known as DSMC is used to handle the Boltzmann equation [37,38,39,40,41,42,43]. This is the Boltzmann equation:
f t = D f + Q f , f * ,
where the velocity distribution function of particles moving at velocity V is represented by f = f(V,x,t) or f * , and operators D and Q are operators defining the particle convection and binary interactions, respectively, with the following forms:
D = V . ,
Q = f * f f * f B g , θ d Ω θ d x
Post-collision distribution functions are indicated by primes, B g , θ , which are dependent on the intermolecular potential, θ . The variation in particle velocity caused by an intermolecular collision is expressed by the unit vector, the relative molecular velocity is expressed by g, and dΩ is a stable angle component in the direction of θ . The discrete velocity distribution function at time t k is separated using the following splitting methodology in the traditional DSMC method, to offer the Boltzmann equation solution at time t k .
f t k + δ t , x t k , ξ t k + δ t = S Q δ t , h f [ t k , x t k , ξ t k ] ,
f t k + δ t , x t k + δ t , ξ t k + δ t = S D δ t f t k + δ t , x t k , ξ t k + δ t ,
where δ t represents the time step and operators S Q δ t , h and S D δ t are the DSMC numerical methods, and where these algorithms, respectively, approximate the collision and free molecular motion terms in the Boltzmann equation [37]. In addition to being derived using the Boltzmann equations, Stefanov’s N-particle equation [37] can also be used to derive DSMC. The DSMC technique is applicable across the whole flow rarefaction range, from a Kn approaching zero to infinite.
We used OpenFOAM-2.4.0-Strath’s dmcFoamStrath, a recently released variant of the original DSMC solver [44]. The VHS (variable-hard-sphere) collision model was used to describe intermolecular collisions. We used a Maxwellian velocity distribution function at the surface temperature to calculate the particle velocities in diffusive walls. This research demonstrates that simulation outcomes are independent of the grid size and particle number per cell (PPC). Compared to the averages of the collision time and transit time, we chose a tiny time step. Argon was the gas employed in the simulation; its molecular weight is 6.63 × 10⁻²⁶ Kg, its diameter is 4.17 × 10⁻¹⁰ m, and its viscosity–temperature index is ω = 0.81 [3]. Tref = 273 K was chosen to serve as the reference temperature.

2.2. DUGKS, or Discrete Unified Gas Kinetic Scheme

Non-equilibrium flows were modeled and simulated using the DUGKS approach. This is based on the Bhatnagar–Gross–Krook (BGK) and Shakhov models. It was discovered that DUGKS performed better computationally for low-speed flow at low Knudsen values [45,46], and we compared the DUGKS and DSMC approaches in [21]. Boltzmann’s equation and the Shakhov collision model were combined to provide the governing equation:
f t + V . f = p μ f S f ,
where p and μ stand for pressure and the viscosity coefficient, respectively. The definition of time of relaxation is given by τ and is represented as 1 / τ = p / μ . The Maxwell distribution function plus a heat flux adjustment component form the formula for Shakhov’s distribution function:
f S = f M 1 + 1 Pr c . q 5 p R T c 2 R T 5 ;       f M = ρ 2 π R T 3 / 2 exp c 2 2 R T ,
where the Prandtl number, particular gas constant, unusual velocity, and fluid velocity are represented by Pr, R, c = V-U, and U, respectively. The DUGKS is a numerical technique used to resolve a simulated 2-D Boltzmann equation, i.e., by displaying reduced distribution functions, the z-direction dependence of the velocity distribution function is eliminated. References [45,46] goes into more detail on how to solve Equation (6) in the DUGKS.
The primary distinction between DUGKS and the unified gas kinetic scheme (UGKS) is the adoption in DUGKS of a reforming distribution function that incorporates both the normal distribution function and the collision term. The distribution function and collision term are connected using this technique. Thus, at a cell interface, the distribution function’s updating procedure and reconstruction are made simpler; i.e., together, the distribution function and collision term are taken into account. It should be remembered that, provided an appropriate discretization in physical space and velocity space is offered, the DUGKS scheme applies across the entire range of flow rarefaction from an Kn approaching zero to infinite. At large Knudsen values, the DUGKS solution could actually take longer than DSMC, because a refined velocity space is needed.

2.3. SNIT (Slow Non-Isothermal Thermal)

The addition of thermal stress variables in the momentum equation of the continuum set of equations served as the foundation for the construction of slow non-isothermal equations [47,48,49]. The Boltzmann system is described by these equations, as an asymptotic theory for small mean free time and small mean free path [9]. The general behavior of the mildly rarefied gas is described by equations of the type used in fluid dynamics. Asymptotic analysis, based on Knudsen numbers, Kogan–Galkin–Friedlander (KGF) power series expansion, and evaluation of the order of magnitude are used to create the following second-order equations for continuum flows [9,48,49]. Following KGF expansion, macro-variables such as velocity and temperature are enlarged in terms of the Knudsen number. The time-independent Boltzmann equation’s solution, however, can be split up into various length scales at minimal Knudsen numbers. Take into account the separation shown below:
f = f H + f k n
where fH is the scale O(1) fluid-dynamic component of the velocity distribution function and f k n   is the Knudsen-layer adjustment on the scale O(Kn). In a power series of Kn, the distribution function fH and the macroscopic variables hH = ρH, uiH, and TH can be extended as follows:
f H = f H 0 + f H 1 Kn + f H 2 Kn 2 + h H = h H 0 + h H 1 Kn + h H 2 Kn 2 +
We obtain the following system of equations of the fluid-dynamic type by substituting Equation (10) into the Boltzmann equation and taking into account terms of the same order of Kn:
p H 0 x i = 0
x i u i H 1 T H 0 = 0
p H 1 x i = 0
u i H 1 x i = γ 2 2 x i T H 0 T H 0 x i
x i u i H 1 u j H 1 T H 0 γ 1 2 x j T H 0 u i H 1 x j + u j H 1 x i 2 3 u k H 1 x k δ i j γ 7 T H 0 T H 0 x i T H 0 x j u j H 1 γ 2 T H 0 1 4 T H 0 x j = 1 2 p H 2 + x i + p H 0 F i H 2 2 T H 0
The energy and momentum equations are given in Equations (14) and (15), respectively, and P H 2 + is calculated as follows:
p H 2 + = p H 0 p H 2 + 2 γ 3 3 x k T H 0 T H 0 x k γ 7 6 T H 0 x k 2
The correlations shown above are general to all molecular models. The only thing a molecular model can predict is the transport coefficients. A gas–particle model can be used with the hard-sphere approach, to calculate the following non-dimensional coefficients [48]:
γ 1 = 1.270042427 γ 2 = 1.922284066 γ 3 = 1.947906335 γ 7 = 1.758705
The nonlinear thermal term, which has coefficients of γ 3 and γ 7 on the left side of Equation (14) and the right side of Equation (15), are of Knudsen number order. After setting up the initial values for velocity, pressure, and temperature, the momentum equation is first solved, and an iteration loop and trial-and-error procedure then determine the temperature. The momentum equation is solved using the SIMPLE (semi-implicit method for pressure linked equations) method, even though a thermal stress term is present, and the pressure and velocity are calculated. The SNIT equations are developed at the limit of Kn approaching 0. As a result, these equations are only used in this work at very low Kn, to demonstrate the origin of the vortices. With correct assumptions about the velocity distribution function, higher-order continuum equations can be derived from the Boltzmann equations [5]. Why do we require higher-order continuum-based equations? Since DSMC can solve the flow field throughout the complete range of Knudsen numbers. Continuum-based solutions explain the observed behavior, and the purpose of the current study’s use of higher-order SNIT continuum equations was to demonstrate that the nonlinear thermal stress effects are the primary cause of the central vortex emerging in both cases.

3. Geometry and Verification

3.1. The Geometry

Both geometries are shown in Figure 1. In case 1, the cavity is a 2-D square shape, with a side length of L. Opposite walls are at the same temperature, i.e., the top and bottom sides are hot at 1500 K, with adjacent cold walls at 300 K. Case 2 is a rectangular bend, with the top and right side hot, with a temperature of 1500 K, and the other walls are cold, with a temperature of 300 K. Both cases use a diffuse reflector for all borders as a boundary condition. We defined the Knudsen number in the introduction, and it is λ/L in this paper.

3.2. Grid and Particle Independence Test of DSMC Solver for Cases 1 and 2

In case 1, the square geometry was divided into small areas using structured cells. To obtain accurate results, the mean free path of gas molecules should be larger than the size of the cells [4,5,6,7,8], and the grid size and particle per cell (PPC) should be adequate. The normalized density and temperature are shown in Figure 2 at Kn = 0.1 on the cavity’s bottom side. We used three different grid sizes, with maximum cell sizes of 0.13λ, 0.1λ, and 0.07λ; i.e., grids of 5184, 10,000, and 20,164 cells were employed to show the grid independence of the solutions. Density and temperature were normalized to the average density and average temperature. The frames in Figure 2 show the nearly identical results for the three grid sizes; thus, the grid with 10,000 cells was used to solve this test case.
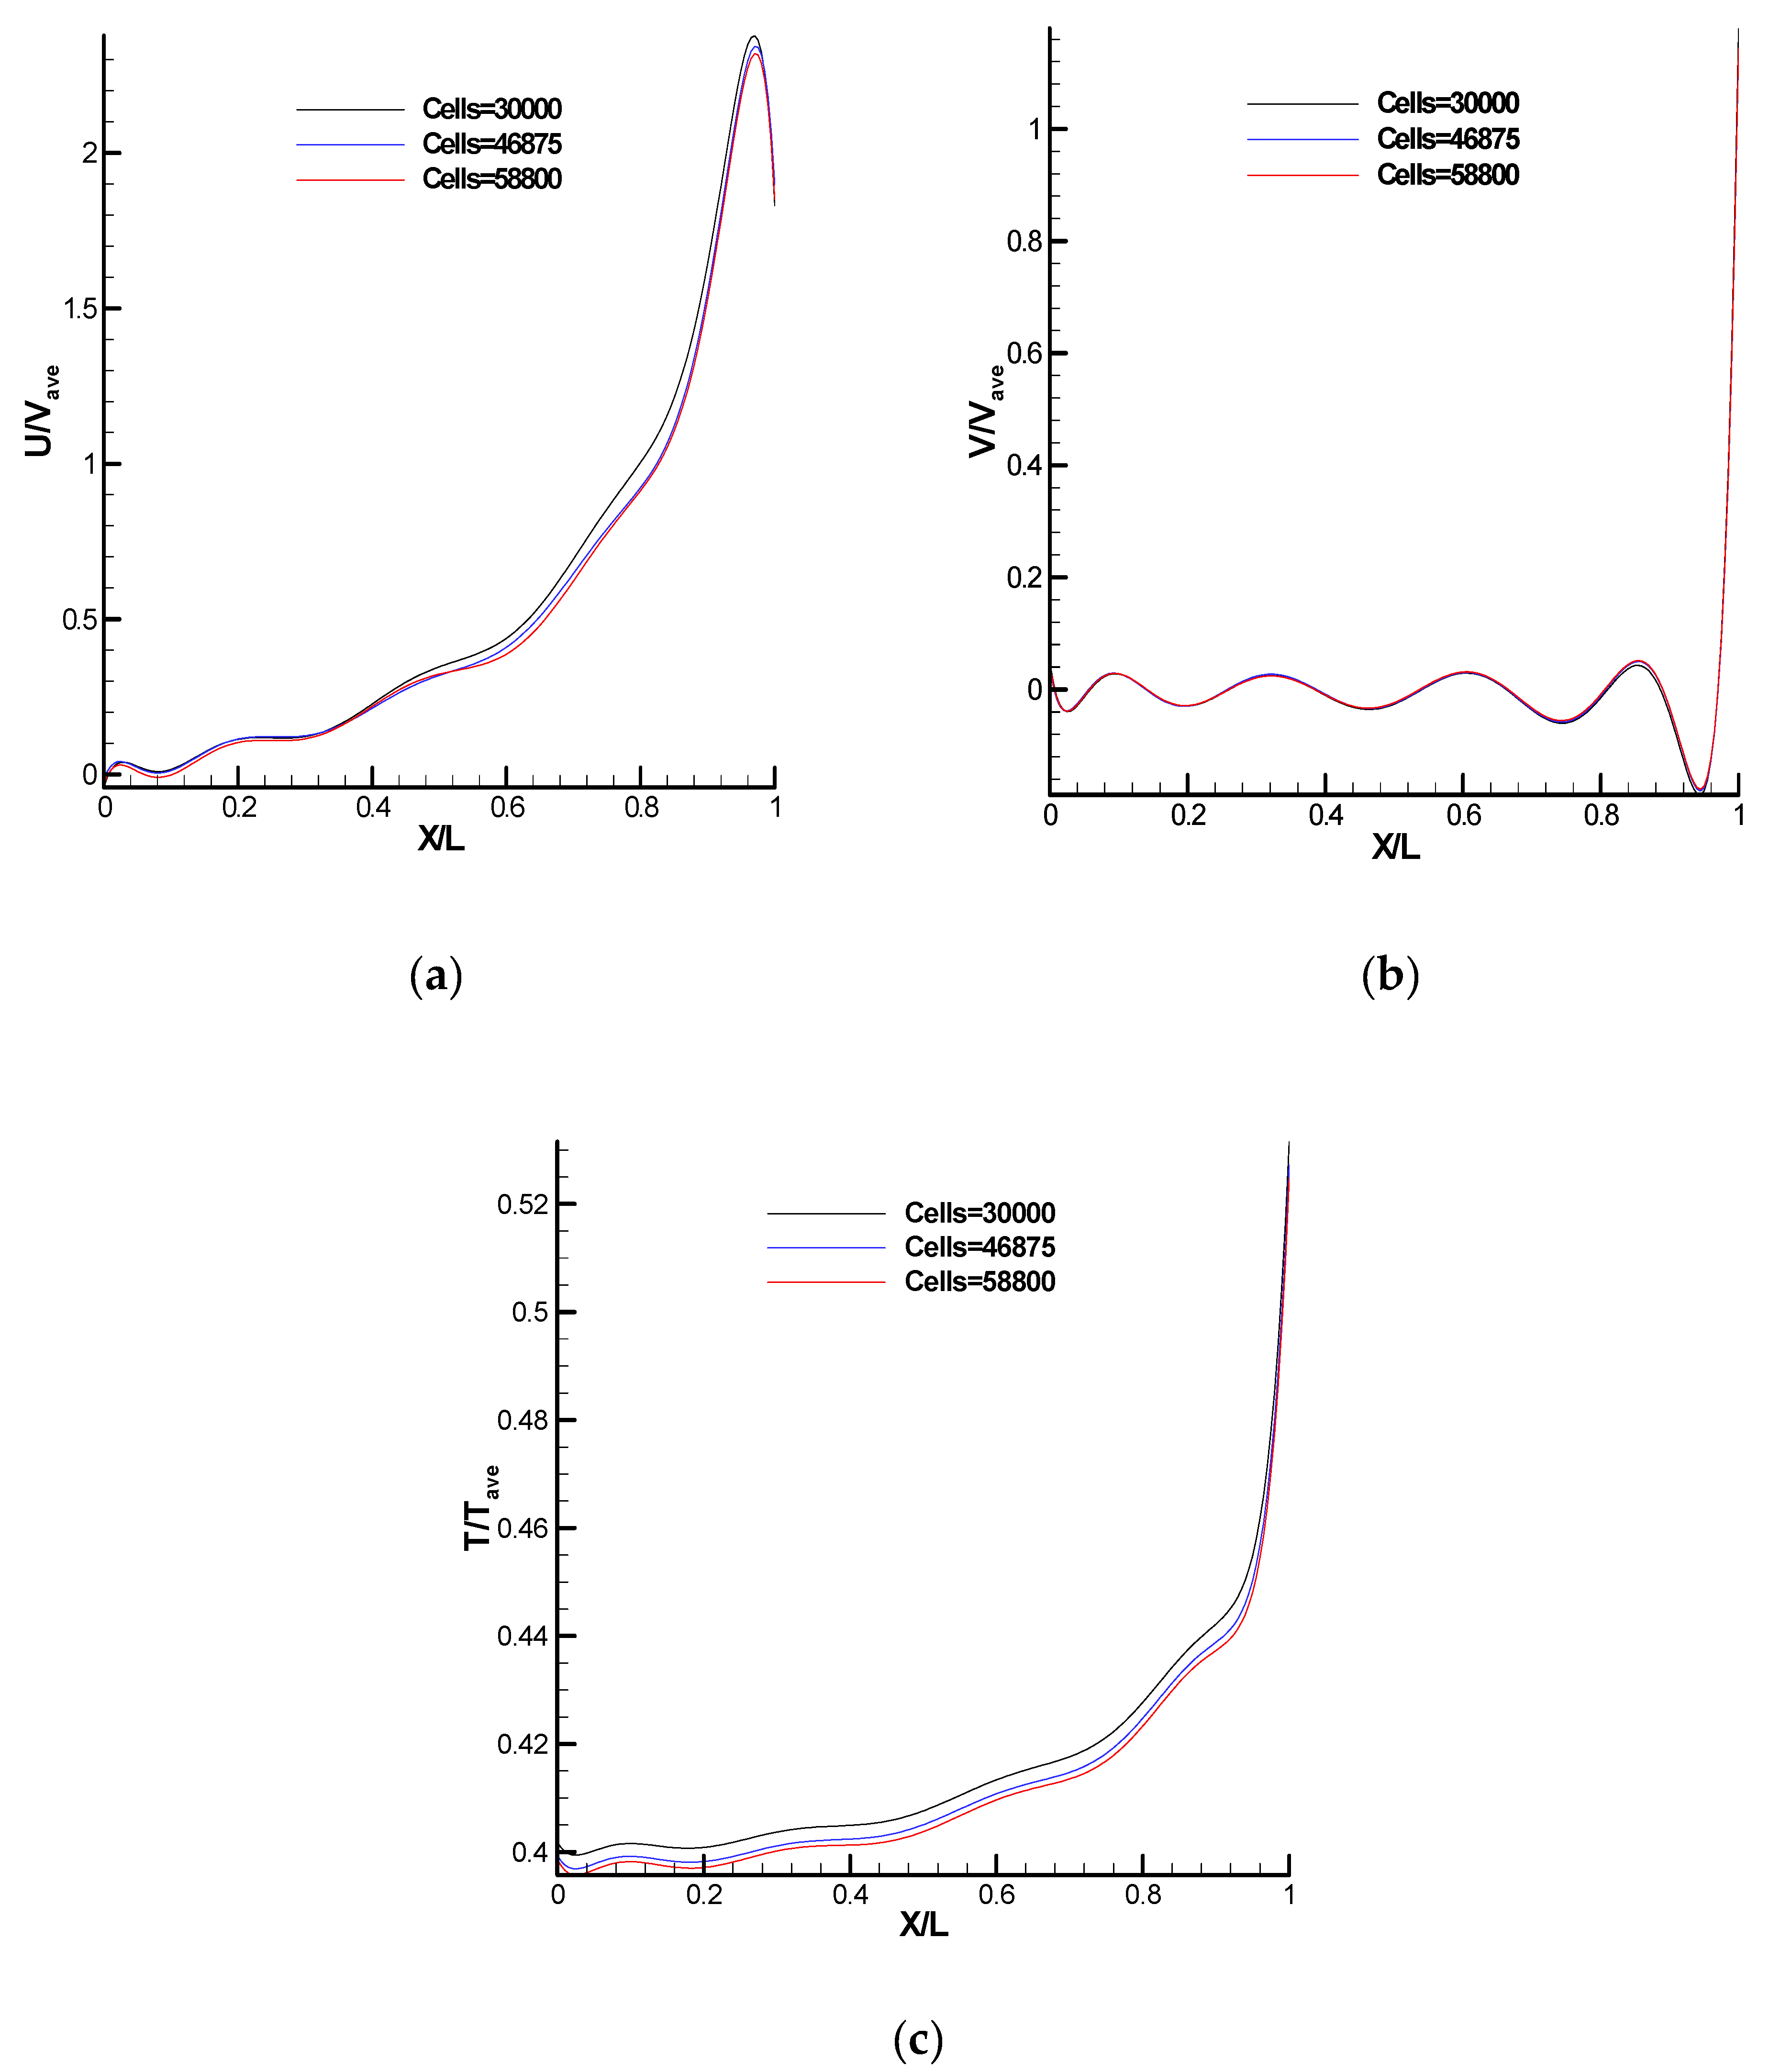
In case 2, the rectangular bend geometry was divided into small areas using structured cells. In the rectangular bend’s cold side, normalized velocity components in the x and y directions and temperature are shown in Figure 3 at Kn = 0.1. We used three different grid sizes, with maximum cell sizes of 0.1λ, 0.08λ, and 0.07λ; i.e., grids of 30,000, 46,875, and 58,800 cells. The velocity in the direction of x, y, and temperature were normalized to average velocity and average temperature, respectively. The frames in this figure show the nearly identical results for three grid sizes; thus, a grid with 30,000 cells was used to solve case 2.
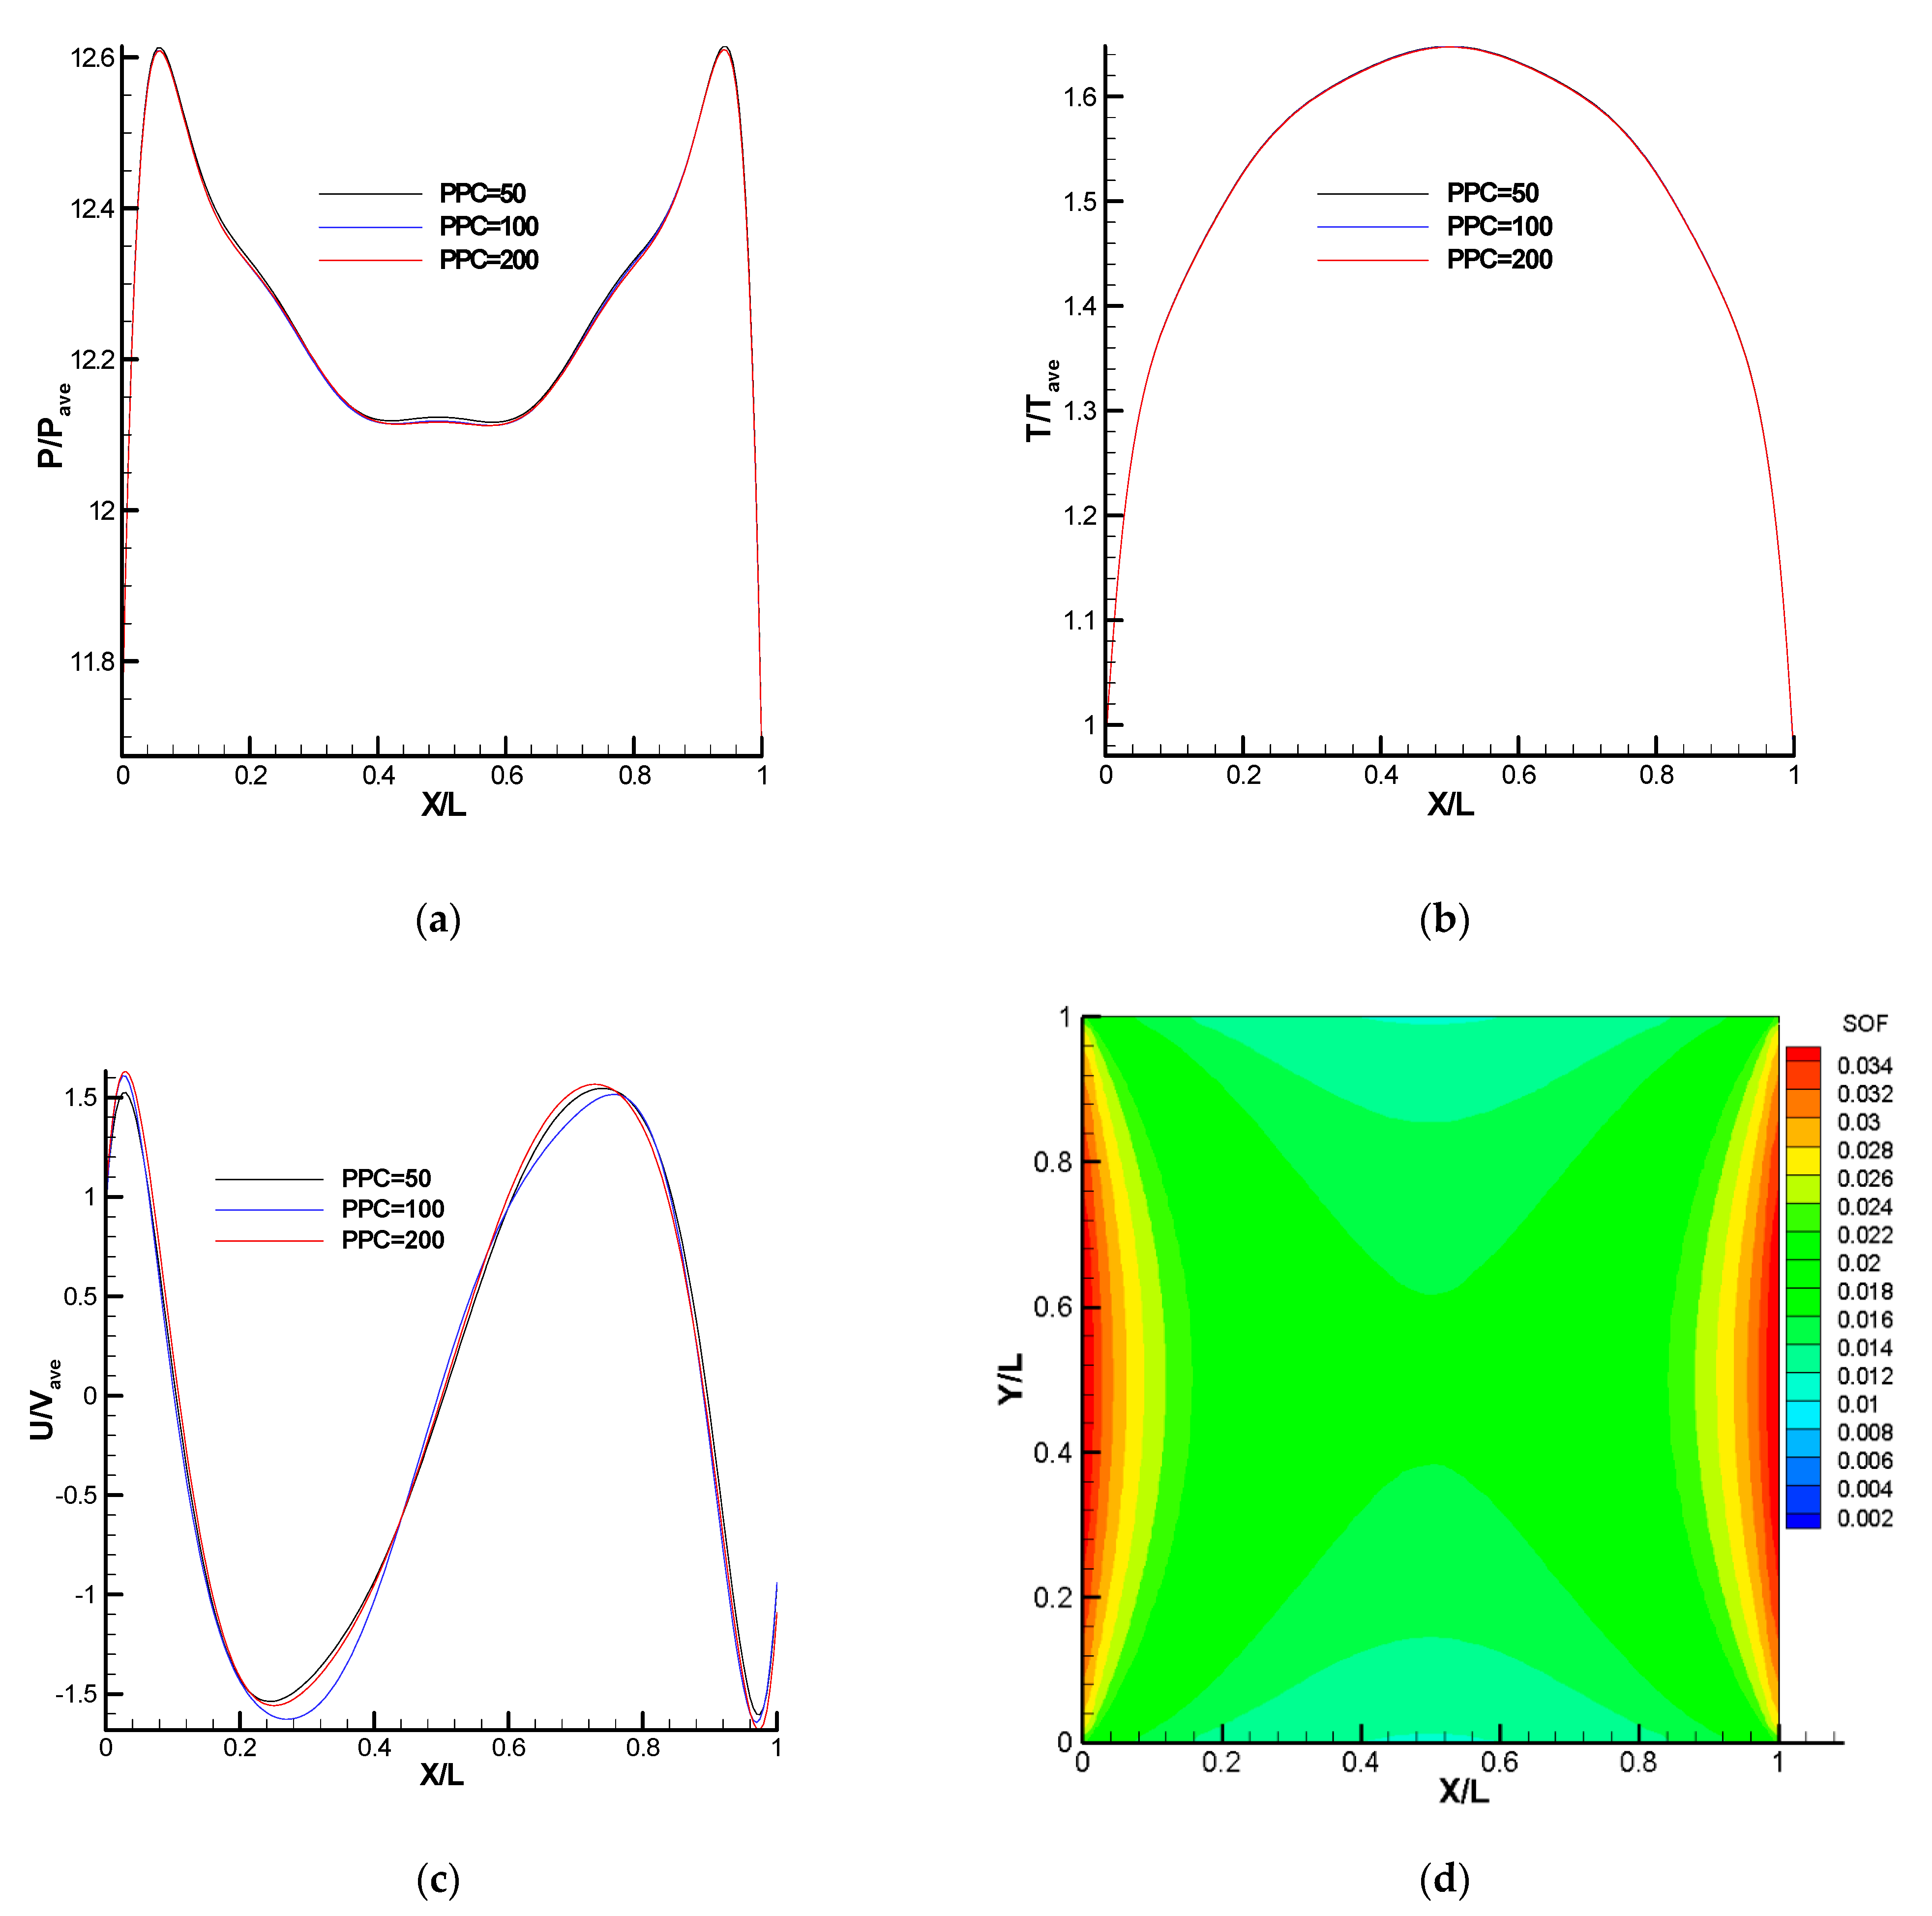
The particle per cell (PPC) independence test is reported in Figure 4 for case 1. PPC values of 50, 100, and 200 were used to analyze three cases. The chart demonstrates that there was little to no difference in the data from the three PPCs used for pressure and temperature. There was a slight difference between PPC = 100 and 50 and 200 at the dips and peaks in the U-velocity profile. Therefore, for the simulations described in this paper, we employed at least PPC = 100.
In the domain of one typical case at Kn = 0.1, Figure 4d displays the contours of the separation of free pathways, or SOF, which is the ratio of mean collision separation to mean free path. An excellent way to tell if enough particles are present is to look at the SOF contours. For a self-validated DSMC solution, the value of SOF should be less than 0.3, according to Bird [7]. As seen in the picture, this value is within 0.034, which means that the number of particles is more than adequate, and the collision was carried out accurately in the simulation domain. The other Knudsen number cases that were considered and simulated had a low SOF value.
The sample size of a typical simulation was 246 × 104. Thus, the error in the simulated velocity in this example is around 2.8% percent with PPC = 100 and Machave = 1.71 × 10⁻³ at Kn = 0.1.
E v 1 n s a m p l e s i z e P P C 1 Mach a v e γ = 1 2460000 × 100 × 1 1.71 × 10 3 × 1.67 2.8 %
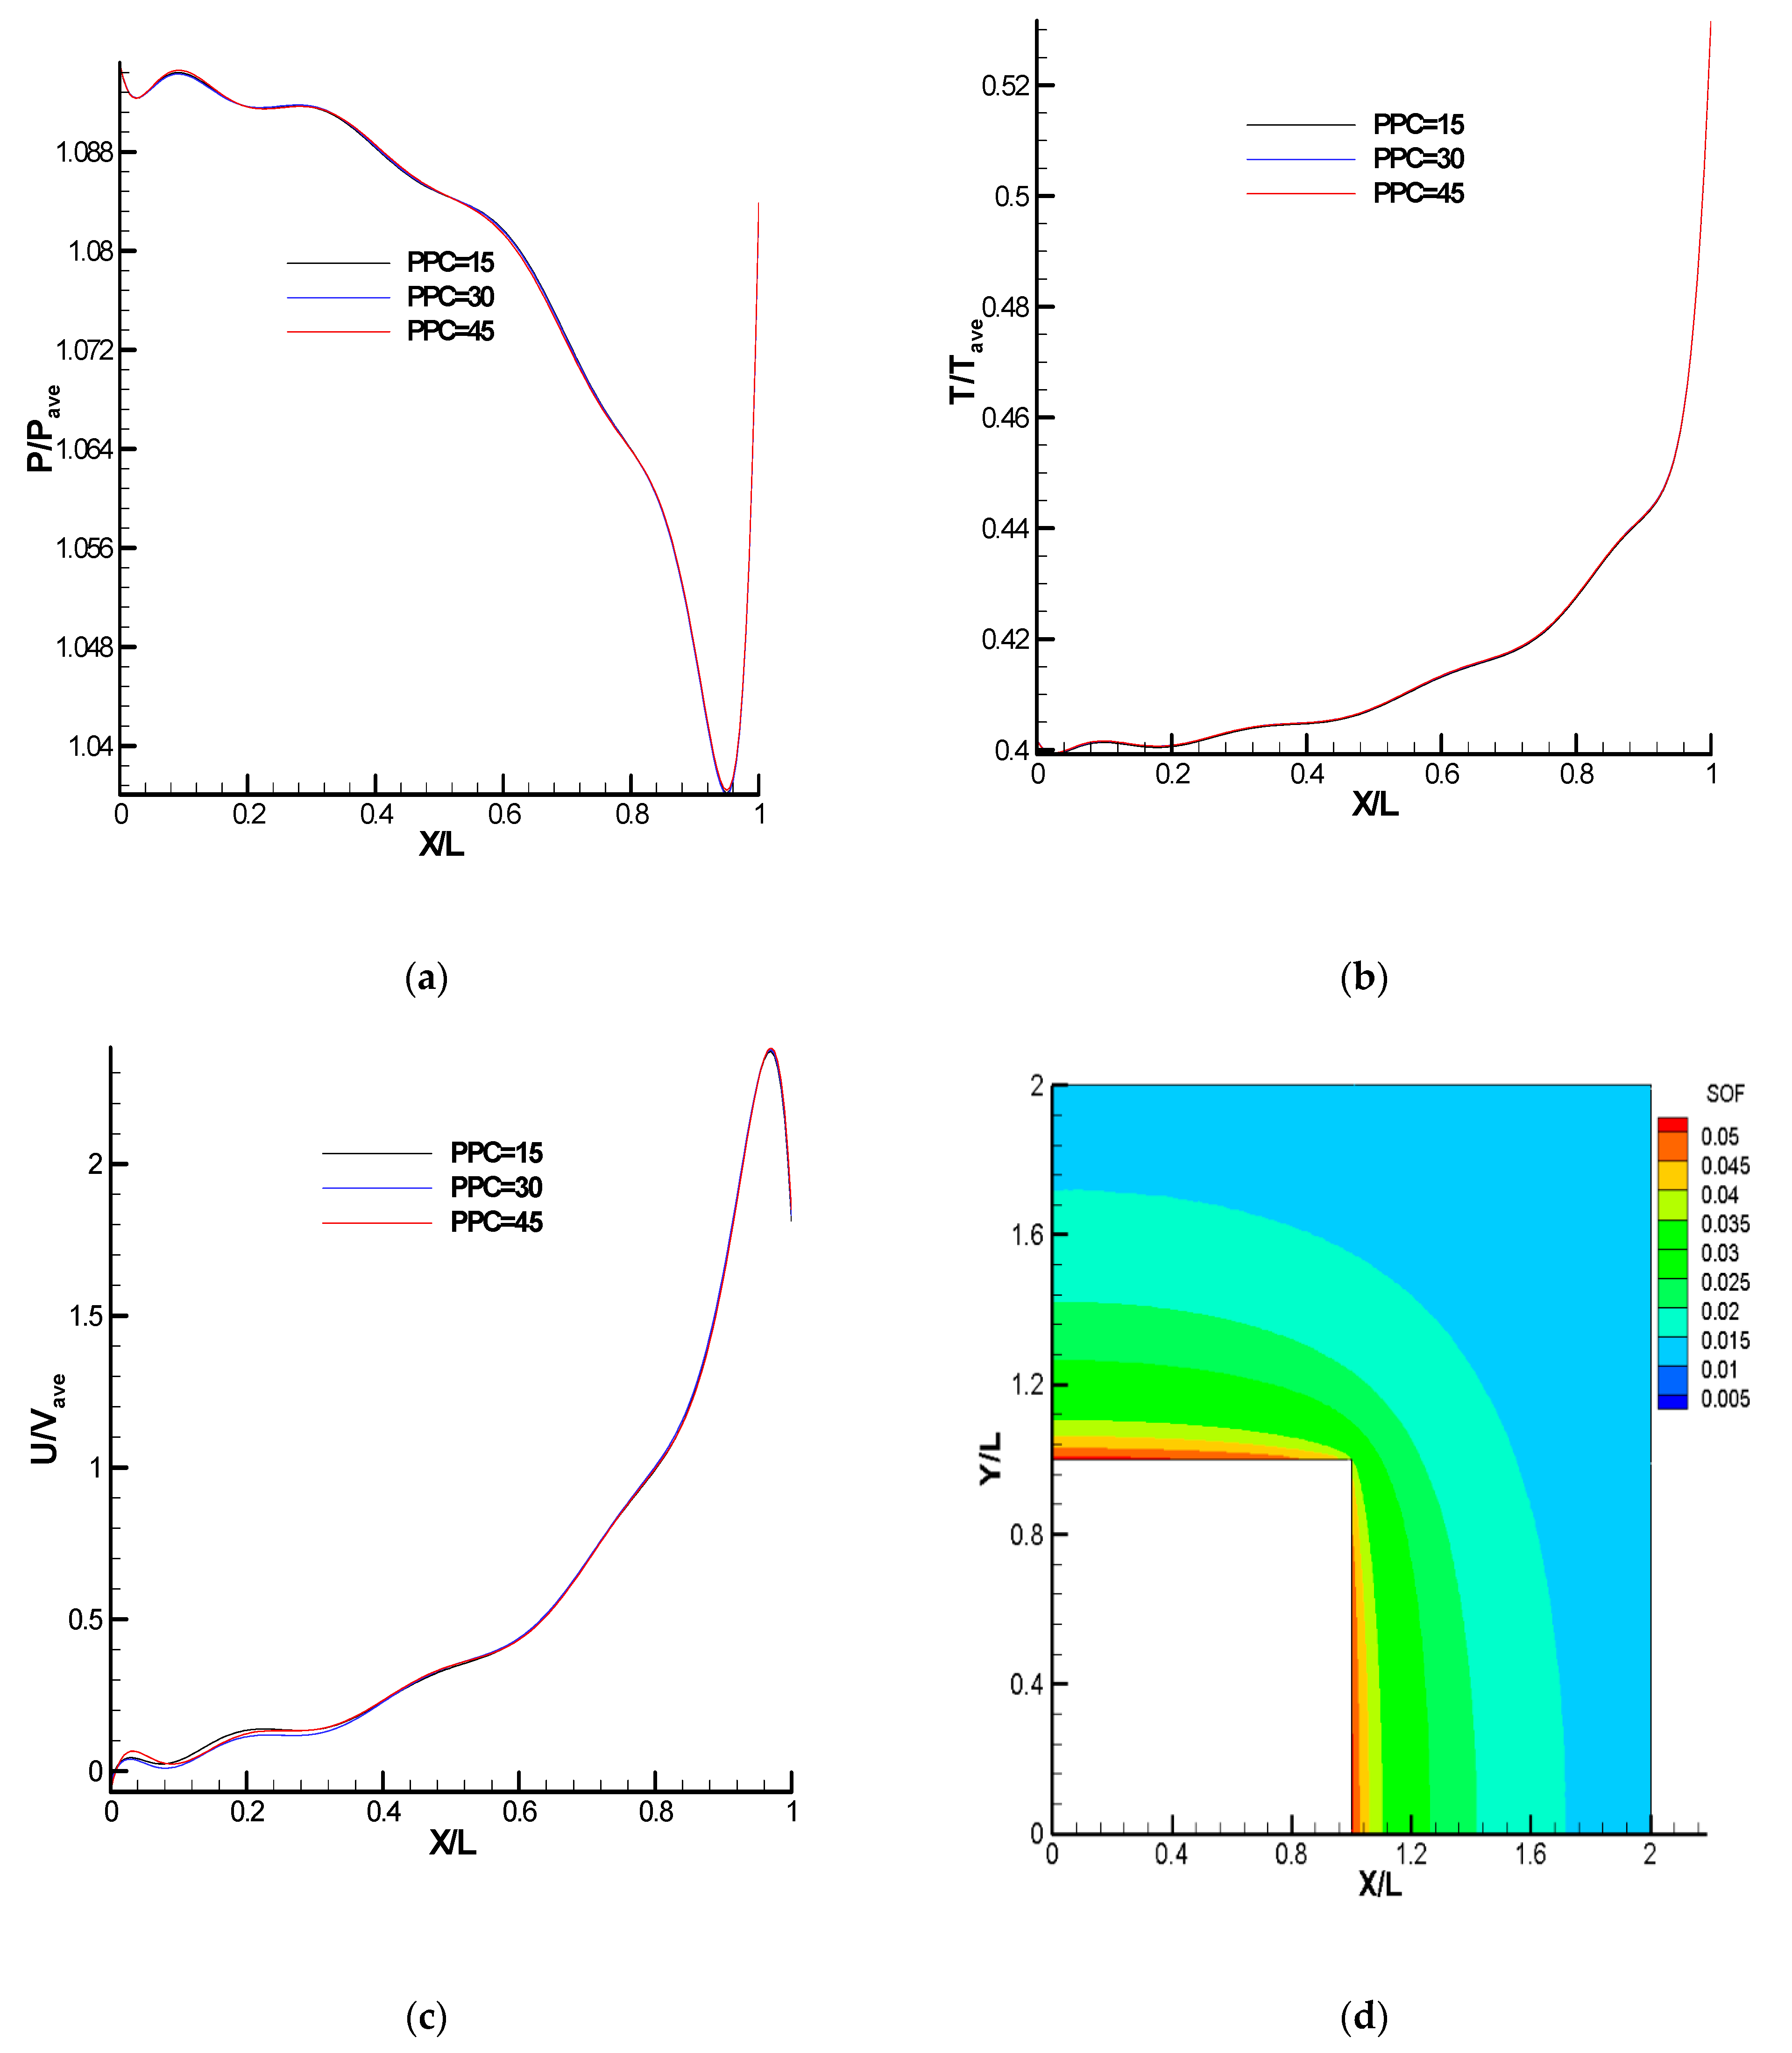
The PPC independence test is depicted in Figure 5 for case 2. PPC values of 15, 30, and 45 were used to analyze three simulations. The chart demonstrates there was little to no difference in the data from the three PPCs used for the pressure and temperature. There was a small difference at the beginning of the graph in the U-velocity. Therefore, for the simulations described in this paper, we employed at least PPC = 30. The contour separation of free pathways or (SOF) is displayed in Figure 5d. Similarly to case 1, values of SOF were less than 0.3, indicating particles were sufficient in this domain and the collisions were modeled accurately, according to Bird [7].
The sample size for a typical case 2 simulation was around 2587 × 104. The error in the simulated velocity in this example was approximately 0.6% percent, with PPC = 30 and Machave = 4.35 ×   10 3 at Kn = 0.1.
E v 1 n s a m p l e s i z e P P C 1 Ma a v e γ = 1 25870000 × 30 × 1 4.35 × 10 3 × 1.67 0.6 %

3.3. Verification of the DUGKS Solver for Cases 1 and 2

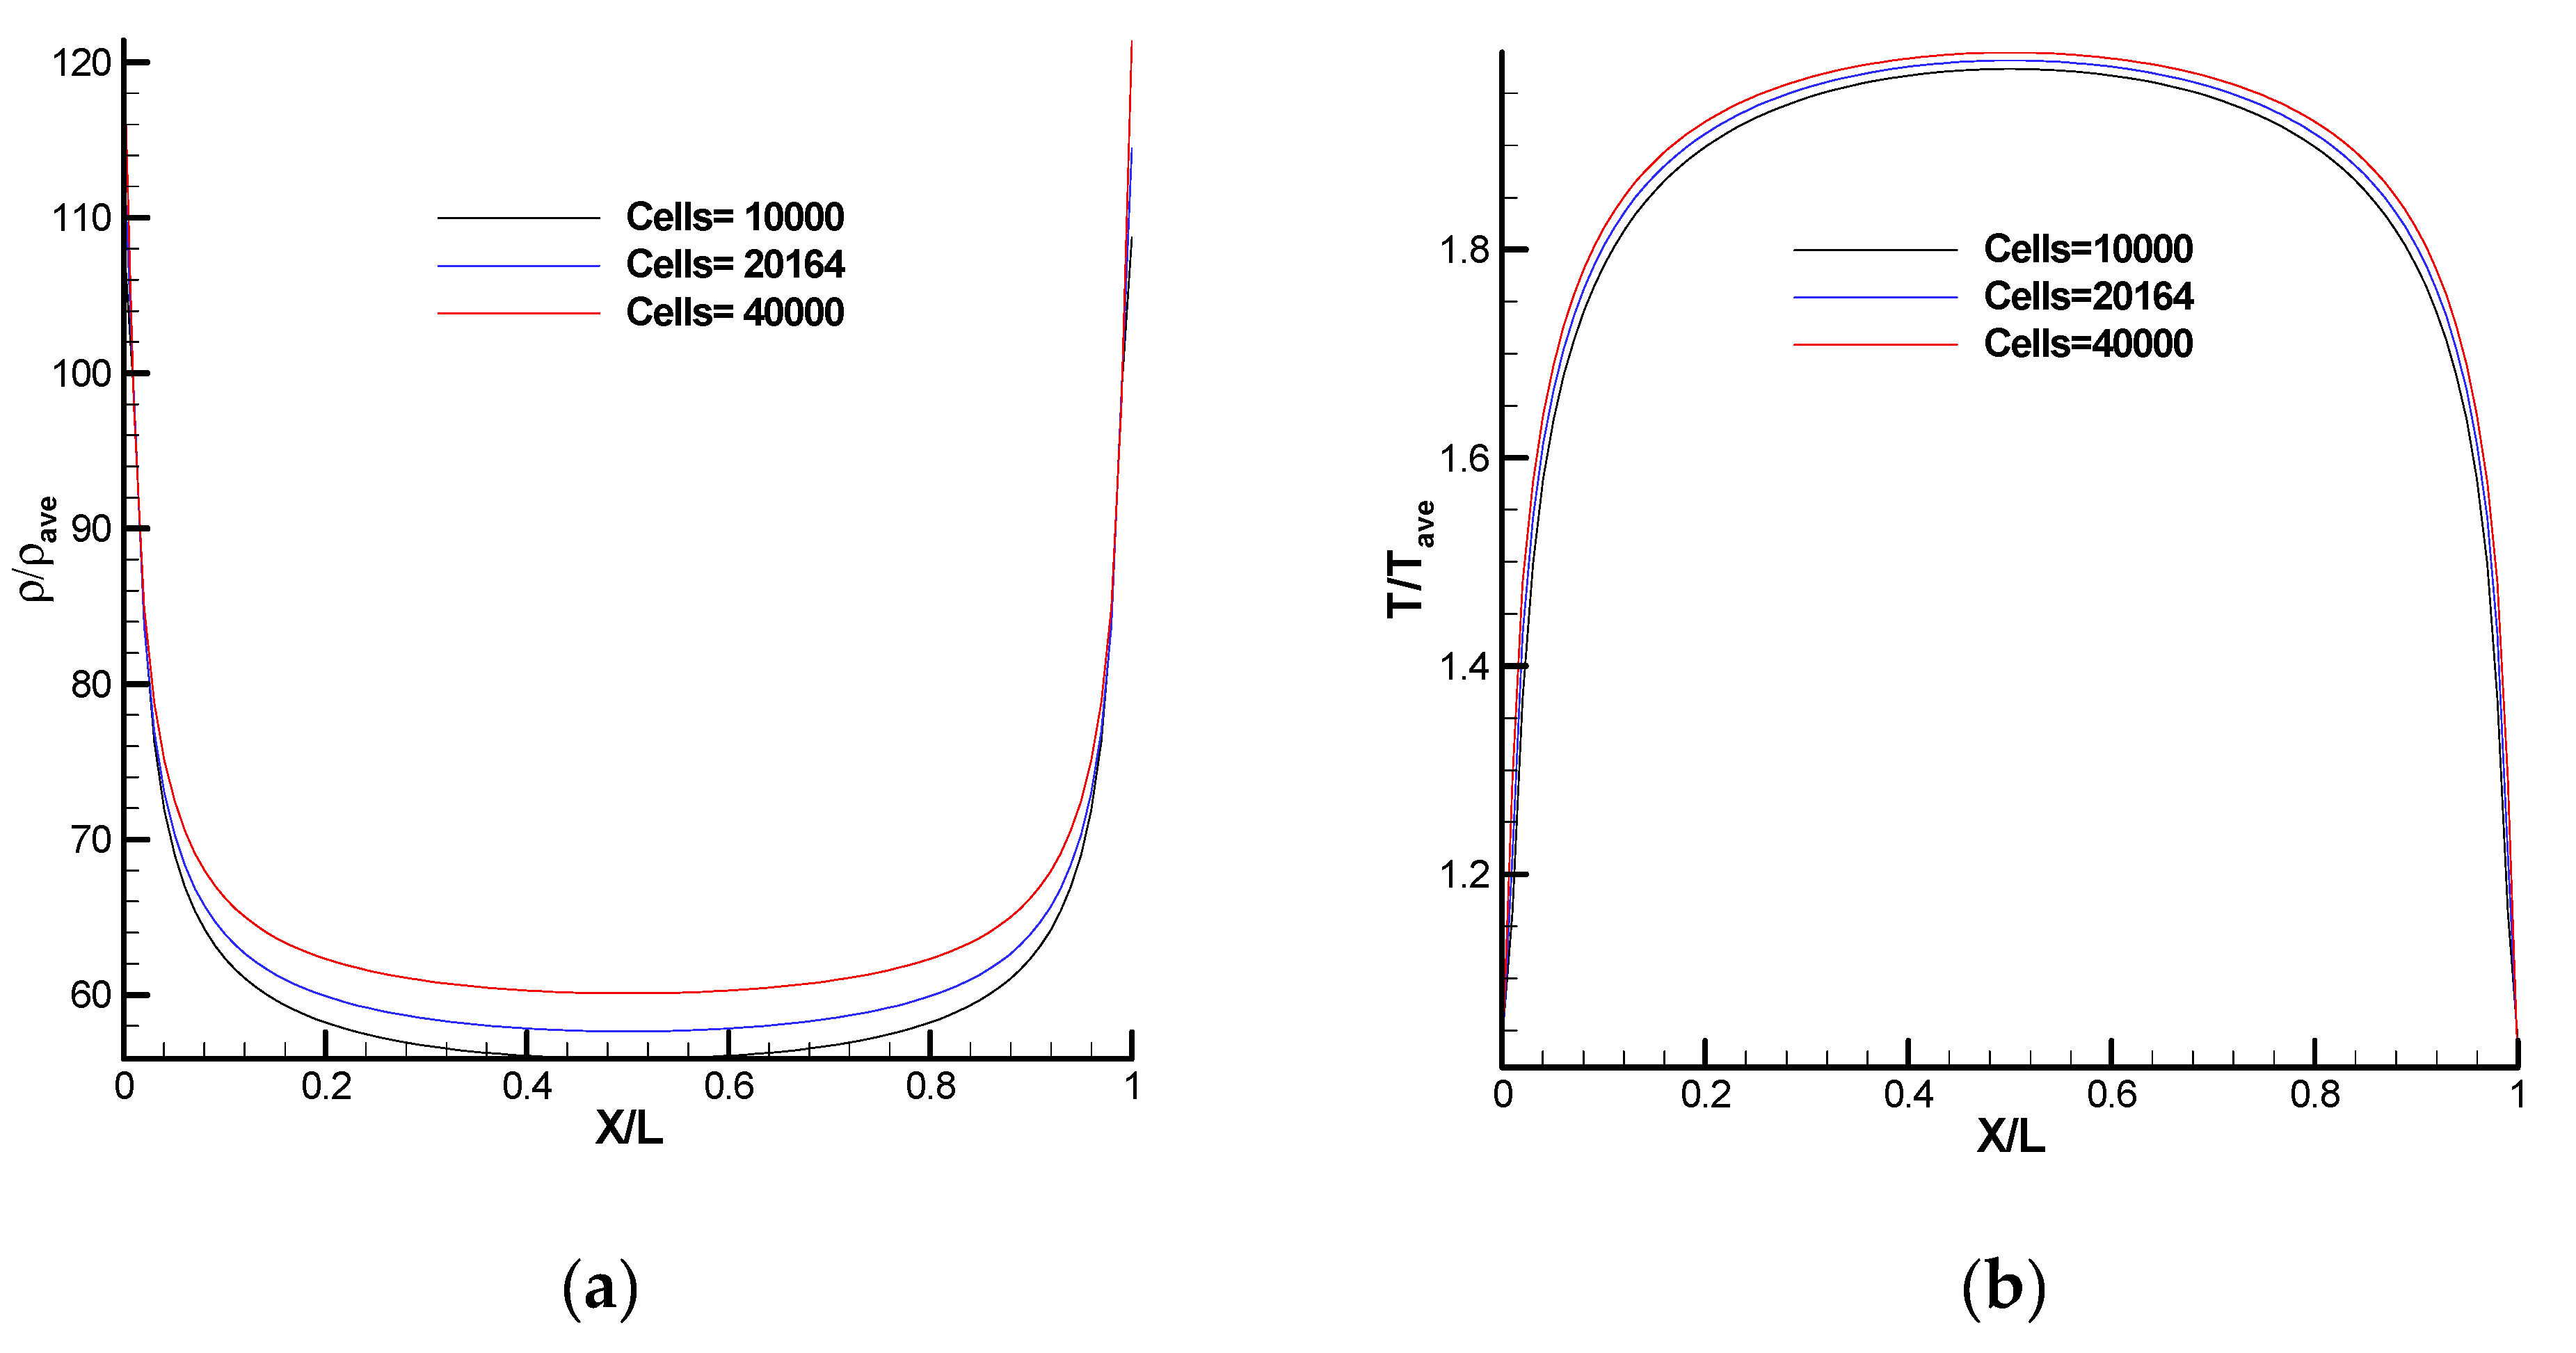
Since the DSMC solver is time-consuming at low Knudsen numbers, the DUGKS method was used to examine the properties of the flow field at small Kn for case 1. Three independent grid sizes of 10,000, 20,164, and 40,000 cells, with a Gauss–Hermit quadrature expansion using a velocity grid of 28 × 28 cells, were evaluated. All cases had a Courant–Friedrichs–Lewy (CFL) number of 0.5. Figure 6 displays the normalized density, temperature, and U-velocity distribution on the bottom side of the square cavity at Kn = 0.01. There was little difference in the three used grid sizes for density, temperature, and U-velocity, but the lines show a converging trend. Thus, we used a grid size of 10,000 cells to solve the problem.
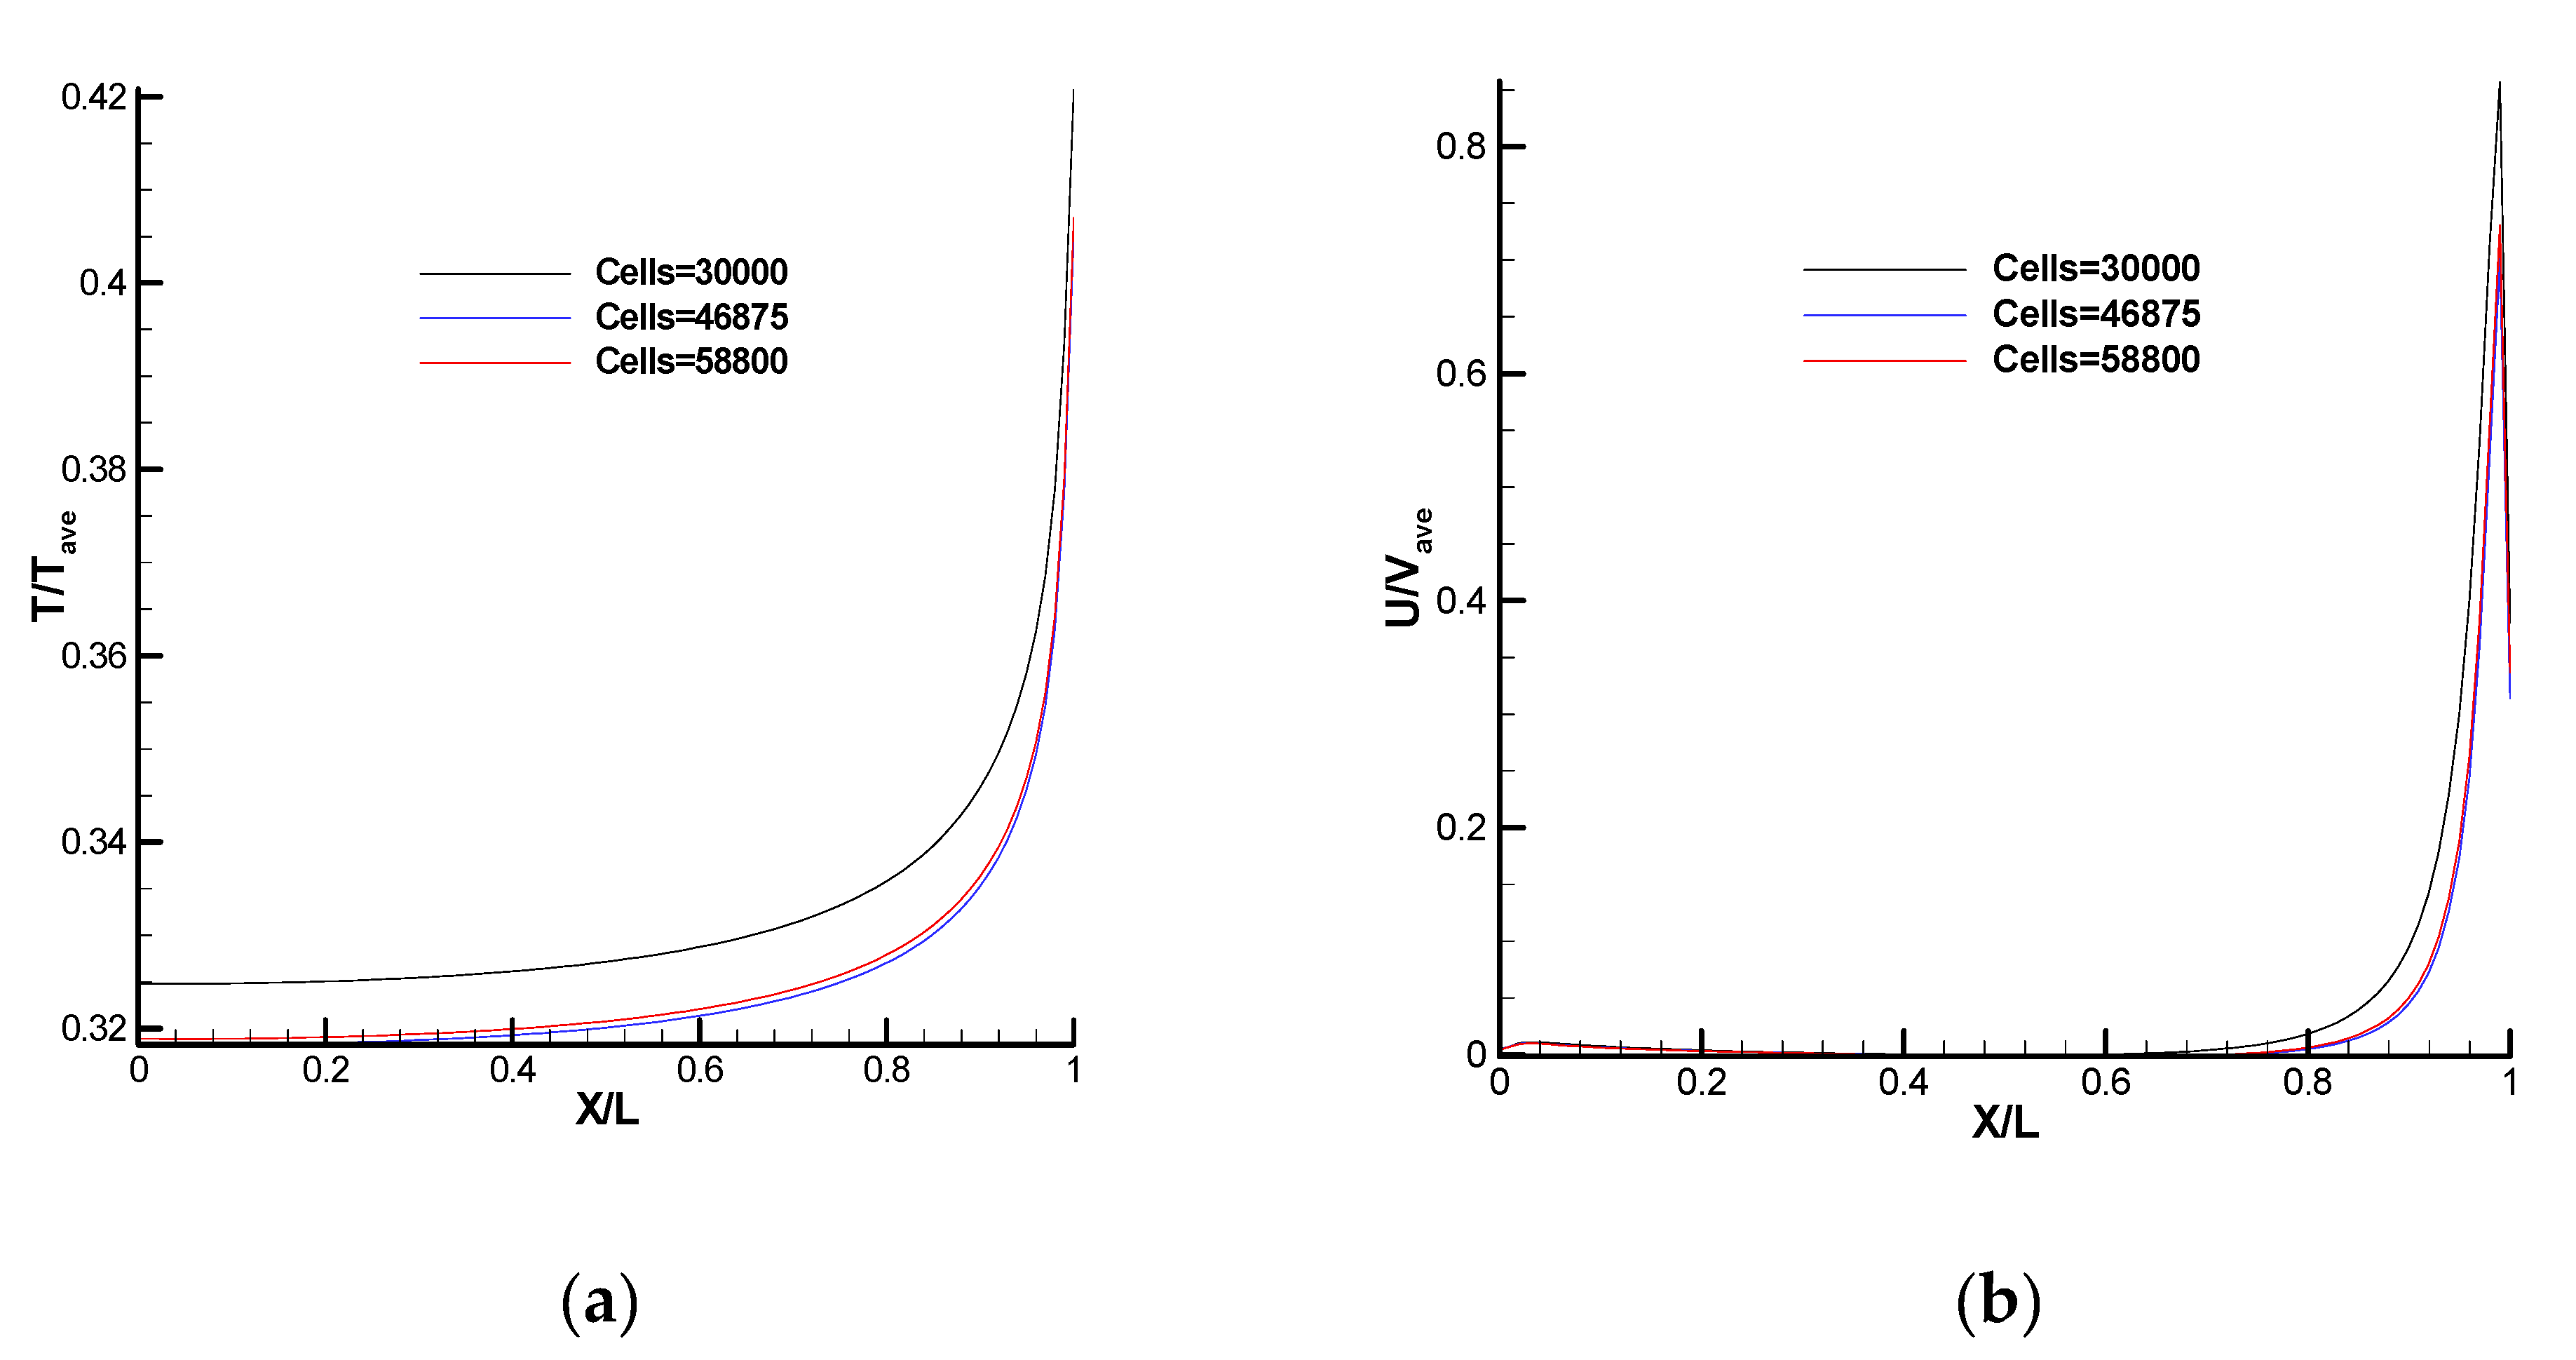
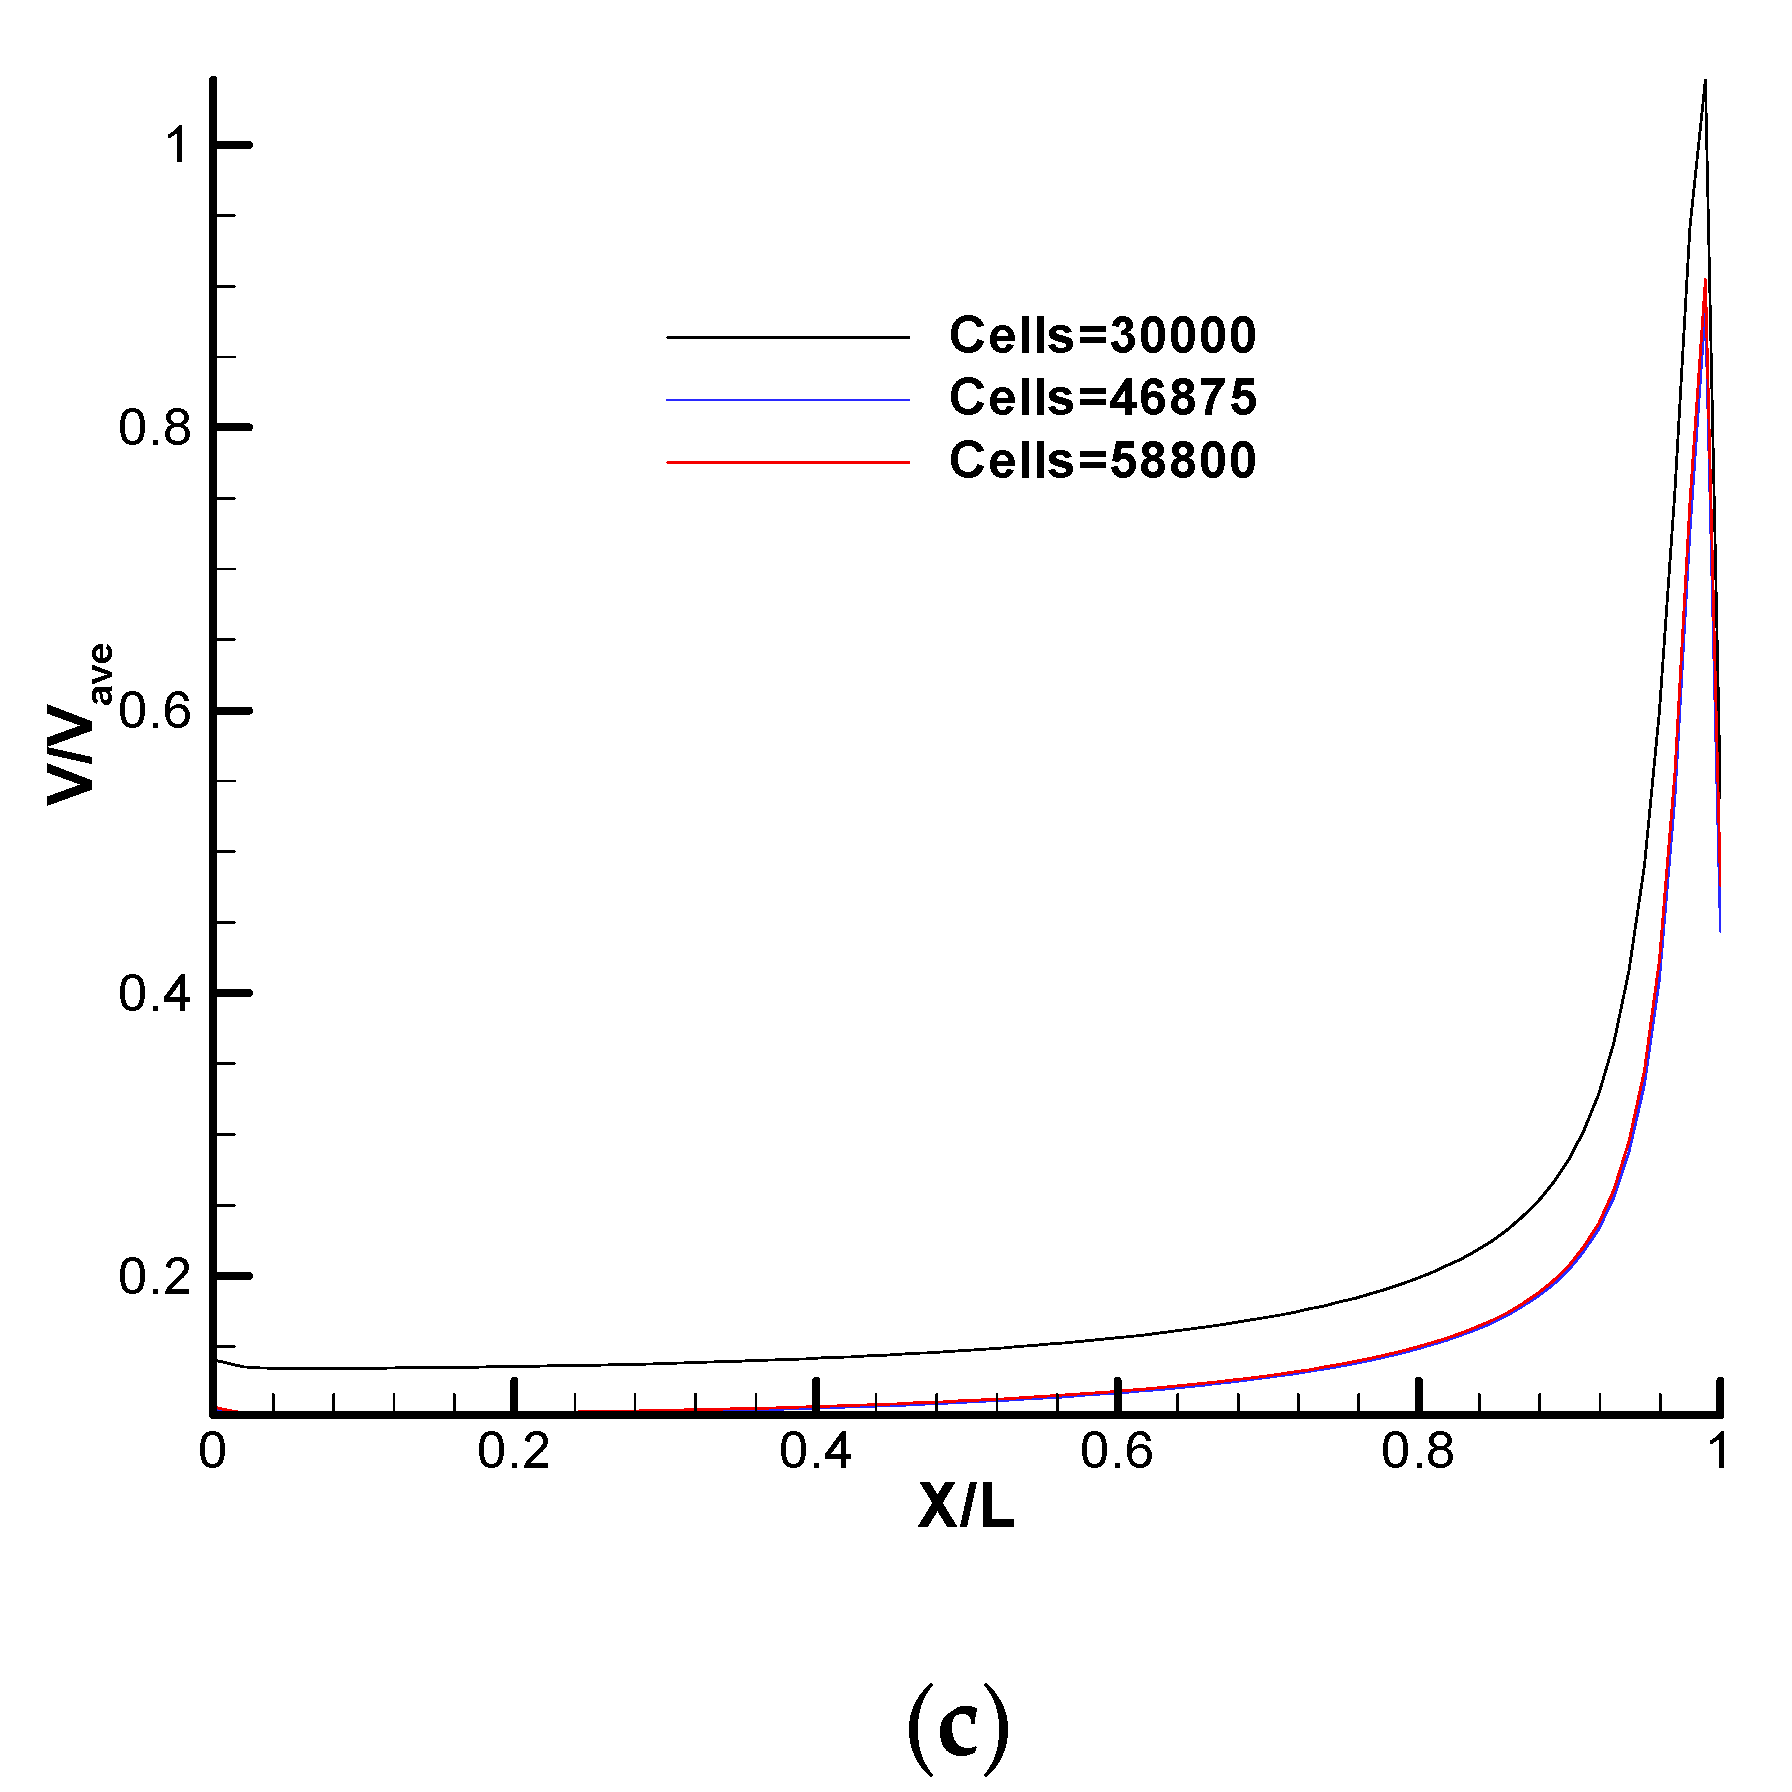
In case 2, grid sizes of 30,000, 46,875, and 58,800 cells, and a Gauss–Hermit quadrature expansion for the velocity grid of 28 × 28 cells were tested, and the results are depicted in Figure 7. All cases had a Courant–Friedrichs–Lewy (CFL) number of 0.5. A trend similar to that of case 1 was observed. We used grid 1 with 30,000 cells.

3.4. Verification of the SNIT Solver for Cases 1 and 2

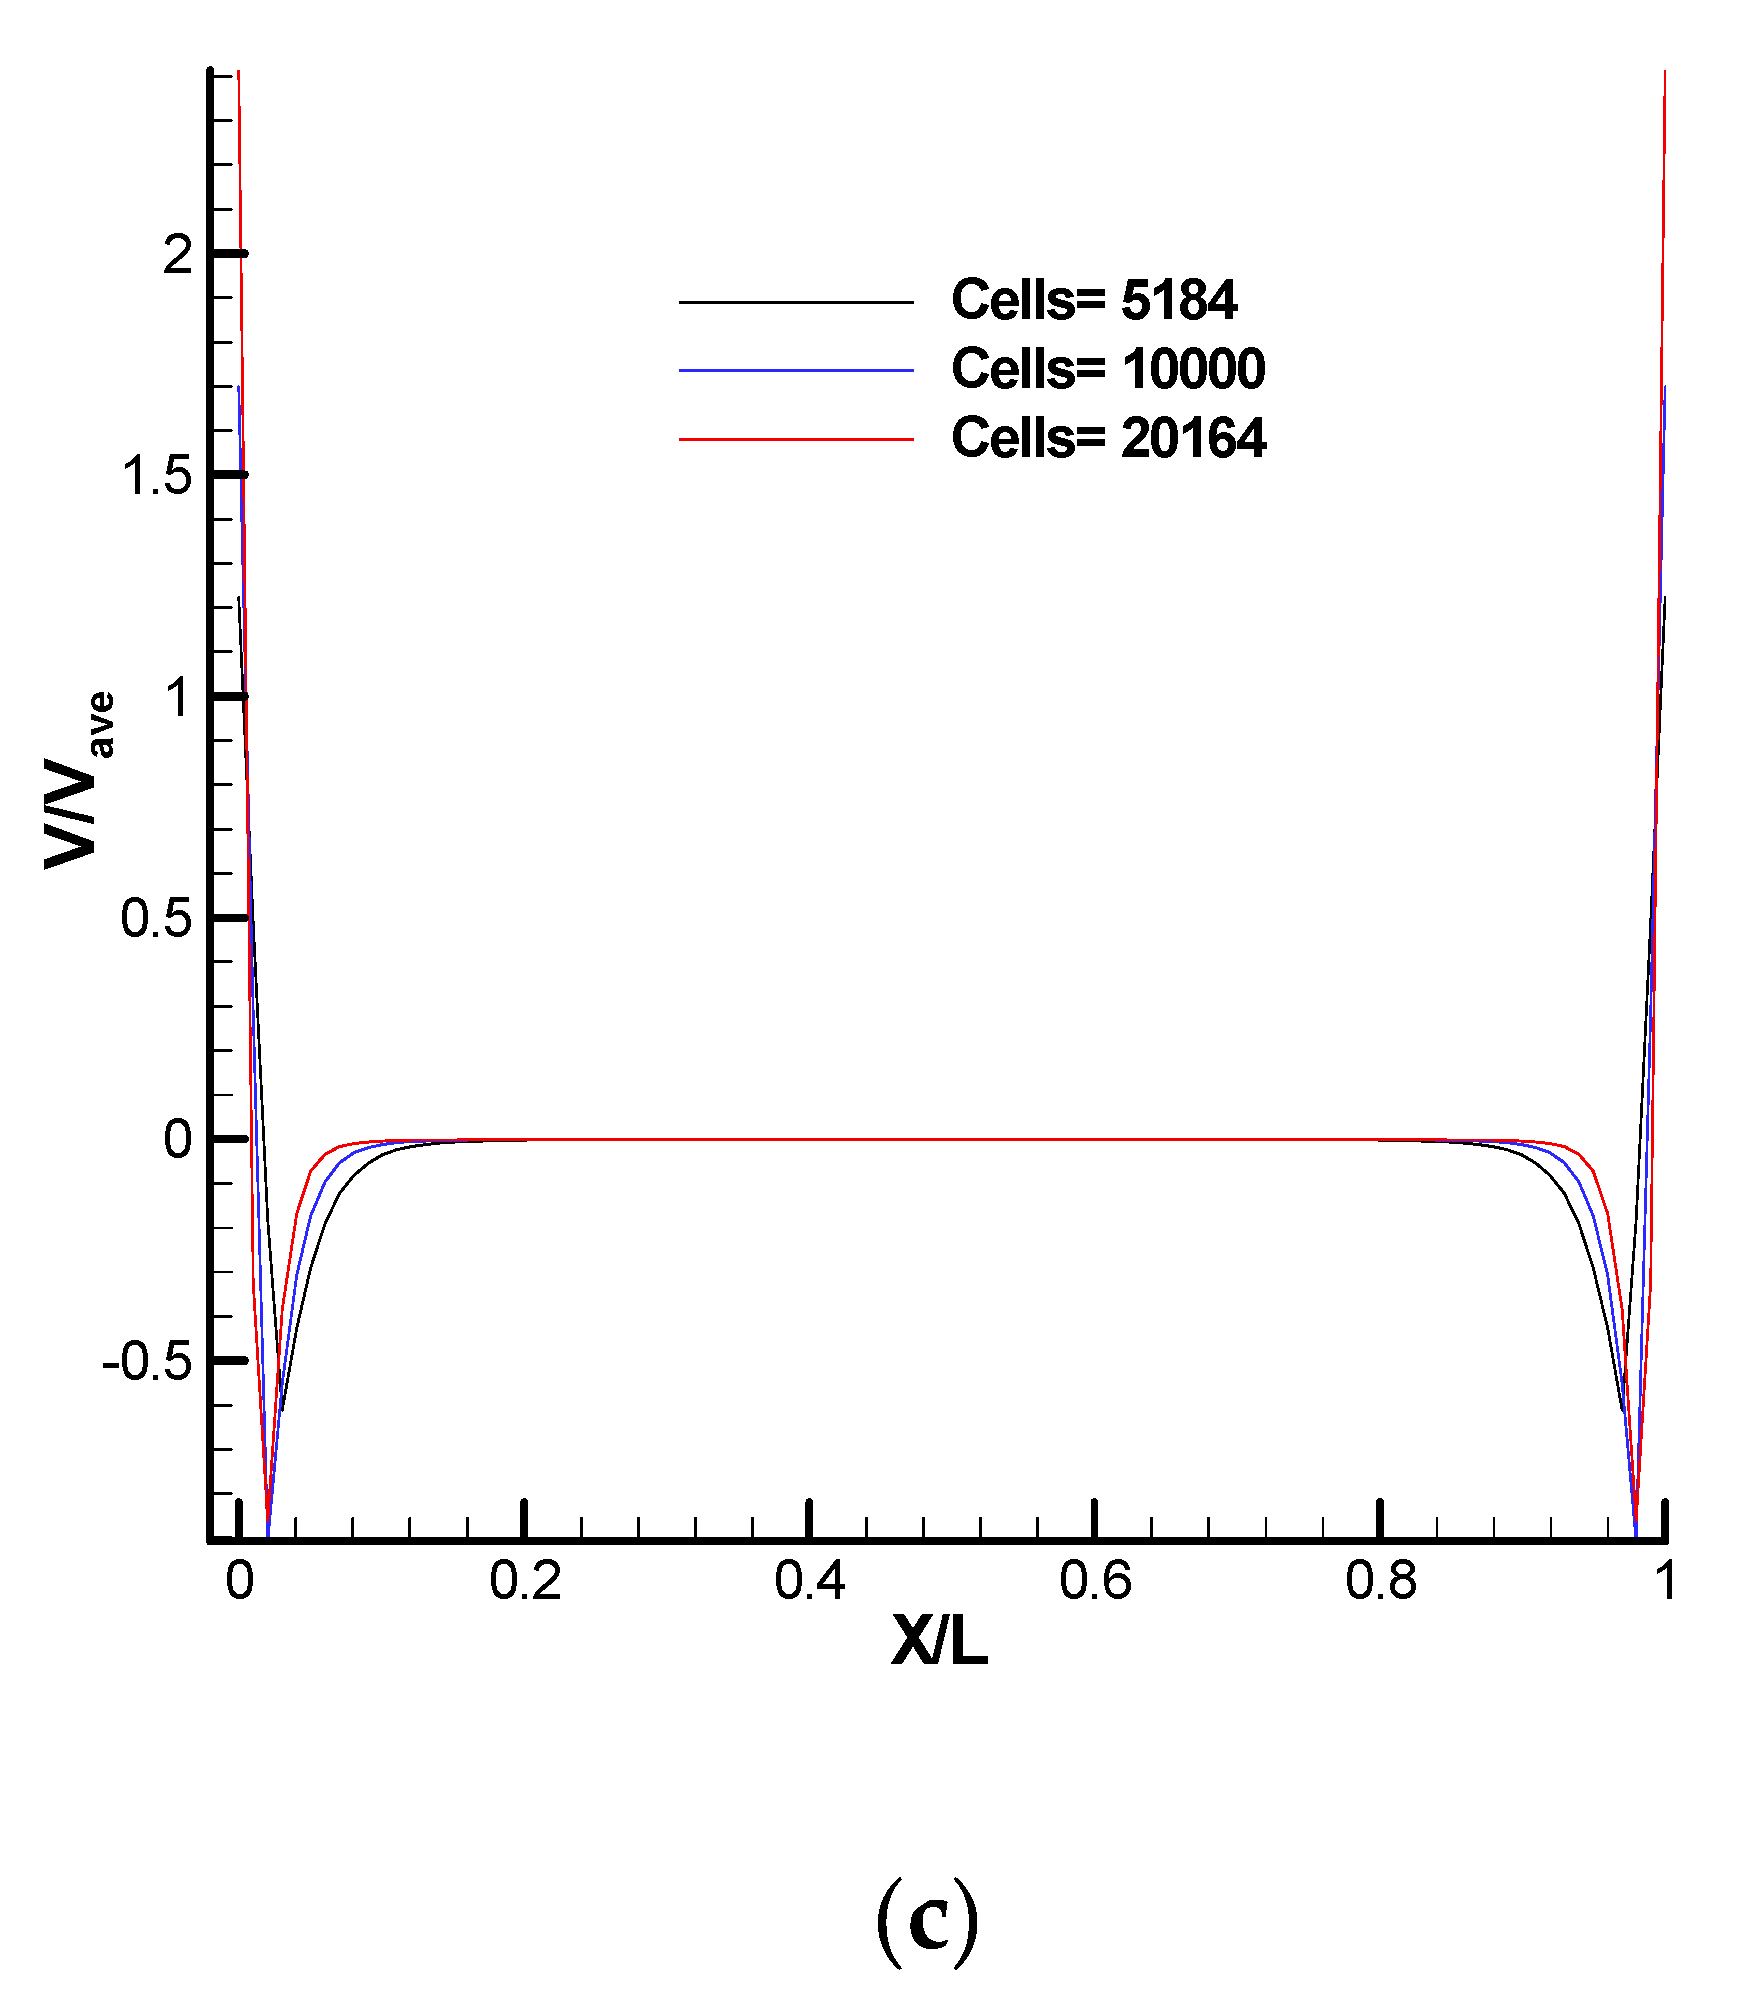
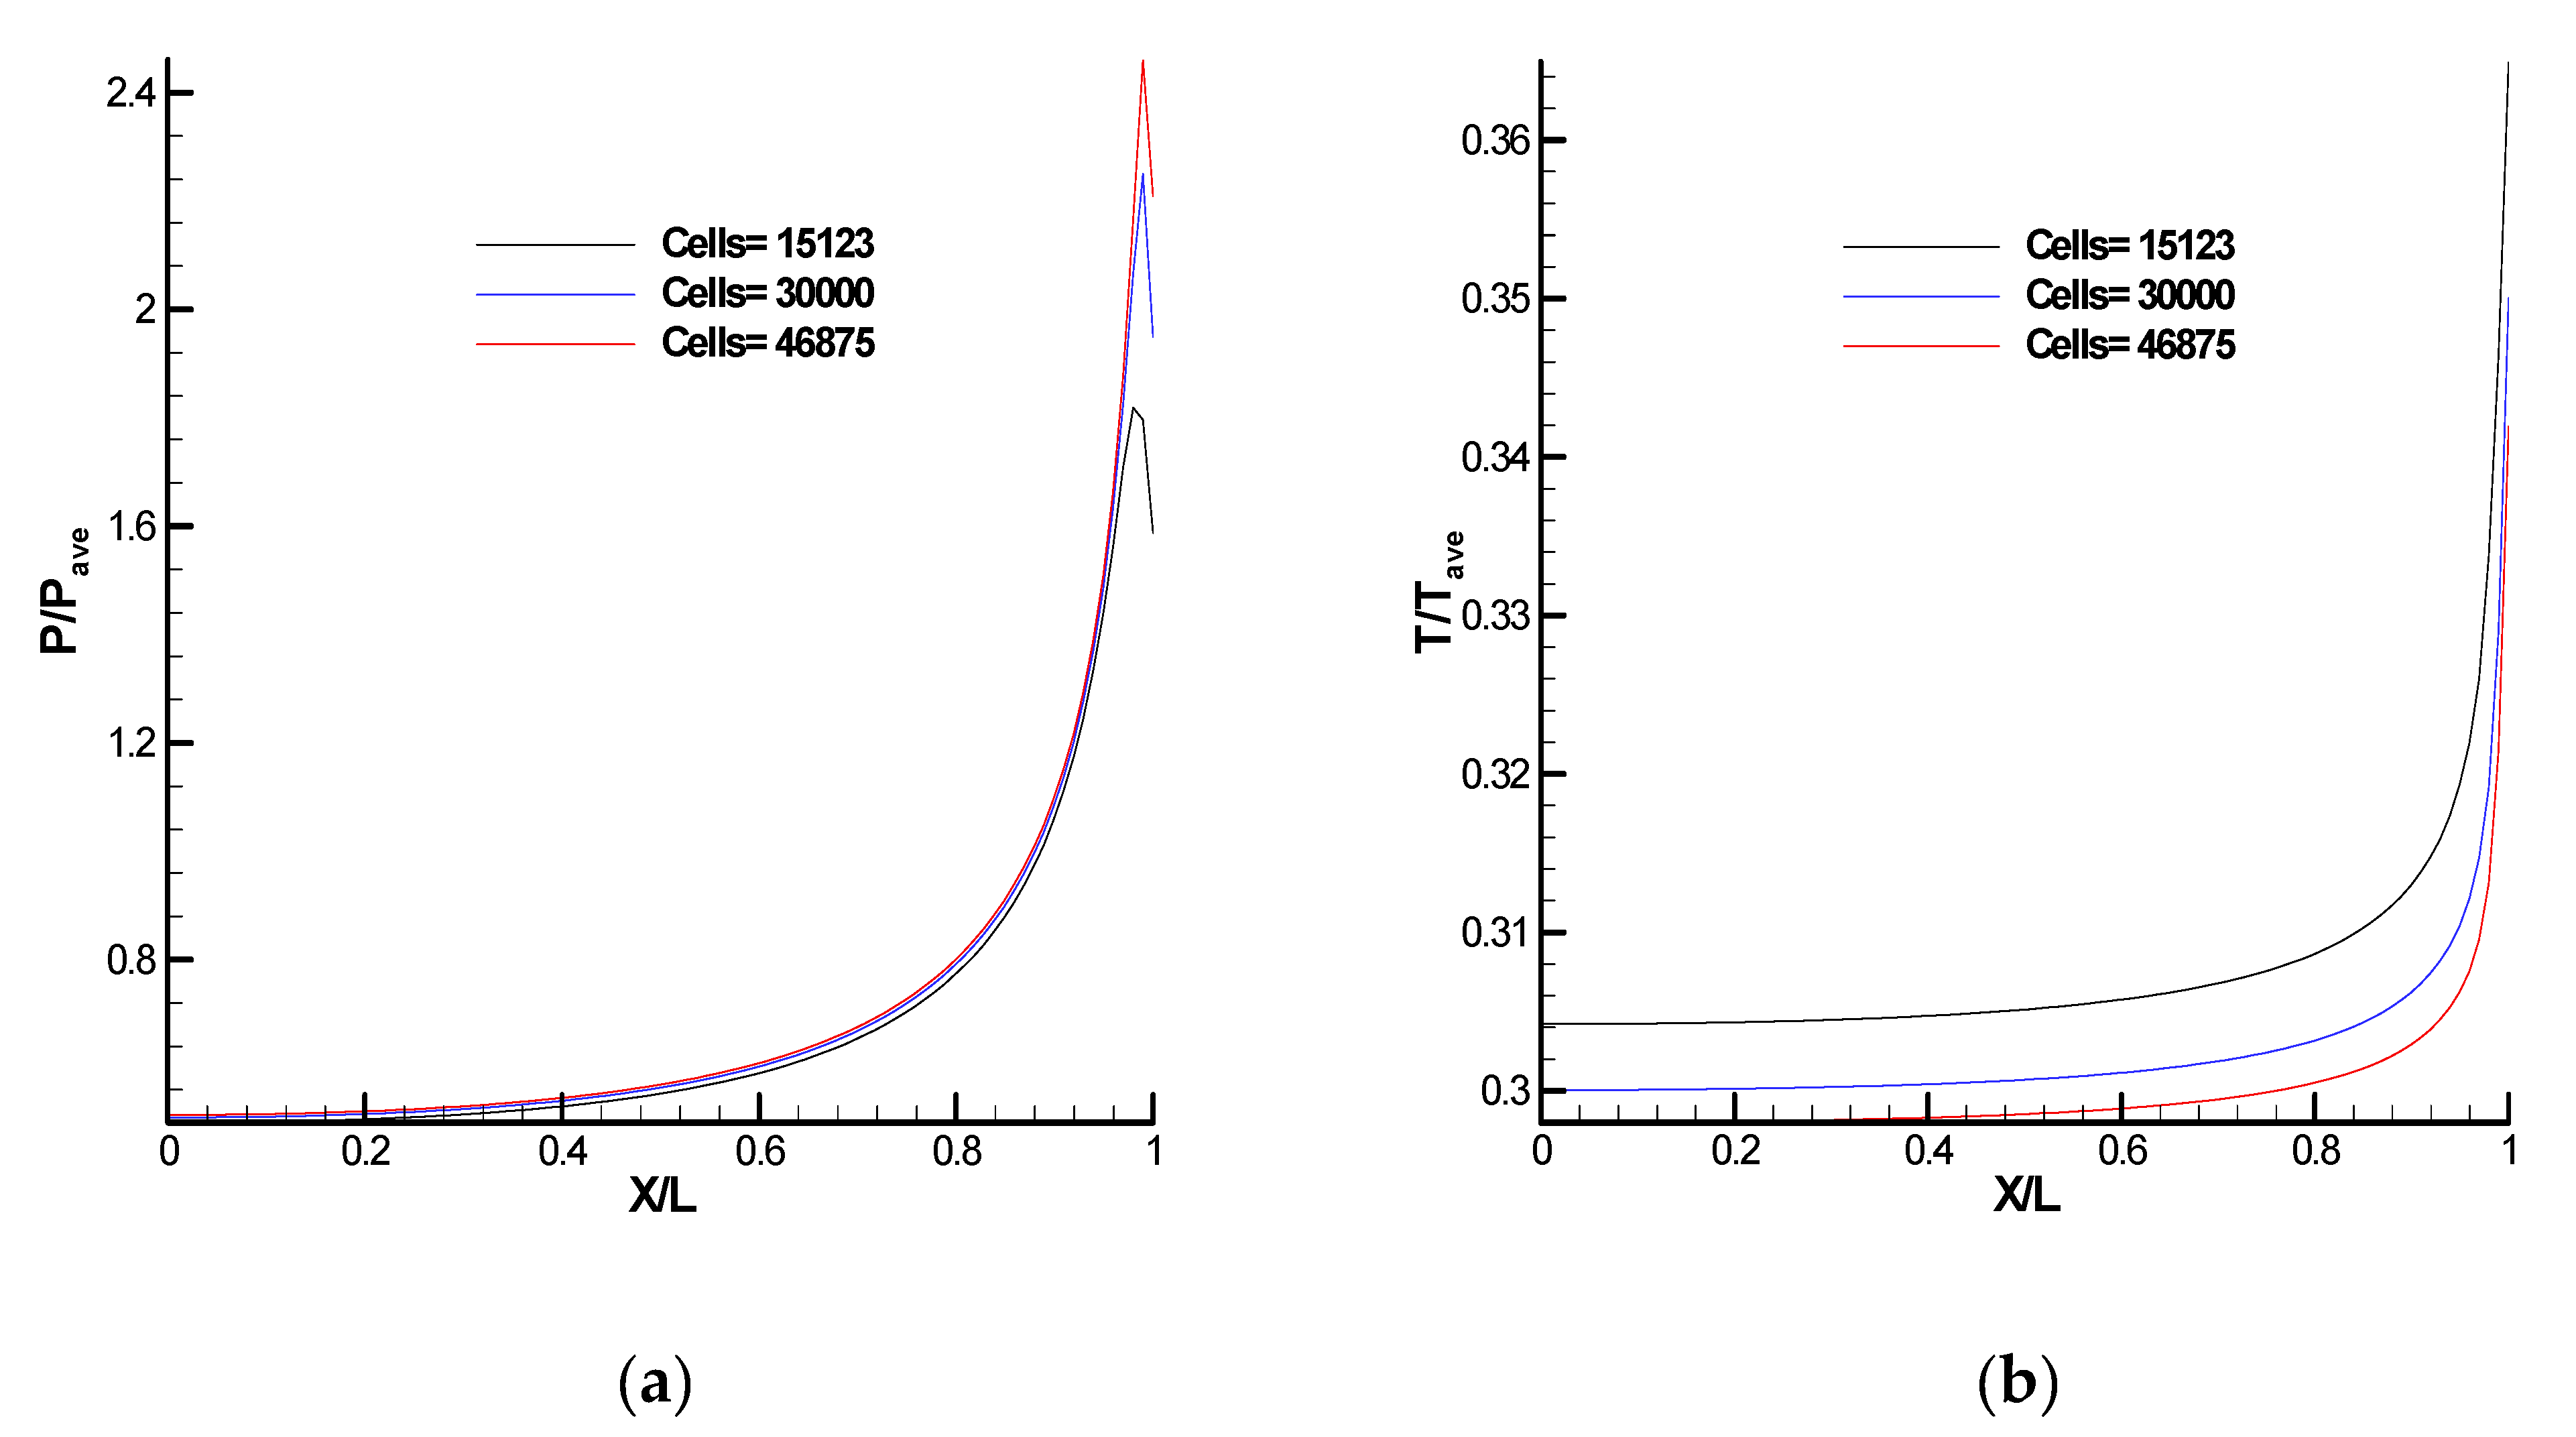
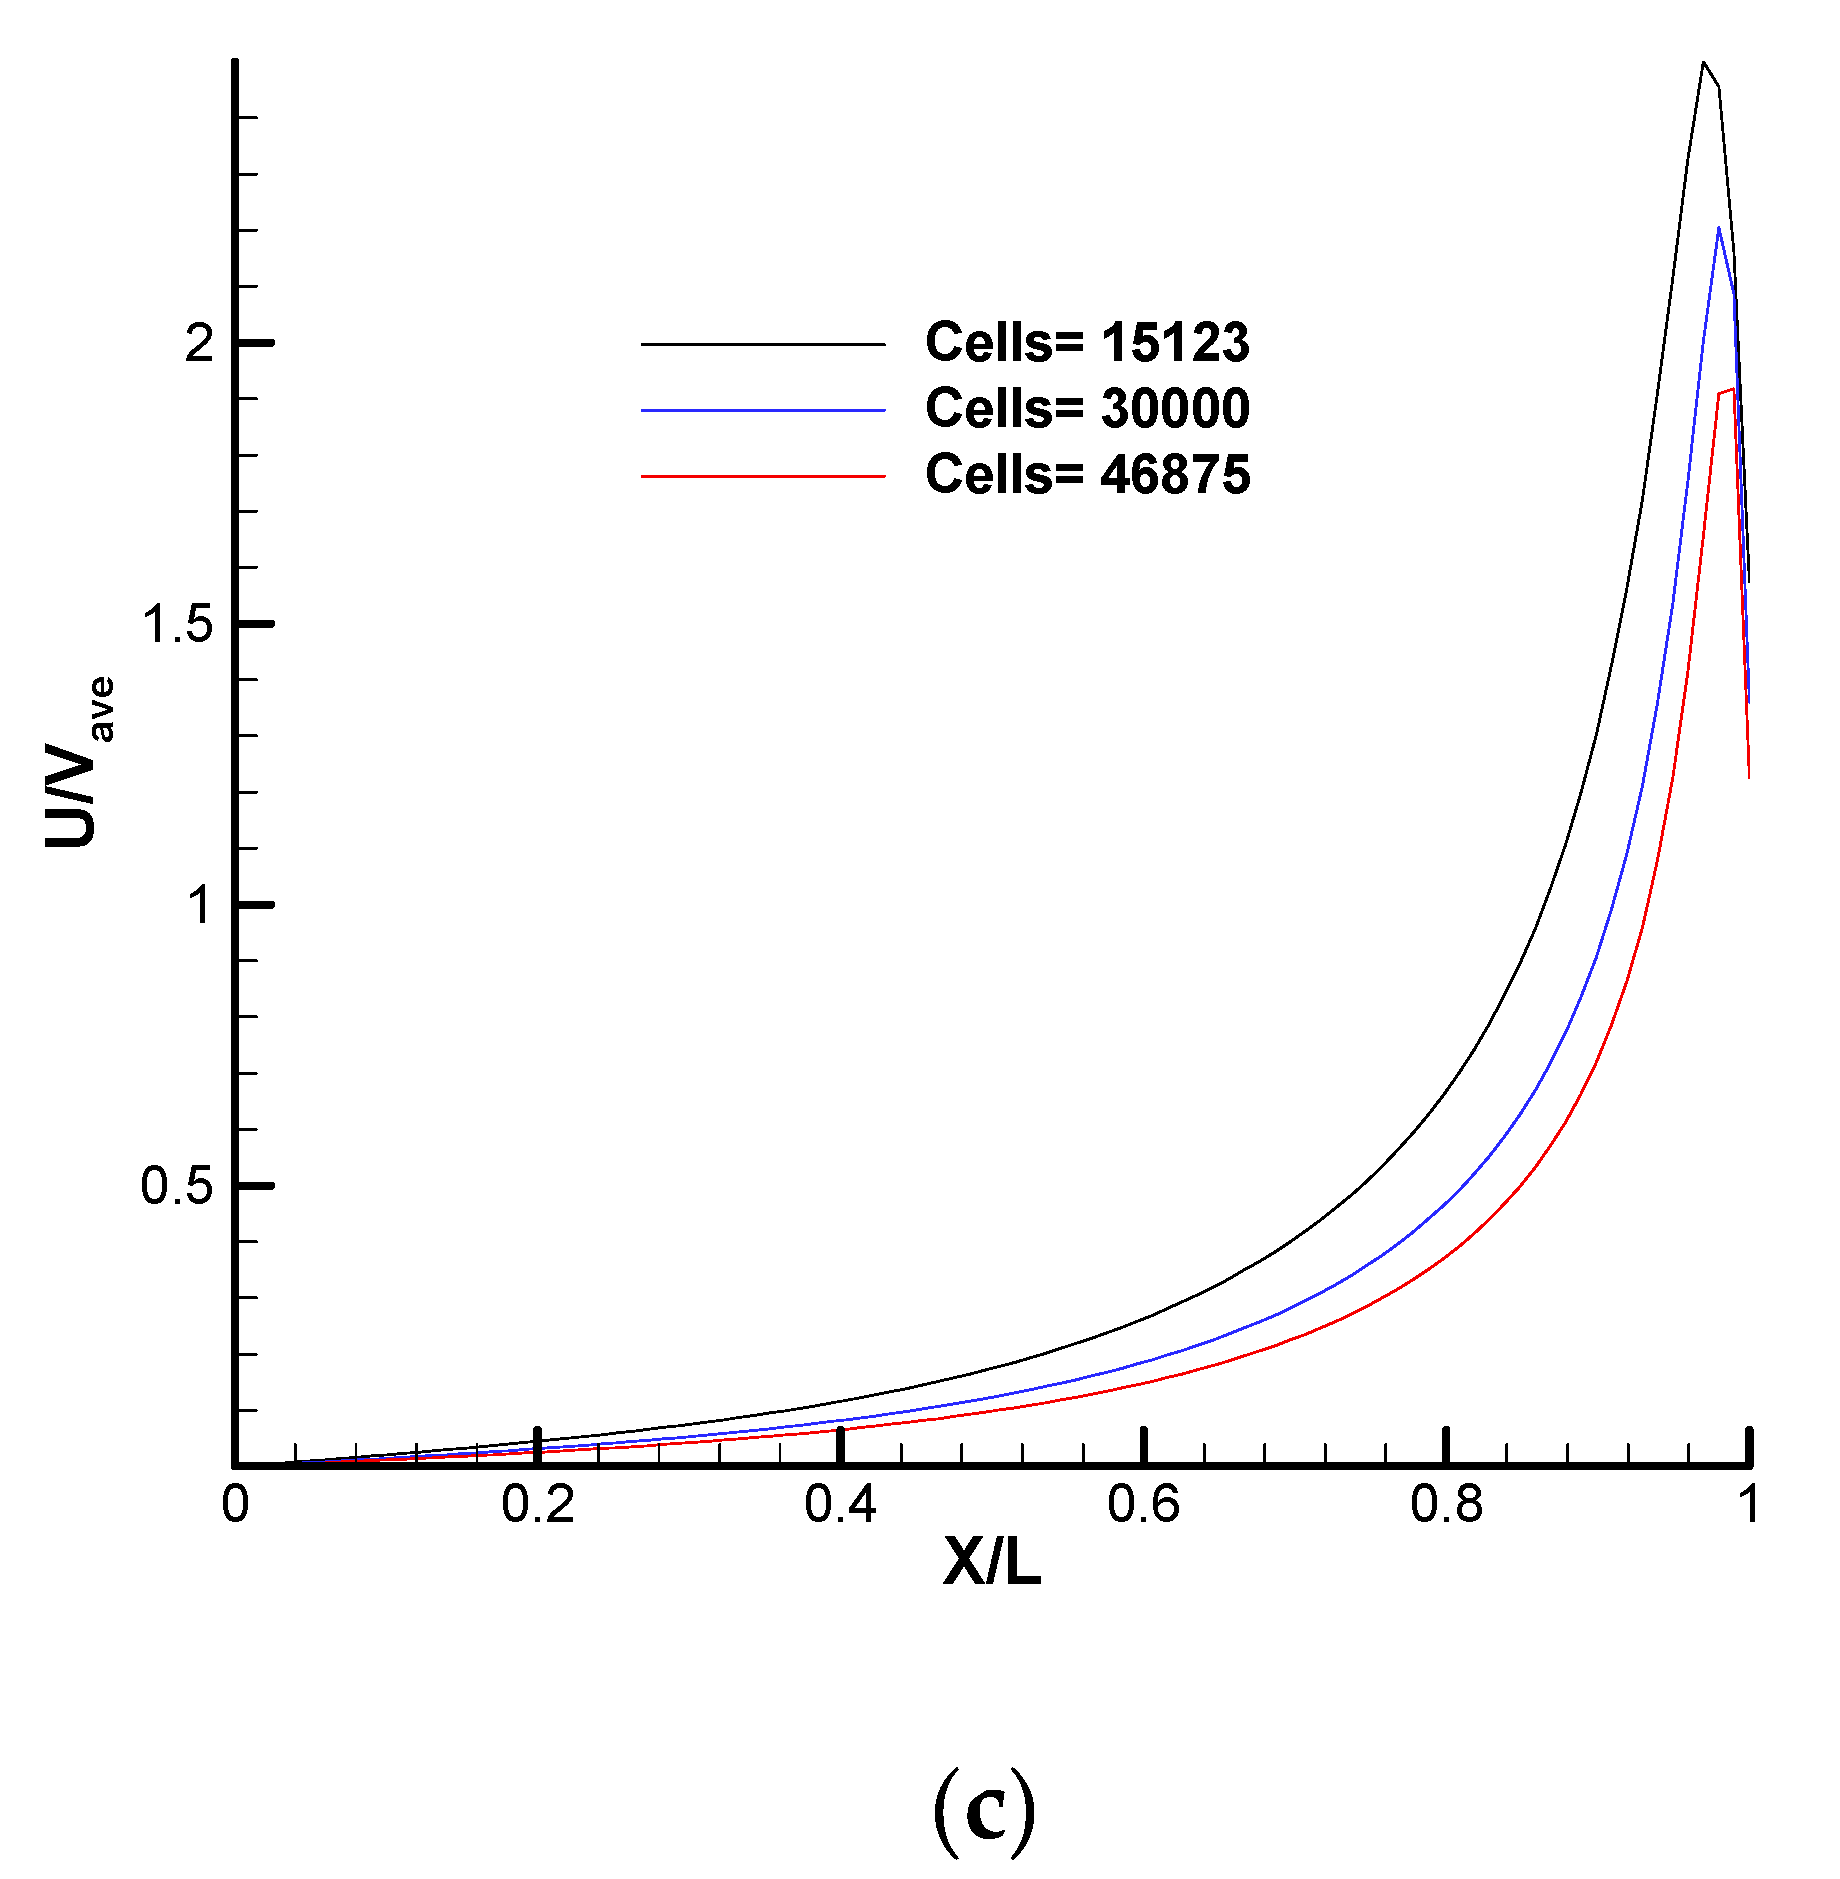
The grid independence with three cell sizes of 5184, 10000, and 20,164 cells is reported in Figure 8 for the SNIT solver in case 1, to find a suitable grid size. The SNIT solver was used to prove that nonlinear thermal stress effects caused the primary vortices that appeared in both cases. A normalized temperature distribution, U-velocity, and V-velocity are depicted in Figure 8. In case 2, three cases of 15,123, 30,000, and 46,875 cells are considered in Figure 9. In this figure, normalized pressure, temperature, and U-velocity are shown. We employed a grid size with 10,000 cells for case 1 and 30,000 cells for case 2.

4. Results and Discussion

4.1. Streamlines and Temperature Contours in the Square Cavity in Case 1

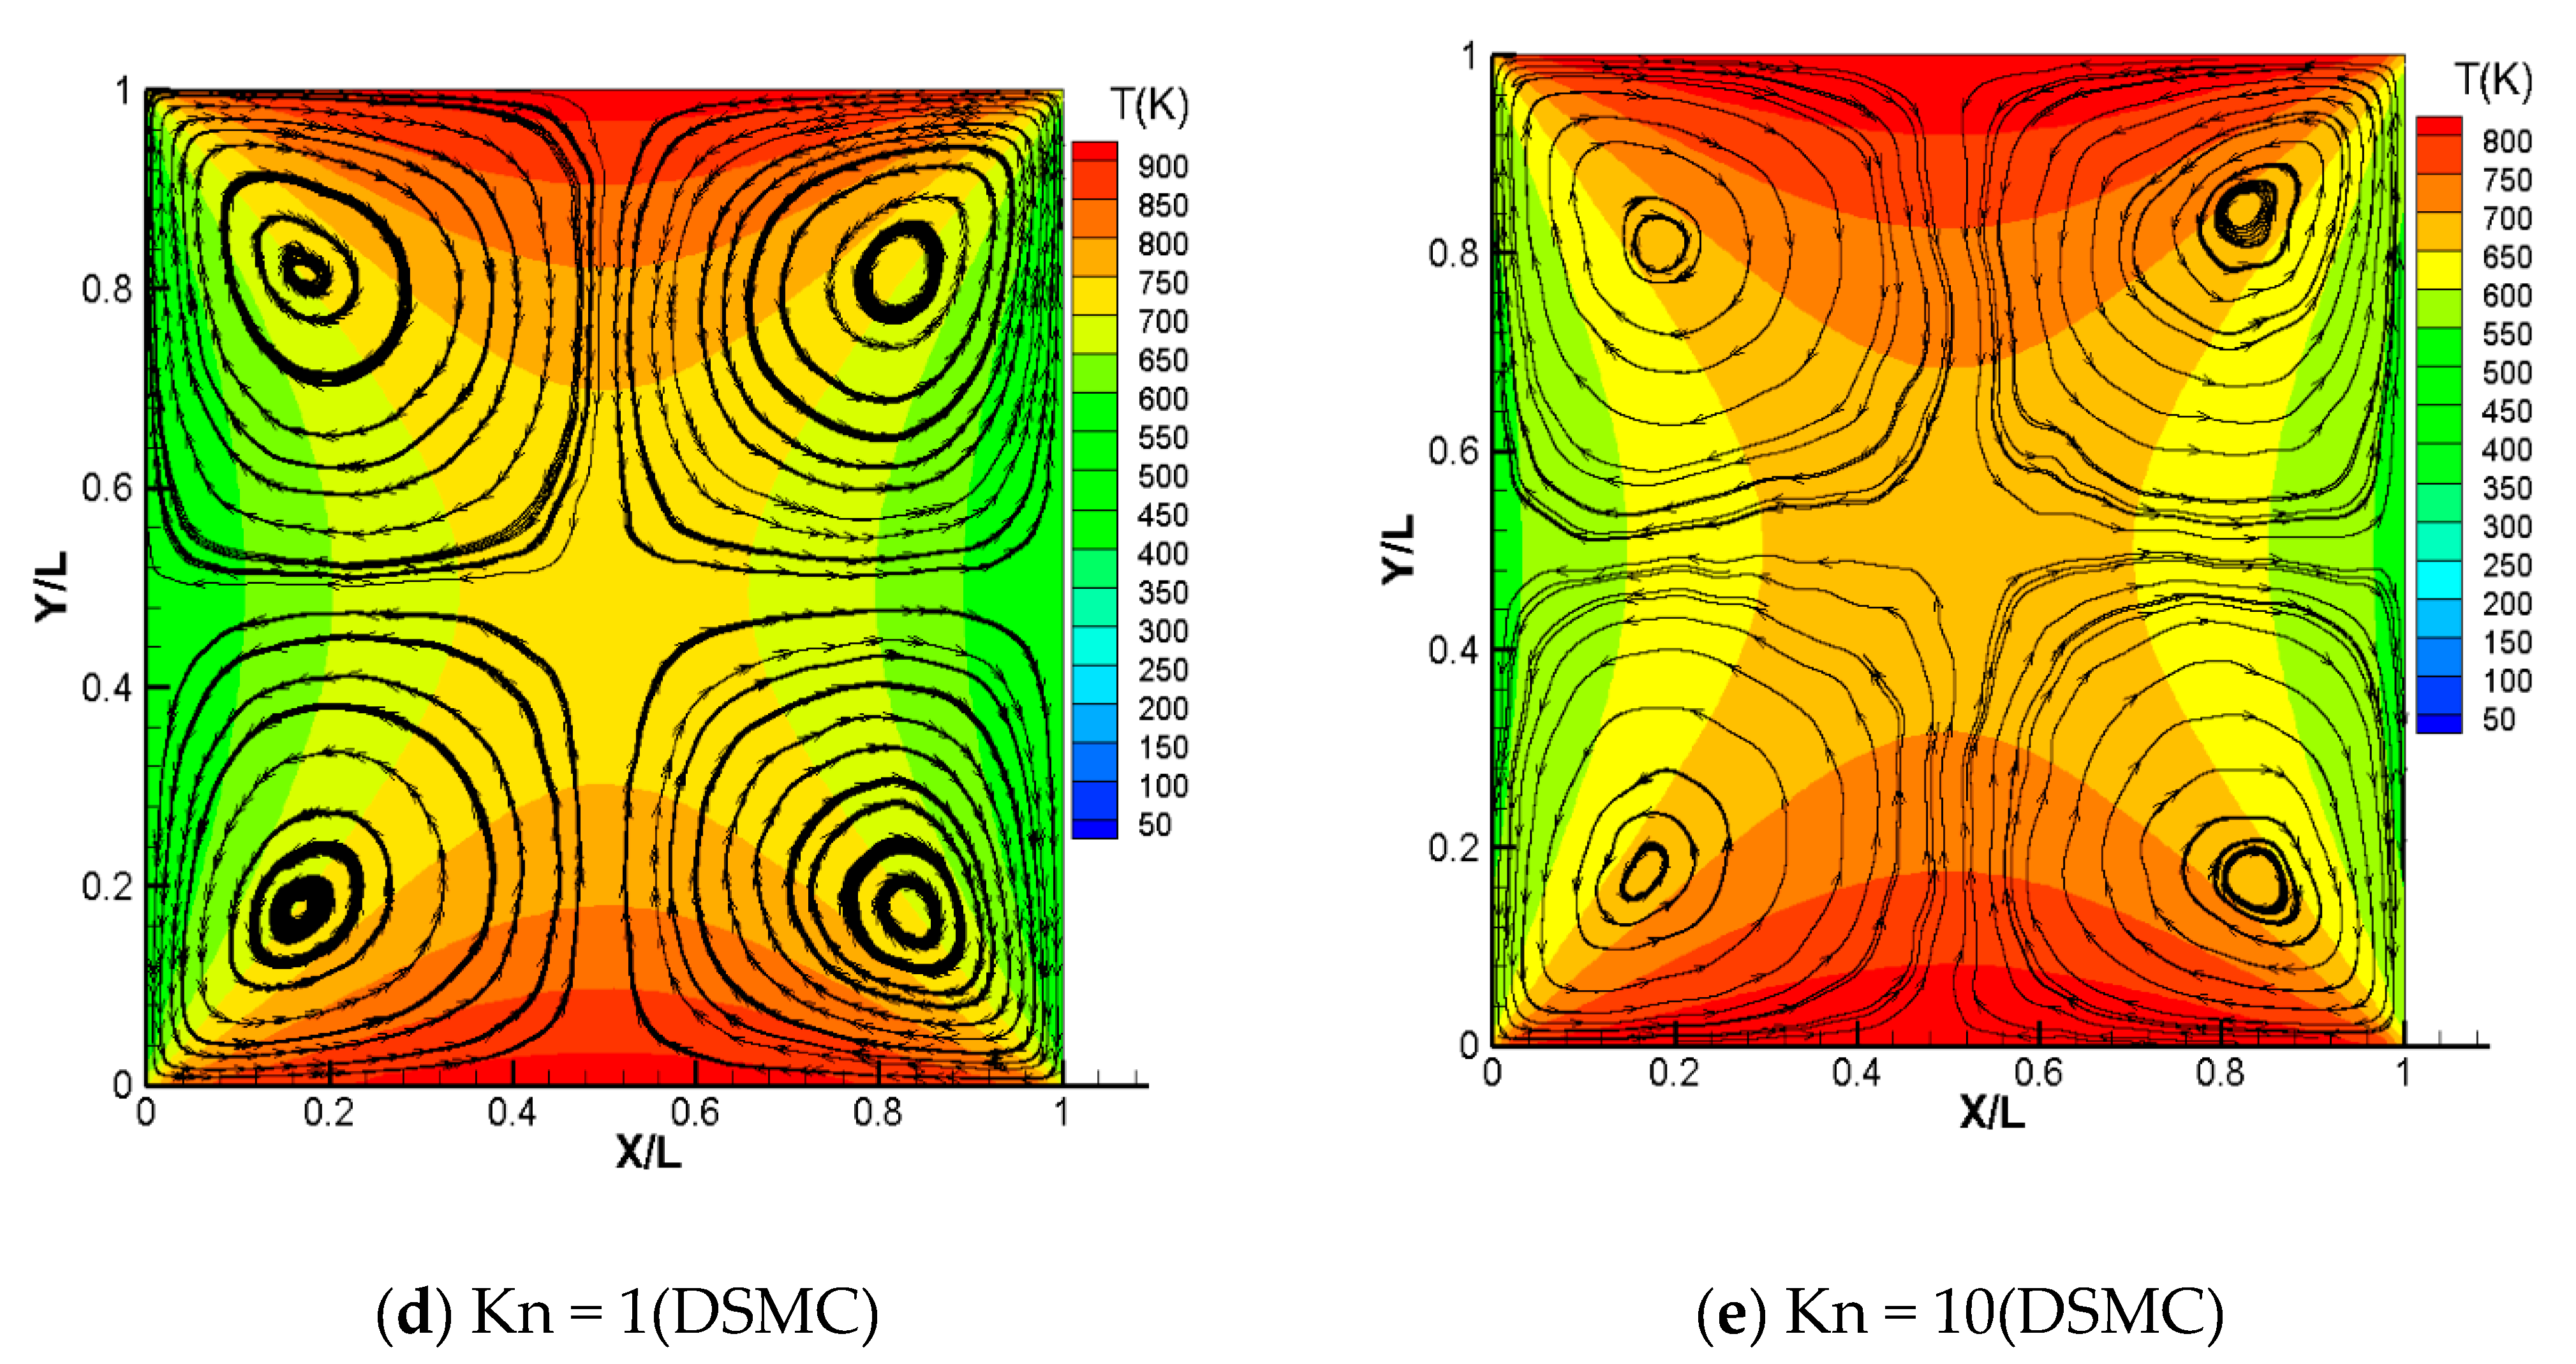
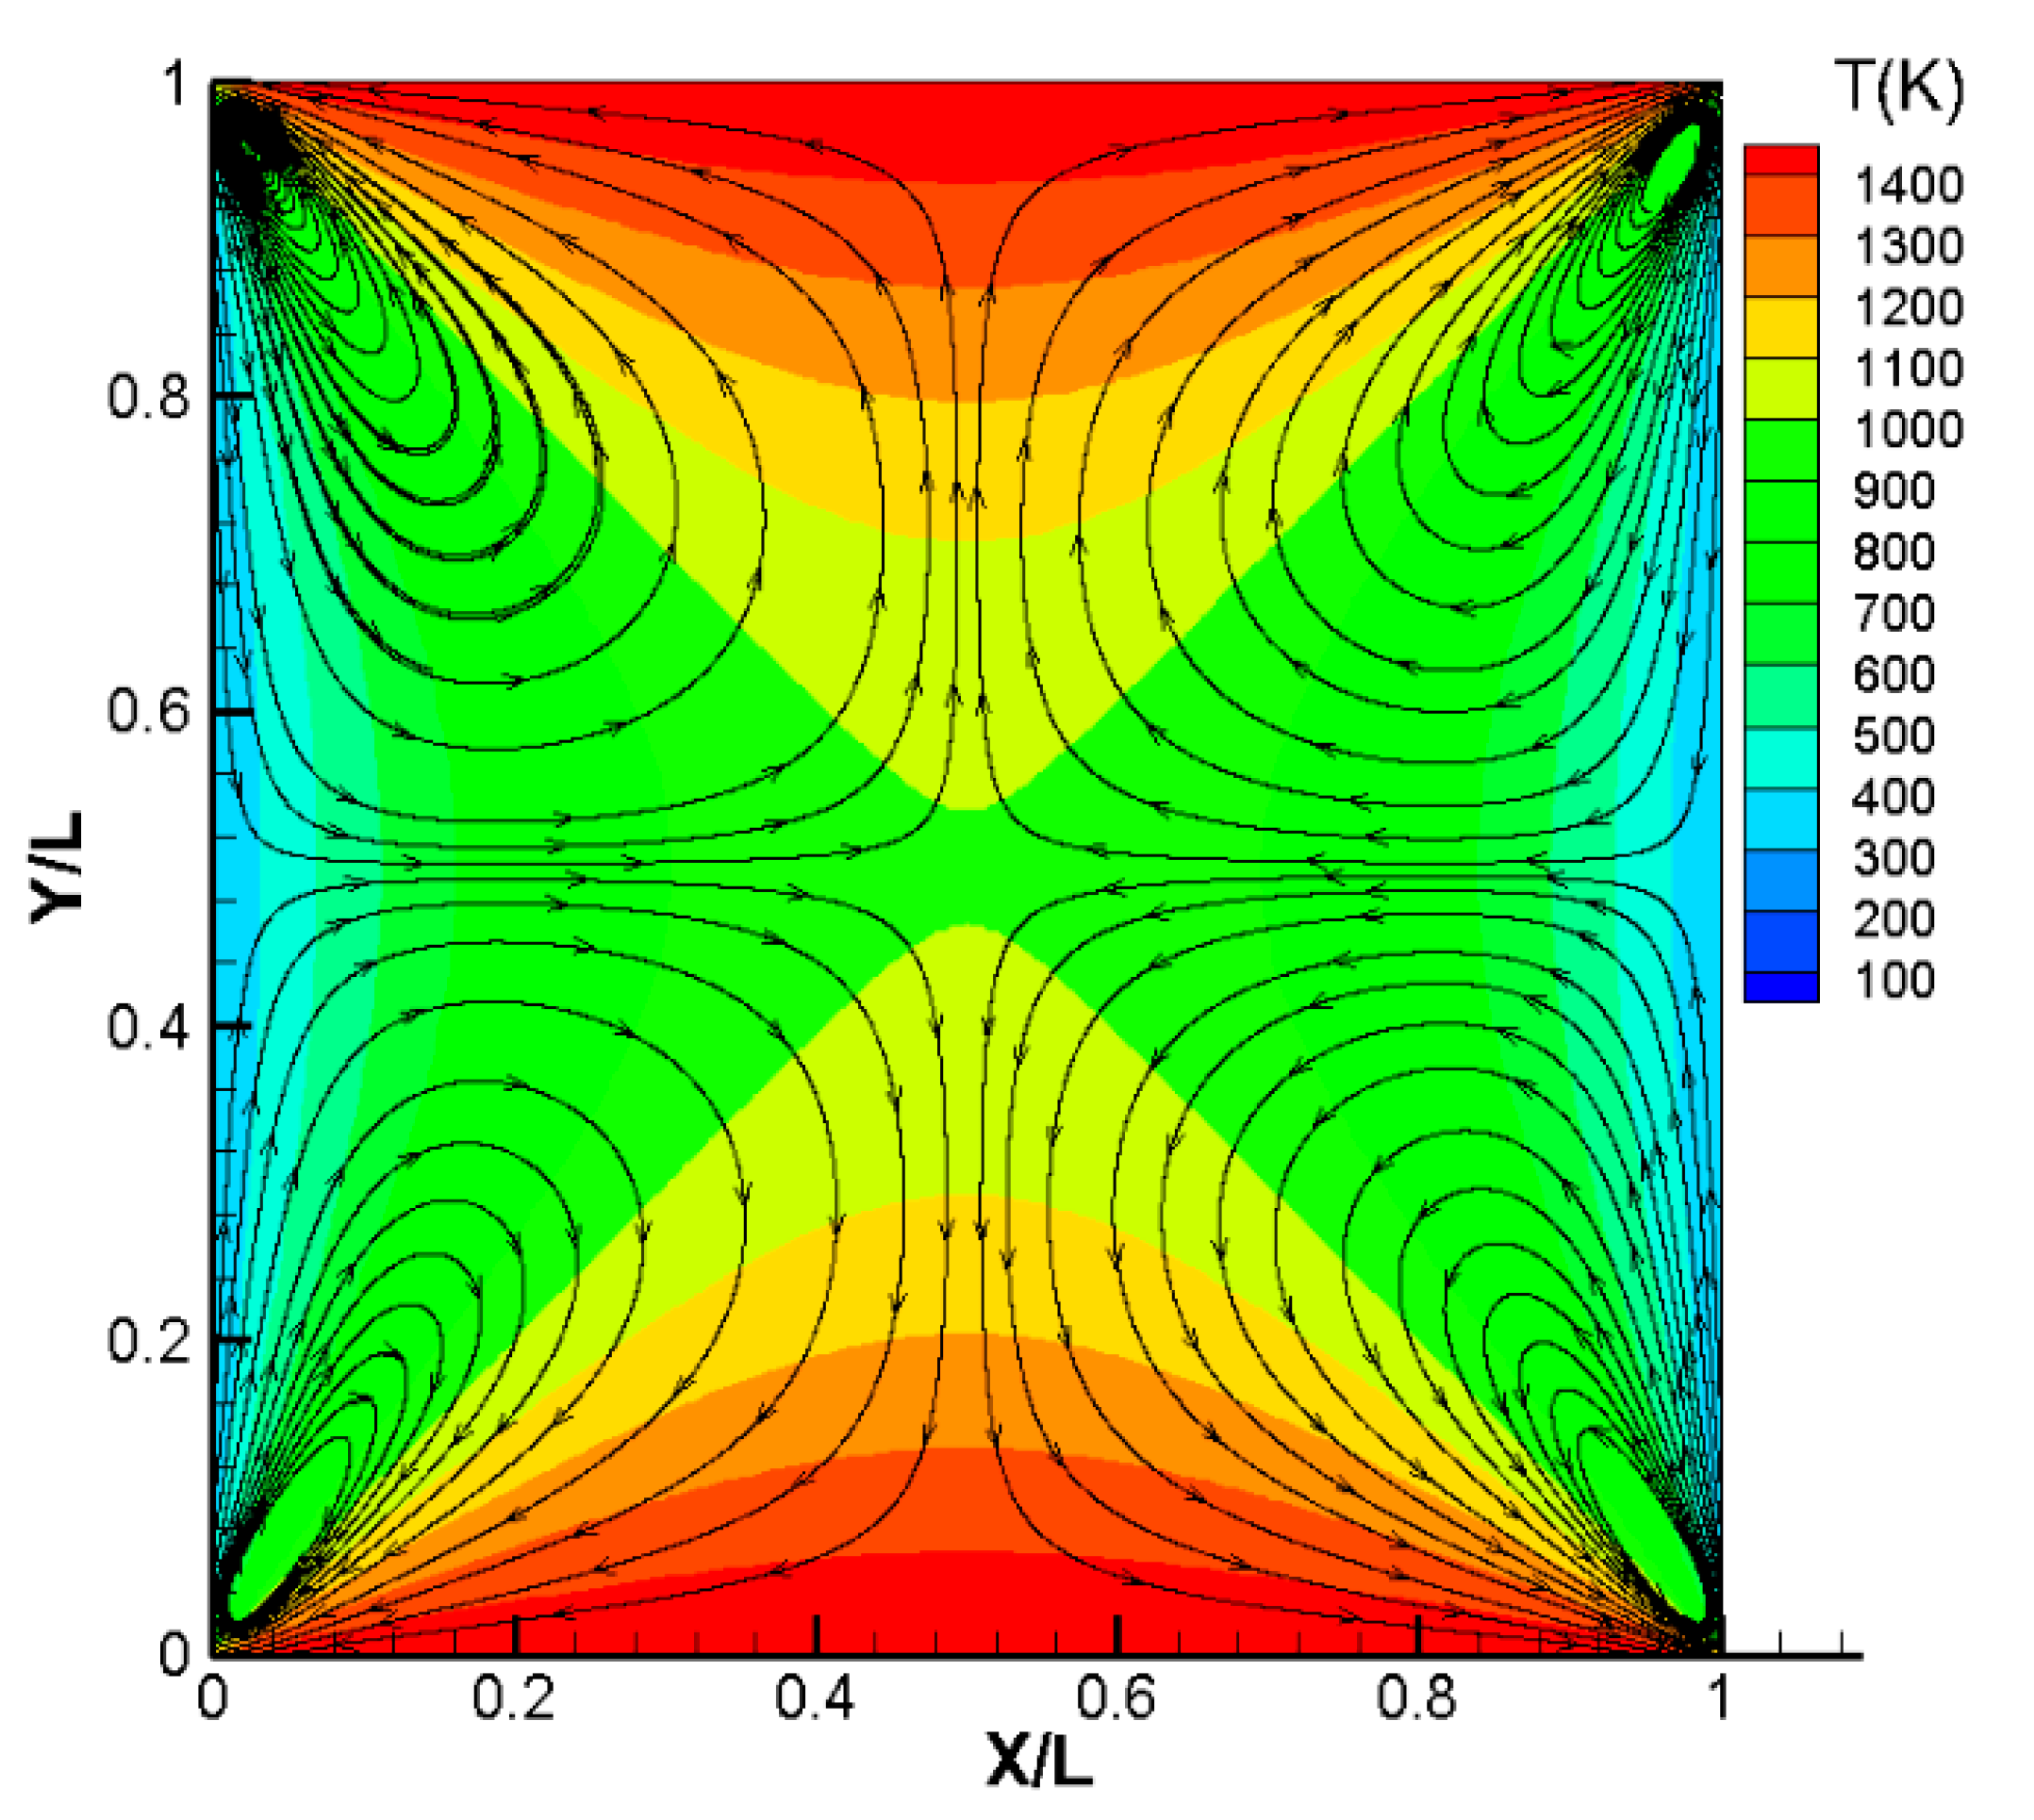
The streamlines and temperature contours are shown in Figure 10 for Kn = 0.01, 0.1, 1, and 10 for the DSMC and DUGKS solvers. At Kn = 1, 10, the realm is entirely dominated by four enormous vortices directed from the warm to the cold area, while at Kn = 0.01, both the DSMC and DUGKS solvers’ streamline directions are from the cold to warm zone. As the Knudsen number increases, the vortices’ nature changes, causing the direction to reverse. Since the isothermal curves are not straight and there is a significant temperature differential, primary vortices are likely the result of nonlinear thermal stress flow effects. This was compared to concentric elliptical cylinders in Ref. [23]. The SNIT equations could capture these vast vortices, while the NSF equations could not do so, as we will demonstrate in Section 4.4. It is evident that the nonlinear thermal stress caused these sizable vortices. Formula (8)–(16) in Section 2.3 explain how flow (in our case, vortices) is created by nonlinear thermal stress. Sone [9] asserted that the induced thermal field causes the nonlinear thermal stress flow in this domain. In contrast to the thermal stress slip and thermal creep flows, where the walls play an active part, the walls only play a secondary function in creating such a flow field. When the temperature fluctuations are not small, thermal stress, a function of the temperature gradient, can be seen in Equation (16). A force parallel to the temperature gradient pulls the gas in the opposite direction.
The primary distinction between the present study and earlier publications [23,50,51] concentrating on thermally induced flows in elliptical cylinder geometries is the singular nature of the square geometry. Notwithstanding the fact nonlinear thermal stress flow happens in a square, singularities may have the potential to influence and change it. The singularity at the sharp edges (points of the plate), as studied in [13,21,22,23], is so strong that it dominates the overall flow field for both the thermal edge flow and the radiometric edge flow. The sharp corners in the square problem may have a less significant impact but still contend with the nonlinear thermal stress flow and influence it. There were four tiny vortices near to the square’s corners at Kn = 0.01 and eight vortices in the vicinity of all sides, though those disappeared at Kn = 1, 10. In the current issue, there are four acute corners where the wall temperature is discontinuous; thus, the bottom/top and side walls close to the corner experience a significant temperature jump. A sharp temperature gradient develops in the gas along the bottom/top and side walls close to the corners. Due to this strong temperature gradient, flows are induced in the corners and along all side walls that move toward the corners at Kn = 0.1 (the so-called thermal creep). At Kn = 0.01, near the corner, these flows create four and eight vortices along all sides at Kn = 0.1. When Kn is increased, the vortices created by thermal creep disappear, because with an increasing Knudsen number, vortices formed by nonlinear thermal stress become stronger and surround the entire cavity. Temperature increases as Kn rises, showing a more significant temperature jump along the bottom and top sides.

4.2. Velocity Distribution and Force in Case 1 with the DSMC Solver

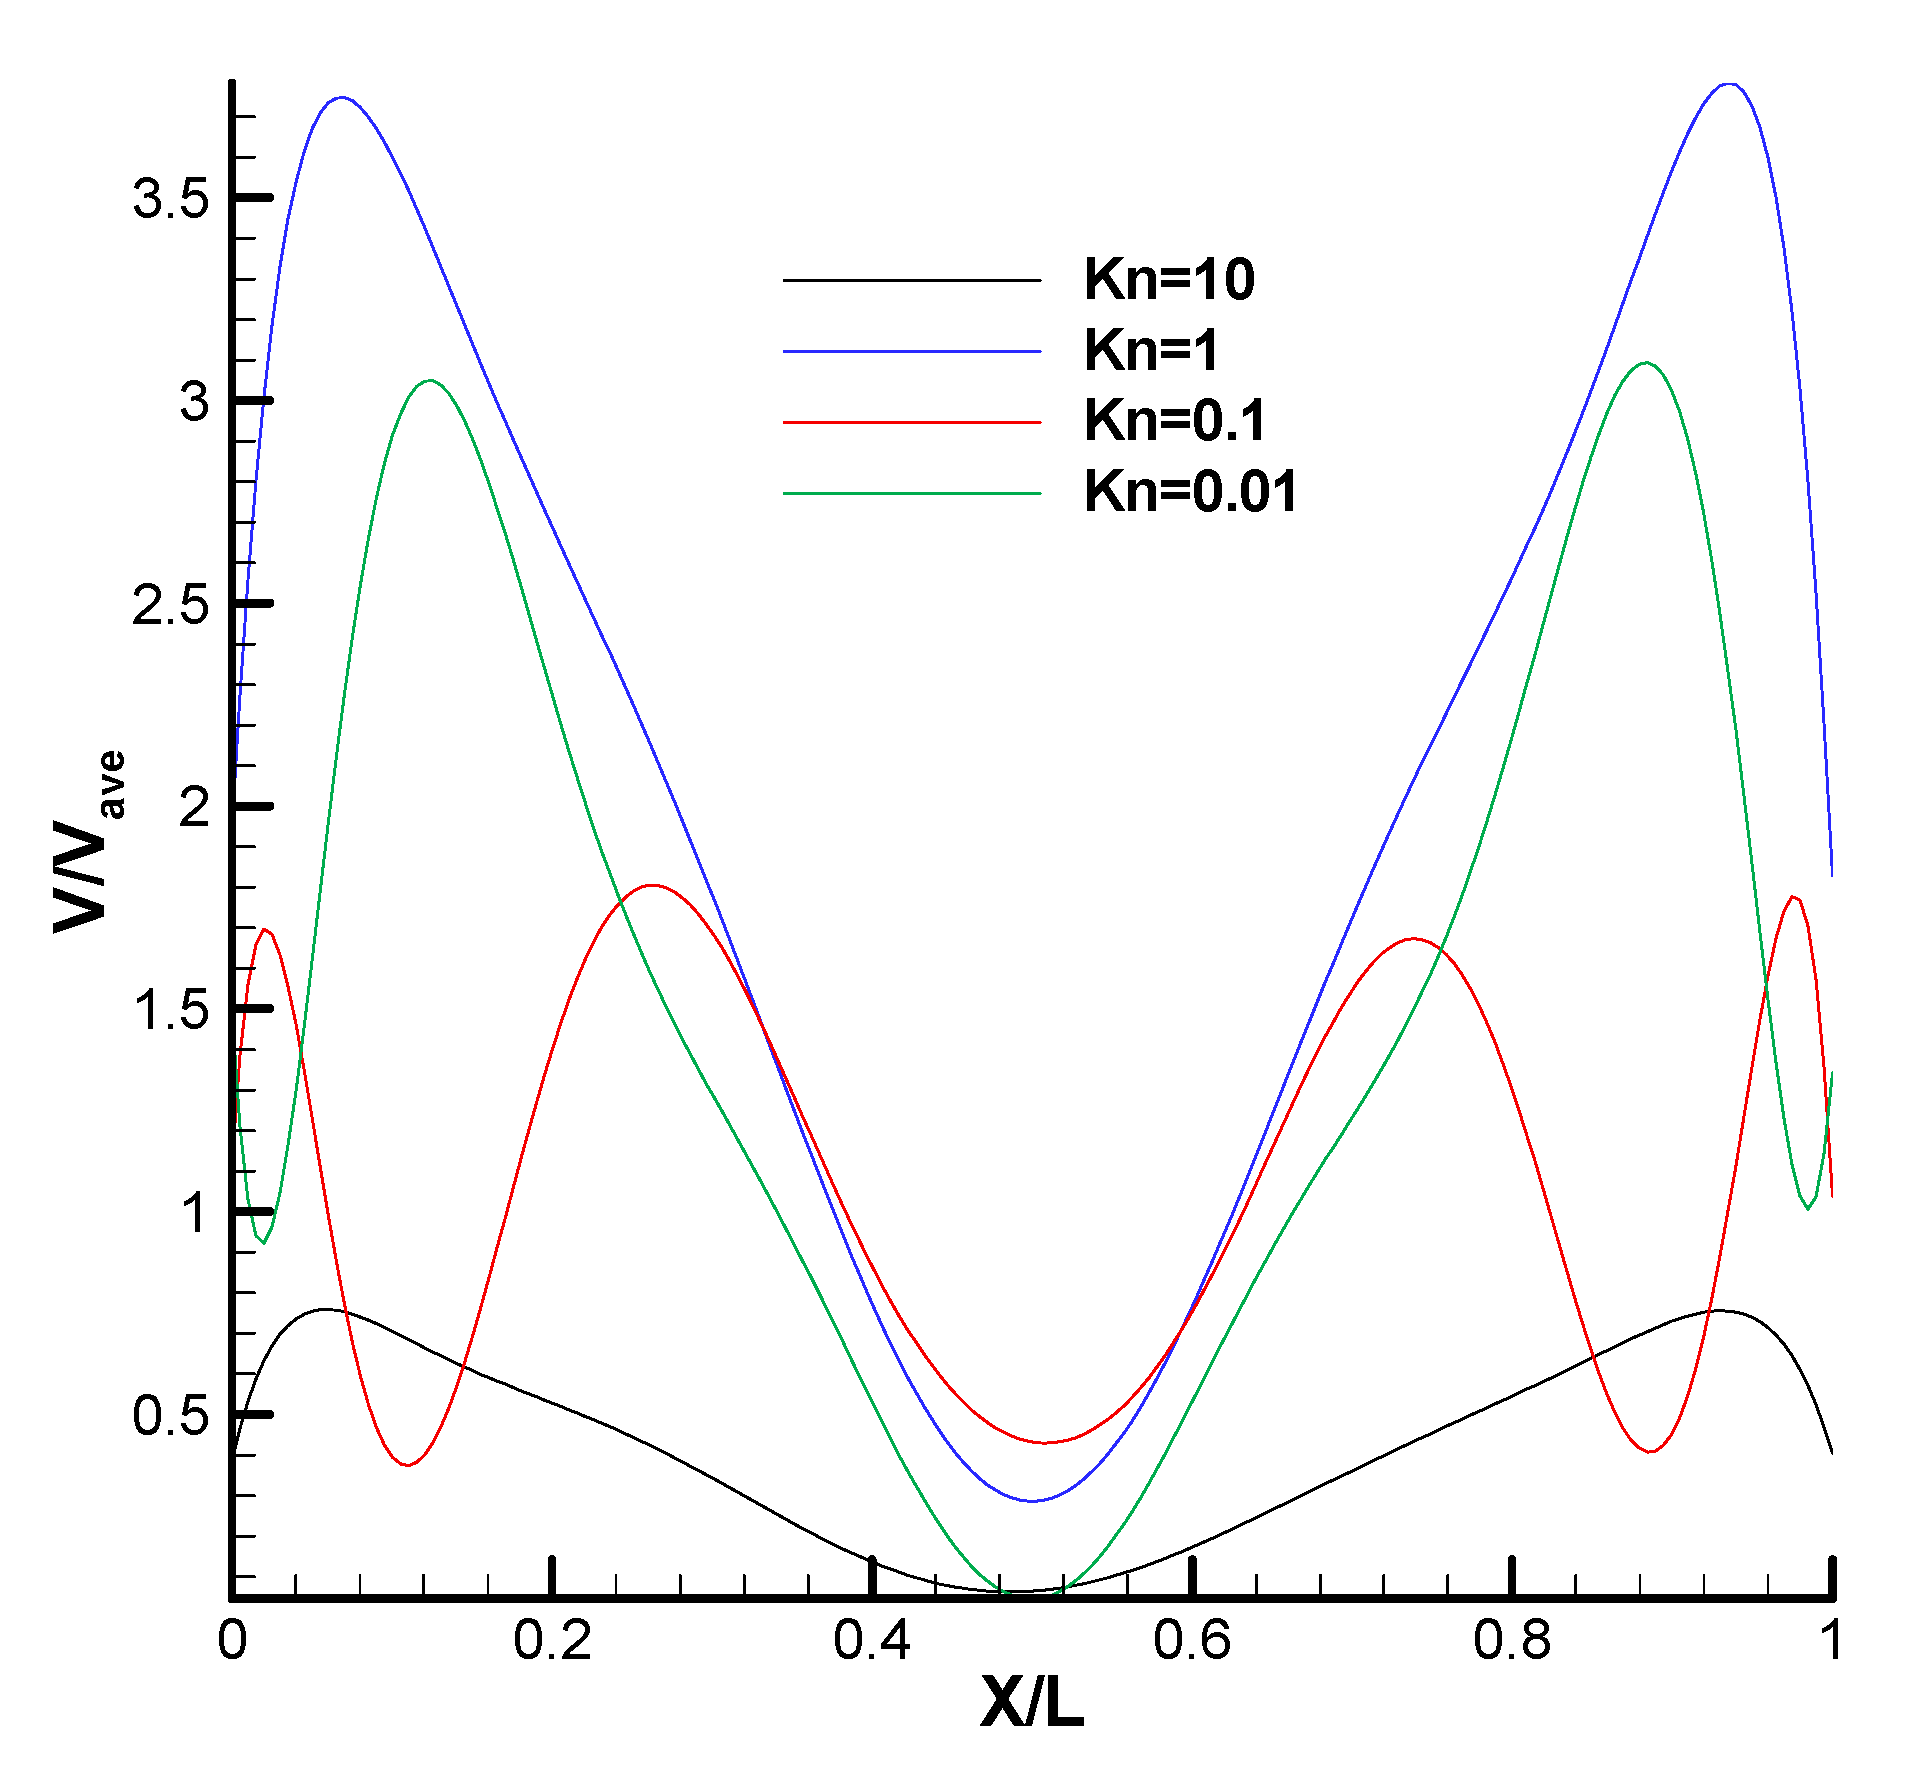
The velocity profile over a horizontal line for the range of Kn = 0.01 to Kn = 10 is shown in Figure 11 on the bottom side’s cavity. There is a concavity at Kn = 1, 0.01, which becomes deeper at Kn = 0.01. As it moves toward the side’s center, the velocity decreases at Kn = 10, until X/L = 0.5, which is zero. There are three concavities at Kn = 0.1. The local maximum velocity at Kn = 1 is higher in comparison with other Knudsen numbers.
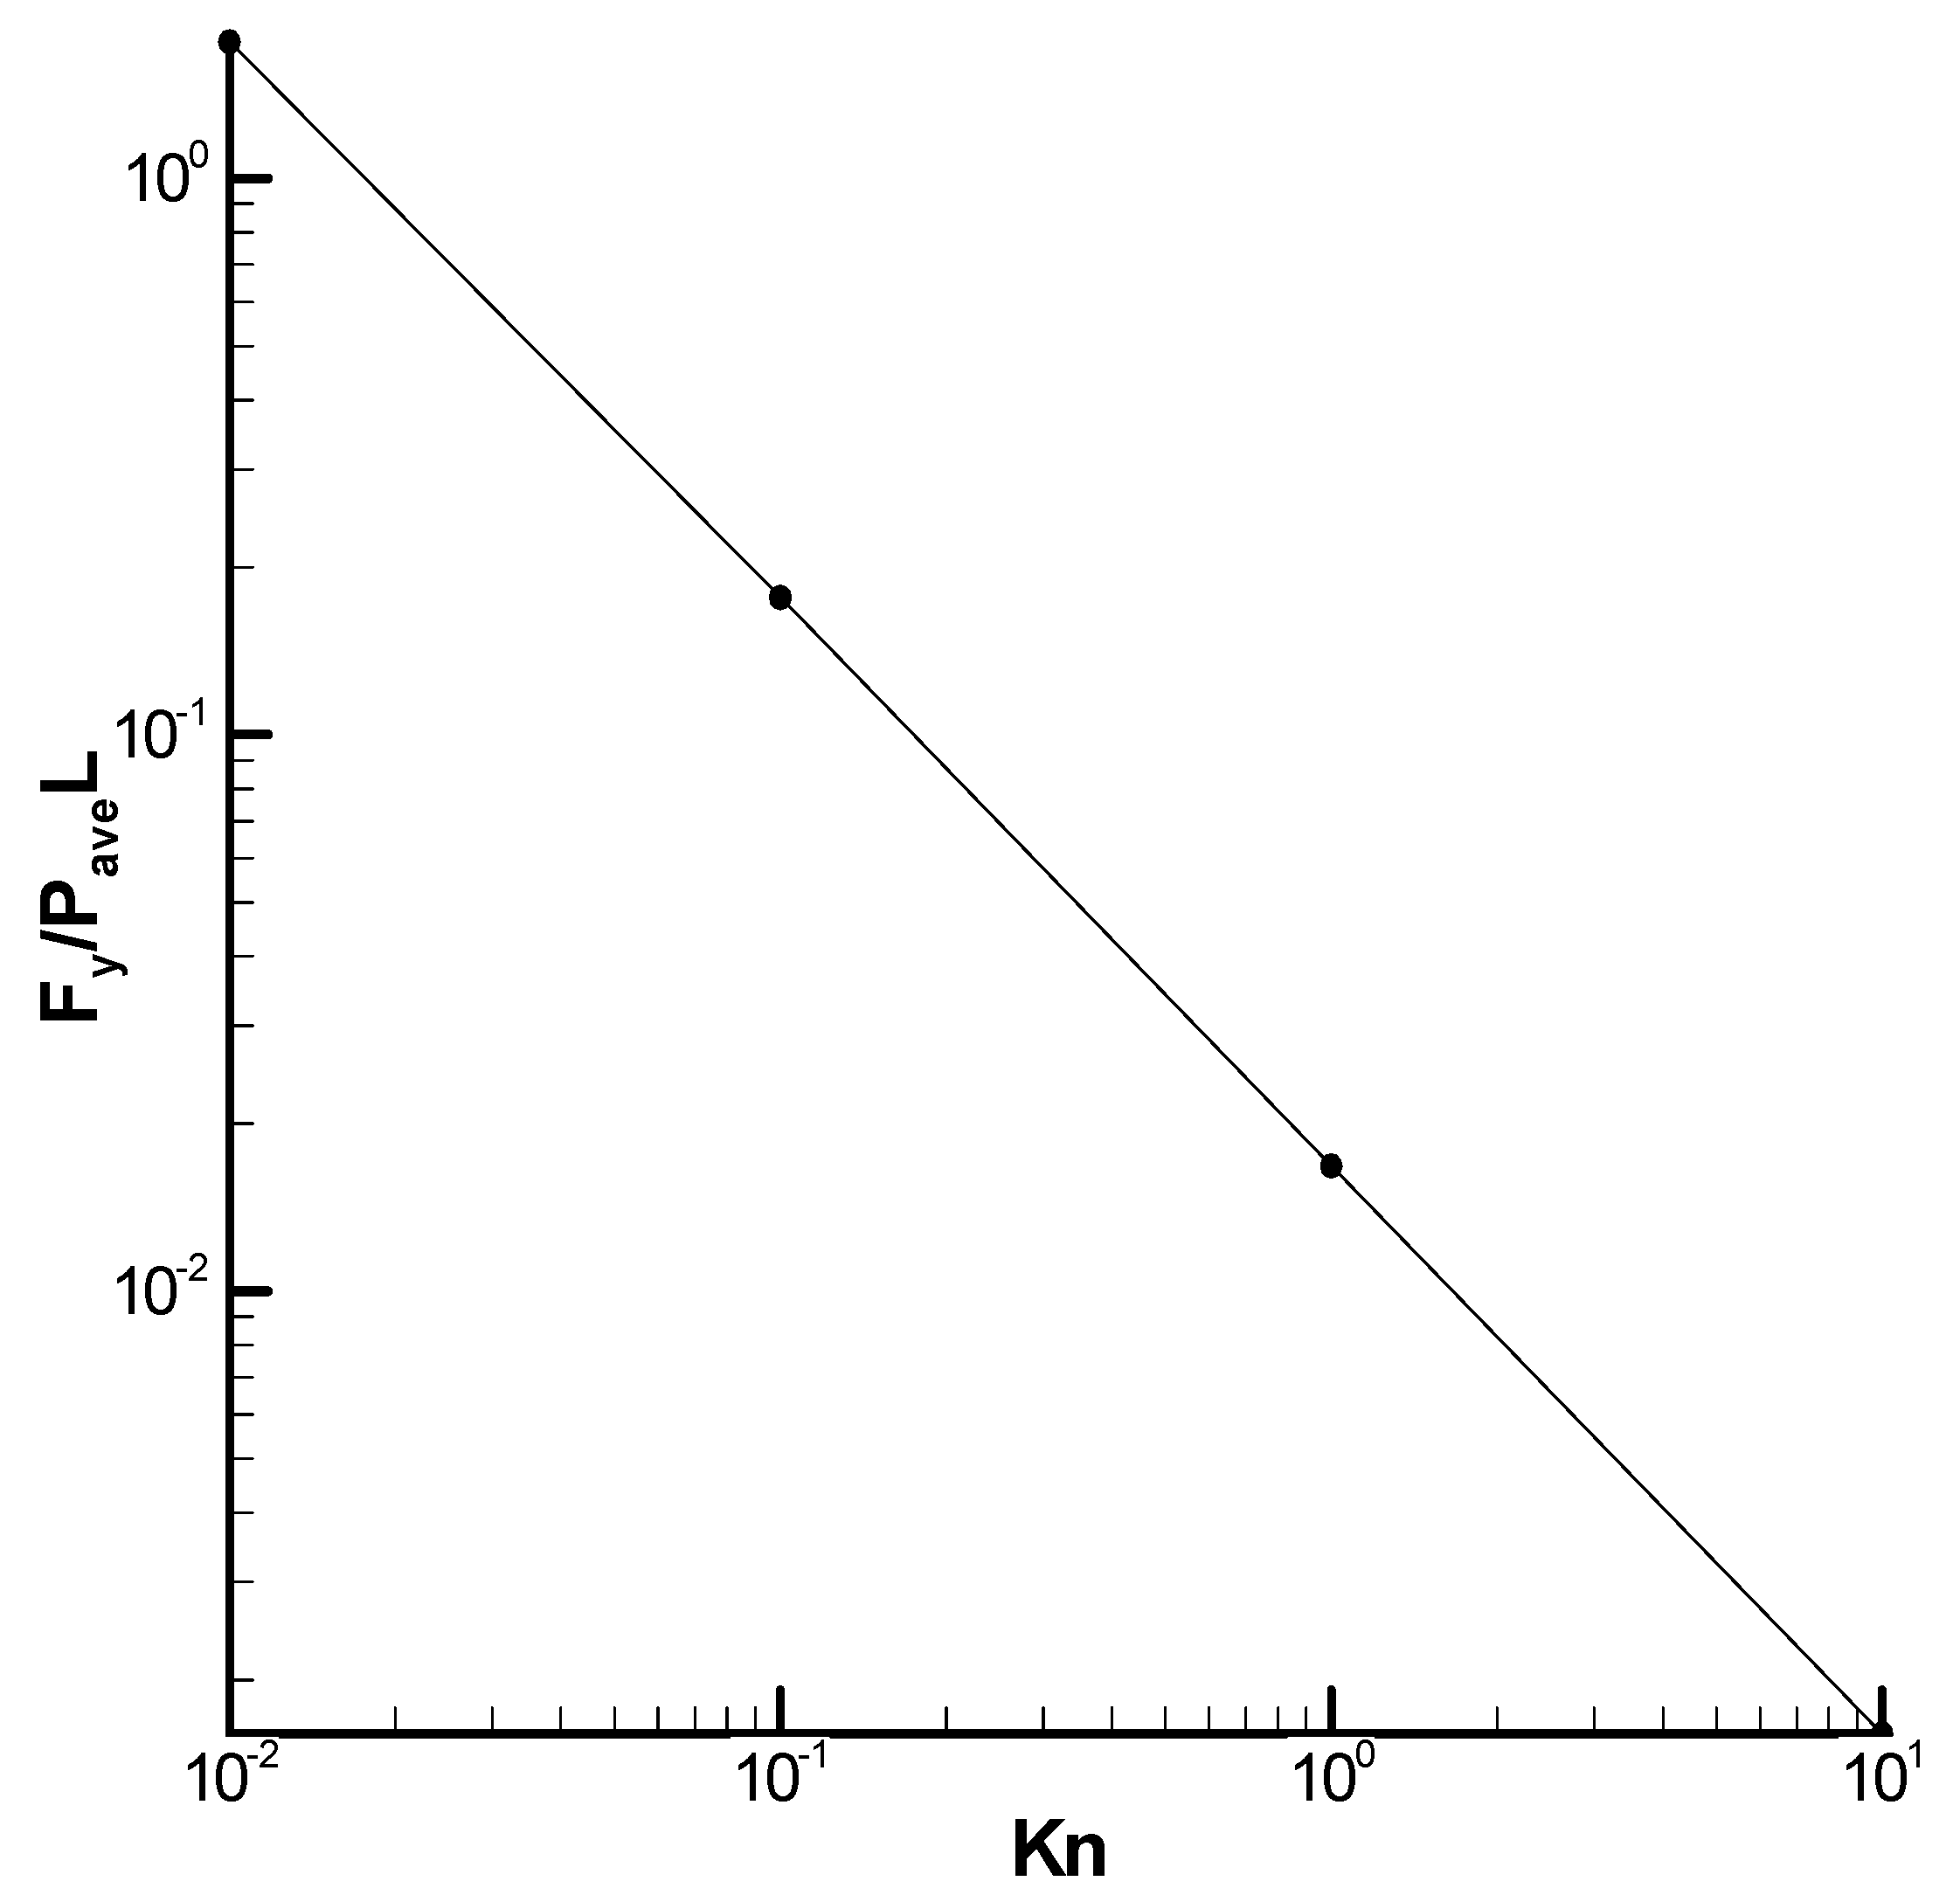
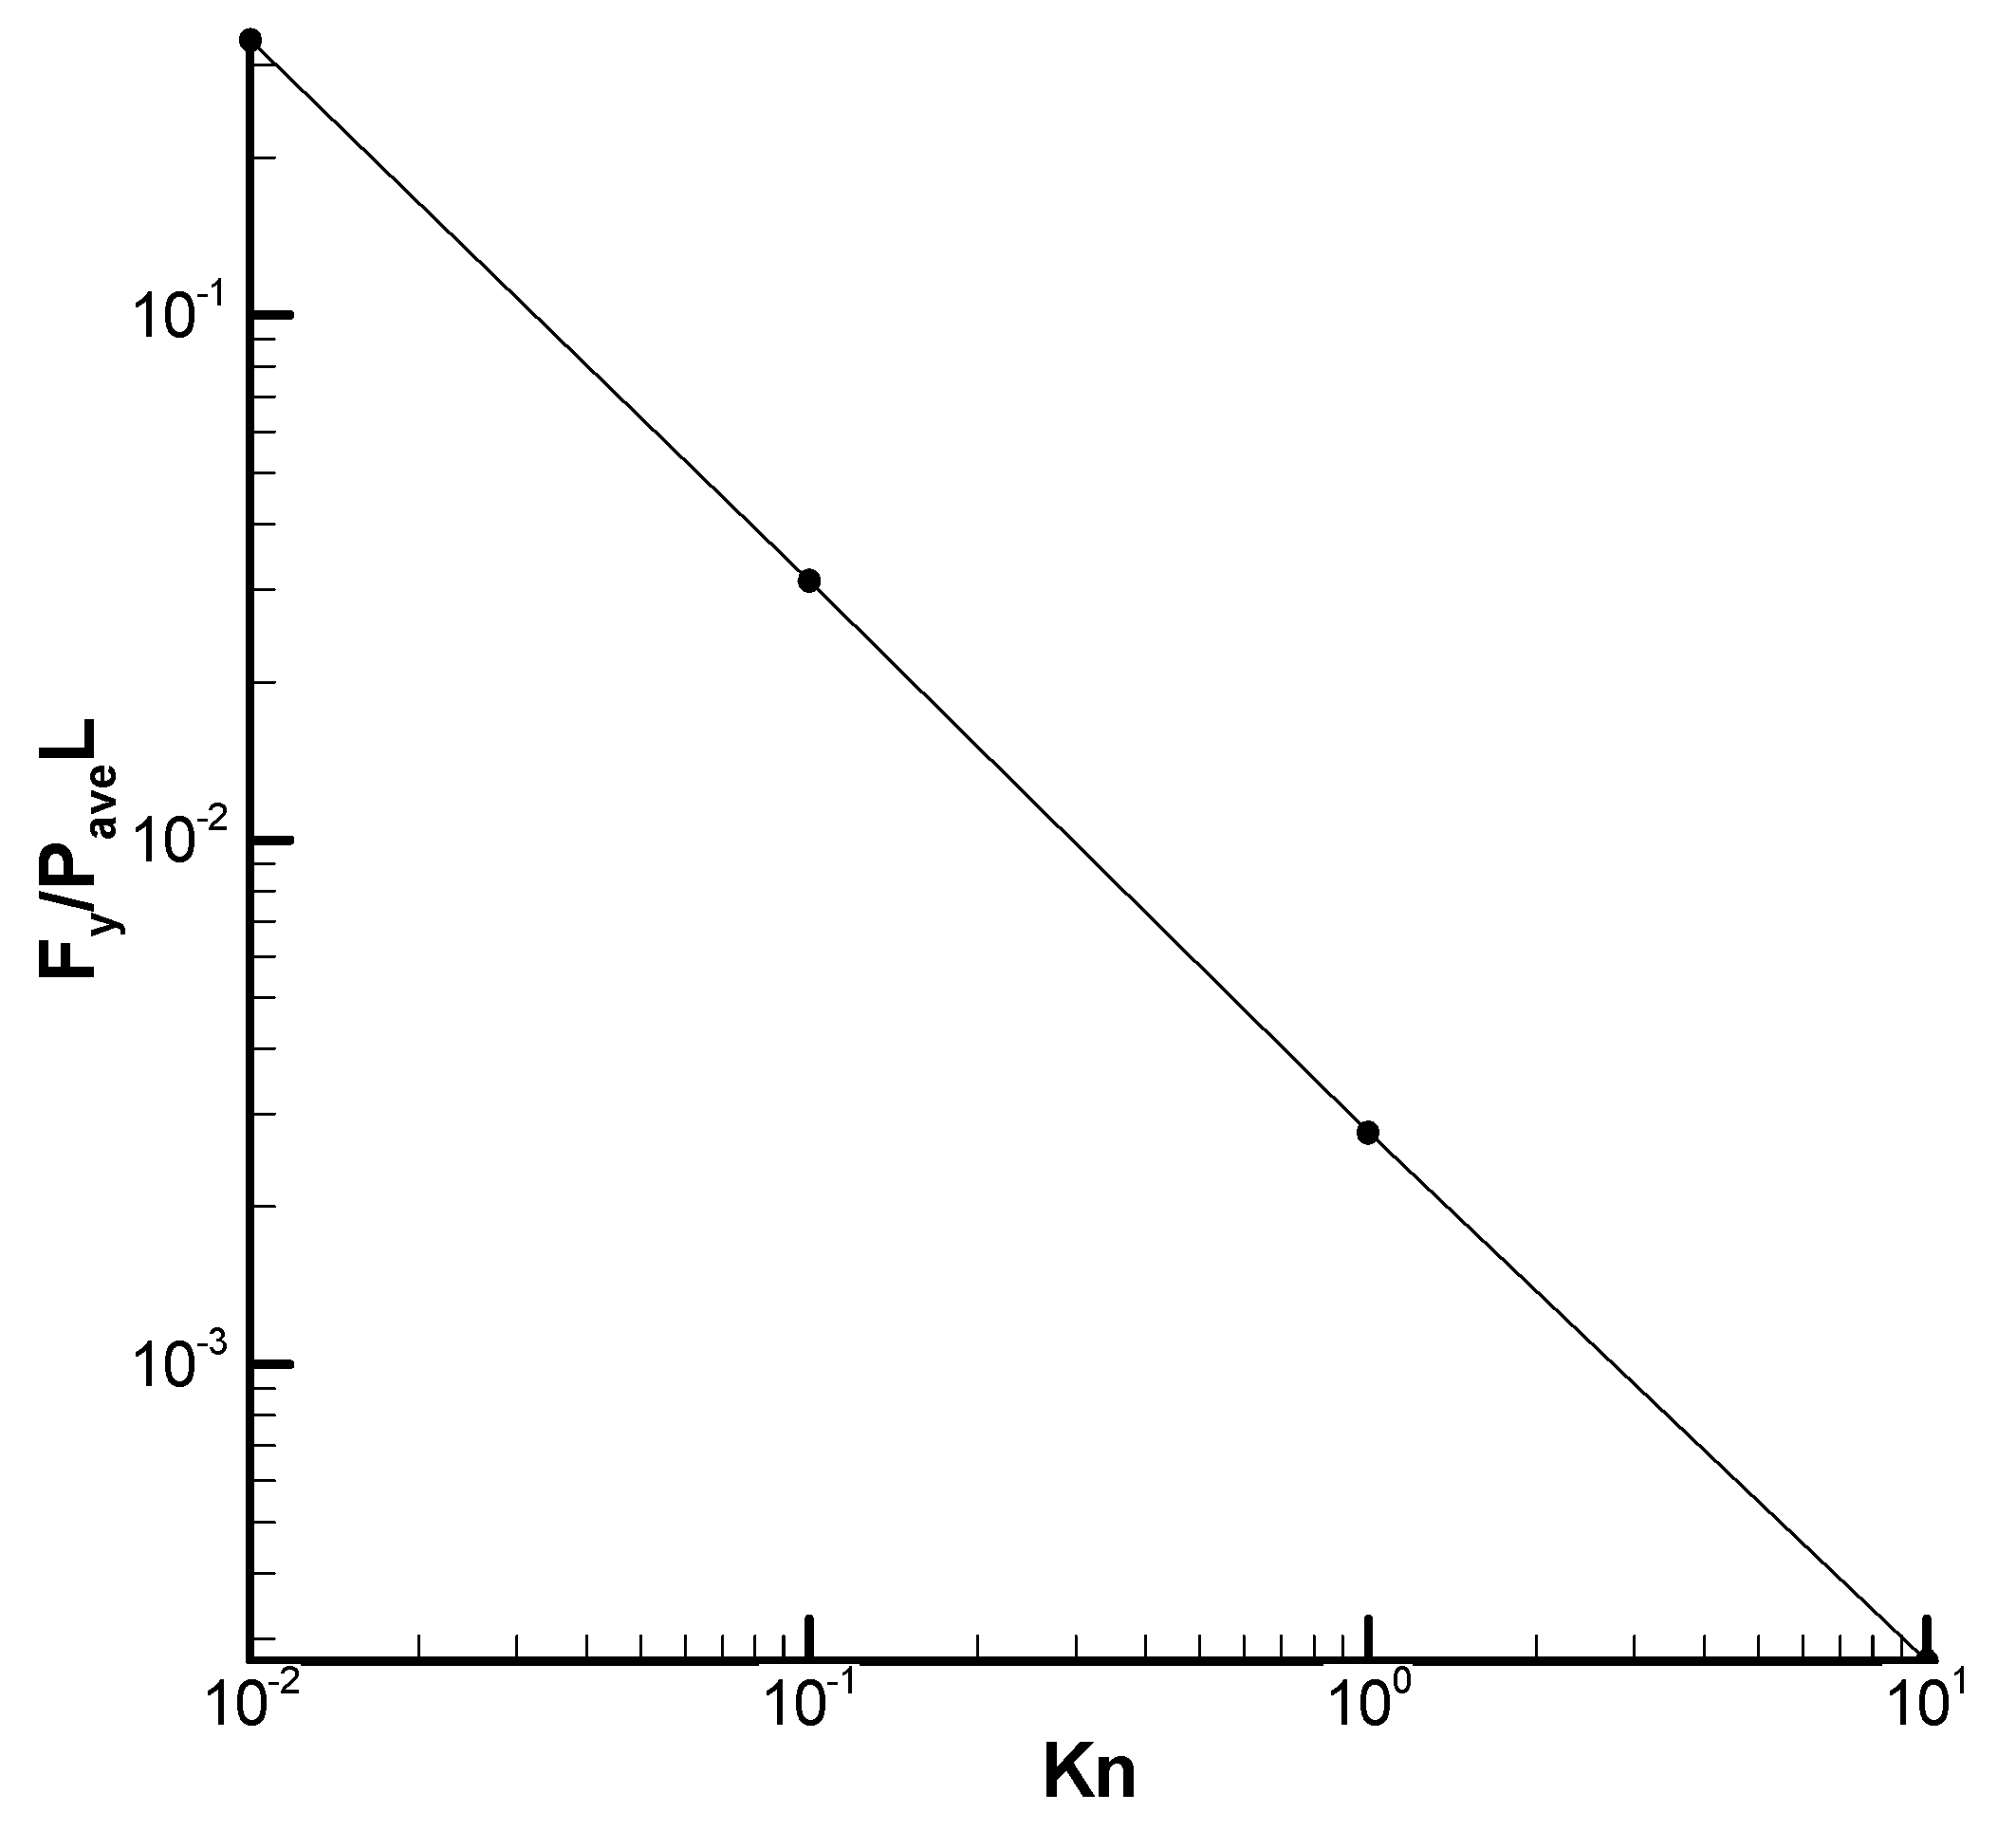
The normalized normal force on the bottom wall for a wide range of Knudsen numbers is shown in Figure 12. The axial force’s order is substantially lower than the normal force’s order. The graph shows that when Kn increases, the normal force decreases. This indicates that even when the size of the vortices grows as Kn rises, the generated flow reduces as the vortices’ strength falls and the temperature gradient becomes weaker. By taking into account the average velocity in the domain, as shown in Figure 5, this can be further substantiated. For the entire range of the investigation, the curve fitting to the normalized force exhibits a dependence on 1/Kn. Therefore, throughout the problem’s explored range, the combined effects of the temperature gradient and Knudsen number dependency yield a force that drops with 1/Kn.

4.3. Comparison of the DUGKS and DSMC Solvers for Case 1

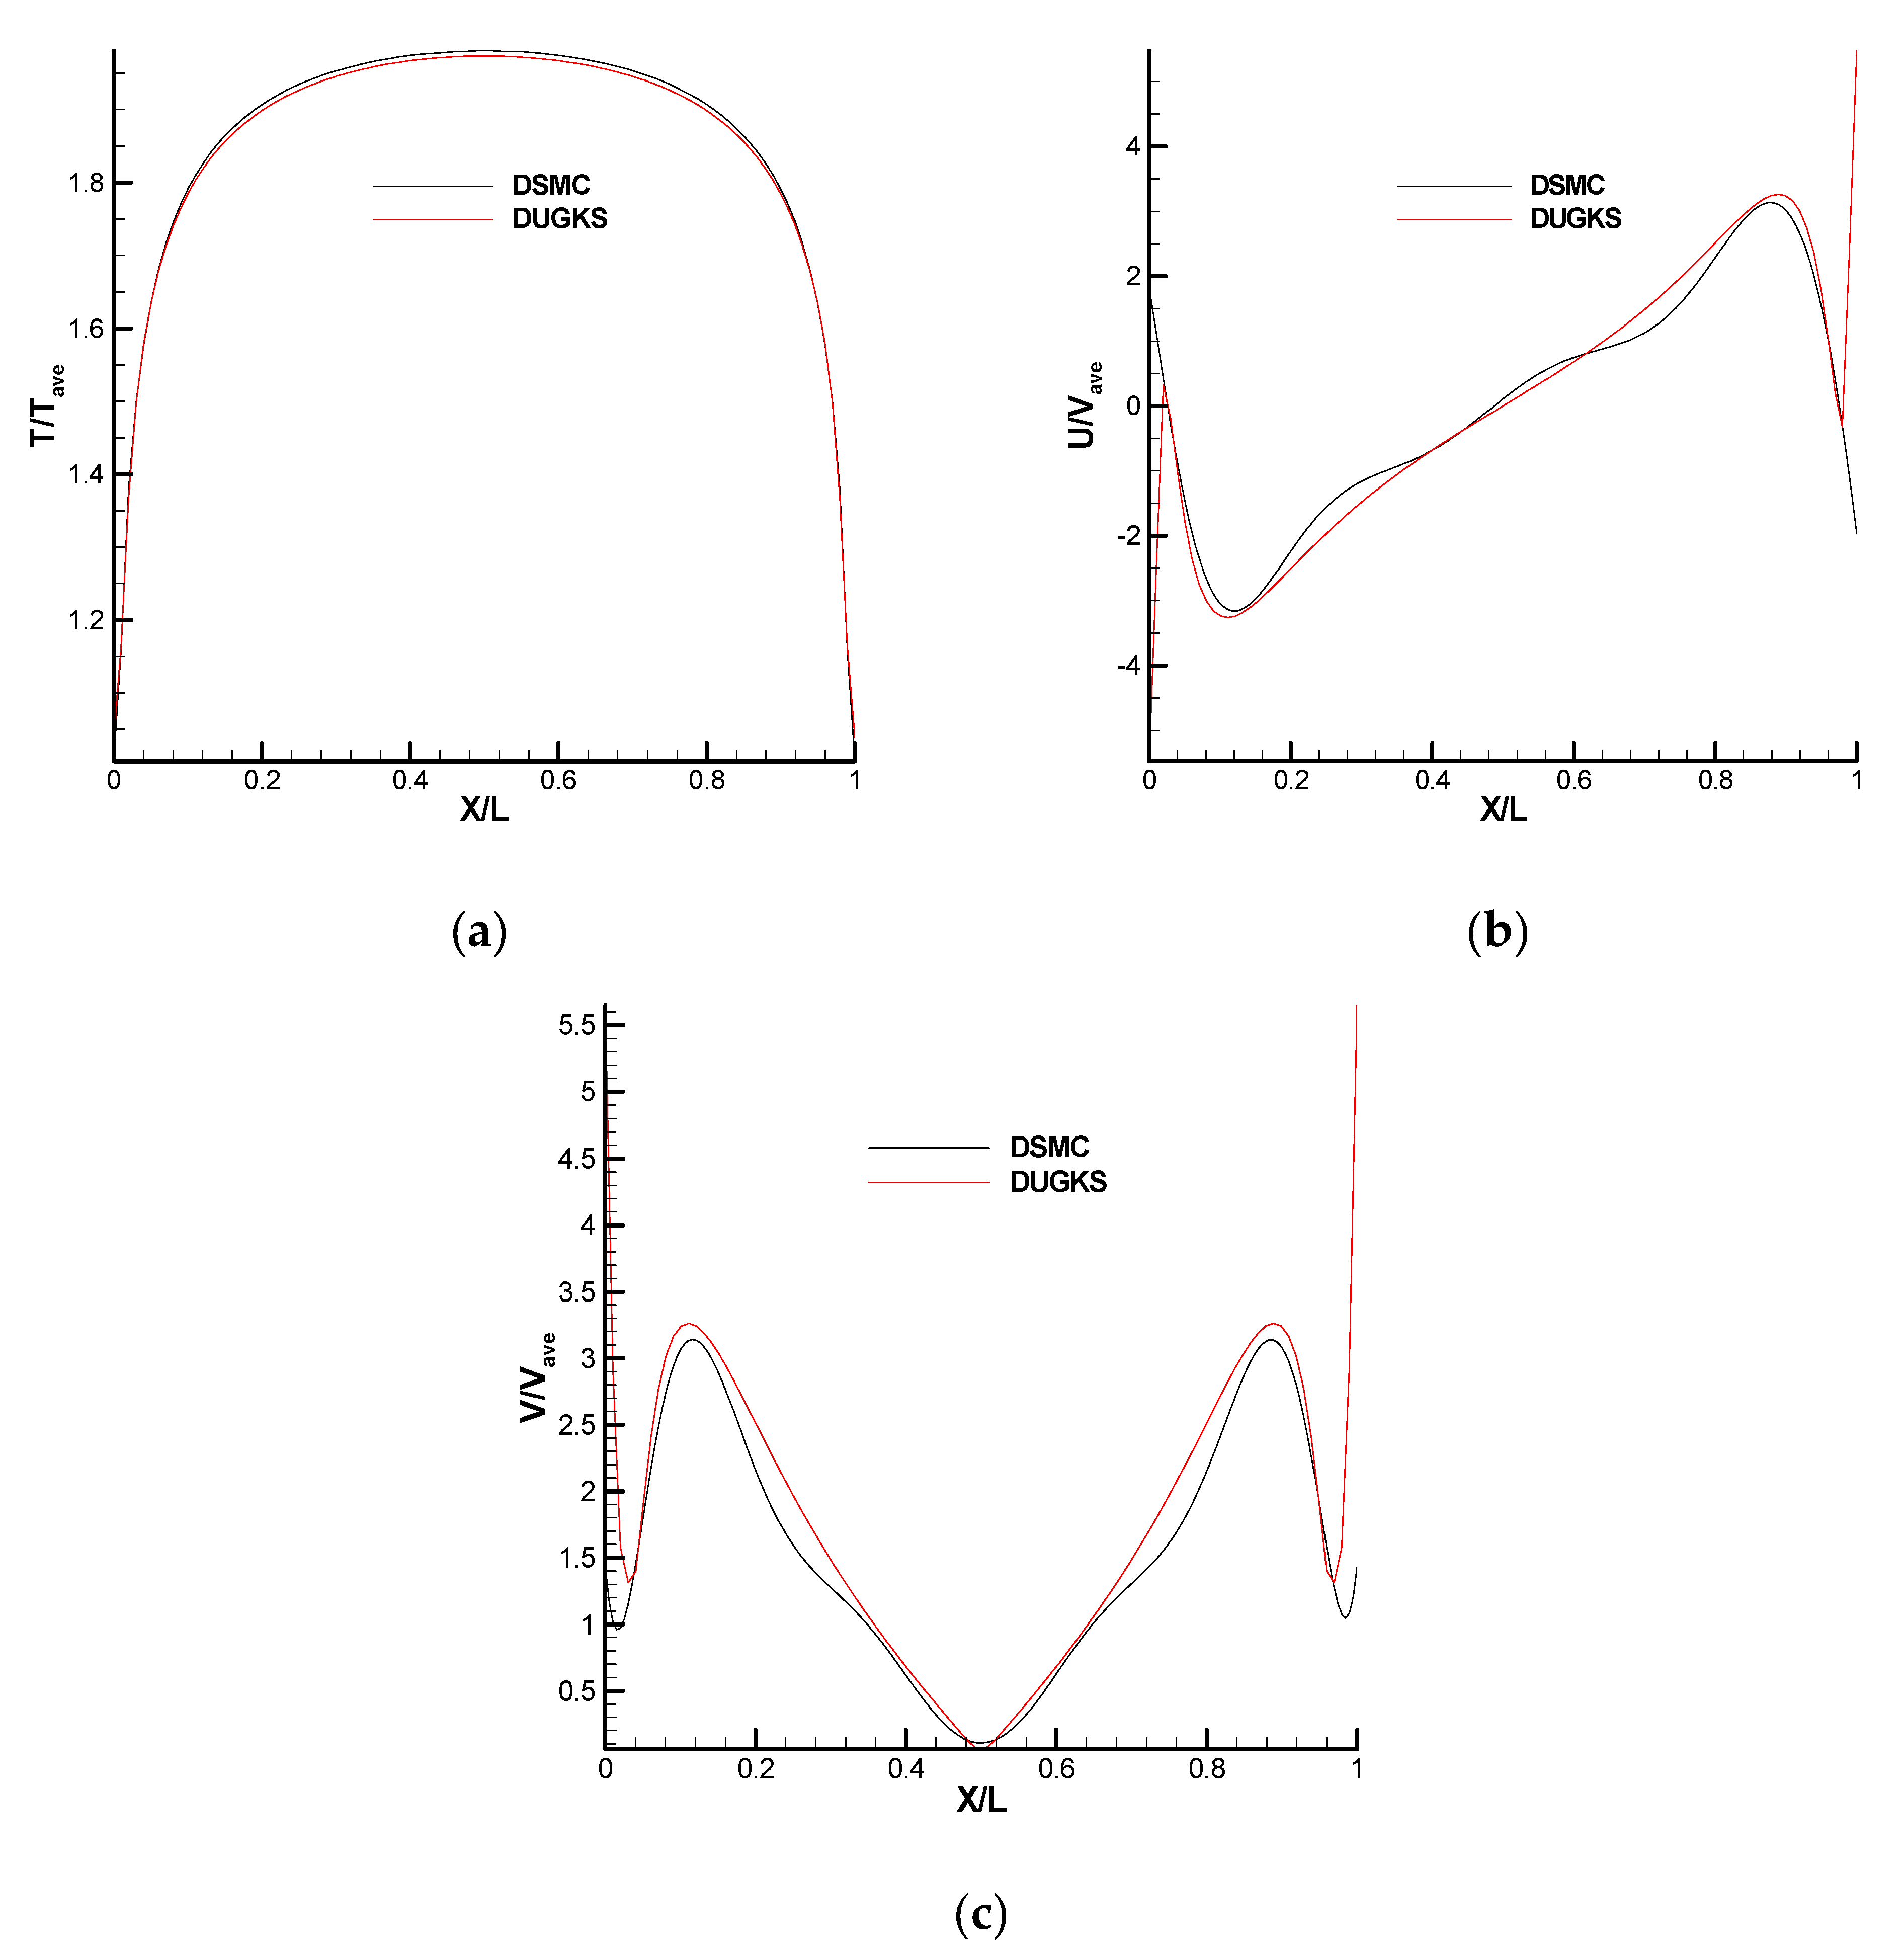
Figure 13 compares the temperature and velocity components in the axial and normal directions on the heated surface of the square in Case 1 at Kn = 0.01. As shown in Figure 13, both solvers produced nearly identical results for the temperature field and velocities. There is little difference in U-velocity and V-velocity at 0.2 < X/L < 0.4 and 0.7 < X/L < 0.9 between the DSMC and DUGKS solvers. At 0.2 < X/L < 0.4 in the U-velocity, the results of DSMC are higher in comparison with DUGKS, in the opposite of 0.7 < X/L < 0.9, the regions where U-velocity was obtained by the DUGKS solver were higher than with DSMC. For the V-velocity at both zones, the values obtained from DSMC were smaller than with the DUGKS solver.

4.4. SNIT Solver for Case 1

The streamlines in the cavity in case 1 are depicted in Figure 14 using SNIT predictions at Kn = 0.01. The simulation results showed that the large vortices in the cavity were caused by nonlinear thermal stress flow. By solving the set of SNIT equations and by setting the coefficients γ 3 and γ 7 on the left-hand side of Equations (14) and (15) to zero, no vortex or flow was observed in the domain. This shows that the nonlinear thermal stress factor was the parameter that caused the induced flow in the square under consideration. Four tiny vortices can be seen in the DSMC forecasts around the four corners at Kn = 0.01, but not in the SNIT prediction. This may be a result of the SNIT equation’s flaw: the SNIT equation includes O(1) for temperature and O(Kn) effects in flow velocity; as a result, SNIT cannot capture vortices close to the corners which are O(Kn2). The position and shape of the vortices with SNIT and the predictions of DSMC and DUGKS depicted in Figure 10 differ, as the vortices’ centers are closer to the corners in the solution of SNIT compared to DSMC and DUGKS. The DSMC and DUGKS streamline directions are from the cold to the hot zone.

4.5. Streamlines and Temperature Contours in the Rectangular Bend in Case 2

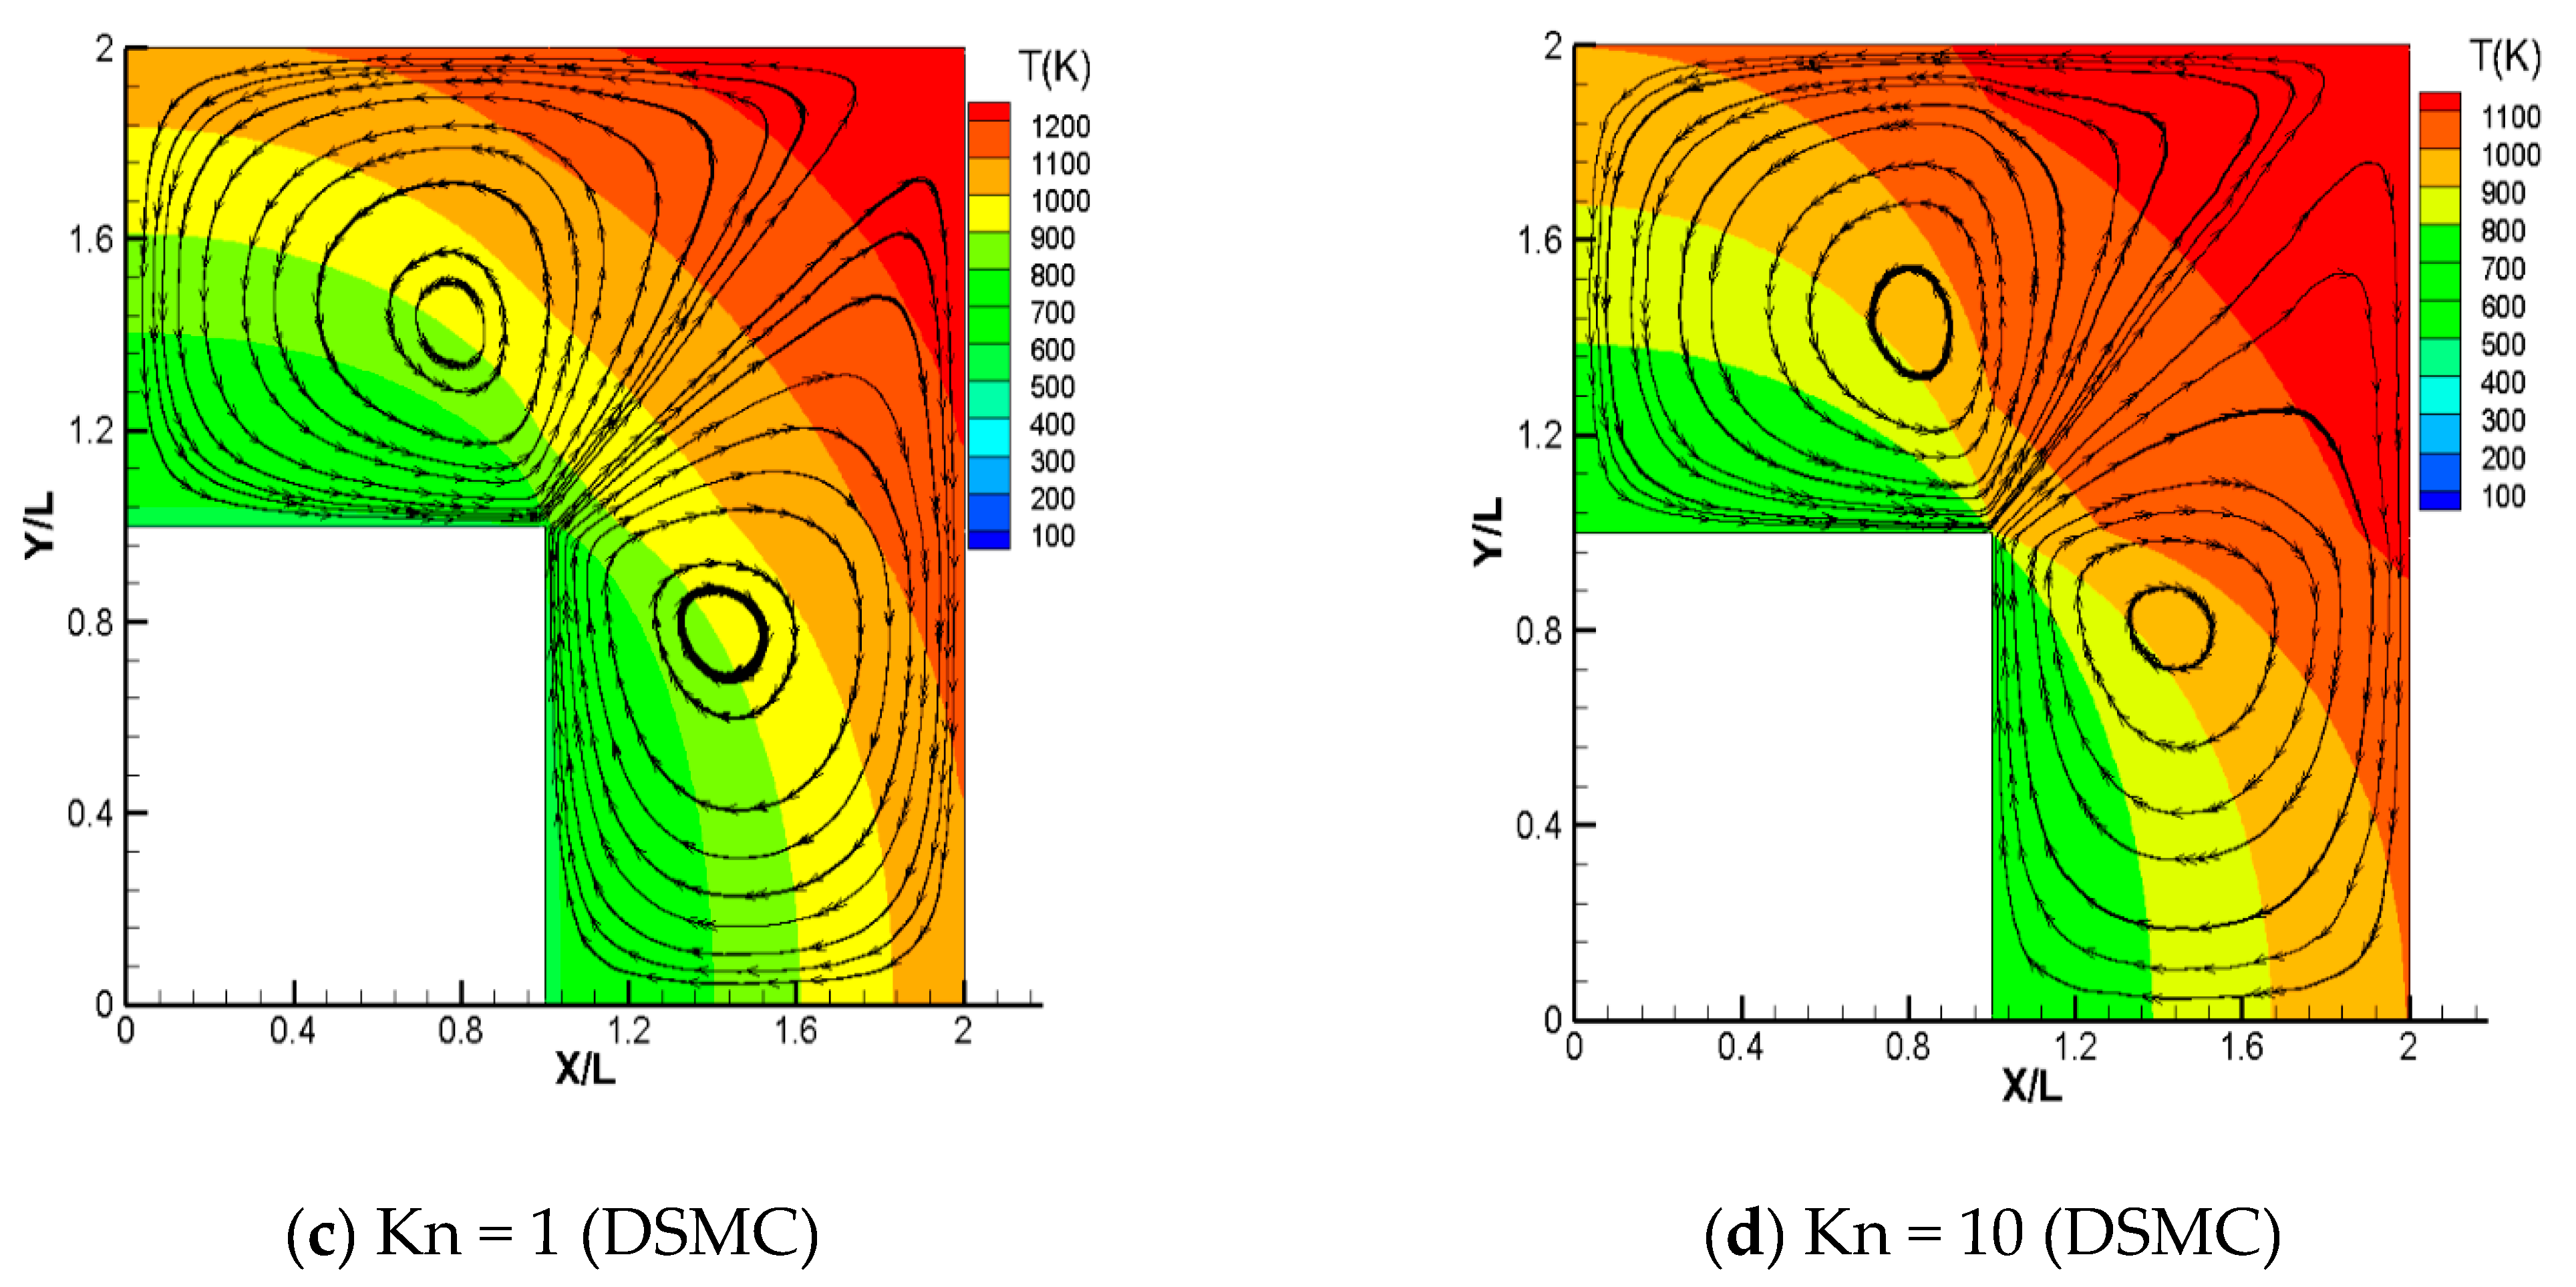
The streamlines produced by the DSMC and DUGKS solvers are displayed in Figure 15 for Kn = 0.01, 0.1, 1, and 10. DUGKS was used to obtain the Kn = 0.01, and the DSMC solver provided the others. At all Knudsen numbers, the realm was entirely dominated by two enormous vortices. Due to the non-straight isothermal curves and the significant temperature differential |TH -TC|/TC, these vortices were most likely the result of nonlinear thermal stress effects.

4.6. Velocity Distribution and Force in Case 2 with the DSMC Solver

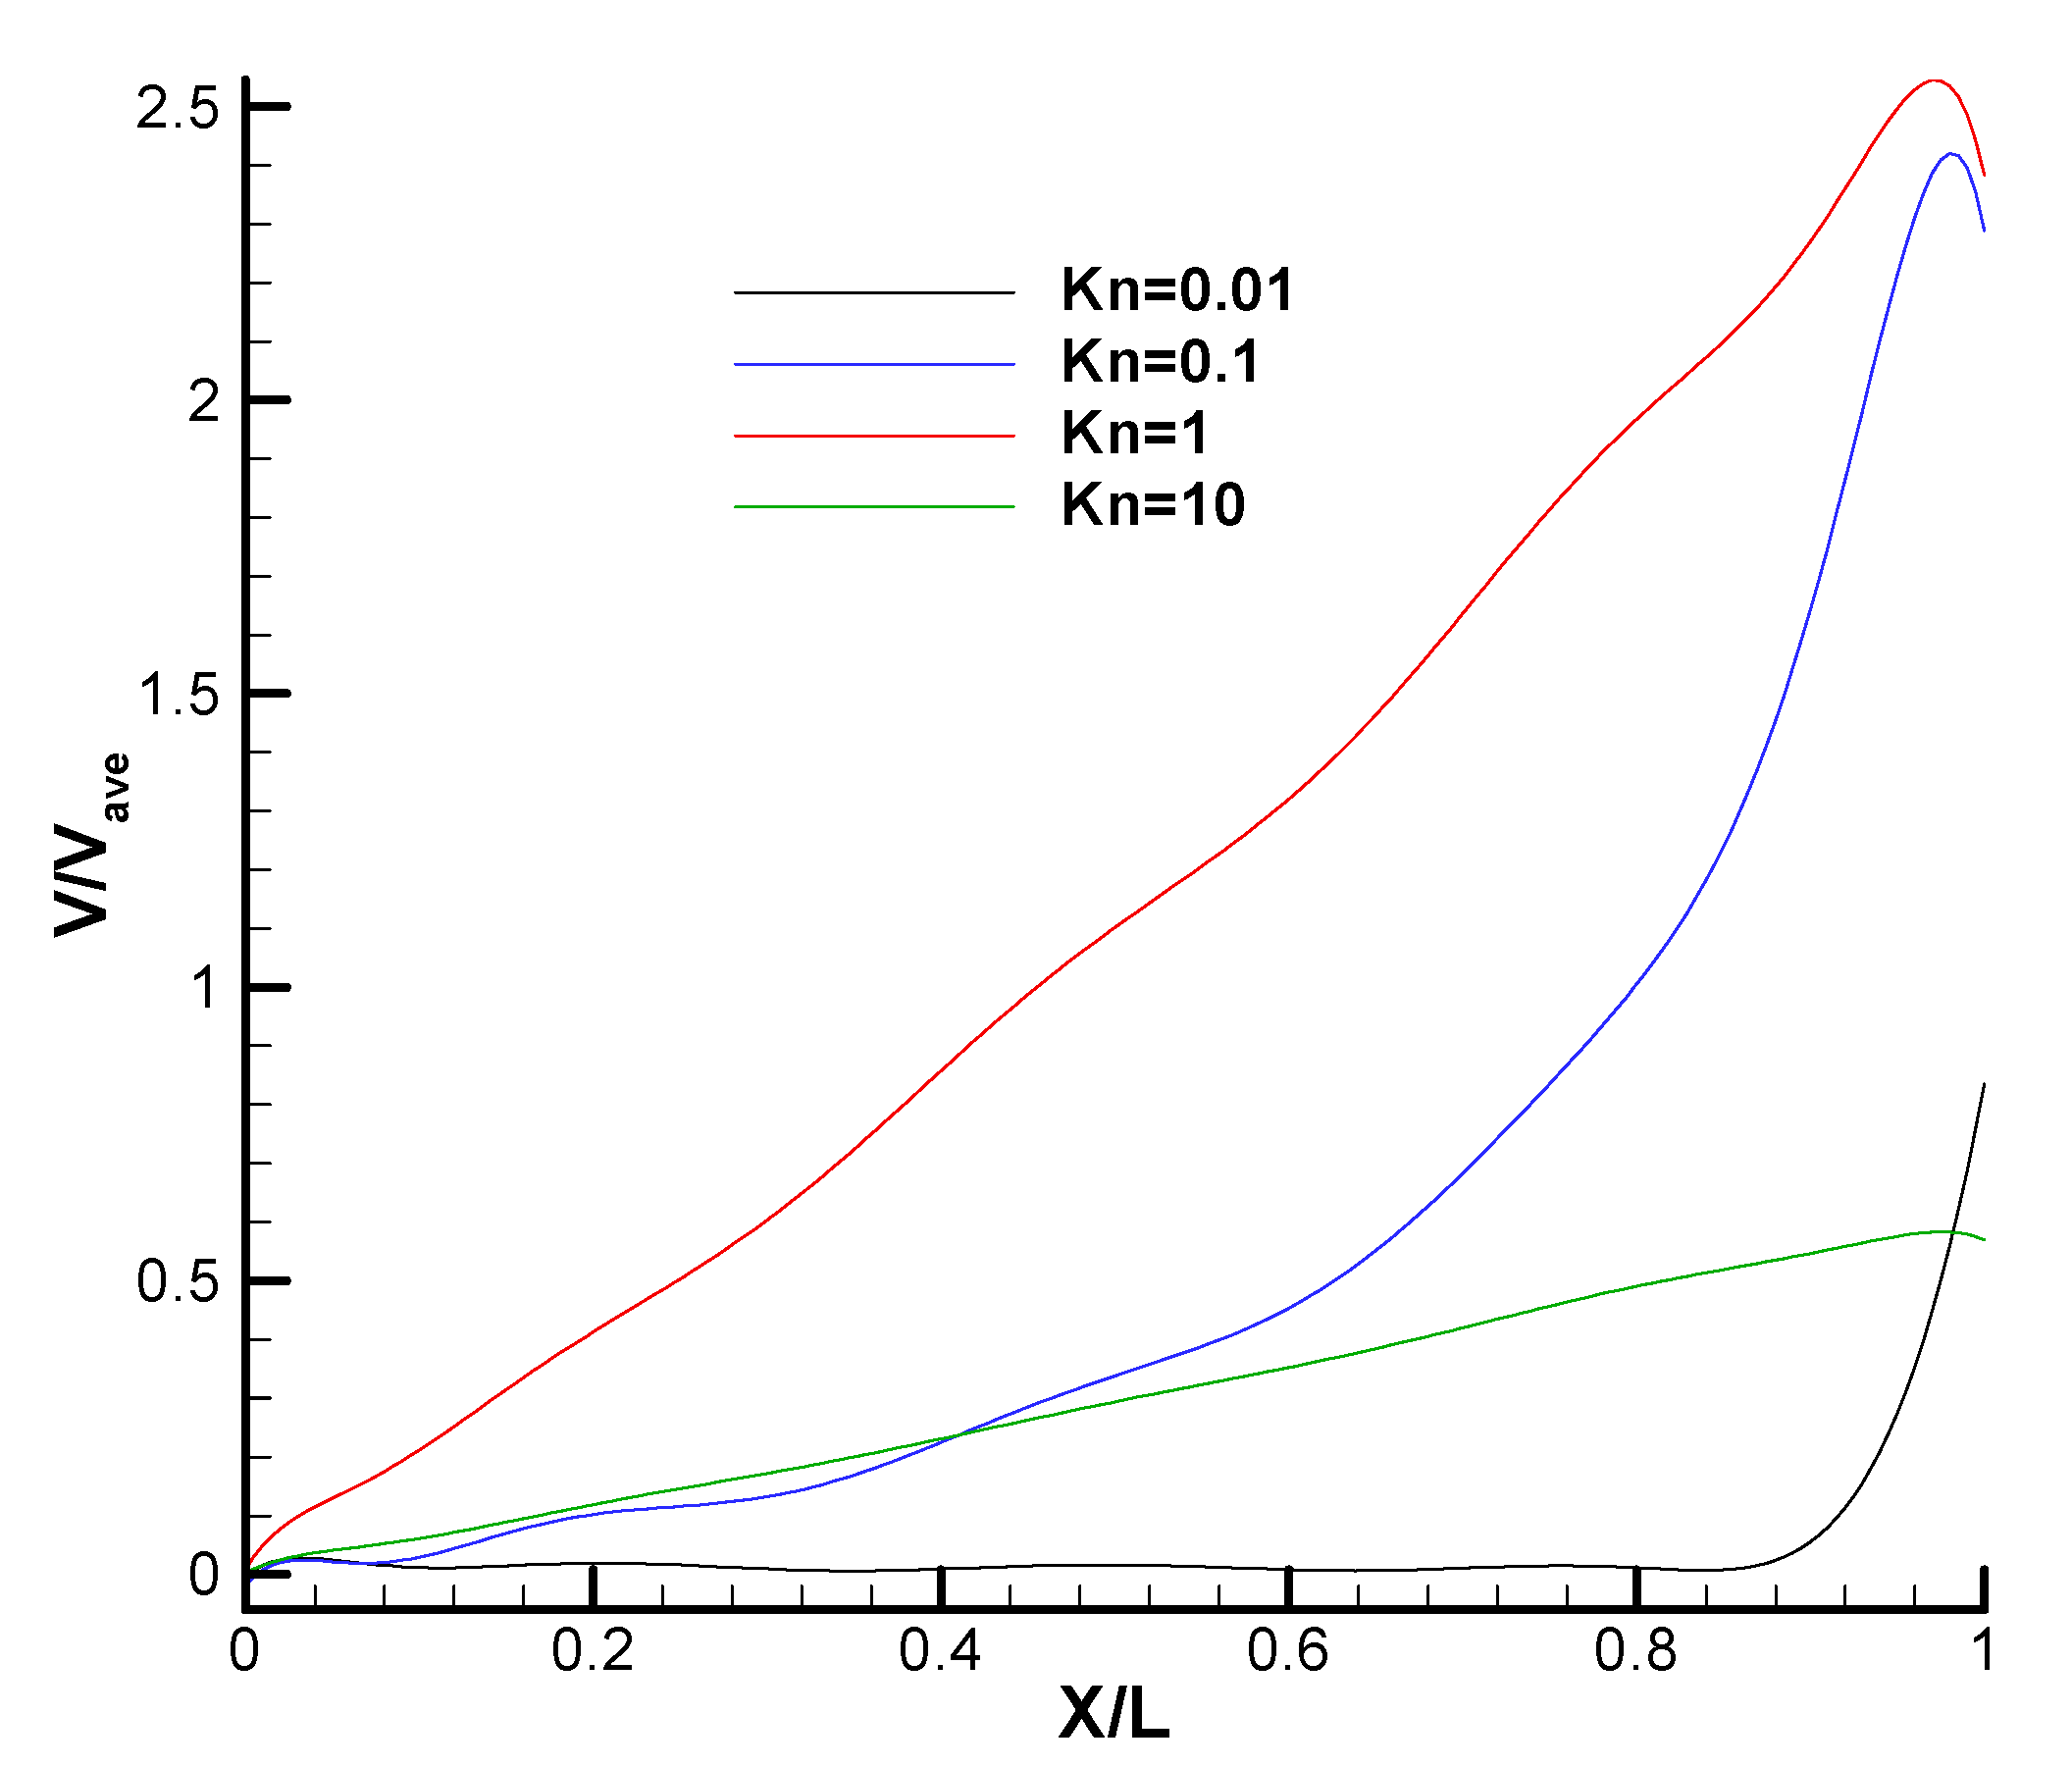
The velocity profile over a horizontal line for the range of Kn = 0.01 to Kn = 10 is shown in Figure 16 on the cold side of the geometry. There is a rising trend in all Knudsen numbers except Kn = 0.01, which decreases in the region 0 < X/L < 0.84; then it increases.
The normalized normal force on the cold wall for a wide range of Knudsen numbers is shown in Figure 17. The graph shows that when Kn increases, the normal force falls. Vortices become weaker and the generated flow becomes weaker as the temperature gradient weakens with the increase in Kn. For the whole range of the experiment, the normalized force curve indicates a dependence on 1/Kn.

4.7. Comparison of the DUGKS and DSMC Solvers in Case 2

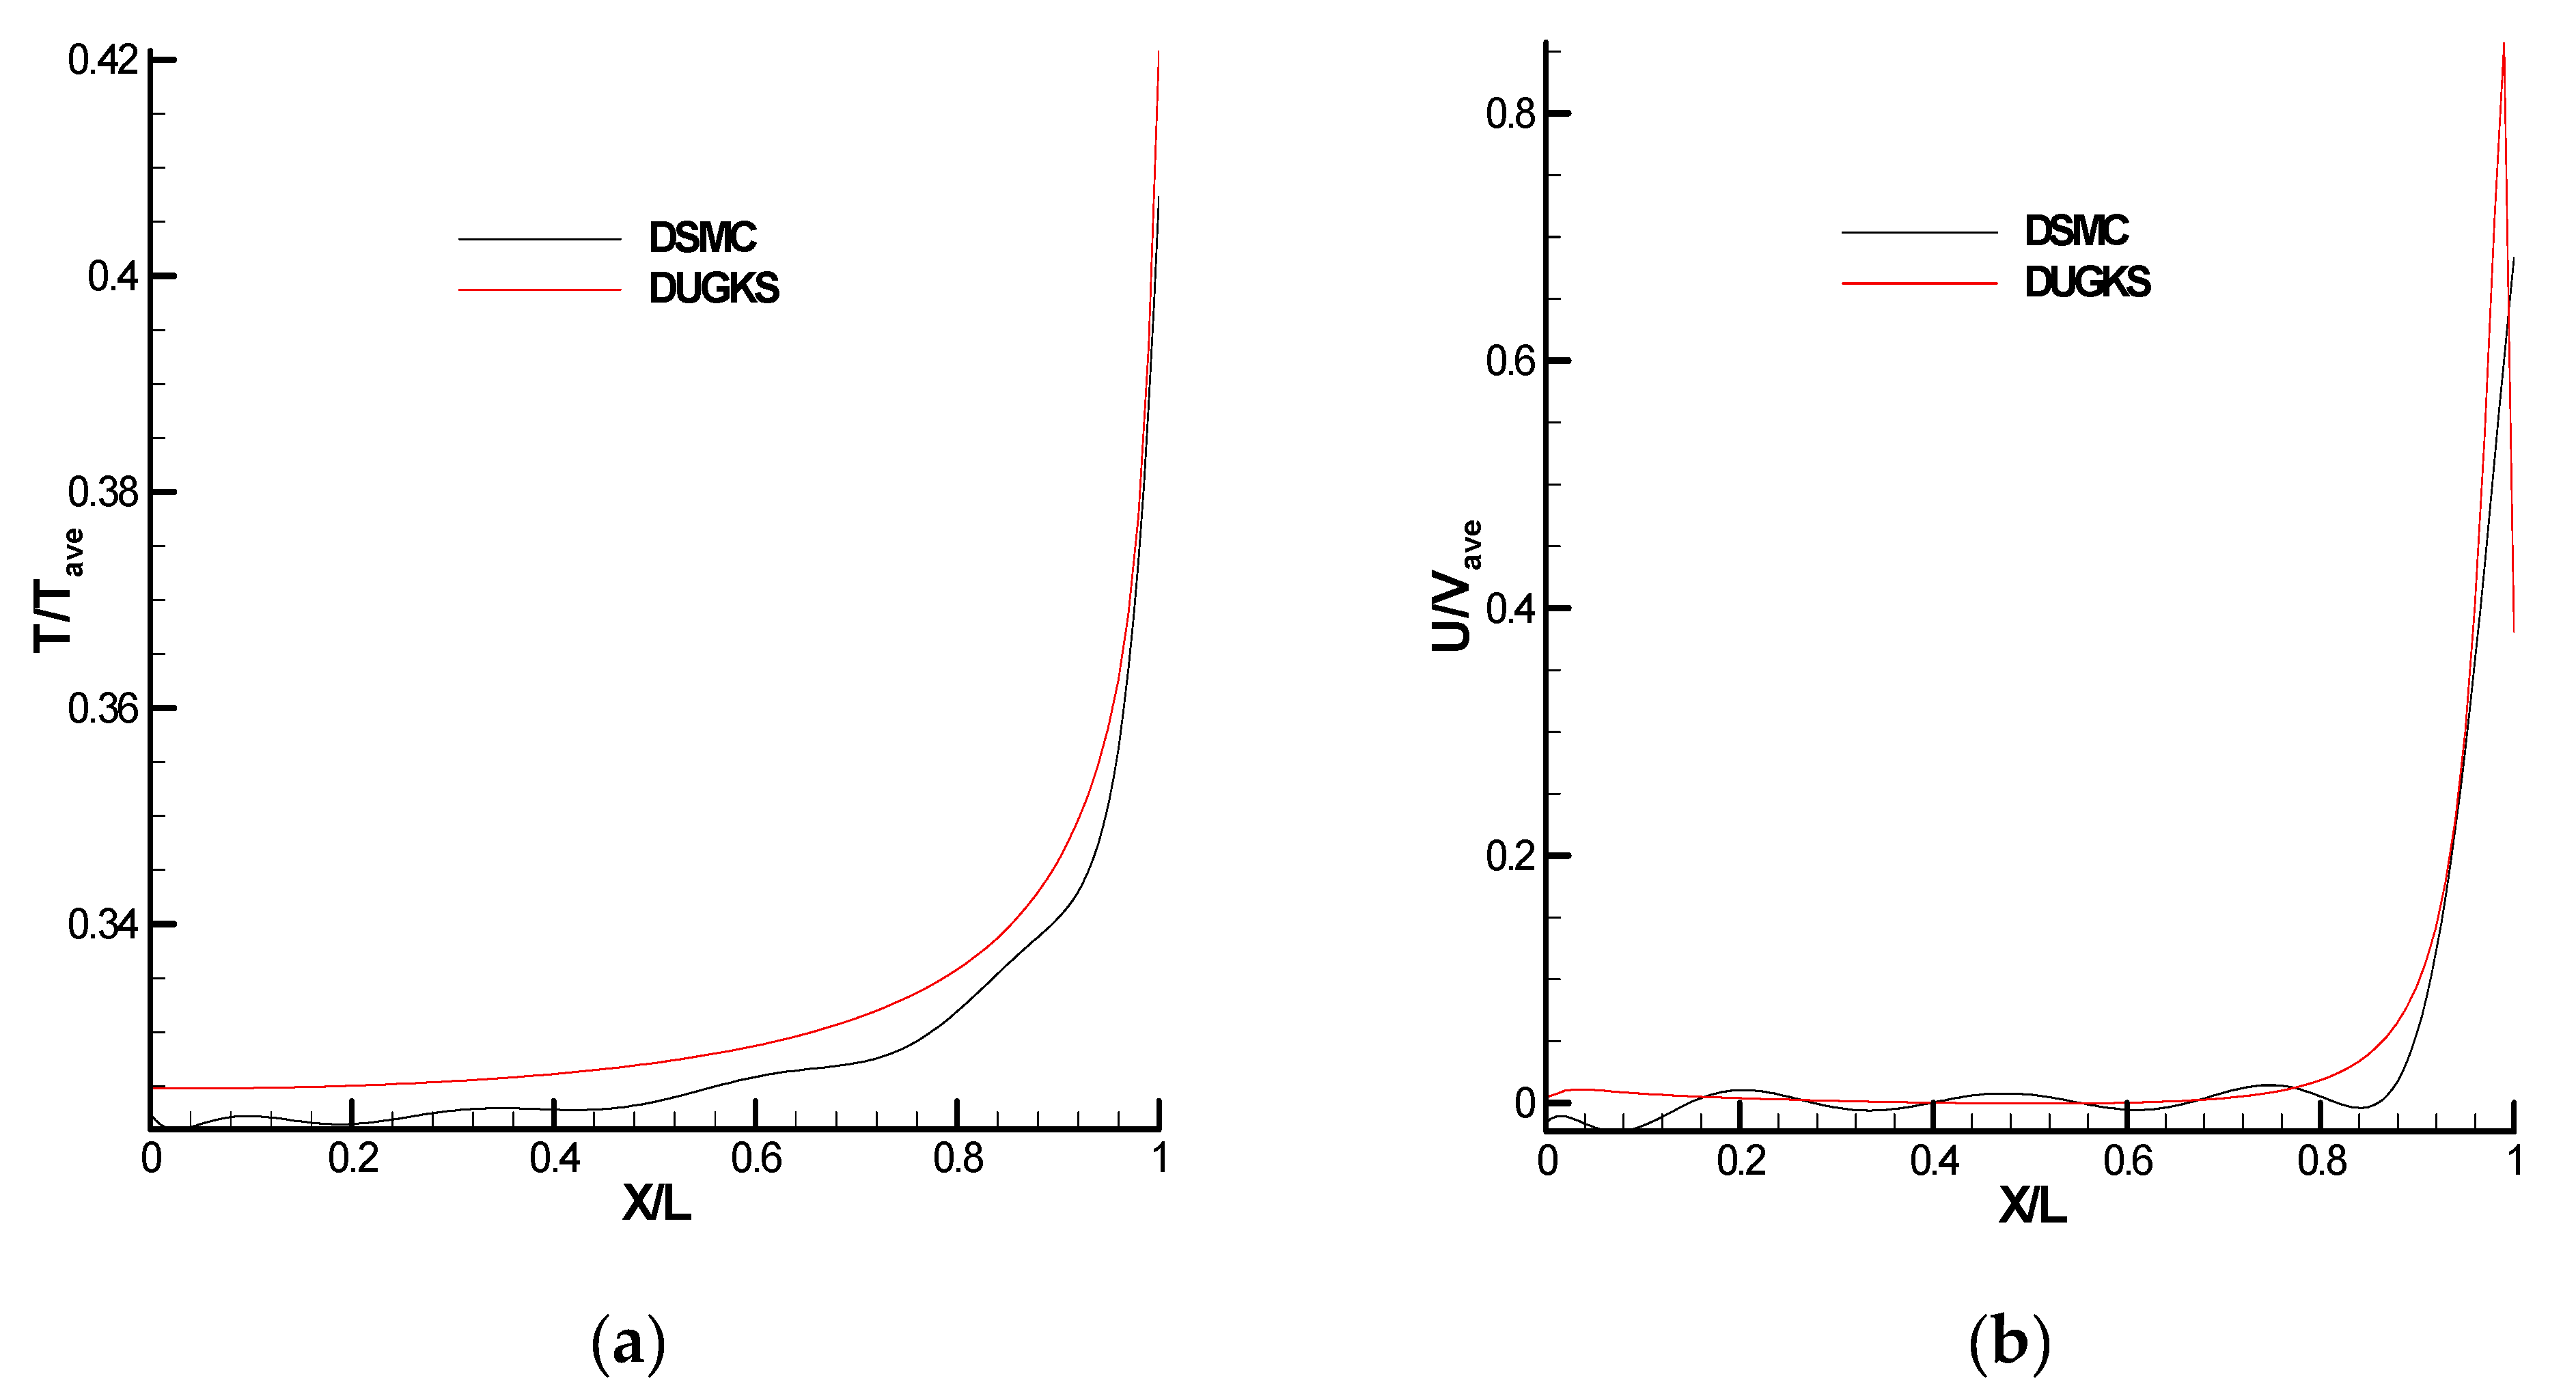
In Case 2 at Kn = 0.01, Figure 18 compares the velocity profile and temperature on the rectangular bend’s cold surface. As seen in Figure 18, both solvers produced nearly identical results. The temperature fields of the two solvers varied slightly, as the values obtained by the DUGKS solver were larger than DSMC’s, which might be because the two solvers use different temperature models. The DUGKS and DSMC solvers are based on the Shakhov model and the Boltzmann equations, respectively, so a slight difference is acceptable.

4.8. Verification of the SNIT Solver for Case 2

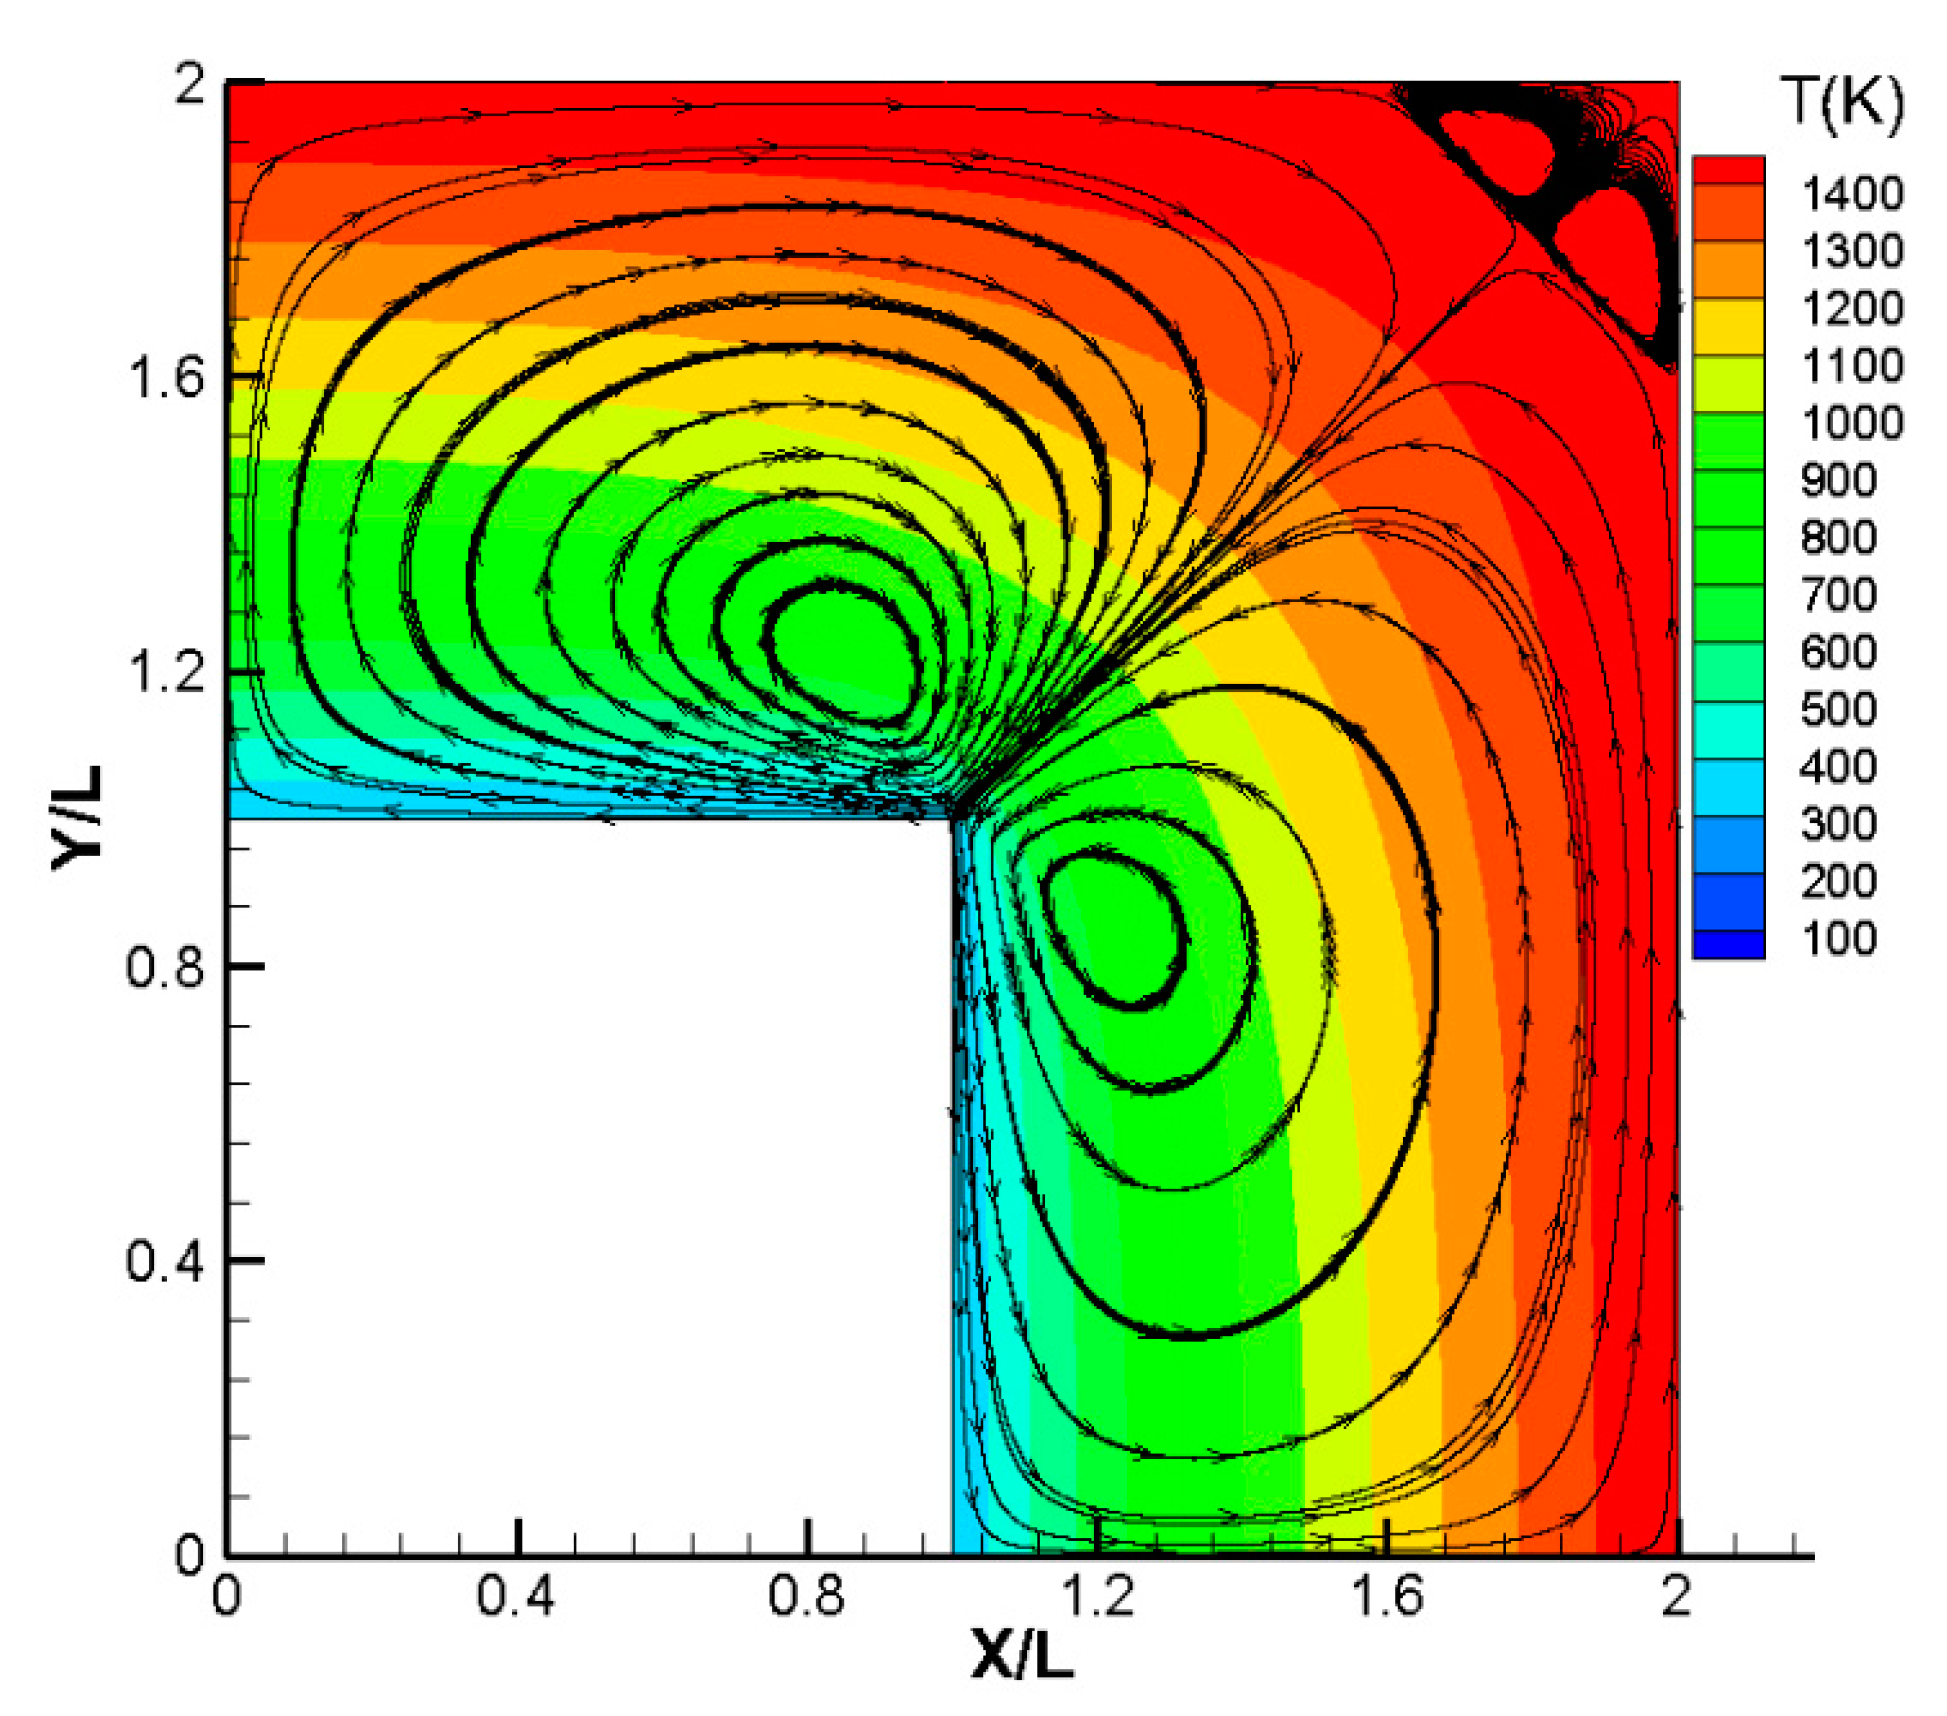
In Case 2, the streamlines in the cavity from the SNIT predictions at Kn = 0.01 are depicted in Figure 19. Large vortices in the cavity are seen in the simulation results and were caused by nonlinear thermal stress flow. In the SNIT predictions, two small vortices appear close to the top right corner. These could be Moffat vortices growing close to the rectangular bend’s corners. Due to the abrupt change in geometry and boundary temperature near the corners, the SNIT equations are invalid, making the tiny vortices nonphysical.

4.9. Average velocity in Cases 1 and 2

The average velocity magnitude for cases 1 and 2 is shown in Figure 20 for various Knudsen numbers. The average velocity trend is nearly the same in both cases, as the maximum average velocity is reached at Kn = 0.1, and then decreases. In both cases, the velocity average increases until Kn = 0.1, and falls with a different slope, as the incline of case 2 at 1 < Kn < 10 is greater in comparison with case 1.

5. Conclusions

Three numerical techniques were used in the current work to examine the thermally-driven flow in a square cavity and rectangular bend, in two separate scenarios. Direct simulation Monte Carlo (DSMC), discrete unified gas kinetic scheme (DUGKS), and asymptotic solution for slow non-isothermal flow (SNIT) were used as numerical methods. Three solvers were used, all from the open-source OpenFOAM computing platform. The first test case was a square cavity: the top and bottom sides were set to warm, with adjacent cold walls. The second test case was a rectangular bend, where two sides were set cold, and the other sides were set to warm. The four central vortices inside the cavity were created by nonlinear thermal stress, as evidenced by the SNIT solver’s solution in case 1. In addition to the primary vortex, small vortices were observed that can be attributed to thermal creep effects at Kn = 0.01, 0.1. In the SNIT forecasts, these vortices were not present. The distance of the vortex’s center from the corners was greater at Kn = 0.01, 0.1 than Kn = 1, 10. At Kn = 0.01, four vortices were attached to corners, and at Kn = 0.1, eight small vortices formed in the vicinity of the cavity’s side, caused by thermal creep effects. In case 2, there were two giant vortices that seemed to be induced by nonlinear thermal stress. The velocity streamlines in vortices that were located on the left were counterclockwise, opposite to the other vortices located on the bottom. The direction of streamlines in the two main vortices was from the warm to cold region.

Author Contributions

Conceptualization, E.R.; methodology, E.R.; software, M.M.; validation, M.M.; formal analysis, E.R. and M.M.; investigation, E.R. and M.M.; resources, E.R. and M.M.; data curation, M.M.; writing—original draft E.R. and M.M. All authors have read and agreed to the published version of the manuscript.

Funding

This work was funded by Iran National Science Foundation (INSF) under project No. 4004529.

Institutional Review Board Statement

Not applicable.

Informed Consent Statement

Not applicable.

Data Availability Statement

All information reported in this article will be provided upon reasonable request from the corresponding author.

Conflicts of Interest

The authors declare no conflict of interest.

Nomenclature

cPeculiar velocityRGas Constant
DOperator describing particle convectionSOFSeparation of free path
dMean molecular diameter S D δ t Streaming operator
EVInaccuracy in velocity S Q δ t , h Collision operator
fVelocity distribution functionTTemperature
f * Velocity distribution functionTHHot temperature
f H Fluid-dynamic part of the velocity distribution functionTCCold temperature
f k n Knudsen-layer adjustment T H 0 Temperature
f M Maxwell distribution function t k Characteristic time
f S Shakhov equilibrium distribution functionU,VVelocity components
F Y Force in direction yuiHVelocity
γRatio of specific heat capacity
gRelative velocity of molecules δ t Time step
hHArbitrary variable δ i j Kronecker delta function
KnKnudsen numberθUnit vector
LLengthλMean free path
MachMach number γ 1 , γ 2 , γ 3 , γ 7 non-dimensional coefficients
mMolecular Mass μ Viscosity coefficient
PPressureπPi
PPCParticle per cellρDensity
PrPrandtl numberτRelaxation time
P H 2 + Function of pressureΩSolid angle element
QOperator describing binary interactions ω Viscosity-Temperature index
qHeat flux

References

  1. Karniadakis, G.; Beskok, A.; Aluru, N. Microflows and Nanoflows: Fundamentals and Simulation; Springer Science & Business Media: Berlin/Heidelberg, Germany, 2006; Volume 29. [Google Scholar]
  2. Mohammadzadeh, A.; Roohi, E.; Niazmand, H.; Stefanov, S.; Myong, R.S. Thermal and second-law analysis of a micro- or nano-cavity using direct-simulation Monte Carlo. Phys. Rev. E 2012, 85, 056305. [Google Scholar] [CrossRef] [PubMed] [Green Version]
  3. Bird, G.A. Molecular Gas Dynamics and the Direct Simulation of Gas Flows; Oxford University Press: Oxford, UK, 1994. [Google Scholar]
  4. Rader, D.J.; Gallis, M.A.; Torczynski, J.R.; Wagner, W. Direct simulation Monte Carlo convergence behavior of the hard-sphere-gas thermal conductivity for Fourier heat flow. Phys. Fluids 2006, 18, 077102. [Google Scholar] [CrossRef]
  5. Bird, G.A. Sophisticated Versus Simple DSMC. In Rarefied Gas Dyn. 25th Int. Symp.; Ivanov, M.S., Rebrov, A.K., Eds.; House of the Siberian Branch of the Russian Academy of Sciences: Novosibirsk, Russia, 2007; pp. 349–357. [Google Scholar]
  6. Bird, G.A.; Gallis, M.A.; Torczynski, J.R.; Rader, D.J. Accuracy and efficiency of the sophisticated direct simulation Monte Carlo algorithm for simulating noncontinuum gas flows. Phys. Fluids 2009, 21, 017103. [Google Scholar] [CrossRef]
  7. Bird, G.A. The DSMC Method; CreateSpace Independent Publishing Platform: Scotts Valley, CA, USA, 2013. [Google Scholar]
  8. Boyd, I.D.; Schwartzentruber, T.E. Nonequilibrium Gas Dynamics and Molecular Simulation; Cambridge University Press: Cambridge, MA, USA, 2017; Volume 42. [Google Scholar]
  9. Sone, Y. Molecular Gas Dynamics: Theory, Techniques, and Applications; Springer Science & Business Media: Berlin/Heidelberg, Germany, 2007. [Google Scholar]
  10. Aoki, K.; Sone, Y.; Masukawa, N. A Rarefied Gas Flow Induced by a Temperature Field. In Rarefied Gas Dynamics; Harvey, J., Lord, G., Eds.; Oxford University Press: Oxford, UK, 1995; pp. 35–41. [Google Scholar]
  11. Aoki, K.; Takata, S.; Aikawa, H.; Golse, F. A rarefied gas flow caused by a discontinuous wall temperature. Phys. Fluids 2001, 13, 2645–2661. [Google Scholar] [CrossRef] [Green Version]
  12. Han, Y.L.; Muntz, E.P.; Alexeenko, A.; Young, M. Experimental and Computational Studies of Temperature Gradient–Driven Molecular Transport in Gas Flows through Nano/Microscale Channels. Nanoscale Microscale Thermophys. Eng. 2007, 11, 151–175. [Google Scholar] [CrossRef]
  13. Taguchi, S.; Aoki, K. Rarefied gas flow around a sharp edge induced by a temperature field. J. Fluid Mech. 2012, 694, 191–224. [Google Scholar] [CrossRef] [Green Version]
  14. Taguchi, S.; Aoki, K. Motion of an array of plates in a rarefied gas caused by radiometric force. Phys. Rev. E 2015, 91, 063007. [Google Scholar] [CrossRef] [Green Version]
  15. Taguchi, S.; Tsuji, T. On the motion of slightly rarefied gas induced by a discontinuous surface temperature. J. Fluid Mech. 2020, 897, A16. [Google Scholar] [CrossRef]
  16. Wang, X.; Zhang, W.; Su, T.; Zhang, Z.; Zhang, S. Gas-surface interaction effects on rarefied gas flows around microbeams induced by temperature fields. Int. J. Heat Mass Transf. 2021, 172, 121186. [Google Scholar] [CrossRef]
  17. Zeng, D.; Cai, R.; Yang, Y. Rarefied gas flow around a double-plate induced by temperature difference. Adv. Space Res. 2022, 69, 737–750. [Google Scholar] [CrossRef]
  18. Yazdanpanah, E.; Roohi, E.; Abolfazli, J. Flow field and heat transfer characteristics of thermal cavities. Vacuum 2014, 109, 333–340. [Google Scholar]
  19. Shahabi, V.; Baier, T.; Roohi, E.; Hardt, S. Thermally-induced gas flow in ratchet channels with diffuse and specular walls. Sci. Rep. 2017, 7, 41412. [Google Scholar] [CrossRef] [PubMed] [Green Version]
  20. Baier, T.; Hardt, S.; Shahabi, V.; Roohi, E. Knudsen pump inspired by Crookes radiometer with a specular wall. Phys. Rev. Fluids 2017, 2, 033401. [Google Scholar] [CrossRef] [Green Version]
  21. Lotfian, A.; Roohi, E. Radiometric Flow in Periodically Patterned Channels: Fluid Physics and Improved Configurations. J. Fluid Mech. 2019, 860, 544–576. [Google Scholar] [CrossRef]
  22. Lotfian, A.; Roohi, E. Binary gas mixtures separation using micro-scale radiometric pumps. Int. Commun. Heat Mass Transf. 2021, 121, 105061. [Google Scholar] [CrossRef]
  23. RafieeNasab, S.; Roohi, E.; Teymourtash, A. Numerical analysis of nonlinear thermal stress flow between concentric elliptical cylinders. Phys. Fluids 2020, 32, 102007. [Google Scholar] [CrossRef]
  24. John, B.; Gu, X.J.; Emerson, D.R. Investigation of heat and mass transfer in a lid driven cavity under non-equilibrium flow conditions. Numer. Heat Transf. Part B Fundam 2010, 58, 287–303. [Google Scholar] [CrossRef]
  25. John, B.; Gu, X.-J.; Emerson, D.R. Effects of incomplete surface accommodation on non-equilibrium heat transfer in cavity flow: A parallel DSMC study. Comput. Fluids 2011, 45, 197–201. [Google Scholar] [CrossRef]
  26. Mohammadzadeh, A.; Roohi, E.; Niazmand, H. A Parallel DSMC Investigation of Monatomic/Diatomic Gas Flows in a Micro/Nano Cavity. Numer. Heat Transf. Part A Appl. 2013, 63, 305–325. [Google Scholar] [CrossRef]
  27. Vargas, M.; Tatsios, G.; Valougeorgis, D.; Stefanov, S. Rarefied gas flow in a rectangular enclosure induced by non-isothermal walls. Phys. Fluids 2014, 26, 057101. [Google Scholar] [CrossRef]
  28. Akhlaghi, H.; Roohi, E.; Stefanov, S. Ballistic and Collisional Flow Contributions to Anti-Fourier Heat Transfer in Rarefied Cavity Flow. Sci. Rep. 2018, 8, 13533. [Google Scholar] [CrossRef] [PubMed]
  29. Roohi, E.; Shahabi, V.; Bagherzadeh, A. On the vortical characteristics and cold-to-hot transfer of rarefied flow in a lid-driven isosceles orthogonal triangular cavity with isothermal walls. Int. J. Therm. Sci. 2018, 125, 381–394. [Google Scholar] [CrossRef]
  30. Venugopal, V.; Praturi, D.S.; Girimaji, S.S. Non-equilibrium thermal transport and entropy analyses in rarefied cavity flows. J. Fluid Mech. 2019, 864, 995–1025. [Google Scholar] [CrossRef]
  31. Zhang, J.; Yao, S.; Fei, F.; Ghalambaz, M.; Wen, D. Competition of natural convection and thermal creep in a square enclosure. Phys. Fluids 2020, 32, 102001. [Google Scholar] [CrossRef]
  32. Zakeri, M.; Roohi, E. Flow and thermal field investigation of rarefied gas in a trapezoidal micro/nano-cavity using DSMC. Int. J. Mod. Phys. C 2021, 32, 17. [Google Scholar] [CrossRef]
  33. Garg, R.; Agrawal, A. Influence of three-dimensional transverse micro-ridges on the Poiseuille number in a gaseous slip flow. SN Appl. Sci. 2019, 1, 1–18. [Google Scholar]
  34. Garg, R.; Mujumdar, S.; Agrawal, A. Pumping Power Performance and Frictional Resistance of Textured Microchannels in Gaseous Slip Flows. Ind. Eng. Chem. Res. 2021, 60, 2290–2299. [Google Scholar] [CrossRef]
  35. Liu, C.; Xu, K.; Sun, Q.; Cai, Q. A unified gas-kinetic scheme for continuum and rarefied flows IV: Full Boltzmann and model equations. J. Comput. Phys. 2016, 314, 305–340. [Google Scholar] [CrossRef] [Green Version]
  36. Ghia, U.; Ghia, K.N.; Shin, C.T. High-Re Solutions for Incompressible Flow Using the Navier-Stokes Equations and a Multigrid Method. J. Comput. Phys. 1982, 48, 387–411. [Google Scholar] [CrossRef]
  37. Stefanov, S.K. On the basic concepts of the direct simulation Monte Carlo method. Phys. Fluids 2019, 31, 067104. [Google Scholar] [CrossRef]
  38. Goshayeshi, B.; Roohi, E.; Stefanov, S. DSMC simulation of hypersonic flows using an improved SBT-TAS technique. J. Comput. Phys. 2015, 303, 28–44. [Google Scholar] [CrossRef]
  39. Akhlaghi, H.; Roohi, E.; Daliri, A.; Soltani, M.R. Shock Polar Investigation in Supersonic Rarefied Gas Flows over a Circular Cylinder. Phys. Fluids 2021, 33, 052006. [Google Scholar] [CrossRef]
  40. Akhlaghi, H.; Roohi, E. Generalized description of the Knudsen layer thickness in rarefied gas flows. Phys. Fluids 2021, 33, 061701. [Google Scholar] [CrossRef]
  41. Liu, W.; Zhang, J.; Jiang, Y.; Chen, L.; Lee, C.-H. DSMC study of hypersonic rarefied flow using the Cercignani–Lampis–Lord model and a molecular-dynamics-based scattering database. Phys. Fluids 2021, 33, 072003. [Google Scholar] [CrossRef]
  42. Taheri, E.; Roohi, E.; Stefanov, S. A symmetrized and simplified Bernoulli trial collision scheme in direct simulation Monte Carlo. Phys. Fluids 2022, 34, 012010. [Google Scholar] [CrossRef]
  43. Lu, X.; Ye, Z. A universal method of redistributing relaxation energies in inelastic molecular collisions. Phys. Fluids 2022, 34, 036106. [Google Scholar] [CrossRef]
  44. White, C.; Borg, M.; Scanlon, T.; Longshaw, S.; John, B.; Emerson, D.; Reese, J. dsmcFoam+: An OpenFOAM based direct simulation Monte Carlo solver. Comput. Phys. Commun. 2018, 224, 22–43. [Google Scholar] [CrossRef]
  45. Zhu, L.; Guo, Z. Application of discrete unified gas kinetic scheme to thermally induced non-equilibrium flows. Comput. Fluids 2017, 193, 103613. [Google Scholar] [CrossRef] [Green Version]
  46. Guo, Z.; Wang, R.; Xu, K. Discrete unified gas kinetic scheme for all Knudsen number flows: II. Compressible case, Physical review. E Stat. Nonlinear Soft Matter Phys. 2014, 91, 033313. [Google Scholar] [CrossRef] [Green Version]
  47. Galkin, V.S.; Kogan, M.N.; Fridlender, O.G. Some kinetic effects in continuum flows. Fluid Dyn. 1973, 5, 364–371. [Google Scholar] [CrossRef]
  48. Sone, Y.; Aoki, K.; Takata, S.; Sugimoto, H.; Bobylev, A.V. Inappropriateness of the heat-conduction equation for description of a temperature field of a stationary gas in the continuum limit: Examination by asymptotic analysis and numerical computation of the Boltzmann equation. Phys. Fluids 1996, 8, 628–638. [Google Scholar] [CrossRef]
  49. Rogozin, O. Slow non-isothermal flows: Numerical and asymptotic analysis of the Boltzmann equation. Comput. Math. Math. Phys. 2017, 57, 1201–1224. [Google Scholar] [CrossRef]
  50. Aoki, K.; Sone, Y.; Waniguchi, Y. A rarefied gas flow induced by a temperature field: Numerical analysis of the flow between two coaxial elliptic cylinders with different uniform temperatures. Comput. Math. Appl. 1998, 35, 15–28. [Google Scholar] [CrossRef] [Green Version]
  51. Sone, Y.; Aoki, K. Slightly rarefied gas flow over a specularly reflecting body. Phys. Fluids 1977, 20, 571. [Google Scholar] [CrossRef]
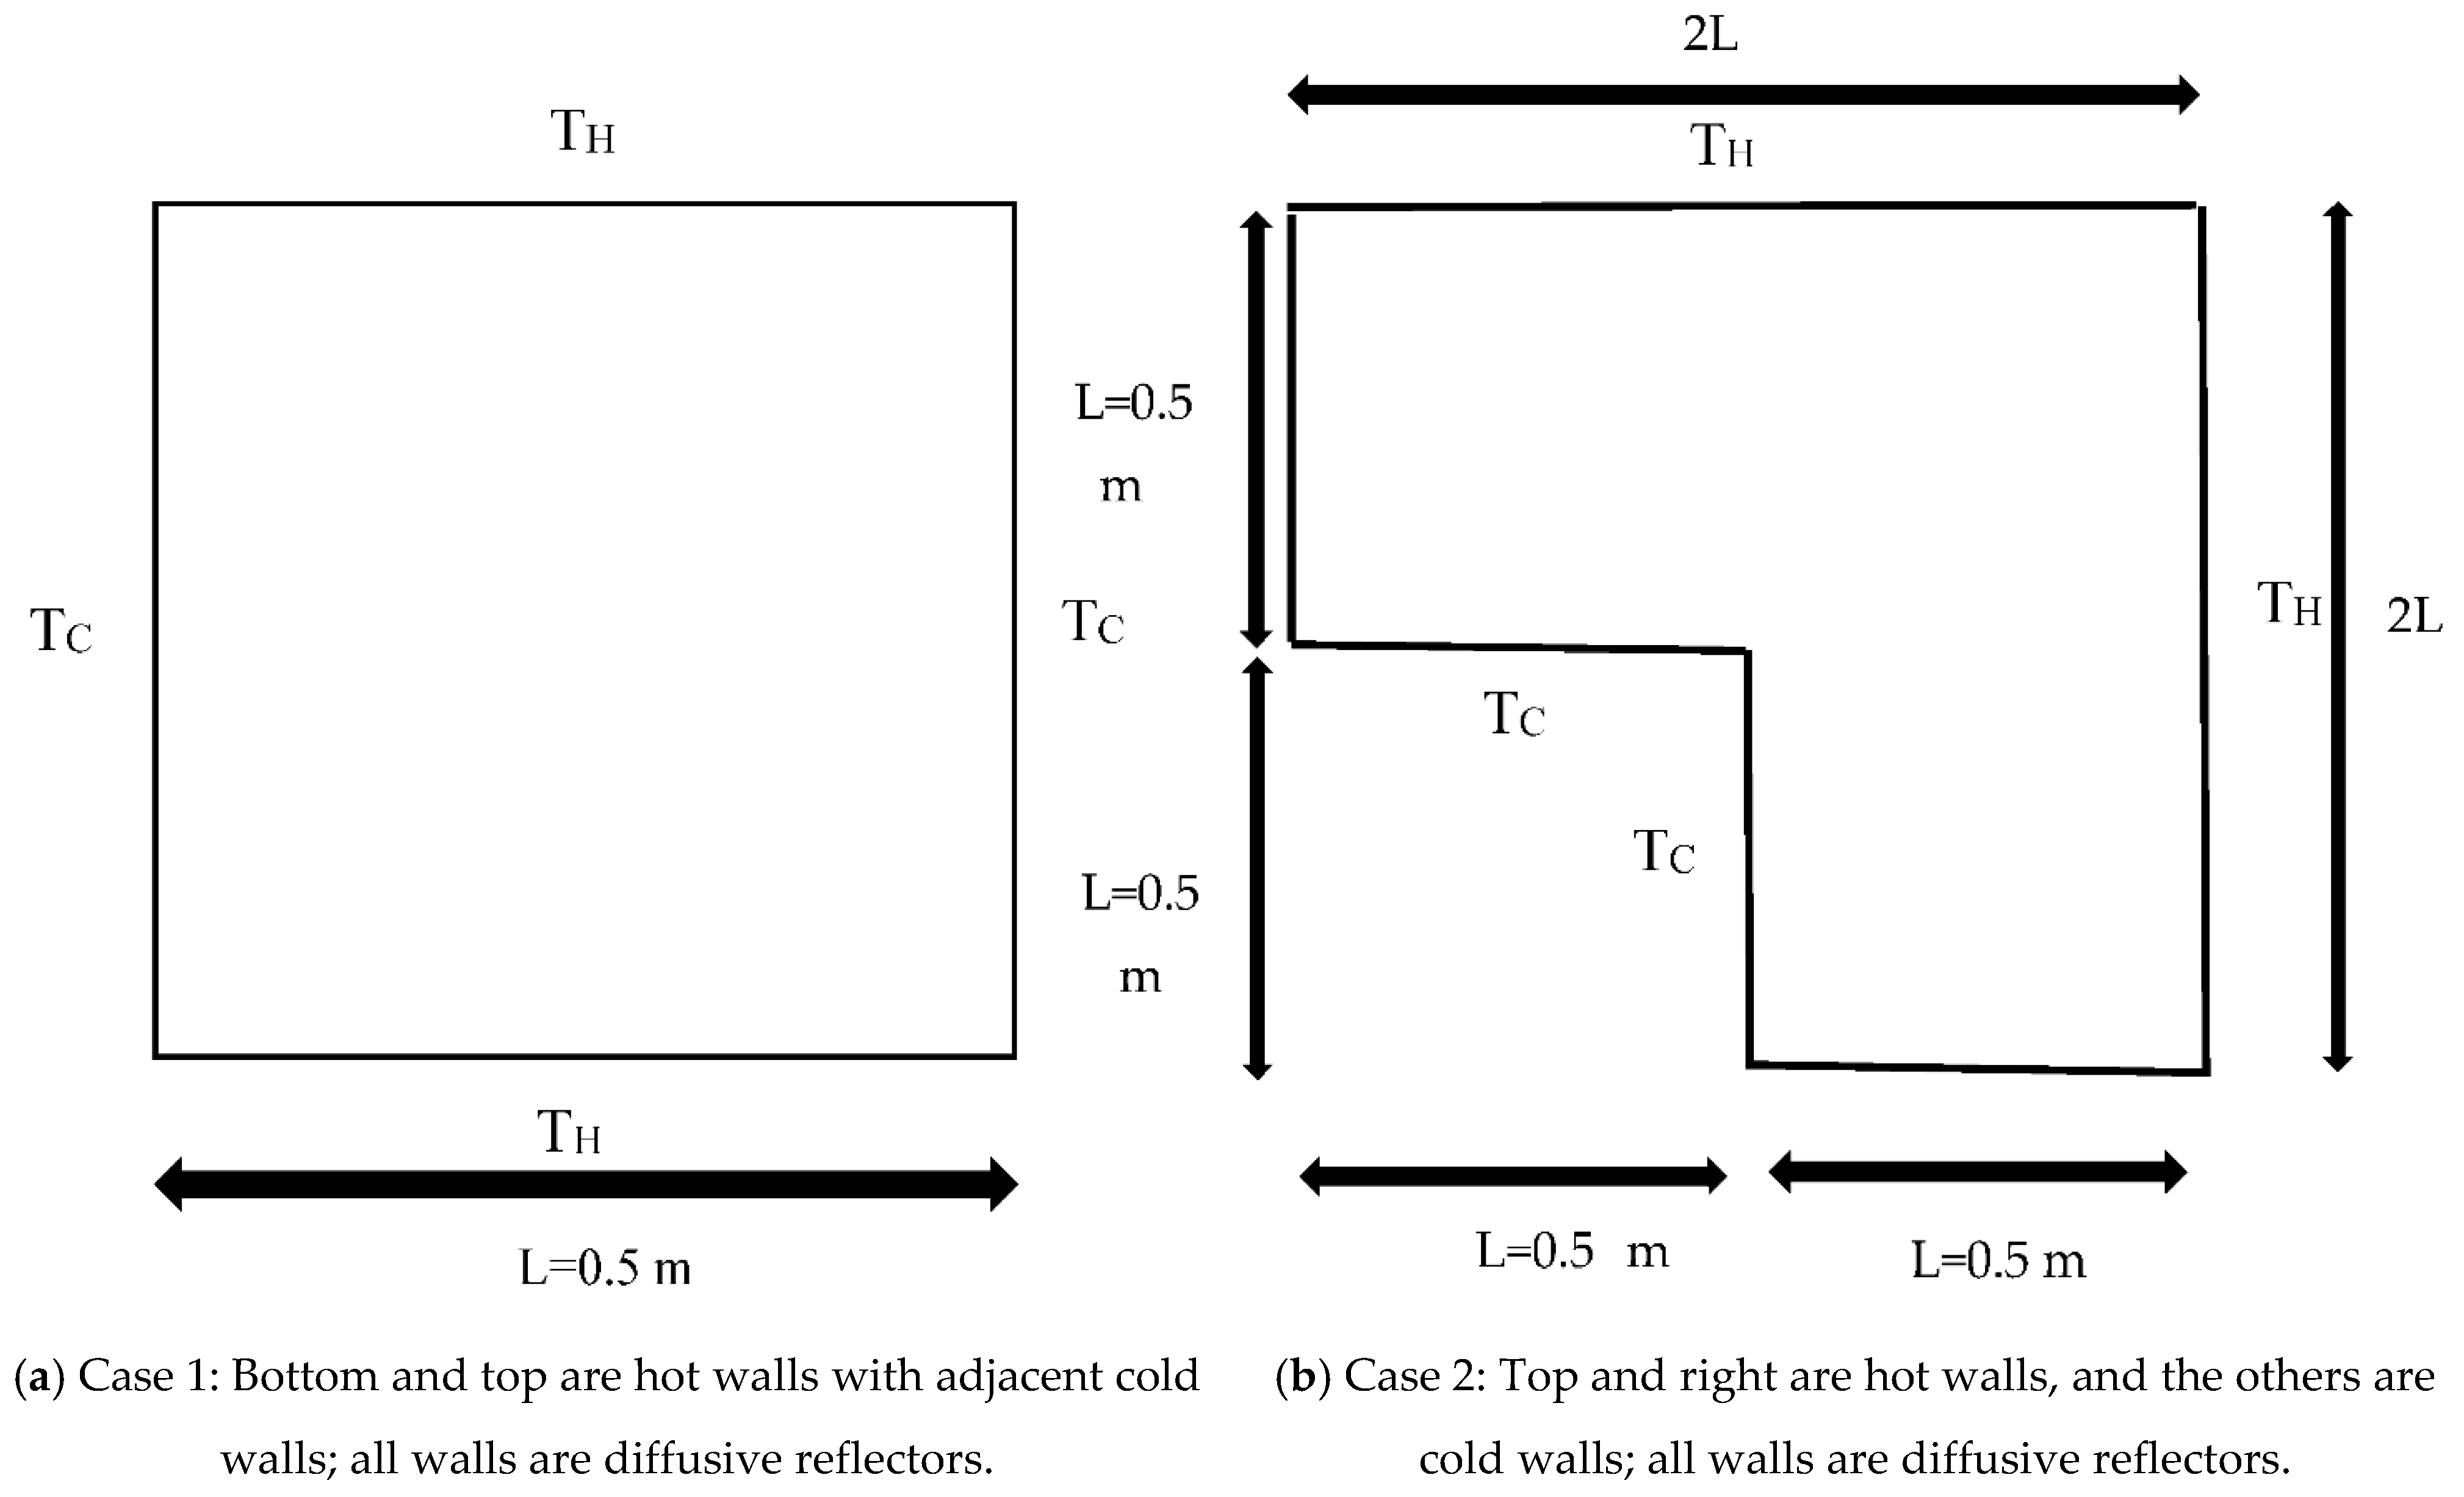
Figure 1. Configurations of the square cavity and rectangular bend: (a) case 1, and (b) case 2.
Fluids 07 00354 g001
Figure 2. Grid independence of the DSMC solver for case 1 at Kn = 0.1, (a) density, (b) temperature on the bottom side of the square cavity.
Fluids 07 00354 g002
Figure 3. (ac) Grid independence of the DSMC solver for case 2 on the cold side of rectangular bend at Kn = 0.1, (a) U-velocity, (b) V-velocity, (c) temperature.
Fluids 07 00354 g003
Figure 4. (ac) PPC independence for the DSMC solver in case 1 at Kn = 0.1, pressure, temperature, and U-velocity on square cavity’s bottom side, (d) Separation of free paths (SOF) in the entire domain for the DSMC solver.
Fluids 07 00354 g004
Figure 5. (ac) PPC independence for the DSMC solver in case 2 at Kn = 0.1, pressure, temperature, and U-velocity on rectangular bend’s cold side. (d) Separation of free paths (SOF) in the entire domain for the DSMC solver.
Fluids 07 00354 g005
Figure 6. Grid independence check for the DUGKS solver in case 1 at Kn = 0.01, (a) density, (b) temperature, and (c) U−velocity on the bottom side of the cavity.
Fluids 07 00354 g006aFluids 07 00354 g006b
Figure 7. Grid independence check for the DUGKS solver in case 2 at Kn = 0.01, (a) temperature, (b) U-velocity, and (c) velocity magnitude on the bottom side of the cavity.
Fluids 07 00354 g007aFluids 07 00354 g007b
Figure 8. SNIT grid independence check for case 1 on the bottom of the cavity, (a) temperature distributions and (b,c) velocity components.
Fluids 07 00354 g008aFluids 07 00354 g008b
Figure 9. (ac) SNIT grid independence check for case 2 on the cold side of the rectangular bend, pressure distributions, temperature distribution, and U-velocity.
Fluids 07 00354 g009aFluids 07 00354 g009b
Figure 10. (ae) Streamlines and temperature contours in the square cavity for Case 1 (DSMC-DUGKS).
Fluids 07 00354 g010aFluids 07 00354 g010b
Figure 11. Velocity distribution over a horizontal line on the bottom side’s cavity with the DSMC solver.
Fluids 07 00354 g011
Figure 12. Force on the top side in Case 1 with the DSMC solver.
Fluids 07 00354 g012
Figure 13. Difference between DUGKS and DSMC on the bottom wall in case 1, Kn = 0.01, (a) temperature, (b) U−velocity, (c) V-velocity.
Fluids 07 00354 g013
Figure 14. SNIT forecast of velocity streamlines and temperature contour in the square cavity.
Fluids 07 00354 g014
Figure 15. (ad) Streamlines and temperature contours in the rectangular bend in case 2, 0.01 ≤ Kn ≤ 10.
Fluids 07 00354 g015aFluids 07 00354 g015b
Figure 16. Velocity distribution in case 2 over a horizontal line on the cold side with the DSMC solver.
Fluids 07 00354 g016
Figure 17. Force on the cold wall in case 2 with the DSMC solver.
Fluids 07 00354 g017
Figure 18. Difference between DUGKS and DSMC on the cold wall in case 2, Kn = 0.01, (a) temperature, (b) U-velocity.
Fluids 07 00354 g018
Figure 19. SNIT forecast of velocity streamlines and temperature contour in the rectangular bend.
Fluids 07 00354 g019
Figure 20. Difference of average velocity in cases 1 and 2 with the DSMC solver.
Fluids 07 00354 g020
Publisher’s Note: MDPI stays neutral with regard to jurisdictional claims in published maps and institutional affiliations.