Abstract
This study introduces an algebraic model informed by computational fluid dynamics (CFD) simulations to investigate the performance of the assisted bidirectional Glenn (ABG) operation on a broad range of conditions. The performance of this operation, as measured by the superior vena cava (SVC) pressure, depends on the nozzle area in its ejector pump and the patient’s pulmonary vascular resistance (PVR). Using the developed algebraic model to explore this two-dimensional parameter space shows that the ejector pump can create a pressure difference between the pulmonary artery and the SVC as high as 5 mmHg. The lowest SVC pressure is produced at a nozzle area that decreases linearly with the PVR such that, at PVR (Wood units-m2), there is no added benefit in utilizing the ejector pump effect (optimal nozzle area is zero, corresponding to the bidirectional Glenn circulation). At PVR (Wood units-m2), the SVC pressure can be lowered to less than 4 mmHg by using an optimal nozzle area of mm2. Regardless of the PVR, adding a 2 mm2 nozzle to the baseline bidirectional Glenn boosts the oxygen saturation and delivery by at least 15%. The SVC pressure for that 2 mm2 nozzle remains below 14 mmHg for all PVRs less than 7 Wood units-m2. The mechanical efficiency of the optimal designs consistently remains below 30%, indicating the potential for improvement in the future. A good agreement is observed between the algebraic model and high-fidelity CFD simulations.
1. Introduction
Infants born with a single ventricle undergo three stages of palliation to survive, starting with the first stage performed within a few days after birth. This procedure establishes a systemic-to-pulmonary shunt, such as the modified Blalock–Taussig shunt (mBTS) [1,2], to create a parallel circulation between the systemic and pulmonary beds. The second stage procedure, the bidirectional Glenn (BDG), is performed at around two months of age, during which the systemic-to-pulmonary shunt is removed, and the superior vena cava (SVC) is connected directly to the pulmonary arteries (PA) [3,4]. The upper body venous return through the SVC thus becomes the sole source of the pulmonary blood flow. The third stage operation, the Fontan procedure, further connects the inferior vena cava to the pulmonary arteries, after which the pulmonary and systemic circulations are then placed in series [5,6].
The long-term mortality rate among single-ventricle patients remains high, owing to single ventricle failure, SVC syndrome, underdeveloped or unevenly developed pulmonary arteries, and other complications resulting from the first and second stage operations [7,8]. Despite many efforts in improving the mBTS physiology [9,10,11,12,13,14,15,16], it remains as a fundamentally flawed operation due to the unavoidable high ventricle load and the high chance of shunt occlusion due to thrombosis.
Some of the drawbacks of the mBTS are addressed in the next stage by the BDG procedure. That may motivate the total replacement of the mBTS by the BDG or an earlier transition to the BDG physiology. Historically, however, the BDG procedure can not be used for stage-one palliation due to complications related to elevated pulmonary vascular resistance (PVR) after birth, including SVC syndrome, insufficient pulmonary flow, and low oxygen saturation [17,18,19]. More recent studies have explored the feasibility of performing the BDG operation at an earlier age [20,21]. However, other studies have reported underdeveloped pulmonary arteries due to insufficient pulmonary arterial flow for patients with early BDG adaptation [22,23].
In order to overcome the shortcomings associated with the mBTS and the BDG, an alternative operation called the assisted bidirectional Glenn (ABG) was recently proposed that is a hybrid between those two standard operations [24,25,26,27,28]. The assisted bidirectional Glenn is based on the BDG circulation with the addition of a systemic-to-pulmonary shunt between the brachiocephalic artery (BA) and the SVC to assist the pulmonary flow. The effectiveness of the ABG circulation depends on the successful adaptation of the ejector pump effect. As it operates in industrial devices, the ejector pump uses a high energy flow as the energy source, which is jetted into a low energy flow and assists the low energy flow downstream. In the ABG circulation, the high-energy blood through the shunt would mix with the upper body return flow in the SVC, and provide the energy necessary for pulmonary circulation. Our latest study introduced a modified ABG by connecting the shunt to the SVC at the brachiocephalic veins (BV) and SVC juncture, creating a slit-shaped nozzle at that anastomosis [29]. Our multiscale simulation showed that at a pulmonary vascular resistance (PVR) of 2.3 Wood units-, the modified ABG procedure increased the pulmonary flow by 76% and reduced the SVC pressure by 26% compared to the BDG while reducing the heart workload by 43% comparing to the mBTS. Other improvements were observed, including higher oxygen delivery, higher aortic oxygen saturation, and more even left and right pulmonary flow distribution.
Despite the encouraging results for the modified ABG at normal PVR, this improved circulation still poses excessively high SVC pressure when the PVR is elevated. In fact, at a PVR of 7 Wood units-m2, the SVC pressure was around 15 mmHg, which is 28% higher than that of the BDG. Since newborns experience episodes of high PVR, such high SVC pressure could potentially cause other complications, including cerebral ventriculomegaly, recanalization, and obliterated vessels [30,31,32]. The elevated SVC pressure at high PVR can be understood by two competing effects: the first is the ejector pump effect that reduces the upstream (SVC) pressure relative to the downstream (PA) pressure. The second effect results from the additional blood flow introduced by the shunt that goes through the pulmonary bed, thereby elevating the PA pressure. While the ejector pump effect at low PVR is dominant, it is overcome at higher PVR by the competing effect, leading to a higher overall SVC pressure. Therefore, at certain PVRs, the SVC pressure produced by the ABG will be higher than that of the BDG, which does not have additional flow coming from a systemic-to-pulmonary shunt.
This study aims to gain a deeper understanding of the above-mentioned competing effects and quantitatively establish the regime at which the ABG presents an advantage over the conventional procedures. Achieving this goal requires surveying at minimum a two-dimensional parameter space (i.e., different PVR and nozzle areas). Using high-fidelity computational fluid dynamic (CFD) simulations, which is the approach taken by most cardiovascular simulation studies [33,34], for this purpose will be prohibitively expensive. To overcome this issue, a multi-fidelity approach is developed in this study, where the CFD simulations are coupled to a newly introduced algebraic model. The algebraic model is then utilized to evaluate the performance of the ABG at different PVR values while identifying the optimal design for each regime. This article is organized as the following. In Section 2.1 we will review the improved version of the ABG that is to be used as the baseline in this study. Then in Section 2.2 and Section 2.3, we will discuss our CFD framework and present the construction of the newly introduced algebraic model, respectively. We will compare the predictions of the algebraic model against the CFD results in Section 3.1. Our full parametric study using the algebraic model is presented in Section 3.2. The physicality of the algebraic model and the clinical implication of our findings are discussed in Section 4.
2. Materials and Method
2.1. Modified Assisted Bidirectional Glenn
The most recent modifications to the ABG circulation are constructed on top of the BDG circulation where the SVC is connected to the PAs (Figure 1). The shunt is connected to the brachiocephalic artery on the systemic side. The pulmonary side of the shunt is connected to the BV-SVC juncture via a nozzle-shaped outlet. The nozzle profile is designed to maximize the contact area between the high-energy jet and the upper body return. This profile facilitates the mixing and momentum transfer between the two streams, thus creating the ejector pump effect successfully (Figure 1c). In addition to improving the ejector pump effect, this nozzle design also minimizes energy loss. In this study, both the shunt diameter and the nozzle width are fixed at 3.5 mm to minimize energy loss due to the wall shear effect that can be created by the high-velocity jet impinging the SVC walls, which is 5 mm in diameter. Additionally, the jet from the nozzle is parallel to the SVC direction to prevent asymmetric wall impingement that also causes energy loss.
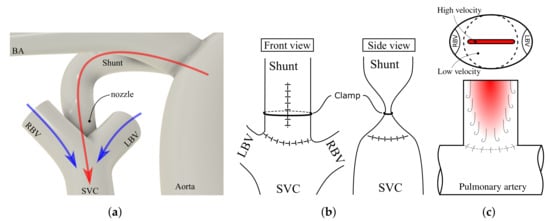
Figure 1.
(a) Closeup of the insertion location of the shunt in the modified ABG. (b) Front and side view of potential clinical implementation of the slit-shaped nozzle design. LBV and RBV are removed from the side view. (c) nozzle view from the SVC and mixing visualization. BA, brachiocephalic artery; SVC, superior vena cava; LBV, left brachiocephalic vein; RBV, right brachiocephalic vein.
With the above parameters fixed, the only remaining parameter that determines the efficiency of the ejector pump is the nozzle thickness which directly affects the nozzle area. Therefore in this study, we will investigate the effect of nozzle areas by varying the thickness of the nozzle. The second varying parameter in this study is the PVR, which is changed in the lumped parameter network model discussed in the next section.
2.2. Geometry Construction and CFD Simulation
Five 3D geometries are constructed: four variations of the modified ABG with different nozzle areas and one BDG. All five geometries are idealized representative geometries based on the modified ABG geometry from our previous study [29]. Briefly, the SVC and PA diameters are 5 mm [35] and 5.5 mm [36], respectively, and the left and right BV diameters are set to 4 mm based on Murray’s law [37]. For the modified ABG geometries, the shunt is 3.5 mm in diameter, which converges to a slit-shaped nozzle at the shunt-SVC connection (Figure 1b,c), with four different nozzle cross-sectional areas of 2.0, 2.5, 3.0, and 3.5 . For the BDG geometry, the shunt is not present, while all other dimensions are identical to the modified ABG geometries. This BDG geometry is considered a particular case of the modified ABG with zero nozzle area in our algebraic model.
A multiscale CFD framework, which is similar to the previous studies [24,25,26] and identical to our previous study [29], is adapted to simulate the various cases. In these simulations, the flow in major vessels (e.g., aorta, PA, SVC, etc.) is fully resolved both spatially and temporally while it is modeled for the rest of the circulatory system (e.g., the heart, lower and upper body microvasculature, etc.) using a 0D lumped parameter network (LPN), where the variables are only functions of time [38,39].
The CFD simulations are performed using a validated in-house finite-element solver named Multi-physics finite-element solver (MUPFES) [38,40,41]. For the 3D simulation, incompressible Newtonian fluid and rigid walls are assumed. The underlying formulation of this solver is based on the weak form of the Navier-Stokes equation, which attempts to find and such that for all and ,
is satisfied. In Equation (1), , , , p, , , , , and q are the density, acceleration, velocity vector, pressure, viscous stress tensor, Neumann boundary traction, boundary outward normal vector, velocity and pressure test functions, respectively. The Neumann and Dirichlet boundaries are denoted by and , respectively, and the 3D fluid domain is denoted by . is a positive coefficient between 0.0 and 0.5 and set to 0.2 in our computations, and is defined as,
In [15]. The last term in Equation (1) is a minimally intrusive backflow stabilization term used to avoid simulation divergence due to partial or bulk backflow on the Neumann boundaries [42]. Provided that the Galerkin’s form in Equation (1) does not meet LBB condition for identical shape functions for velocity and pressure, the actual formulation implemented in our solver is based on the RBVMS (residual-based variational multiscale) formulation and includes additional terms to ensure the stability of the solution even at highly convective regimes [43,44]. A specialized iterative algorithm, preconditioner, and parallelization strategy are employed for an efficient and scalable solution of the linear system of equations that arises from the discretization of the RBVMS formulation [40,41,45]. The numerical method used in this study can capture the chaotic nature of the flow, which includes the turbulent jet created downstream of the nozzle (Figure 2c). The Reynolds number in the other vessels, including ascending aorta is less than 1000 and thus the flow remains transitional.
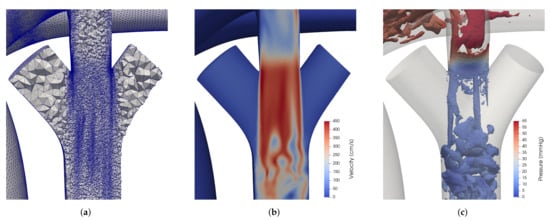
Figure 2.
(a) Tetrahedral mesh cross section, (b) velocity field, and (c) Q-criterion contour at the shunt-SVC junction for the ABG simulation with a nozzle size of 3 mm2 and PVR of 4.7 Wood units- at end systole.
The 0D LPN model, which consists of five blocks to model upper body, lower body, pulmonary bed, coronary circulation, and heart, is also identical to our previous study [29], where the component values are taken from a modeling study of 28 Norwood-procedure patients [16]. The schematic for the LPN system of the ABG is presented in Figure 3. The numerical implementation of the LPN is described in our previous study [38]. The LPN values and calculations related to the heart model are included in Appendix A. PVR of 2.3, 4.7, and 7 Wood units- are simulated for all five models, representing normal, slightly elevated, and high PVR values in an infant [24]. The two higher PVR values are simulated to account for patient-to-patient variability, PVR change with age, and uncertainties in the clinical measurements. To mimic the long-term effect of the auto-regulatory system, we used the blood volume control system that regulates the average aortic pressure at an average of 67 mmHg [29].
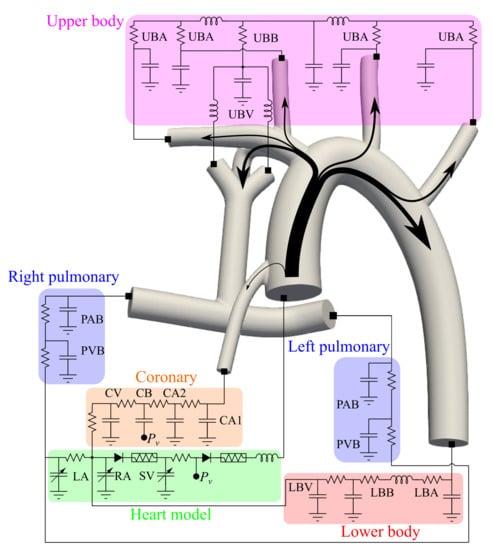
Figure 3.
Lumped parameter network coupled with physical domain geometry for the ABG procedure. See Appendix A for details.
The boundary conditions at the 3D-0D interface are not prescribed but obtained by solving the lumped parameter network [41]. For the coupled Neumann boundary conditions, the CFD solver will send the flow rate and receive the pressure in exchange from the LPN. The process is similar for coupled Dirichlet boundary condition with the difference that the pressure is sent and flow is received from the LPN. The ascending aorta, LBV and RBV are coupled Dirichlet boundaries, where we impose a parabolic profile. The remaining boundaries are coupled Neumann boundaries. The initial conditions for the LPN are taken from prior studies. The final results do not depend on those initial conditions.
Blood density is 1060 kg/m3 and viscosity is 0.004 Pas. We treated the blood as a Newtonian fluid because the shear rates in our simulation are outside of the range that produces non-Newtonian effects [46]. All geometries are meshed using tetrahedral elements and an adaptive mesh refinement algorithm to improve accuracy (Figure 2a). Our mesh refinement algorithm is detailed in our previous study [29]. A rigorous convergence study was performed to ensure results are independent of the mesh size, the linear solver tolerance, and the number of Newton-Raphson iterations. On average, the mesh geometries contain 2 million elements after 6 iterations of adaptive mesh refinement, resulting in an accuracy that is comparable to that of a 10 million elements uniform mesh. We used a time step size of 10−4 s for the simulations. Each simulation is continued for 10 s corresponding to 20 cardiac cycles. This number of cycles is selected to ensure both mean value and cycle-to-cycle convergence. This convergence is clearly shown in Figure 4 for the case with 2.0 nozzle area and PVR value of 7.0 Wood units-. The SVC pressure is observed to be the last parameter to converge in our simulations. Therefore, as long as the SVC converges, the simulation is considered converged in our study. The simulation results are calculated from the last cardiac cycle in every case. A typical simulation takes around 40 physical hours with 224 processors, or around 9000 computational hours, at a 2.4 GHz clock rate. In total, fifteen simulations were performed for five geometries at three different PVR values.
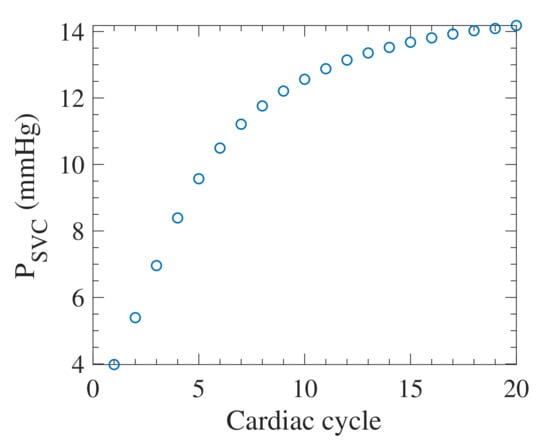
Figure 4.
Mean SVC pressure over one cardiac cycle as the simulation progresses for 2.0 nozzle area and 7.0 Wood units- PVR.
2.3. Algebraic Model
Each of the simulations described in the previous section takes ≈7 days to run on a cluster when utilizing 192 processors at a 2.4 GHz clock rate. Due to this high cost, it is infeasible to evaluate the full range of nozzle areas and PVRs using multiscale CFD simulations. To overcome this issue, we developed a multi-fidelity approach that utilizes the CFD simulations to tune an algebraic model, which in turn is used to predict the performance of the ABG circulation over a wide range of nozzle areas, , and PVR values, . The construction and parameter tuning of the algebraic model is discussed in the following sections.
2.3.1. Model Construction
The assumptions of this algebraic model (schematically shown in Figure 5), which replaces the 3D model, are incompressible, inviscid, steady and unidirectional flow. The viscous effect is incorporated in this model using loss terms tuned based on the CFD results. The model only includes the shunt, the BV-SVC juncture, the SVC, and the pulmonary branches. The reason for such choice is that the aortic flow and lower body circulation are minimally affected by the nozzle geometry or the PVR values, as confirmed by the CFD simulation results in Section 3.1. The dimensional constants of cross-sectional areas are consistent with the dimensions of the CFD geometries. The aortic pressure, , and the left atrial pressure, , are held fixed at 67.0 and 2.1 mmHg, respectively, which are identical to the CFD simulation and based on the clinical measurements [16].
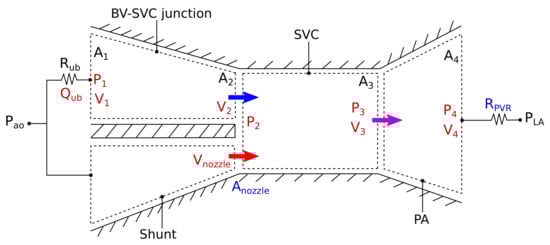
Figure 5.
Schematic of the algebraic model for modeling the ABG circulation. Variables shown in black, red, and blue are known, unknown, and independent parameters, respectively. Note that the 2D representation of this schematic is only for demonstrating the control volumes. The algebraic model is a 0D model that does not capture variation in time or space.
The upper body section is modeled using two equations: one for the upper body circulation and the other for the flow in the BV-SVC juncture. The upper body circulation is modeled using
where the total upper body flow rate, , and the bottom BV pressure, , are the unknown variables. The upper body resistance, mmHg-min/L, is a constant obtained from the LPN used for the CFD simulations. The flow through the BV-SVC juncture is modeled while neglecting losses using the Bernoulli’s equation
where is the upper SVC pressure. The upper body return velocity, , and the upper SVC velocity, , are defined using mass conservation as
Based on the 3D geometry, the total cross-sectional area of both BVs, , is 0.248 , the SVC corss-sectional area, , is 0.196 , and the nozzle area, , is an independent variable. The effective area of the upper SVC, , is calculated as
Accounting for losses in the shunt, the shunt upstream and downstream conditions can be related via
where the pressure, , and nozzle velocity, , are unknown. Due to the high velocity in the shunt, especially at the nozzle, a head loss constant, , is added to the equation to account for the viscous dissipation in the shunt that is similar in form to the Darcy-Weisbach equation. The value of is to be calculated through a tuning process from the CFD simulation results as discussed in Section 2.3.2. The modeling of these two streams inherently assumes that the mixing does not happen in the BV-SVC junction, which is the case demonstrated by CFD results.
The flow in the SVC is modeled by the mass conservation equation between the inlets and outlet
where is the fluid velocity at the bottom of the SVC, and the conservation of momentum equation:
where the bottom SVC pressure, , is unknown.
Three equations model the PA section: a Bernoulli’s equation with a head loss constant, , which will be calculated from the CFD results (Equation (10)), a conservation of mass equation (Equation (11)), and a pressure-flow rate relation for the pulmonary bed (Equation (12)).
From the 3D geometries, the total cross-sectional area of the PAs, , is 0.475 . The PA pressure, , and PA velocity, are two unknowns, and is the pulmonary flow rate. The PVR value, , is the other independent variable in this model.
In total, there are ten equations with ten unknowns (marked in red in Figure 5) and two independent variables. The calculation for the head loss constants and is detailed in the next section. Other parameters can be calculated from the unknowns solved from this system of equations. The total cardiac output, , is calculated as:
where the lower body flow, , rate is held constant at L/min, taken from the simulation results. The systemic flow rate, is calculated as:
The oxygen delivery, , and aortic oxygen saturation can be further calculated by
and
where is the the oxygen concentration in the pulmonary vein, is the total body oxygen consumption, and assuming half of the total oxygen is consumed by the upper body, that is, [24].
2.3.2. Parameter Identification
Using the CFD results, we can first verify our earlier assumption that changing the nozzle area or PVR has a negligible effect on the hemodynamics outside the algebraic model. Comparing lower body flow rate of all 15 CFD simulations for this purpose shows its minimal change from L/min, thereby confirming our earlier assumption (Figure 6).
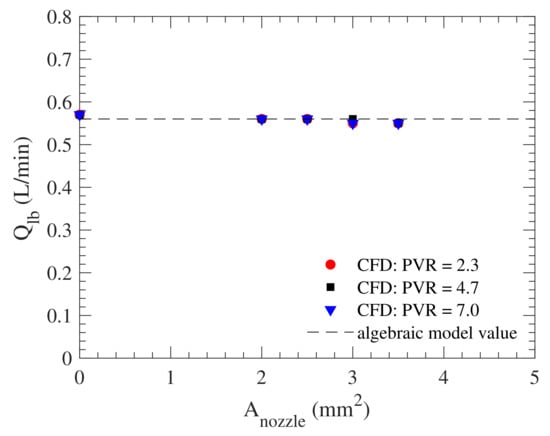
Figure 6.
Lower body average flow rate, , obtained from CFD simulations with PVRs of 2.3 (red circle), 4.7 (black square), and 7.0 (blue triangle) Wood units-. Some data points are not clearly visible since they are overlapping. The dotted line is the constant lower body flow rate assumed in the algebraic model.
and are computed through an optimization procedure. Three parameters from the CFD simulation results are used as target values in the calculations: the mean SVC pressure, , the mean PA pressure, , and the mean pulmonary flow rate, . The optimization problem is stated as minimizing the error function:
with respect to .
To find the minimum of the error function, we used a gradient-based iterative approach that is implemented as in MATLAB [47]. The minimum of the function, , is computed such that , where the lower bound is and the upper bound is . The initial value is . The function took 11 iterations to converge to and , producing .
3. Results
3.1. CFD and Algebraic Model Comparison
With the constant values calculated, remaining unknowns in the algebraic model can be calculated and compared against the CFD results. Figure 7 and Figure 8a shows the behavior of the three parameters that are most critical to the effectiveness of the ABG circulation, namely the mean pulmonary flow rate, , the mean SVC pressure, , and the mean PA pressure, , which are the same parameters used to calculate the constants in the algebraic model. In the figures of this section, the lines are the results from the algebraic model, and the data points are the CFD results. The BDG is represented by the zero nozzle area in these plots.
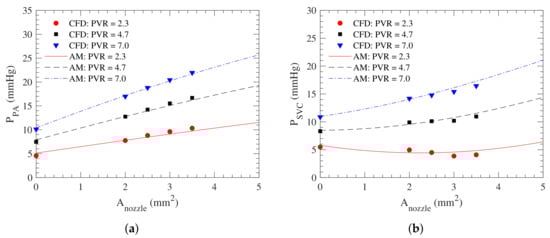
Figure 7.
(a) the mean pulmonary artery pressure, and (b) the mean SVC pressure, , as a function of the nozzle area, , at different PVR values. Lines correspond to the algebraic model (AM) and symbols to the CFD.
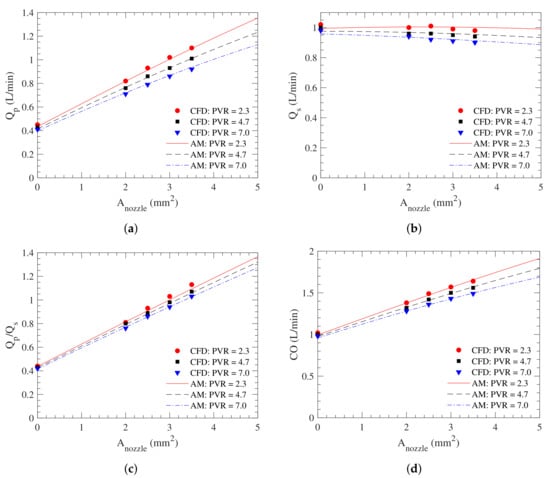
Figure 8.
(a) The pulmonary average flow rate, ; (b) the average systemic flow rate, ; (c) the pulmonary-to-systemic flow ratio, ; and (d) the average cardiac output, , as a function of the nozzle area, , at different PVR values. Lines correspond to the algebraic model (AM) and symbols to the CFD.
There is a good overall agreement between the algebraic model and the CFD results. Figure 7a shows that the pulmonary arterial pressure at a given PVR increases almost linearly with the nozzle area. This correlation is caused by the pulmonary flow increasing monotonically as the nozzle area increase (Figure 8a), as the mean velocity at the nozzle is almost constant. Since the PVR is held constant as an independent variable in our models, the pulmonary arterial pressure is linearly proportional to the pulmonary flow rate, thus creating a linear relationship between the nozzle area and the pulmonary arterial pressure. In practice, the pulmonary arterial pressure might plateau when the nozzle area increases beyond a certain value since studies show that the PVR drops as the pulmonary arterial pressure increases [48,49]. As expected, the rate at which the pulmonary arterial pressure increases with the nozzle area, as well as its absolute value, increases with the PVR.
The SVC pressure, , initially decreases as the nozzle area increases owing to the ejector pump effect. However, at sufficiently large nozzle areas or PVRs, it increases as the increase in beyond that of the BDG (corresponding to a zero nozzle area) as the increase in the pulmonary arterial pressure cannot be compensated by the ejector pump effect. For higher PVRs, any additional flow from the shunt is non-beneficial to the lowering SVC pressure. The exact cut-off value of the PVR for such adverse effect is presented in Section 3.2.
Other parameters calculated from the algebraic model also show good agreement with the CFD results (Figure 8). The systemic flow rate, , remains relatively constant as it is a function of aortic and venous pressures and systemic vascular resistance, which do not depend on the nozzle area. The cardiac output, , and pulmonary-to-systemic flow ratio, , both linearly increase with the nozzle area, which is the direct consequences of the systemic flow rate being constant and the pulmonary flow rate linearly increasing with the nozzle area. These three parameters are relatively insensitive to the PVR, especially at smaller nozzle areas.
Figure 9 shows the oxygen delivery, , and systemic oxygen saturation obtained from the CFD simulation and the algebraic model. These parameters show rapid growths at small nozzle areas up to approximately 2 . Increasing the nozzle area beyond 2 has a smaller effect on oxygen delivery and saturation as the increase in the pulmonary flow is countered by a drop in systemic flow rate owing to the shunt flow.
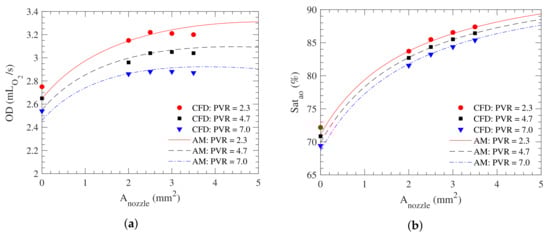
Figure 9.
(a) The oxygen delivery, ; and (b) the aortic oxygen saturation, , as a function of the nozzle area, , at different PVR values. Lines correspond to the algebraic model (AM) and symbols to the CFD.
The effectiveness of the ejector pump effect can be further demonstrated with two additional parameters: the pressure recovery, , and the ejector pump efficiency, . The pressure recovery is calculated as the difference in pressure between the downstream and upstream of the ejector pump, which are the PA pressure and the SVC pressure, respectively. As shown in Figure 10a, the pressure recovery is almost independent of the PVR according to both the CFD and algebraic model. It increases linearly with the nozzle area up to a certain value, around 3 mm2 for the CFD result and 2 mm2 for the algebraic model. The pressure recovery then plateaus before trending slightly downwards at large nozzle areas. The ejector pump efficiency is calculated as the ratio between the actual pressure recovery and the pressure recovery when the losses associated with and terms are removed from the model. Figure 10b shows that there is an optimal nozzle area for the ejector pump efficiently. For very small nozzle areas, the nozzle flow dissipates its energy before transferring it to the SVC flow. On the other hand, for very large nozzles, the SVC length is too short for the two streams to mix sufficiently. As a result, the jet created by the nozzle impinges the PA, losing its energy and lowering the ejector pump efficiency. The efficiency metric is very sensitive to the dynamics of the flow in the ejector pump and the approach in modeling the losses. The algebraic model only accounts for the losses that are proportional to the velocity square. Linear losses are excluded in the algebraic model to prevent over-fitting. In reality, some losses may scale linearly rather than quadratically with the flow, such as Poiseuille’s law at low Reynolds number. These simplifications likely cause those disagreements between the CFD and the algebraic model predictions.
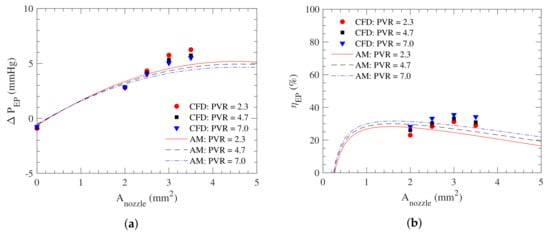
Figure 10.
(a) The pressure recovery, ; and (b) ejector pump efficiency, , as a function of nozzle area, , at different PVR values. Lines correspond to the algebraic model (AM) and symbols to the CFD.
The overall agreement between the CFD and the algebraic model indicates the relative accuracy of the algebraic model in characterizing the ABG circulation and predicting its hydrodynamic response for different nozzle areas and PVRs.
3.2. Algebraic Model Predictions
With the algebraic model, we can further analyze where the losses are occurring in the ejector pump. The shunt and PA losses are calculated using the loss terms in Equations (7) and (10) whereas the SVC loss is inherent due to the momentum balance formulation of the SVC mixing in the algebraic model. The loss in the SVC is calculated from the energy difference between the inlets and the outlet of the SVC. Thus, while other losses can be avoided by improving the design of the ejector pump, the SVC mixing loss is unavoidable as it is inherent to the ejector pump function. As shown in Figure 11 and Figure 12, the energy loss mostly occurs in the shunt and through the mixing inside the SVC at a smaller nozzle area. As the nozzle area increases, the loss inside the PA becomes more dominant. Although the energy loss due to the mixing inside the SVC is required for the proper functioning of the ejector pump, the significant energy loss in the shunt and the PA indicates there is still room for improvement by identifying a more optimal design.
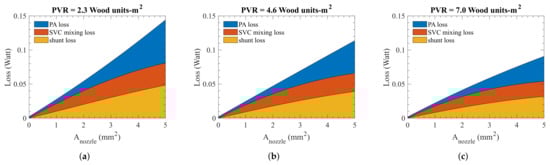
Figure 11.
The locations where energy losses occur in the ABG circulation at (a) normal PVR, (b) elevated PVR, and (c) high PVR. These results are obtained from the algebraic model.
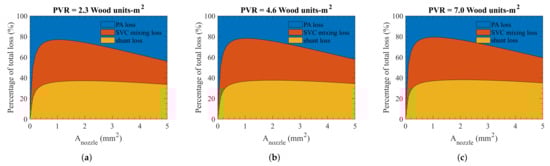
Figure 12.
The same results as Figure 11, namely, losses in the ABG circulation, but on a relative scale at (a) normal PVR, (b) elevated PVR, and (c) high PVR.
Figure 13 and Figure 14 present the 2D survey of the ABG circulation performance for any given nozzle area and PVR. The pulmonary arterial pressure (Figure 13a) monotonically increases with the PVR and nozzle area since a higher PVR imposes higher resistance against pulmonary perfusion and a larger nozzle area increases the pulmonary perfusion, as described mathematically in Equation (12). The ejector pump pressure recovery (Figure 13b) is almost independent of PVR while monotonically increasing with the nozzle area. A larger nozzle provides more energy for pumping the flow, thereby increasing the overall pumping pressure of the ejector pump. This correlation nonetheless breaks down at a large nozzle area owing to the finite SVC flow and the increase in losses at higher shunt flow (Figure 13c).
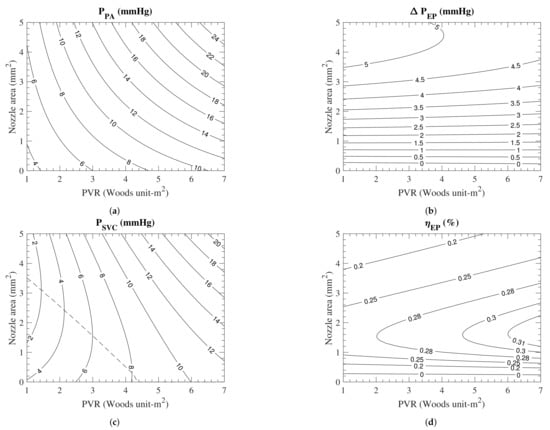
Figure 13.
(a) The PA pressure, (b) the ejector pump pressure recovery, (c) the SVC pressure, and (d) the ejector pump efficiency as functions of the nozzle area and the PVR. The dashed line in (c) represent the optimal nozzle area that produces the lowest SVC pressure at a given PVR. These results are obtained from the algebraic model.
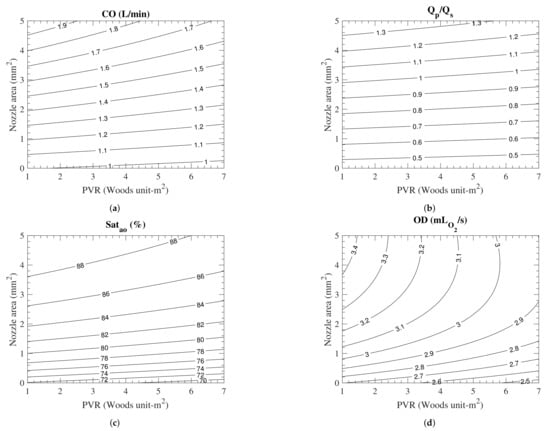
Figure 14.
(a) The cardiac output, (b) the pulmonary-to-systemic flow ratio, (c) the aortic oxygen saturation, and (d) the oxygen delivery as functions of the nozzle area and the PVR. These results are produced by the algebraic model.
The change in the SVC pressure, which is a result of a competition between the change in the PA pressure and the ejector pump pressure recovery, has a more complex behavior (Figure 13c). For normal to slightly elevated PVR, that competition leads to an SVC pressure that first decreases then increases as the nozzle area increases. This non-monotonic variation creates an optimal nozzle area (shown with a dashed line in Figure 13c) that yields the lowest SVC pressure. For PVR greater than Wood units-m2, however, the inclusion of the systemic-to-pulmonary shunt will only have an adverse effect on the SVC pressure. This monotonic variation can be explained by the fact that the rate at which the pulmonary arterial pressure increases with the nozzle area is faster than that of the ejector pump pressure recovery.
The ejector pump efficiency (Figure 13d) depends on the amount of energy extracted from the shunt flow to elevate the ejector pump pressure recovery. The efficiency shows a strong dependence on the nozzle area while weakly varying with the PVR. Its variation with the nozzle area is non-monotonic, reaching a peak at an intermediate nozzle size, around 1.6 mm2. As explained earlier, lower efficiency at small and large nozzle areas can be attributed to the significant losses in the PA through different mechanisms. One must note that the maximum efficiency of the ejector pump does not necessarily coincide with the maximum pressure recovery or minimum SVC pressure, as each of these parameters depends on a range of other parameters, including the pulmonary arterial pressure.
The cardiac output primarily depends on the nozzle area since a larger nozzle area directs more flow to the pulmonary circulation (Figure 14a). Similar to the cardiac output, the pulmonary-to-systemic flow ratio is also primarily a function of the nozzle area (Figure 14b). This is due to the fact that the pulmonary flow rare linearly increases with nozzle area while the systemic flow rate is almost independent of the nozzle size, as shown in Figure 8b. The aortic oxygen saturation also monotonically increases with the nozzle area (Figure 14c). This dependence results from the pulmonary flow rate increasing linearly with the nozzle area, which in turn changes the balance between the oxygenated and deoxygenated blood in the atrium. The oxygen delivery shows a rather complex behavior (Figure 14d). For small nozzle areas, the oxygen delivery increases linearly with the nozzle area and is independent of the PVR. On the other hand, it decreases monotonically with the PVR for large nozzle areas while remaining relatively independent from the nozzle area. This behavior at large nozzle areas can be explained by the gradual drop in cardiac output and systemic saturation as PVR increases (Figure 14a,c).
These plots showcase the advantage of the algebraic model over CFD to fully survey all nozzle area and PVR with a fraction of the computational cost. Furthermore, the contour plots can be a powerful tool in clinical decision-making for the ABG procedure. It permits for the fast prediction of the SVC pressure, among others, for different patients. It also provides a means to predict how selecting a larger or smaller nozzle influences the outcome of an operation.
4. Discussion
We introduced an algebraic model as a fast and accurate way to characterize the ABG circulation performance. One key component that dictates the accuracy of the algebraic model is the loss constants, and . Despite the fact that these constants are calculated by minimizing the difference between the model prediction and the CFD results, the computed values are physically reasonable. We introduced two non-dimensional head loss terms as functions of the flow rate-squared because the losses primarily occur due to the sharp change in flow directions in the shunt and SVC-PA regions. These loss terms can be compared to the Darcy–Weisbach equation (Equation (17)) for head loss, , in a pipe flow,
where L is the pipe length, D is the pipe diameter, is the mean velocity in pipe, and is the friction factor [50]. In our study, the head loss constants, and , are related to friction factors via
The lengths, L, of the shunt and pulmonary arteries are 1.7 and 3.5 cm, respectively, and the diameters, D, of the shunt and pulmonary arteries are 0.3 and 0.55 cm, respectively. Knowing the constants in our case, the friction factors for the shunt and the pulmonary arteries and , are calculated to be 0.11 and 0.26, respectively. Both of the friction factors are comparable to the friction factors in pipe flow for the Reynolds numbers (≈1000) of our simulation.
Three interesting observations can be made from the algebraic model results. First, parameters such as the pulmonary flow rate and the cardiac output are less sensitive to the PVR for smaller nozzle areas (). This lack of sensitivity can be beneficial for infants who experience episodes of increased PVR after birth, during which sufficient blood circulation can be maintained. Second, even a small nozzle of mm2 is better than no nozzle when the oxygen delivery and systemic oxygen saturation are concerned. Regardless of PVR, these two parameters are elevated by to when a 2 mm2 nozzle is added to the BDG. Such improvement in these metrics is significant considering that the early BDG complications are partly related to low oxygen saturation [20,21]. Lastly, the version of the ejector pump utilized in this study can reduce the upper body (SVC) pressure for normal PVR and limit the pressure rise to a minimum when episodes of high PVR occur, thereby mitigating the risk of SVC syndrome reported in older studies [17,18]. A more recent study on successful BDG operation further shows that the infant can endure an SVC pressure as high as 13.2 mmHg [21]. If we consider that pressure to be the maximum allowable SVC pressure, then a patient receiving a 2 mm2 nozzle should remain in the safe zone as long as the PVR remains below 7 Wood units-m2. Moreover, studies showed that the PVR value generally decreases as the oxygen saturation and the pulmonary arterial pressure are increased [48,49]. For its higher saturation and PA pressure, the ABG operation patients are expected to have a lower PVR than those undergoing the mBTS or BDG. Thus, the higher SVC pressure observed in the case of ABG may not materialize in practice.
Overall, the optimal nozzle size is in the range of 2 mm2 and 3 mm2. Smaller nozzle areas (≈2 mm2) are more suited for patients with wider ranges of PVR as the SVC pressure remains reasonably low even at high PVR values. As discussed above, the flow rate parameters such as the pulmonary flow rate and cardiac output are more stable for smaller nozzle areas as PVR changes. Furthermore, since the cardiac output will be lower for smaller nozzle areas, the overall workload on the heart will be less. On the other hand, if the patient has relatively stable PVR, and can handle a larger ventricle load, a larger nozzle area (≈3 mm2) has more physiological benefits. The SVC pressure will be even lower than that of the case of smaller nozzle areas for normal PVR, as seen in Figure 7b, which will further alleviate complications related to high SVC pressure. The aortic oxygen saturation and oxygen delivery will also be slightly higher. Finally, the pulmonary-to-systemic flow ratio will be exactly 1, which is considered the ideal situation. Outside of our optimal range, if the nozzle area is even smaller, the benefits of the ABG circulation are diminished since most of the energy through the shunt is lost through dissipation. For a nozzle larger than 3 mm2, the excessive flow through the shunt overloads the pulmonary circulation, impeding the upper body circulation while creating unnecessarily high ventricle load.
An essential advantage of the algebraic model is its negligible cost that enables real-time predictions of post-operating conditions. That can be in the form of using this algebraic model in clinical settings to select the appropriate nozzle size that is patient-specific. One limitation of our algebraic model is the assumption of a constant PVR. As we discussed in this paper, the PVR changes as a function of the pulmonary arterial pressure and the pulmonary oxygen saturation [48,49]. Such dynamic response is therefore missing in the algebraic model. Accounting for this dependence in the future models will allow us to determine whether the improved pulmonary arterial pressure and oxygen saturation in the ABG are sufficient to prevent an elevated SVC pressure. Improvements on the shunt and nozzle design can help further reduce losses and improve the efficiency of the ABG to obtain an even lower SVC pressure. For example, a more smooth shunt transition can help reduce energy loss in the shunt. The SVC downstream loss due to the flow impingement can also be reduced if the SVC-PA junction is Y-shaped instead of T-shaped. However, any of these changes must be made while considering surgical feasibility, patient growth, and vascular remodeling.
5. Conclusions
An accurate algebraic model that was informed by CFD was constructed to characterize the performance of the ABG procedure. With this algebraic model, we can explore and characterize the full relationship between design parameters and patient conditions, a feat that would not have been possible using CFD simulations alone. Optimization study shows that the mABG shunt is only successful in reducing the SVC pressure when the PVR is lower than 4.4 Wood units-m2. The model shows that there is little benefit in increasing the nozzle area beyond 2 mm2 in terms of oxygen delivery and saturation. Our study introduces, for the first time, a procedure for real-time simulation of the ABG at an accuracy comparable to CFD.
Author Contributions
Conceptualization, D.J. and M.E.; methodology, D.J. and M.E.; software, D.J. and M.E.; validation, D.J. and M.E.; formal analysis, D.J.; investigation, D.J.; resources, M.E.; data curation, D.J. and M.E.; writing—original draft preparation, D.J.; writing—review and editing, D.J. and M.E.; visualization, D.J.; supervision, M.E.; project administration, M.E.; funding acquisition, M.E. All authors have read and agreed to the published version of the manuscript.
Funding
This research received no external funding.
Institutional Review Board Statement
Not applicable.
Informed Consent Statement
Not applicable.
Data Availability Statement
The data presented in this study are available on request from the corresponding author.
Conflicts of Interest
The authors declare no conflict of interest.
Appendix A. LPN Model and Values
The values of the LPN (Figure 3) elements are shown in Table A1. Outside the heart model, all the resistors, capacitors, and inductors have linear behavior. To model turbulence associated with the heart valves, two resistances are included in the LPN, which pressure drop through them is proportional to the square of their flow rate. Heart chambers pressure is considered to be composed of active and passive parts. The atrial pressure is model using,
is modeled with sinusoidal function which is non-zero during atrium contraction and , , , and are the constants of this model. The same model is used for ventricle, except the active pressure, that is, first term in Equation (A1), is replaced with a parabolic function,
All the constants of the heart model along with the rest of LPN are shown in Table A1.

Table A1.
Figure 3 parameters values. R, resistance; C, capacitance; L, inductance. The locations of UBA, UBB, UBV, etc.) are marked in Figure 3. E, elastance; P, pressure; K, constant; V, volume; v, single ventricle; u, unstressed; a, atrium; , tricuspid; , aorta; , atrial septal defect. Data from [16,24].
| Parameter | Value | Unit |
|---|---|---|
| 28.0899 | mmHg s/mL | |
| 0.04430 | mL/mmHg | |
| 0.02138 | mmHg s/mL | |
| 0.64510 | mmHg s/mL | |
| 0.15515 | mL/mmHg | |
| 0.16529 | mmHg s/mL | |
| 2.03945 | mL/mmHg | |
| 0.83376 | mmHg s/mL | |
| 0.02039 | mL/mmHg | |
| 0.02194 | mmHg s/mL | |
| 0.44375 | mL/mmHg | |
| 7.02239 | mmHg s/mL | |
| 0.07758 | mL/mmHg | |
| 0.01069 | mmHg s/mL | |
| 0.64510 | mmHg s/mL | |
| 0.07758 | mL/mmHg | |
| 0.16529 | mmHg s/mL | |
| 2.03945 | mL/mmHg | |
| 10.6739 | mmHg s/mL | |
| 1.9435 × | mL/mmHg | |
| 10.6739 | mmHg s/mL | |
| 5.1827 × | mL/mmHg | |
| 21.3477 | mmHg s/mL | |
| 7.7741 × | mL/mmHg | |
| 10.6739 | mmHg s/mL | |
| 0.05 × | mL/mmHg | |
| 18.5 | mmHg/mL | |
| −0.042 | mmHg/mL | |
| 4.0 | mL | |
| 0.9 | mmHg | |
| 0.062 | 1/mL | |
| 7.35 | mmHg/mL | |
| 1.0 | mL | |
| 0.17 | mmHg | |
| 0.484 | 1/mL | |
| 4 × | mmHg s/mL | |
| 4 × | mmHg s/mL | |
| 0.09 | mmHg s/mL | |
| 0.001 | mmHg s/mL | |
| 0.041555 | mL/mmHg |
References
- Norwood, W.I.; Kirklin, J.K.; Sanders, S.P. Hypoplastic left heart syndrome: Experience with palliative surgery. Am. J. Cardiol. 1980, 45, 87–91. [Google Scholar] [CrossRef]
- Norwood, W.I.; Lang, P.; Casteneda, A.; Campbell, D. Experience with operations for hypoplastic left heart syndrome. J. Thorac. Cardiovasc. Surg. 1981, 82, 511–519. [Google Scholar] [CrossRef]
- Glenn, W.W. Circulatory bypass of the right side of the heart: Shunt between superior vena cava and distal right pulmonary artery—Report of clinical application. N. Engl. J. Med. 1958, 259, 117–120. [Google Scholar] [CrossRef] [PubMed]
- Glenn, W.W.; Ordway, N.K.; Talner, N.S.; Call, E.P., Jr. Circulatory Bypass of the Right Side of the Heart: VI. Shunt between Superior Vena Cava and Distal Right Pulmonary Artery; Report of Clinical Application in Thirty-eight Cases. Circulation 1965, 31, 172–189. [Google Scholar] [CrossRef] [PubMed]
- Fontan, F.; Baudet, E. Surgical repair of tricuspid atresia. Thorax 1971, 26, 240–248. [Google Scholar] [CrossRef]
- Fontan, F.; Kirklin, J.W.; Fernandez, G.; Costa, F.; Naftel, D.C.; Tritto, F.; Blackstone, E.H. Outcome after a “perfect” Fontan operation. Circulation 1990, 81, 1520–1536. [Google Scholar] [CrossRef] [PubMed]
- D’Udekem, Y.; Xu, M.Y.; Galati, J.C.; Lu, S.; Iyengar, A.J.; Konstantinov, I.E.; Wheaton, G.R.; Ramsay, J.M.; Grigg, L.E.; Millar, J.; et al. Predictors of survival after single-ventricle palliation: The impact of right ventricular dominance. J. Am. Coll. Cardiol. 2012, 59, 1178–1185. [Google Scholar] [CrossRef] [PubMed]
- Bartram, U.; Grünenfelder, J.; Richard Van Praagh, M. Causes of death after the modified Norwood procedure: A study of 122 postmortem cases. Ann. Thorac. Surg. 1997, 64, 1795–1802. [Google Scholar] [CrossRef]
- Migliavacca, F.; Dubini, G.; Pennati, G.; Pietrabissa, R.; Fumero, R.; Hsia, T.Y.; de Leval, M.R. Computational model of the fluid dynamics in systemic-to-pulmonary shunts. J. Biomech. 2000, 33, 549–557. [Google Scholar] [CrossRef]
- Song, M.H.; Sato, M.; Ueda, Y. Three-dimensional simulation of the Blalock-Taussig shunt using computational fluid dynamics. Surg. Today 2001, 31, 688–694. [Google Scholar] [CrossRef]
- Migliavacca, F.; Pennati, G.; Di Martino, E.; Dubini, G.; Pietrabissa, R. Pressure drops in a distensible model of end-to-side anastomosis in systemic-to-pulmonary shunts. Comput. Methods Biomech. Biomed. Eng. 2002, 5, 243–248. [Google Scholar] [CrossRef]
- Waniewski, J.; Kurowska, W.; Mizerski, J.K.; Trykozko, A.; Nowiński, K.; Brzezińska-Rajszys, G.; Kościesza, A. The effects of graft geometry on the patency of a systemic-to-pulmonary shunt: A computational fluid dynamics study. Artif. Organs 2005, 29, 642–650. [Google Scholar] [CrossRef]
- Bove, E.L.; Migliavacca, F.; de Leval, M.R.; Balossino, R.; Pennati, G.; Lloyd, T.R.; Khambadkone, S.; Hsia, T.Y.; Dubini, G. Use of mathematic modeling to compare and predict hemodynamic effects of the modified Blalock–Taussig and right ventricle–pulmonary artery shunts for hypoplastic left heart syndrome. J. Thorac. Cardiovasc. Surg. 2008, 136, 312–320. [Google Scholar] [CrossRef]
- Esmaily-Moghadam, M.; Murtuza, B.; Hsia, T.Y.; Marsden, A. Simulations reveal adverse hemodynamics in patients with multiple systemic to pulmonary shunts. J. Biomech. Eng. 2015, 137, 031001. [Google Scholar] [CrossRef] [PubMed]
- Moghadam, M.E.; Migliavacca, F.; Vignon-Clementel, I.E.; Hsia, T.Y.; Marsden, A.L. Optimization of shunt placement for the Norwood surgery using multi-domain modeling. J. Biomech. Eng. 2012, 134, 051002. [Google Scholar] [CrossRef] [PubMed]
- Migliavacca, F.; Pennati, G.; Dubini, G.; Fumero, R.; Pietrabissa, R.; Urcelay, G.; Bove, E.L.; Hsia, T.Y.; de Leval, M.R. Modeling of the Norwood circulation: Effects of shunt size, vascular resistances, and heart rate. Am. J. Physiol.-Heart Circ. Physiol. 2001, 280, H2076–H2086. [Google Scholar] [CrossRef]
- Di Carlo, D.; Williams, W.G.; Freedom, R.M.; Trusler, G.A.; Rowe, R.D. The role of cava-pulmonary (Glenn) anastomosis in the palliative treatment of congenital heart disease. J. Thorac. Cardiovasc. Surg. 1982, 83, 437–442. [Google Scholar] [CrossRef]
- Kopf, G.S.; Laks, H.; Stansel, H.C.; Hellenbrand, W.E.; Kleinman, C.S.; Talner, N.S. Thirty-year follow-up of superior vena cava-pulmonary artery (Glenn) shunts. J. Thorac. Cardiovasc. Surg. 1990, 100, 662–671. [Google Scholar] [CrossRef]
- Warrier, G.; Dharan, B.S.; Koshy, S.; Kumar, S.; Krishnanaik, S.; Rao, S.G. Bidirectional Glenn operation in infancy. Indian J. Thorac. Cardiovasc. Surg. 2004, 20, 159–163. [Google Scholar] [CrossRef]
- Jaquiss, R.D.; Ghanayem, N.S.; Hoffman, G.M.; Fedderly, R.T.; Cava, J.R.; Mussatto, K.A.; Tweddell, J.S. Early cavopulmonary anastomosis in very young infants after the Norwood procedure: Impact on oxygenation, resource utilization, and mortality. J. Thorac. Cardiovasc. Surg. 2004, 127, 982–989. [Google Scholar] [CrossRef] [PubMed]
- Petrucci, O.; Khoury, P.R.; Manning, P.B.; Eghtesady, P. Outcomes of the bidirectional Glenn procedure in patients less than 3 months of age. J. Thorac. Cardiovasc. Surg. 2010, 139, 562–568. [Google Scholar] [CrossRef] [PubMed][Green Version]
- Caspi, J.; Pettitt, T.W.; Mulder, T.; Stopa, A. Development of the pulmonary arteries after the Norwood procedure: Comparison between Blalock-Taussig shunt and right ventricular–pulmonary artery conduit. Ann. Thorac. Surg. 2008, 86, 1299–1304. [Google Scholar] [CrossRef] [PubMed]
- Griselli, M.; McGuirk, S.P.; Ofoe, V.; Stümper, O.; Wright, J.G.; de Giovanni, J.V.; Barron, D.J.; Brawn, W.J. Fate of pulmonary arteries following Norwood procedure. Eur. J. Cardio-Thorac. Surg. 2006, 30, 930–935. [Google Scholar] [CrossRef][Green Version]
- Esmaily-Moghadam, M.; Hsia, T.Y.; Marsden, A.L.; Modeling of Congenital Hearts Alliance (MOCHA) Investigators. The assisted bidirectional Glenn: A novel surgical approach for first-stage single-ventricle heart palliation. J. Thorac. Cardiovasc. Surg. 2015, 149, 699–705. [Google Scholar] [CrossRef] [PubMed]
- Shang, J.K.; Esmaily, M.; Verma, A.; Reinhartz, O.; Figliola, R.S.; Hsia, T.Y.; Feinstein, J.A.; Marsden, A.L. Patient-specific multiscale modeling of the assisted bidirectional Glenn. Ann. Thorac. Surg. 2019, 107, 1232–1239. [Google Scholar] [CrossRef]
- Verma, A.; Esmaily, M.; Shang, J.; Figliola, R.; Feinstein, J.A.; Hsia, T.Y.; Marsden, A.L. Optimization of the assisted bidirectional Glenn procedure for first stage single ventricle repair. World J. Pediatr. Congenit. Heart Surg. 2018, 9, 157–170. [Google Scholar] [CrossRef]
- Zhou, J.; Esmaily-Moghadam, M.; Conover, T.A.; Hsia, T.Y.; Marsden, A.L.; Figliola, R.S. In vitro assessment of the assisted bidirectional Glenn procedure for stage one single ventricle repair. Cardiovasc. Eng. Technol. 2015, 6, 256–267. [Google Scholar] [CrossRef]
- Fleeter, C.M.; Geraci, G.; Schiavazzi, D.E.; Kahn, A.M.; Marsden, A.L. Multilevel and multifidelity uncertainty quantification for cardiovascular hemodynamics. Comput. Methods Appl. Mech. Eng. 2020, 365, 113030. [Google Scholar] [CrossRef]
- Jia, D.; Peroni, M.; Khalapyan, T.; Esmaily, M. An Efficient Assisted Bidirectional Glenn Design With Lowered Superior Vena Cava Pressure for Stage-One Single Ventricle Patients. J. Biomech. Eng. 2021, 143, 071008. [Google Scholar] [CrossRef]
- DeCampli, W.M. The steam locomotive makes a comeback: A new solution to staged single-ventricle palliation? J. Thorac. Cardiovasc. Surg. 2015, 149, 706–707. [Google Scholar] [CrossRef]
- Morgan, C.D.; Wolf, M.S.; Le, T.M.; Shannon, C.N.; Wellons, J.C.; Mettler, B.A. Cerebral ventriculomegaly after the bidirectional Glenn (BDG) shunt: A single-institution retrospective analysis. Child’s Nerv. Syst. 2015, 31, 2131–2134. [Google Scholar] [CrossRef] [PubMed]
- Heinemann, M.; Breuer, J.; Steger, V.; Steil, E.; Sieverding, L.; Ziemer, G. Incidence and impact of systemic venous collateral development after Glenn and Fontan procedures. Thorac. Cardiovasc. Surg. 2001, 49, 172–178. [Google Scholar] [CrossRef] [PubMed]
- Pasta, S.; Gentile, G.; Raffa, G.M.; Scardulla, F.; Bellavia, D.; Luca, A.; Pilato, M.; Scardulla, C. Three-dimensional parametric modeling of bicuspid aortopathy and comparison with computational flow predictions. Artif. Organs 2017, 41, E92–E102. [Google Scholar] [CrossRef]
- Scardulla, F.; Pasta, S.; D’Acquisto, L.; Sciacca, S.; Agnese, V.; Vergara, C.; Quarteroni, A.; Clemenza, F.; Bellavia, D.; Pilato, M. Shear stress alterations in the celiac trunk of patients with a continuous-flow left ventricular assist device as shown by in-silico and in-vitro flow analyses. J. Heart Lung Transplant. 2017, 36, 906–913. [Google Scholar] [CrossRef] [PubMed]
- Ficial, B.; Finnemore, A.E.; Cox, D.J.; Broadhouse, K.M.; Price, A.N.; Durighel, G.; Ekitzidou, G.; Hajnal, J.V.; Edwards, A.D.; Groves, A.M. Validation study of the accuracy of echocardiographic measurements of systemic blood flow volume in newborn infants. J. Am. Soc. Echocardiogr. 2013, 26, 1365–1371. [Google Scholar] [CrossRef]
- Ruano, R.; de Fatima Yukie Maeda, M.; Niigaki, J.I.; Zugaib, M. Pulmonary artery diameters in healthy fetuses from 19 to 40 weeks’ gestation. J. Ultrasound Med. 2007, 26, 309–316. [Google Scholar] [CrossRef]
- Box, F.M.; van der Geest, R.J.; Rutten, M.C.; Reiber, J.H. The influence of flow, vessel diameter, and non-Newtonian blood viscosity on the wall shear stress in a carotid bifurcation model for unsteady flow. Investig. Radiol. 2005, 40, 277–294. [Google Scholar] [CrossRef]
- Moghadam, M.E.; Vignon-Clementel, I.E.; Figliola, R.; Marsden, A.L.; Modeling of Congenital Hearts Alliance (MOCHA) Investigators. A modular numerical method for implicit 0D/3D coupling in cardiovascular finite element simulations. J. Comput. Phys. 2013, 244, 63–79. [Google Scholar] [CrossRef]
- Marsden, A.L.; Esmaily-Moghadam, M. Multiscale modeling of cardiovascular flows for clinical decision support. Appl. Mech. Rev. 2015, 67, 030804. [Google Scholar] [CrossRef]
- Esmaily-Moghadam, M.; Bazilevs, Y.; Marsden, A.L. A bi-partitioned iterative algorithm for solving linear systems arising from incompressible flow problems. Comput. Methods Appl. Mech. Eng. 2015, 286, 40–62. [Google Scholar] [CrossRef]
- Esmaily-Moghadam, M.; Bazilevs, Y.; Marsden, A.L. A new preconditioning technique for implicitly coupled multidomain simulations with applications to hemodynamics. Comput. Mech. 2013, 52, 1141–1152. [Google Scholar] [CrossRef]
- Moghadam, M.E.; Bazilevs, Y.; Hsia, T.Y.; Vignon-Clementel, I.E.; Marsden, A.L. A comparison of outlet boundary treatments for prevention of backflow divergence with relevance to blood flow simulations. Comput. Mech. 2011, 48, 277–291. [Google Scholar] [CrossRef]
- Brooks, A.N.; Hughes, T.J. Streamline upwind/Petrov-Galerkin formulations for convection dominated flows with particular emphasis on the incompressible Navier-Stokes equations. Comput. Methods Appl. Mech. Eng. 1982, 32, 199–259. [Google Scholar] [CrossRef]
- Bazilevs, Y.; Calo, V.; Cottrell, J.; Hughes, T.; Reali, A.; Scovazzi, G. Variational multiscale residual-based turbulence modeling for large eddy simulation of incompressible flows. Comput. Methods Appl. Mech. Eng. 2007, 197, 173–201. [Google Scholar] [CrossRef]
- Esmaily-Moghadam, M.; Bazilevs, Y.; Marsden, A. Impact of data distribution on the parallel performance of iterative linear solvers with emphasis on CFD of incompressible flows. Comput. Mech. 2015, 55, 93–103. [Google Scholar] [CrossRef]
- Eckmann, D.M.; Bowers, S.; Stecker, M.; Cheung, A.T. Hematocrit, volume expander, temperature, and shear rate effects on blood viscosity. Anesth. Analg. 2000, 91, 539–545. [Google Scholar] [CrossRef] [PubMed]
- The Mathworks, Inc. MATLAB Version 9.11.0.1751886 (R2021b); The Mathworks, Inc.: Natick, MA, USA, 2021. [Google Scholar]
- Lakshminrusimha, S.; Swartz, D.D.; Gugino, S.F.; Ma, C.X.; Wynn, K.A.; Ryan, R.M.; Russell, J.A.; Steinhorn, R.H. Oxygen concentration and pulmonary hemodynamics in newborn lambs with pulmonary hypertension. Pediatr. Res. 2009, 66, 539–544. [Google Scholar] [CrossRef]
- Mazza, E.; Taichman, D.B. Chapter 1—Functions and control of the pulmonary circulation. In Pulmonary Vascular Disease; Mandel, J., Taichman, D., Eds.; W.B. Saunders: Philadelphia, PA, USA, 2006; pp. 1–19. [Google Scholar] [CrossRef]
- Brown, G.O. The History of the Darcy-Weisbach Equation for Pipe Flow Resistance. In Environmental and Water Resources History; American Society of Civil Engineers: Reston, VA, USA, 2002; pp. 34–43. [Google Scholar] [CrossRef]


Publisher’s Note: MDPI stays neutral with regard to jurisdictional claims in published maps and institutional affiliations. |
© 2022 by the authors. Licensee MDPI, Basel, Switzerland. This article is an open access article distributed under the terms and conditions of the Creative Commons Attribution (CC BY) license (https://creativecommons.org/licenses/by/4.0/).