Article

On an Exact Step Length in Gradient-Based Aerodynamic Shape Optimization—Part II: Viscous Flows

1
Zienkiewicz Centre for Computational Engineering, College of Engineering, Bay Campus, Swansea University, Fabian Way, Crymlyn Burrows, Swansea SA1 8EN, UK
2
Department of Mechanical Engineering, University of Canterbury, Private Bag 4800, Christchurch 8140, New Zealand
*
Author to whom correspondence should be addressed.
Fluids 2021, 6(3), 106; https://doi.org/10.3390/fluids6030106
Submission received: 22 January 2021 / Revised: 10 February 2021 / Accepted: 26 February 2021 / Published: 4 March 2021
(This article belongs to the Special Issue Recent Numerical Advances in Fluid Mechanics, Volume II)

Abstract

:
This study presents an extension of a previous study (On an Exact Step Length in Gradient-Based Aerodynamic Shape Optimization) to viscous transonic flows. In this work, we showed that the same procedure to derive an explicit expression for an exact step length βexact in a gradient-based optimization method for inviscid transonic flows can be employed for viscous transonic flows. The extended numerical method was evaluated for the viscous flows over the transonic RAE 2822 airfoil at two common flow conditions in the transonic regime. To do so, the RAE 2822 airfoil was reconstructed by a Bezier curve of degree 16. The numerical solution of the transonic turbulent flow over the airfoil was performed using the solver ANSYS Fluent (using the Spalart–Allmaras turbulence model). Using the proposed step length, a gradient-based optimization method was employed to minimize the drag-to-lift ratio of the airfoil. The gradient of the objective function with respect to design variables was calculated by the finite-difference method. Efficiency and accuracy of the proposed method were investigated through two test cases.

1. Introduction

The advent of computers of ever-increasing power, speed, and memory capacity over the past decades has enabled the development of various aerodynamic shape optimization algorithms which rely on combining computational fluid dynamics with numerical optimization methods. Among the optimization methods commonly used in aerodynamic shape optimization problems are gradient-based methods such as the steepest descent, conjugate gradient, and quasi-Newton methods. In these methods, the calculation of two variables (1) direction of descent and (2) step length are needed during the iterative process to update the current solution. The direction of descent determines the direction along which the value of the underlying objective function is reduced and is obtained from the calculation of the gradient of the objective function. The step length specifies the distance that the updated solution should move in the direction of descent to reduce the objective function as efficiently as possible. The effectiveness of a gradient-based aerodynamic shape optimization problem relies very much on the accuracy of the calculation of these two variables. In aerodynamic shape optimization problems, the finite-difference method and the adjoint method are two methods to calculate the gradient of the objective function with respect to design variables. In this study, the central finite-difference method was used to calculate the gradient. The inexact step length used in the aerodynamic shape optimization was calculated using line search or trust-region methods and was chosen so that some conditions, such as the Wolfe conditions, could be satisfied [1]. In [1], the authors proposed an exact step length in aerodynamic shape optimization problems for inviscid transonic flow over an airfoil. The main objective of this study was to extend the derived expression for the exact step length in inviscid flows to the viscous flows. In this work, the RAE 2822 airfoil was used to assess the accuracy and efficiency of the proposed gradient-based shape optimization method due to widespread use of this airfoil in transonic turbulent flows [2,3,4,5,6,7,8,9]. As the state-of-the-art in aerodynamic shape optimization was presented in some detail in the first part of this work [1], in this paper we only state some papers dealing with the shape design optimization of the RAE2822 at the flow conditions of interest in this work. The aerodynamic shape optimization of the RAE 2822 airfoil in some of the above literature is as follows:
In [2], a different number of design variables (vertical movements of the free-form deformation (FFD) control points and the angle of attack) ranging from 8 to 52 and C- and O-type structured grids were used to reduce the drag on the airfoil satisfying some constraints. The adjoint method was used to compute the derivatives of objective and constraint functions with respect to large numbers of design variables. In [3], the airfoil was reconstructed using B-spline and the flow domain was meshed using a structured multi-block grid. Then the B-spline control points and angle of attack were considered as design variables in the problem of the drag reduction under some constraints including lift. The gradient of the objective function (drag) was computed by the adjoint method and the sequential quadratic programming (SQP) was employed to solve the constrained minimization problem. In [4], the angle of attack and the deformation of certain pilot points along the airfoil surface were considered as the design variables. The reduction of the drag was considered as the objective function and the adjoint method was used to compute the gradient of the objective function with respect to the design variables. In [5], the airfoil was parameterized with a different number (ranging from 16 to 48) of control points of a third-order B-spline. The B-spline control points and angle of attack were considered as design variables. The constrained optimization of the drag reduction under the specified constraints was defined by a quadratic penalty equation as an objective function. Sparse nonlinear optimizer (SNOPT) was employed to minimize the objective function and the gradient was solved by an adjoint solver. In [6], a class-shape function transformation (CST) method of the order 8 was employed to parameterize the airfoil. The conformal transformation was used to mesh the flow domain. Using 18 design variables and based on surrogate models for the objective function (drag) and constraints, a so-called “multi-round optimization strategy” (with a total cost of 592 CFD calls for global optimization) was used to find the global optimal solution. In [7], an aerodynamic shape optimization code, Jetstream, was used to minimize the airfoil drag satisfying certain constraints. A C-type structured grid was used and the y-coordinates of the B-spline surface control points (ranging from 7 to 37 on the top and bottom surfaces of the airfoil) or FFD control points (ranging from 5 to 37 on the top and bottom surfaces of the airfoil), as well as the angle of attack, were considered as design variables. The discrete-adjoint method was used to compute the gradients and the sequential quadratic programming was employed to minimize the objective function.
The remainder of this paper is organized as follows: The RAE 2822 airfoil was parameterized using a Bezier curve of degree 16 (for either of the upper and lower surfaces). Some of the Bezier curve control points were considered as design variables. The flow domain was meshed using the O-type structured hyperbolic grid generation method and the flow equations were solved using the CFD solver ANSYS Fluent. The square of the drag-to-lift ratio was considered as an objective function. The gradient-based quasi-Newton method was used to minimize the objective function. An explicit expression was derived for the step length needed in the iterative process to update the solution. The gradient of the objective function with respect to the design variables was calculated by the central finite-difference method.

2. Governing Equations

Viscous flows were governed by the Navier–Stokes equations. If body forces and volumetric heating were negligible, the 2D steady-state Navier–Stokes equations may be written as:
F x + G y = 0
where the flux vectors F and G are as follows:
F = [ ρ u ρ u 2 + p τ x x ρ v u τ x y ρ ( e + V 2 2 ) u + p u k T T x u τ x x v τ x y ] , G = [ ρ v ρ u v τ y x ρ v 2 + p τ y y ρ ( e + V 2 2 ) v + p v k T T y u τ y x v τ y y ]
where u and v are the components of the velocity vector V = u i + v j ( i and j are the unit vectors in x and y directions, respectively), p is the pressure, ρ is the density, V = u 2 + v 2 is the scalar magnitude of the velocity vector of the fluid flow V , T is the temperature, k T is the thermal conductivity, e is the internal energy, and τ is the shear stress. In transonic turbulent flows, the numerical solution of the full Navier–Stokes equations is prohibitively expensive to adequately resolve time and length scales of the turbulence. The Reynolds-averaged Navier–Stokes (RANS) equations with a turbulence model can be used to reduce the prohibitively high computational cost of the numerical solution and simulate the turbulent flows efficiently. The RANS equations are based on the decomposition of the flow variables into a time-averaged (mean) and fluctuating part. The averaging method results in the equations for the time-averaged part which are of the same form as the original Navier–Stokes equations plus fluctuating quantities known as Reynolds stresses. In turbulence modeling, the Reynolds stresses are related to the time-averaged velocity gradients or time-averaged strain rate tensor through introducing the turbulent eddy viscosity concept. The Spalart–Allmaras (S-A) one-equation turbulence model [10] is one of the most popular turbulence models which was developed specifically for aerospace applications and is widely used in computations of turbulent flows around wings and airfoils. The S-A model is robust, converges fast, and can be easily implemented on structured and unstructured grids with moderate grid resolution requirements in the near-wall region [11]. In this study, the software ANSYS Fluent (V19.2) was used to solve the RANS equations along with the S-A turbulence model in order to compute the drag and lift forces acting on the RAE 2822 airfoil. Here, the viscous flows over the transonic RAE 2822 airfoil at two common flow conditions in the transonic regime were considered. These two flow conditions were referred to as Case 6 (corrected) and Case 9 (corrected) in [12], respectively, and have been extensively used to validate the numerical results from the solution of the RANS equations applied to viscous transonic flows over the RAE 2822 airfoil. The two flow conditions are as follows (Figure 1):
Test case I (Case 6 [12]):
  M = 0.729 ,   α = 2.31 °
Test case II (Case 9 [12]):
  M = 0.734 ,   α = 2.79 °
where M and α are the free stream Mach number and the angle of attack, respectively.

3. Aerodynamic Shape Optimization

3.1. Airfoil Parameterization

In [1], a Bezier curve of degree 10 was used to parameterize the shape of a NACA 0012 airfoil in steady inviscid transonic flow. In this study, however, since we dealt with a more complicated airfoil shape, a Bezier curve of degree 16 (17 control points) was used to construct the upper and lower surfaces of the RAE 2822 airfoil separately. The Bezier curve is mathematically defined as:
P ( t ) = i = 0 n B i J n , i ( t )
where:
J n , i ( t ) = n ! i ! ( n i ) ! t i ( 1 t ) n i
where is the Bernstein basis polynomial of degree n (in this study, n = 16 ), t [ 0 , 1 ] , B i are the control points of the Bezier curve, and P ( t ) = ( x ( t ) , y ( t ) ) where x ( t ) and y ( t ) are x and y coordinates of the predetermined data points on the airfoil surface. The increase in the degree of a Bezier curve has advantages and disadvantages which should be recognized:
Advantage: It improves the flexibility of the Bezier curve, thereby increasing the accuracy of the resulting airfoil shape.
Disadvantage: It increases the computational cost of calculating the sensitivity coefficients when the finite-difference method is used to calculate the derivative of the objective function with respect to the design variables.
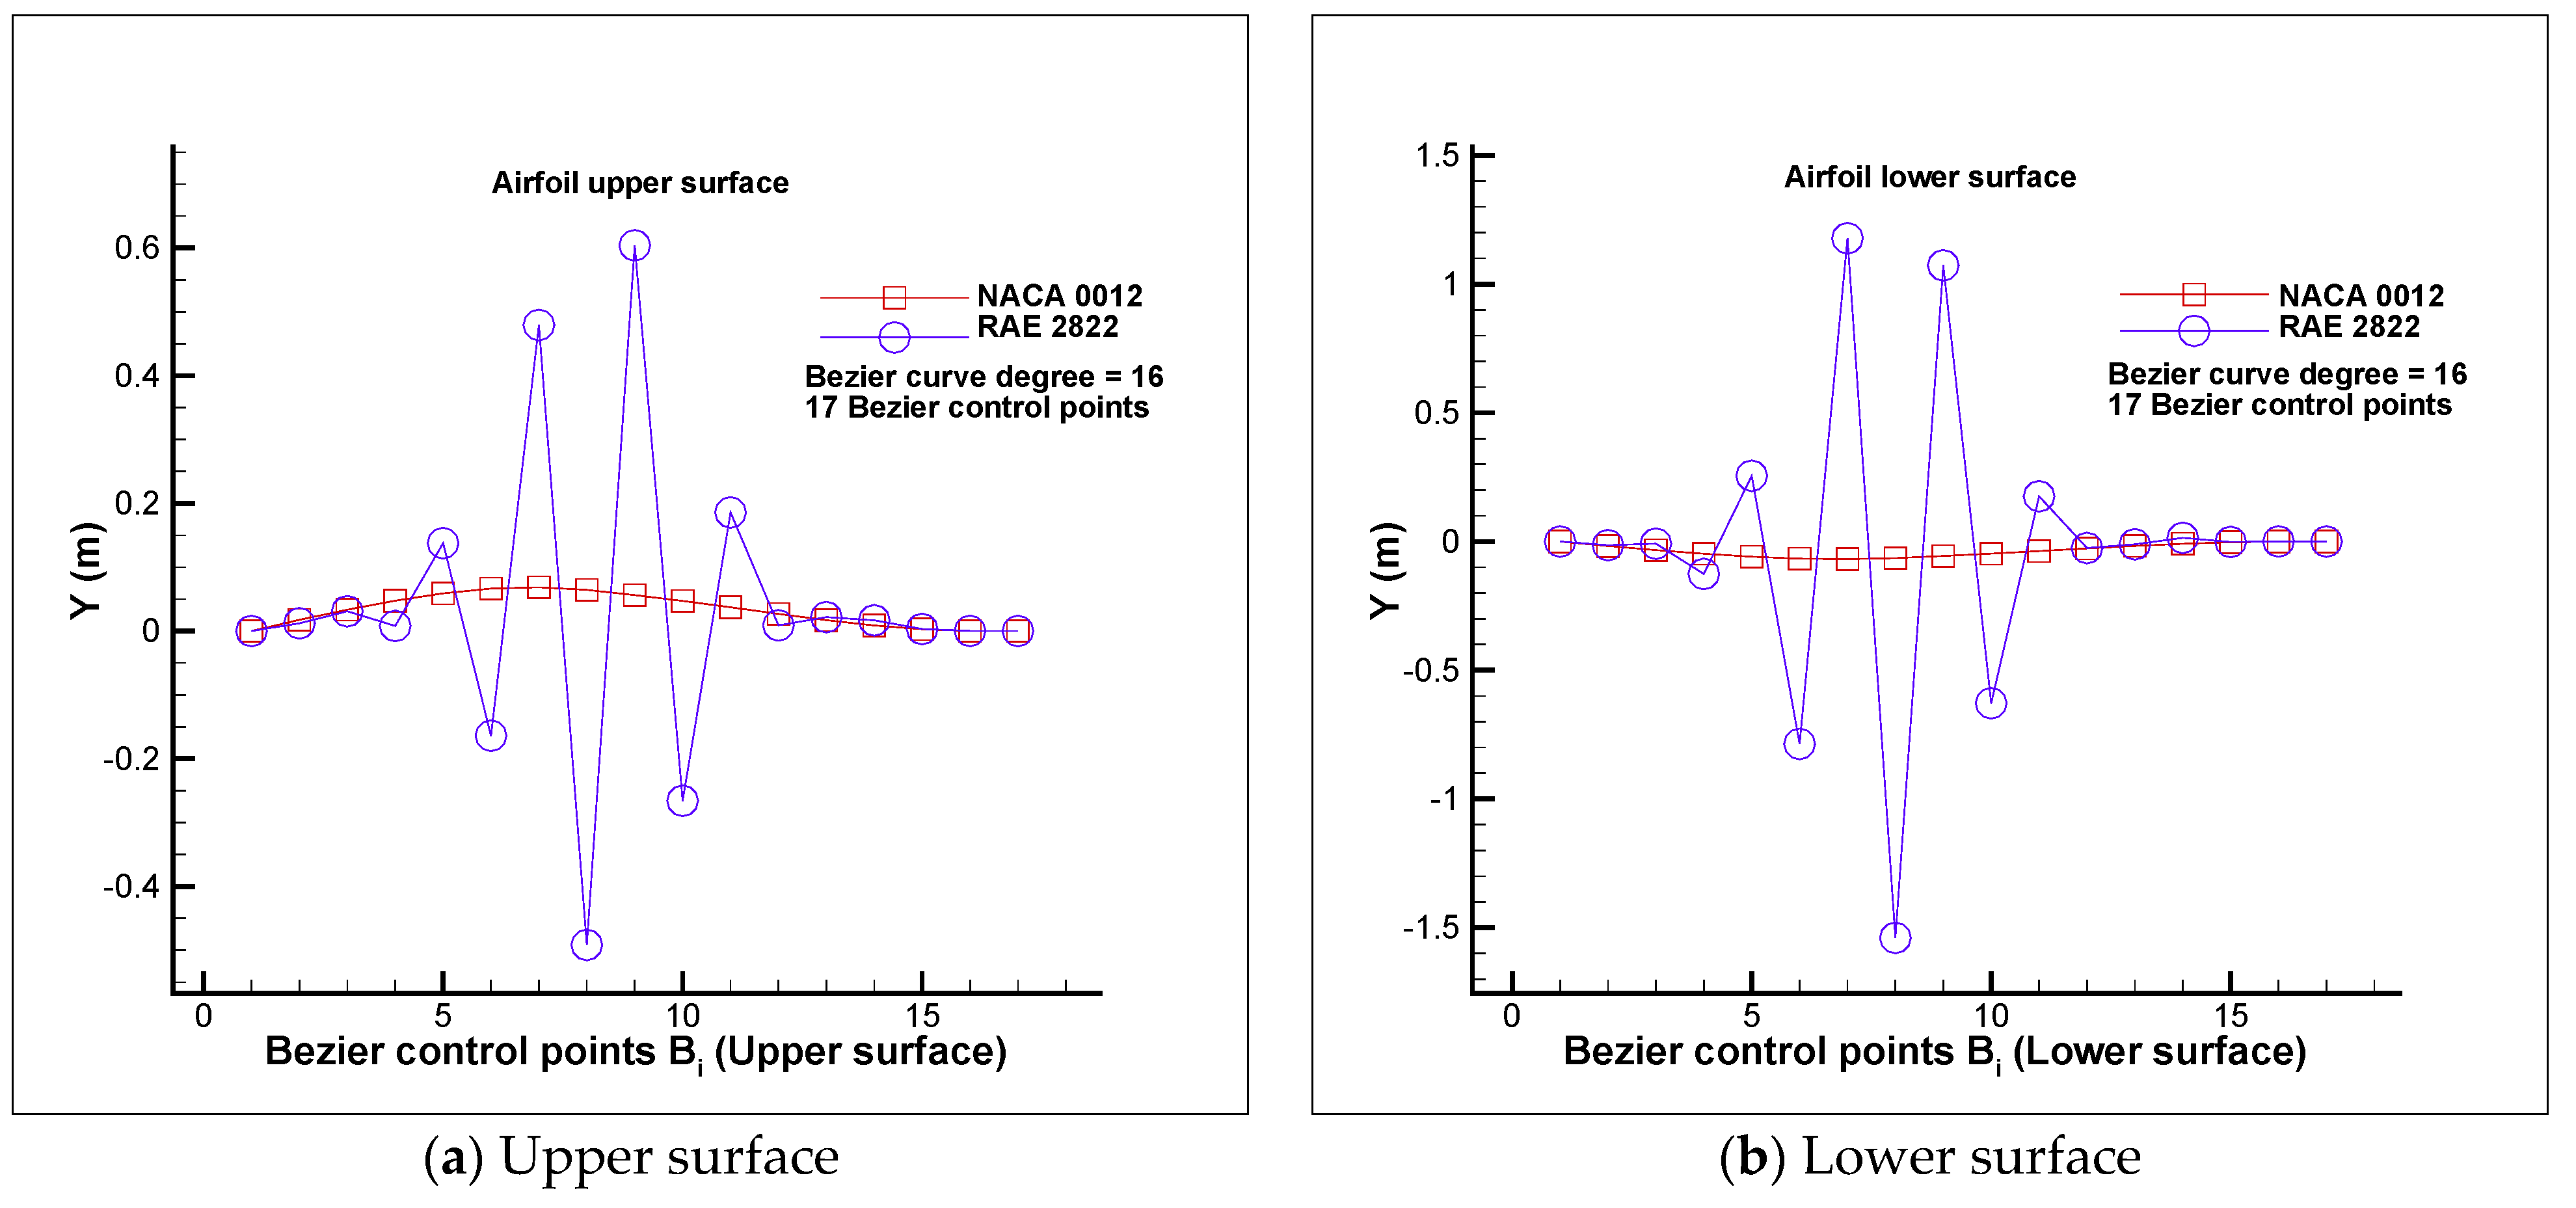
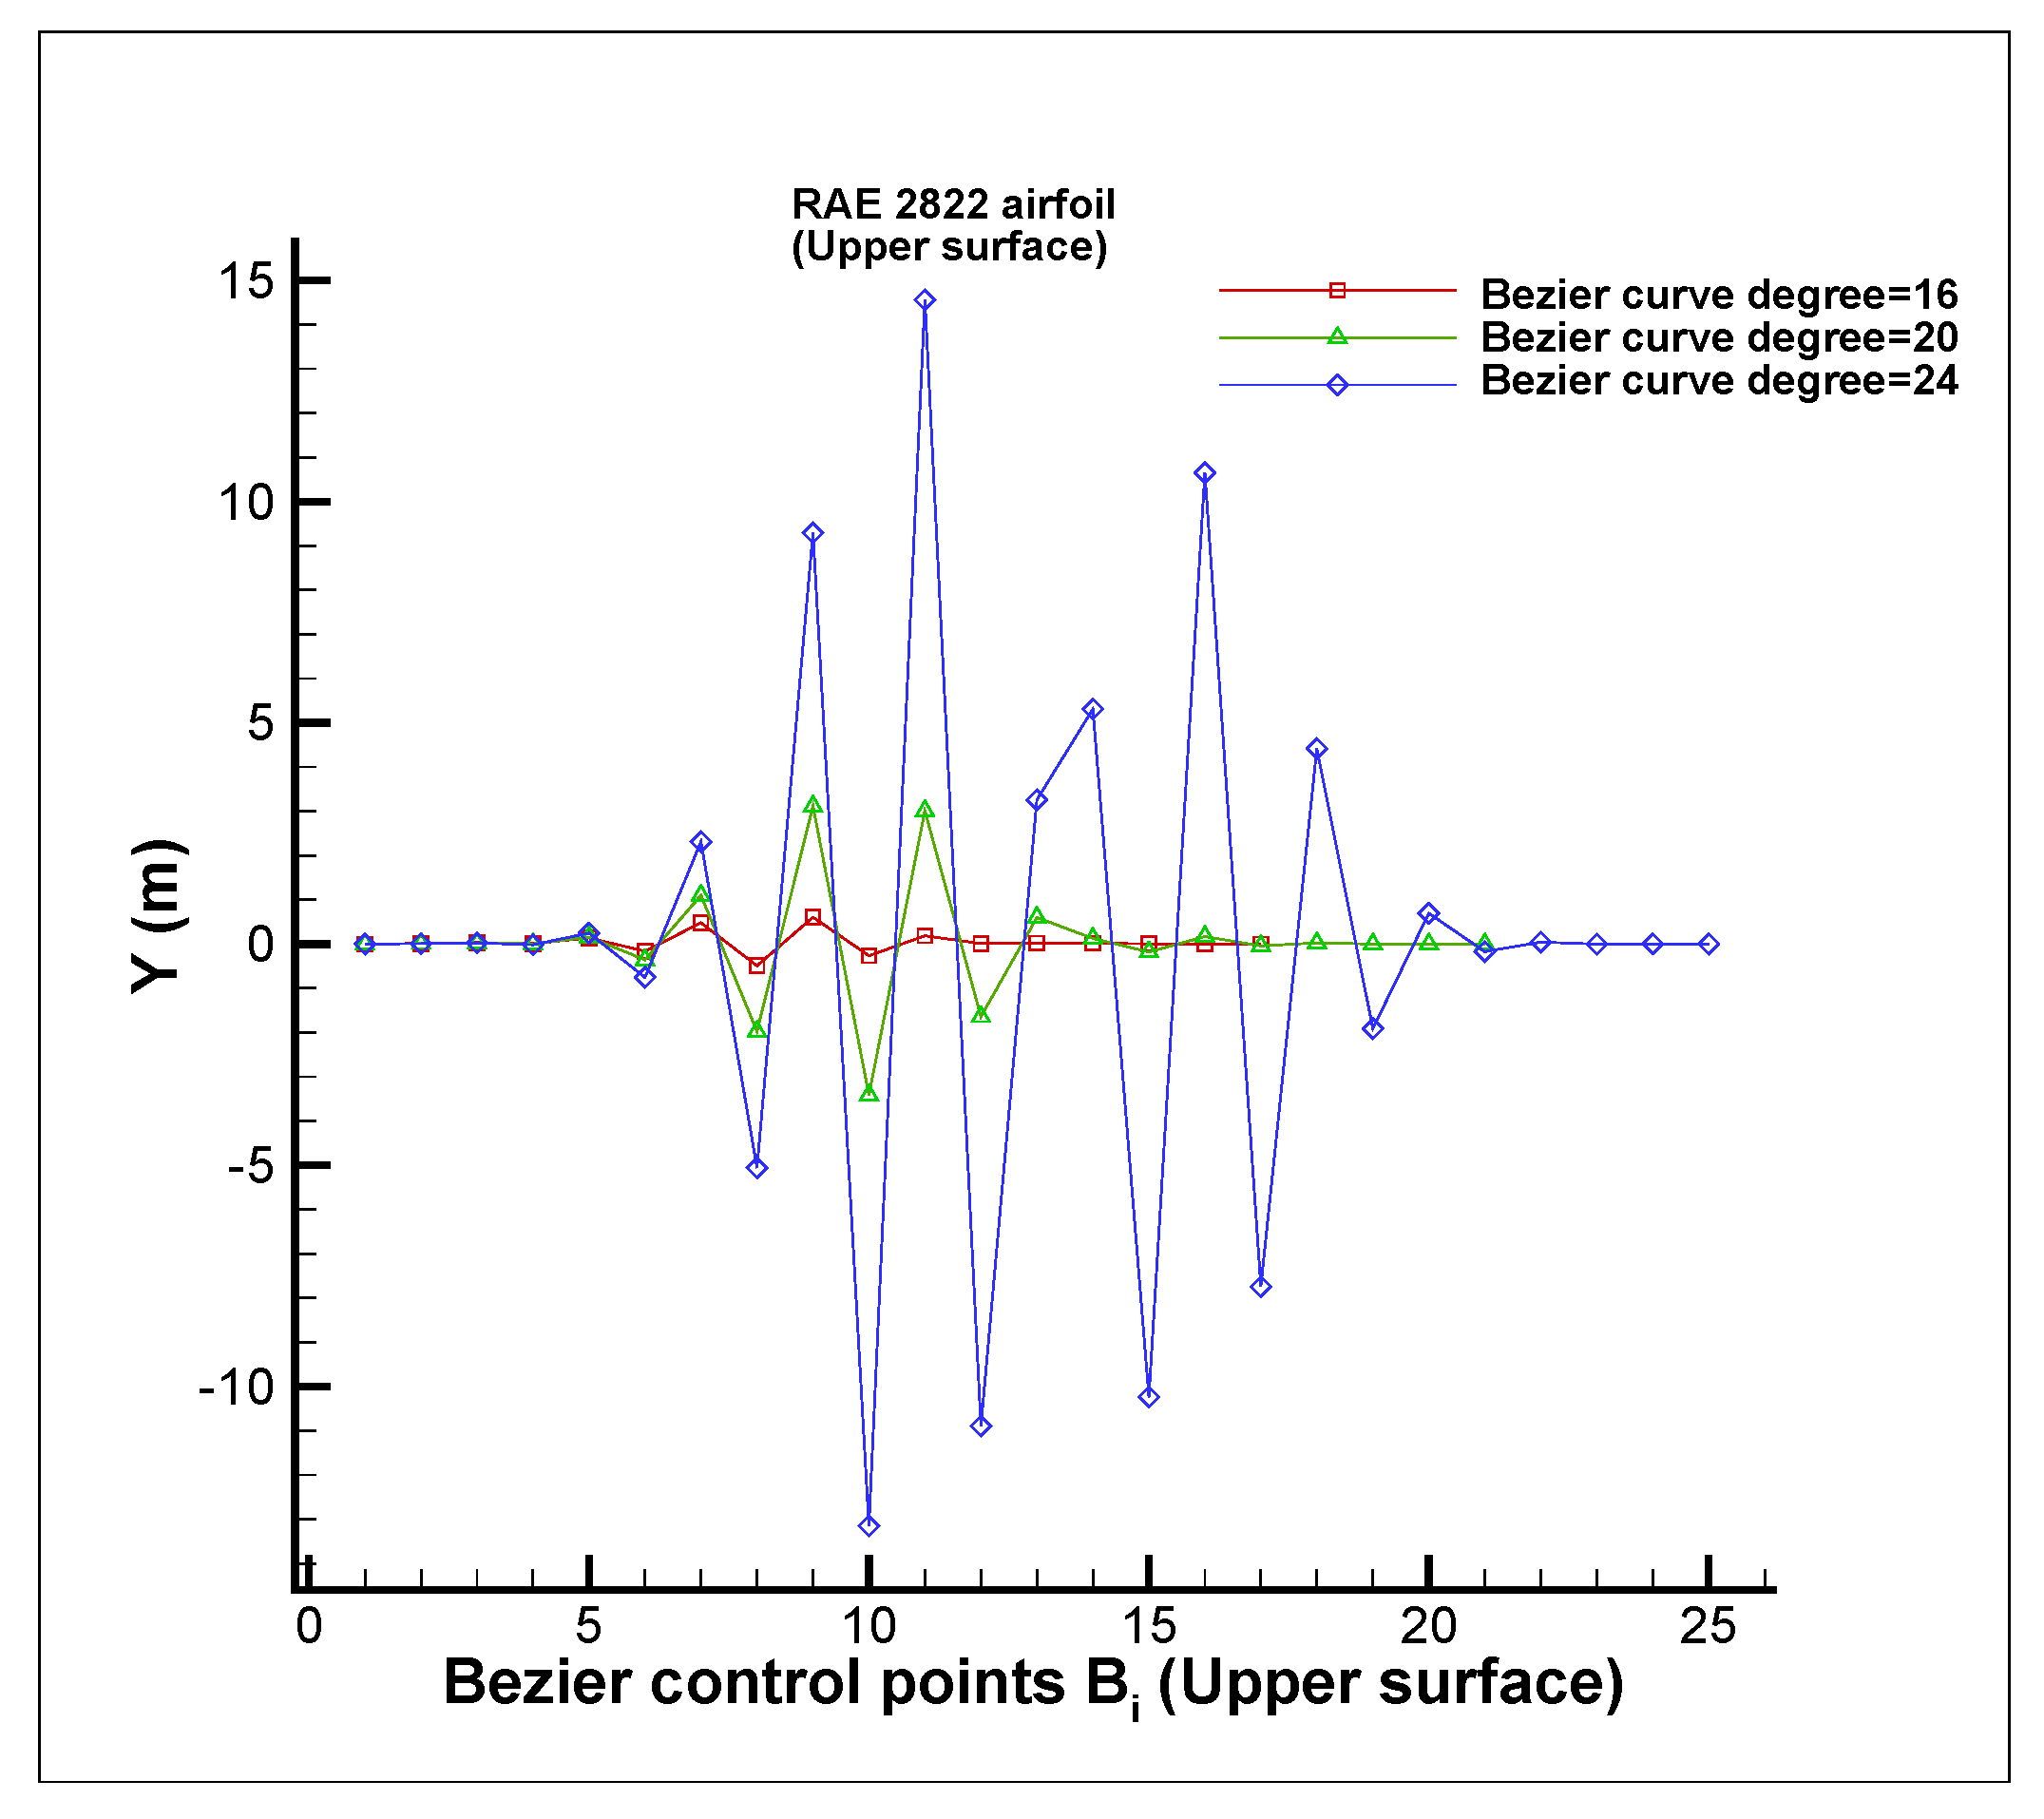
Disadvantage: Control points (design variables) with widely varying orders of magnitude may be obtained (problem of poor scaling [13]). It is somewhat the case for the parameterization of the RAE 2822 airfoil using the Bezier curve. A comparison of the Bezier control points for the parameterization of the NACA 0012 and RAE 2822 airfoils by a Bezier curve of degree 16 using 65 points on each surface (upper and lower ones) is shown in Figure 2. Since any point on a Bezier curve is affected by the values of all control points, any change in one control point is felt throughout the entire curve (an inability to produce a local change within a curve). It can be concluded that when dealing with the RAE 2822 airfoil, the effect of the changes to the control points on the variation of the objective function is widely varying, which may result in unphysical airfoil shapes. Moreover, increasing the Bezier curve degree increases the variations of the control points for the RAE 2822 airfoil and makes the scaling issue more severe (Figure 3).
Although the scaling of the design variables is a way to alleviate the problem of the poor scaling of the design variables, in this work, the design variables were not scaled. Instead, the exact step length value β exact was modified and only a fraction of it was considered. In doing so, the variations of the design variables were limited and a realistic airfoil shape was obtained at each iteration. For two test cases of interest in this study, we considered some approximate values for the step length modification as follows:
For Test case I: M = 0.729 , α = 2.31 °
β = 0.02 β exact
For Test case II: M = 0.734 , α = 2.79 °
β = 0.1 β exact
It should be noted that the modifications values of 0.02 and 0.1 given by Equations (5) and (6) were applied for all iterations and there was no need to change them in every single iteration. Moreover, these modification values depended on the shape of the airfoil used in the study. If, for example, a NACA 0012 airfoil was used, the scaling problem was less severe and larger values of the modification (close to one) could be used.

3.2. Optimization Method

In this study, the unconstrained nonlinear minimization problem was solved by a quasi-Newton method (BFGS) which is a gradient-based optimization approach. The algorithm and the details of this optimization method used in this study are explained in [1]. The objective function considered in this study is defined as:
J = ( D L ) 2
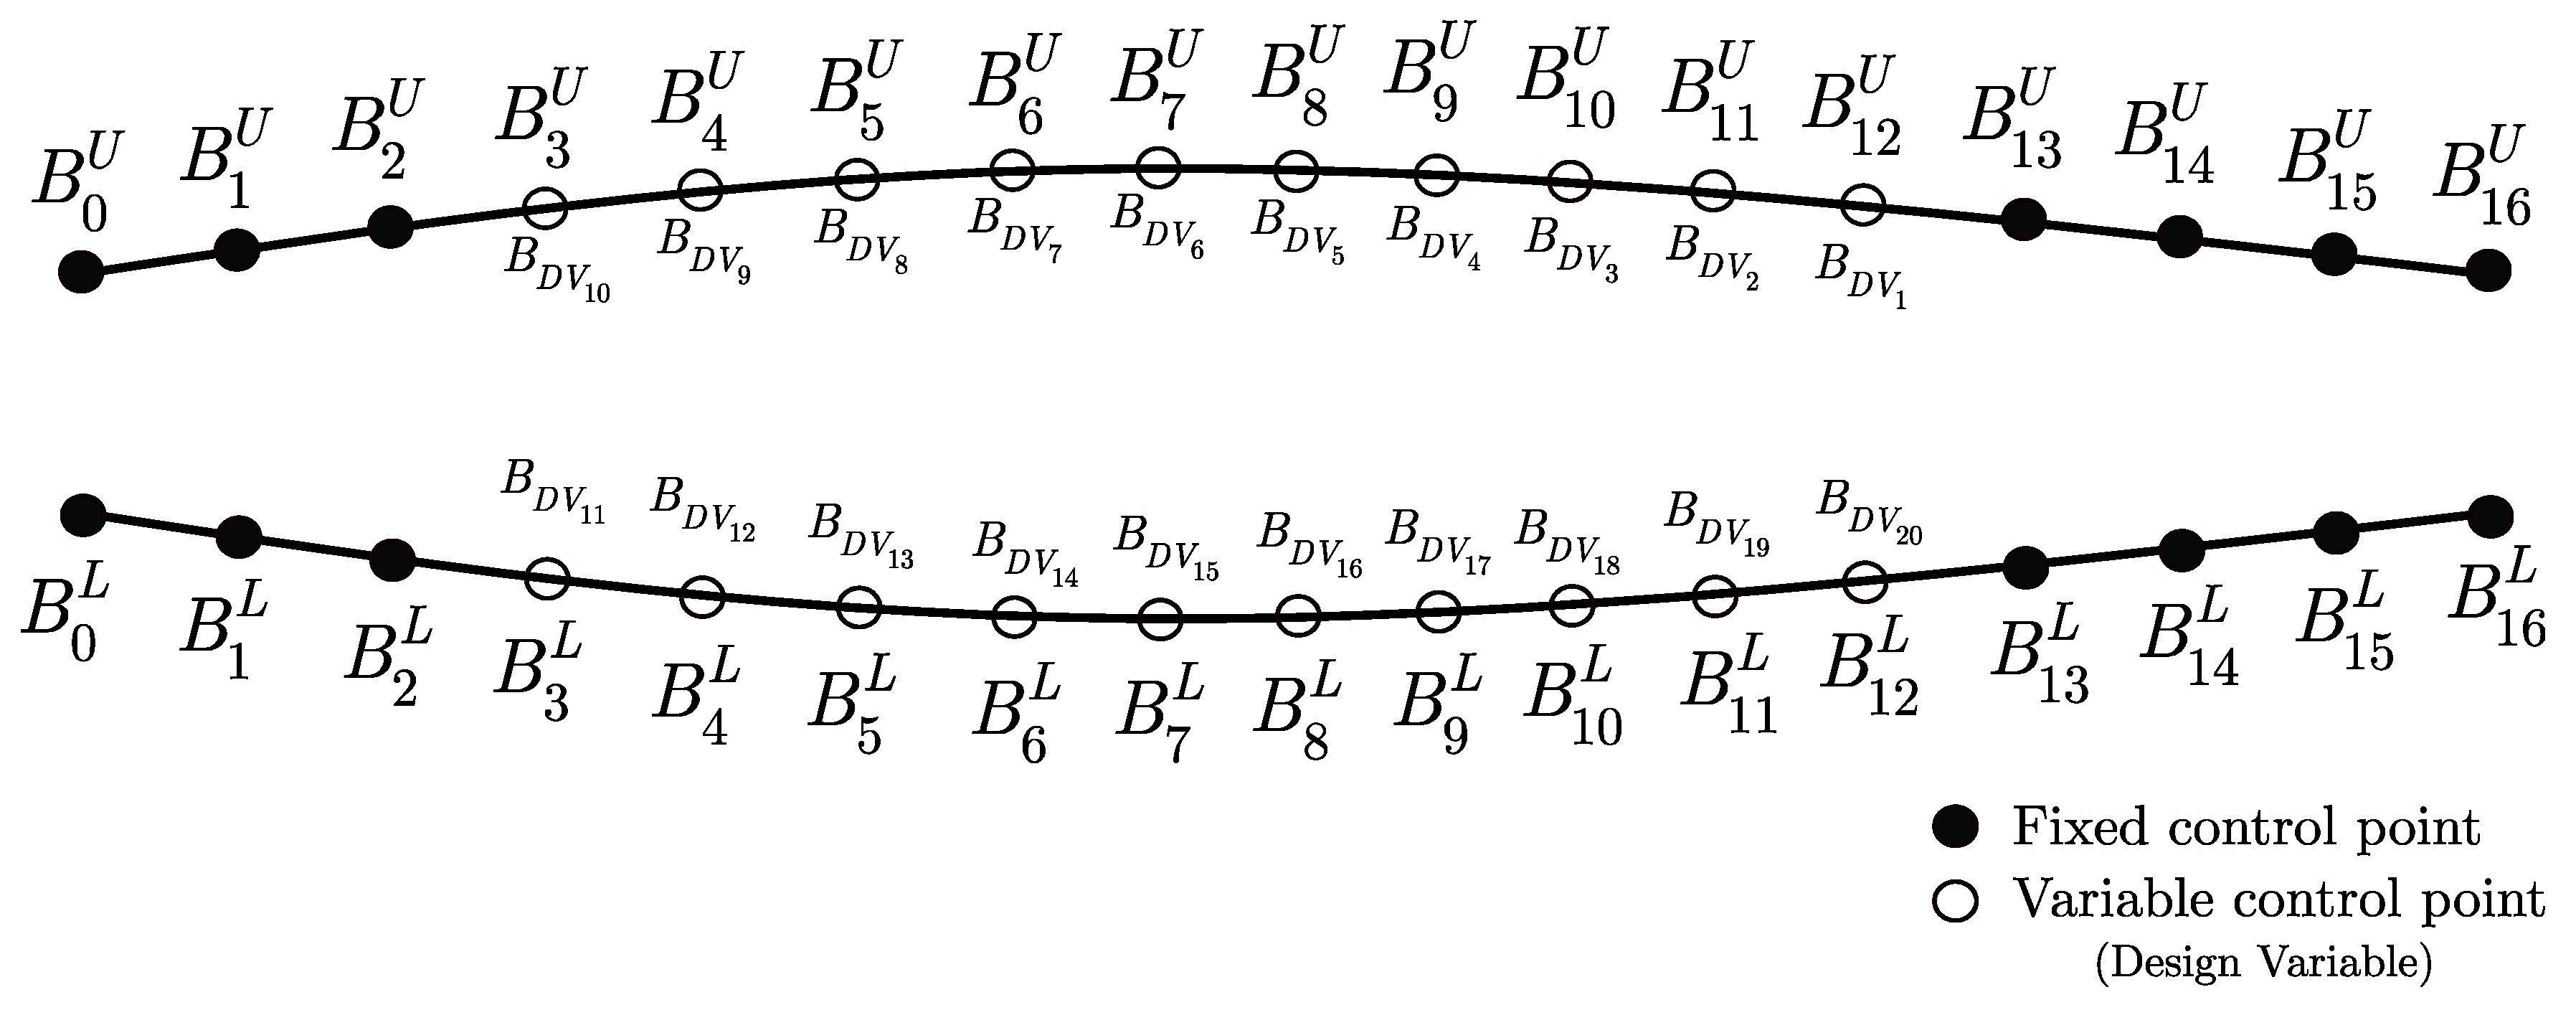
where D and L are the drag and the lift, respectively. The angle of attack α is considered constant during minimization of the objective function J . Some Bezier control points were considered as the design variables. On either of the upper and lower surfaces of the parameterized airfoil, three control points at the leading edge and four control points at the trailing edge were fixed to obtain a sharp trailing edge and a round leading edge. Thus, there were 2 × 10 = 20 design variables for each test case which were denoted by B D V i ( i = 1 , , 20 ) (Figure 4). As shown by the optimization results, such a high number of fixed control points did not restrict the effectiveness of the optimization process.
The derivation of the objective function J with respect to the design variables B D V i is:
J B D V i = 2 ( D L ) B D V i ( D L ) = 2 ( D L ) D B D V i L L B D V i D L 2 = 2 ( D L 3 ) ( D B D V i L L B D V i D )
where the terms D B D V i and L B D V i are calculated using the central finite-difference method as follows:
D B D V i = D ( B D V i + ε B D V i ) D ( B D V i ε B D V i ) 2 ε B D V i
L B D V i = L ( B D V i + ε B D V i ) L ( B D V i ε B D V i ) 2 ε B D V i
where ε = 0.01 .
The total drag D is the sum of the drag due to pressure D p and the drag due to skin friction D f .
D = D p + D f
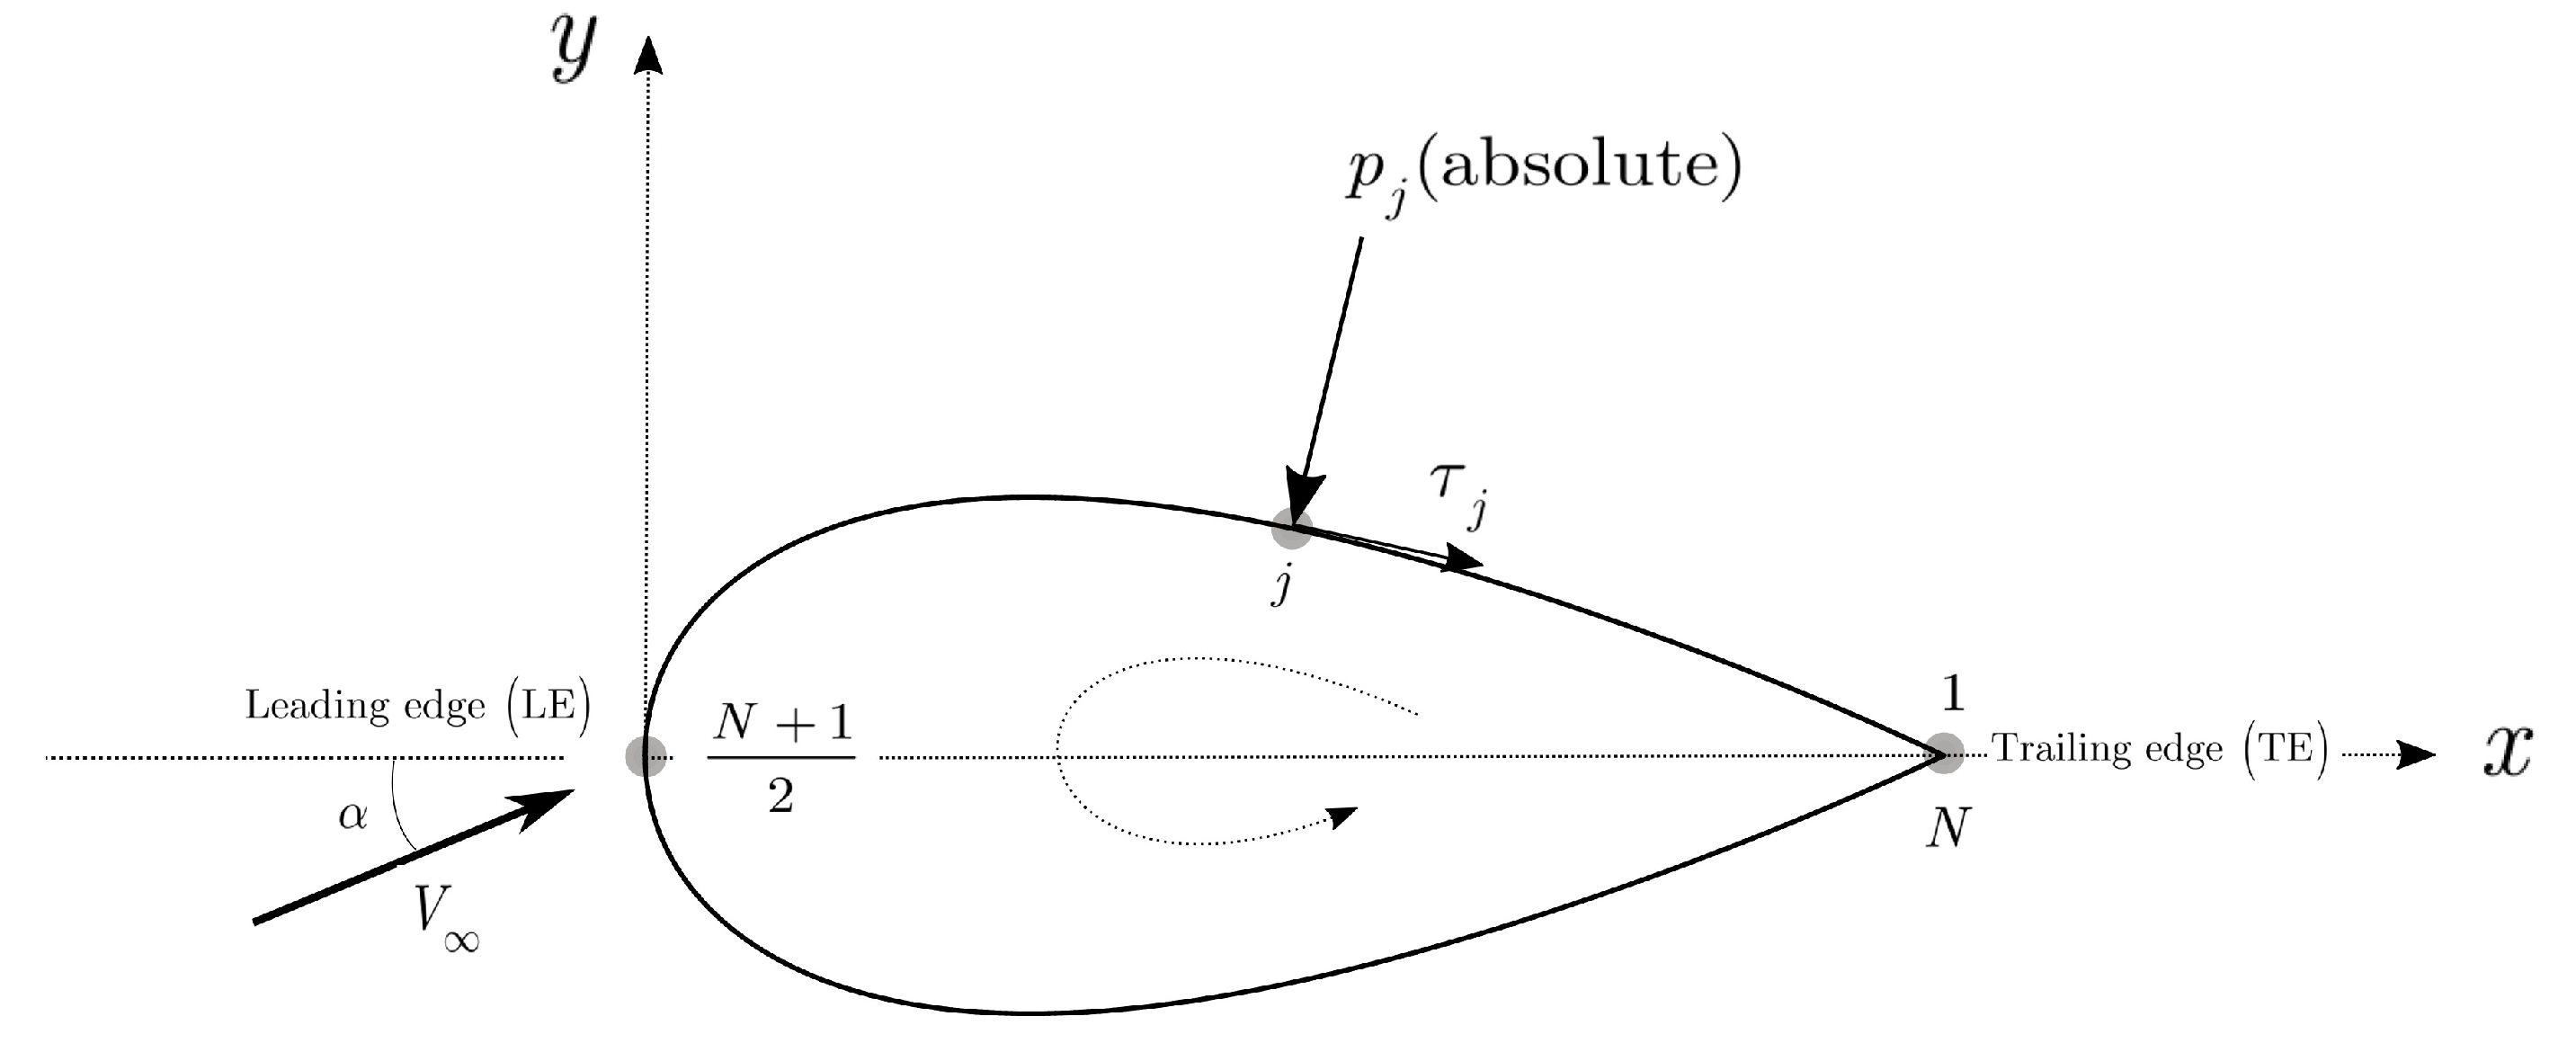
where D p and D f are given as (Figure 5).
D p = A p cos α + N p sin α = j = 1 N 1 ( p j ( y j y j + 1 ) cos α + p j ( x j + 1 x j ) sin α )
D f = A f cos α + N f sin α =
( j = 1 N + 1 2 τ j ( x j x j + 1 ) + j = N + 1 2 + 1 N 1 τ j ( x j + 1 x j ) ) cos α + ( j = 1 N + 1 2 τ j ( y j y j + 1 ) + j = N + 1 2 + 1 N 1 τ j ( y j + 1 y j ) ) sin α
In aerodynamic shape optimization, the x coordinates of airfoil nodes are usually considered fixed during the optimization and only the y coordinates of airfoil nodes are optimized. Therefore, the terms N p and A f , which are functions of x coordinates, are considered constants. Thus, from Equation (11), we have:
D = j = 1 N 1 ( p j ( y j y j + 1 ) cos α ) + N p sin α + A f cos α + ( j = 1 N + 1 2 τ j ( y j y j + 1 ) + j = N + 1 2 + 1 N 1 τ j ( y j + 1 y j ) ) N f sin α
The term N f sin α is very small compared to the other terms and can be ignored (both the normal force due to the wall shear stress τ j , N f , and sin α have small magnitude). Thus:
D = j = 1 N 1 ( p j ( y j y j + 1 ) cos α ) + N p sin α + A f cos α
The total lift L is the sum of the lift due to pressure L p and the lift due to skin friction L f :
L = L p + L f
L p = A p sin α + N p cos α = j = 1 N 1 ( p j ( y j y j + 1 ) sin α + p j ( x j + 1 x j ) cos α )
L f = A f sin α + N f cos α =
( j = 1 N + 1 2 τ j ( x j x j + 1 ) + j = N + 1 2 + 1 N 1 τ j ( x j + 1 x j ) ) sin α + ( j = 1 N + 1 2 τ j ( y j y j + 1 ) + j = N + 1 2 + 1 N 1 τ j ( y j + 1 y j ) ) cos α

3.3. Exact Step Length

Following an argument given in Equations (23)–(25) in [1], it can be concluded that for the minimization of the defined objective function, J = ( D L ) 2 , an expression for the exact step length can be derived as follows:
J β = 2 D L β ( D L ) = 0 D = 0
By following the same procedure in [1], we can derive the following exact step length for viscous flows:
β exact ( k ) = [ i = 1 n 1 j = 2 N + 1 2 1 a i U ( k ) n ! i ! ( n i ) ! t y j i ( 1 t y j ) n i ( p j p j 1 ) + i = 1 n 1 j = N + 1 2 + 1 N 1 a i L ( k ) n ! i ! ( n i ) ! t y j i ( 1 t y j ) n i ( p j p j 1 ) ] cos α + N p sin α + A f cos α [ i = 1 n 1 j = 2 N + 1 2 1 b i U ( k ) n ! i ! ( n i ) ! t y j i ( 1 t y j ) n i ( p j p j 1 ) + i = 1 n 1 j = N + 1 2 + 1 N 1 b i L ( k ) n ! i ! ( n i ) ! t y j i ( 1 t y j ) n i ( p j p j 1 ) ] cos α
where the term A f cos α is added to the numerator of the exact step length expression for the inviscid flows derived in [1].

4. Results

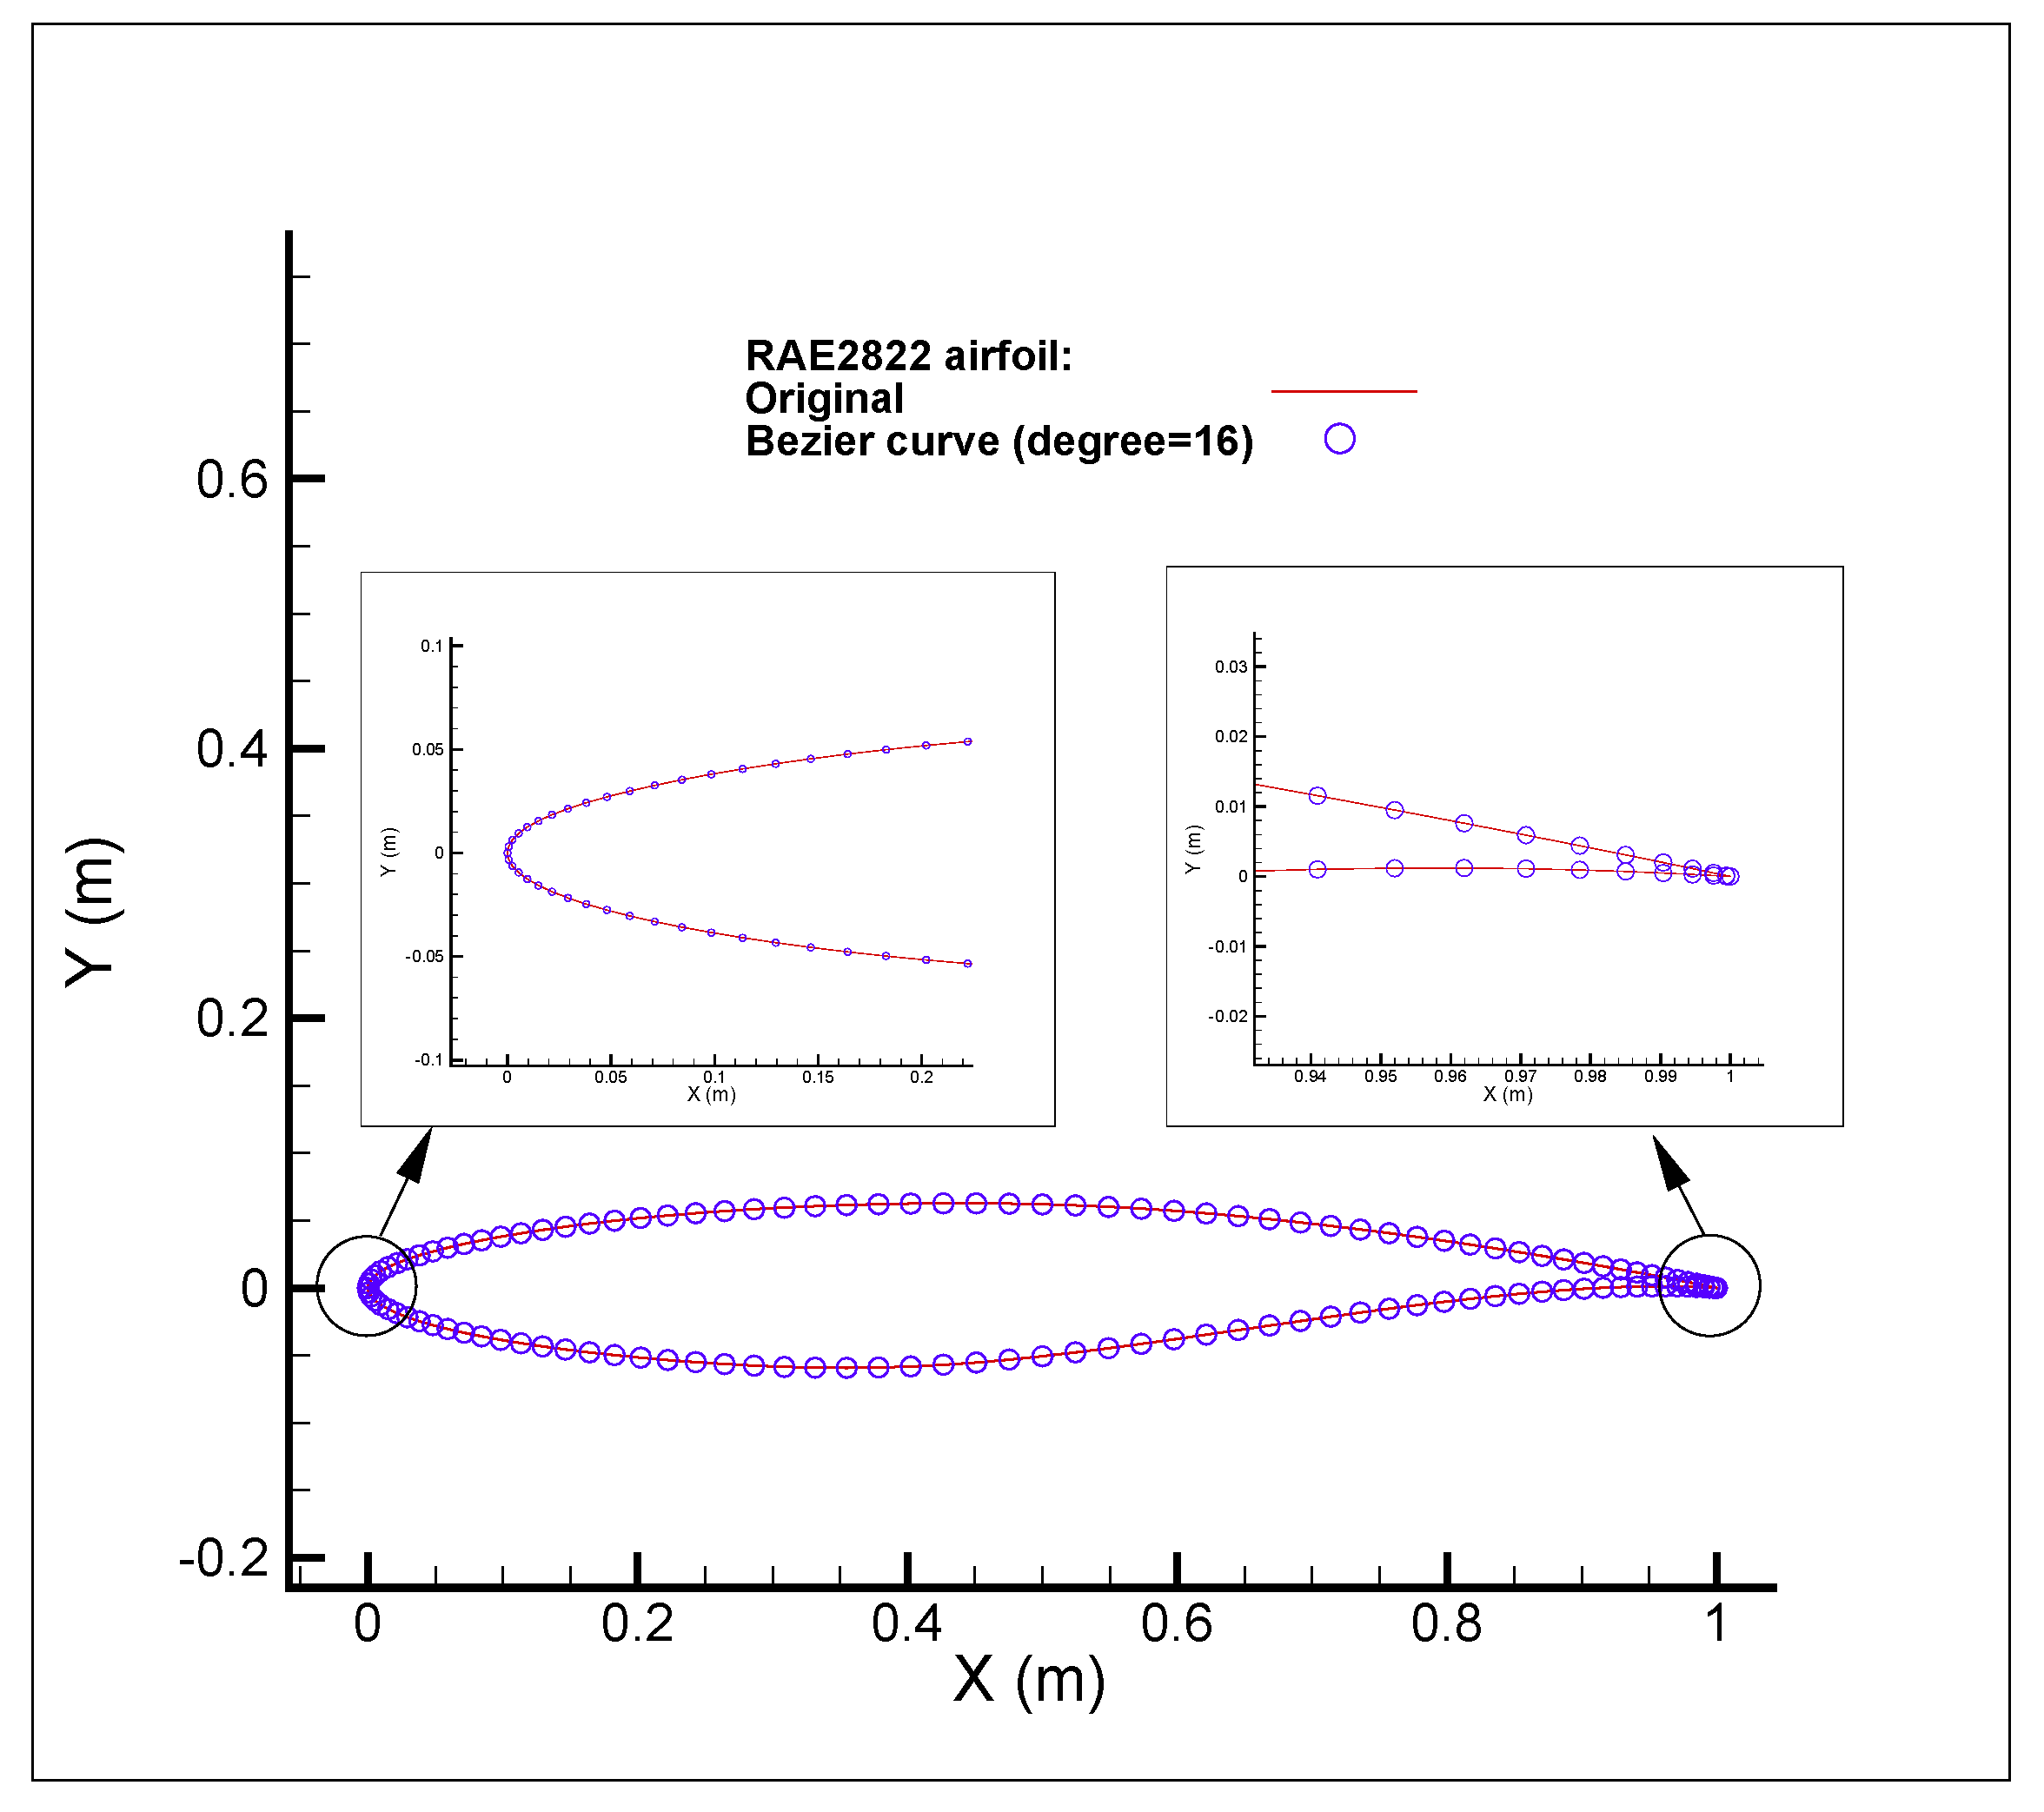
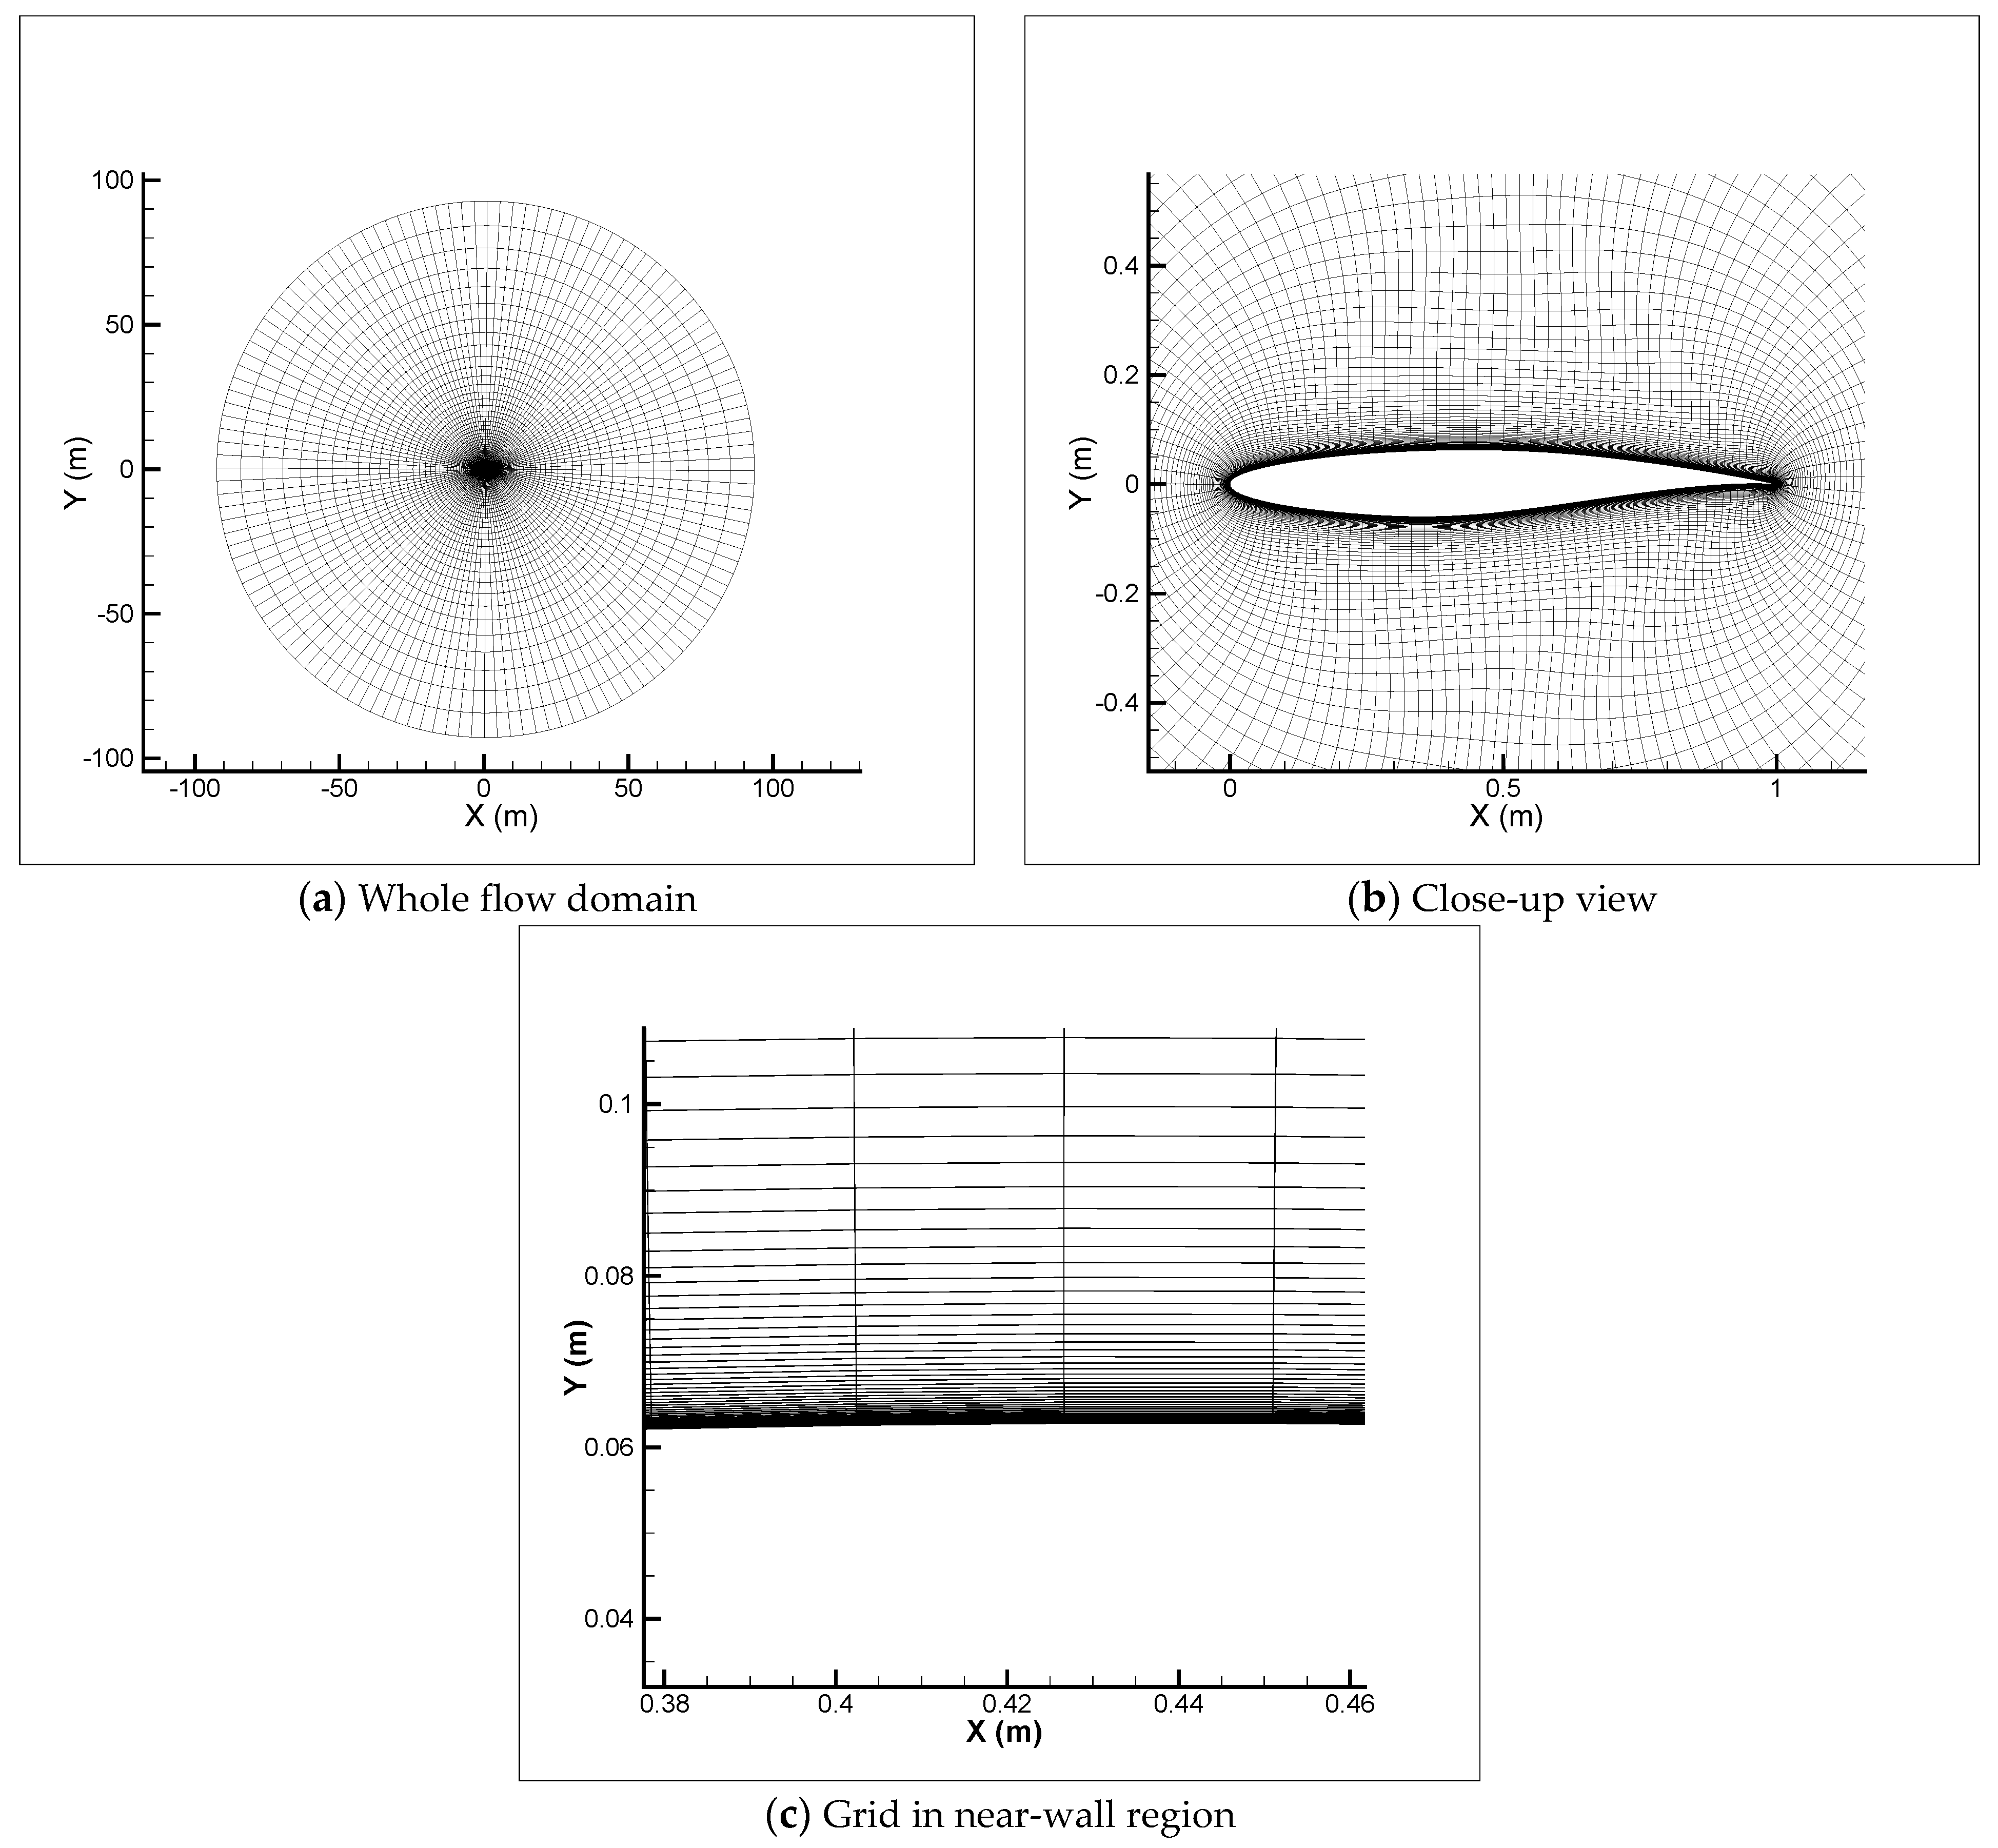
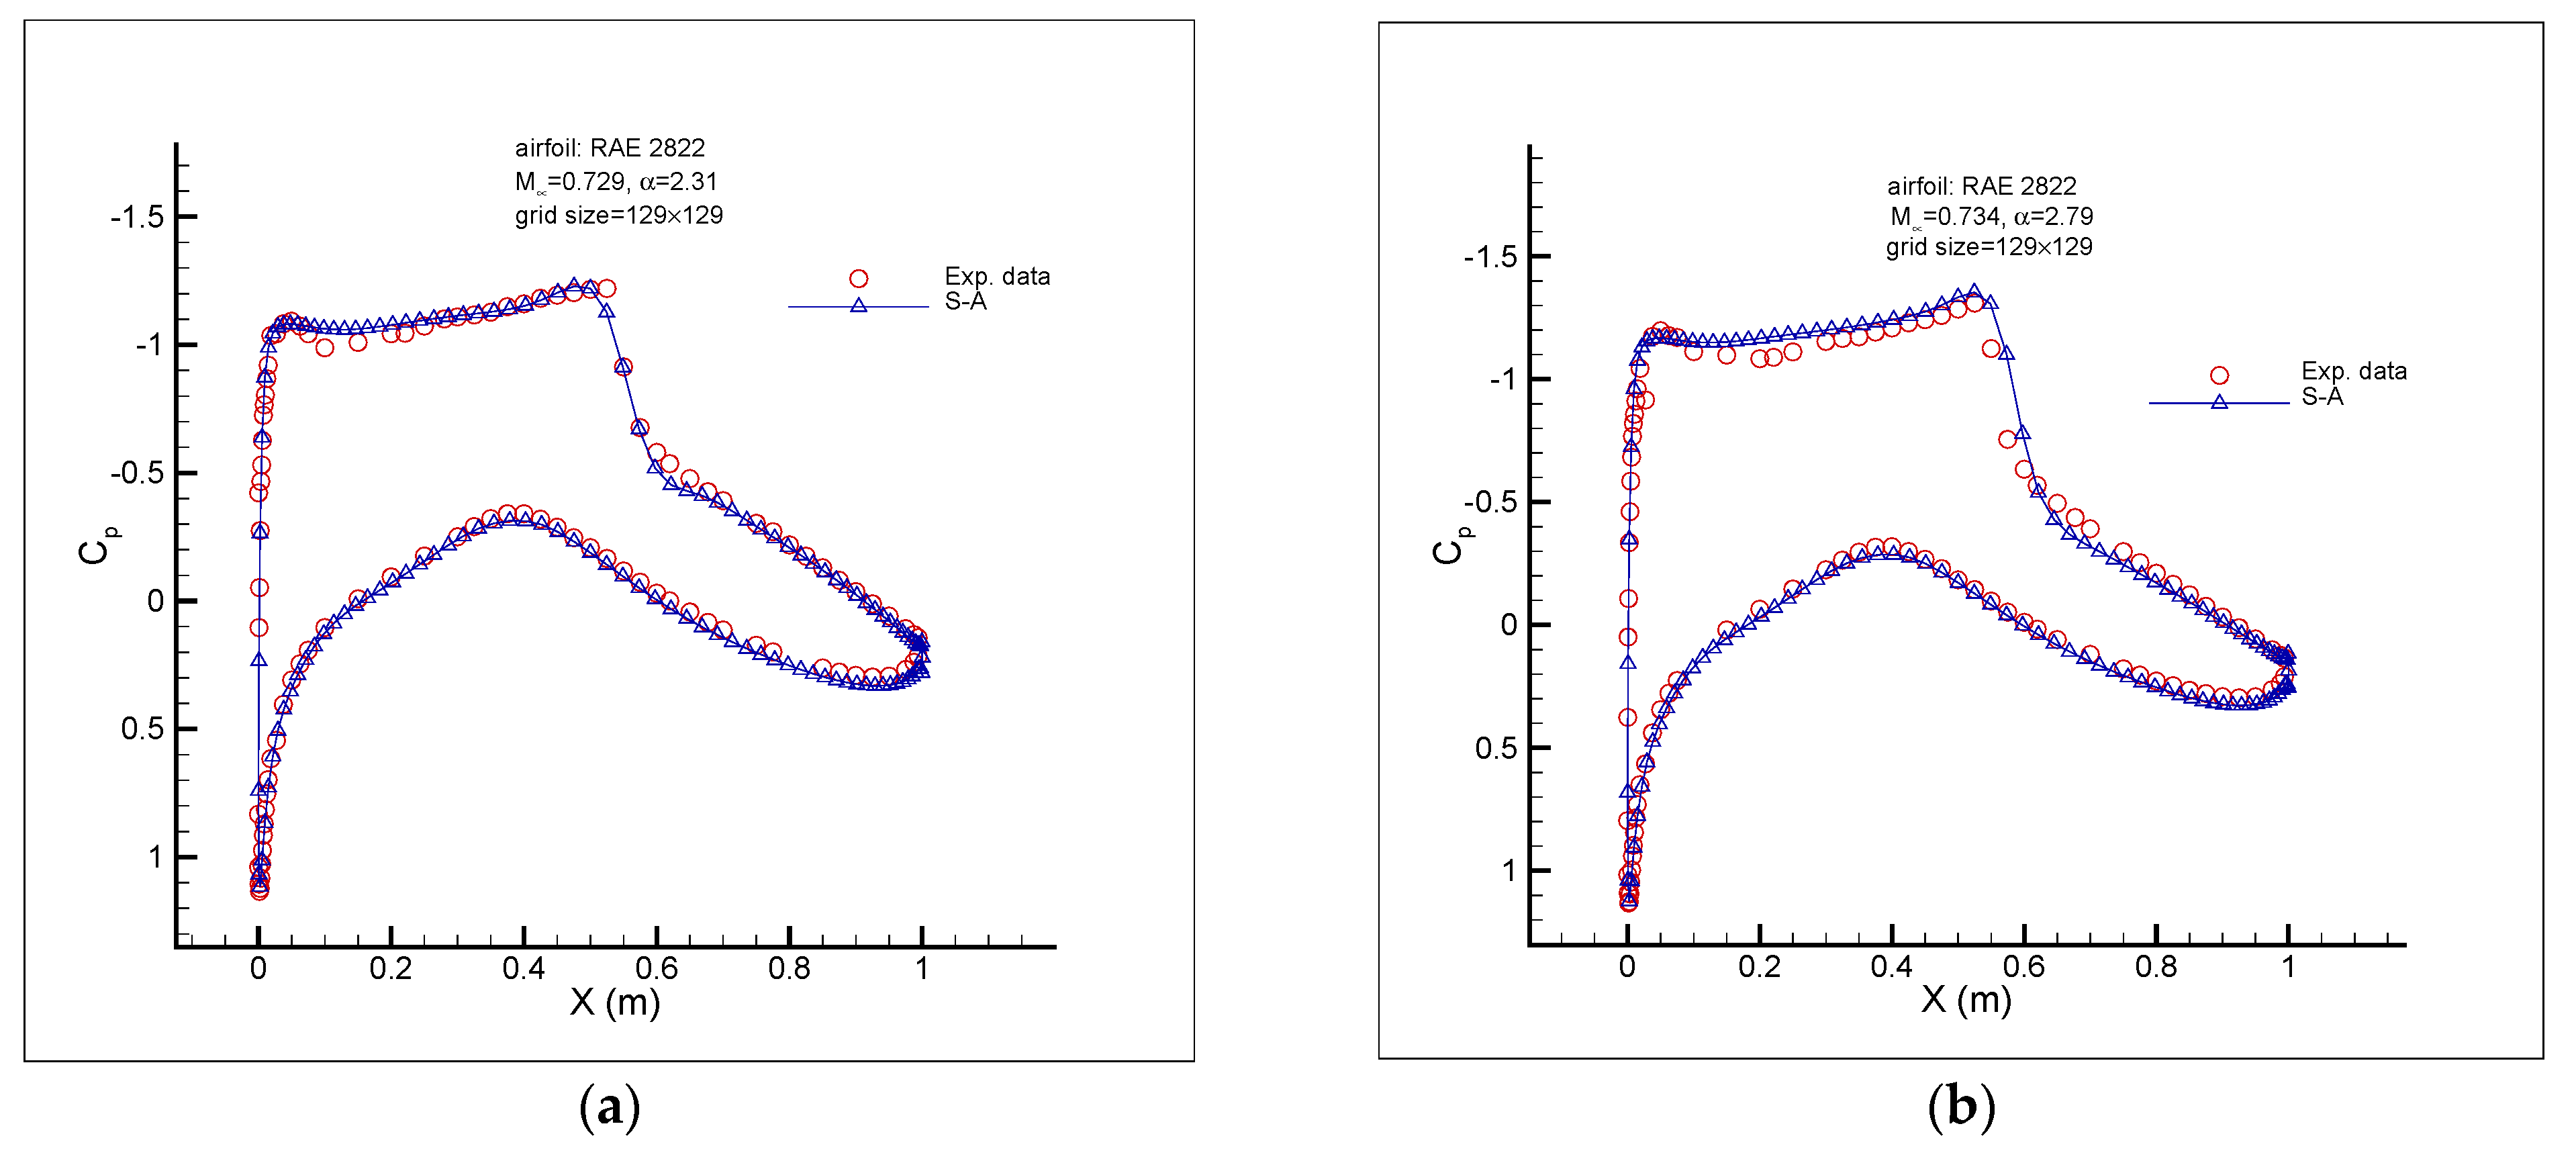
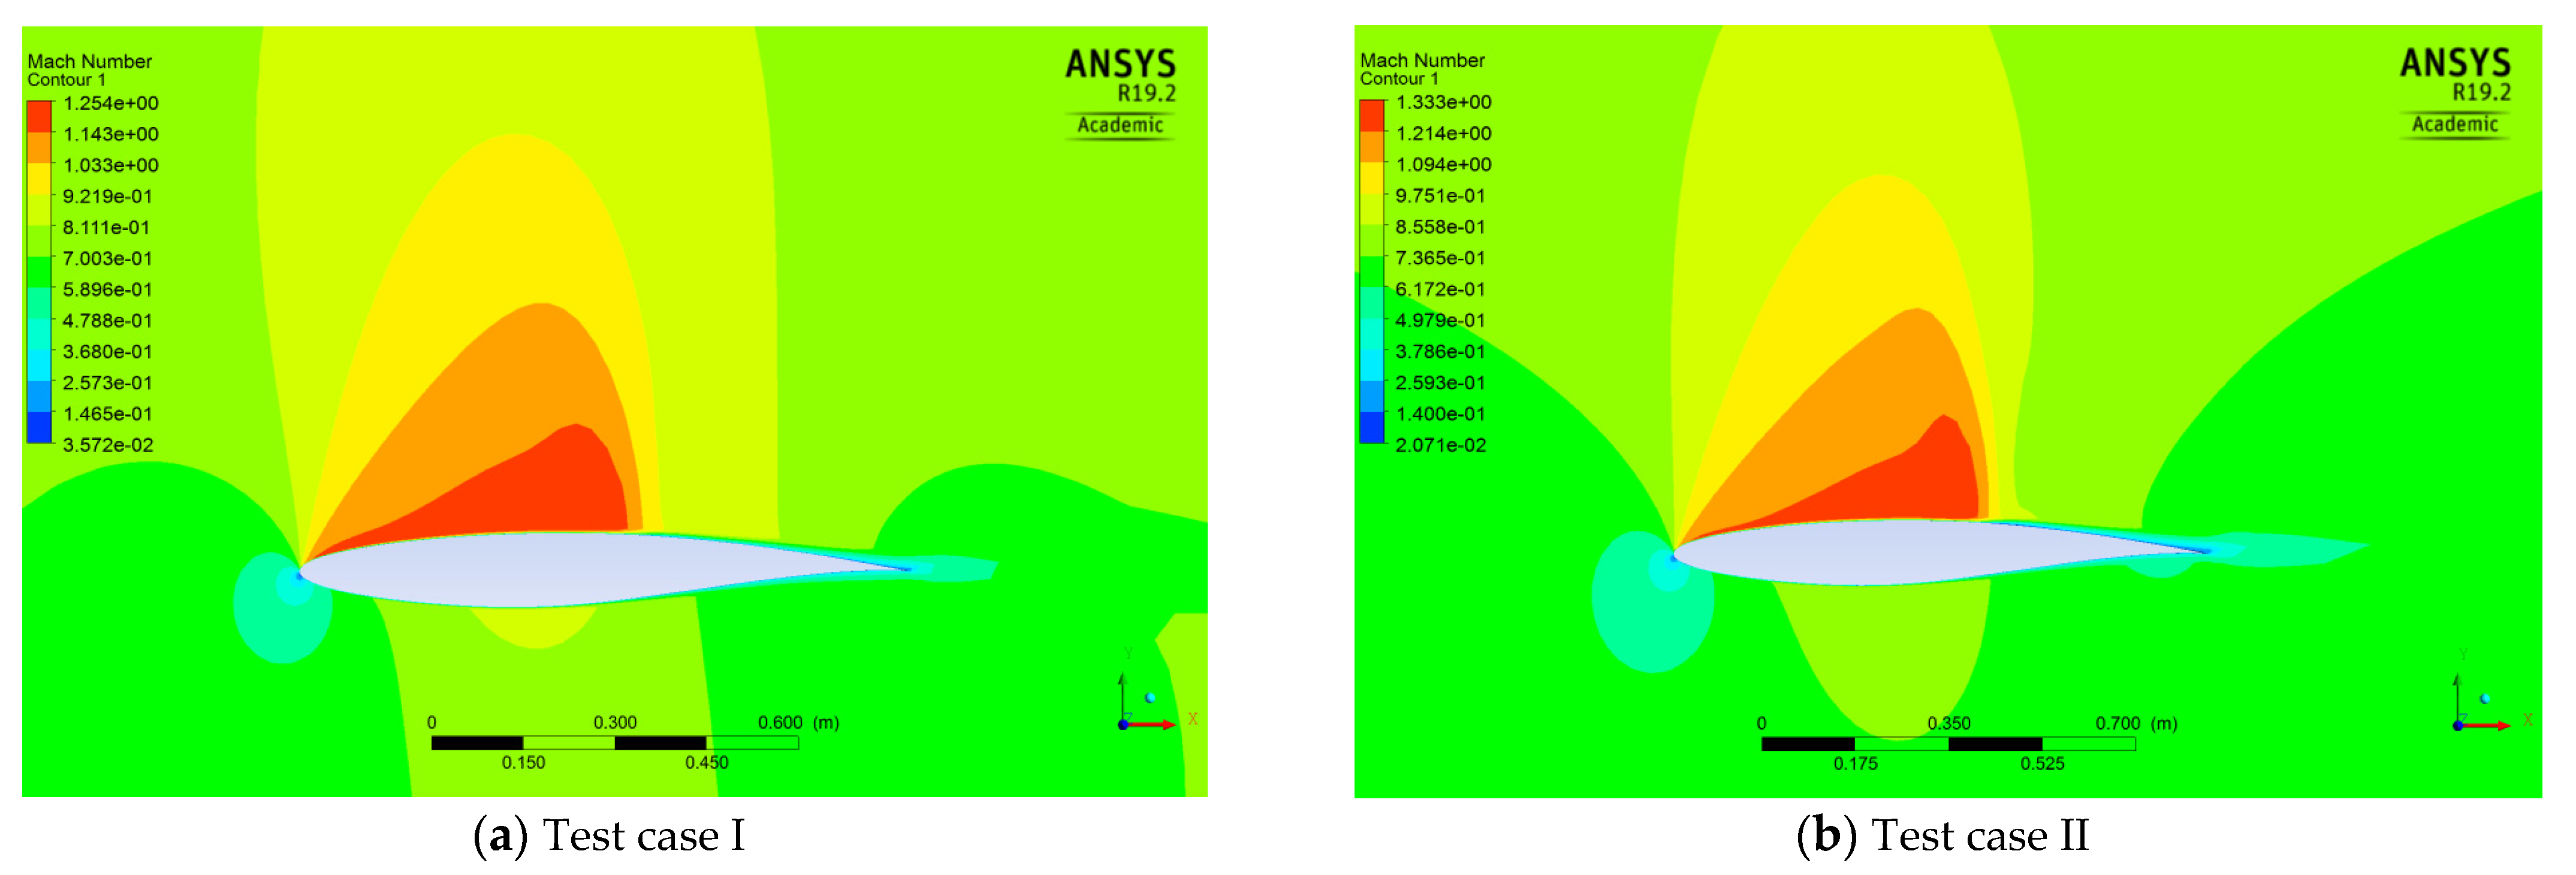
Initially, the numerical solutions of the viscous transonic flow over the RAE 2822 airfoil for the two considered flow conditions obtained by the software ANSYS Fluent were validated by the experimental data in [12]. To do so, the original RAE 2822 airfoil [14] was reconstructed using a Bezier curve of degree 16 to obtain the initial control points (Figure 6). Then a structured hyperbolic grid generation method was used to generate an O-type mesh over the whole flow domain (Figure 7). The grid size was 129 × 129 (129 nodes on the airfoil surface and 129 nodes in the normal direction to the airfoil surface). For both flow conditions, the S-A turbulence model was used and the wall spacing was 5 × 10 5 m ( y + 30 ). In ANSYS Fluent, when using the Spalart–Allmaras turbulence model, y + of the wall-adjacent cells was either very small (on the order of y + = 1 ) or approximately 30 or greater [15]. A summary of the data used in the numerical simulation and the results including the drag D , the lift L , the coefficient of the drag c d , and the coefficient of lift c l for both flow conditions are given in Table 1. The comparisons between the results obtained from the numerical solution (ANSYS Fluent, S-A turbulence model) and the experimental data [12] are shown in Figure 8a (for the first flow condition) and Figure 8b (for the second flow condition). As can be seen, a very good agreement was obtained between the numerical results (using the reconstructed RAE 2822 airfoil) and experimental data for both flow conditions. The Mach number distributions for both test cases are shown in Figure 9.
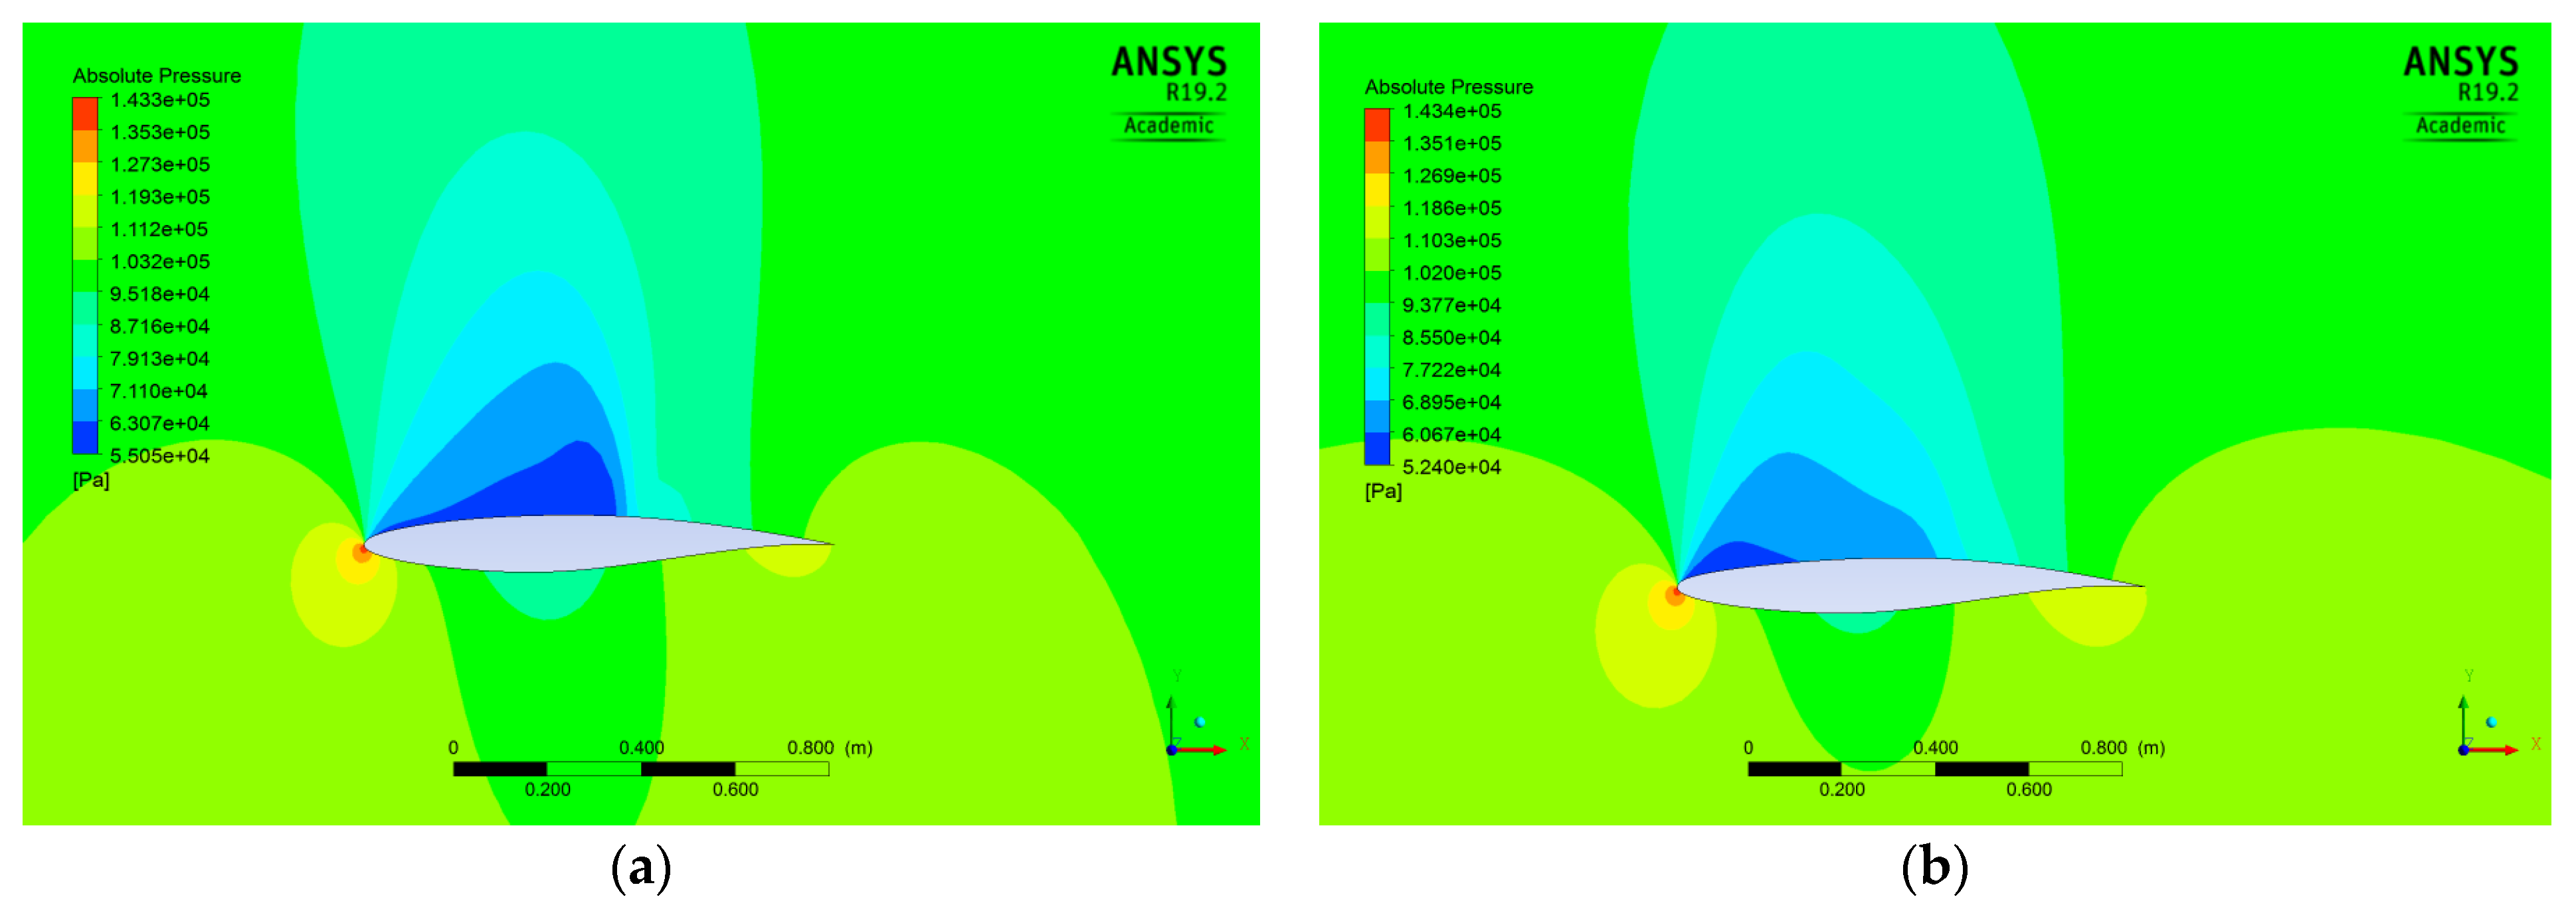
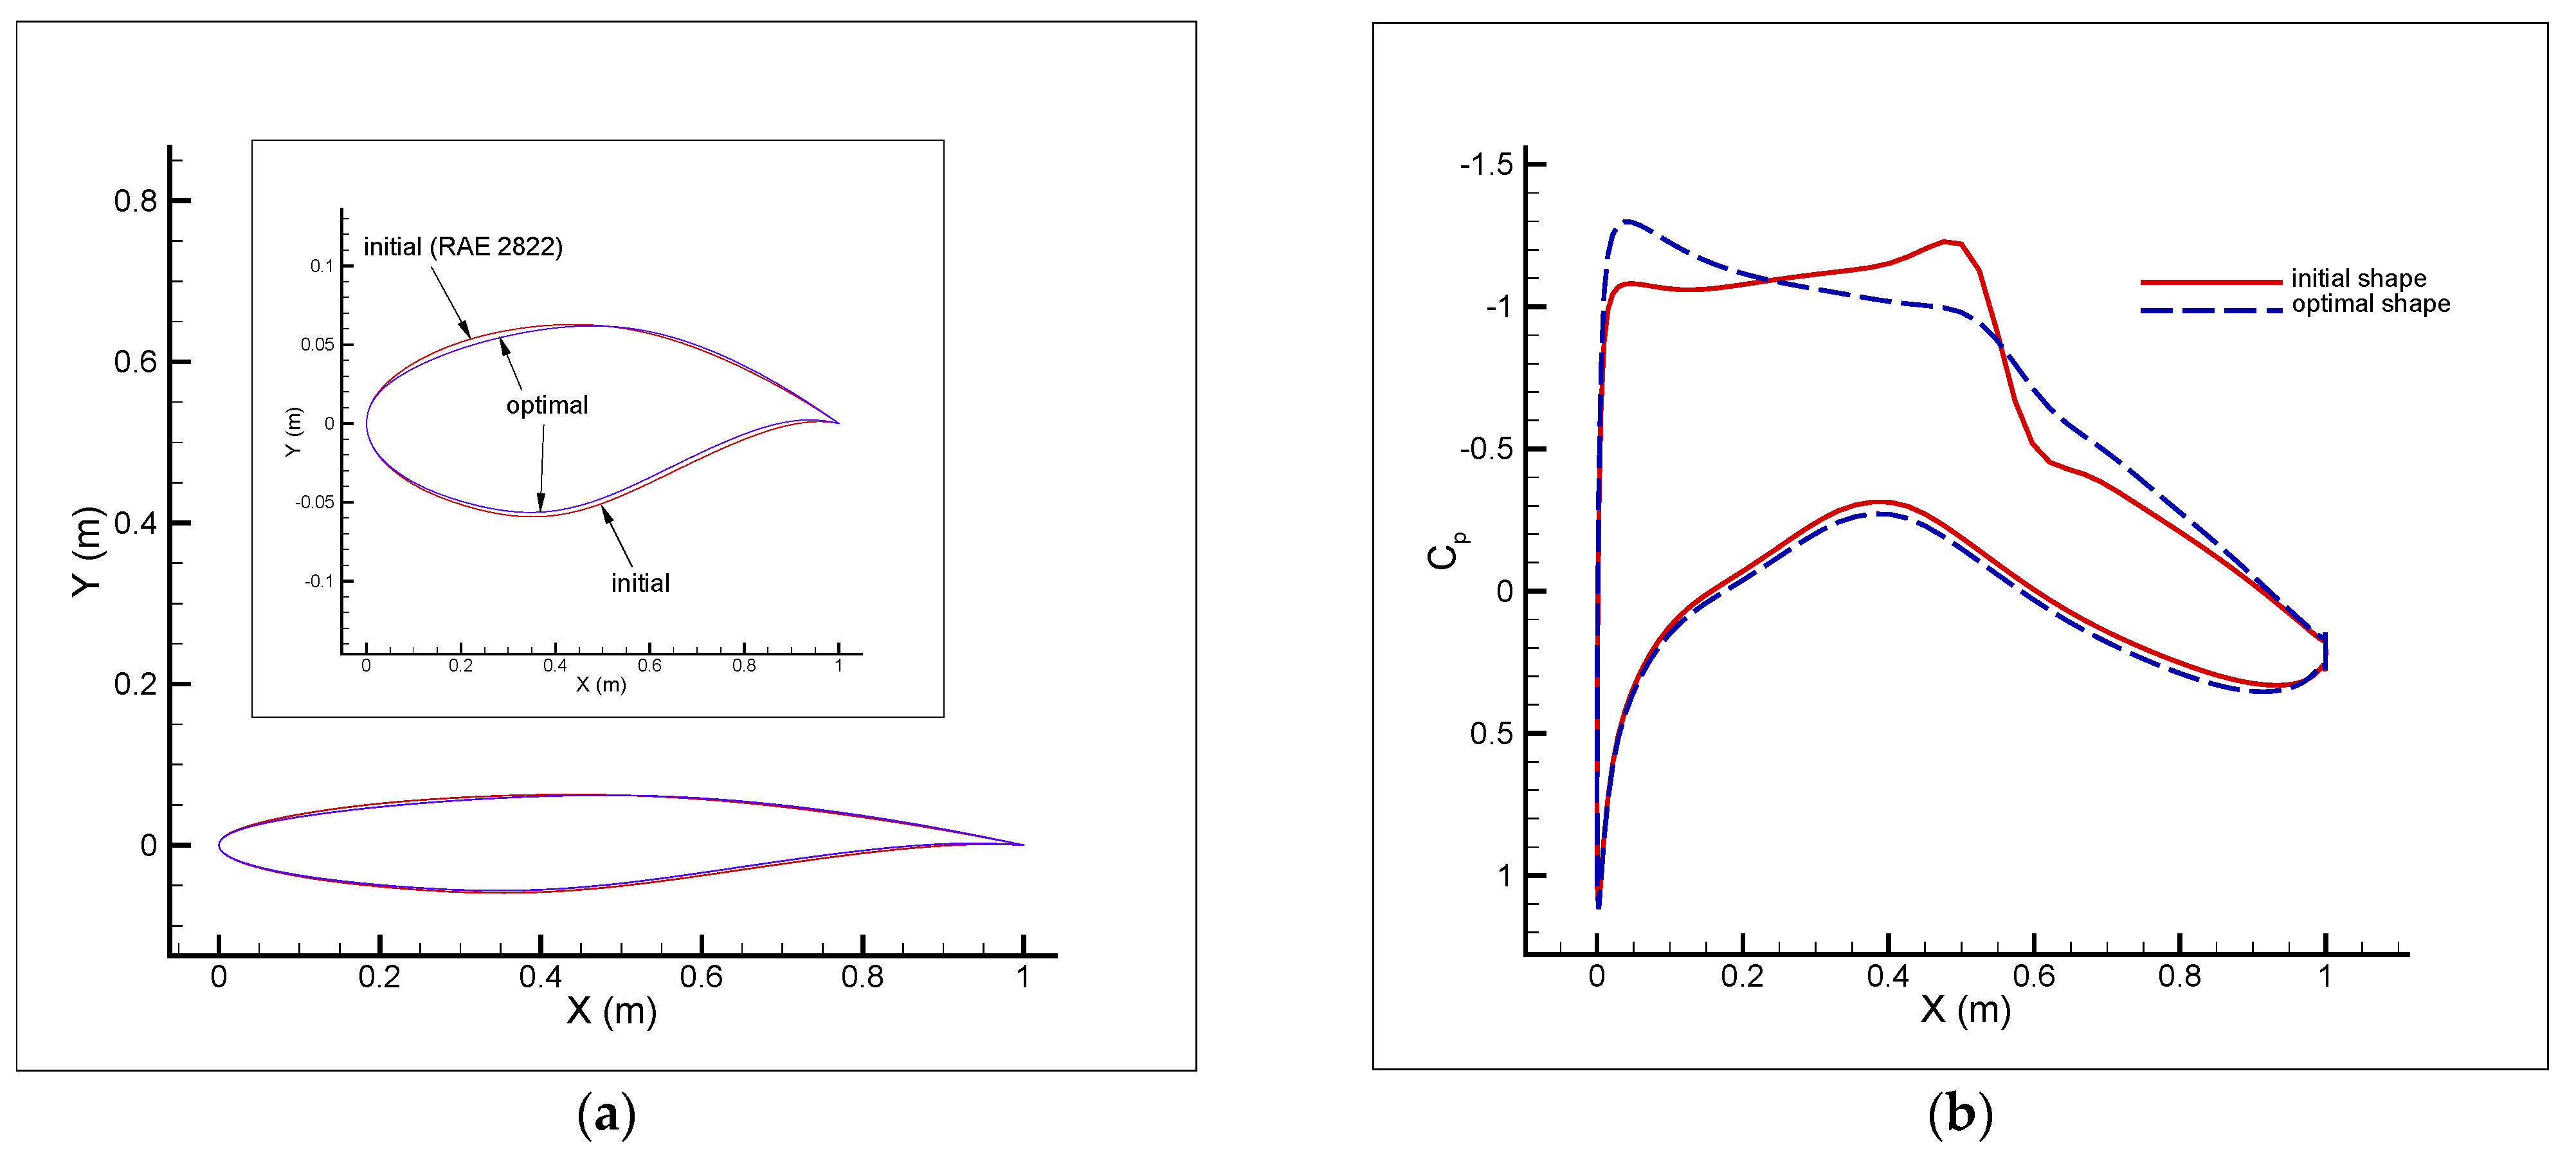
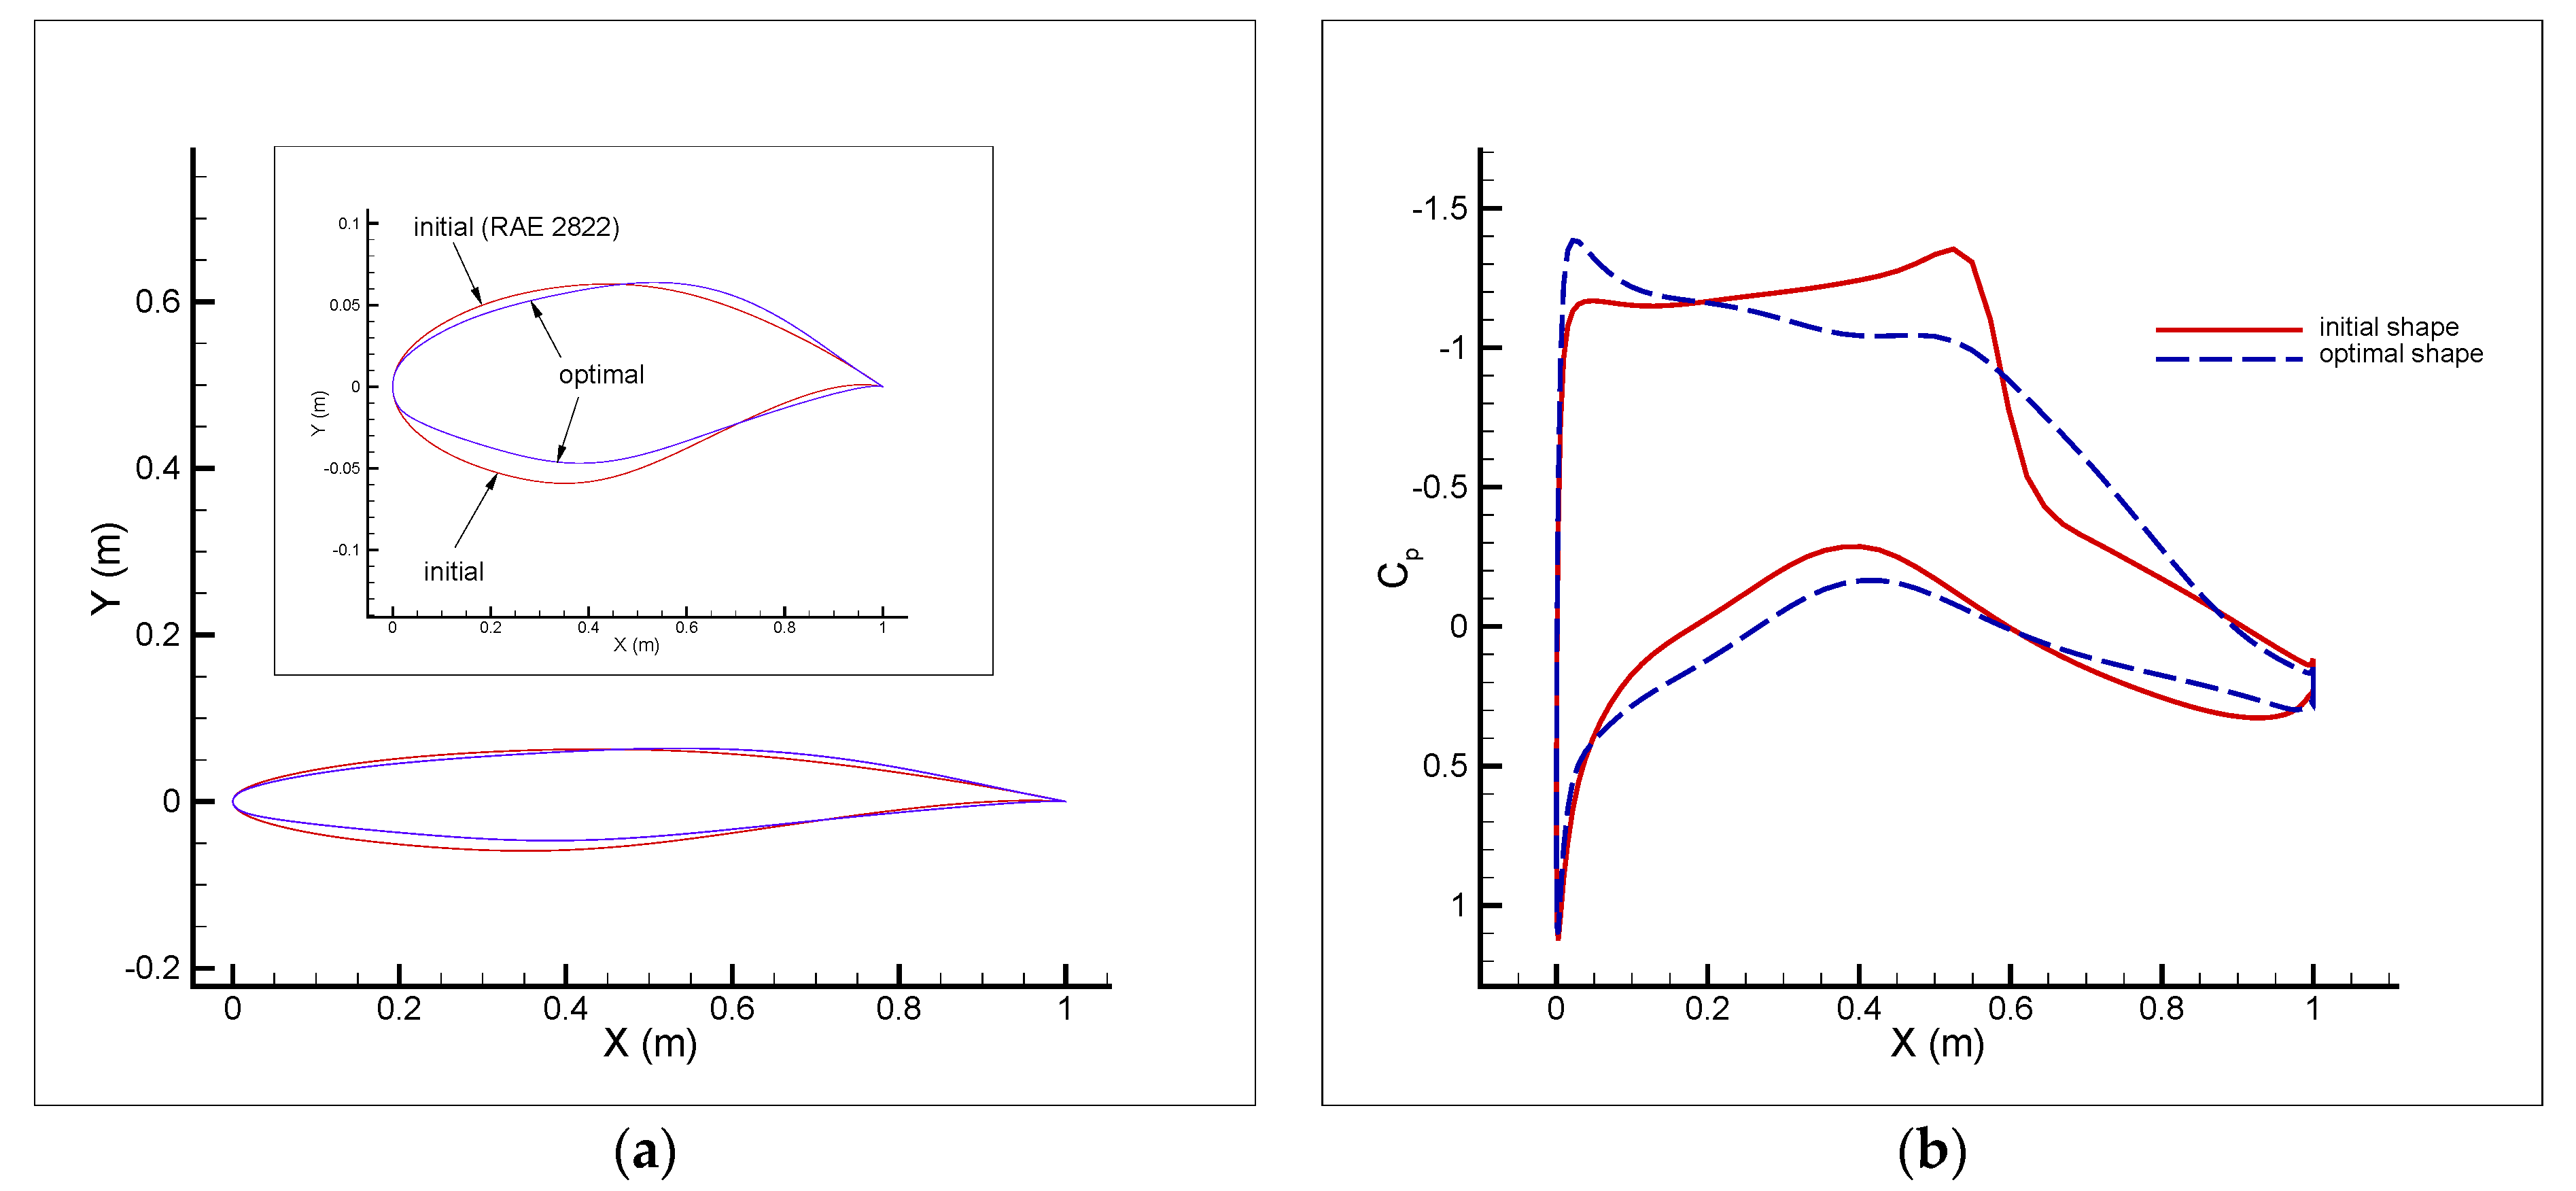
As stated previously, two flow conditions were considered here to investigate the performance of the proposed numerical approach in the shape optimization of the RAE 2822 airfoil in viscous transonic flows. In both flow conditions, there was a shock on the upper surface, as can be seen in Figure 10a (for Test case I) and Figure 11a (for Test case II). Moreover, the optimal shapes for the both test cases (Figure 10b and Figure 11b) were approximately shock-free with a significantly reduced drag. The numerical solution of the initial shape (reconstructed RAE 2822 airfoil) gave a total drag of 126.8 counts (75.3 counts due to pressure and 51.5 counts due to skin friction) in Test case I (Table 2) and a total drag of 204.3 counts (155.1 counts due to pressure and 49.2 counts due to skin friction) in Test case II (Table 3). The corresponding values of the drag for the optimal shape for both test cases were a total drag of 99.9 counts (47.8 counts due to pressure and 52.1 counts due to skin friction) in Test case I (Table 2) and a total drag of 110.3 counts (58.4 counts due to pressure and 51.9 counts due to skin friction) in Test case II (Table 3). Therefore, the drag reduction (21.2% in Test case I and 46.0% in Test case II) was mainly due to the pressure drag. The skin friction drag contribution to the drag reduction was insignificant, as explained earlier in Section 3.2 and Equation (14). Moreover, as can be seen in Table 2 and Table 3, the increase in the lift (7.9% in Test case I and 4.3% in Test case II) was totally due to the pressure lift. The lift due to skin friction was negligible. As the drag reduction due to the skin friction was insignificant, the drag reduction problem could be considered as the minimization of the pressure drag only. Thus, the exact step length expression obtained already for the inviscid flows [1] could also be used to deal with the viscous flows. If in Equation (20), A f cos α = 0 , then the expression for the inviscid flows was obtained. In this case, when A f cos α = 0 , the numerator of Equation (20) became smaller and we could consider larger modification values (Equations (5) and (6)) for the modified step length. Thus, the modified step length became closer to the exact step length value. If we considered the pressure drag reduction only and neglected the insignificant variation of the skin friction drag during the optimization process, the drag reductions of 36.5% (27.5 drag counts) and 62.3% (96.7 drag counts) were obtained in Test cases I (Table 2) and II (Table 3), respectively. A summary of the results including the values of the objective function, the step length, the drag, the drag coefficient, the lift, and the lift coefficients in all iterations during the optimization process is presented in Table 4 (for Test case I) and Table 5 (for Test case II). The results showed that the objective function reduction was 46.7% for Test case I and 73.3% for Test case II. As can be seen in the trend of the minimization of the objective function, the vast majority of the reduction in the objective function value happened in the first iteration. This resulted in a very efficient optimization procedure because a desirable airfoil shape based on the design requirements was achieved in only one iteration. This matter (major reduction in the objective function value in the first iteration) was also observed in the optimization problem for the inviscid transonic flow presented in [1]. The comparison of the initial and optimal airfoils and the corresponding airfoil surface pressure coefficients are shown in Figure 12 (Test case I) and Figure 13 (Test case II). The gradient of the objective function with respect to the design variables for the initial and optimal airfoil shapes as well as the history of the objective function during the shape optimization process are shown in Figure 14 (Test case I) and Figure 15 (Test case II). As given in Table 6 and Table 7, the reduction in the norm of the gradient of the objective function (which is usually considered as a measure to verify a sufficient decrease in the objective function value to reach the optimal solution) was 88% (Test case I) and 95.5% (Test case II). The value of the lift-to-drag ratio for the initial and optimal shapes were 60.35 and 82.65 for Test case I (Table 8) and 41.87 and 80.95 for Test case II (Table 9). As can be seen, the lift-to-drag ratio for both test cases was improved significantly. The optimization process for each test case stopped when a negative step length was obtained as long as a sufficient reduction in the norm of the gradient (or the objective function value) was achieved. Moreover, by considering the results reported in the literature concerning the aerodynamic design optimization of the RAE 2822 airfoil at these two flow conditions, it can be seen that the final results for both test cases considered in this paper were comparable and competitive to the results presented in the literature.
As stated previously, the two test cases considered in this study were as follows:
Test case I: M = 0.729 , α = 2.31 ° :
Test case II: M = 0.734 , α = 2.79 ° :

5. Conclusions

In this study, the expression for the exact step length which was previously developed by the authors for inviscid transonic flows, was extended to viscous transonic flows over airfoils. The RAE 2822 airfoil was chosen to investigate the accuracy of the proposed step length due to widespread use of the RAE 2822 airfoil in transonic turbulent flows. The RAE 2822 airfoil was reconstructed by a Bezier curve of degree 16 and then some of the Bezier curve control points were considered as design variables. The minimization of the drag-to-lift ratio was performed using the gradient-based optimization method BFGS. The gradient of the defined objective function with respect to the design variables was calculated by the finite-difference method. Two test cases were considered using two common flow conditions and the numerical solution of the transonic turbulent flow over the airfoil was performed using the solver ANSYS Fluent (using the S-A turbulence model). The use of the proposed step length expression resulted in an accurate and efficient optimization process in which the optimal shape was achieved within a few iterations with a significant objective function reduction in the first iteration. The final results for both test cases were comparable and competitive to the results presented in the literature.

Author Contributions

Conceptualization, F.M.; data curation, F.M.; formal analysis, F.M.; funding acquisition, F.M.; investigation, F.M.; methodology, F.M.; resources, F.M.; software, F.M.; supervision, B.E. and M.S.; validation, F.M.; visualization, F.M.; writing—original draft, F.M.; writing—review and editing, F.M. and B.E. All authors have read and agreed to the published version of the manuscript.

Funding

This research was supported by funding from the European Union’s Horizon 2020 research and innovation program under the Marie Skłodowska–Curie grant agreement no. 663830.

Conflicts of Interest

The authors declare no conflict of interest.

References

  1. Mohebbi, F.; Evans, B. On an exact step length in gradient-based aerodynamic shape optimization. Fluids 2020, 5, 70. [Google Scholar] [CrossRef]
  2. He, X.; Li, J.; Mader, C.A.; Yildirim, A.; Martins, J.R. Robust aerodynamic shape optimization—From a circle to an airfoil. Aerosp. Sci. Technol. 2019, 87, 48–61. [Google Scholar] [CrossRef]
  3. Carrier, G.; Destarac, D.; Dumont, A.; Meheut, M.; El Din, I.S.; Peter, J.; Ben Khelil, S.; Brezillon, J.; Pestana, M. Gradient-based aerodynamic optimization with the elsA software. In Proceedings of the 52nd Aerospace Sciences Meeting, National Harbor, MD, USA, 13–17 January 2014; p. 0568. [Google Scholar]
  4. Anderson, G.R.; Nemec, M.; Aftosmis, M.J. Aerodynamic shape optimization benchmarks with error control and automatic parameterization. In Proceedings of the 53rd AIAA Aerospace Sciences Meeting, Kissimmee, FL, USA, 5–9 January 2015; p. 1719. [Google Scholar]
  5. Bisson, F.; Nadarajah, S.; Shi-Dong, D. Adjoint-based aerodynamic optimization of benchmark problems. In Proceedings of the 52nd Aerospace Sciences Meeting, National Harbor, MD, USA, 13–17 January 2014; p. 0412. [Google Scholar]
  6. Zhang, Y.; Han, Z.-H.; Shi, L.; Song, W.-P. Multi-round surrogate-based optimization for benchmark aerodynamic design problems. In Proceedings of the 54th AIAA Aerospace Sciences Meeting, San Diego, CA, USA, 4–8 January 2016; p. 1545. [Google Scholar]
  7. Lee, C.; Koo, D.; Telidetzki, K.; Buckley, H.; Gagnon, H.; Zingg, D.W. Aerodynamic Shape Optimization of Benchmark Problems Using Jetstream. In Proceedings of the 53rd AIAA Aerospace Sciences Meeting, Kissimmee, FL, USA, 5–9 January 2015; p. 0262. [Google Scholar]
  8. Poole, D.J.; Allen, C.B.; Rendall, T. Control point-based aerodynamic shape optimization applied to AIAA ADODG test cases. In Proceedings of the 53rd AIAA Aerospace Sciences Meeting, Kissimmee, FL, USA, 5–9 January 2015; p. 1947. [Google Scholar]
  9. Zhang, M.; Rizzi, A.W.; Nangia, R.K. Transonic airfoils and wings design using inverse and direct methods. In Proceedings of the 53rd AIAA Aerospace Sciences Meeting, Kissimmee, FL, USA, 5–9 January 2015. [Google Scholar]
  10. Spalart, P.; Allmaras, S. A one-equation turbulence model for aerodynamic flows. Rech. Aerosp. 1994, 1, 5–21. [Google Scholar]
  11. Blazek, J. Computational Fluid Dynamics: Principles and Applications; Butterworth-Heinemann: Oxford, UK, 2015. [Google Scholar]
  12. Cook, P.; McDonald, M.; Firmin, M. Aerofoil RAE 2822-Pressure Distributions, and Boundary Layer and Wake Measurements, Experimental Data Base for Computer Program Assessment; AGARD Report AR 138; Research and Technology Organisation (NATO): Neuilly-sur-Seine, France, 1979. [Google Scholar]
  13. Cobb, S.M.; Gill, P.E.; Murray, W.; Wright, M.H. Practical optimization. Math. Gaz. 1982, 66, 252. [Google Scholar] [CrossRef] [Green Version]
  14. RAE 2822 AIRFOIL (rae2822-il). Available online: http://airfoiltools.com/airfoil/details?airfoil=rae2822-il (accessed on 20 December 2020).
  15. Fluent Users Guide; Version 19.2; ANSYS Inc.: Canonsburg, PA, USA, 2018.
Figure 1. Flow domain and free stream conditions.
Fluids 06 00106 g001
Figure 2. Comparison of the control points of Bezier curve of degree 16 for reconstructing the NACA 0012 and RAE 2822 airfoils.
Fluids 06 00106 g002
Figure 3. Comparison of the control points of Bezier curves of degrees 16 (17 control points), 20 (21 control points), and 24 (25 control points) for RAE 2822 airfoil.
Fluids 06 00106 g003
Figure 4. Definition of the design variables (variable control points). The coordinates of the Bezier control points were not real and were plotted this way for the sake of simplicity in the definition.
Fluids 06 00106 g004
Figure 5. Pressure and shear stress applied on an airfoil surface.
Fluids 06 00106 g005
Figure 6. Comparison of original RAE2822 airfoil and reconstructed RAE2822 airfoil using a Bezier curve of degree 16.
Fluids 06 00106 g006
Figure 7. Structured mesh (hyperbolic O-type) around the RAE2822 airfoil used for solving the transonic turbulent flow Equations. The grid size and the wall spacing are 129 × 129 and 5 × 10 5   m , respectively.
Fluids 06 00106 g007
Figure 8. Comparison of surface pressure coefficient between the numerical solution (ANSYS Fluent, S-A turbulence model) and the experimental data [12] for the RAE2822 airfoil at the flow conditions: (a) Test case I: M = 0.729 ,   α = 2.31 ° , and (b) Test case II: M = 0.734 ,   α = 2.79 ° .
Fluids 06 00106 g008
Figure 9. Mach number distribution around the RAE 2822 airfoil.
Fluids 06 00106 g009
Figure 10. Absolute pressure distribution for the initial shape (RAE 2822) (a) and the optimal shape (at iteration 5) (b) for Test case I.
Fluids 06 00106 g010
Figure 11. Absolute pressure distribution for the initial shape (RAE 2822) (a) and the optimal shape (at iteration 19) (b) for Test case II.
Fluids 06 00106 g011
Figure 12. Comparison of initial and optimal airfoils used in the transonic turbulent flow shape optimization (a) and the corresponding airfoil surface pressure coefficients (b) for Test case I.
Fluids 06 00106 g012
Figure 13. Comparison of initial and optimal airfoils used in the transonic turbulent flow shape optimization (a) and the corresponding airfoil surface pressure coefficients (b) for Test case II.
Fluids 06 00106 g013
Figure 14. The gradient of the objective function with respect to the design variables (a) and the history of the objective function during the shape optimization process (Test case I).
Fluids 06 00106 g014
Figure 15. The gradient of the objective function with respect to the design variables (a) and the history of the objective function during the shape optimization process (Test case II).
Fluids 06 00106 g015
Table 1. Numerical simulation of transonic turbulent flow over the RAE 2822 airfoil using the software ANSYS Fluent.
Test Case M α Grid SizeWall SpacingTurbulence Model D c d L c l
10.7292.31129 × 1295 × 10−5 mS-A478.215 N0.012728,861.262 N0.766
Experimental results ([12]: Case 6 (corrected):0.0127 0.743
20.7342.79129 × 1295 × 10−5 mS-A780.363 N0.020432,671.037 N0.856
Experimental results ([12]: Case 9 (corrected):0.0168 0.803
Table 2. The value of the components of the drag (drag due to pressure and drag due to skin friction) for the initial and optimal shapes (Test case I).
Airfoil Shape c d p   ( Due   to   Pressure ) c d f   ( Due   to   Skin   Friction ) c l p   ( Due   to   Pressure ) c l f   ( Due   to   Skin   Friction )
Initial0.00753
(75.3 counts)
0.00515
(51.5 counts)
0.766Negligible
Optimal0.00478
(47.8 counts)
0.00521
(52.1 counts)
0.827Negligible
Variation−27.5 counts
(−36.5%)
+0.6 counts
(+1.2%)
+7.9%-
Table 3. The value of the components of the drag (drag due to pressure and drag due to skin friction) for the initial and optimal shapes (Test case II).
Airfoil Shape c d p   ( Due   to   Pressure ) c d f   ( Due   to   Skin   Friction ) c l p   ( Due   to   Pressure ) c l f   ( Due   to   Skin   Friction )
Initial0.01551
(155.1 counts)
0.00492
(49.2 counts)
0.856negligible
Optimal0.00584
(58.4 counts)
0.00519
(51.9 counts)
0.893negligible
Variation−96.7 counts
(−62.3%)
+2.7 counts
(+5.5%)
+4.3%-
Table 4. Results for Test case I.
Iteration Number (k) J = ( D L ) 2 Step   Length   β = 0.02 β exact D ( N ) c d L ( N ) c l
0 (initial shape)2.745 × 10⁻⁴-478.2150.0127028,861.2620.766
11.646 × 10−40.617365.3370.0097028,471.8070.756
21.605 × 10−40.380362.6350.0096328,623.5690.760
31.574 × 10−40.478363.7090.0096628,993.7490.770
41.541 × 10−40.527365.9790.0097229,479.7900.783
51.464 × 10−41.023376.6580.0100031,132.0610.827
Variation:−46.68% −21.24% +7.87%
Table 5. Results for Test case II.
Iteration Number (k) J = ( D L ) 2 Step   Length   β = 0.1 β exact D ( N ) c d L ( N ) c l
0 (initial shape)5.705 × 10⁻⁴-780.3630.0204432,671.0370.856
11.922 × 10−40.649452.7070.0118632,650.3600.855
21.732 × 10−41.020424.8280.0111332,278.5230.845
31.704 × 10−42.892422.8080.0110732,387.9670.848
41.676 × 10−40.472419.2050.0109832,382.3750.848
51.651 × 10−40.194416.2520.0109032,391.8800.848
61.630 × 10−40.159414.0450.0108432,427.2140.849
71.613 × 10−40.071412.2620.0108032,458.9090.850
81.600 × 10−40.191411.5150.0107832,531.6100.852
91.589 × 10−40.204411.1360.0107732,618.6350.854
101.579 × 10−40.130411.2530.0107732,725.5370.857
111.570 × 10−40.176411.6400.0107832,847.4270.860
121.563 × 10−40.166412.4250.0108032,987.5410.864
131.557 × 10−40.135413.3220.0108233,129.3530.868
141.551 × 10−40.060414.4120.0108533,274.9570.871
151.546 × 10−40.135415.6240.0108833,428.4230.875
161.541 × 10−40.128416.9840.0109233,589.9640.880
171.536 × 10−40.129418.4080.0109633,758.8360.884
181.531 × 10−40.131419.8610.0110033,937.6610.889
191.526 × 10−40.023421.3740.0110334,112.0080.893
Variation:−73.25% −46.00% +4.41%
Table 6. Reduction in the norm of gradient of the objective function (Test case I).
Initial ShapeOptimal ShapeReduction
1.90 × 10−22.3 × 10−387.99%
Table 7. Reduction in the norm of gradient of the objective function (Test case II).
Initial ShapeOptimal ShapeReduction
3.33 × 10−21.5 × 10−395.46%
Table 8. The value of lift-to-drag ratio for the initial and optimal shapes (Test case I).
Airfoil Shape L D
Initial60.35
Optimal82.65
Variation+36.95%
Table 9. The value of lift-to-drag ratio for the initial and optimal shapes (Test case II).
Airfoil Shape L D
Initial41.87
Optimal80.95
Variation+93.34%
Publisher’s Note: MDPI stays neutral with regard to jurisdictional claims in published maps and institutional affiliations.