Article

Numerical Investigation of Spray Collapse in GDI with OpenFOAM

Institute for Combustion Technology, University of Stuttgart, Herdweg 51, 70174 Stuttgart, Germany
*
Author to whom correspondence should be addressed.
Fluids 2021, 6(3), 104; https://doi.org/10.3390/fluids6030104
Submission received: 2 February 2021 / Revised: 22 February 2021 / Accepted: 1 March 2021 / Published: 4 March 2021
(This article belongs to the Special Issue Modelling of Reactive and Non-reactive Multiphase Flows)

Abstract

:
During certain operating conditions in spark-ignited direct injection engines (GDI), the injected fuel will be superheated and begin to rapidly vaporize. Fast vaporization can be beneficial for fuel–oxidizer mixing and subsequent combustion, but it poses the risk of spray collapse. In this work, spray collapse is numerically investigated for a single hole and the spray G eight-hole injector of an engine combustion network (ECN). Results from a new OpenFOAM solver are first compared against results of the commercial CONVERGE software for single-hole injectors and validated. The results corroborate the perception that the superheat ratio R p , which is typically used for the classification of flashing regimes, cannot describe spray collapse behavior. Three cases using the eight-hole spray G injector geometry are compared with experimental data. The first case is the standard G2 test case, with iso-octane as an injected fluid, which is only slightly superheated, whereas the two other cases use propane and show spray collapse behavior in the experiment. The numerical results support the assumption that the interaction of shocks due to the underexpanded vapor jet causes spray collapse. Further, the spray structures match well with experimental data, and shock interactions that provide an explanation for the observed phenomenon are discussed.

1. Introduction

Fuel direct injection (GDI) in spark-ignited engines has become a widely used method in the automotive industry to improve engine efficiency and to reduce CO2 emissions. The advantages of direct injection include, but are not limited to, controlled fuel-to-air ratios during cranking and cold start, lower operating break specific fuel consumption, higher compression ratios and increased engine efficiency [1]. In recent years, liquid pressurized gas (LPG) internal combustion engines have been emerging as a suitable alternative to conventional gasoline engines and have become common in many regions of the world. While LPG offers many advantages over refinery gasoline, such as a higher compression ratio and lower specific CO2 emissions, it has a significantly higher saturation pressure. Therefore, the fuel is injected in a superheated condition for several engine operating conditions that are typical for direct injection. In the superheated state, vapor bubbles nucleate within the jet and start to grow rapidly, leading to a disintegration of the jet and a fine dispersed cloud of droplets. This process is commonly referred to as flash boiling and often characterized by the superheat ratio of the saturation to ambient pressure, R p = p sat / p . While flash boiling can help to improve the vaporization process and reduce the droplet size, adverse effects such as spray collapse may occur [2,3,4]. Spray collapse is a result of plume-to-plume interaction [2,4,5], with a significantly increased penetration length and decreased spray angle, which negatively impacts engine performance and emissions. Even though flashing occurs in a wider range of operating conditions for LPG, higher hydrocarbons experience flashing as well and may also be subject to spray collapse.
Flashing in direct injection engines has been studied by several authors. Zeng et al. [2] experimentally studied the spray morphology of several gasoline-like fluids such as ethanol, methanol or n-hexane with an eight-hole industry grade injector with a nominal spray angle of 60°. The authors concluded that spray collapse occurs at superheat ratios greater than R p = 3.33 . However, this threshold disregards the injector geometry, which plays an important role in determining the onset of spray collapse. The fact that the injector geometry, especially the number of bores, affects the spray collapse was first reported by Weber and Leick [6]. This work was continued by Lacey et al. [4] who investigated propane and iso-octane for the spray G configuration of the engine combustion network (ECN) with a nominal spray angle of 80°. They found that R p cannot serve as a general threshold value for spray collapse and that rather the combination of geometric parameters with an adiabatic expansion process gives a criterion for spray collapse. It is therefore assumed that the flow is chocked within the injector and that the subsequent expansion of the under-expanded gaseous jet causes spray collapse, if the two opposite plumes touch. Payri et al. [7], however, observed spray collapse for iso-octane in a supercritical regime; thus, flashing cannot be the cause of spray collapse.
Flash boiling in GDI engines has been studied numerically by multiple researchers including Guo et al. [5], Saha et al. [8], Rachakonda et al. [9], Devassy et al. [10], Mohapatra et al. [11]. Saha et al. [12] investigated the applicability of the homogeneous relaxation model of Downar-Zapolski et al. [13] to the modeling of the phase change. They concluded that the general model parameters originally fitted to water are in good agreement and can be used to simulate flashing in GDI. Devassy et al. [10] used a Hertz–Knudsen relationship with an empirical nucleation model to simulate flash boiling in the spray G case of ECN, showing that this model is applicable for the modeling of flashing in GDI injectors. However, only one case was considered, and spray collapse was not discussed. A general comparison of different CFD software tools and modeling approaches has been summarized in Mohapatra et al. [11], concluding that the choice of the evaporation model does not significantly affect the mass flow rate through the nozzle but that rather the general numerical modeling is important to correctly capture the injection process. In Guo et al. [5] the interaction of two plumes of a two-hole injector was studied. They focused on the resulting shock structures of the flashing jet after the exit of the injector. Similar to underexpanded gaseous jets, a shock system formed outside of the injector, and the authors stated that the interaction of the shocks caused a low-pressure region in the center of the spray, resulting in spray collapse. In a successive study, the same authors investigated the spray collapse of propane using a spray G injector [14]. They concluded that spray collapse is caused by the shock interactions of neighboring plumes, which isolate the low-pressure region in the center of the spray from the ambient conditions. However, their work focused on significantly lower injection pressures than those investigated in this work. As the injection pressure has a strong influence on the spray characteristics of flashing flows, different shock structures can be expected [15,16].
The presence of shocks in flashing flows was also shown experimentally by Lamanna et al. [17] for flashing acetone sprays and numerically for flashing cryogenic nitrogen sprays by Gärtner et al. [18]. Poursadegh et al. [16] visualized the shock structures for spray collapse in an ECN injector for the supercritical injection of propane using near-nozzle Schlieren images. A low-pressure region in the center of the spray was also considered as the cause of spray collapse in the work of Rachakonda et al. [19]. However, Rachakonda et al. [19] did not mention the cause of the low-pressure region or the developing shock structures. Possibly, the coarse grid of only 1.4 million cells did not allow the resolution of these structures.
In this work, the cause of spray collapse due to flashing and the proposed idea of shock interaction for high injection pressures are investigated. Further, the capability of R p to describe flashing spray behavior is challenged by simulating two cases with the same R p value but different injection temperatures. The simulations are conducted with an in-house code based on OpenFOAM [20], which uses a one-fluid approach together with the homogeneous relaxation model (HRM) to model the two phase flow. The solver has already been applied successfully to cases of flash boiling cryogenic nitrogen and acetone [18]. At first, the solver is applied to the single injector case of Guo et al. [21] to validate the solver for GDI applications and to investigate the mesh effects. In a second step, three cases using the spray G configuration are simulated, and plume-to-plume shock interaction is studied.

2. CFD Modeling

To simulate flashing, a compressible one-fluid in-house solver based on the OpenFOAM -v5.x [20] compressibleInterFoam code was developed. This solver has already been applied successfully to flashing cryogenic liquids and has been validated to predict shock size and position correctly [22]. The solver uses a one-fluid approach and therefore solves the equation for the transport of a liquid volume fraction in addition to the mass, momentum and energy equations. The set of governing equations to solve is therefore as follows:
ρ l ¯ α ˜ t + · ( ρ l ¯ α ˜ u ˜ ) + · ( ρ l α l u ¯ ) = m ˙ l ˜ ,
ρ ¯ u ˜ t + · ρ ¯ u ˜ u ˜ = p ¯ + ρ ¯ g + · τ t ˜ ,
ρ ¯ D h ˜ l D t + ρ ¯ D K ˜ D t = p ¯ t + · ( k l , Eff T ˜ l ) + ρ ¯ ρ ¯ l α ¯ l m ˙ l ( h SG ( p ) h ˜ l ) ,
ρ ¯ D h ˜ g D t + ρ ¯ D K ˜ D t = p ¯ t + · ( k g , Eff T ˜ g ) + ρ ¯ ρ ¯ g α ¯ g m ˙ l ( h ˜ g h SG ( p ) ) ,
where α = V l / V , ρ , ρ l , p, u , K, τ t , h, k Eff , g, are the volume fraction, mixture density, liquid density, pressure, mixture velocity vector, kinetic energy, turbulent viscous stress tensor, mixture enthalpy, effective thermal conductivity and gravity, respectively. The overbar represents Reynolds averages of the density field, while tildes and double prime superscripts denote Favre averages and fluctuations around these averages, respectively. Variables with the subscripts “ l ” and “ g ” refer to the fluid properties of the respective phase, while properties without an index are volume-averaged quantities. Contrary to typical one-fluid implementations, the developed solver solves the energy equation of each phase separately, therefore allowing a temperature difference between the two phases [18]. The turbulent contributions for the enthalpy transport equations are included in the effective thermal conductivity using
· ( k g , Eff T ˜ ) = · μ Pr + μ t Pr t h ˜ ,
where μ t is the turbulent viscosity and Pr t is the turbulent Prandtl number. The same modeling approach is chosen for the volume fraction transport, and further details about the implementation can be found in [18]. The use of an Euler–Euler approach with the transport of a volume fraction allows for a simple treatment of the transition of the pure liquid region in the injector to the vapor droplet mixture in the final spray. However, as no phase interface is resolved, effects such as droplet/bubble drag and slip velocities between the phases are neglected. This also holds for any microscopic effects such as nucleation, bubble growth and details on spray break-up. After spray break-up, no information on the droplet size distribution exists, and interactions between the phases may not be well modeled. The admittedly simple implementation used here is, however, a proven method to simulate the behavior of flashing spray and capture the characteristics of the flow such that qualitative—and to a certain degree also quantitative—agreement with experiments is observed [8,14,23,24,25,26]. More advanced models such as Euler–Lagrange coupling [27], interface tracking with surface density modeling [19] and general LES simulations [28] were also applied to the simulation of GDI injectors. The coupling of Eulerian and Lagrangian simulations allowed for a more detailed spray treatment; however, only the slightly superheated spray G case was considered [27]. Surface density modeling was used for Euler–Euler descriptions and gave the additional information of the mean droplet diameter or spray shape. However, surface density provided additional information only and did not feed back information for the mass, momentum, energy conservation or phase change equations. Thus, flow dynamics were not affected by the more sophisticated description of the two-phase flow. Lastly, the LES simulation of Befrui et al. [28] for a GDI injector used sharp interface tracking, but this approach is not suitable to model flashing behavior.
Throughout this work, the turbulent viscosity μ t is modeled with the k- ω shear stress transport (SST) model. This turbulence model is suitable for adverse pressure gradients at the wall and to model flow separation. Further, the k- ϵ turbulence model was also tested, and it was found that the choice of turbulence model has no significant effect on the results.

Phase Change Modeling

The phenomenon of flash boiling poses a multi-scale problem, ranging from bubble nuclei at the nanoscale via bubbles in the micrometer range to bubble coalescence and spray break-up at the macro scale [29,30]. Due to this large-scale separation, it is not possible to resolve the bubble or droplet interface and to simulate all scales for any relevant engineering problem. Thus, the phase change has to be modeled using the resolved scales available. Over time, several models have emerged to simulate flash boiling in a one-fluid approach, notably the Hertz–Knudsen model and the homogeneous relaxation model (HRM). While the pure Hertz–Knudsen model is based on fundamental physical principles, it requires the knowledge of the correct interface temperatures, which are not available in simulations in which the bubble or droplet interfaces are not resolved [31]. Further, information about the interface area or droplet/bubble number density is required to get the total mass flux. In contrast, the HRM model by Downar-Zapolski et al. [13] relates the phase change to the deviation of the liquid mass fraction, χ , to its respective equilibrium value and a relaxation time Θ which depends on the pressure difference and the volume fraction,
Θ = Θ 0 ρ l ρ ρ l ρ g β p s ( T ) p p c p s ( T ) λ .
where p c is the critical pressure and the coefficients Θ0 = 3.84 × 10⁻⁷ s, β = 0.54 , λ = 1.76 represent the high-pressure fit to the flashing water experiments. The final expression for the phase change with χ as the liquid mass fraction is then
D χ D t = χ h l ( p , T ) h SL ( p ) h SG ( p ) h SL ( p ) 1 Θ = m ˙ l ρ .
We re-iterate here that the current one-fluid implementation using the HRM approach is unable to account for any microscopic effects such as local homogeneity within the two phases, including their local temperatures and pressures, bubble and droplet sizes, which will, on a microscopic scale, determine the evaporation rates and thus spray break-up and jet spreading. Despite these shortcomings, HRM has been successfully applied to simulate flashing fluids in various conditions and applications [8,23,24,26]. Further, the empirical coefficients are applicable for a wide range of fluids and superheat conditions, and it is noted here that for cavitating nozzles, the flow is close to thermal equilibrium such that the HRM approach gives phase change rates of the order of the homogeneous equilibrium model (HEM) [32]. This is in agreement with the work of Guo et al. [5] who used a lower Θ 0 constant to simulate flashing n-hexane in GDI injectors, effectively implying a relaxation time in the range of nanoseconds, and the work of Mohapatra et al. [11], in which the homogeneous equilibrium model (HEM) gave the same results as the HRM model. Thus, as the HRM model uses only information of the resolved scales and is a proven method, it is used here to model the phase change.

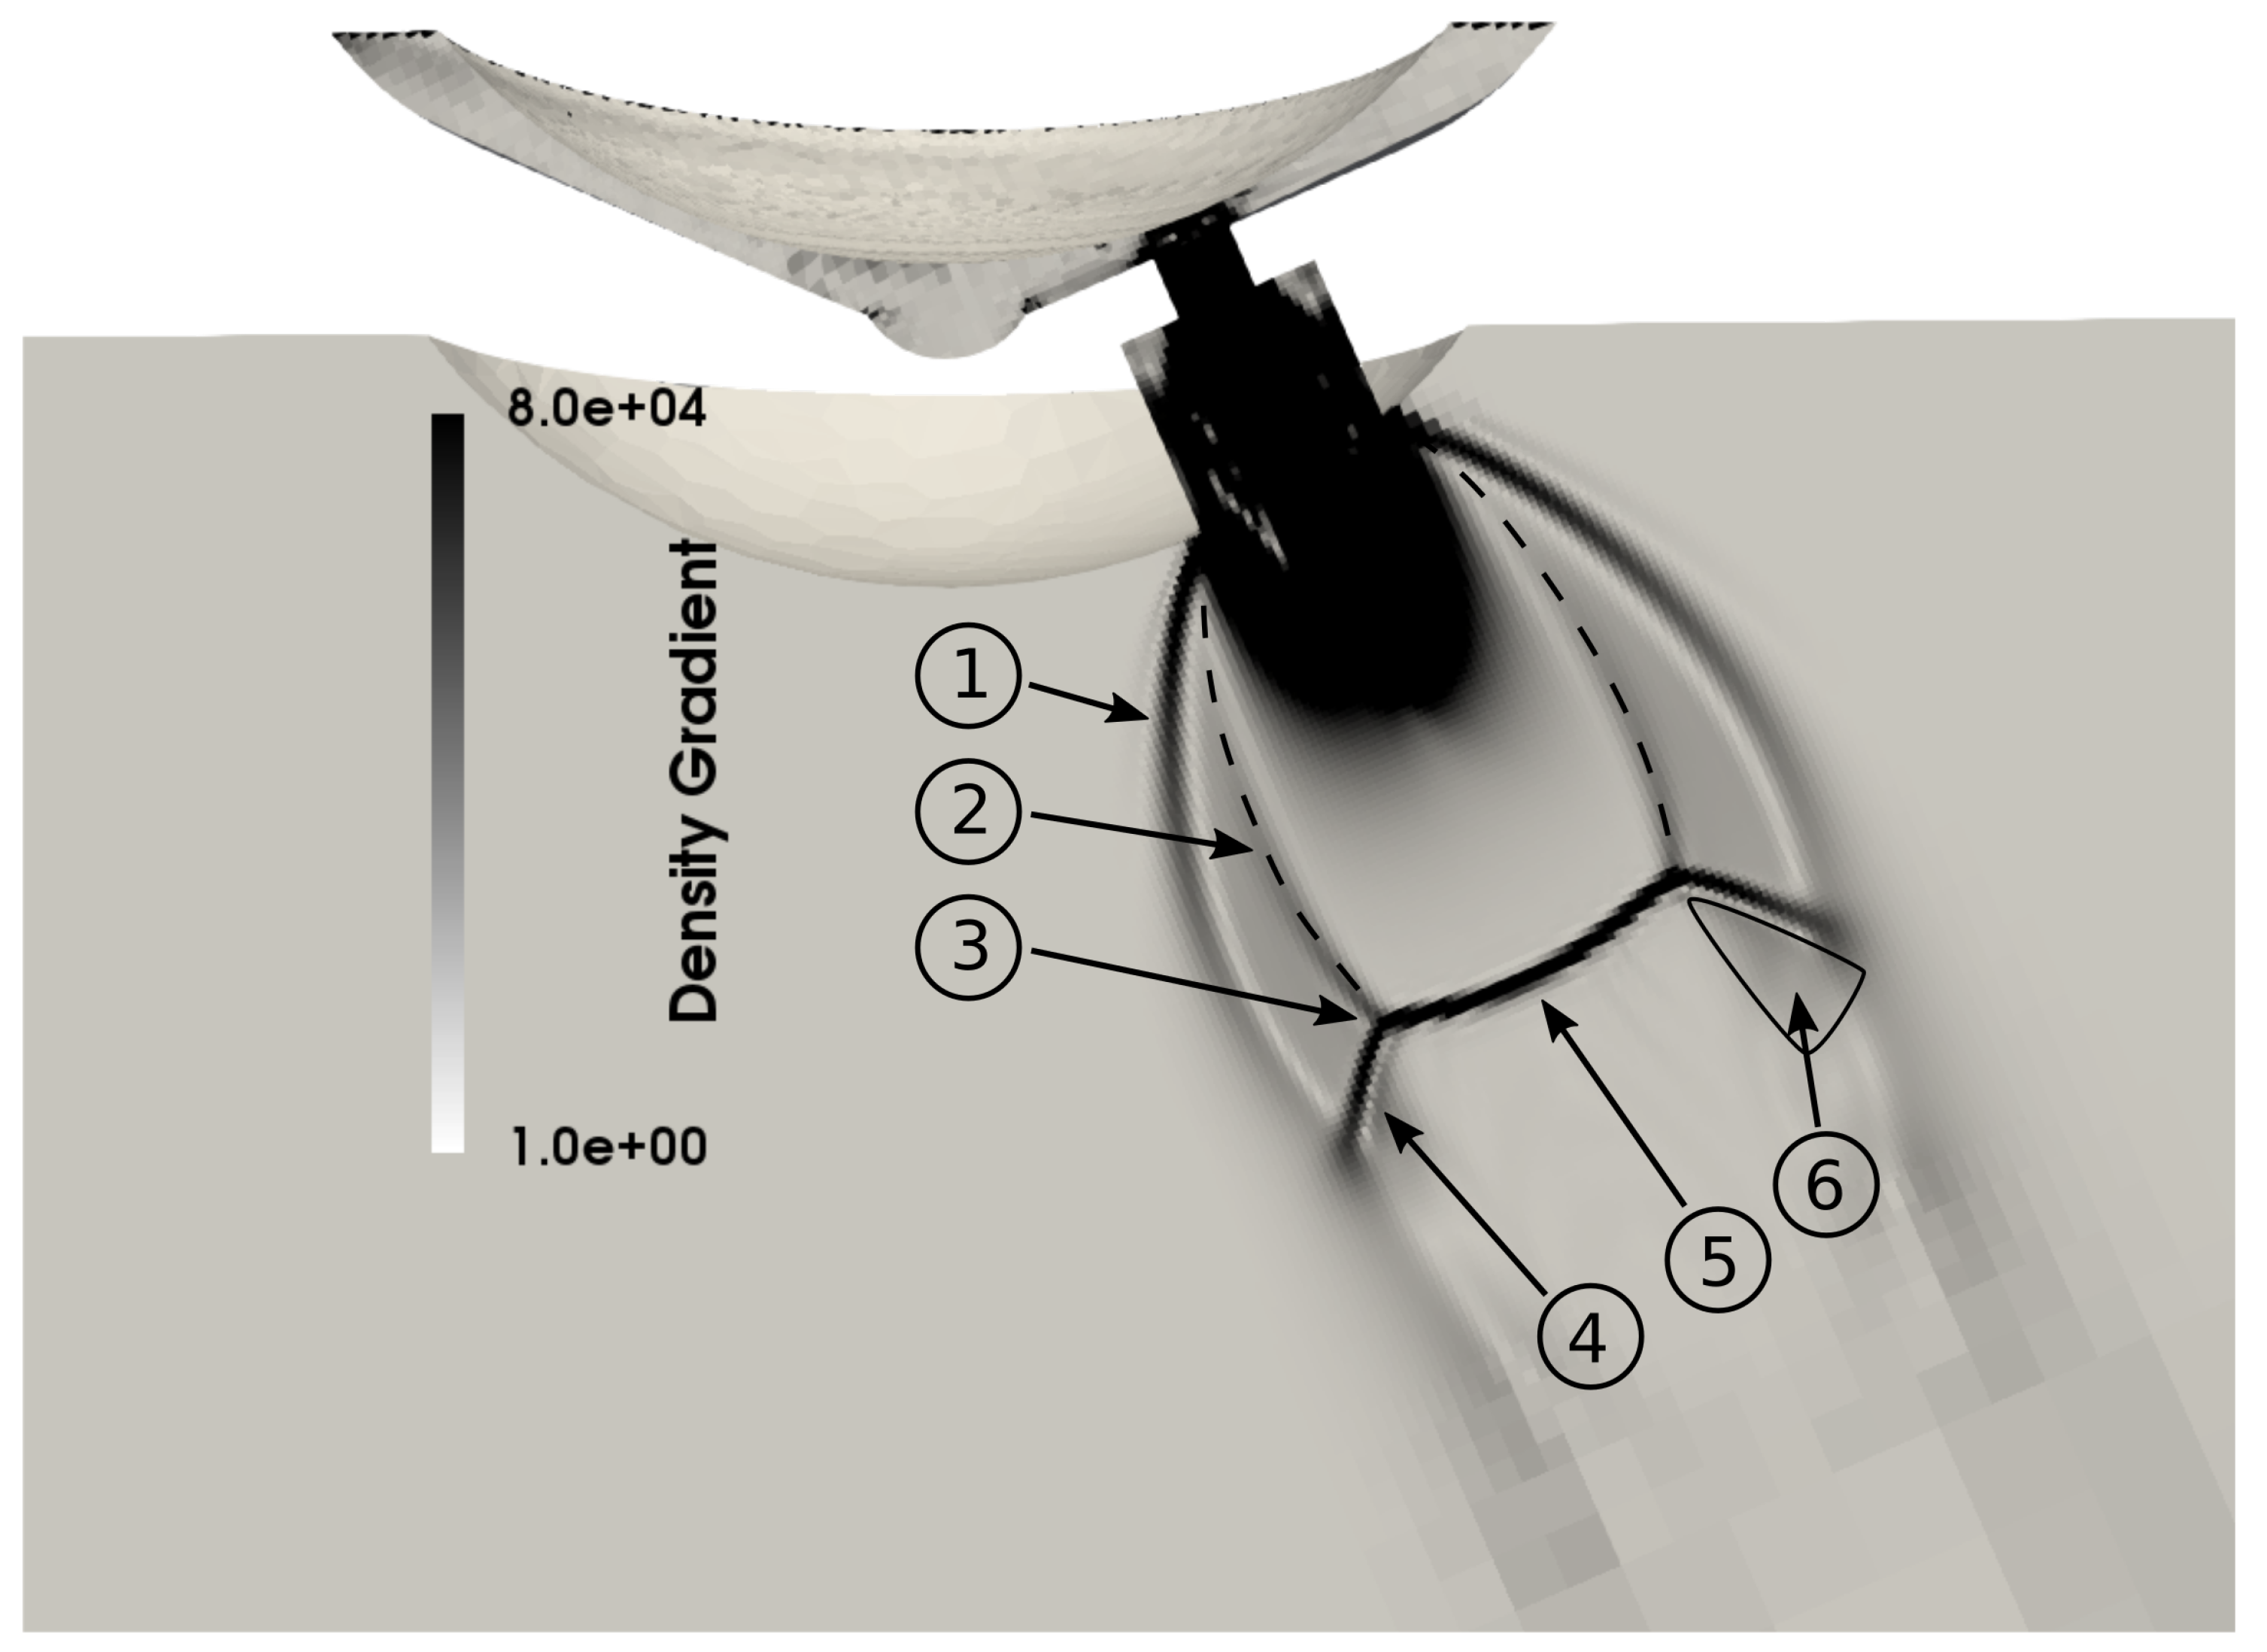
3. Single Hole Injector

The general setup is first validated by comparison with the numerical work of Guo et al. [21]. In their work, a modified version of a commercial five-hol injector using n-hexane as a fluid is investigated. One injector bore is considered, with a nominal spray angle of 60°, and the geometry is shown in Figure 1. As only one injector bore is simulated, this case allows for meshes with a reduced cell number compared with the full eight-hole spray G injector. Therefore, this case is also used to investigate the effects of the mesh as well as the injection temperature and ambient pressure on spray and flow dynamics.
For the reference case, the authors used the commercial software CONVERGE 2.3 [33] to simulate the flashing flow together with the HRM model for the phase change and adaptive mesh refinement to capture the shock structures. In contrast to the standard HRM model, the Θ 0 constant was modified and set to 1 × 10⁻⁹ s, while keeping the exponents of the high-pressure fit of Downar-Zapolski et al. [13]. To compare the results of the OpenFOAM solver, the same settings for the HRM model were selected. For the discretization scheme, first-order temporal discretization was used together with a hybrid scheme switching between a central differencing and upwind approach depending on a shock sensor [34] for the momentum equation. The reference solution with CONVERGE used a second-order temporal discretization and a second-order upwind scheme. A second-order backwards Euler method cannot be used with the OpenFOAM solver due to the implementation of the volume fraction transport equation, which requires an explicit flux correction [18]. Therefore, for the sake of stability, all presented results used first-order Euler time discretization. The mesh was generated with the OpenFOAM tool snappyHexMesh using a mesh size of 15.625 μm in the injector and in the jet, including the shock front. The mesh size was the result of a previous mesh study [35]; in addition, the cell size was smaller than the value of 17.5 μm suggested by Saha et al. [36] and in the range of the smallest mesh size of 12.5 μm used for the reference computations by Guo et al. [21].
Table 1 lists the three cases, which are compared to the results of Guo et al. [21] using the injection temperature of 403 K. In these simulations, the inlet pressure was reduced, as for an injection pressure of 10 MPa, the velocity and pressure at the inlet of the injector were above the reported values of the reference cases. As the details of the geometry upstream of the injector bore were not known, the adjustment of the injection pressure seemed to be justified to match the same pressure and velocity values at the entrance of the inner bore of the injector between the simulations and the reference.

3.1. Discussion of the Results

Inside the inner bore and in the upstream regions of the counter bore of the injector, most of the liquid vaporized, thus increasing the pressure and leading to an underexpanded gaseous jet leaving the injector. The vapor therefore exited the injector with a pressure above the ambient conditions, leading to an expansion and acceleration of the fluid to supersonic conditions. The supersonic vapor flow was then terminated by a complex shock system [37]. For the case nHexane-A, this is depicted in Figure 2, showing the outer barrel shock as well as the formed Mach disk with its reflected shocks.
To compare the data to the reference, the velocity magnitude along the centerline of the injector axis is plotted in Figure 3. This shows that the trend between both simulations was matched and that the same conditions within the injector and at the outlet could be reproduced. Further, it validated the OpenFOAM implementation and its capability to predict the shock structures of fully flashing jets correctly.

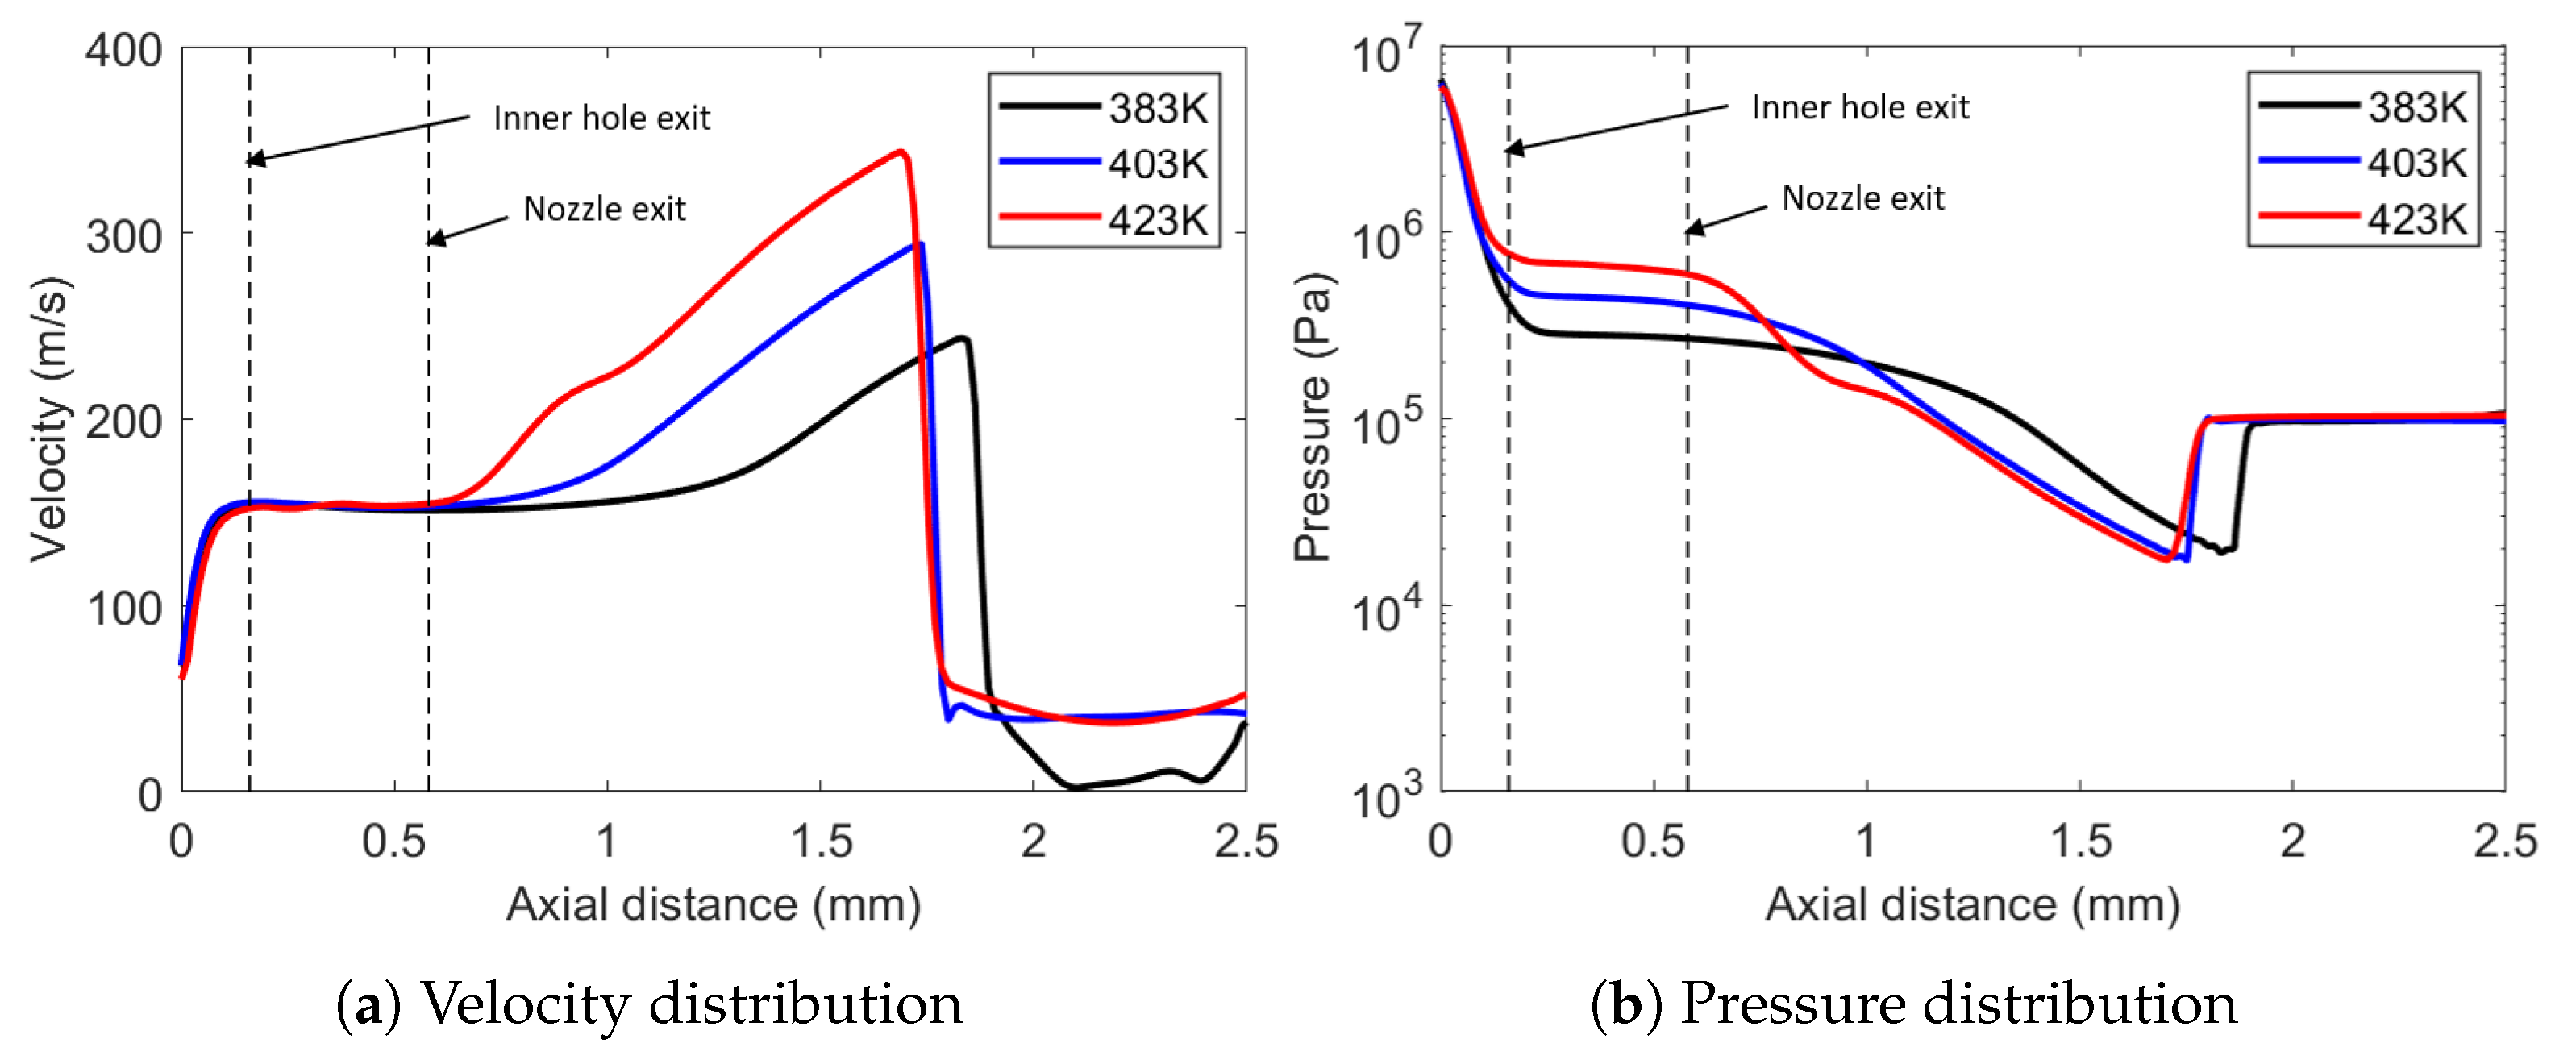
3.2. Effects of Injection Pressure and Temperature

Figure 3 also shows that, with increasing back pressure, the shock front terminating the gas expansion moves upstream and the maximum velocity is decreased at the same time. However, the acceleration up to the shock front is the same for all three cases. The effect of the injection temperature on the velocity is plotted in Figure 4a with a fixed back pressure of 101 kPa. From the results, it is apparent that the injection temperature mainly affected the acceleration of the flow. The increase of pressure in the injector seen in Figure 4b was due to the higher saturation pressure for higher injection temperatures. Inside the injector, the liquid evaporated and the pressure correspondingly increased, therefore decreasing the evaporation speed until an equilibrium between pressure increase and evaporation speed was established. Thus, for a higher injection temperature (and a higher saturation pressure), the pressure increased in the injector.
We can conclude that the injection temperature mainly affects the velocity gradient in the supersonic region whereas the ambient pressure determines the position of the shock front. Further, this means that cases with the same R p value do not give the same velocity profiles, as a lower ambient pressure with a lower injection temperature can give the same R p value as a case with higher injection temperature and ambient pressure. The variable R p is thus not sufficient to characterize the flow dynamics in the combustion chamber.

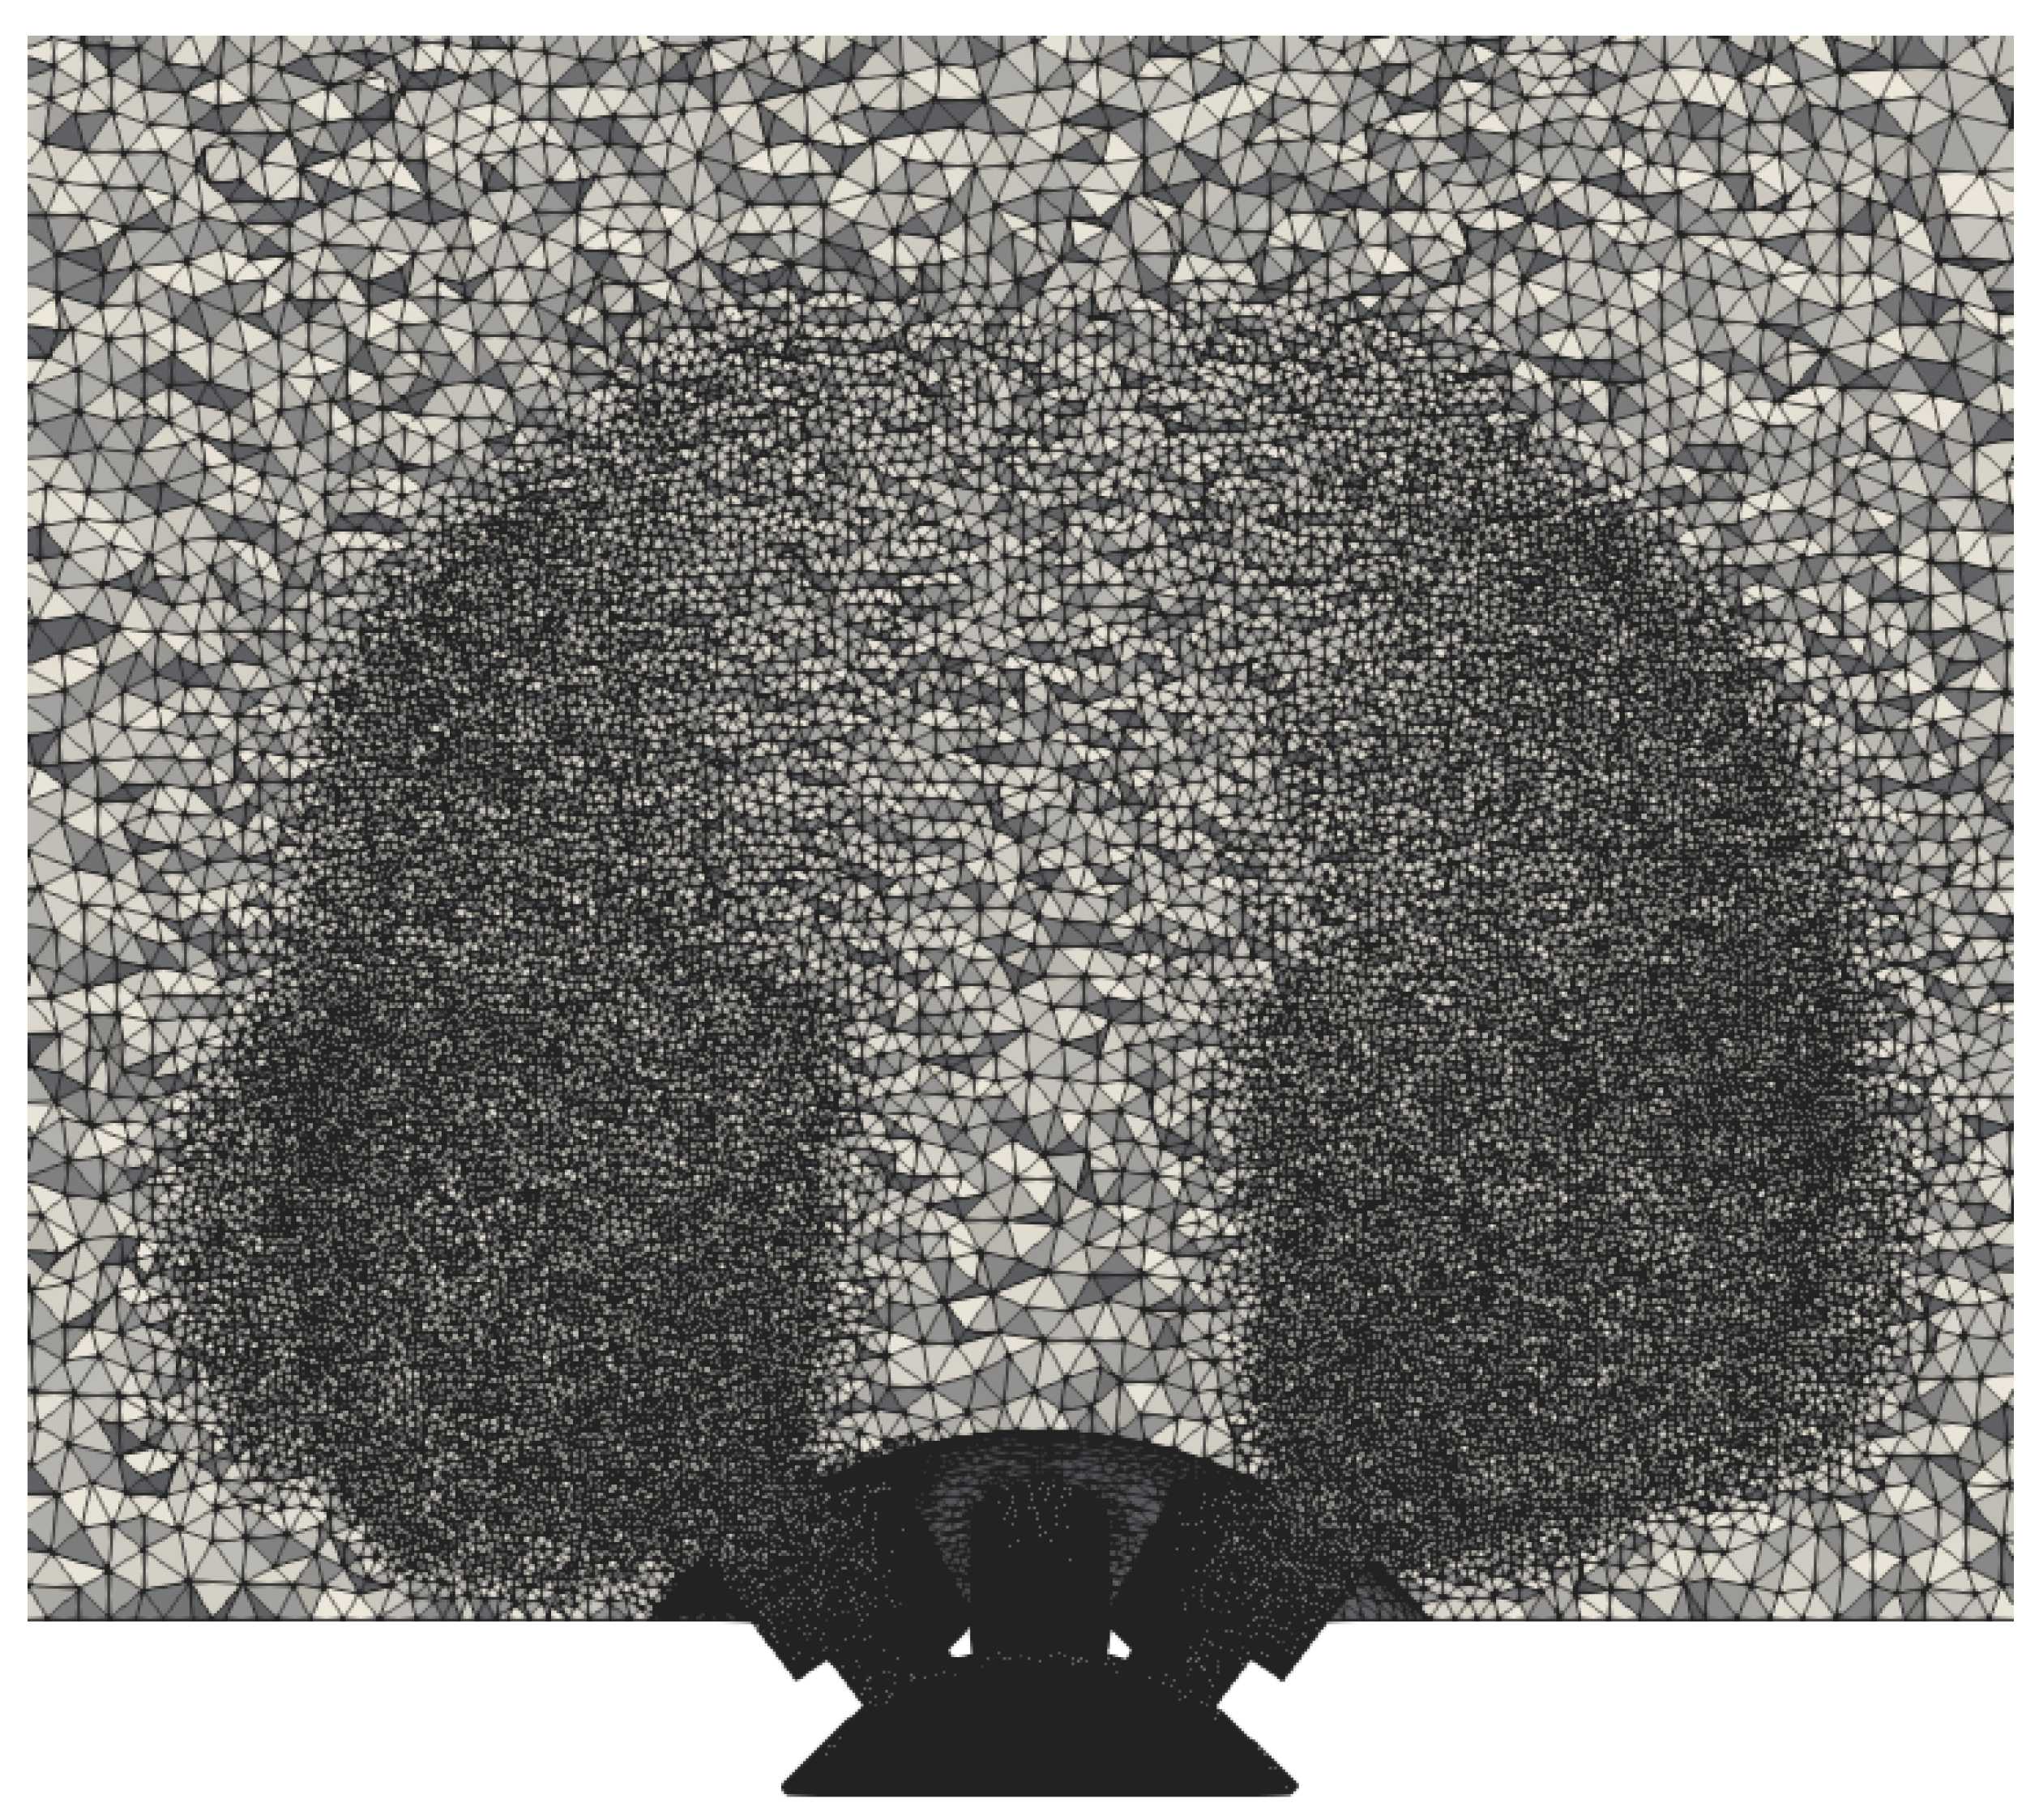
4. Simulation of Eight-Hole Spray G Configuration

In the previous section, the results of the OpenFOAM solver were compared and validated against the CFD code CONVERGE. Then, the solver was applied to three test cases using the spray G configuration defined by the ECN network (see Table 2). The first case was the standard G2 test case, which was only slightly superheated. The two propane cases were taken from Lacey et al. [4] and showed full spray collapse behavior in the experiment.

4.1. Mesh Generation

On the ECN website, a mesh is provided. However, the mesh resolution outside the injector with a cell size greater than 42 μm is too coarse to capture the flashing and shock structures accurately. Further, the domain size of about 7 mm in diameter is too small to include the complete shock structure. Therefore, a new mesh was generated with the automatic grid generator GMSH. This tool has the advantage of smooth mesh gradings as opposed to tools such as snappyHexMesh or cfMesh, which use refinement levels and have a cell size jump at the refinement boundaries. The Frontal–Delaunay meshing algorithm was chosen for 2D and 3D meshing as the advanced Frontal–Delaunay for quads algorithm gave invalid cells [38]. The mesh for the propane cases is displayed in Figure 5, showing that a smooth transition of cell size and refinement in the supersonic region was achieved. Inside the inner bore, where most of the liquid evaporated under fully flashing conditions, the cell size was set to 12.5 μm in accordance with the results of the single-hole injector. The location of the shock position was first approximated by preliminary simulations with a coarse mesh. Subsequent mesh refinement in the regions of interest provided the final grid used to obtain the results presented here. While the complete 3D mesh was used for the two propane cases, the iso-octane case was simulated with only three injectors and a cyclic boundary condition. Due to the relatively low superheat ratio of this case, no spray collapse was expected, and therefore simulating only a segment of the domain was justified.

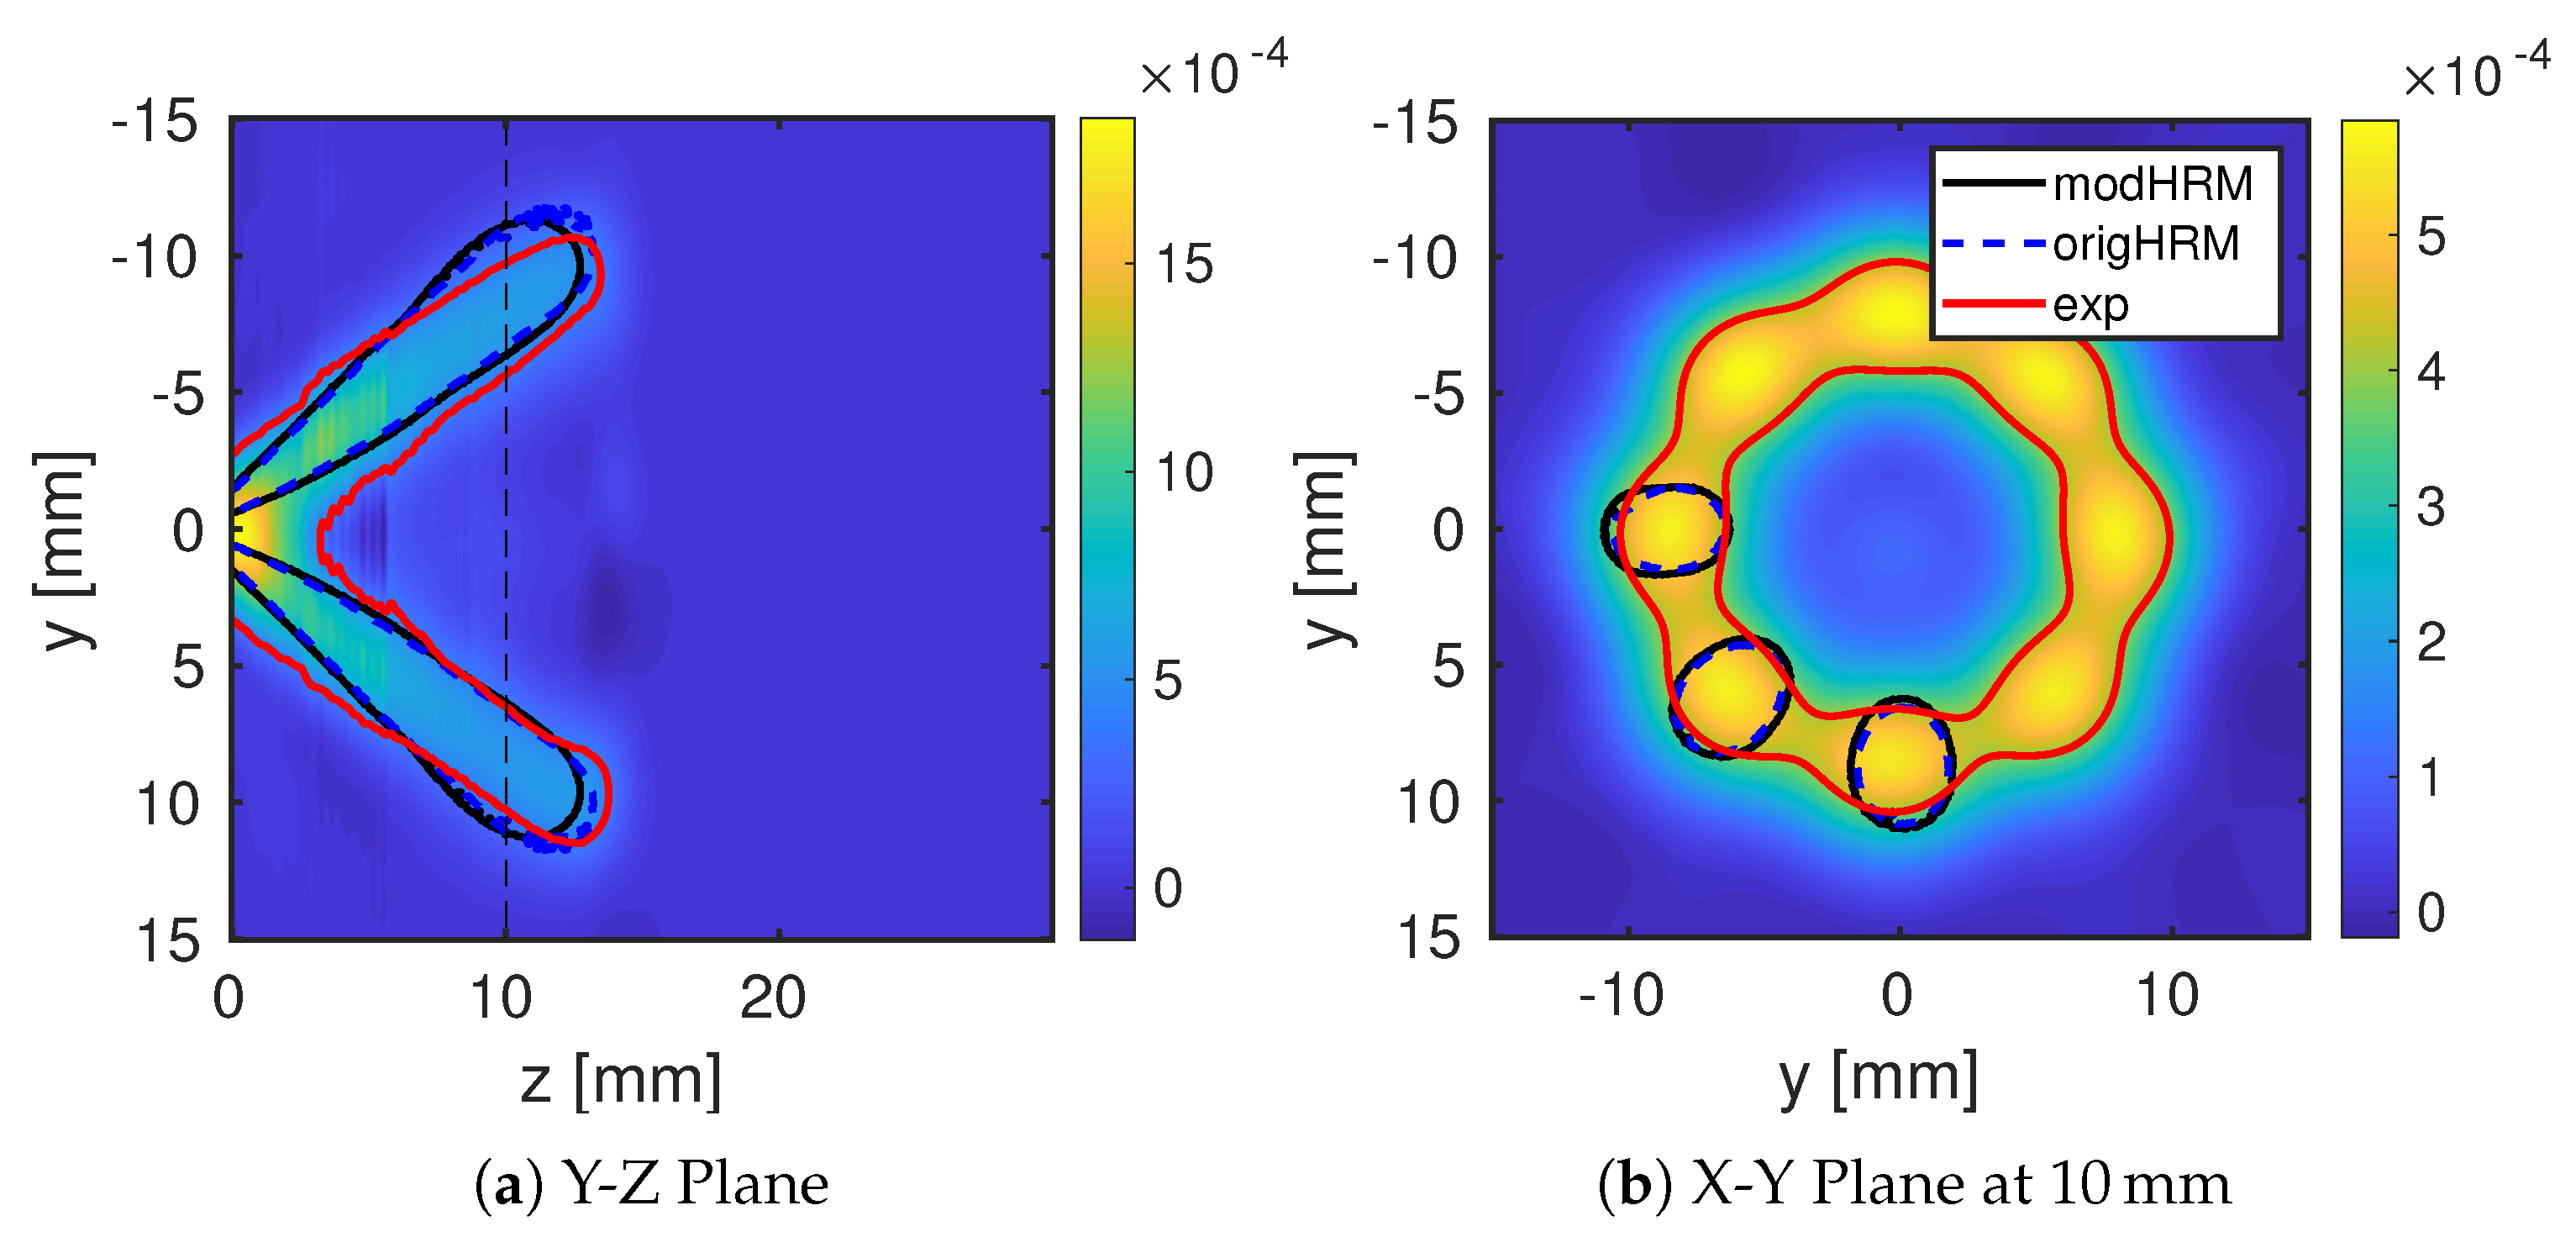
4.2. IsoOctane Case A

Experimental data sets for the case of IsoOctane-A are available on the ECN web page. In the work of Hwang et al. [39], extinction imaging was used together with a tomographic reconstruction to get a 3D image of the projected liquid volume fraction. Figure 6 shows the experimentally measured liquid volume fraction of the experiment at the y–z plane and the x–y plane at 10 mm downstream of the injector. The iso-contour line for a volume fraction of α = 5 × 10⁻⁴ is drawn in red for the experimental data; the simulation results are represented by the blue dotted line using the original HRM model constants and by the black line for the numerical results with the HRM model using the modified constants, Θ 0 = 1   n s .
The cut in the axial y–z plane shows that the liquid penetration length, cone angle and the outer contour were in agreement with the experimental data. Further, the increase of the evaporation rate by adjusting the relaxation time did not significantly change the results. This is in agreement with the findings of Mohapatra et al. [11], who showed that the choice of the evaporation model did not significantly affect the mass flow rate of injection. For the x–y plane, the experimental results indicate that all jets fused into one ring. This is different from the numerical results, which predicted individually detectable plumes. It is difficult to identify a specific reason for this difference. The injection conditions and the resulting subsonic spray correctly prevented spray collapse, while the accurate prediction of spray expansion in the y–z plane suggest ed the accurate modeling of the evaporation rate. A possible cause could be the difference in setup between the experiment and the simulation. In the experiment, the chamber was filled with nitrogen, whereas the simulation assumed a single component solution and sets the gas to iso-octane vapor. However, iso-octane has a density about five times higher than that of nitrogen, which affects the momentum exchange between the spray and the surrounding gas. In addition, the experimental data included some inaccuracies as well. For example, the quality of the data depends on the accuracy of the estimated droplet size, which was assumed to be 7 μm, as measured in the experiments performed at General Motors and Shanghai Jiao Tong University using phase-doppler interferometry (PDI) [40]. However, the experiments were conducted for the spray G configuration and not the evaporating G2 configuration. Further, artifacts in the measurement and reconstruction relatively close to the injector were reported by Hwang et al. [39]. The authors mentioned that no individual plumes were detectable for positions closer than 5 mm. In conclusion a mix of several possible reasons may contribute to the deviation of the simulation results from the experiment in the x–y plane. The matching angle and spreading of the spray in the cross-sectional y–z cut, as well as the comparison of the evaporation model variations, show that the chosen set-up and modeling are generally applicable for the spray G case.

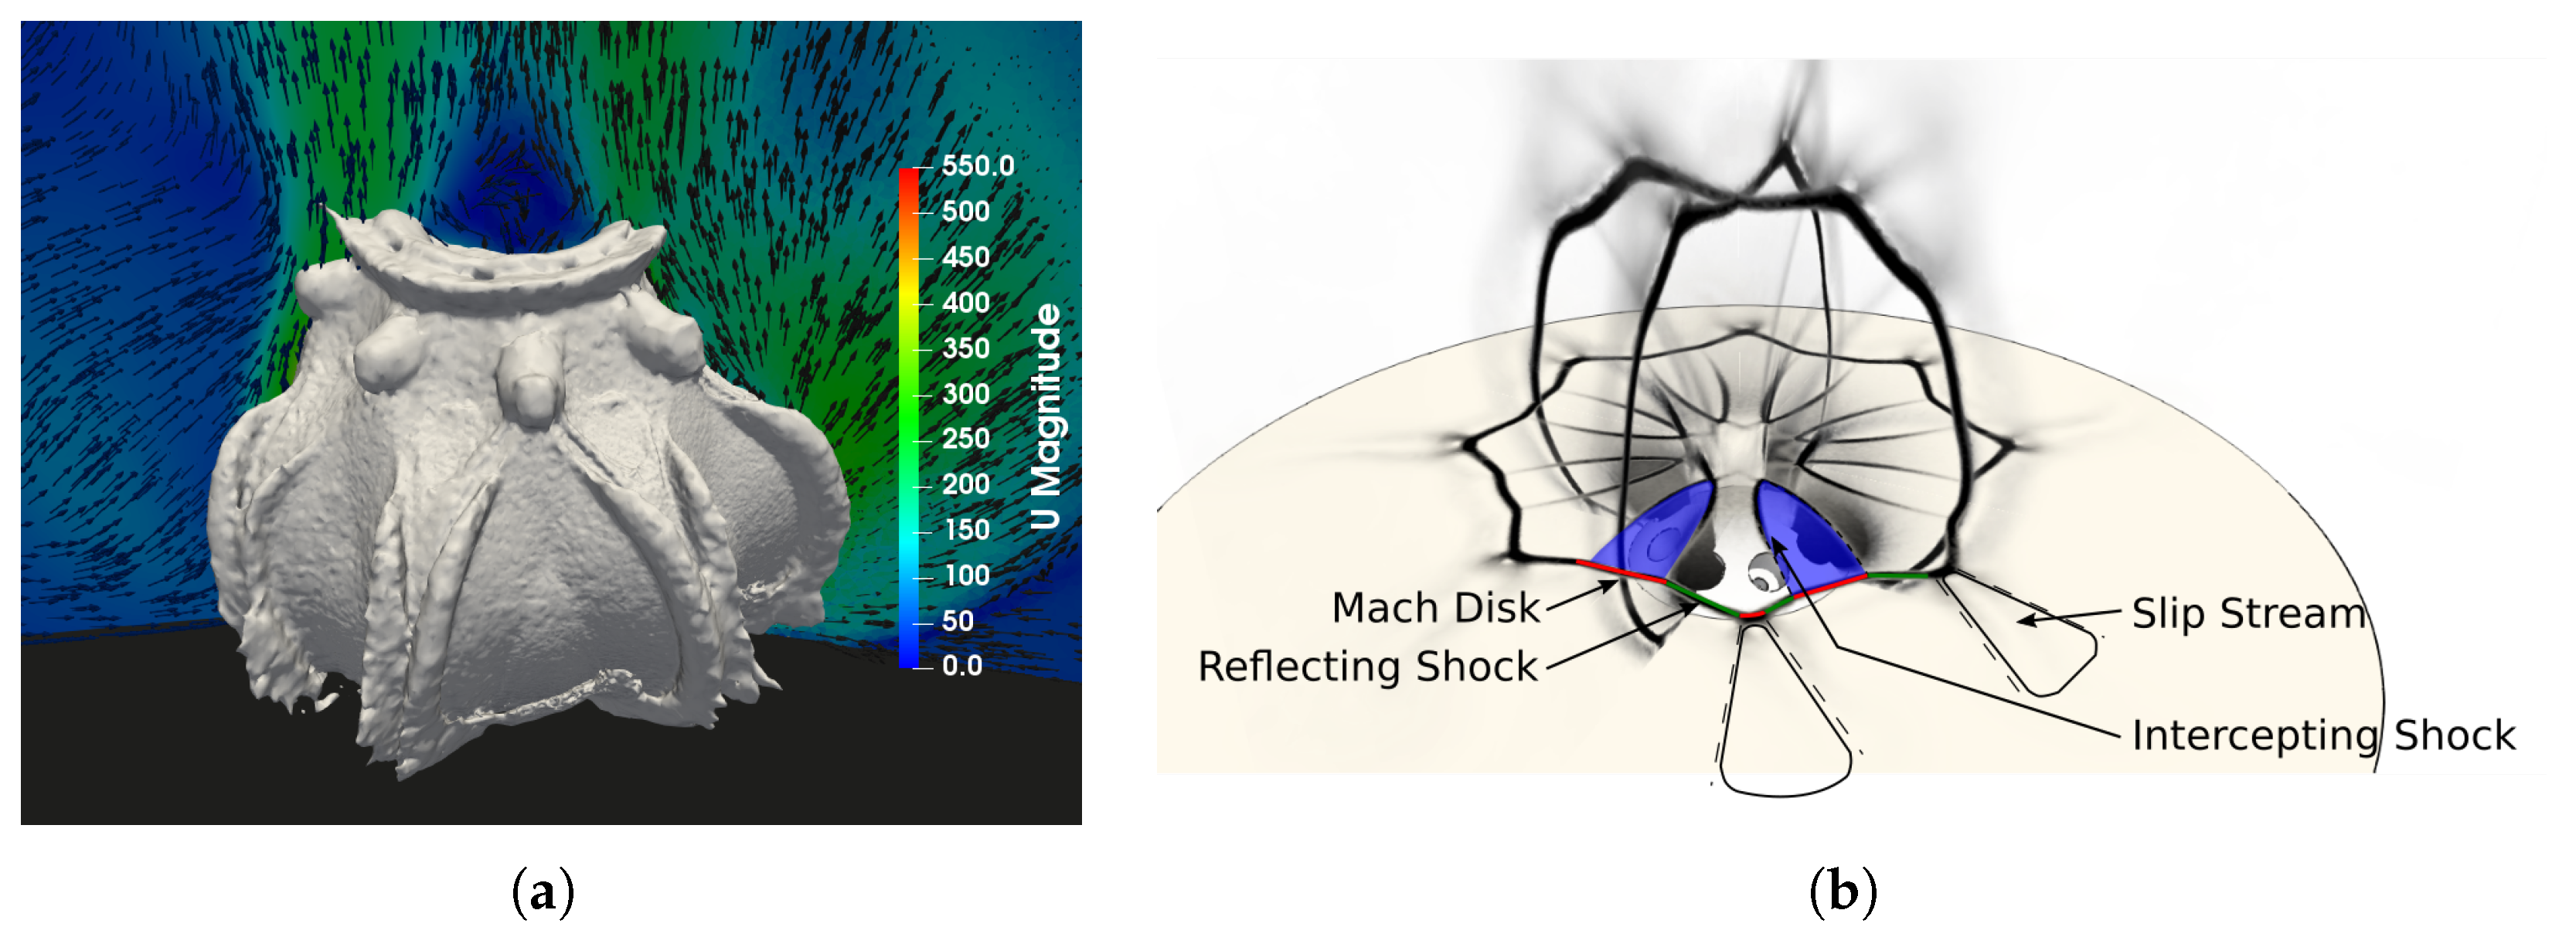
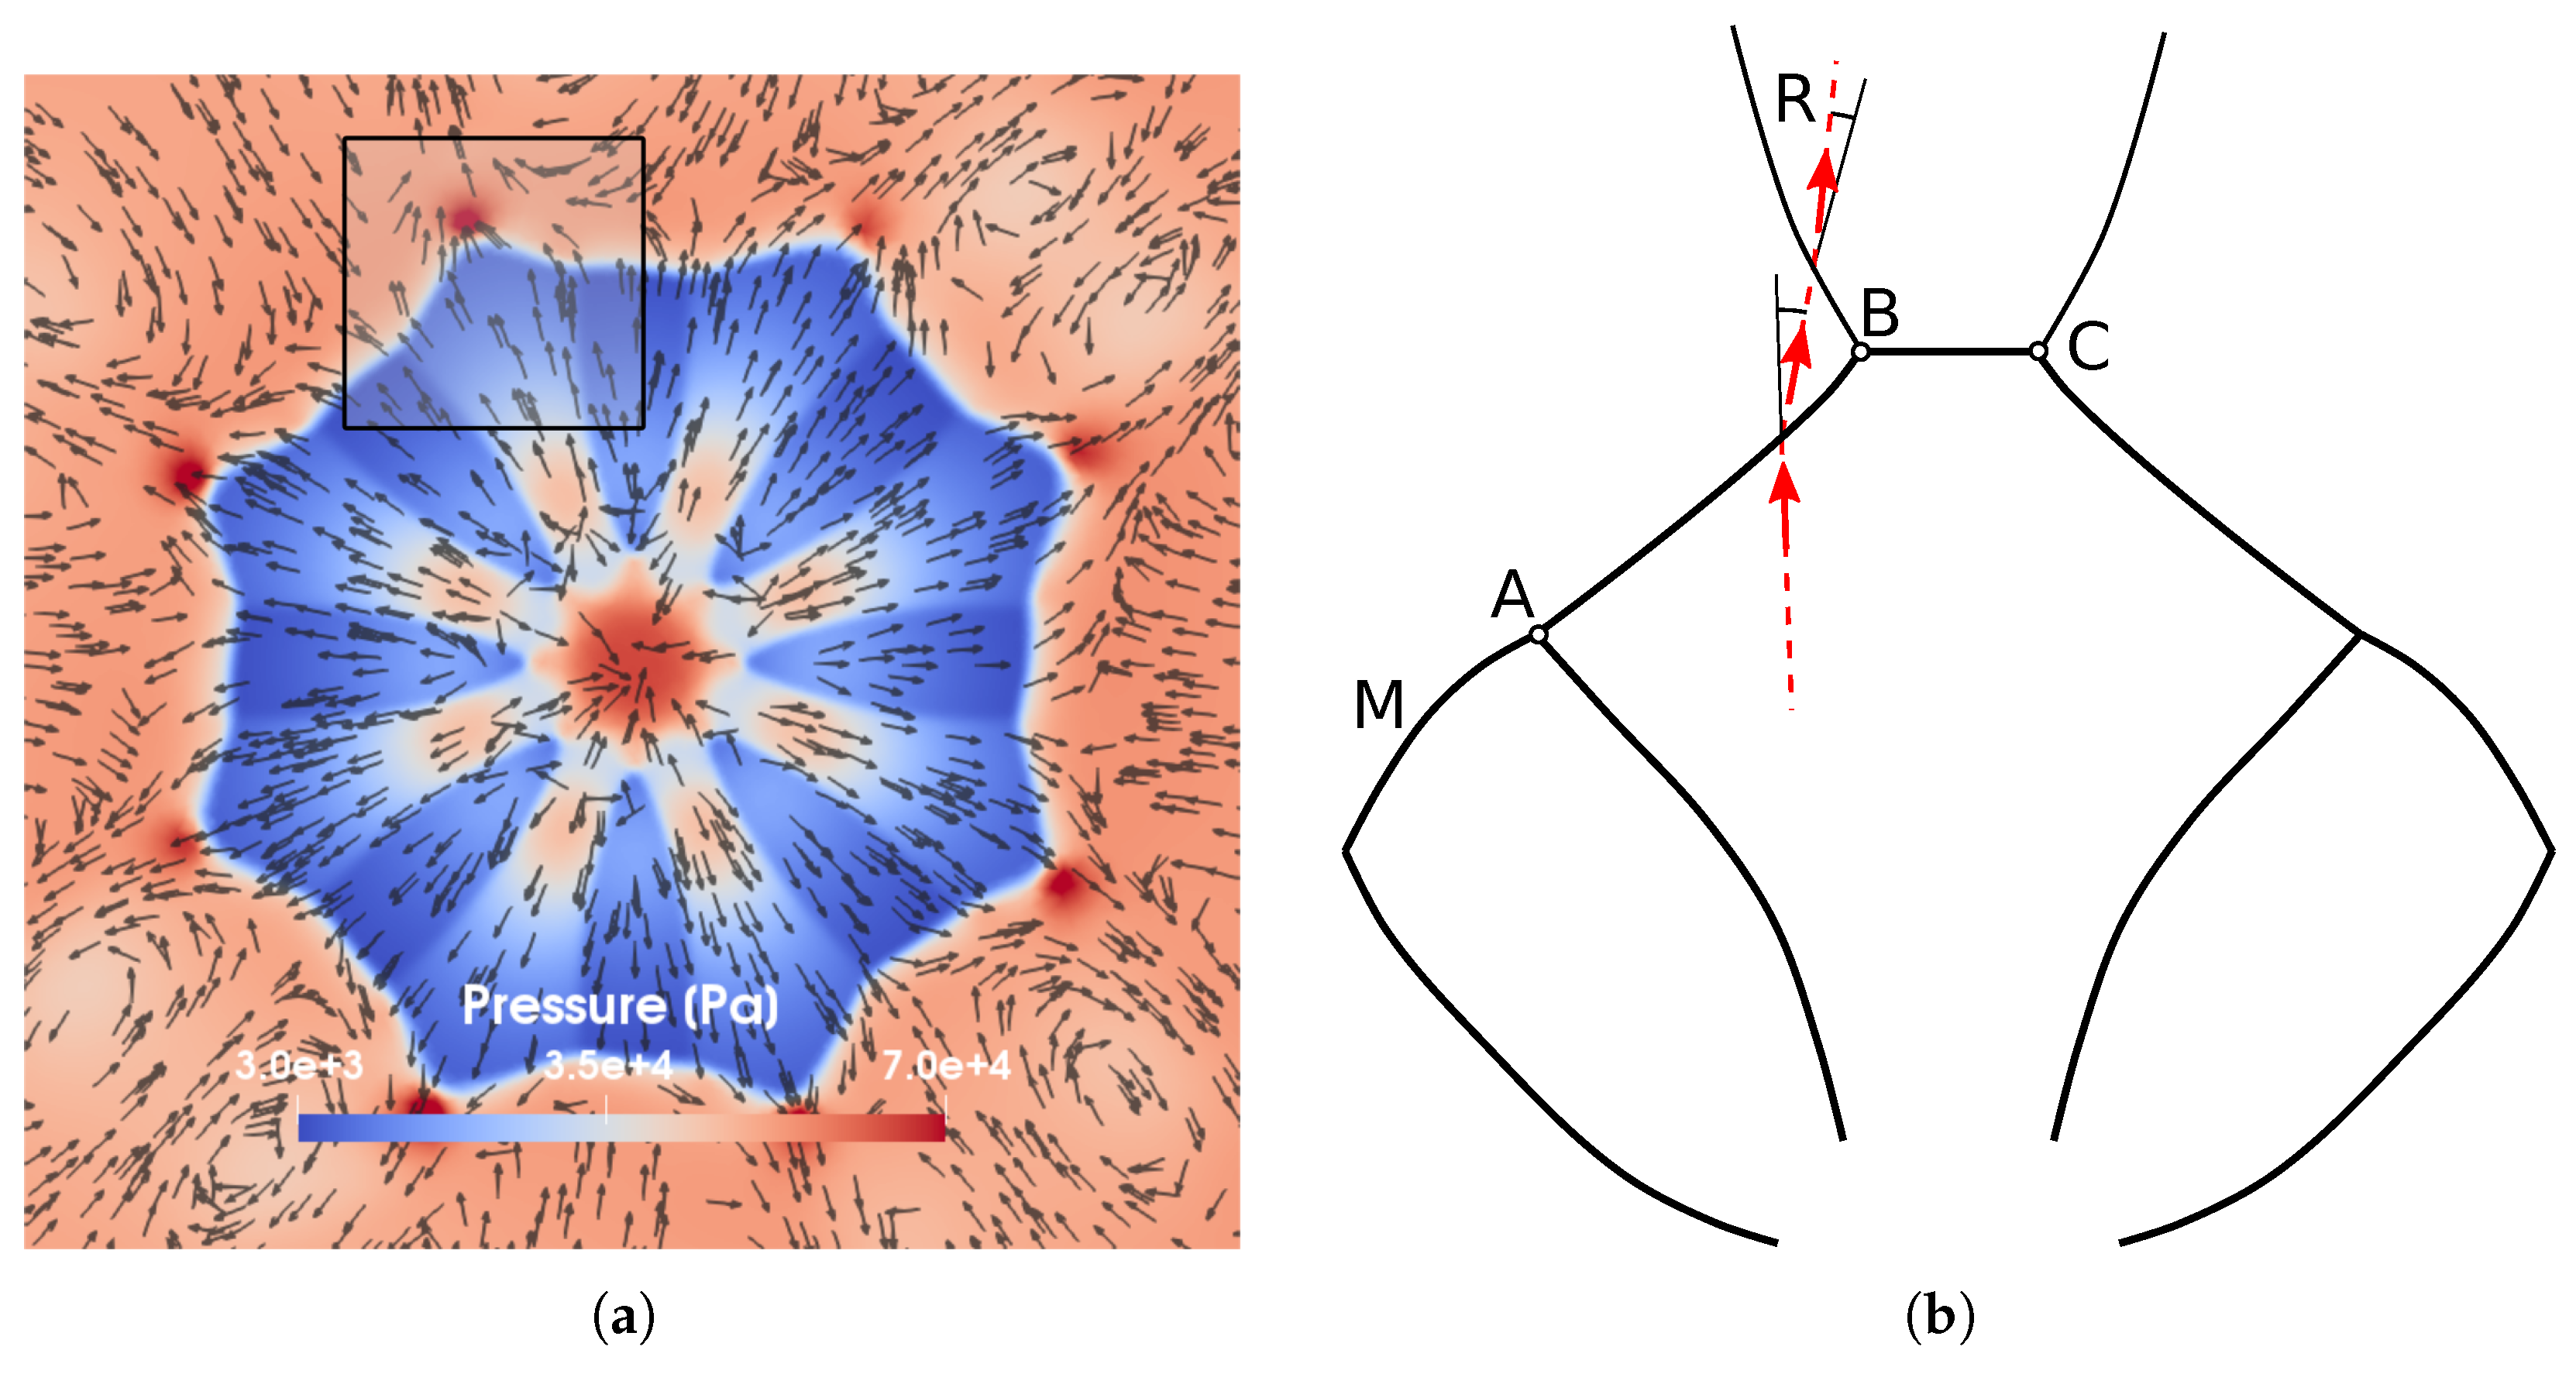
4.3. Spray Collapse Due to Shock Interaction

The two propane cases investigated experimentally exhibited spray collapse behavior, as evident in Lacey et al. [4]. Spray collapse is here defined as a significantly decreased spray angle and increased liquid penetration length compared to a conventional non-flashing spray. This is clearly visible in Figure 7, which shows three cases of flashing propane injection from the experiments [4]. The first case in picture (a) is a slightly superheated spray with an R p of 9.38, which has a wide spray angle and a short liquid penetration length. The second image (b) corresponds to the case of Propane-A of this paper and shows a significantly reduced spray angle as well as an increased liquid penetration length. The last image shows the case of Propane-B with an even further increased liquid penetration length.
In their study, the authors introduced a new criterion for spray collapse due to flashing, called D n . This criterion can be determined analytically with the assumption of a homogeneous equilibrium inside the injector and an isentropic expansion from the liquid fuel in the rail system to the nozzle throat with a succeeding adiabatic but non-isentropic expansion to the chamber pressure. For further details on how to compute the value, readers are referred to Lacey et al. [4]. If the plumes are modeled as stream tubes, the plume diameter, d c , fuel , can be calculated. This plume diameter is then related to a collapse diameter, d collapse , calculated from the pitch circle diameter, d c c , of the injector nozzle holes and the orifice angle Θ , as visualized in Figure 8. Thus, severe spray collapse occurs for cases in which the collapse diameter is equal to or greater than the distance between the nozzles expressed by d collapse ; i.e., D n = d c , fuel / d collapse 1 . In summary, spray collapse occurs if the shocks of opposing plumes touch. In the following section, the spray development of the shock structures and the cause of the spray collapse are numerically investigated for a case slightly below and another case above this threshold, as the experimental techniques do not allow the visualization of the shock structures in fully flashing flows.
The case of Propane-A is studied first, with a value of D n = 0.95 [4]. Figure 9 shows in the left column the development of the velocity magnitude in a central plane at different time steps. Shortly after the start of injection, a shock system with a diamond structure was formed, which is typical for moderately underexpanded jets [37] (see Figure 9a). As the spray developed further and more liquid was transported to the counter bore of the injector, the strength of the evaporation increased and the pressure correspondingly rose, leading to a highly underexpanded jet. The reflected shocks in the perpendicular x–y plane began to interact with neighboring plumes, and the Mach disk shrunk, forming the reflected shock seen in Figure 9b. This created a low-pressure region in the center of the spray, pulling the plumes towards the center. In Figure 9c, the reflected shocks of the opposing plumes came close to each other but did not merge into one central Mach disk as was expected due to the analytical threshold value. However, the superheat was high enough that the spray angle collapsed and the liquid penetration length increased compared to the non-collapsed case in Figure 7a. The increase in liquid penetration length can be explained by the altered focus of the major mass flow and thus the momentum along the centerline in the axial direction.
The second case, Propane-B, had a lower chamber pressure and thus a higher superheat. As a result, stronger shocks and a faster development of the spray collapse were expected. This can be seen in the right column of Figure 9, which shows the velocity magnitude development for this case. In Figure 9e, after 20 μs, the spray was already in a highly underexpanded state and corresponded to the situation in Figure 9b of case A at 100 μs. Figure 9f marks the beginning of the spray collapse, when the reflecting shocks of the opposing plumes began to form. In comparison to the case of Propane-A, the reflected shocks in Figure 9g began to interact and merge into one new Mach disk, pulling the plumes even closer together. The final steady state, with a Mach disk in the center of the spray, is depicted in Figure 9h. The liquid penetration length of case Propane-B was even further increased in the experiment compared to the case of Propane-A, which can be explained by the reduced spray diameter, the faster formation of the shock structure and thus the further focusing of the momentum along the centerline of the spray. Therefore, the criterion of D n 1 for severe spray collapse can be seen as a sufficient but not necessary measure to predict spray collapse. These findings are supported by the results of Guo et al. [14]. There, a case similar to Propane-B was simulated, featuring the same level of superheat R p but a much lower injection pressure. In this case, the spray showed shock structures of a highly underexpanded jet without the merging of the reflective shocks or a central Mach disk, while still resulting in spray collapse.
Figure 10 shows the pressure development up to 150 μs. In Figure 10a, it can be seen that the initial shock structure of a moderately underexpanded jet began to form a reflected shock. Here, one pressure cell can be identified, as for single-hole injectors. With increasing time, a second pressure cell with a slightly higher pressure than the first cell formed out of the reflected shocks and the expansion fan. This is in accordance with the findings of Guo et al. [5] for a two-hole injector. Figure 10c shows the onset of the shock merging in the center to form a third pressure cell and with it the Mach disk. This is different to the results for the two-hole injector, in which only two pressure cells were found that had originated from the merging of the reflected shocks.
In conclusion, the prediction of merging shocks of opposing plumes using D n is corroborated. However, D n 1 cannot be understood as providing a strict limit, as both cases show spray collapse behavior despite being below and above this threshold. It should be noted that the evaporation rates and thus jet expansion predicted by the HRM approach greatly depend on the relaxation times, which in turn are given by the HRM coefficients. The latter have not been further investigated, therefore adding some uncertainty to the numerical results. These constraints in the interpretation of our results should be considered in the light of the experimental study by Poursadegh et al. [16] who showed that spray collapse was found for a D n as low as 0.8, thus supporting the claim that D n 1 is a useful estimate but not a unique threshold value. The faster merging and reduced spray diameter of the spray for the second case can explain the increased liquid penetration length. However, the description here with the pressure cells is a two-dimensional view only. While the central pressure cell with the Mach disk is common to all injectors, the other two cells are present for each injector and also form more cells between two neighboring injectors.

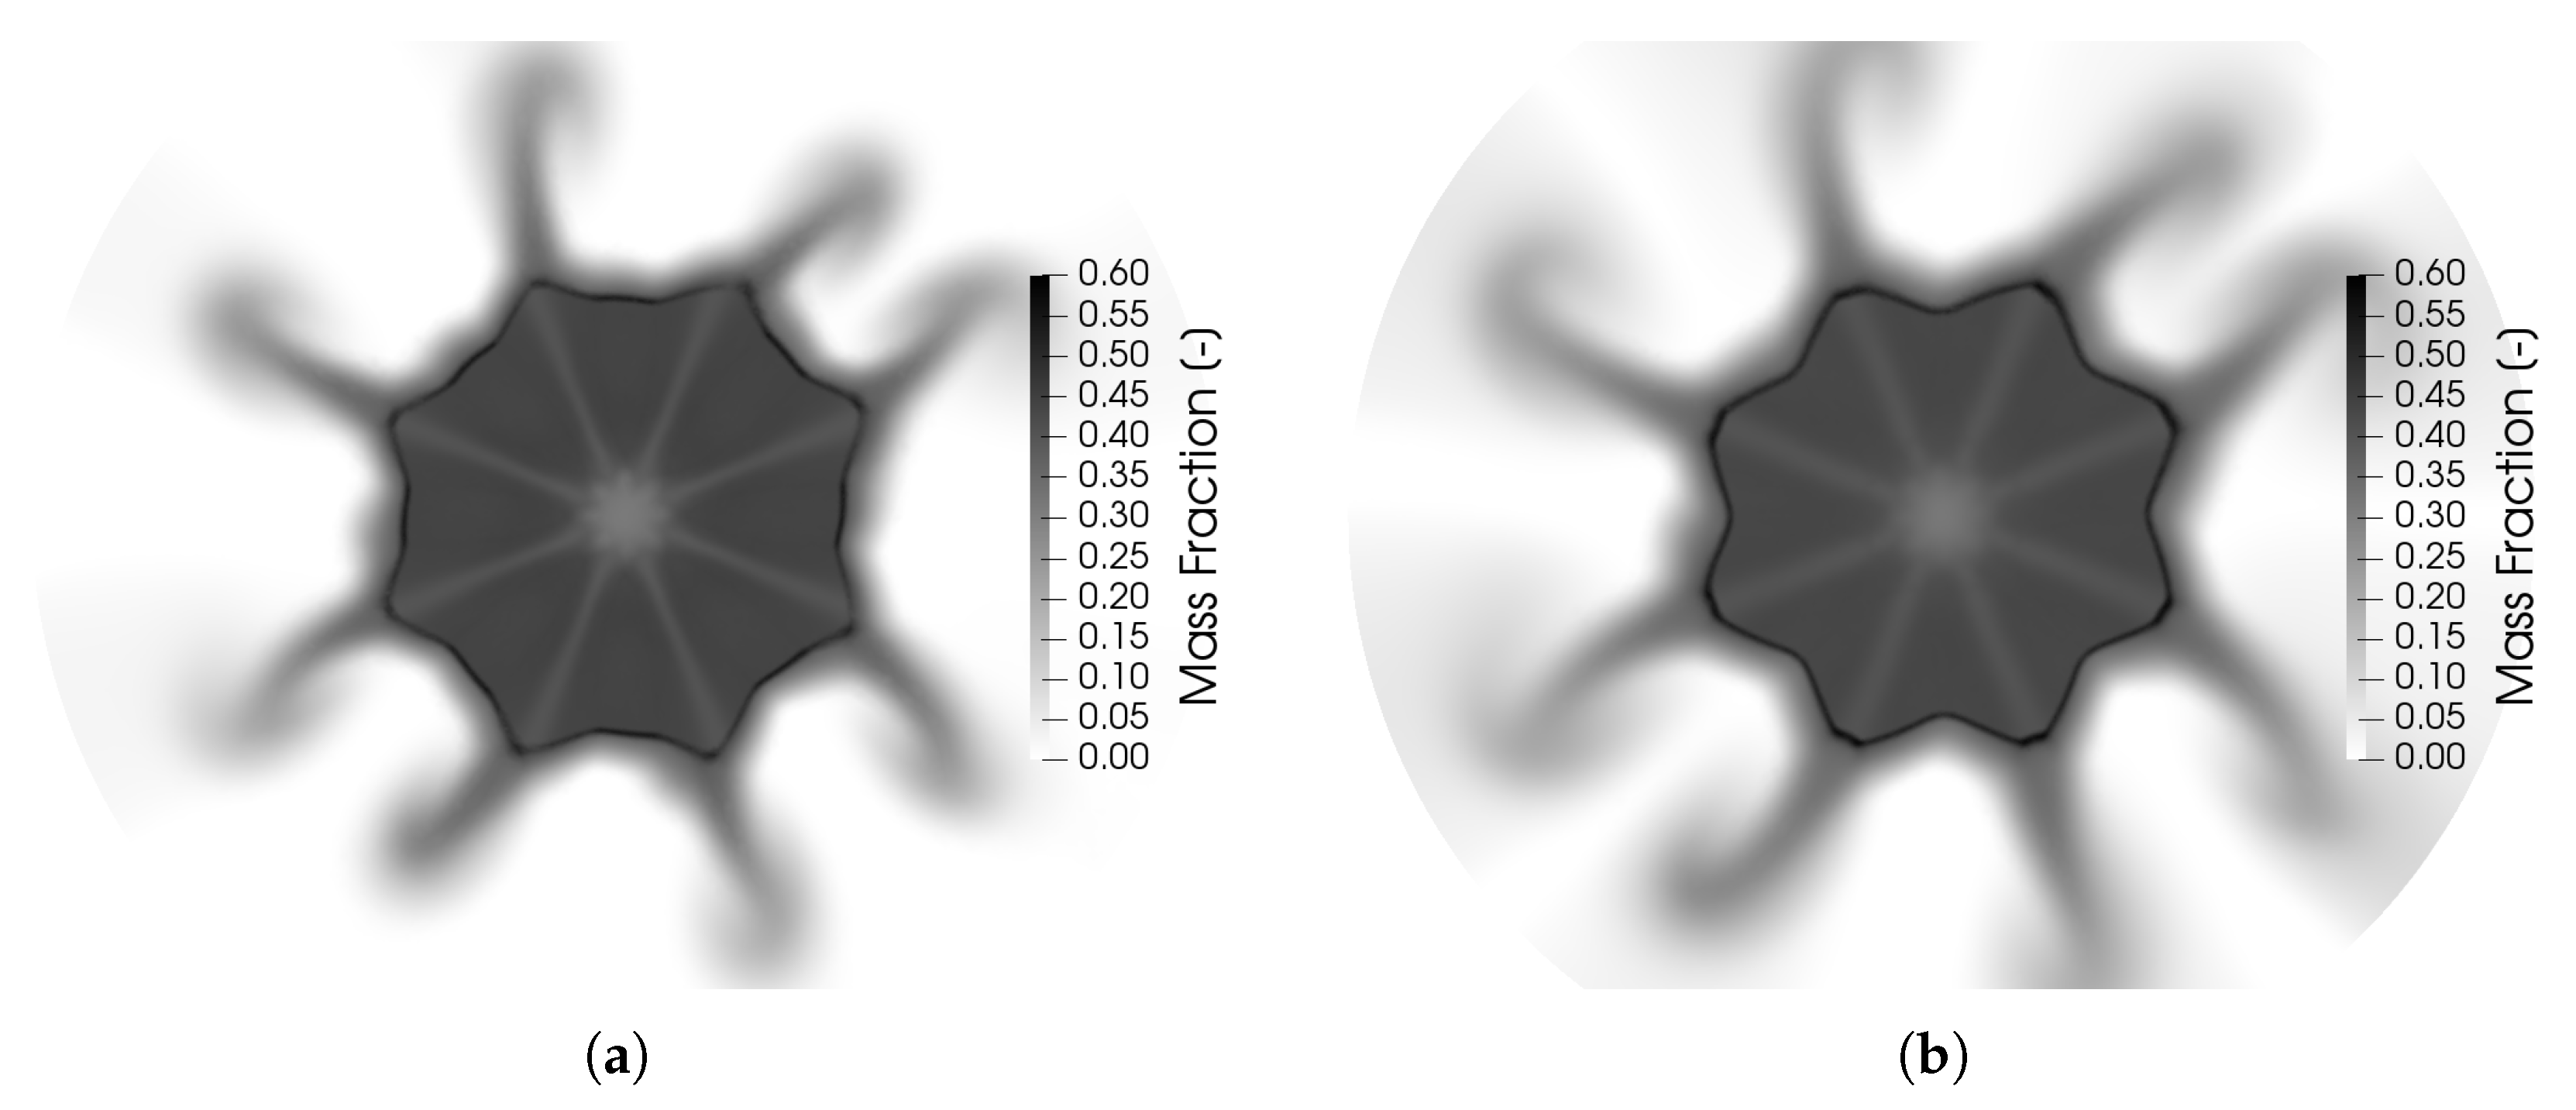
4.4. Shock Interaction of Neighboring Plumes

The highly three-dimensional structure of the shock system is apparent in Figure 11a. It shows the strong interaction between neighboring plumes and the resulting reflected shocks, as well as the slip stream between two injectors. To visualize the shock structure inside the spray, Figure 11b shows the density gradient at a cross-sectional plane 0.65 mm above the injector and at the x–z and y–z planes. The first pressure cell of Figure 10c is shown in light blue. Further, the three-dimensional view shows that the low-pressure cell that formed in the center of the spray was shielded from the ambient conditions by the merging of the reflected shocks of neighboring injectors. This formed a closed shock front around the low-pressure core, providing a suitable explanation as. to why spray collapse occurred even though case Propane-A had a value of D n below one. Therefore, these results support the findings of Guo et al. [14] who stated that spray collapse occurs if the shock structures of neighboring plumes interact, merge and thus isolate the low-pressure cell in the center of the spray from the ambient conditions. A possible modification of D n to include this information could be to relate the fuel expansion diameter d c , fuel not to the distance of opposing plumes but to that of neighboring plumes instead. However, the modification and successful validation of this parameter is beyond the scope of this work.
The intercepting shocks of neighboring plumes lead to a compression of the flow between two injector holes and thus a higher pressure, as shown in Figure 12a. A sketch of the shock system is shown in Figure 12b. It shows the Mach disk of the shock system of each injector, marked with M, the incident shock AB and the resulting Mach stem BC as well as the reflective shock R. The change in the flow direction through the incident shock AB is also visible in the velocity vectors of Figure 13. The flow through the Mach disk, M, changes mainly in the axial direction, which is perpendicular to the observed plane and thus not visible. However, in the 3D view of Figure 11a, the change is clearly visible on the left side. In contrast, the flow through the Mach stem and the slip stream are not directed axially. The resulting mass flux is clearly visible in the mass fraction contour plots of Figure 13, forming radially stretched fingers. The curling of the flow at the end of these fingers is due to the large velocity gradients between the slip stream and the surrounding flow, which form Kelvin–Helmholtz instabilities. To conclude, the shock wave system can explain the radial profiles that have been observed in experiments of Zhang et al. [41]. Despite these radial streams, most of the mass is directed into the axial direction and focused into a rather narrow region on the centerline, therefore leading to the increased liquid penetration length.

5. Conclusions and Outlook

In this work, severe spray collapse due to flashing was investigated numerically for single and multi-hole injectors with different fluids. The numerical solver was based on OpenFOAM, and its suitability for predicting injection processes under conditions relevant for direct injection gasoline engines was demonstrated. The solver was validated by the comparison of predictions of fully flashing n-hexane sprays in a single-hole injector with simulations by Guo et al. [21], who used the commercial CFD software CONVERGE. The comparison of the two solvers showed that the OpenFOAM solver can reproduce the results if inlet conditions are matched. Varying the chamber pressure and injection temperature showed that the position of the Mach disk was mainly determined by the chamber pressure, whereas the increase of velocity and also the extension of the shock wave was predominantly set by the injection temperature. Therefore, the value R p , which is typically used to describe flashing, could not be used here to unambiguously describe the behavior of the jet or later spray collapse. To investigate the shock interaction of both the opposing plumes and also the three-dimensional effect caused by neighboring injector holes, the spray G configuration of ECN was analyzed. Here, three cases were studied: first, the standard G2 case with slightly superheated iso-octane; second, two propane cases which showed severe spray collapse behavior. The simulation results of the G2 spray were compared with extinction imaging, showing that the general trend was matched [39]. Deviations from the experimental results were found in the x–y plane perpendicular to the spray axis. In the experiments, the results showed that the eight plumes formed a ring structure, whereas the simulation predicted individual plumes. This was possibly due to the simplified numerical setup, as the simulation used iso-octane throughout the domain, in contrast to the experiment, in which the chamber was filled with nitrogen; however, this does not affect the interpretation of spray dynamics due to shock structures.
As the superheat ratio R p cannot give a criterion for spray collapse, a new characteristic number, D n , was proposed by Lacey et al. [4]. The first propane case results, for Propane-A, showed that the reflected shocks of opposing plumes did not merge as would be expected, since the value of D n of 0.95 was below the threshold value of 1.0. In the second case with a D n of 1.27, the reflected shocks of opposing plumes interacted and merged into one central Mach disk. Thus, the shock structures of the two propane cases showed the expected behavior indicated by the characteristic number D n . Our results support the findings of Guo et al. [14]; i.e., that the merging of the reflected shocks due to the underexpanded vapor jet causes the collapse of the spray, by shielding the low-pressure cell in the center of the spray from the ambient conditions. Thus, D n 1 can be seen as a good estimate but not a necessary criterion for spray collapse. This result is supported by the experimental investigation of Poursadegh et al. [16], where spray collapse occurred for values of D n below 1.0. Further, the spray patterns and the radially squeezed-out fluid are in agreement with experimental results.
In conclusion, the proposed idea of the interaction of underexpanded vapor jet plumes of opposing injector holes was numerically supported. Further, the finding of Guo et al. [14] that an isolated low-pressure region in the center of the spray causes spray collapse was confirmed by the results of the propane cases. Further investigations of the flow behind the shock system would be required to get a holistic view of the spray behavior and to give a quantitative prediction of the liquid penetration length. In addition, future work may investigate the transition of the spray towards spray collapse, as the new characteristic number, D n , can be seen as a sufficient but not necessary criterion to predict spray collapse.

Author Contributions

Conceptualization, J.W.G. and A.K.; methodology, J.W.G., Y.F. and A.K.; software, J.W.G.; validation, J.W.G. and Y.F.; formal analysis, J.W.G. and Y.F.; investigation, J.W.G. and Y.F.; resources, A.K.; data curation, J.W.G.; writing—original draft preparation, J.W.G.; writing—review and editing, A.K. and O.T.S.; visualization, J.W.G.; supervision, A.K. and O.T.S.; project administration, A.K. and O.T.S.; funding acquisition, A.K. All authors have read and agreed to the published version of the manuscript.

Funding

The project is funded by the collaborative research center SFB-TRR75, Project number 84292822 and supported by the supercomputer forHLR funded by the Ministry of Science, Research and the Arts of Baden-Württemberg and by the Federal Ministry of Education and Research.

Institutional Review Board Statement

Not applicable.

Informed Consent Statement

Not applicable.

Data Availability Statement

The data and numerical tools presented in this study are available on reasonable request from the corresponding author.

Acknowledgments

The authors thank the German Research Foundation (DFG) for financial support of the project within the collaborative research center SFB-TRR 75, Project number 84292822. The authors also are grateful for the access to the supercomputer ForHLR funded by the Ministry of Science, Research and the Arts Baden-Württemberg and by the Federal Ministry of Education and Research.

Conflicts of Interest

The authors declare no conflict of interest.

References

  1. Zhao, F.; Lai, M.C.; Harrington, D.L. Automotive spark-ignited direct-injection gasoline engines. Prog. Energy Combust. Sci. 1999, 25, 437–562. [Google Scholar] [CrossRef]
  2. Zeng, W.; Xu, M.; Zhang, G.; Zhang, Y.; Cleary, D.J. Atomization and vaporization for flash-boiling multi-hole sprays with alcohol fuels. Fuel 2012, 95, 287–297. [Google Scholar] [CrossRef]
  3. Montanaro, A.; Allocca, L. Flash Boiling Evidences of a Multi-Hole GDI Spray under Engine Conditions by Mie-Scattering Measurements. SAE Tech. Pap. 2015. [Google Scholar] [CrossRef]
  4. Lacey, J.; Poursadegh, F.; Brear, M.J.; Gordon, R.; Petersen, P.; Lakey, C.; Butcher, B.; Ryan, S. Generalizing the behavior of flash-boiling, plume interaction and spray collapse for multi-hole, direct injection. Fuel 2017, 200, 345–356. [Google Scholar] [CrossRef]
  5. Guo, H.; Li, Y.; Xu, H.; Shuai, S.; Zhang, H. Interaction between under-expanded flashing jets: A numerical study. Int. J. Heat Mass Transf. 2019, 137, 990–1000. [Google Scholar] [CrossRef]
  6. Weber, D.; Leick, P. Structure and Velocity Field of Individual Plumes of Flashing Gasoline Direct Injection Sprays. In Proceedings of the ILASS Europe, 26th Annual Conference on Liquid Atomization and Spray Systems, Bremen, Germany, 8–10 September 2014. [Google Scholar] [CrossRef]
  7. Payri, R.; Salvador, F.J.; Martí-Aldaraví, P.; Vaquerizo, D. ECN Spray G external spray visualization and spray collapse description through penetration and morphology analysis. Appl. Therm. Eng. 2017, 112, 304–316. [Google Scholar] [CrossRef]
  8. Saha, K.; Som, S.; Battistoni, M.; Li, Y.; Pomraning, E.; Senecal, P.K. Numerical Investigation of Two-Phase Flow Evolution of In- and Near-Nozzle Regions of a Gasoline Direct Injection Engine During Needle Transients. SAE Int. J. Engines 2016, 9, 1230–1240. [Google Scholar] [CrossRef]
  9. Rachakonda, S.K.; Wang, Y.; Schmidt, D. Flash-Boiling Initialization for Spray Simulations Based on Parametric Studies. At. Sprays 2018, 28. [Google Scholar] [CrossRef]
  10. Devassy, B.; Benković, D.; Petranovic, Z.; Edelbauer, W.; Vujanovic, M. Numerical Simulation of Internal Flashing in a GDI Injector Nozzle. In Proceedings of the 29th European Conference on Liquid Atomization and Spray Systems, Paris, France, 2–4 September 2019. [Google Scholar]
  11. Mohapatra, C.K.; Schmidt, D.P.; Sforozo, B.A.; Matusik, K.E.; Yue, Z.; Powell, C.F.; Som, S.; Mohan, B.; Im, H.G.; Badra, J.; et al. Collaborative investigation of the internal flow and near-nozzle flow of an eight-hole gasoline injector (Engine Combustion Network Spray G). Int. J. Engine Res. 2020. [Google Scholar] [CrossRef]
  12. Saha, K.; Som, S.; Battistoni, M. Investigation of Homogeneous Relaxation Model Parameters and their Implications for Gasoline Injectors. At. Sprays 2017, 27, 345–365. [Google Scholar] [CrossRef]
  13. Downar-Zapolski, P.; Bilicki, Z.; Bolle, L.; Franco, J. The non-equilibrium relaxation model for one-dimensional flashing liquid flow. Int. J. Multiph. Flow 1996, 22, 473–483. [Google Scholar] [CrossRef]
  14. Guo, H.; Nocivelli, L.; Torelli, R. Numerical study on spray collapse process of ECN spray G injector under flash boiling conditions. Fuel 2021, 290, 119961. [Google Scholar] [CrossRef]
  15. Guo, H.; Nocivelli, L.; Torelli, R.; Som, S. Towards understanding the development and characteristics of under-expanded flash boiling jets. Int. J. Multiph. Flow 2020, 129, 103315. [Google Scholar] [CrossRef]
  16. Poursadegh, F.; Lacey, J.S.; Brear, M.J.; Gordon, R.L.; Petersen, P.; Lakey, C.; Butcher, B.; Ryan, S.; Kramer, U. On the phase and structural variability of directly injected propane at spark ignition engine conditions. Fuel 2018, 222, 294–306. [Google Scholar] [CrossRef]
  17. Lamanna, G.; Kamoun, H.; Weigand, B.; Steelant, J. Towards a unified treatment of fully flashing sprays. Int. J. Multiph. Flow 2014, 58, 168–184. [Google Scholar] [CrossRef]
  18. Gärtner, J.W.; Kronenburg, A.; Rees, A.; Sender, J.; Oschwald, M.; Lamanna, G. Numerical and experimental analysis of flashing cryogenic nitrogen. Int. J. Multiph. Flow 2020, 130, 103360. [Google Scholar] [CrossRef]
  19. Rachakonda, S.K.; Paydarfar, A.; Schmidt, D.P. Prediction of spray collapse in multi-hole gasoline direct-injection fuel injectors. Int. J. Engine Res. 2019, 20, 18–33. [Google Scholar] [CrossRef]
  20. The OpenFOAM Foundation Ltd. OpenFOAM. 2021. Available online: https://openfoam.org/ (accessed on 16 February 2021).
  21. Guo, H.; Li, Y.; Wang, B.; Zhang, H.; Xu, H. Numerical investigation on flashing jet behaviors of single-hole GDI injector. Int. J. Heat Mass Transf. 2019, 130, 50–59. [Google Scholar] [CrossRef]
  22. Gärtner, J.W.; Rees, A.; Kronenburg, A.; Sender, J.; Oschwald, M.; Loureiro, D. Large Eddy Simulation of Flashing Cryogenic Liquid with a Compressible Volume of Fluid Solver. In Proceedings of the 29th European Conference on Liquid Atomization and Spray Systems, Paris, France, 2–4 September 2019. [Google Scholar]
  23. Neroorkar, K.; Gopalakrishnan, S.; Grover, R.O., Jr.; Schmidt, D. Simulation of flash boiling in pressure swirl injectors. At. Sprays 2011, 21, 179–188. [Google Scholar] [CrossRef]
  24. Schmidt, D.; Gopalakrishnan, S.; Jasak, H. Multidimensional simulation of thermal non-equilibrium channel flow. Int. J. Multiph. Flow 2010, 36, 284–292. [Google Scholar] [CrossRef]
  25. Lyras, K.; Dembele, S.; Wen, J.X. Numerical simulation of flashing jets atomisation using a unified approach. Int. J. Multiph. Flow 2018, 113. [Google Scholar] [CrossRef] [Green Version]
  26. Lyras, K.; Dembele, S.; Vyazmina, E.; Jallais, S.; Wen, J. Numerical simulation of flash-boiling through sharp-edged orifices. Int. J. Comput. Methods Exp. Meas. 2017, 6, 176–185. [Google Scholar] [CrossRef] [Green Version]
  27. Saha, K.; Quan, S.; Battistoni, M.; Som, S.; Senecal, P.K.; Pomraning, E. Coupled Eulerian Internal Nozzle Flow and Lagrangian Spray Simulations for GDI Systems. SAE Tech. Pap. 2017. [Google Scholar] [CrossRef]
  28. Befrui, B.; Corbinelli, G.; Spiekermann, P.; Shost, M.; Lai, M.C. Large Eddy Simulation of GDI Single-Hole Flow and Near-Field Spray. SAE Int. J. Fuels Lubr. 2012, 5, 620–636. [Google Scholar] [CrossRef]
  29. Sher, E.; Bar-Kohany, T.; Rashkovan, A. Flash-boiling atomization. Prog. Energy Combust. Sci. 2008, 34, 417–439. [Google Scholar] [CrossRef]
  30. Witlox, H.; Harper, M.; Bowen, P.; Cleary, V. Flashing liquid jets and two-phase droplet dispersion: II. Comparison and validation of droplet size and rainout formulations. J. Hazard. Mater. 2007, 142, 797–809. [Google Scholar] [CrossRef] [PubMed]
  31. Persad, A.H.; Ward, C.A. Expressions for the Evaporation and Condensation Coefficients in the Hertz-Knudsen Relation. Chem. Rev. 2016, 116, 7727–7767. [Google Scholar] [CrossRef] [PubMed]
  32. Schmidt, D.P.; Rakshit, S.; Neroorkar, K. Thermal and inertial equilibrium in small, high-speed, cavitating nozzle simulations. In Proceedings of the 11th International Annual Conference on Liquid Atomization and Spray Systems 2009, ICLASS 2009, Vail, CO, USA, 26–30 July 2009. [Google Scholar]
  33. Richards, K.J.; Senecal, P.K.; Pomraning, E. CONVERGE 2.3. Converg. Sci. 2020. [Google Scholar]
  34. Ducros, F.; Ferrand, V.; Nicoud, F.; Weber, C.; Darracq, D.; Gacherieu, C.; Poinsot, T. Large-eddy simulation of the shock/turbulence interaction. J. Comput. Phys. 1999, 152, 517–549. [Google Scholar] [CrossRef]
  35. Feng, Y. Numerical Investigation of GDI Injectors and Shock Interactions. Ph.D. Thesis, University of Stuttgart, Stuttgart, Germany, 2020. [Google Scholar]
  36. Saha, K.; Som, S.; Battistoni, M.; Li, Y.; Quan, S.; Kelly Senecal, P. Modeling of Internal and Near-Nozzle Flow for a Gasoline Direct Injection Fuel Injector. J. Energy Resour. Technol. 2016, 138. [Google Scholar] [CrossRef]
  37. Franquet, E.; Perrier, V.; Gibout, S.; Bruel, P. Free underexpanded jets in a quiescent medium: A review. Prog. Aerosp. Sci. 2015, 77, 25–53. [Google Scholar] [CrossRef]
  38. Remacle, J.F.; Henrotte, F.; Carrier Baudouin, T.; Geuzaine, C.; Béchet, E.; Mouton, T.; Marchandise, E. A frontal delaunay quad mesh generator using the L∞ norm. In Proceedings of the 20th International Meshing Roundtable, IMR 2011, Paris, France, 23–26 October 2011; pp. 455–472. [Google Scholar] [CrossRef]
  39. Hwang, J.; Weiss, L.; Karathanassis, I.K.; Koukouvinis, P.; Pickett, L.M.; Skeen, S.A. Spatio-temporal identification of plume dynamics by 3D computed tomography using engine combustion network spray G injector and various fuels. Fuel 2020, 280, 118359. [Google Scholar] [CrossRef]
  40. Engine Combustion Network. Primary Spray G Datasets. 2021. Available online: https://ecn.sandia.gov/gasoline-spray-combustion/target-condition/primary-spray-g-datasets/ (accessed on 16 February 2021).
  41. Zhang, G.; Xu, M.; Zhang, Y.; Zhang, M.; Cleary, D.J. Macroscopic characterization of flash-boiling multihole sprays using planar laser-induced exciplex fluorescence. part II: Cross-sectional spray structure. At. Sprays 2013, 23. [Google Scholar] [CrossRef]
Figure 1. Single-hole domain test case. The inner bore and counter bore are marked with a blue and red box, respectively.
Fluids 06 00104 g001
Figure 2. Shock system for the case of nHexane-A visualized by the density gradient magnitude. (1) Constant pressure streamline or barrel shock, (2) intercepting shock, (3) triple point, (4) reflected shock, (5) Mach disk, (6) slip stream [37].
Fluids 06 00104 g002
Figure 3. Velocity magnitude for the single-hole injector with n-hexane. Reference solution of Guo et al. [21] is shown in (a).
Fluids 06 00104 g003
Figure 4. Effect of injection temperature on the spray development.
Fluids 06 00104 g004
Figure 5. Mesh used for the simulation of propane spray G cases. Cell refinement at the expected shock front by prior simulations with a coarse grid.
Fluids 06 00104 g005
Figure 6. Liquid volume fraction distribution for the case IsoOctane-A as measured in the experiment. Experimental data are taken from Hwang et al. [39], and the iso-contour for volume fraction α = 5 × 10⁻⁴ is shown in black for the homogeneous relaxation model (HRM) model with modified constants, with a blue dotted line for the original HRM model and red for the experimental results.
Fluids 06 00104 g006
Figure 7. Mie-scattering images at 500 μs after injection start: (a) shows a slightly evaporating case ( R p = 9.38 ), (b) the case of Propane-A and (c) the case of Propane-B. The liquid penetration length L p is marked in the images (a,b). Reprinted from Lacey et al. [4] with permission from Elsevier.
Fluids 06 00104 g007
Figure 8. A simplified view of the injector with a pitch circle diameter d c c and the fuel expansion d c , fuel [4].
Fluids 06 00104 g008
Figure 9. Velocity magnitude for different times for the case of Propane-A in the left column (subfigures (a)–(d)) and Propane-B in the right column (subfigures (e)–(h)).
Fluids 06 00104 g009
Figure 10. Logarithmic pressure contour for the case of Propane-B for different time steps: (a) 0.020 ms, (b) 0.035 ms, (c) 0.040 ms and (d) 0.150 ms. The formed pressure cells are marked in (c) with Roman numerals I and II.
Fluids 06 00104 g010
Figure 11. (a) Three-dimensional iso-contour of the density gradient for the case of Propane-B at 150 μs. The left side shows a cut through an injector and the right side shows a cut between two injector bores. (b) Density gradient contour for the case of Propane-B; the first pressure cell is colored in light blue.
Fluids 06 00104 g011
Figure 12. (a) Pressure distribution at a plane 0.65 mm above the injector and 2D velocity vector. (b) Schematic drawing of the shock system for the marked area in (a) showing the velocity vector through the incident shock wave AB. The reflective shock is marked with R and the Mach disk with M.
Fluids 06 00104 g012
Figure 13. Liquid mass fraction contour at x–y plane at 0.65 mm (a) and 1.5 mm (b) above the injector.
Fluids 06 00104 g013
Table 1. Test cases for the single-hole injector.
Case P inj [MPa] T inj [K] P amb [kPa] T amb [K] R p
nHexane-A7.54031013004.49
nHexane-B7.5403603008.31
nHexane-C7.54032030024.9
Table 2. Boundary conditions for the test cases for the spray G configuration.
CaseFluid P inj [MPa] T inj [K] P amb [kPa] T amb [K] R p
IsoOctane-A (G2)Iso-octane20363.0502931.5
Propane-APropane20363.010029326.3
Propane-BPropane20363.05329370.8
Publisher’s Note: MDPI stays neutral with regard to jurisdictional claims in published maps and institutional affiliations.

