Abstract
This study aims to characterize experimentally the heat transfer in micro-milled multi-microchannels copper heat sinks operating with flow boiling, in the attempt to contribute to the development of novel and high heat flux thermal management systems for power electronics. The working fluid was R-134a and the investigation was conducted for a nominal outlet saturation temperature of 30 C. The microchannels were 1 cm long and covered a square footprint area of 1 . Boiling curves starting at low vapor quality and average heat transfer coefficients were obtained for nominal channel mass fluxes from 250 to 1100 . The measurements were conducted by gradually increasing the power dissipation over a serpentine heater soldered at the bottom of the multi-microchannels, until a maximum heater temperature of 150 C was reached. Infrared thermography was used for the heater temperature measurements, while high-speed imaging through a transparent top cover provided visual access over the entire length of the channels. The average heat transfer coefficient increased with the dissipated heat flux until a decrease dependent on hydrodynamic effects occurred, possibly due to incomplete wall wetting. Depending on the channel geometry, a peak value of 200 for the footprint heat transfer coefficient and a maximum dissipation of 620 at the footprint with a limit temperature of 150 C could be obtained, showing the suitability of the investigated geometries in high heat flux cooling of power electronics. The experimental dataset was used to assess the prediction capability of selected literature correlations. The prediction method by Bertsch et al. gave the best agreement with a mean absolute percent error of 24.5%, resulting to be a good design tool for flow boiling in high aspect ratio multi-microchannels as considered in this study.
1. Introduction
In the last two decades, power electronics have experienced increasing research and industrial interest, promoted by the broad diffusion of technologies that are strategic to the sustainable development of our society [1]. An example is power drives, which are used to maximize the efficiency of wind turbines or efficiently manage the traction of electric vehicles. Reliability and lifetime are vital aspects of these electronic systems and they are strongly dependent on the operational temperature. Optimum system development requires the design phase to combine the electronic and thermal aspects. Over the years, the miniaturization of electronic components has demanded more effective thermal management systems.
The thermal management of electronics is implemented by spreading the heat dissipated by the circuitry over an extended surface and removing it by a cooling medium. In response to an increased heat dissipation per unitary footprint area, the maximum working temperature of the system can be maintained by either improving the heat transfer coefficient or extending the heat transfer area. Such ideas have promoted pioneering studies on the use of very narrow channels for the thermal management of electronics with liquid cooling [2]. Narrow channels can provide a high surface-to-volume ratio, extending the heat transfer area of the heat sink, and can benefit from the increased heat transfer coefficient due to reduced hydraulic diameter [3]. In this context, a further improvement of thermal management of electronics was envisioned by combining narrow channels with flow boiling [4,5]. This combination represents a promising scheme for the cooling of high power density electronics, allowing footprint heat dissipation of the order of hundreds of [6,7]. As reviewed in Karayiannis [8], thermal management by flow boiling includes several advantages over liquid cooling. Firstly, heat removal by boiling occurs at almost uniform temperatures, minimizing thermal gradients, and improving system reliability. Secondly, cooling by flow boiling needs less pumping power than liquid cooling.
With the continuous miniaturization of electronics, research on the flow boiling in microchannels has received increasing attention as a future thermal management system. The purpose of the present study is to characterize experimentally the heat transfer performance of micro-milled copper multi-microchannels using narrow and high aspect ratio channels, in the attempt to support the concentrated dissipation needs of the future. In particular, it is believed that multi-microchannels in copper can support the increased heat dissipation needs of the next generation of power electronics. Following the purpose of the study, three multi-microchannels heat sinks were manufactured by micro-milling with a nominal channel height of 1200 µm and a nominal channel width of 300 µm, 300 µm, and 200 µm, respectively. The nominal wall thickness was 300 µm, 100 µm, and 200 µm, respectively. The study comprised four main objectives: the first objective was to analyze quantitatively the heat transfer of the manufactured solutions. The second objective was to supply the quantitative heat transfer analysis with a report of the flow patterns observed through high-speed visualization. The third objective was to analyze the differences in heat transfer among the investigated solutions, showing how the enhancement of the heat transfer area by the reduction of channel diameter or the wall thickness can affect the heat transfer performance. The fourth and last objective was to use the obtained experimental data to assess the prediction capabilities of existing literature correlations for circular and rectangular channels and provide suitable design tools for the conditions investigated.
1.1. Synthesized Literature Review
Boiling in microchannels is characterized by the increased importance of surface forces over body forces, if compared to channels originally investigated in flow boiling studies [8]. Since the size of nucleating bubbles is not influenced by the channel diameter, bubbles may experience confinement: experimental observations showed that confined bubble growth can result in elongated-bubble flow, vapor backflow, and eventually mass flow rate instabilities [8]. Karayiannis [9] identified and proposed additional variables to characterize boiling in narrow channels, such as the heated length and the surface finish, which depends on the material used and the manufacturing process. Together with these variables, the confinement and the reduced system size can harm the precise control over the experimental boundary conditions and introduce significant uncertainties in the measurements. As presented in this section, experimental studies have shown a limited agreement on the dependence of the heat transfer coefficient on physical parameters, such as the channel-level heat flux and mass flux, as well as the heat transfer coefficient values. Table 1 presents a list of selected investigations conducted with R-134a in copper multi-microchannels heat sinks. For a comprehensive review of the works conducted with other fluids and other heat sink materials, the reader may refer to Karayiannis [8].

Table 1.
List of previously investigated conditions in flow boiling of R-134a in copper multi-microchannel and nominal test conditions of the present study.
Bertsch et al. [10] investigated the heat transfer performance of R-134a during flow boiling in a parallel array of 17 channels having a cross-section of 762 µm × 1905 µm, a wall thickness of 762 µm, and a heated length of 10 mm. A pre-heater controlled the inlet vapor quality to the test section. An increasing and decreasing trend of the local heat transfer coefficient with respect to the local vapor quality occurred for all the conditions tested. The heat transfer coefficient was influenced by both mass flux and heat flux, while the saturation temperature did not significantly affect the performance. In a later study by the same authors [11], R-134a and R-245fa were compared in two geometries with rectangular sections of 762 µm × 1905 µm and 381 µm × 953 µm. The mass fluxes ranged between 20 and 350 . Again, the local heat transfer coefficient followed an increasing and decreasing trend with respect to the local vapor quality. The heat flux strongly influenced the heat transfer coefficient, leading to the conclusion that nucleate boiling dominated the heat transfer mechanism. Good predictions of the experimental data by the Cooper correlation [12] corroborated the nucleate boiling hypothesis. Similarly, in Madhour et al. [13], the authors observed a heat flux-dominated heat transfer mechanism. They presented flow boiling data for R-134a in a cold plate with 100 microchannels, having a 100 µm width and 680 µm height, with 72 µm channel wall. A nominal saturation temperature of 63 C and a maximum heater temperature of 85 C characterized the investigation. The heat transfer coefficient increased with the local heat flux for the range of conditions tested, while vapor quality had an effect only at 250 , which was the lowest mass flux tested. Do Nascimento et al. [14] investigated experimentally a microchannel heat sink comprising 50 parallel channels with a channel width of 100 µm and a wall thickness of 200 µm, at a saturation temperature of 25 C. The study was conducted keeping a constant average vapor quality in the microchannels and varying the operating mass flux. Under these conditions, the authors observed that the heat transfer coefficient increased with the operating mass flux, which also corresponded to an higher channel heat flux. The observed behavior of flow boiling was similar to the one observed in Bertsch et al. [10]. Fayyadh et al. [15] investigated a set of 25 parallel channels of 300 µm× 700 µm, with a separating wall of 200 µm. The investigated mass flux ranged between 50 and 300 and the nominal saturation temperature was 30 C. Their investigation showed a heat transfer coefficient strongly dependent on the heat flux. Flow instabilities were observed and recognized as an important effect that influences the heat transfer performance and the control over the operational conditions. The impact of the mass flux on the heat transfer coefficient could not be clearly inferred due to flow maldistribution caused by instabilities. Flow visualization showed that the nucleation of bubbles was still present in the liquid film of slug and annular flows. Finally, their data were well-predicted by Mahmoud and Karayannis’ correlation [16], as well as the Cooper correlation [12].
On the other hand, the dominance of convective effects and film evaporation on the heat transfer was highlighted in References [17,18,19]. Lee and Mudawar [17] obtained measurements of the local heat transfer coefficient at different vapor qualities by decreasing the channel mass flux at a constant heat flux. A bubbly flow was observed only at low vapor qualities, while higher vapor qualities led to annular flow. The authors explained the heat transfer performance in the annular regime with thin-film evaporation. Similarly, a heat transfer mechanism depending on the local vapor quality was observed in References [18,19]. Quantitative measurements and flow visualization supported the conclusion that annular flow with thin-film evaporation gradually suppressed the bubble nucleation.
1.2. Outline of the Study
The present study characterizes the heat transfer performance of three multi- microchannels during flow boiling of R-134a. Firstly, an analysis of the footprint heat transfer coefficient highlights the overall cooling performances of each heat sink; secondly, the focus moves on the channel average heat transfer coefficient, pointing out the characteristics of the flow boiling inside the microchannels and their dependence on the average heat flux, mass flux, and multi-microchannels geometry. Finally, the prediction capability of selected literature correlations over the experimental data is assessed over the measurements obtained. The quantitative analysis was combined with flow visualization over the entire channel length and the flow maps are presented. The results are described in terms of boiling curves and averaged heat transfer coefficients for all the three microchannel geometries at a nominal outlet saturation temperature of 30 C. The nominal mass flux ranged between 250 and 1100 . In the presented experiments, the footprint heat flux was gradually increased at each mass flux until a maximum heater temperature of 150 C was reached by either a sharp temperature excursion due to critical heat flux or by a stable response.
2. Experimental Methods
This section describes the experimental setup and the methods used for data reduction in the present study. Section 2.1 presents the flow conditioning loop, while Section 2.2 describes the test section and elaborates on the measured geometrical features of the channels in the heat sinks. Section 2.3 outlines the test procedure and the test conditions. Finally, Section 2.4 describes the data reduction.
2.1. The Flow Conditioning Loop
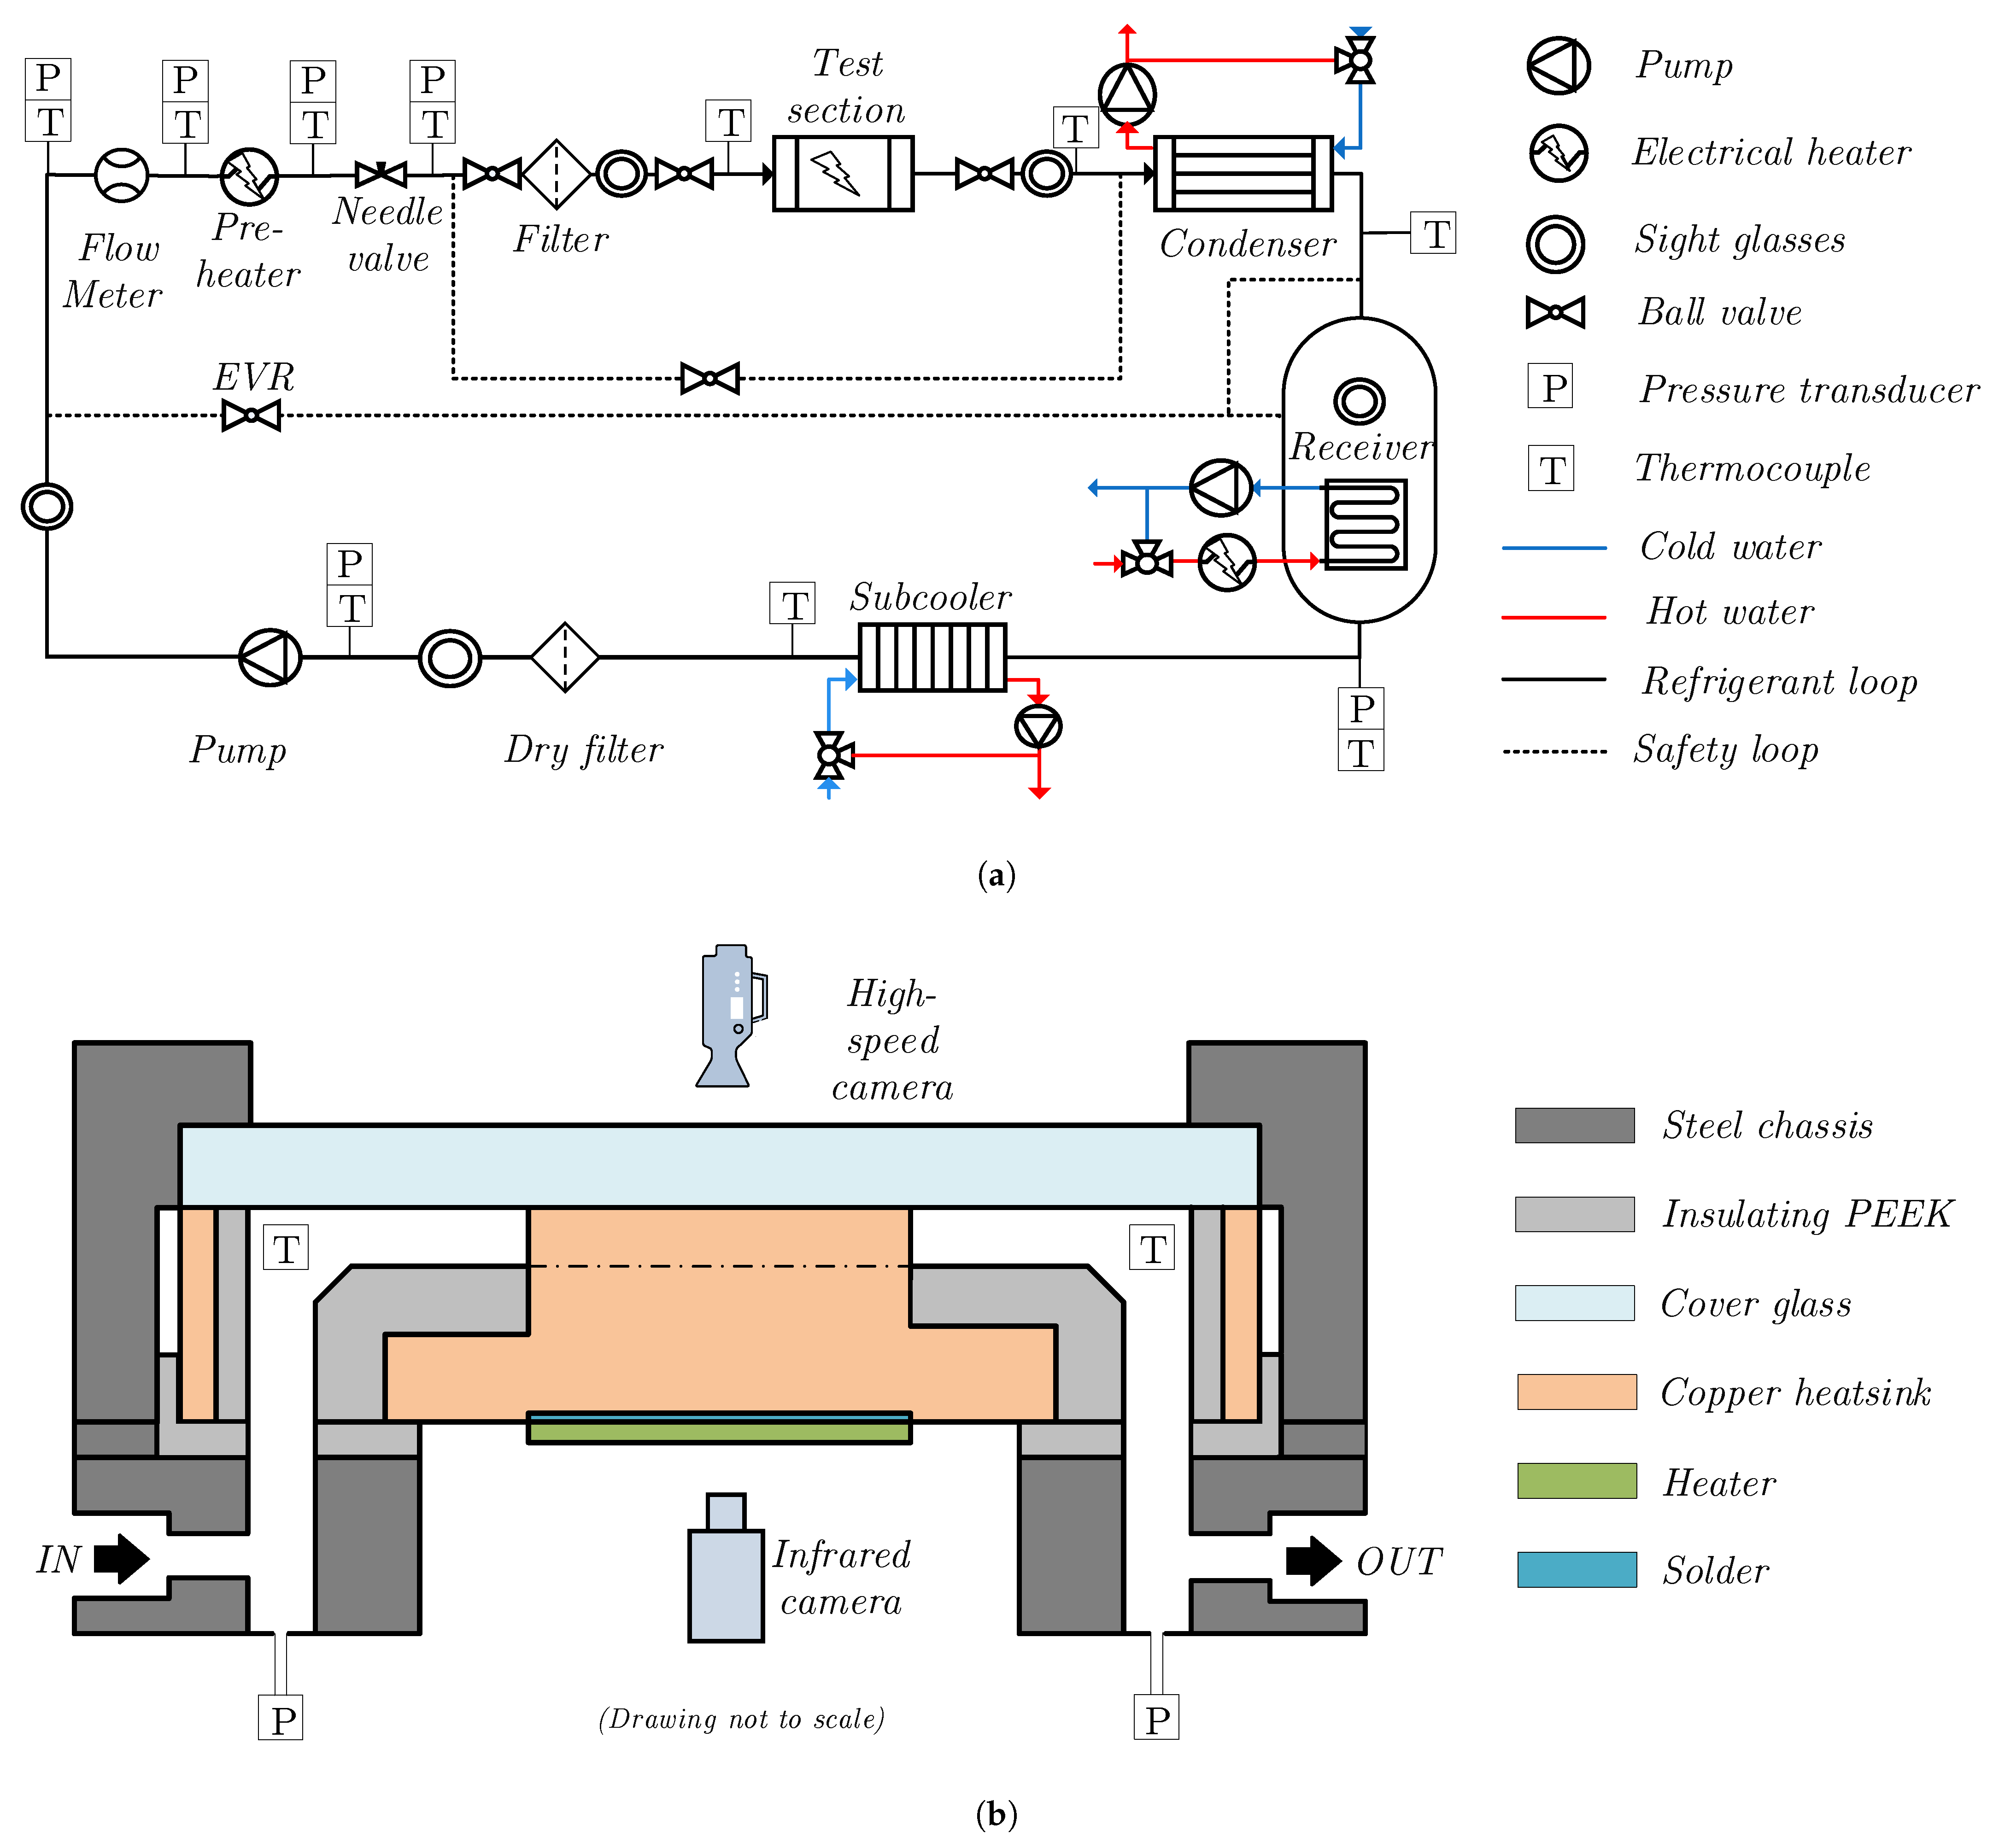
The flow conditioning loop comprised all the piping, instrumentation, and components used to convey liquid R-134a from a receiver to the inlet of the test section at prescribed conditions. Figure 1a shows a diagram of the loop. A gear pump by Tuthill, Burr Ridge, IL, USA, generated the flow in the loop. Starting from the receiver, the refrigerant underwent subcooling in a plate heat exchanger, pressure increase through the pump and heating by an electric pre-heater. The flow was balanced with a needle valve placed before the test section. Once boiling occurred in the test section, the two-phase flow was condensed in a plate heat exchanger and gathered back into the receiver. The receiver was equipped with a conditioned water coil capable of cooling and heating, thus controlling the pressure in the system. A 7 µm filter was mounted before the test section and a dry filter before the pump suction. Sight glasses were placed in various positions along the loop to inspect the presence of vapor. Measuring instruments were located along the flow loop, as indicated in Figure 1a. A Micro Motion Coriolis Elite sensor (CMFS010M) by Emerson Electric, Ferguson, MO, USA, measured the mass flow rate, while T-type thermocouples by Omega Engineering, Norwalk, CT, USA, and pressure transducers AKS33 (060G2044 and 060G2050) by Danfoss, Nordborg, Denmark, measured the temperature and the pressure in various locations. All signals were connected to data acquisition modules by National Instrument, Austin, TX, USA, and were monitored by a customized Labview interface. Before the installation, the thermocouples were calibrated in a thermal bath using a Standard Platinum Resistance (model 162) by Rosemount, Shakopee, MN, USA. Pressure transducers were calibrated by an Air-Operated dead weights tester by Budenberg, Salford, UK. After the calibration, the overall uncertainty budget on each instrument was evaluated according to the method presented in Reference [20]. Table 2 reports the calibration range of the instruments and their average uncertainties u expanded to a 95% confidence interval.
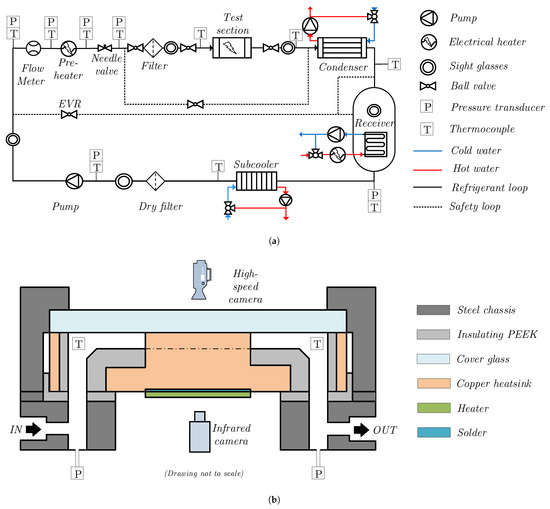
Figure 1.
The experimental setup: (a) Schematic diagram of the experimental loop, (b) Schematic representation of the parts of the test section.

Table 2.
Instrument type and expanded uncertainties.
2.2. The Test Section
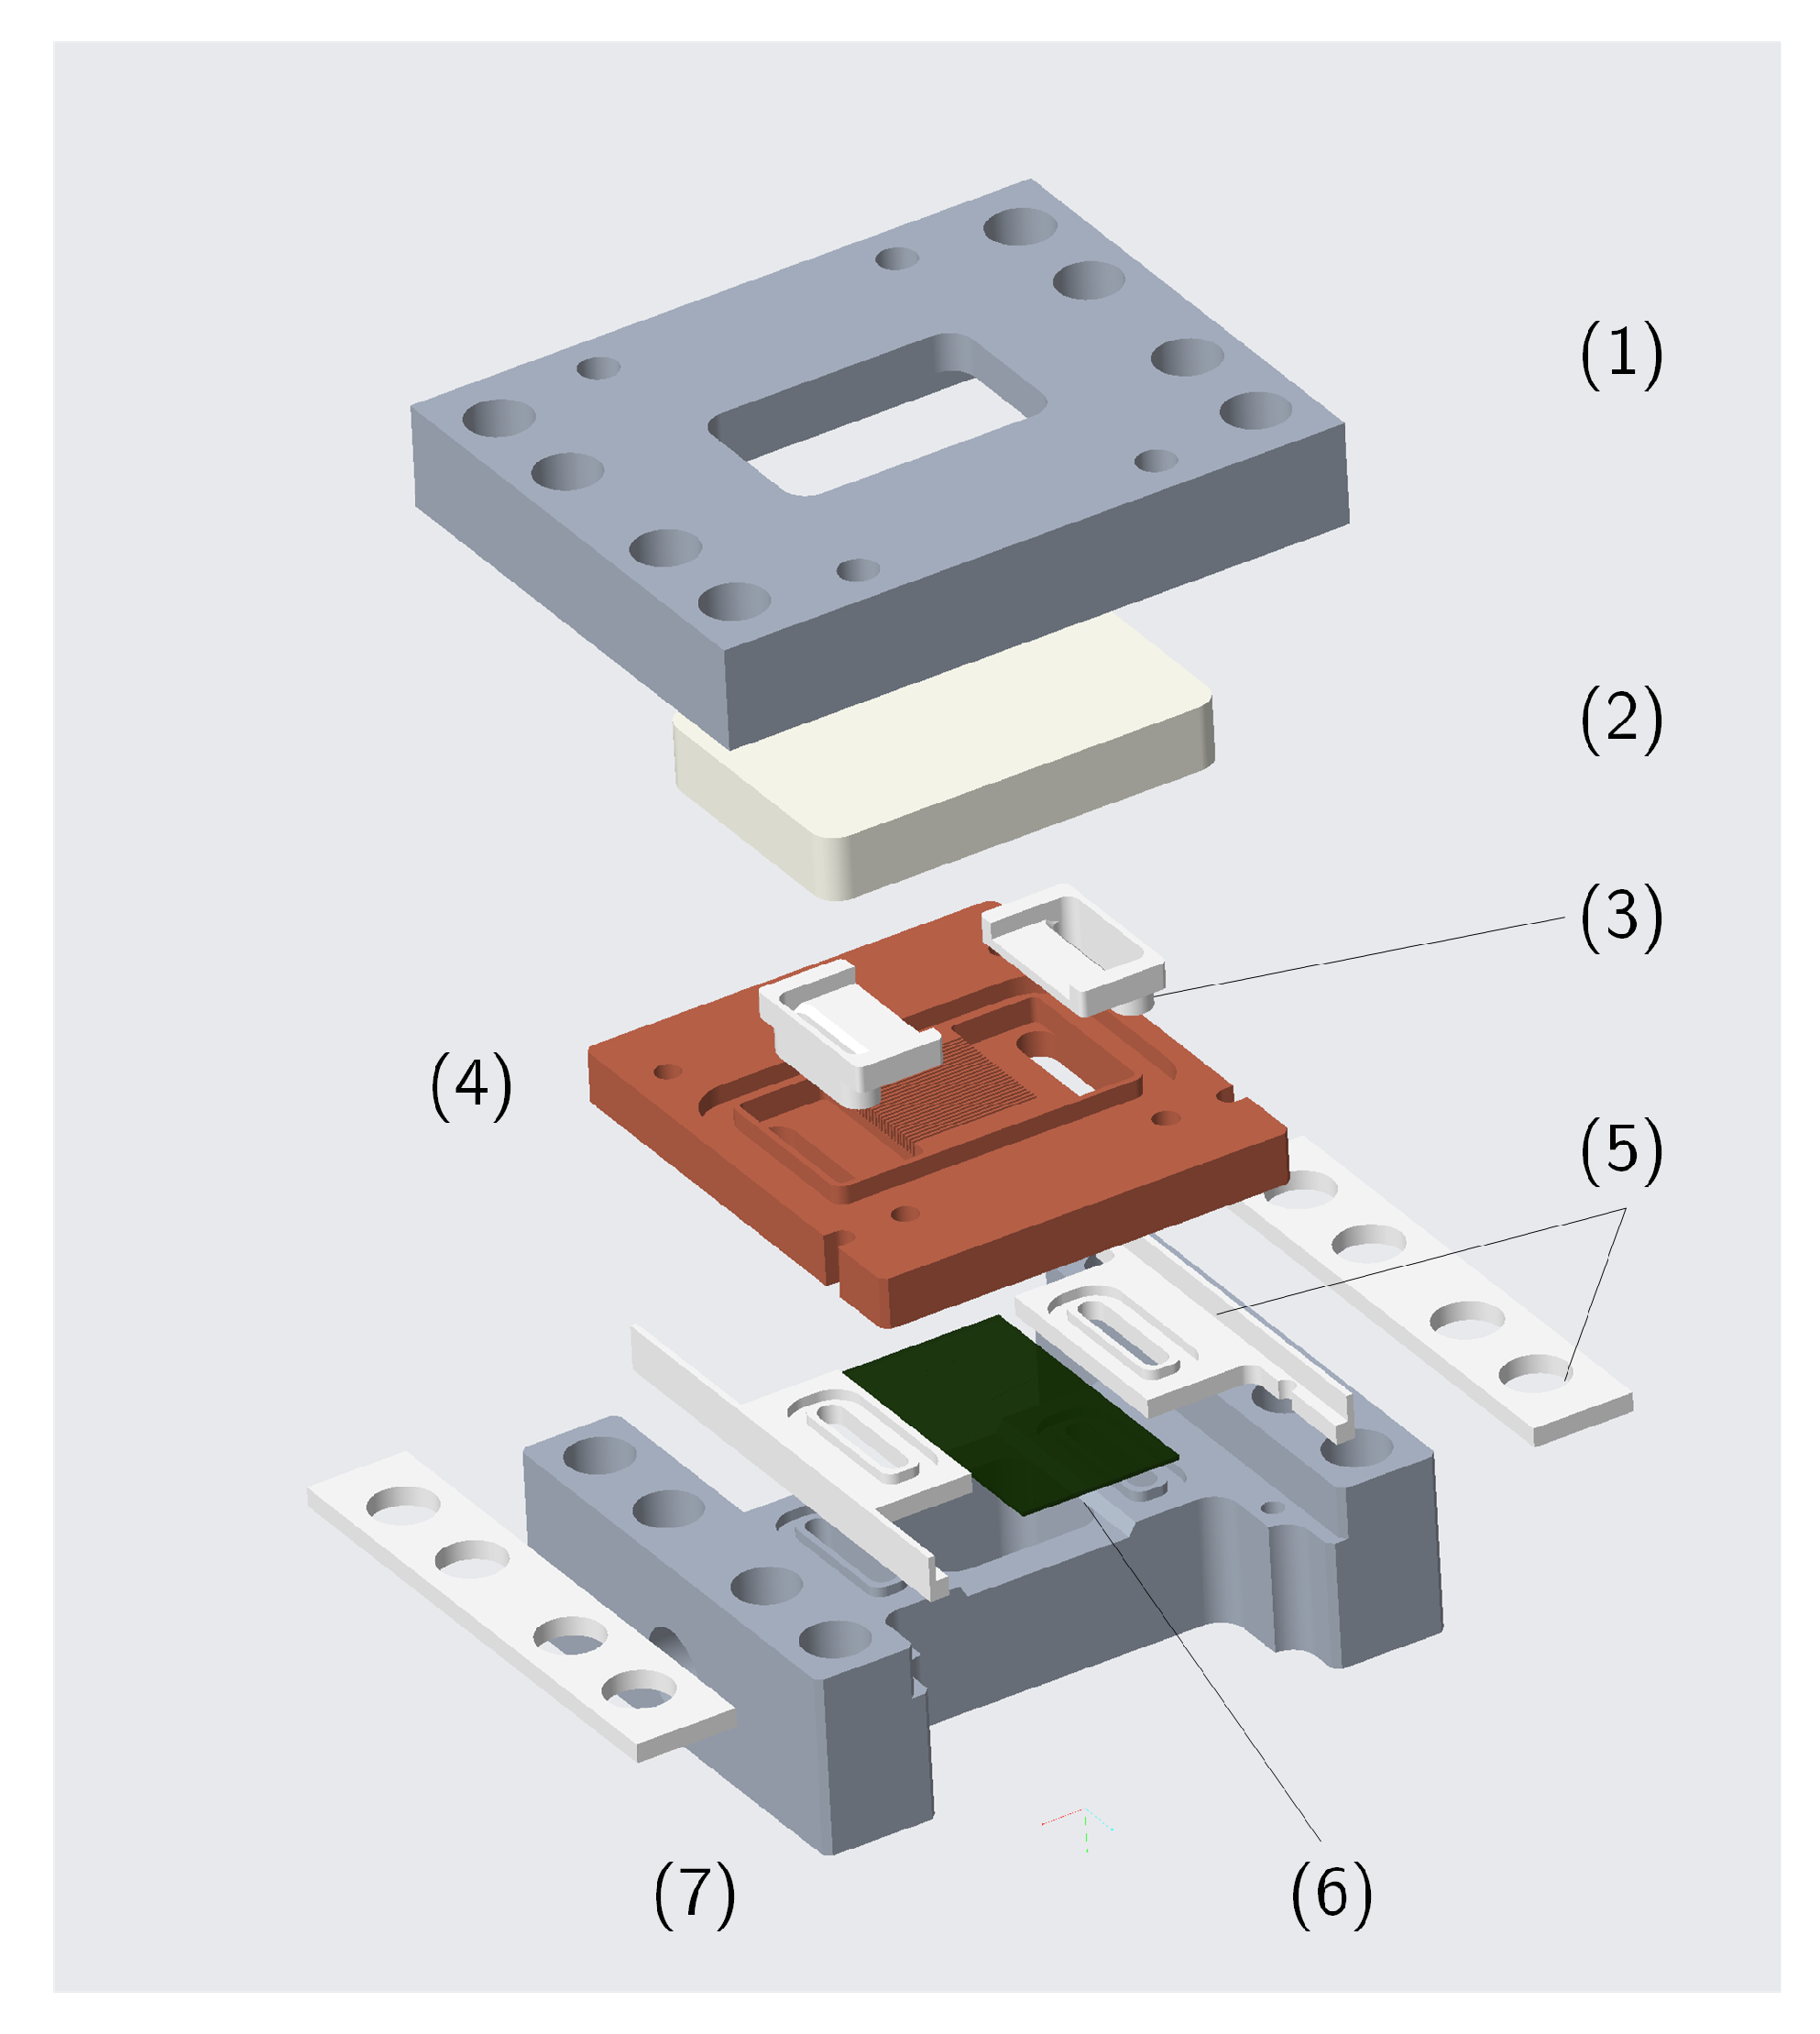
The test section mainly comprised an interchangeable copper heat sink placed into a steel chassis, as shown in the exploded view in Figure 2. The steel chassis was directly soldered to the piping of the flow conditioning loop and featured successive fluid routing to connect the main pipe with the inlet plenum of the heat sink. A customized heating chip with a serpentine platinum element was vacuum-soldered to the bottom of the heat sink and several PEEK (PolyEther Ether Ketone)inserts were employed to minimize heat losses to the steel chassis. The serpentine heater consisted of a 0.88 µm thick platinum deposition on a 350 µm silicon wafer. The deposition covered a nominal square area of 1 , vertically aligned and corresponding to the footprint area of the channels. Four 4-wire resistance thermal detectors (RTDs) were integrated along the serpentine heater to monitor locally the chip temperature. A Sn-Ag solder paste was used to vacuum-solder the heater to the copper heat sink. The absence of significant voids in the solder layer was verified by 3-D tomography. Differential height measurements allowed to estimate the solder layer to be 90 µm. Once the soldering was complete, the serpentine heater was painted with a black heat-resistant paint. The melting temperature of the solder layer limited the maximum operating temperature of the heater, which was set to 150 , considering a safety margin. The distance between the solder layer and the bottom of the channels was 2.58 . The heat sink was covered by a framed borosilicate glass, which gave visual access to the high-speed camera mounted on top of the test section. A 100 µm heat-resistant and transparent silicon layer was placed between the glass and the top of the channels to improve the sealing and avoid boiling activities on the top of the separating walls. Finally, polyurethane insulation and reflective tape were placed all around the test section, the connecting pipes, and wires to minimize the heat loss. The inlet and outlet manifolds of the heat sink were instrumented each with two K-type thermocouples and a pressure tap for measurements by a pressure transducer AKS33 (060G2044) by Danfoss, Nordborg, Denmark, and a PMD75 by Endress-Hauser, Reinach, Switzerland. A 1500 W power supply N5700 by Keysight, Santa Rosa, CA, USA, controlled the power input to the serpentine heater. The RTDs embedded into the serpentine heater were calibrated to a maximum temperature of 160 in a thermal bath, after the heater was vacuum-soldered to the copper heat sink. Furthermore, the temperature of the serpentine heater was measured by an infrared camera A655sc by FLIR, Wilsonville, OR, USA, with a close-up lens (T198059). The measurements of the infrared camera were calibrated using the RTDs embedded in the serpentine heater as a reference. The high-speed camera used for the visualization was a Nova S9 by Photron, Tokyo, Japan, with a double 2× teleconverter. Then, 2 × 150 W LED lights by GSVitec, Bad Soden-Salmünster, Germany, were pulsed with a 10% duty cycle during the image recording, which took approximately 1.2 s. About 11% of the radiated light was estimated to reach the test section, resulting in approximately 1.1% of absorbed power due to the pulsing during the video recording. The recording took place at 20,000 fps, generating images with 512 × 896 pixels and a 6.8 mm × 11.8 mm field of view.
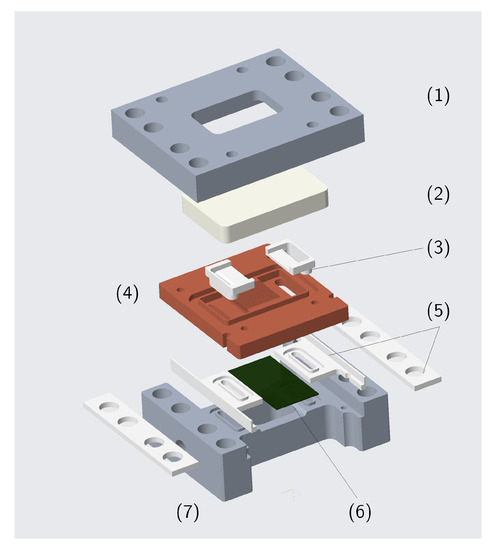
Figure 2.
Exploded view of the test section: (1) steel cover, (2) cover glass, (3) PEEK (PolyEther Ether Ketone) manifold inserts, (4) copper heat sink with microchannels, (5) insulating PEEK inserts, (6) serpentine heater, and (7) steel chassis.
Channel Geometry
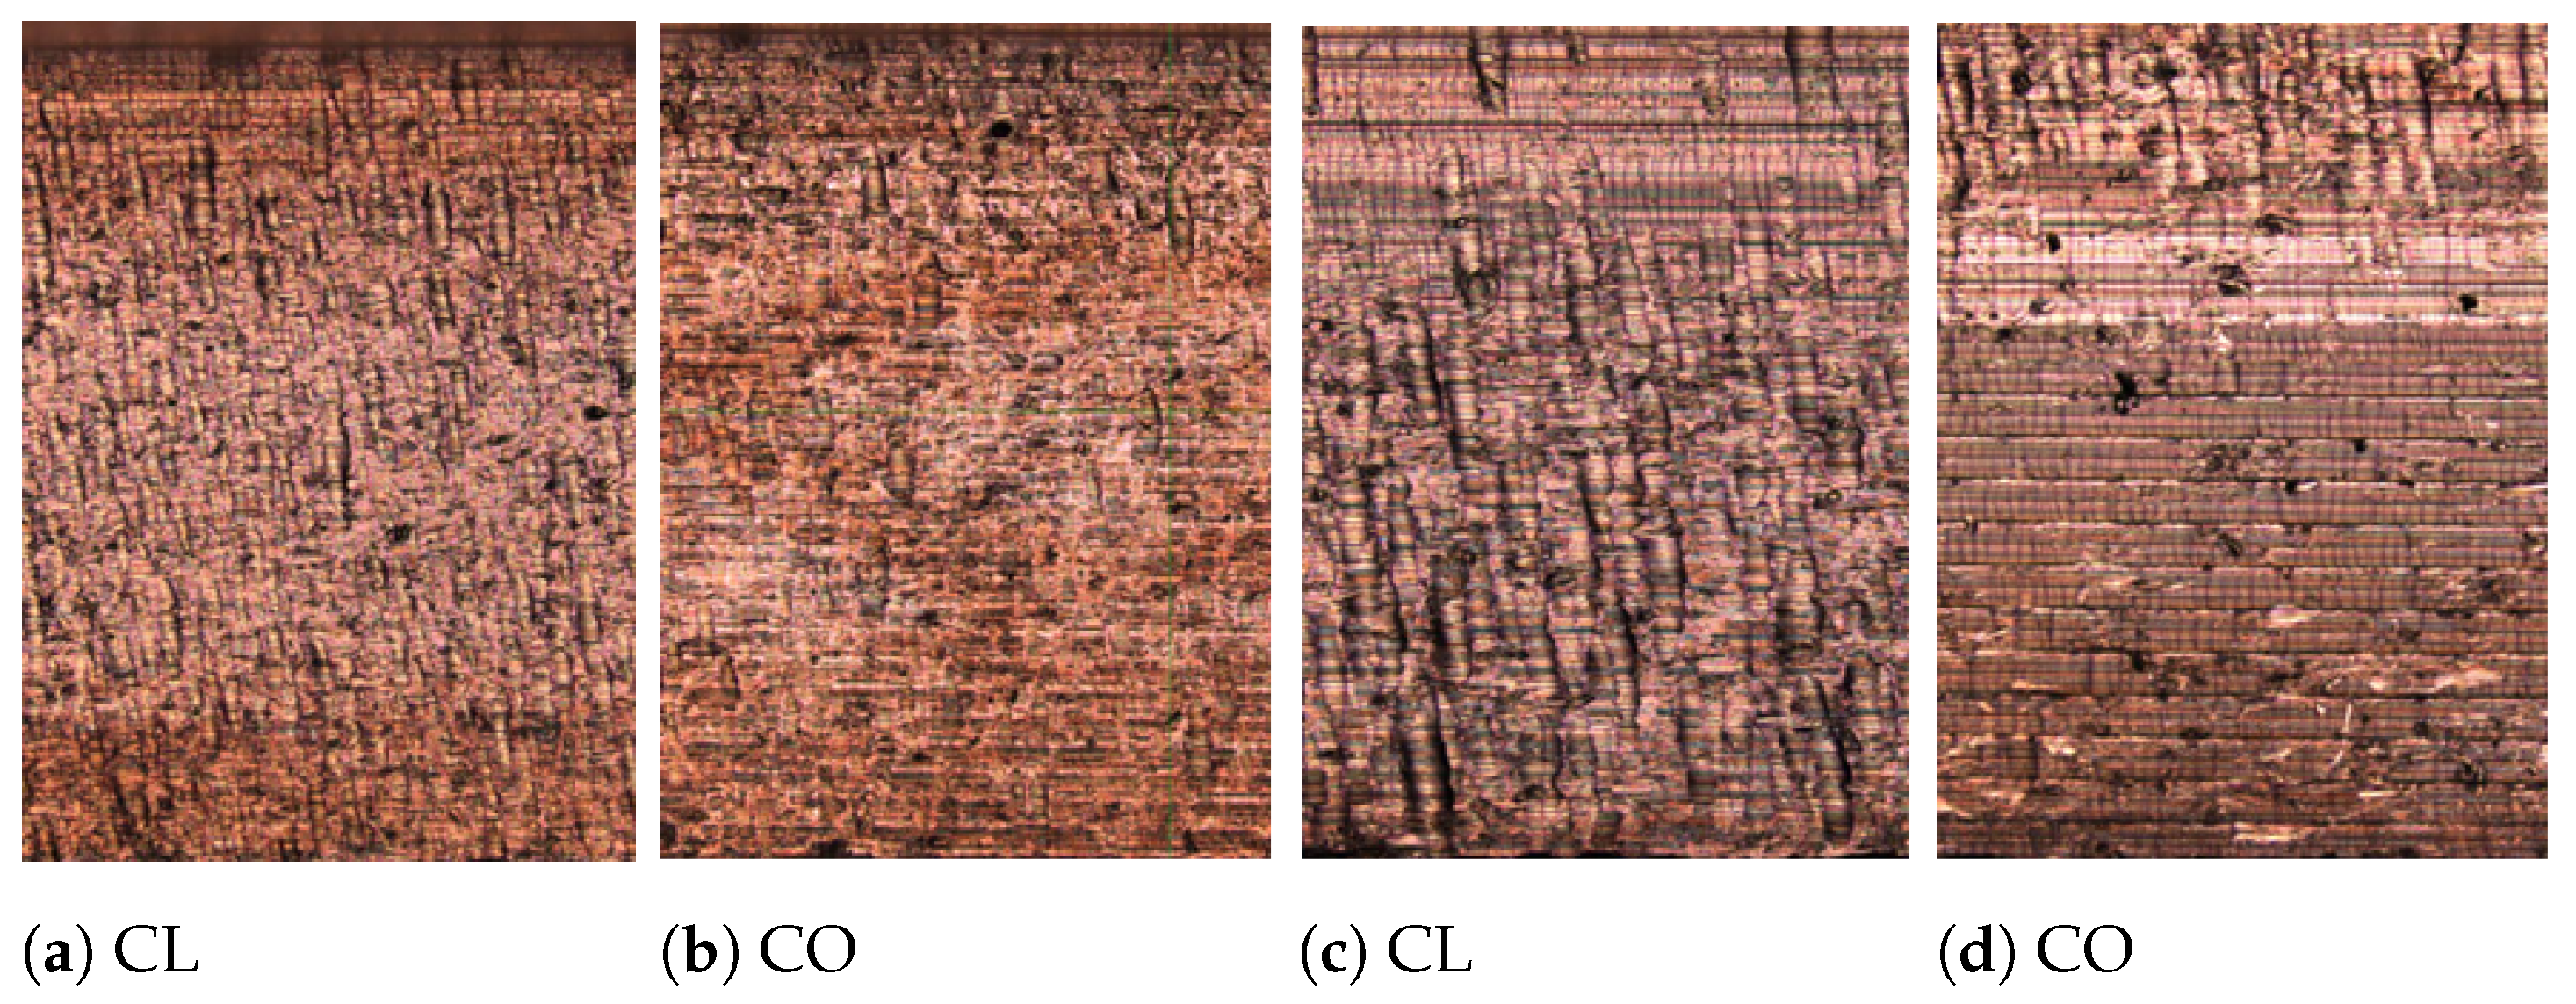
In the present study, three heat sink geometries were investigated. For convenience, they are labeled as Geometry A, B, and C throughout the manuscript. In all cases, the microchannels covered a nominal footprint area of 1 and had a length L of 10 mm and a nominal height H of 1200 µm. The straight microchannels were manufactured by micro-milling in Electrolytic Tough Pitch copper (C101/CW004A), and their nominal width corresponded to the nominal width of the cutting tool. After the manufacturing, the effective size of the channels was verified through a confocal microscope Lext OLS4000 by Olympus, Japan, with a dedicated 20× lens. The measurements were repeated five times in five different locations, allowing to evaluate the uncertainty on the measured value. Table 3 reports the measured dimensions and the propagated uncertainty on the channel hydraulic diameter , calculated according to Reference [20]. The resulting heat transfer area was 4.50 , 6.67 , and 6.33 for Geometry A, B, and C, respectively. In the same order, the resulting flow area was 5.86 , 8.44 , and 5.78 . In addition, the surface roughness of the side walls of the channels was measured. However, contrary to the case of the height and width, the surface roughness of the channels could not be measured directly on the test samples in a non-destructive way. Individual samples were manufactured solely for roughness measurements, using the same feed rate, cutting depth, and material as for the heat sinks. The measurements were conducted by the confocal miscoscope with a dedicated 100× lens. Depending on the size of the cutting tool and the side of the wall (one is climb-milled, the other is conventionally-milled), slightly different roughness values were found. For the 200 µm cutting tool, roughness values were 372 and 348 for the climb-milled side and the conventionally-milled one, respectively. Likewise, for the 300 µm cutting tool, the values were 662 and 504 , respectively. Channel roughness showed a slight dependence on the cutting approach (climb or conventional) and the tool size. Figure 3 shows microscope images of the surface roughness. The measured values were coherent with the values reported in Young et al. [21] for machining of copper. As shown in Jones et al. [22] and Jafari et al. [23], surface roughness can influence the heat transfer coefficient in both pool and flow boiling.

Table 3.
Channel dimension measured by a confocal microscope. H = Height, W = Width, = Separating wall thickness, = hydraulic diameter, u = uncertainty, and = number of channels.
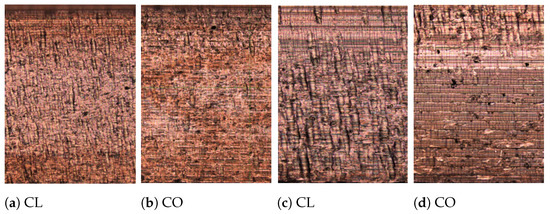
Figure 3.
Microscope images of the channel sides roughness: CL = Climb-milled side, CO = Conventionally-milled side; (a,b) W = 200 μm, (c,d) W = 300 μm.
2.3. Experimental Procedure and Test Conditions
With R-134a charged into the system and cold water running in the subcooler, the pump was started when sufficient subcooling was obtained at its suction. The test mass flow rate was set by adjusting the pump rotational speed through a speed drive, while the heating and cooling into the receiver controlled the pressure at the outlet of the test section. The electric pre-heater power was adjusted to guarantee an inlet subcooling of about 5 . Once stable conditions were achieved in the system, the serpentine heater was powered and signals were recorded when the steady conditions were obtained again in the test section. The test conditions were considered steady when the moving average over 5 s of the temperature measurements changed less than 0.05 over a time interval of 120 . Temperature, pressure and RTDs signals were recorded at 10 . The infrared camera measurements took place at 30 and were launched simultaneously with the Labview recordings. Finally, high-speed flow visualization was started at 20,000 fps right after the Labview recording ended. Once the test was run and the signal recorded, the heat flux of the test section was increased and the rotational speed of the pump was slightly adjusted to keep the prescribed mass flow rate constant. This procedure started from a very low outlet vapor quality and continued until a temperature of 150 was reached on the serpentine heater, either by an exponential growth of the temperature due to the critical heat flux achievement or by a stable response. For non-critical conditions, the dynamic response of the heater temperature to a step increase in the heat flux resembled a stable response of a first order system.
The bottom of Table 1 reports test conditions expressed in dimensional and non-dimensional form for the minimum and the maximum mass flux considered in this study. During the tests, the nominal liquid Weber number ranged from 3.4 to 65.3 for Geometry A and B, while the range was 2.4 to 46.6 for Geometry C. The nominal Capillary number ranged from 0.005 to 0.0024 for all the geometries.
Heat Loss Characterization
The assessment of the heat rate lost from the test section to the ambient was performed before the two-phase experiments. The heat losses were calculated by running single-phase tests and applying an energy balance between the inlet and the outlet of the test section, where pressure and temperature were measured. The obtained data were regressed with the refrigerant mass flow rate and the temperature difference between the serpentine heater and the ambient. The regression resulted in a heat loss equation described by
where to were the regression coefficients equal to 0.569, 0.034, 0.170, and −0.00021, respectively. The regression captured satisfactorily the heat loss trend, showing a mean absolute percentage deviation of 10.3% and an value of 0.943. The total heat losses were mainly dependent by the temperature difference between the ambient and the heater, while the mass flow rate had a negligible impact on the variability of the heat losses. This was also reflected by the error estimate of the coefficients of regression, which was below 20% only for .
2.4. Data Reduction
The heat transfer results of the investigated heat sinks were described in terms of boiling curves and average heat transfer coefficient versus average channel heat flux . This approach was chosen due to the relatively small channel length.
Starting from the current (I) and voltage (V) signals applied to the serpentine heater, the footprint heat flux was defined as:
where was the footprint area of the channels, and was calculated according to Equation (1). The channel average heat flux was defined as
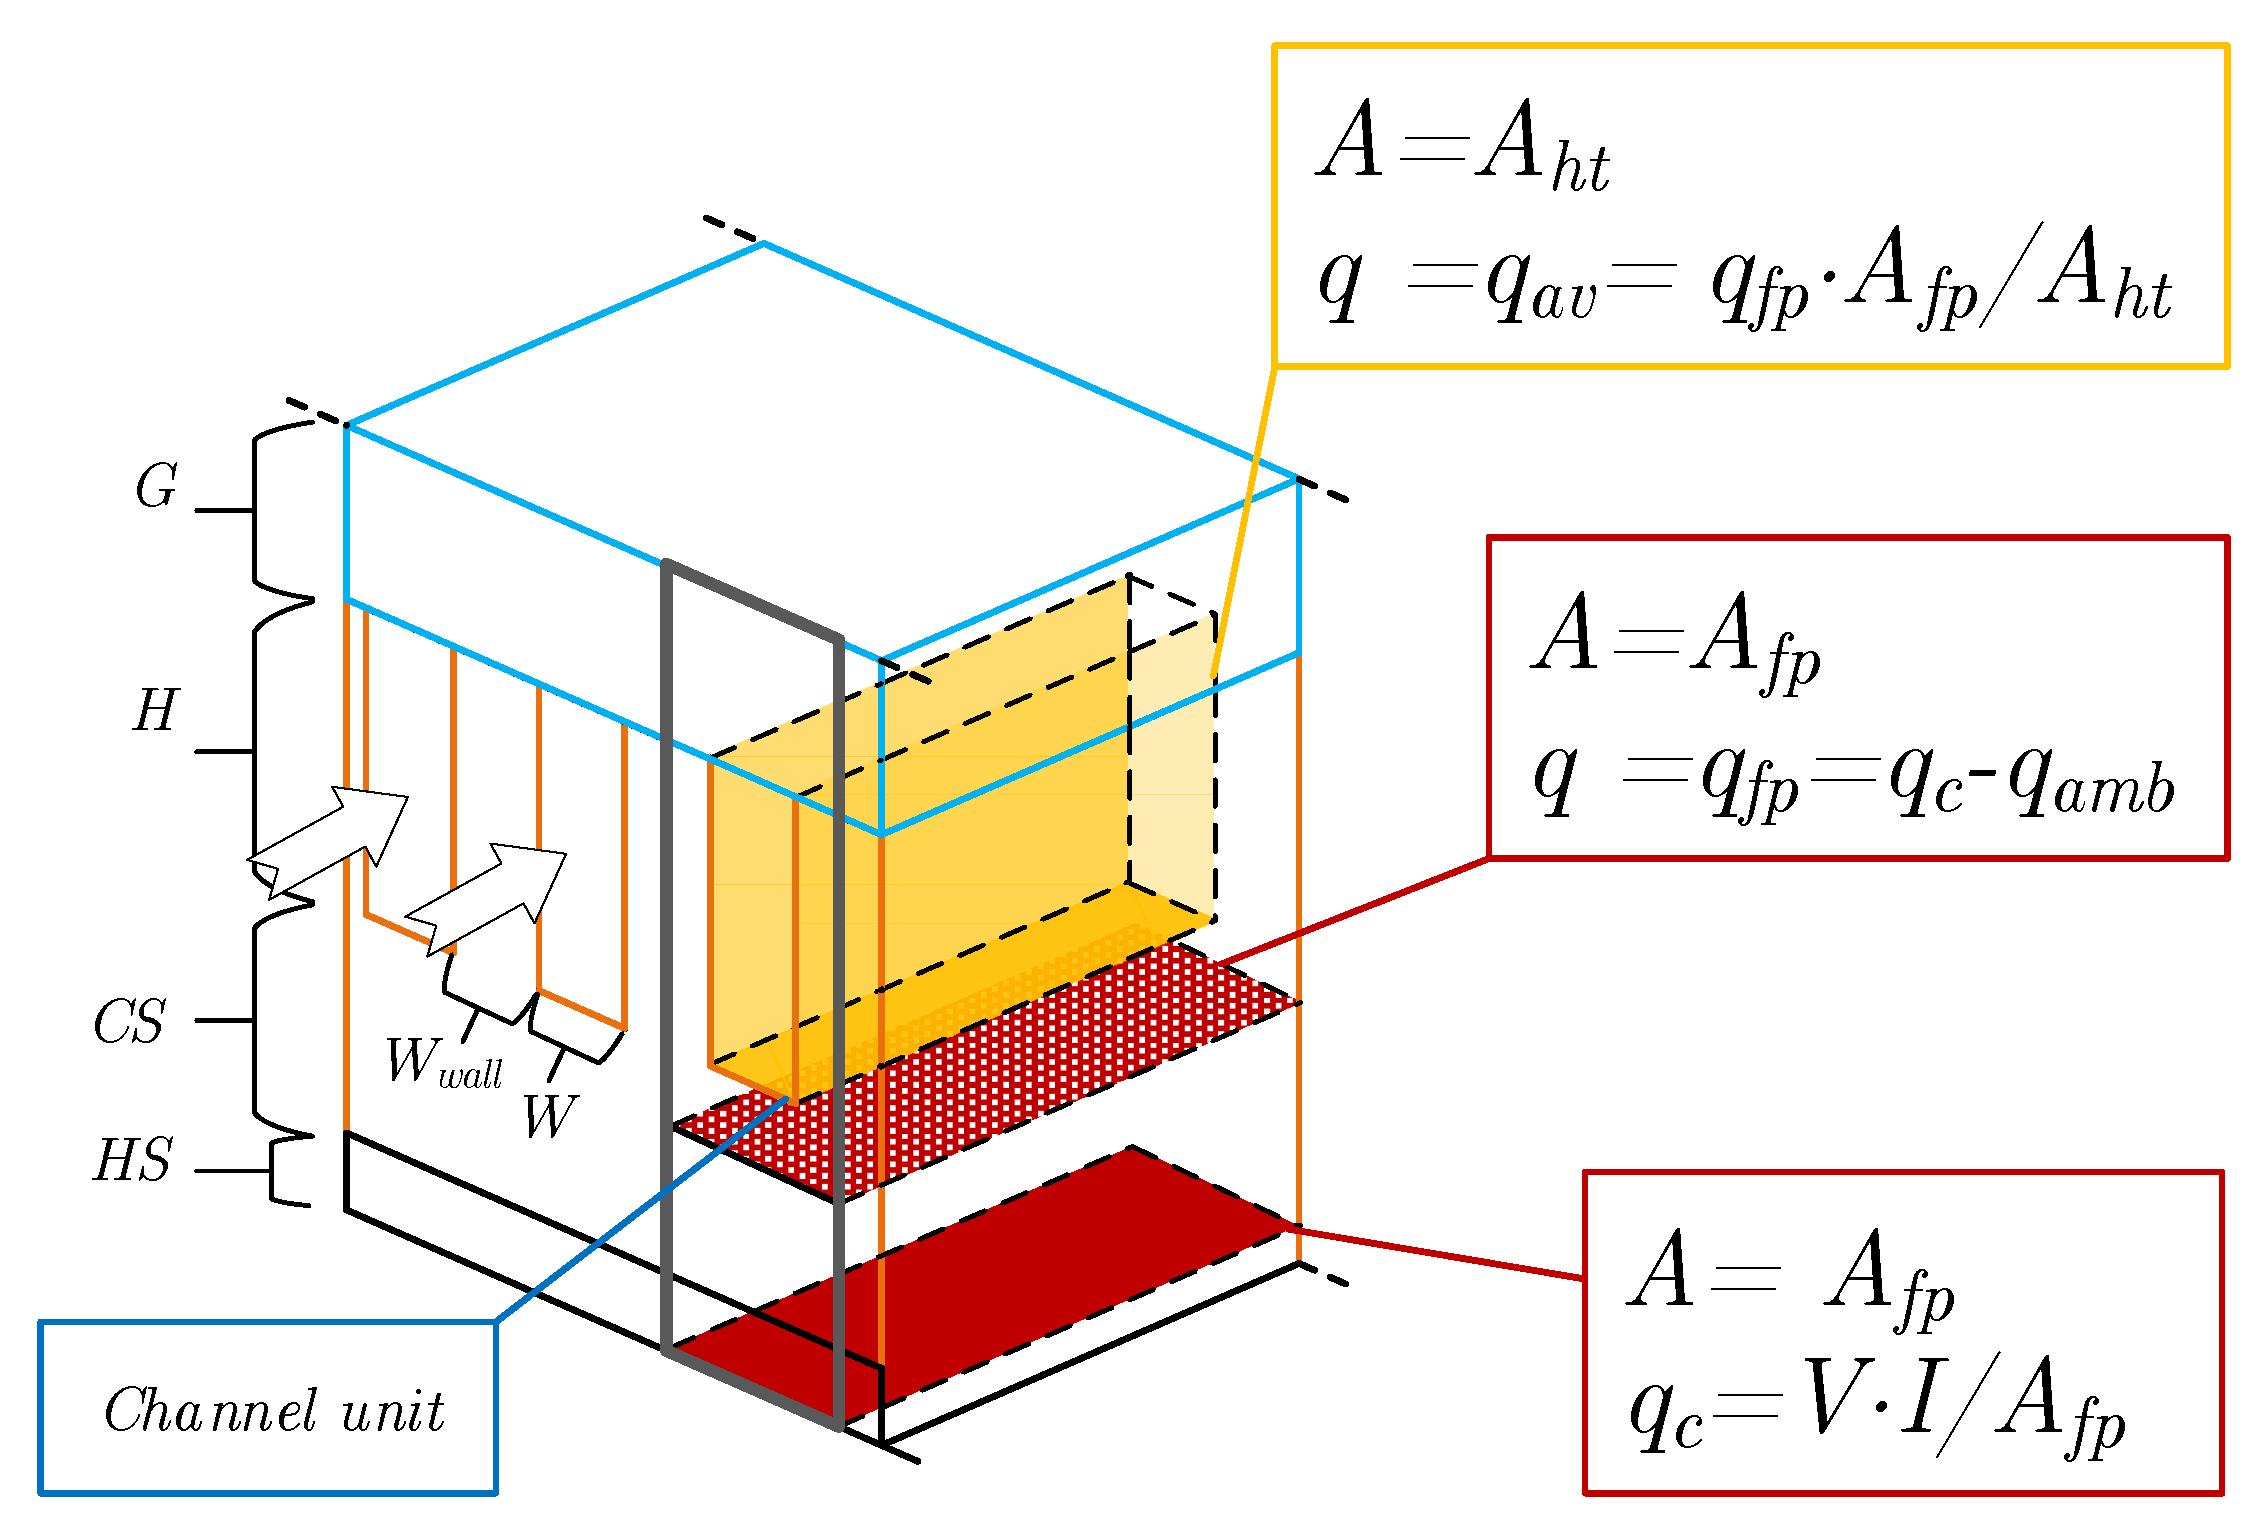
where was the number of channels in the heat sink. Figure 4 shows a graphical representation of the heat transfer areas employed in the definitions of Equation (3) for a unitary channel cell. Making use of the definition of fin efficiency [24], the average heat transfer coefficient at channel level and at footprint level were defined as
where was the average refrigerant temperature in the channel, and was the temperature at the bottom of the channels. Assuming an adiabatic tip, the fin efficiency was calculated as
where was the thermal conductivity of copper. The temperature at the bottom of the channels was calculated assuming one-dimensional conduction through the silicon layer of the heater, the solder layer, and the copper substrate according to
where was the average temperature of the heater measured by the infrared camera, and and represent the thermal conductivity and the thickness of the ith layer, respectively. The thermal conductivity of the silicon layer was calculated according to Shanks et al. [25], while equations fit from the data of the manufacturers were used for the copper and the solder layer. These equations were
where T was the average temperature of the layer expressed in . Equations (10) and (11) are valid for temperature values between 0 and 200 . Finally, the average refrigerant temperature was calculated as
where and were the temperatures measured at the inlet and outlet manifold, respectively, was the average channel pressure, and was the outlet thermodynamic quality calculated by the energy balance on the test section. The average channel pressure was calculated by averaging between the inlet and outlet channel pressure, and . and were obtained by considering the pressure losses inside the inlet and outlet manifold
where represents the pressure drop the fluid undergoes while passing through the manifolds, and and were the pressure values measured by the pressure transducers in the inlet and outlet manifold. Referring to the section view in Figure 1b, the losses in the inlet manifold included: a straight section, a 90 bend in between, another straight section and a sudden contraction at the edge of the microchannels. Similar losses occurred at the outlet manifold, despite having a sudden expansion at the edge of the microchannels. Single-phase pressure drops in the inlet manifold were calculated according to the methods presented in Idel’chik [26], while pressure drop due to a sudden contraction at the channel inlet and expansion at the channel outlet were calculated according to Chalfi and Ghiaasiaan [27]. Homogeneous flow was assumed for the two-phase mixture when calculating the pressure drop at the outlet bend and the straight sections. Considering that the observed differences in the saturation temperature between the inlet and outlet manifold was about few tenths of a (reaching maximum 1 only for the highest wall superheat), the homogeneous flow hypothesis in the outlet bend and the straight sections, and the calculation of the average channel pressure by averaging inlet and outlet were considered adequate for the objective of the study.
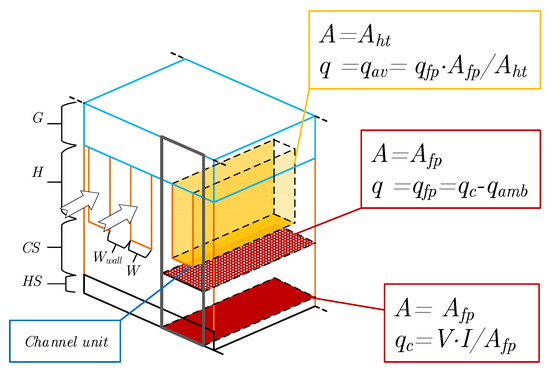
Figure 4.
Schematic representation of the definition of heat transfer areas and heat fluxes for a single channel unit. HS = Heater + Solder, CS = Copper substrate, H = Channel height, G = Cover glass.
Propagated uncertainties on the reduced data were estimated according to the error propagation methods presented in Moffat [28]. The expanded uncertainties for the average channel heat transfer coefficient was 11.2% ± 3.3%, the highest values being obtained at the lowest wall superheats. The measurements of the heat transfer coefficient in single-phase had an expandend uncertainty of 15.8% ± 3.3%, the uncertainty being the highest at the lowest heat fluxes.
Methodology Validation
The data reduction was validated by running single-phase heating tests in the laminar regime for each multi-microchannel geometry. The measured average Nusselt numbers in the channels were compared with the data published in Shah and London [29] and originally presented in Montgomery and Wibulswas [30]. Due to the absence of an unheated length in the microchannels, the data for a simultaneously developing thermal and hydrodynamic boundary layer flow was considered as the reference. As the data was presented in tabular form in Shah and London [29], a regression was performed with respect to the non-dimensional axial coordinate along the channels and the Prandtl number , while the coefficient describing the dependency on the was adopted from the fully developed laminar solution presented in Shah and London [29], resulting into
where was evaluated as a function of the aspect ratio [29]
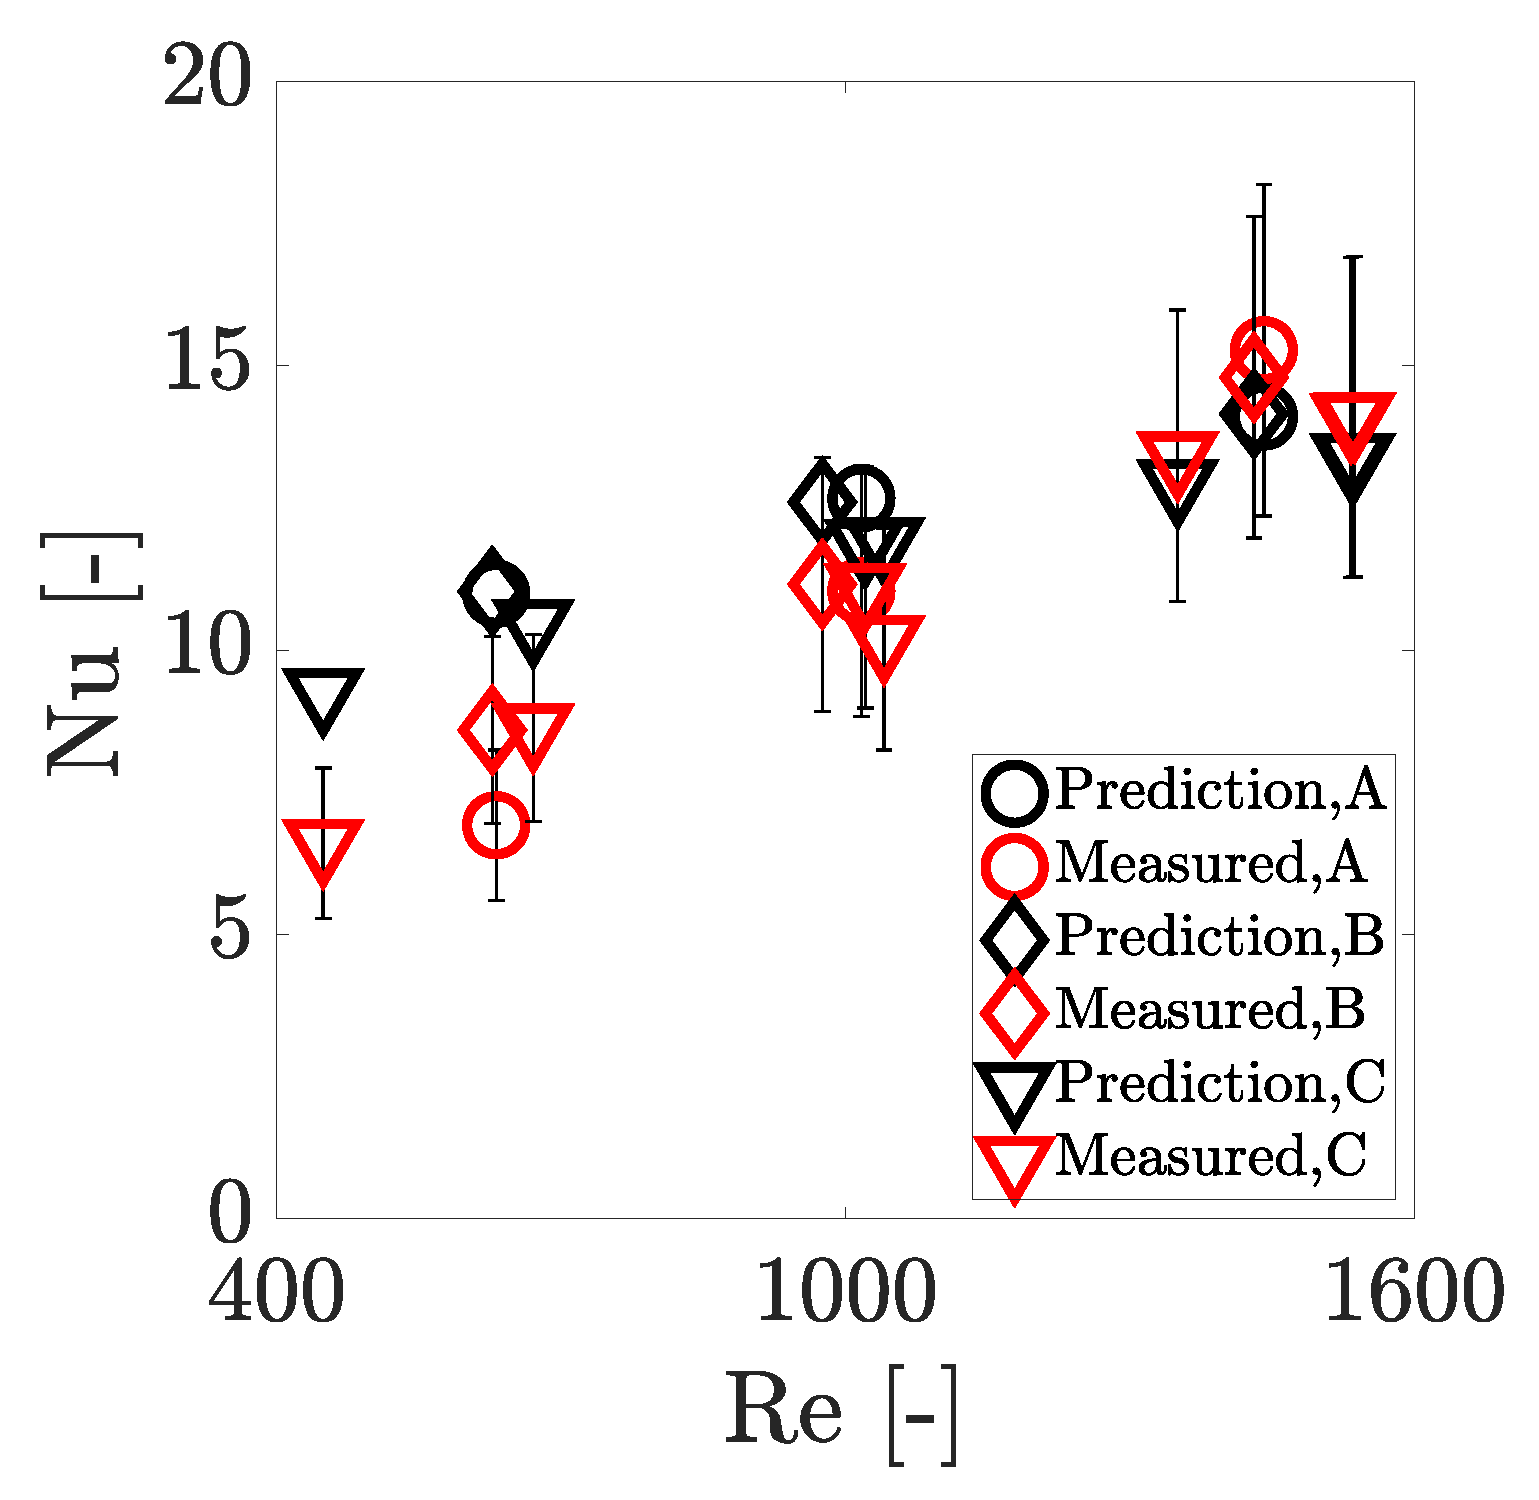
The coefficients of the regression could capture well the tabular data presented in Shah and London [29] as the mean absolute percentage deviation was 2.9% and the amounted to 0.99. Error estimates for the coefficients of regression amounted to 23%, 2%, and 11%, showing a good degree of confidence on the variability related to the number and the non-dimensional axial coordinate along the channels . Figure 5 shows the comparison of measurements obtained in single-phase tests with the reference values. For each measurement, the absence of subcooled boiling was verified by the high-speed flow visualization. The mean absolute percent error amounted to 13.7%, which is within the estimated average experimental uncertainty. Moreover, 77% of the predictions were within the uncertainty of the experimental values, and it was observed that, for the smallest tested, the predicted values were above the maximum calculated experimental uncertainty of 19.1%. The system being developed for two-phase flow and large heat dissipation, the single-phase tests at the lowest dissipated very low heat fluxes and could have experienced larger uncertainties than the calculated ones. Overall, the single-phase tests captured very well the expected heat transfer trends for single-phase flows, and it was considered satisfactory for the objectives of the present study, which focuses on two-phase flows and high heat flux dissipation.
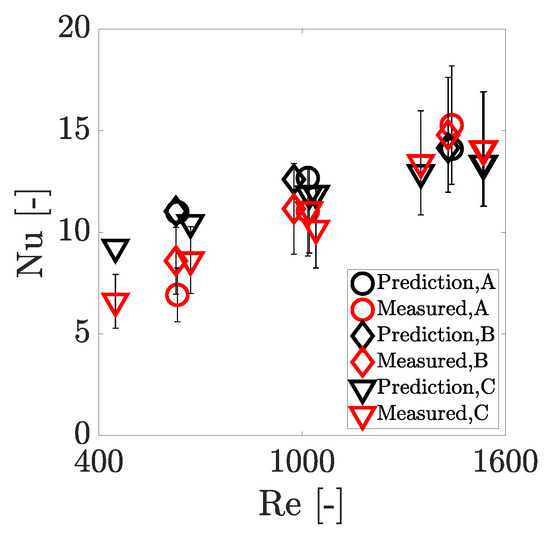
Figure 5.
Comparison between the predictions of by Shah and London [29] for simultaneously developing laminar flow and the experimental value measured in single-phase tests, having an mean absolute percent error of 13.7%.
3. Results
This section presents the results of the experiments. Section 3.1 outlines the overall cooling performance at the footprint of the three multi-microchannels. Section 3.2 gives an overview of the main flow patterns observed through the high-speed camera and presents flow maps. Section 3.3 elaborates on the characteristics of the flow boiling inside the channels of the three geometries, while Section 3.4 includes some observations on the effect of channel wall thickness and hydraulic diameter. Finally, Section 3.5 presents the results of the predictions of literature correlations against the average channel heat transfer coefficients obtained in the present study.
3.1. Footprint Heat Transfer Coefficients
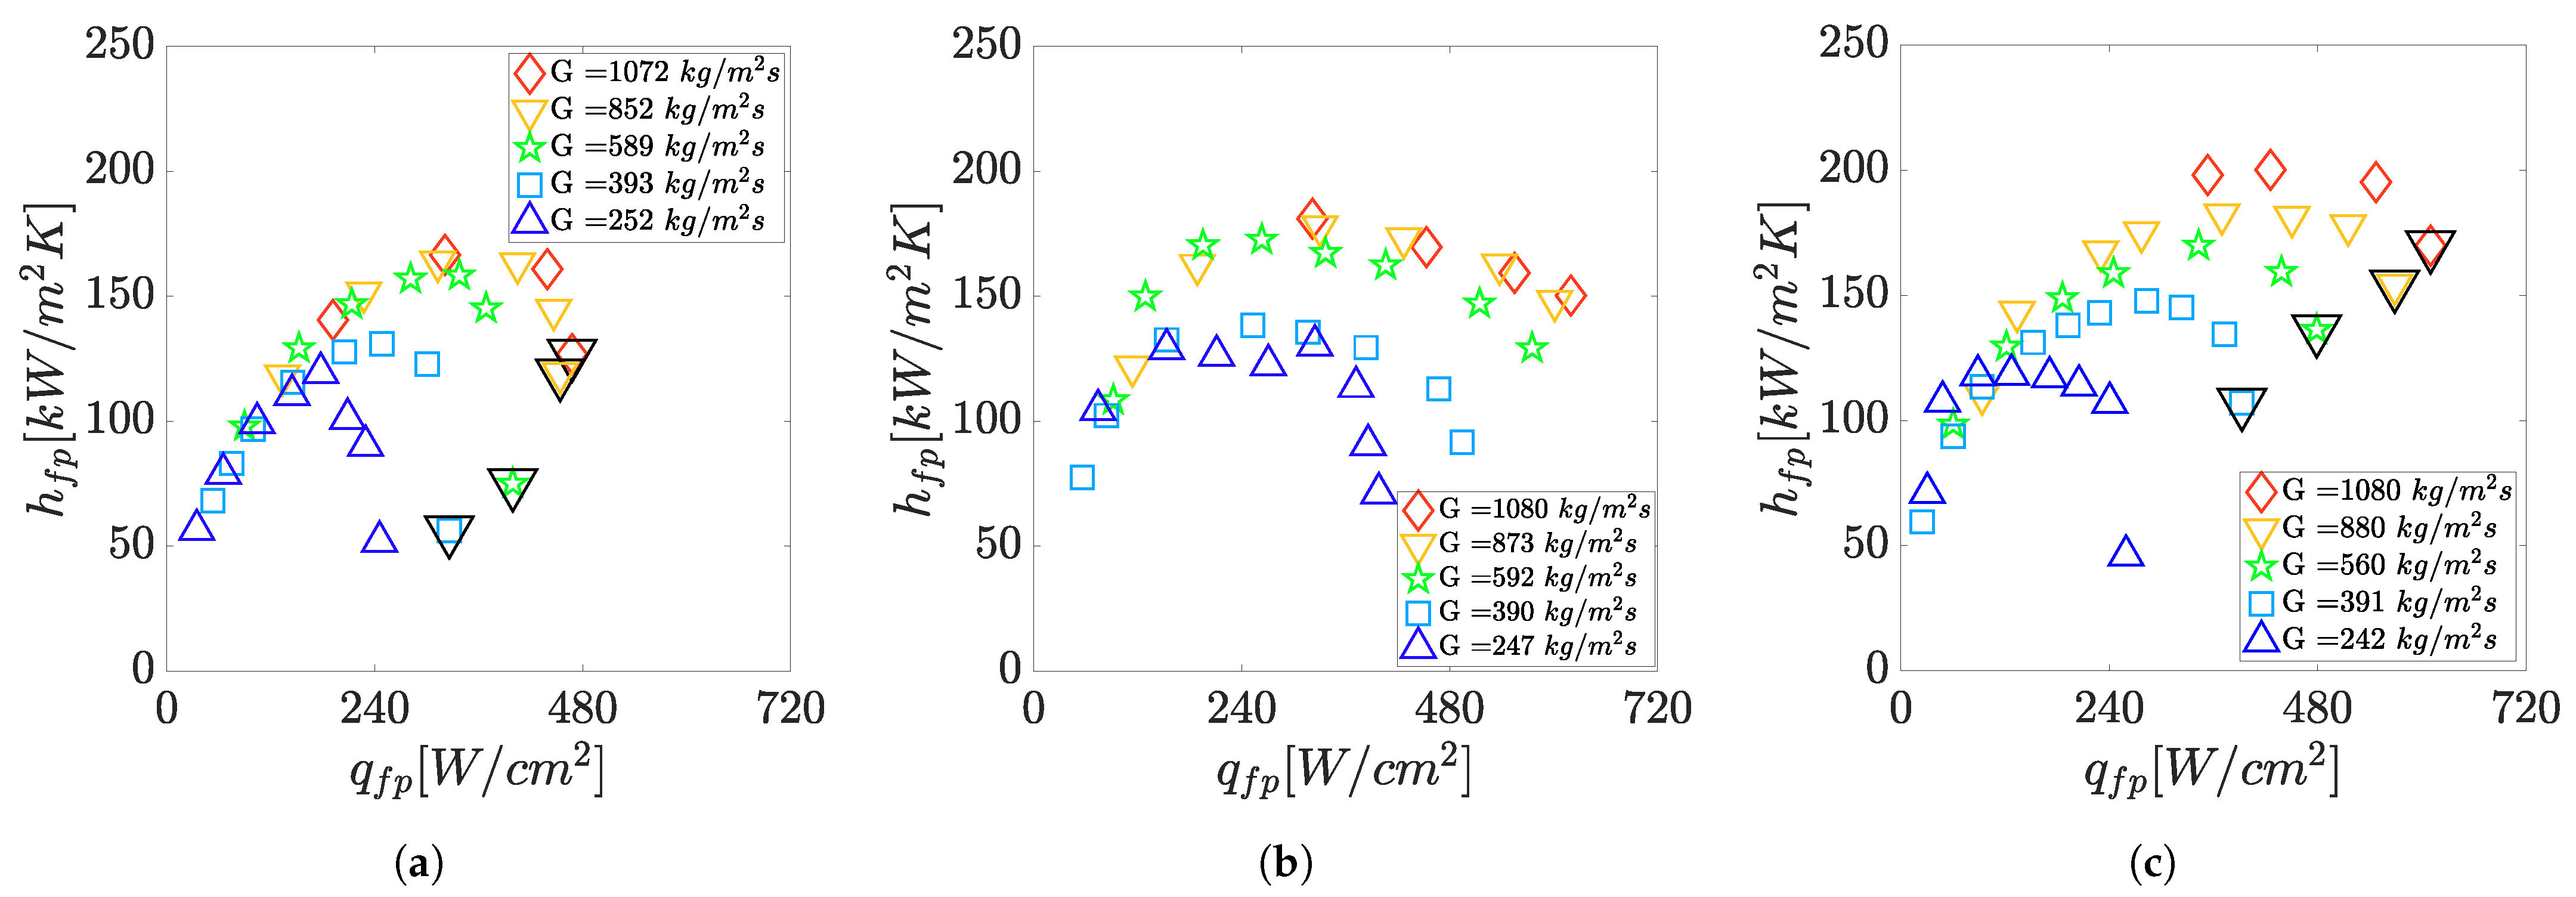
Figure 6 depicts the heat transfer coefficient at the footprint for Geometry A, B, and C. A black triangle around the marker is used to indicate a critical heat flux point, i.e., the last stable measurement before the appearance of a strong heater temperature excursion with a minimum increase in the voltage of the power supply. All the multi-microchannels were characterized by an initial region in which the heat transfer coefficient depended mainly on the footprint heat flux and showed an increasing trend. After that, as the dissipated heat flux increased, the heat transfer coefficient decreased. The steepness of the decrease depended on the geometry of the channels and the operating mass flux. The smoothest decrease was observed for Geometry B. Geometry C, which comprised the channels with the smallest hydraulic diameter, showed the strongest influence of the mass flux on the heat transfer coefficient in the decreasing region. A footprint heat transfer coefficient as high as 200 was obtained for Geometry C, while Geometry B showed slightly lower heat transfer coefficient values. Geometry B reached the limit temperature of 150 without experiencing the critical heat flux. The order of magnitude of the heat transfer coefficients for the studied solutions agree with the high heat transfer coefficient values obtained in other studies with copper microchannels and high aspect ratio [13,14].
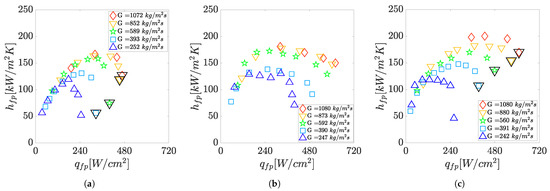
Figure 6.
Footprint heat transfer coefficient versus in Geometry A (a), B (b), and C (c) at a nominal saturation temperature of 30 °C at the outlet of the channels.
3.2. Visualization and Flow Maps
The dominant flow patterns observed close to the outlet of the channels are listed and shown in Figure 7. The classification of the visual features of the flow was partly based on [31,32]. In particular, each flow pattern was defined as follows:

Figure 7.
Images of the dominant flow patterns in the central channel of the heat sinks; labels refer to the conditions in the proximity of the outlet (right side).
- Bubbly flow: It mainly covered measurements in which isolated, coalescing bubbles or Taylor bubbles (at the bottom of the channels) with isolated or coalescing bubbles (at the top of the channels) appeared.
- Slug/churn flow: It covered tests in which vapor slugs intermittently appeared with a churn flow at the channel outlet. Bubble nucleation could be observed in the upper part of the channels and in the liquid film surrounding the vapor core during the slug flow.
- Semi-annular flow: It covered tests in which a wispy-annular flow intermittently appeared with a churn flow at the channel outlet. The liquid-vapor interface was irregular and continuously disturbed by bubble nucleation.
- Annular flow with incomplete wetting: It covered tests in which a stable wispy-annular flow was present and incomplete wetting intermittently appeared. Boiling activities could be observed in the liquid.
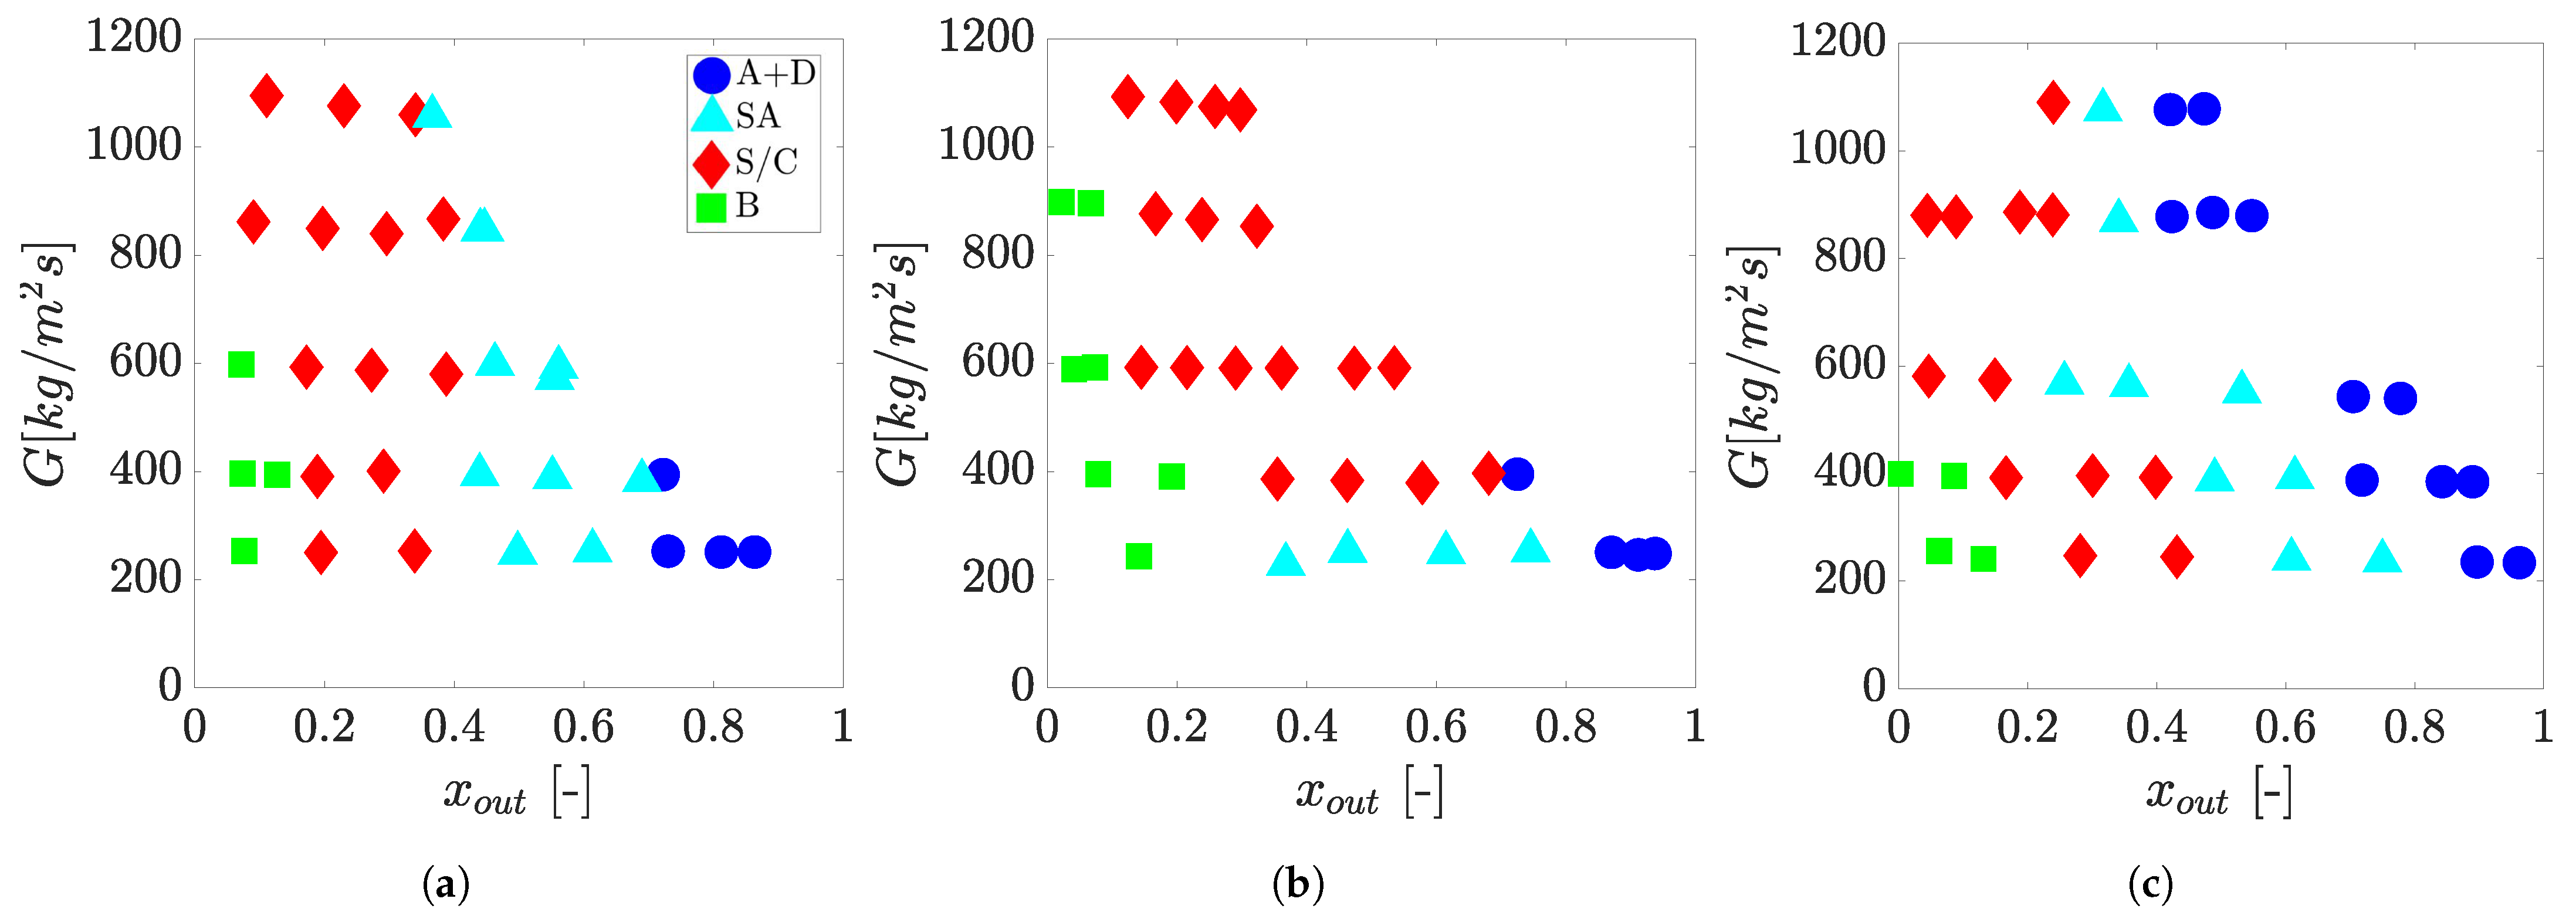
The appearance of each flow pattern is shown by the flow maps presented in Figure 8. The three heat sinks shared the same flow patterns, but did not show the same conditions of transition. The identification of transition to slug/churn flow and the transition to semi-annular flow was generally subject to a large uncertainty, due to the relatively large depth of the channels, the presence of many chaotic liquid-vapor interfaces, and the bias of the observer. In light of these conditions, the transition regions should be interpreted as purely qualitative. For each channel geometry, the bubbly flow was only observed for a limited amount of measurements, mainly at the lowest mass flux and outlet vapor quality tested. Geometry B showed the largest region with bubbly flow. The slug/churn flow appeared in a relevant portion of the experimental conditions and represented the dominant flow pattern for Geometry B. The transition to semi-annular flow was observed only at the lowest mass flux in Geometry B, while it was observed in several mass fluxes for the other two geometries. In Geometry A, the outlet vapor quality for the transition to semi-annular flow seemed independent of the mass flux, while this was not observed for Geometry C, which had the smallest channels. Finally, annular flow with incomplete wetting was observed mainly for Geometry C, with a minor appearance in Geometry A and Geometry B.
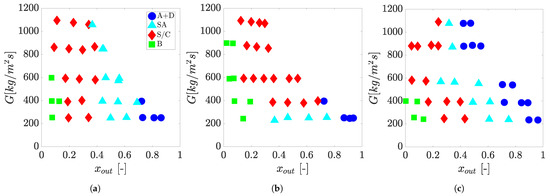
Figure 8.
Flow maps for Geometry A (a), B (b), and C (c):  B = Bubbly flow,
  S/C = slug/churn flow (intermittent),
  SA = Semi-annular flow,
  A + D = Annular flow with incomplete wetting.
 B = Bubbly flow,
  S/C = slug/churn flow (intermittent),
  SA = Semi-annular flow,
  A + D = Annular flow with incomplete wetting.
3.3. Flow Boiling Characteristics in the Channels
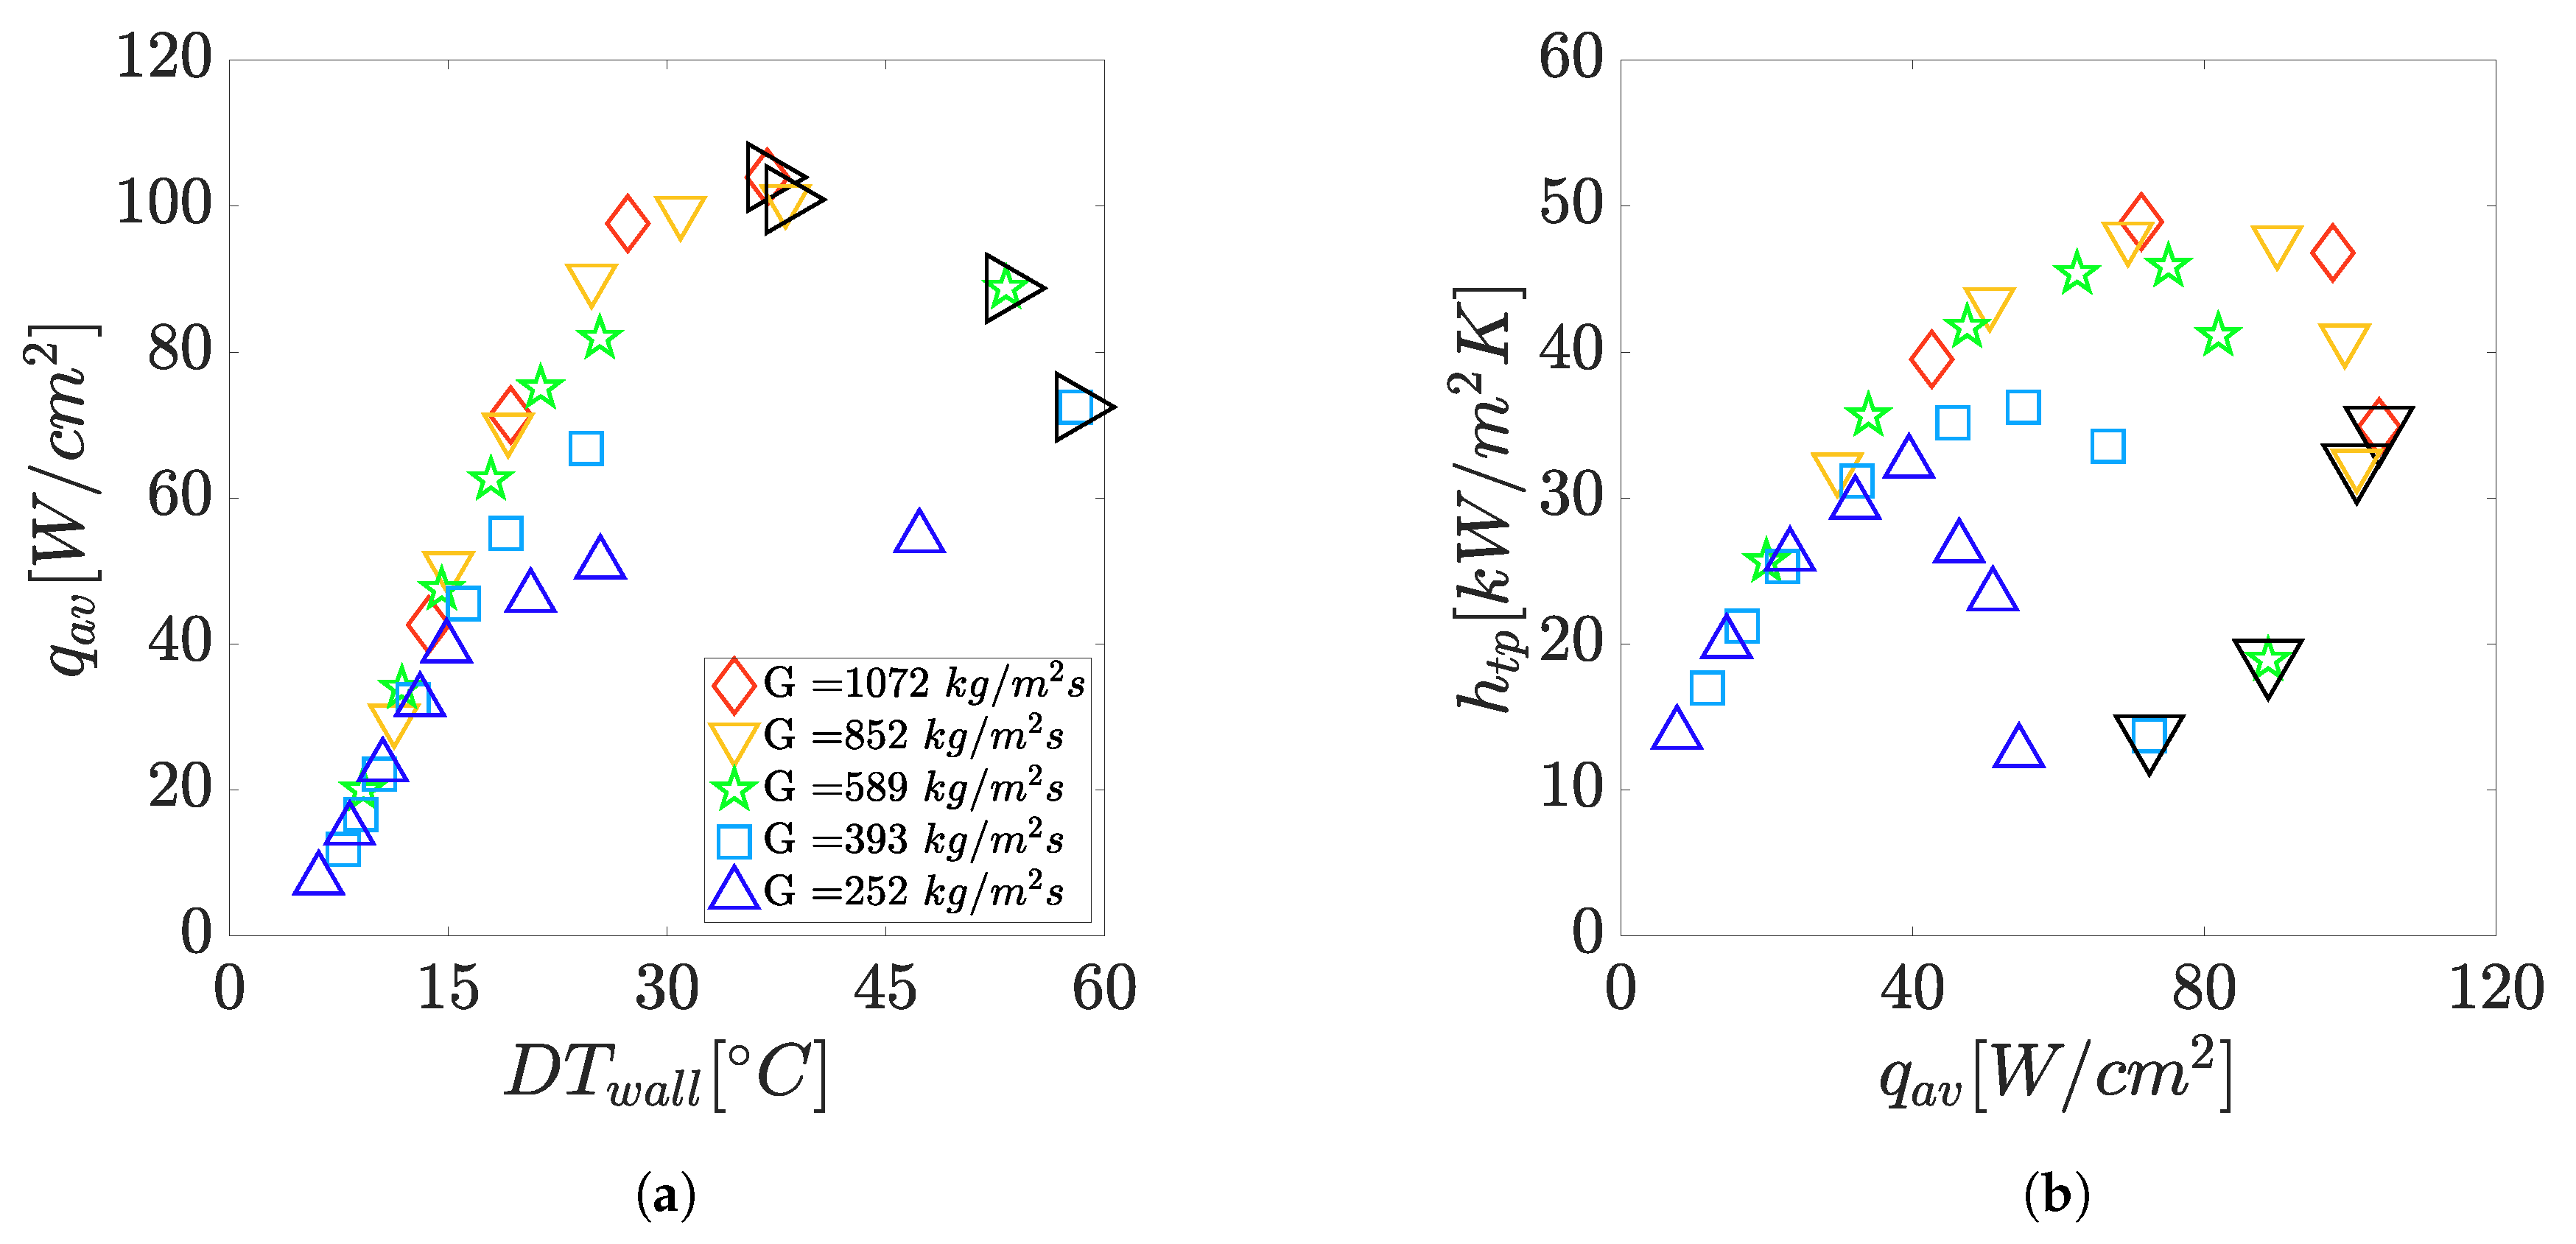
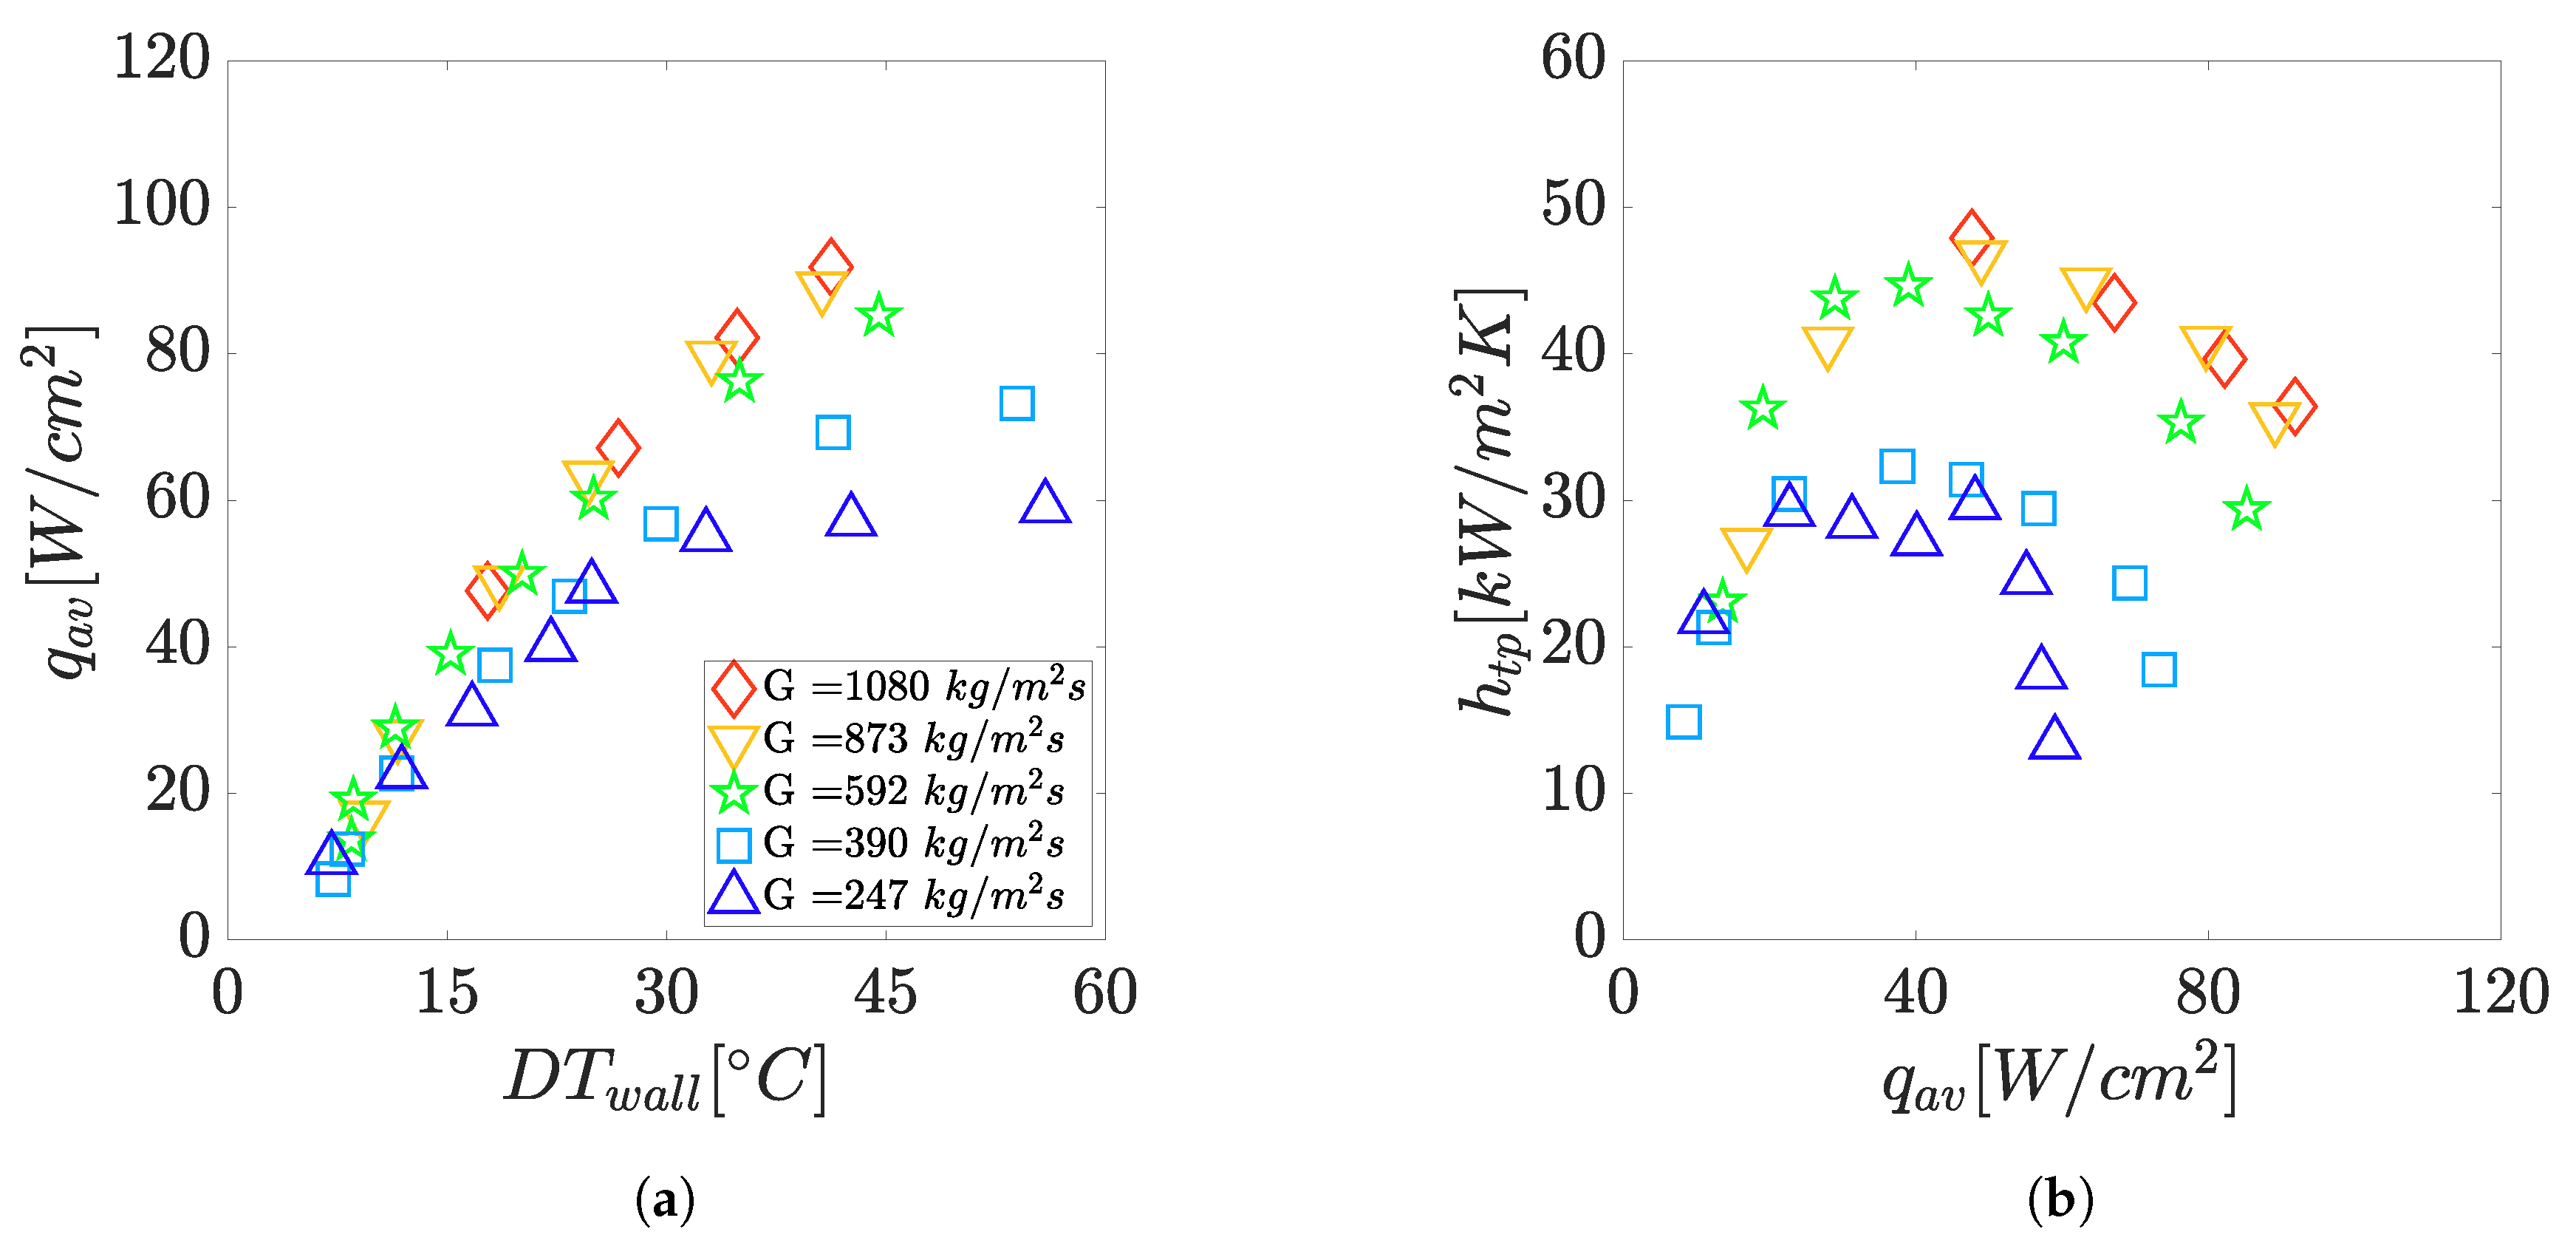
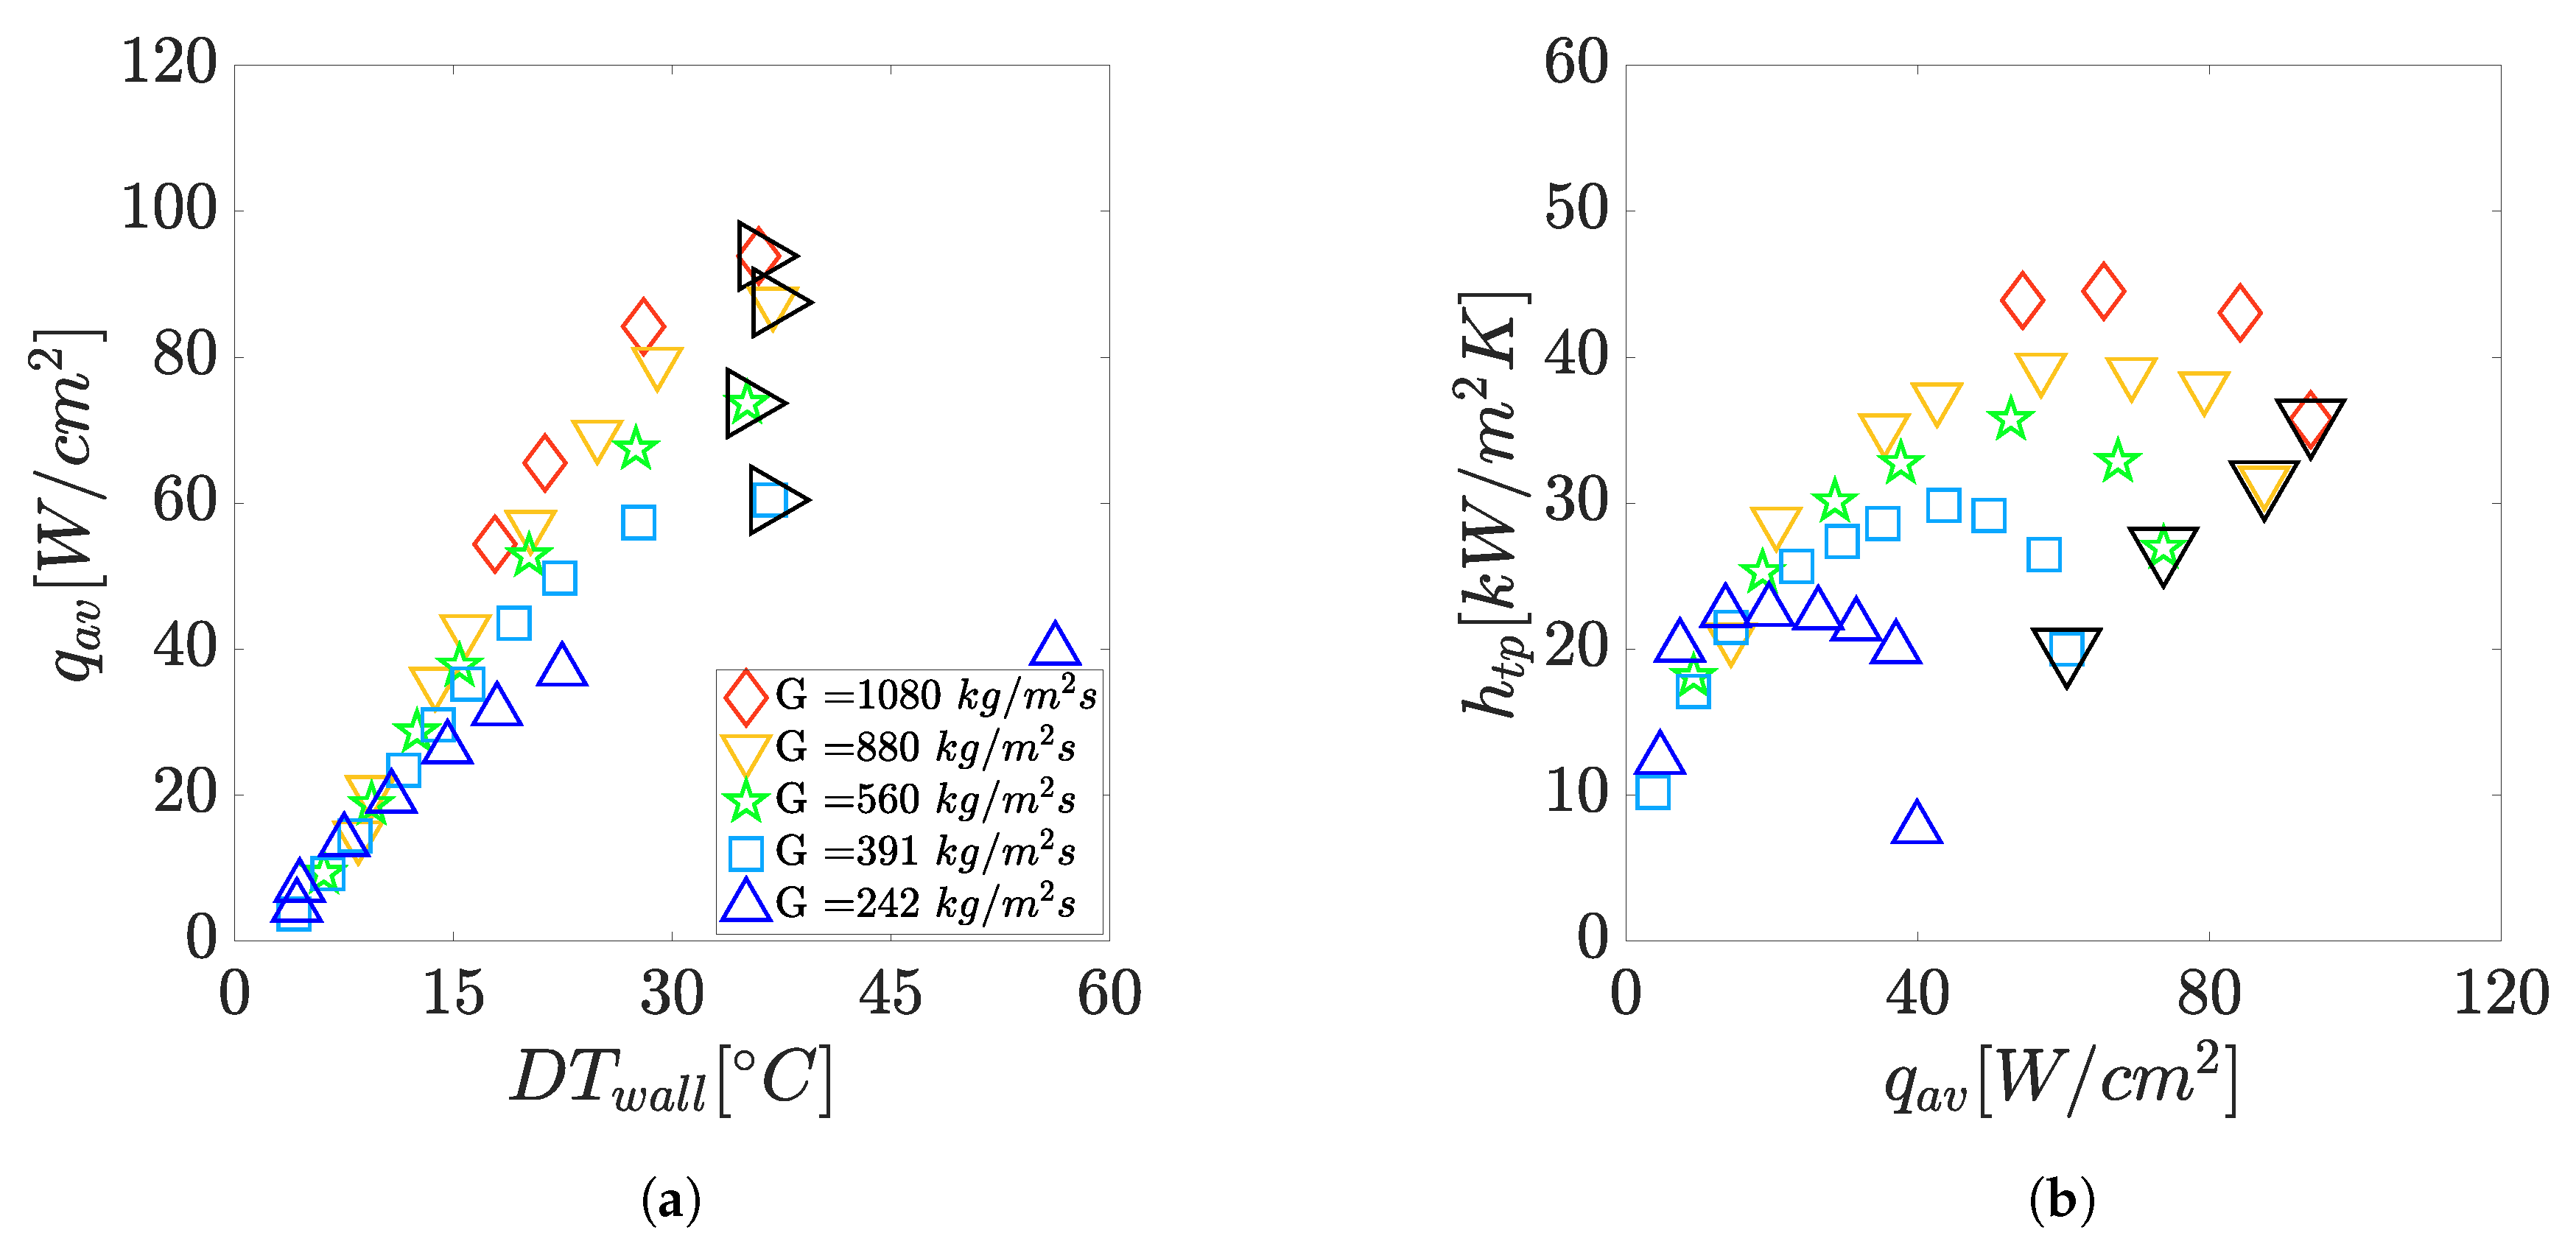
Figure 9, Figure 10 and Figure 11 describe the flow boiling characteristics in the channels through boiling curves and the average heat transfer coefficients for Geometry A, B, and C. Boiling curves are reported in terms of the average channel heat flux , defined by Equation (3), and the wall superheat . Again, the critical heat flux points are indicated by a triangle surrounding the marker in the plots.
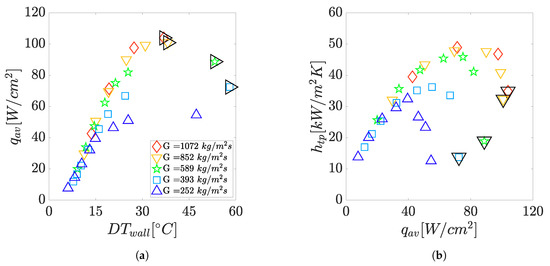
Figure 9.
Boiling curves (a) and channel average heat transfer coefficient (b) in Geometry A for a nominal saturation temperature of 30 °C at the outlet of the channels.
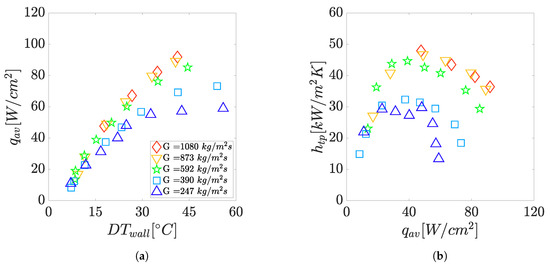
Figure 10.
Boiling curves (a) and channel average heat transfer coefficient (b) in Geometry B for a nominal saturation temperature of 30 °C at the outlet of the channels.
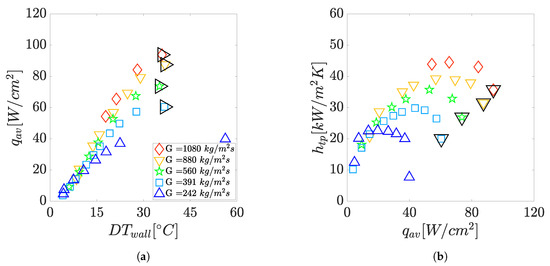
Figure 11.
Boiling curves (a) and channel average heat transfer coefficient (b) in Geometry C for a nominal saturation temperature of 30 °C at the outlet of the channels.
Figure 9 depicts the boiling curves for Geometry A. Two regions can be identified in Figure 9a: the first one, on the left side of the graph, where the wall superheat depends mainly on the average heat flux, and a second one, to the right, where the steepness decreases and an effect on the operating mass flux appears. The flow eventually reaches the critical heat flux, which depends on the operating mass flux. Figure 9b indicates an increase and then a decrease of the heat transfer coefficient for all the mass fluxes tested. After the decreasing region, critical heat flux was observed for all the mass fluxes except the case of 250 , which was characterized by an unstable flow distribution, allowing an alternate presence of superheated vapor at the outlet of a part of the channels when the highest heat fluxes were tested.
Figure 10 shows the results obtained for Geometry B. The dependency of the heat transfer coefficient on the channel heat and mass flux for Geometry B was similar to Geometry A. Major differences were: the critical heat flux was not observed in the conditions tested; thus, the maximum heater temperature of 150 could be reached stably. Moreover, a similar but more pronounced decrease in the average heat transfer coefficient was observed compared to Geometry A, not only close to the maximum heater temperature.
Figure 11 depicts the boiling curves and the heat transfer coefficients for Geometry C, where nominal channel width and wall thickness were both 200 µm. Again, the main trends observed for A and B were confirmed in Geometry C: both the channel heat and mass flux influenced the average heat transfer coefficient and an increasing/decreasing trend with respect to the average heat flux was observed. Considering the two highest mass fluxes, it can be observed that a larger difference in the heat transfer coefficient at 1100 and 850 was present, compared to the other two geometries, in which heat transfer coefficients were very close. Critical heat flux was obtained for all the mass flux tested except for 250 , which always gave stable wall temperature responses in spite of the vapor backflow observed through the high-speed visualization.
3.4. Comparison of the Geometries
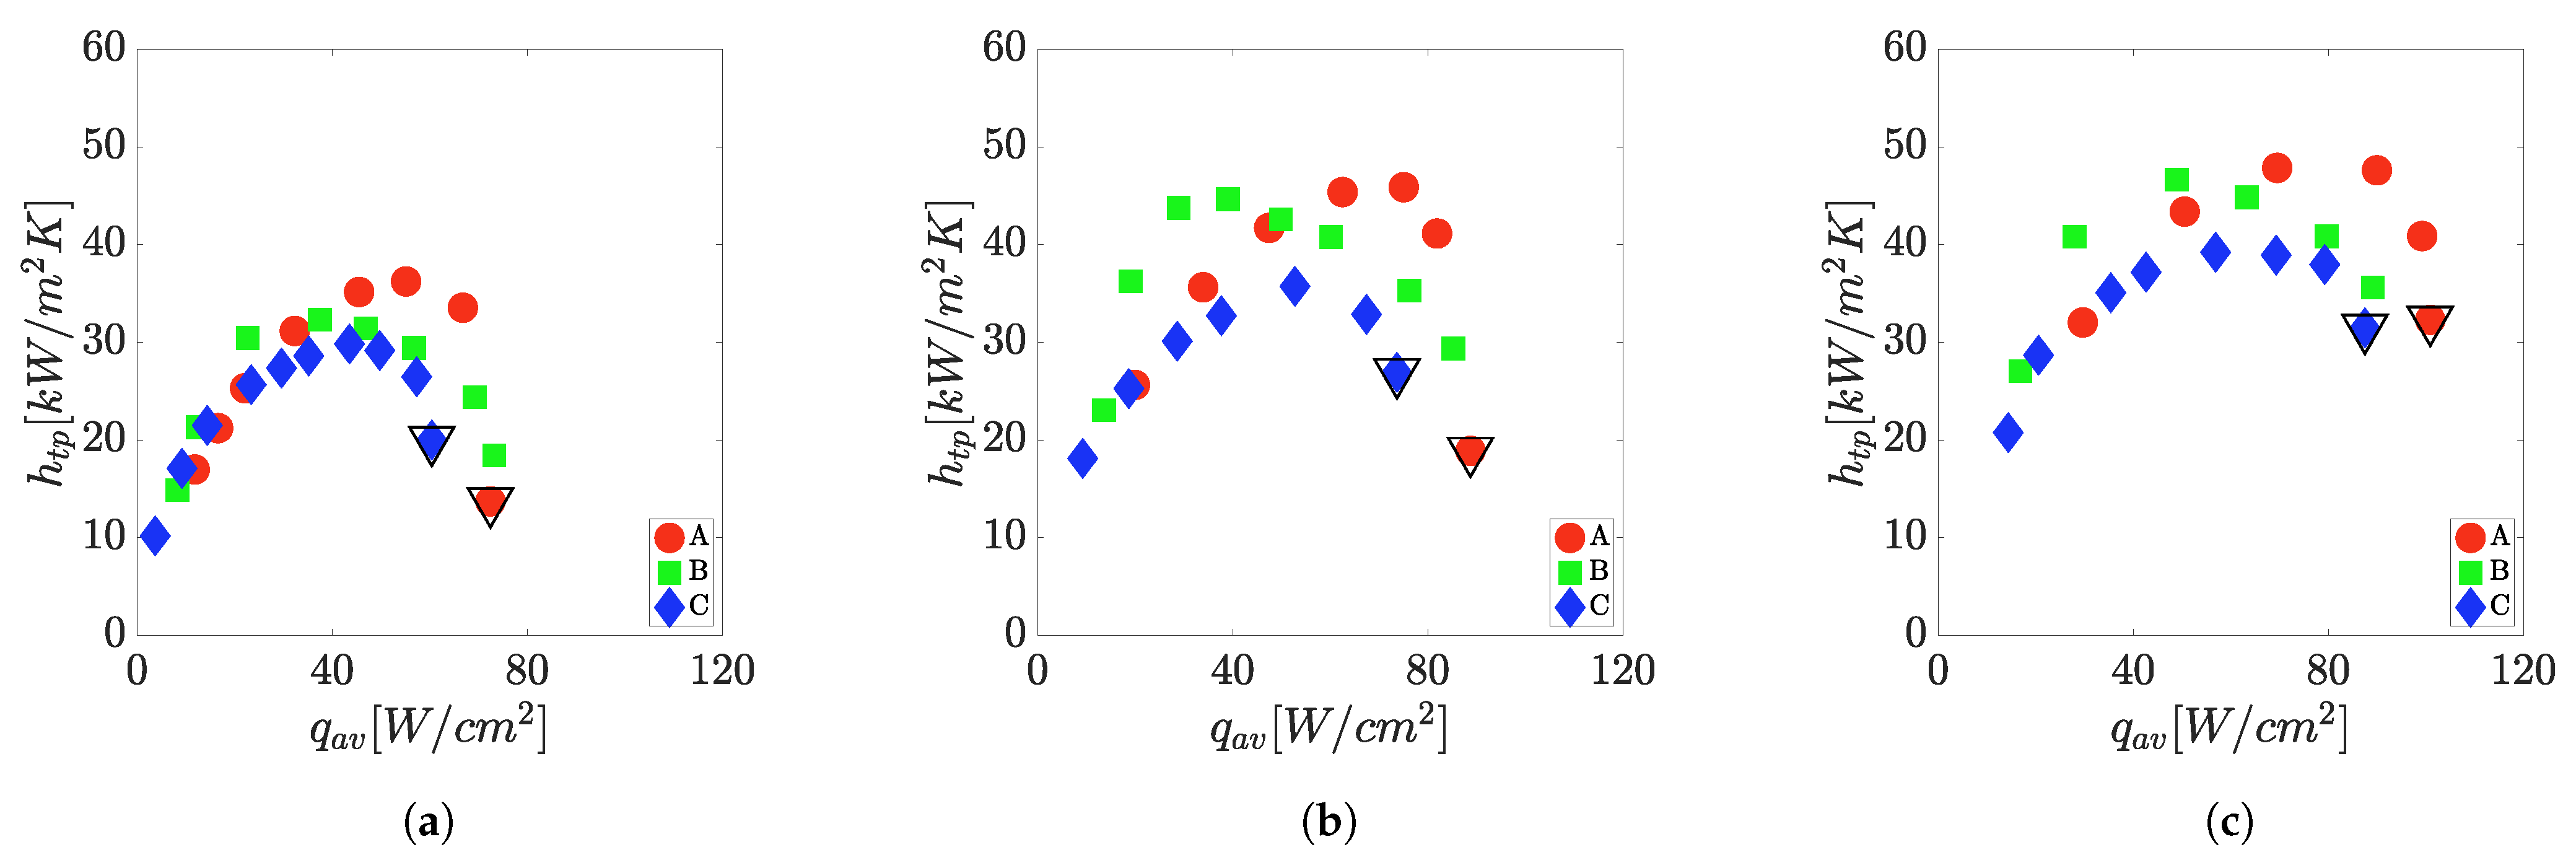
Figure 12 shows a comparison of the average heat transfer coefficient for Geometry A, B, and C, for nominal mass fluxes from 400 , 580 , and 870 and at the same average heat flux .
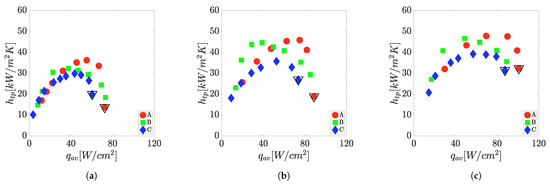
Figure 12.
Comparison of for the Geometry A ( ), Geometry B (
 ), and Geometry C (
 ) at a nominal saturation temperature of 30 °C at the outlet of the channels and different mass fluxes G: (a) G = 400 kg/m2s, (b) G = 580 kg/m2s, (c) G = 870 kg/m2s.
 ), Geometry B (
 ), and Geometry C (
 ) at a nominal saturation temperature of 30 °C at the outlet of the channels and different mass fluxes G: (a) G = 400 kg/m2s, (b) G = 580 kg/m2s, (c) G = 870 kg/m2s.
3.4.1. Effect of the Wall Thickness
A comparison of Geometry A and B outlined the effect of the wall thickness on the channel average heat transfer coefficient for a fixed hydraulic diameter. Geometry B had a measured wall thickness of 115 µm, while it was 306 µm for Geometry A. For all mass fluxes reported in Figure 12, the following could be observed: firstly, the increase of the average heat transfer coefficient was steeper for Geometry B and resulted in higher heat transfer coefficients until a maximum was reached; secondly, the decreasing trend in the heat transfer coefficient started at lower heat fluxes for Geometry B than for Geometry A and resulted in lower heat transfer coefficients at higher heat fluxes. Ideally, Geometry A and Geometry B should perform similarly; considering they are compared at the same operational conditions, they have a negligible difference in the channel diameter and present only a difference in the number of channels.
3.4.2. Effect of the Channel Hydraulic Diameter
The comparison of Geometry A and C may be used to explore the effect of the hydraulic diameter on the channel average heat transfer coefficient. Geometry A had a measured channel width of 293 µm, while it was only 198 µm for Geometry C. For all the mass fluxes reported in Figure 12, the following comments could be made: firstly, Geometry C showed an equal or lower heat transfer coefficient than Geometry A. Secondly, the maximum heat transfer coefficient in Geometry C was obtained at lower values of average heat fluxes compared to Geometry A. Thirdly, both geometries start with similar heat transfer coefficients. In addition, critical heat flux is lower in Geometry C than in Geometry A. Notice that the heat transfer area for Geometry A and Geometry C is different and the outlet vapor qualities are different for the same channel average heat flux. In addition, the number of channel is also different, and this may impact the flow distribution.
3.5. Comparison with Correlations
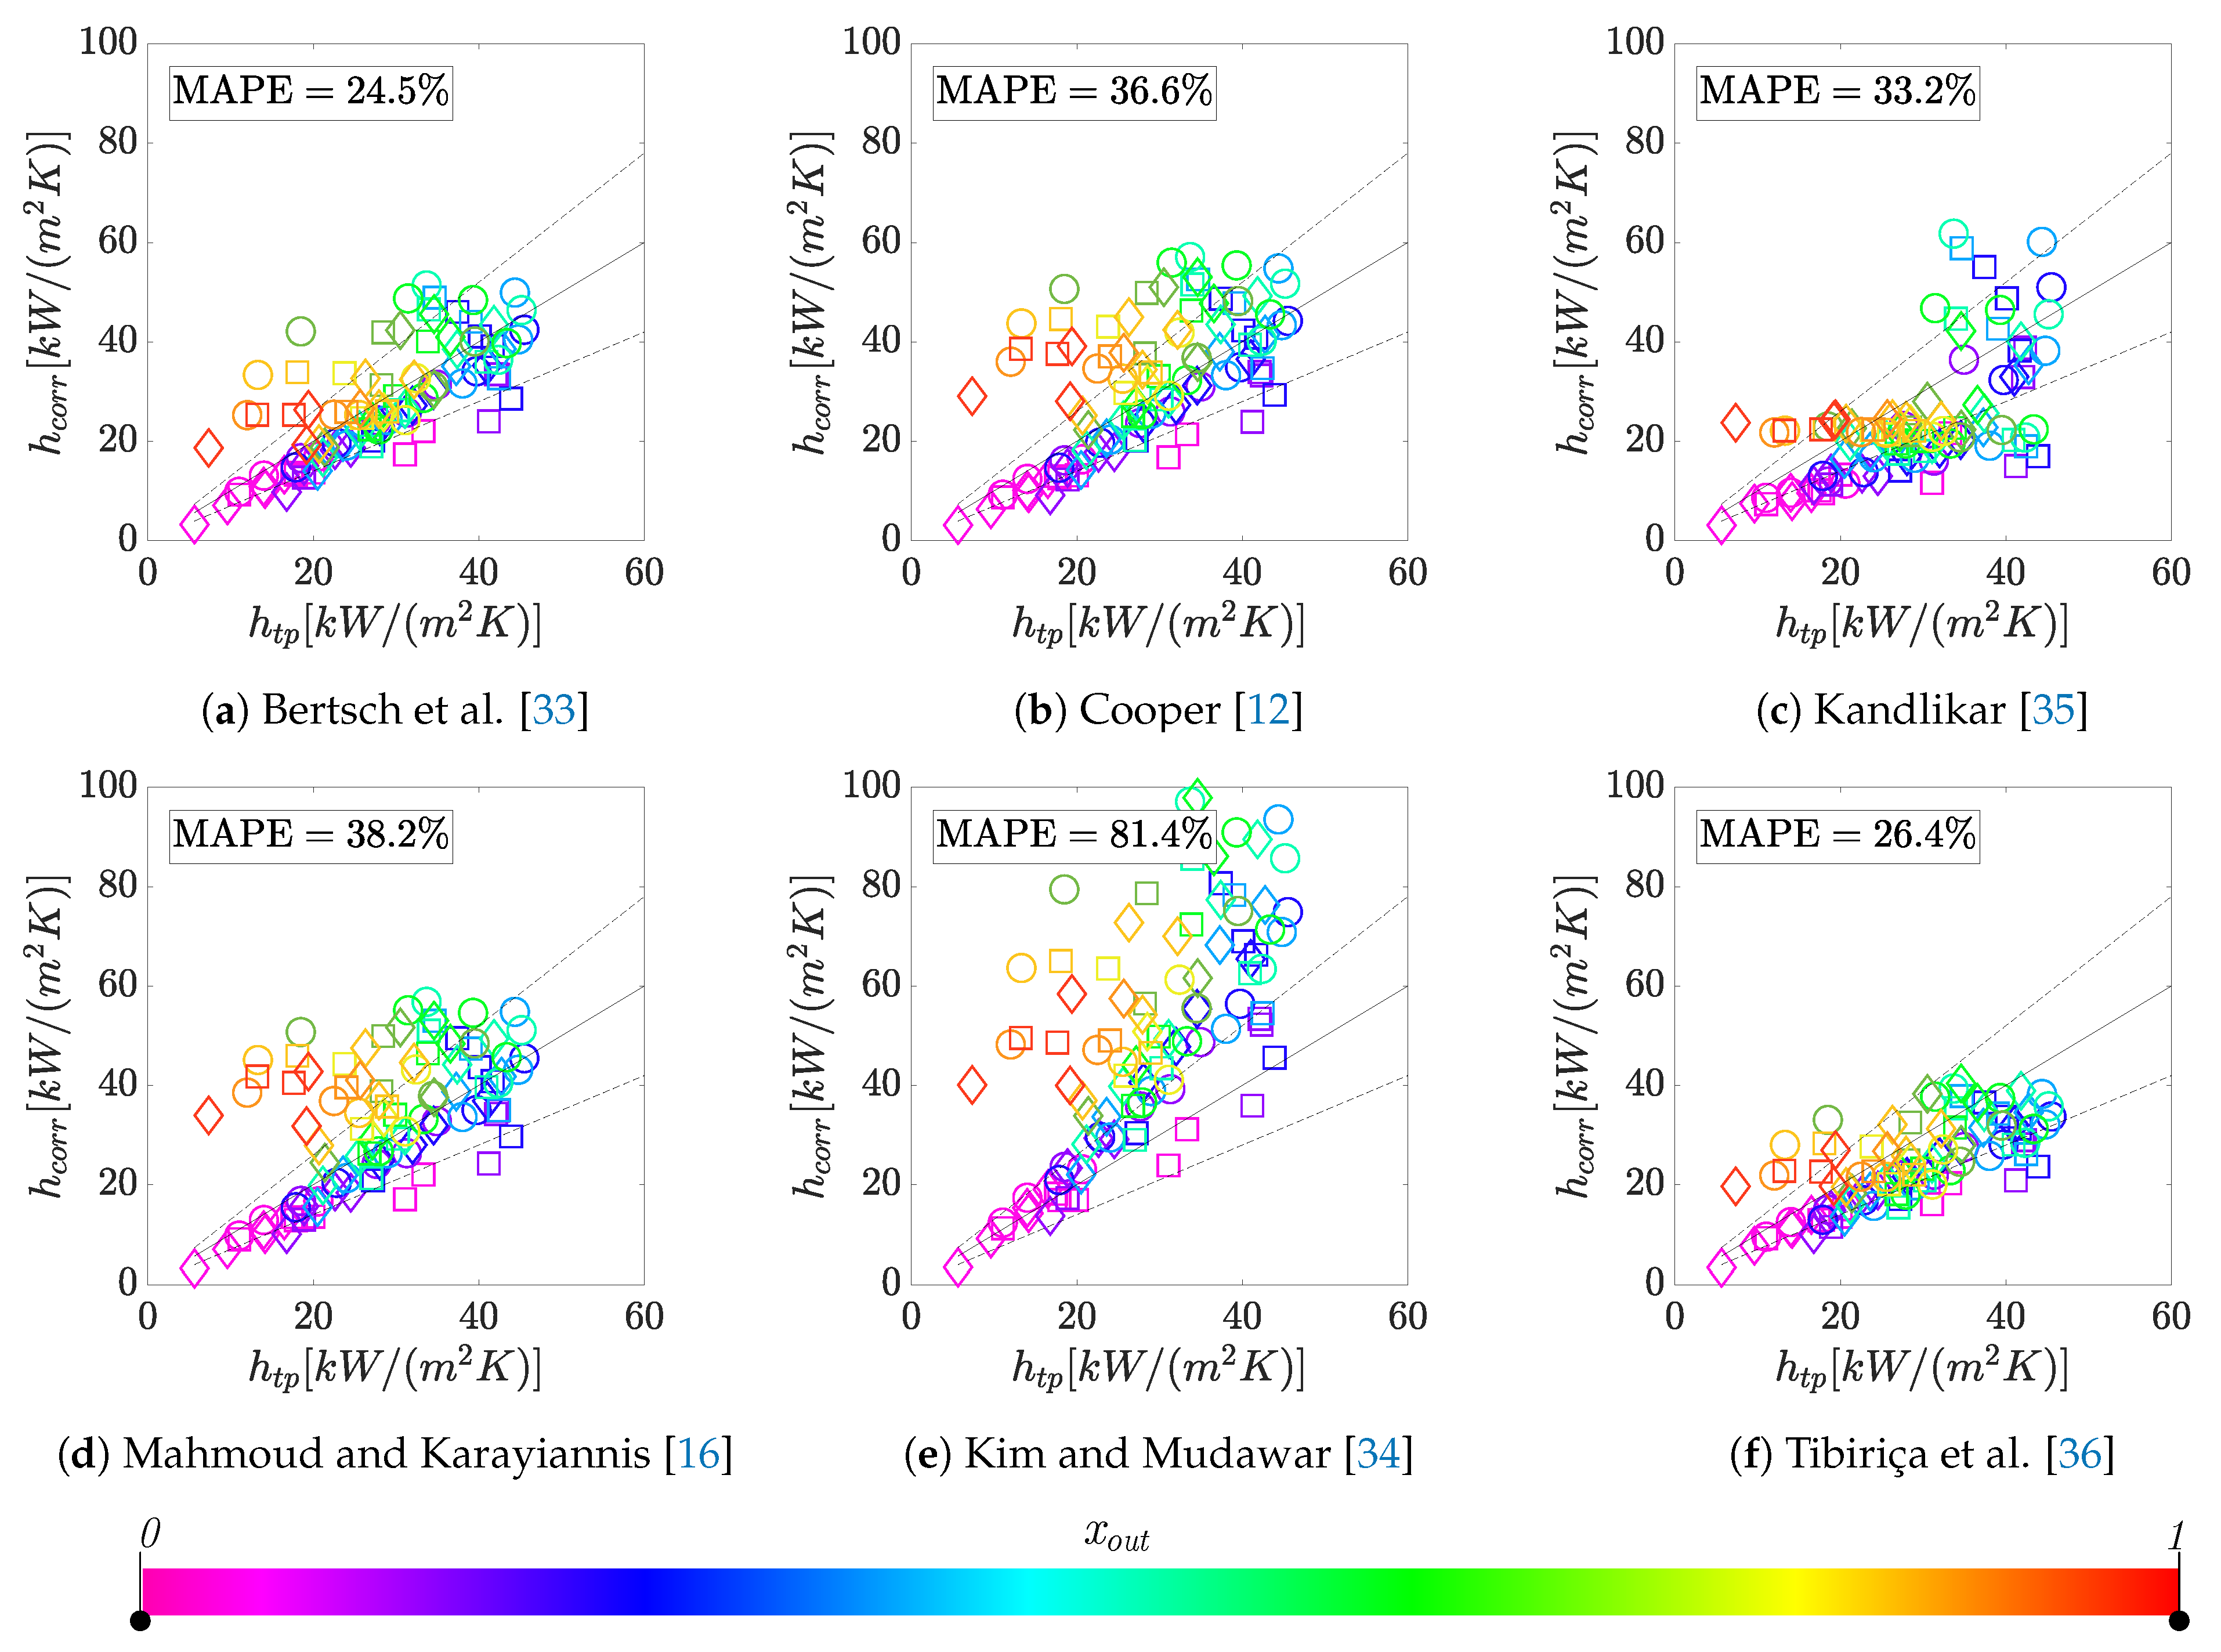
The experimental results presented in Section 3.3 were compared with the predictions by selected correlations for microchannel flow boiling from the literature. A comparison was performed with the correlations by Bertsch et al. [33], Mahmoud and Karayiannis [16], Kim and Mudawar [34], Kandlikar [35], and Tibiriça et al. [36], which were all developed upon a large databank of microchannels flow boiling measurements. The nucleate boiling correlation by Cooper [12] was also assessed, as the results in Section 3.3 suggest a dominance of nucleate boiling until the occurrence of a decrease in the heat transfer coefficient. The average channel heat flux was used as the local heat flux for the correlations. The predicted heat transfer coefficients were averaged flow-wise from local heat transfer computations in twentyfive local elements along the channel length, assuming uniform heat flux and a linear variation of the pressure between the inlet and the outlet of the channels. In the local elements with a negative vapor quality, the Cooper correlation [12] was used to predict the heat transfer coefficient due to the presence of subcooled boiling. For the above-mentioned correlations, Figure 13 shows the corresponding parity plot. The color of each marker is scaled from violet to red according to the outlet vapor qualities. Table 4 reports the results of the comparison in terms of Mean Absolute Percentage Error (MAPE) for each geometry. Bertsch et al. [33] gave the best prediction as 76% of the points were predicted with an absolute percentage error below 30%. Geometry C, which featured the smallest channel diameter, was the best predicted by Bertsch et al. [33], Tibiriça et al. [36], Kandlikar [35], and Cooper correlation [12]. On the other hand, except for the Kim and Mudawar correlation [34], Geometry B represents the case in which the correlations performed the least accurately.
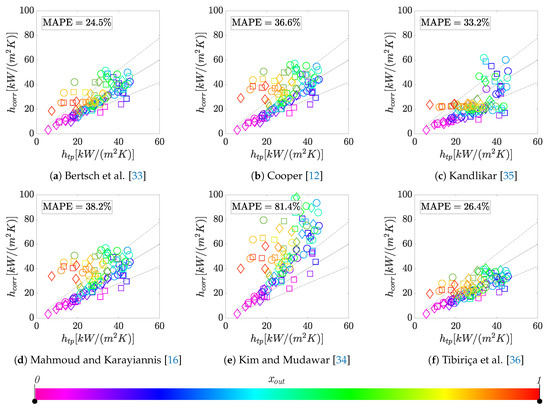
Figure 13.
Comparison of experimental results with the predictions by selected correlations, with 30% error bands indicated by the dotted lines. Colors scaled with the outlet vapor quality. Geometry A = ⚪, Geometry B = □, Geometry C = ♢.

Table 4.
Mean Absolute Percentage Error (MAPE) on the prediction of and overall share of the predictions with MAPE below 30% () for the selected correlations.
4. Discussion
In this section, the discussion of the results is presented. Section 4.1 discusses the results of the multi-microchannels comparison at the footprint level, while the results concerning the flow boiling characteristics are discussed in Section 4.3. Flow maps are discussed in Section 4.2. Finally, the results of the comparison with the correlations are discussed in Section 4.4.
4.1. Comparison of the Heat Sinks at Footprint Level
The footprint heat transfer coefficients presented in Section 3.1 gave an overview on which heat sink provides the best heat removal for a fixed footprint area of 1 . From the footprint perspective, the heat removal performance depends on a combined effect of the heat transfer of the two-phase mixture in the channels (channel heat transfer coefficient ), heat distribution in the walls (fin efficiency ), and area enhancement. These three factors are strongly interrelated, i.e., the fin efficiency depends on the heat transfer coefficient , and the heat transfer coefficient depends on the channel heat flux . The plots in Figure 6 show that the geometries with higher area enhancement, such as B and C, can benefit from higher dissipated footprint heat flux. Moreover, Geometry C experienced lower critical heat flux values compared with Geometry B, whereas the heat transfer performance appeared relatively equal considering all the measurements. If Geometry A is taken as the reference case and heat dissipation needs to be increased, the presented results suggest that an increase in heat transfer area by reducing wall thickness may be preferred to a reduction in the channel width. In other terms, the combination of a thin wall with a higher channel width may perform better than a thicker wall with a lower width, at the same footprint area. This may be because a lower hydraulic diameter can experience lower critical heat flux, as reported in Karayiannis and Mahmoud [8], but it should be seen more generally as a combined effect of the way the heat flux is distributed through the walls and the effectiveness of the heat transfer process inside the channels. In general, the observed performances at the footprint suggested that the investigated solutions represent a novel cooling method for power electronics with the possibility to dissipate several hundreds of . A full assessment of their capabilities, however, should also involve additional operating constraints specific to the applications, such as the pressure drop over the system and environment conditions.
4.2. Flow Maps
The flow maps presented in Section 3.2 gave an overview on the dominating flow patterns observed during the experiments. Regarding the visualization, Taylor bubbles and isolated bubbles could coexist in the height-wise direction for low values of the outlet vapor quality. This may be a peculiarity of high-aspect ratio channels which are asymmetrically heated and could suggest that the definition of confined flows should also take into account heat distribution and channels aspect ratio. The comparison of Geometry A and B in Figure 8 indicates that, reducing the wall thickness at the same hydraulic diameter, the establishment of the semi-annular flow regime could be delayed. This effect may be due to a non-uniform heat flux distribution taking place inside the very thin walls of Geometry B, where the intermittent slug/churn flow dominated at the outlet of the channels for most of the tests. It is not clear whether this behavior was related exclusively to wall thickness. Considering Geometry C, which featured the channels with the smallest diameter, semi-annular flow and annular flow with incomplete wetting appeared earlier than in Geometry A. This effect may be related to the stronger confinement experienced by the bubbles (comparing Geometry C with Geometry A) and the better heat flux distribution in the walls (comparing Geometry C and Geometry B). Overall, the obtained results suggest that flow patterns and transition conditions may be affected by the asymmetric heating resulting from thin channel walls. More experimental studies are needed to understand these effects.
4.3. Flow Boiling Characteristics in the Channels
The flow boiling characteristics in the channels can be analyzed by a combined analysis of the results in Section 3.3 for Geometry A, B, and C and the flow maps presented in Section 3.2. The presence of bubble nucleation on the upper part of the side walls of the channels during the slug/churn flow and the dependence on the heat flux suggest that nucleate boiling is the dominant heat transfer mechanism during flow boiling in these geometries. On the other hand, the decrease in heat transfer coefficient found for higher heat fluxes shown in Figure 9, Figure 10 and Figure 11 may be connected with incomplete wetting generated during the establishment of a wispy-annular flow. However, heat transfer degradation may be affected by flow distribution or be connected to partial boiling suppression. For all the geometries considered, the high-speed visualization showed a continuous boiling activity in the channels at the investigated conditions.
4.3.1. Effect of Wall Thickness
The effect of a reduction in wall thickness for the same hydraulic diameter was presented in Section 3.4.1. Geometry A and Geometry B showed slightly different heat transfer results in spite of the same channel dimension. Assuming that a negligible effect is played by the small variation in the number of channels, the thin walls of Geometry B may generate a less uniform heat flux distribution along the heat transfer perimeter than a thicker one, like in Geometry A. Since the heat transfer coefficient during boiling is dependent on the heat flux, its distribution along the wall perimeter may influence the overall heat transfer performance. The flow maps in Figure 8 also showed that the assumed asymmetric distribution of the heat flux may result in a delay of the semi-annular flow. In other words, the thin walls of Geometry B may have concentrated the heat flux at the bottom of the channels, resulting in a different heat transfer behavior of the heat sink. Referring to the region in which the heat transfer coefficient decreased, flow visualization suggested that the appearance of incomplete wetting during the wispy-annular flow may be responsible for it. However a semi-annular flow was not observed in the case of Geometry B, where slug/churn flows was dominant. In this case, boiling suppression could be an option to explain the reduction in the heat transfer coefficient. Further experiments are necessary.
4.3.2. Effect of the Hydraulic Diameter
The effect of a smaller channel hydraulic diameter at a similar ratio is presented in Section 3.4.2. In general, Geometry C showed an early decrease of the heat transfer coefficient compared to Geometry A. The flow maps in Figure 8 also reports that Geometry C experienced early establishment of semi-annular flow with incomplete wetting. These two observation seem to suggest that smaller channels promoted semi-annular flow and incomplete wetting, resulting in a worse heat transfer performance than in Geometry A. This could be also because, for the same mass flux and average channel heat flux, Geometry C had a higher outlet vapor quality.
4.4. Comparison with Correlations
The results from the assessment of literature correlation against the presented experimental data are described in Section 3.5. Figure 13 shows how the highest outlet vapor qualities tests were the ones experiencing the highest deviations, presumably due to the occurrence of an incomplete wetting. In general, the correlations with the best accuracy were Chen-type correlations, employing the Cooper correlation for the nucleate boiling contribution. Except for the Mahmoud and Karayiannis correlation [16], the implementation of a suppression and enhancement factor gave better prediction than the isolated Cooper correlation. The largest deviations obtained with Geometry B could be explained with the presence of very thin walls which may have experienced a strongly non-uniform heat flux distribution along the channel height. This effect is not directly accounted for in correlations and could represent an additional variable to consider when correlating flow boiling heat transfer data in multi-microchannels which are asymmetrically heated.
5. Conclusions
The present study investigated the heat transfer characteristics of R-134a during flow boiling in three copper multi-microchannel heat sinks for power electronics cooling. Mass fluxes ranging from 250 to 1100 and heat fluxes from low to critical values were investigated. The outlet saturation temperature was kept at 30 and the average channel heat flux was gradually increased at each test. Infrared thermography was used to measure the heater temperature. The analysis was supported by high-speed flow visualization at 20,000 fps from the top of the channels and along their entire length. Flow maps, boiling curves and average heat transfer coefficients were presented and compared among the multi-microchannels. The nominal width of the microchannels of the three heat sinks was 300 µm, 300 µm, and 200 µm, respectively, while the nominal wall thickness was 300 µm, 100 µm, and 200 µm, respectively. All the channels were 10 mm long and 1200 µm high. For these three channel geometries, the following could be concluded:
- The flow boiling heat transfer in the multi-microchannels showed a dependence on the channel heat and mass flux. A firstly increasing and then decreasing trend with respect to the channel heat flux was observed for all the multi-microchannels geometries. The mass flux influenced mainly the decreasing regions, where incomplete wetting or boiling suppression could occur. The visualization suggested that incomplete channel wetting could take place during a wispy-annular flow regime. Boiling was found to be continuously present in the microchannels for almost all the conditions investigated.
- The flow patterns observed at the end of the channels were bubbly flow, intermittent slug/churn flow, semi-annular flow, and wispy-annular flow with incomplete wetting. A comparison at the same outlet vapor quality showed that a dominance of the intermittent slug/churn flow was present for the multi-microchannels with the thinnest walls, while thicker walls seemed to facilitate the establishment of semi-annular flow. The wall thickness, and thus the heat flux distribution in the walls, could influence the transition boundaries from one regime to another for multi-microchannels which are asymmetrically heated. Further investigation is suggested to asses the effect of wall thickness on the flow patterns in a microchannel heat sink.
- The channel average heat transfer coefficient was influenced by the wall thickness at a fixed channel dimension. Thin walls in very short channels may be beneficial for area enhancement but may alter the uniformity of the heat flux distribution in the channel walls, thus complicating the exact control over the experimental conditions and affecting the average heat transfer performance. Further investigation is needed to enlighten more a potential effect of the wall thickness in microchannel heat sinks.
- The decrease of the hydraulic diameter at a fixed channel-width/wall-thickness ratio had a negative influence on the channel-level heat transfer coefficient for medium-to-high average channel heat flux. For the conditions tested, the improved heat transfer by increased area enhancement obtained with a reduced channel hydraulic diameter was found to be compromised by lower critical heat fluxes at the channels.
- For the same footprint area, the heat sink B and C, which featured higher area enhancements, showed a better heat dissipation during the flow boiling of R-134a. Up to 620 could be dissipated, keeping the heater temperature below 150 . For the conditions tested, the study suggests that enhancing the area by a reduction in the wall thickness could provide better performances than a reduction in the hydraulic diameter, when high-aspect ratio channels are employed to dissipate footprint heat fluxes in hundreds of .
- Footprint heat transfer coefficients were influenced by the footprint heat flux and channel average mass flux. Depending on the operating mass and heat flux, a footprint heat transfer coefficient in the range of 100 to 200 could be achieved over a footprint area of 1 with a maximum operational temperature of the heat sink of 150 . The order of magnitude of the heat transfer coefficients for the investigated solutions agree with the high heat transfer coefficient obtained in other studies with copper microchannels and high aspect ratio [13,14], as well as represents a novel cooling method for power electronics with the possibility to dissipate several hundreds of . A comprehensive assessment of the performances, however, would request to consider also the influence of the operating constraints specific to the applications, such as maximum pressure drop and environment conditions.
- The average channel heat transfer coefficients were best predicted by the Bertsch et al. correlation [33], with a mean absolute percent error of 24.5% over the experimental data obtained in this study. The correlation was thus satisfactory in predicting the average heat transfer coefficients in the high aspect ratio channels used for the presented investigation. Notably, among all the three geometries, the heat sink with the thinnest walls was the one predicted with the lowest accuracy for most of the correlations investigated.
Author Contributions
Conceptualization: G.C., W.B.M., and M.R.K.; Data curation: G.C.; Formal analysis: G.C.; Funding acquisition: M.R.K.; Investigation: G.C.; Methodology: G.C., W.B.M., M.R.K.; Software: G.C., M.R.K.; Supervision: W.B.M., M.R.K.; Visualization: G.C.; Writing—Original draft: G.C.; Writing—review and editing: G.C., W.B.M., K.E.M., B.P., M.R.K. All authors have read and agreed to the published version of the manuscript.
Funding
This work was supported by the Danish Council for Independent Research-Technology and Production Sciences (DFF—7017-00356), which is greatly acknowledged.
Data Availability Statement
The data presented in this study are available on request from the corresponding author.
Acknowledgments
The authors would like to thank Danilo Quagliotti from DTU Mechanical Engineering for giving the training on the confocal microscope and Carsten Gundlach from DTU Physics for the 3-D tomographic analysis on the test samples.
Conflicts of Interest
The authors declare no conflict of interest.
References
- EPE European Power Electronics and Drives Association. Position Paper on Energy Efficiency—The Role of Power Electronics; EPE European Power Electronics and Drives Association: Brussels, Belgium, 2007; pp. 1–18. [Google Scholar]
- Tuckerman, D.B.; Pease, R.F.W. High-performance heat sinking for VLSI. IEEE Electron Device Lett. 1981, 2, 126–129. [Google Scholar] [CrossRef]
- Palm, B. Heat transfer in microchannels. Microscale Thermophys. Eng. 2001, 5, 155–175. [Google Scholar] [CrossRef]
- Lazarek, G.M.; Black, S.H. Evaporative heat transfer, pressure drop and critical heat flux in a small vertical tube with R-113. Int. J. Heat Mass Transf. 1982, 25, 945–960. [Google Scholar] [CrossRef]
- Moriyama, K. The thermohydraulic characteristics of two-phase flow in extremely narrow channels (the frictional pressure drop and heat transfer of boiling two-phase flow, analytical model). Heat Transf. Jpn. Res. 1992, 21, 838–856. [Google Scholar]
- Agostini, B.; Fabbri, M.; Park, J.E.; Wojtan, L.; Thome, J.R.; Michel, B. State of the art of high heat flux cooling technologies. Heat Transf. Eng. 2007, 28, 258–281. [Google Scholar] [CrossRef]
- Kheirabadi, A.C.; Groulx, D. Cooling of server electronics: A design review of existing technology. Appl. Therm. Eng. 2016, 105, 622–638. [Google Scholar] [CrossRef]
- Karayiannis, T.G.; Mahmoud, M.M. Flow boiling in microchannels: Fundamentals and applications. Appl. Therm. Eng. 2017, 115, 1372–1397. [Google Scholar] [CrossRef]
- Karayiannis, T.G.; Mahmoud, M.M.; Kenning, D.B. A study of discrepancies in flow boiling results in small to microdiameter metallic tubes. Exp. Therm. Fluid Sci. 2012, 36, 126–142. [Google Scholar] [CrossRef]
- Bertsch, S.S.; Groll, E.A.; Garimella, S.V. Refrigerant flow boiling heat transfer in parallel microchannels as a function of local vapor quality. Int. J. Heat Mass Transf. 2008, 51, 4775–4787. [Google Scholar] [CrossRef]
- Bertsch, S.S.; Groll, E.A.; Garimella, S.V. Effects of heat flux, mass flux, vapor quality, and saturation temperature on flow boiling heat transfer in microchannels. Int. J. Multiph. Flow 2009, 35, 142–154. [Google Scholar] [CrossRef]
- Cooper, M.G. Heat Flow Rates in Saturated Nucleate Pool Boiling-A Wide-Ranging Examination Using Reduced Properties. Adv. Heat Transf. 1984, 16, 157–239. [Google Scholar] [CrossRef]
- Madhour, Y.; Olivier, J.; Costa-Patry, E.; Paredes, S.; Michel, B.; Thome, J.R. Flow boiling of R134a in a multi-microchannel heat sink with hotspot heaters for energy-efficient microelectronic CPU cooling applications. IEEE Trans. Compon. Packag. Manuf. Technol. 2011, 1, 873–883. [Google Scholar] [CrossRef]
- do Nascimento, F.J.; Leão, H.L.S.L.; Ribatski, G. An experimental study on flow boiling heat transfer of R134a in a microchannel-based heat sink. Exp. Therm. Fluid Sci. 2013, 45, 117–127. [Google Scholar] [CrossRef]
- Fayyadh, E.M.; Mahmoud, M.M.; Sefiane, K.; Karayiannis, T.G. Flow boiling heat transfer of R134a in multi microchannels. Int. J. Heat Mass Transf. 2017, 110, 422–436. [Google Scholar] [CrossRef]
- Mahmoud, M.M.; Karayiannis, T.G. Heat transfer correlation for flow boiling in small to micro tubes. Int. J. Heat Mass Transf. 2013, 66, 553–574. [Google Scholar] [CrossRef]
- Lee, J.; Mudawar, I. Two-phase flow in high-heat-flux micro-channel heat sink for refrigeration cooling applications: Part II—Heat transfer characteristics. Int. J. Heat Mass Transf. 2005, 48, 941–955. [Google Scholar] [CrossRef]
- Thiangtham, P.; Keepaiboon, C.; Kiatpachai, P.; Asirvatham, L.G.; Mahian, O.; Dalkilic, A.S.; Wongwises, S. An experimental study on two-phase flow patterns and heat transfer characteristics during boiling of R134a flowing through a multi-microchannel heat sink. Int. J. Heat Mass Transf. 2016, 98, 390–400. [Google Scholar] [CrossRef]
- Dalkılıç, A.S.; Özman, C.; Sakamatapan, K.; Wongwises, S. Experimental investigation on the flow boiling of R134a in a multi-microchannel heat sink. Int. Commun. Heat Mass Transf. 2018, 91, 125–137. [Google Scholar] [CrossRef]
- Joint Comitee for Guides in Metrology. Evaluation of Measurement Data—Guide to the Expression of Uncertainty in Measurement; Technical Report. Clin. Chem. 2008, 50, 977–978. [Google Scholar] [CrossRef]
- Young, P.L.; Brackbill, T.P.; Kandlikar, S.G. Estimating roughness parameters resulting from various machining techniques for fluid flow applications. In Proceedings of the 5th International Conference on Nanochannels, Microchannels and Minichannels, Puebla, Mexico, 18–20 June 2007; pp. 827–836. [Google Scholar] [CrossRef]
- Jones, B.J.; McHale, J.P.; Garimella, S.V. The Influence of Surface Roughness on Nucleate Pool Boiling Heat Transfer. J. Heat Transf. 2009, 131, 121009. [Google Scholar] [CrossRef]
- Jafari, R.; Okutucu-Özyurt, T.; Ünver, H.Ö.; Bayer, Ö. Experimental investigation of surface roughness effects on the flow boiling of R134a in microchannels. Exp. Therm. Fluid Sci. 2016, 79, 222–230. [Google Scholar] [CrossRef]
- Incropera, F.P. Fundamentals of Heat and Mass Transfer; John Wiley: New York, NY, USA, 2007; p. 997. [Google Scholar]
- Shanks, H.R.; Maycock, P.D.; Sidles, P.H.; Danielson, G.C. Thermal conductivity of silicon from 300 to 1400°K. Phys. Rev. 1963, 130, 1743–1748. [Google Scholar] [CrossRef]
- Idelchik, I.E. Handbook of Hydraulic Resistance, 2nd Edition. J. Press. Vessel. Technol. 1987, 109, 260–261. [Google Scholar] [CrossRef]
- Chalfi, T.Y.; Ghiaasiaan, S.M. Pressure drop caused by flow area changes in capillaries under low flow conditions. Int. J. Multiph. Flow 2008, 34, 2–12. [Google Scholar] [CrossRef]
- Moffat, R.J. Describing the uncertainties in experimental results. Exp. Therm. Fluid Sci. 1988, 1, 3–17. [Google Scholar] [CrossRef]
- Shah, R.; London, A. Rectangular Ducts. Laminar Flow Forced Convect. Ducts 1978, 196–222. [Google Scholar] [CrossRef]
- Montgomery, S.R.; Wibulswas, P. Laminar flow heat transfer for simultaneously developing velocity and temperature profiles in ducts of rectangular cross section. Appl. Sci. Res. 1968, 18, 247–259. [Google Scholar] [CrossRef]
- Huo, X.; Chen, L.; Tian, Y.S.; Karayiannis, T.G. Flow boiling and flow regimes in small diameter tubes. Appl. Therm. Eng. 2004, 24, 1225–1239. [Google Scholar] [CrossRef]
- Revellin, R.; Thome, J.R. A new type of diabatic flow pattern map for boiling heat transfer in microchannels. J. Micromech. Microeng. 2007, 17, 788–796. [Google Scholar] [CrossRef]
- Bertsch, S.S.; Groll, E.A.; Garimella, S.V. A composite heat transfer correlation for saturated flow boiling in small channels. Int. J. Heat Mass Transf. 2009, 52, 2110–2118. [Google Scholar] [CrossRef]
- Kim, S.M.; Mudawar, I. Universal approach to predicting saturated flow boiling heat transfer in mini/micro-channels—Part II. Two-phase heat transfer coefficient. Int. J. Heat Mass Transf. 2013, 64, 1239–1256. [Google Scholar] [CrossRef]
- Kandlikar, S.G.; Balasubramanian, P. An Extension of the Flow Boiling Correlation to Transition, Laminar, and Deep Laminar Flows and Microchannels. Heat Transf. Eng. 2004, 25, 86–93. [Google Scholar] [CrossRef]
- Tibiriçá, C.B.; Rocha, D.M.; Sueth, I.L.S., Jr.; Bochio, G.; Shimizu, G.K.K.; Barbosa, M.C.; dos Santos Ferreira, S. A complete set of simple and optimized correlations for microchannel flow boiling and two-phase flow applications. Appl. Therm. Eng. 2017, 126, 774–795. [Google Scholar] [CrossRef]
Publisher’s Note: MDPI stays neutral with regard to jurisdictional claims in published maps and institutional affiliations. |
© 2021 by the authors. Licensee MDPI, Basel, Switzerland. This article is an open access article distributed under the terms and conditions of the Creative Commons Attribution (CC BY) license (http://creativecommons.org/licenses/by/4.0/).

