Abstract
Environmental concerns are forcing the replacement of commonly used refrigerants, and finding new fluids is a top priority. Soon the R134a will be banned, and the hydro-fluoro-olefin (HFO) R1234ze(E) has been indicated as an alternative due to its smaller global warming potential (GWP) and shorter atmospheric lifetime. Nevertheless, for an optimal replacement, its thermo-fluid-dynamic characteristics have to be assessed. Flow boiling experiments (saturation temperature Tsat = 5 °C, mass flux G = 65 ÷ 222 kg·m−2·s−1, mean quality xm = 0.15 ÷ 0.95, quality changes ∆x = 0.06 ÷ 0.6) inside a microfin tube were performed to compare the pressure drop per unit length and the heat transfer coefficient provided by the two fluids. The results were benchmarked for some correlations. In commonly adopted operating conditions, the two fluids show a very similar behavior, while benchmark showed that some correlations are available to properly predict the pressure drop for both fluids. However, only one is satisfactory for the heat transfer coefficient. In conclusion, R1234ze(E) proved to be a suitable drop-in replacement for the R134a, whereas further efforts are recommended to refine and adapt the available predictive models.
1. Introduction
Increasing environmental concerns led the European Parliament to develop a roadmap to move to a competitive low carbon economy. Accordingly, the European Regulation (EU) No. 517/2014 [1], dealing with fluorinated greenhouse gases and their replacement, prescribes progressive steps for the phase-out of HFC. The gradual elimination of the refrigerants commonly used in HVAC devices makes the search for new fluids suitable to prospective HVAC systems a top priority. In the near future, R134a will be banned and the hydro-fluoro-olefin (HFO) R1234ze(E) has been indicated as a promising alternative since its global warming potential (GWP) is much smaller (less than 1 for R1234ze(E) and 1430 for R134a [2]) and its atmospheric lifetime is much shorter (17 days for R1234ze(E) and 13.8 years for R134a [2]). In spite of such environmentally friendly features, drawbacks have also been reported [3], mainly a slight flammability, and a negative impact on overall performance (mostly due to vapor compression efficiency). In recent years, the attention of the scientific community has been particularly focused on the assessment of performance variation due to the replacement of the fluids (the so-called drop-in replacement) at two different levels, namely the overall energy system (and/or its components), and the process (thermodynamics, transport phenomena). As significant examples of the former, Censi and Padovan [3] examined a microfin shell and tube evaporator, showing 25% lower heat transfer rate for R1234ze(E) due to the same reduction in the volume flow rate but similar values of the overall heat transfer coefficient. Colombo et al. [4] reported a 12.3% maximum reduction in the COP of a water-to-water heat pump compared to R134a. Zhang [5] analyzed a plate heat exchanger highlighting that the HFOs refrigerants, compared to their HFC counterparts, show higher heat transfer coefficients and pressure drops when operating under the same conditions.
On the other hand, extensive investigations are reported for thermodynamic properties and transport phenomena. The following sample is closer to the subject of this paper than other literature contributions. Concerning fluid properties, Życzkowski et al. [6] provided functional equations for R1234ze(E) property calculations, whereas Ghafri [7] studied the thermodynamics properties of R1234ze(E) mixtures. Turning the attention to transport phenomena, Kedzierski and Park [8] reported the heat transfer characteristics of the aforementioned refrigerants during flow boiling inside a microfin tube (8.92 mm inner diameter). The experiments revealed that R1234ze(E) has a lower heat transfer coefficient and the authors explained the results as a consequence of the higher thermal conductivity of R134a liquid phase. Goto et al. [9] measured the heat transfer coefficient and pressure drop during condensation and evaporation of R410a and HCFC22 inside internally grooved tubes (either spiral groove or herring-bone groove). The results indicate that the herring-bone grooved tube is more effective in enhancing evaporation and condensation. Bandarra Filho et al. [10] analyzed the pressure drop of refrigerant R134a under convective boiling conditions in horizontal smooth and micro-finned copper tubes. They found that good results can be obtained for smooth pipes, whereas a specific correlation was developed for the finned ones. Analogous work was done later on by Rollmann et al. [11] and by Colombo et al. [12], in which heat transfer coefficient and pressure drop for R134a were, respectively, studied. In both cases, as already noticed in previous studies, microfin tubes are characterized by a larger heat transfer coefficient and pressure drop than smooth tube, specifically as reported in [12] during evaporation at low mass fluxes. Microfin tubes are particularly effective in increasing heat transfer and, moreover, the dry-out phenomenon takes place at larger qualities than in smooth pipes. Diani et al. [13] compared the experimental values of heat transfer coefficient, frictional pressure drop, and vapor quality at the onset of dry-out against the values estimated by empirical correlations available in the open literature. The experiments performed in a 2.4 mm inner diameter microfin tube highlighted that, compared to an equivalent smooth tube, the microfin pipe presents an average enhancement factor of 2.4, which decreases as mass velocity and heat flux increase. Li [14] performed a characterization of the R1234ze(E) in microchannels during evaporation.
To improve our understanding of the heat transfer features, many studies on flow patter maps during flow boiling and convective condensation have been performed. Their large number is related to the disagreement on the quantities that better describe the two-phase flow behavior. Specific to condensation, and worth mentioning, are the studies on flow visualization by Soliman [15] and the flow pattern maps by Breber et al. [16], Tandon et al. [17], El Hajal et al. [18], and Milkie et al. [19]. For flow boiling analysis, studies to note are Kattan et al. [20], Rollmann et al. [21], Wojtan et al. [22] (all of which are based on vapor quality x and mass flux G), and Zhuang et al. [23], which is defined using the Martinelli parameter Xtt and the modified Weber number. As highlighted by Rollmann et al. [21], the microfin tube shows a flow regime, named the helix flow, related to the helical structure of the microfins which cannot be observed in a smooth tube. Helix flow could be a possible explanation of the disagreement between the data and the predictions of the flow pattern maps and the correlations developed for the smooth tube when applied to the microfin tube. The main characteristic feature of the helix flow is the tangential motion of the refrigerant, as a consequence of the helical arrangement of the fins, that cause an asymmetrical distribution (referred to the vertical direction) of the liquid, which wets a larger portion of the tube perimeter than in the smooth tube at the same operating conditions. Eventually, Yang et al. [24] also investigated the two-phase flow patterns and flow transitions for R1234ze(E) in a smooth horizontal tube with an inner diameter of 6 mm, highlighting the fact that the plug to slug and slug to annular transition are influenced by mass flux, heat flux, and saturation pressure.
During the years a large number of correlations were developed to predict the pressure drop and the heat transfer coefficient. Concerning the former, one of the first works was performed by Muller-Steinhagen and Heck [25] in the 1980s. A more up-to-date work was published by Xu et al. [26] in 2012, in which a comprehensive survey of correlations and experimental investigation of two-phase frictional pressure drop is reported. Worth mentioning is the work by Sun and Mishima [27], published in 2008, in which correlations developed for refrigerants were taken into account and compared. In particular, the results show the accuracy of the Lockhart–Martinelli method, Mishima and Hibiki correlation, Zhang and Mishima correlation, and the Lee and Mudawar correlation in the laminar-laminar region is very close to each other, whereas the Muller-Steinhagen and Heck correlation is the best among the evaluated correlations in the turbulent-turbulent region. Moreover, in this paper, a modified Chisholm correlation was proposed, which resulted in better correlations than all of the previously evaluated ones with a mean relative error around 29%. Concerning the heat transfer coefficient, among the earliest correlations are the semi-empirical correlations by Murata et al. [28] and Kattan et al. [29], whereas the multi-variable regression analysis by Mehendale [30] is one of the most recent (2018).
2. Test Rig
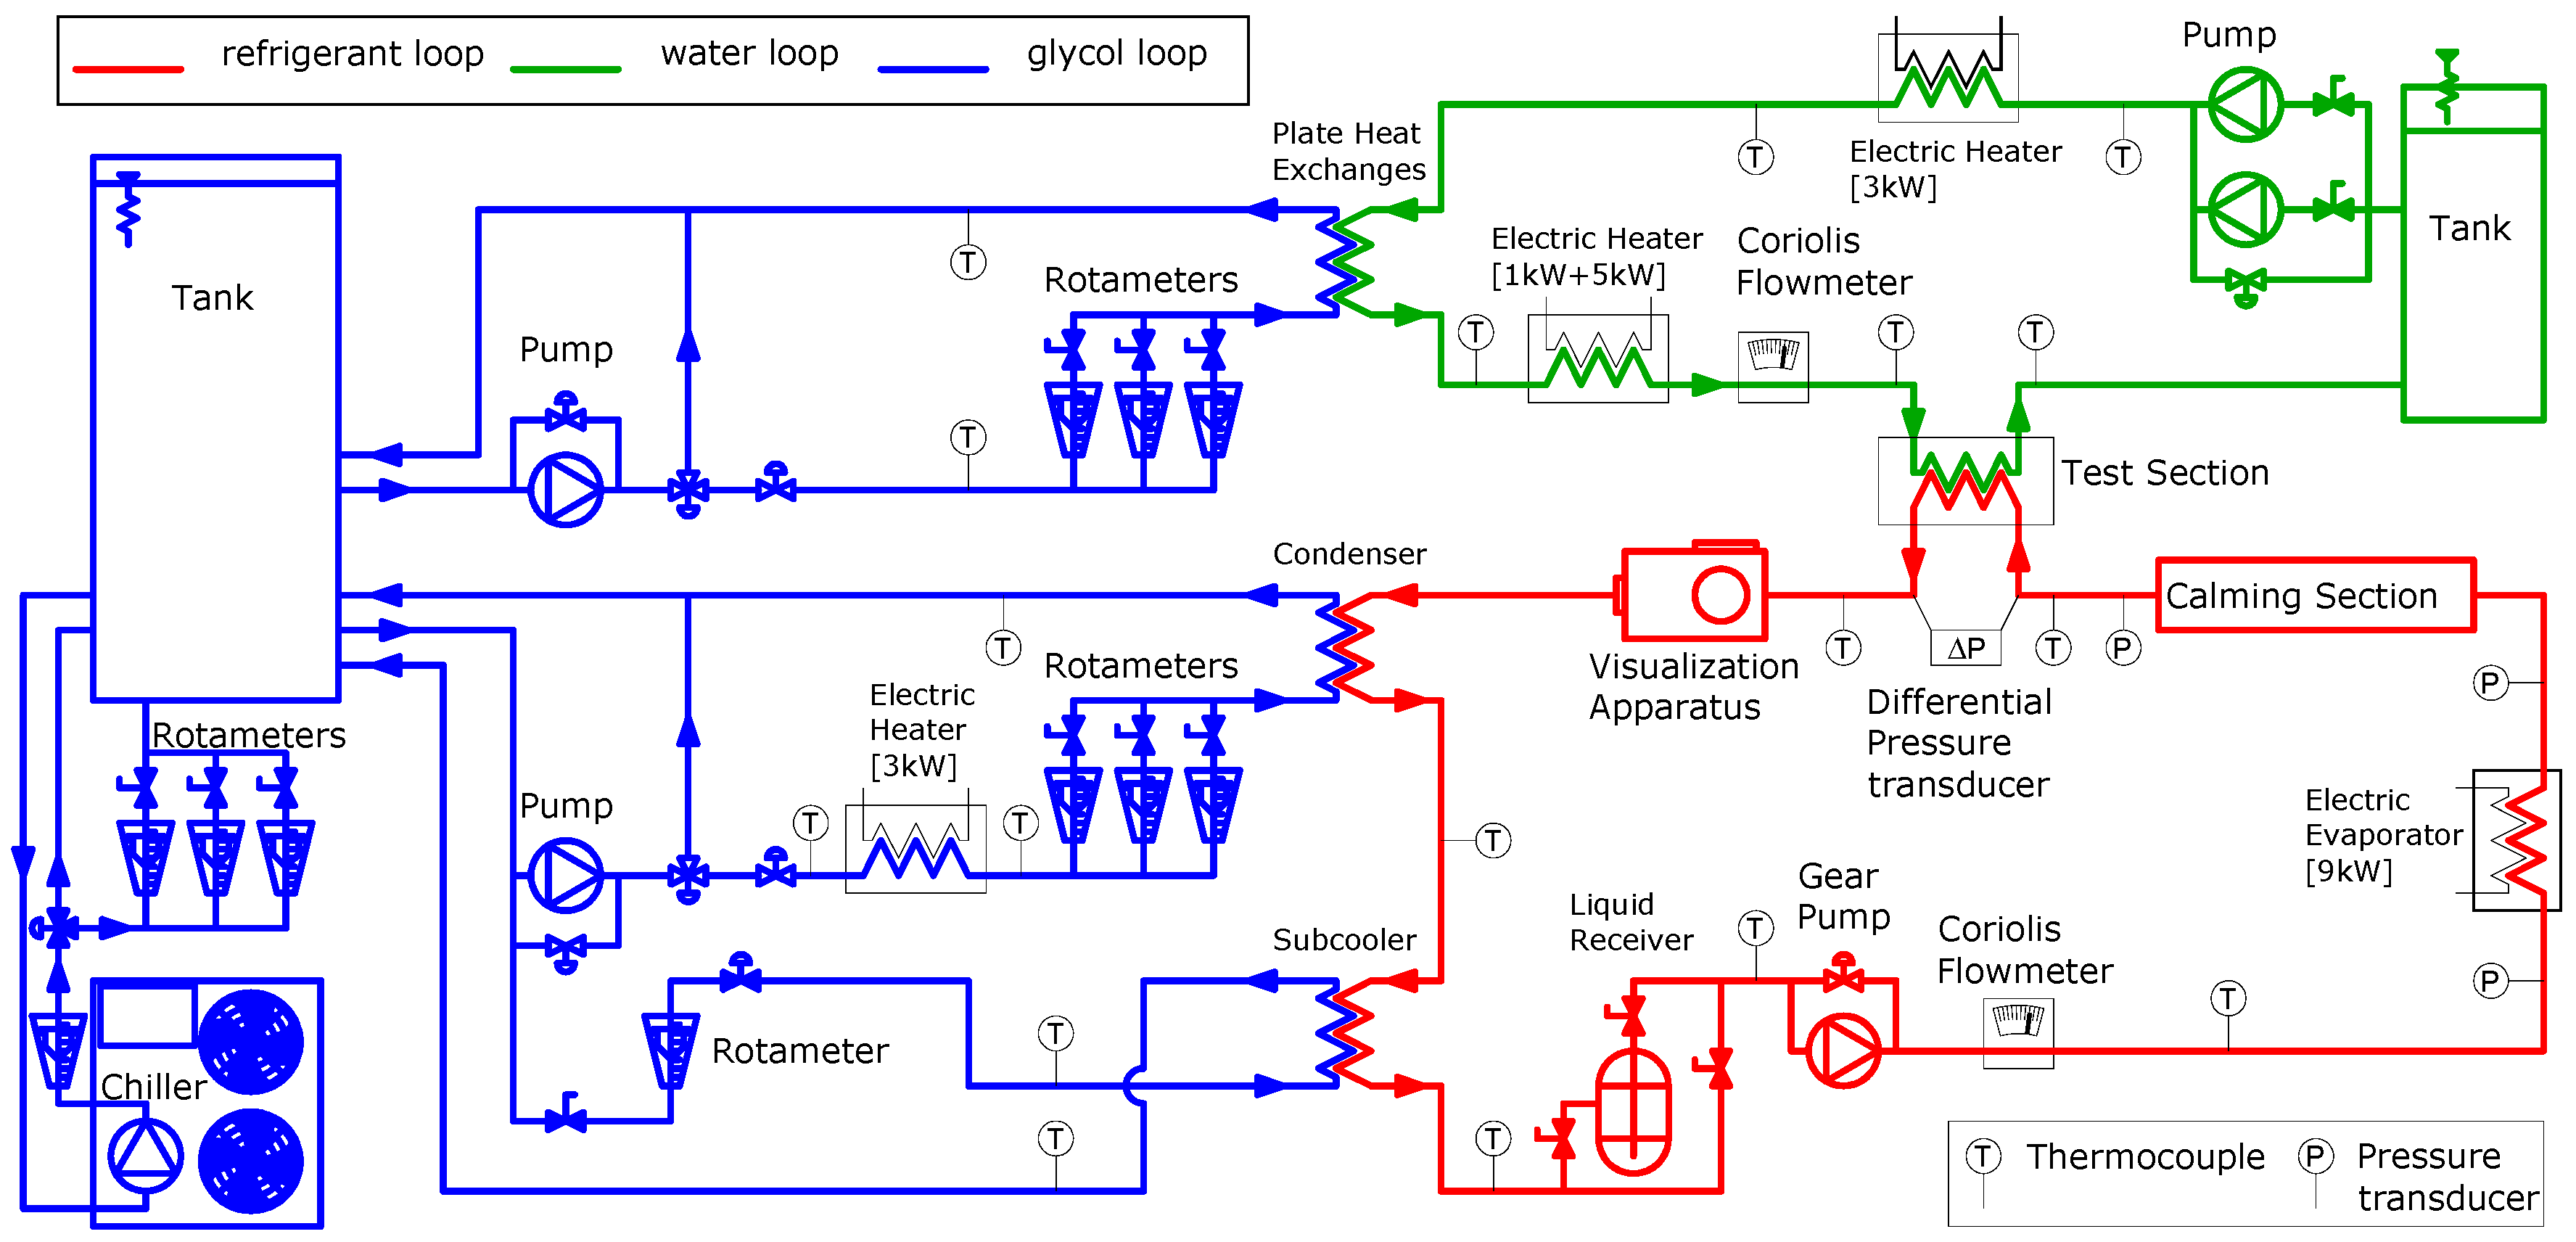
The test rig (a detailed description can be found in [31]) is depicted in Figure 1; the different colors highlight the three parts it is made of. The refrigerant loop was filled at first with the benchmark fluid, the R134a, and afterwards it was filled with one of its possible drop in alternative, the R1234ze(E). The water loop contains demineralized water while the glycol loop is filled with a mixture of water and ethylene glycol (30% volume concentration).
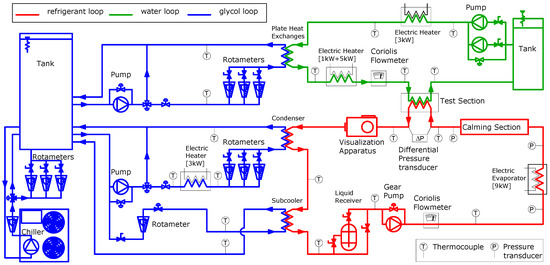
Figure 1.
The three loops of the test rig.
2.1. The Glycol Loop
The glycol loop (blue line in Figure 1) has two main goals:
- To set the pressure in the condenser such that in the test section the selected operating conditions are reached;
- To chill the demineralized water and the liquid refrigerant leaving the condenser.
A 0.75 m3 tank stores the cold mixture (temperature −10 °C) provided by a commercial chiller (21 kW cooling capacity) while two independent loops, one for the water and the other for the refrigerant, deliver the water and glycol to the heat exchangers.
The former loop cools down the water entering in the test section, which heats up as a consequence of viscous dissipation and heat transfer in the test section during condensation experiments.
The latter loop takes care to set the refrigerant temperature at the test section inlet and to prevent cavitation in the refrigerant pump. The former operation is achieved tuning the mass flow rate, using a manual needle valve, and the temperature (checked by a K-type thermocouple) at the condenser inlet, using a P.I.D. driven electric heater (3 kW), such that, at the test section inlet, the refrigerant pressure be the saturation pressure corresponding to the test temperature. For the latter task a bypass drains part of the cold mixture headed to the condenser (the volume flow rate is tuned using a manual needle valve) to cool the liquid refrigerant leaving the condenser.
2.2. The Water Loop
The water loop (green line in Figure 1) exchanges the thermal power required for the refrigerant phase change, and the thermal interaction takes place in a tube in tube heat exchanger (refrigerant in the inner duct, water in the annulus), located in the test section (Figure 2). A rubber foam shell (100 mm thick) insulates it from the surroundings. The water mass flow rate (measured by a Coriolis flowmeter: range [0;400] kg·h−1, uncertainty 0.15% of the reading) is tuned using a bypass and a needle valve and delivered from the tank (volume 0.2 m3, thermally insulated with a rockwool shell 50 mm thick) by a pump. A K-type thermocouple reads the water temperature before the flow enters in a plate heat exchanger (glycol is flushed in the other side if cooling is required). Then, a P.I.D. driven electric heater (made of two elements: 1 kW and 5 kW, individually or simultaneously operated) sets the inlet temperature in the test section (checked by a K-type thermocouple). The power supply causes a prescribed temperature change in the water flow (inlet and outlet temperature are provided by two groups of 3 K-type thermocouples connected in series; the uncertainty is 0.1 K).
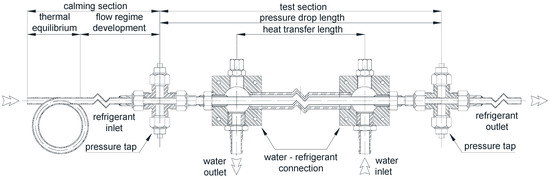
Figure 2.
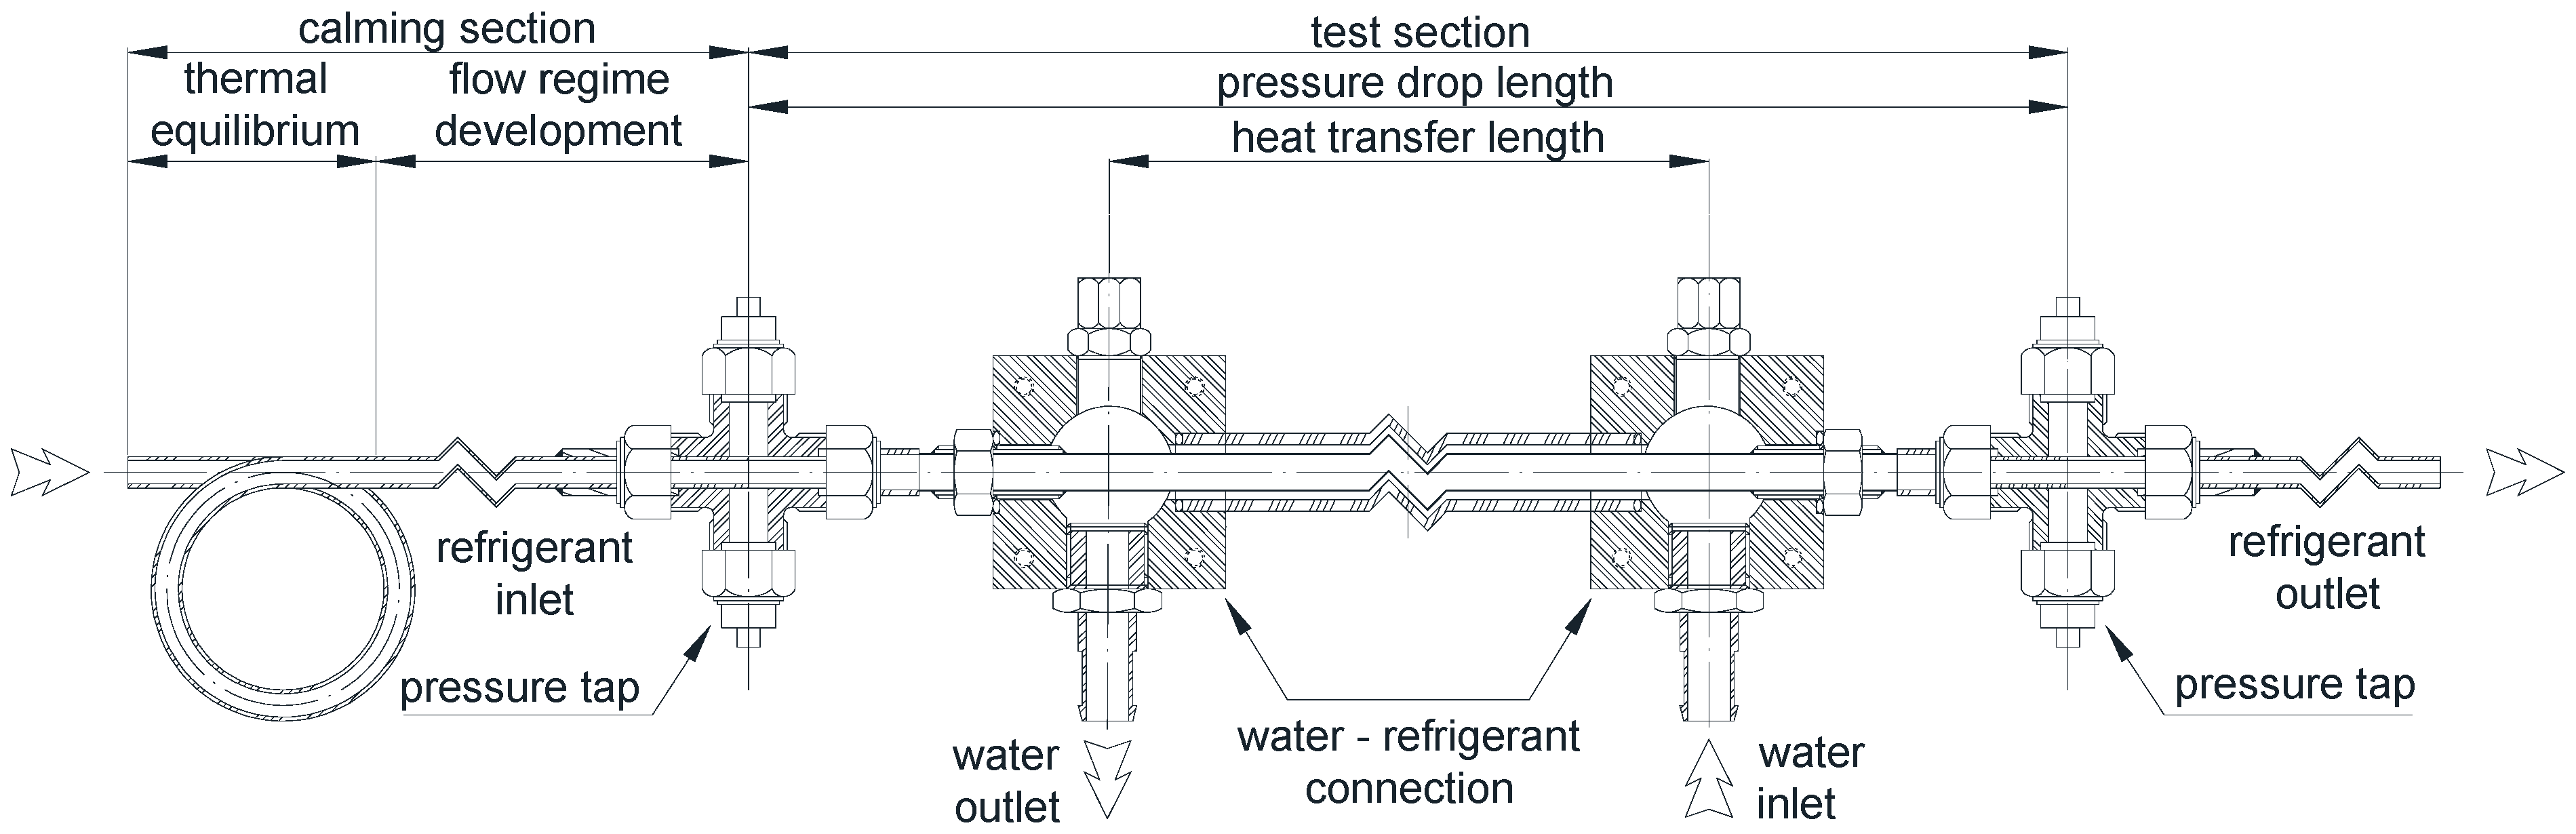
Main components of the calming section and the test section.
2.3. The Refrigerant Loop
The refrigerant loop (red line in Figure 1) is designed to provide, at the inlet of the test section, a two-phase flow at the operating conditions prescribed for each experiment, which are defined by the mass flow rate, the inlet quality, and the inlet temperature.
The saturated liquid refrigerant leaving the condenser (four plate heat exchanges and one shell end tube heat exchanger in parallel, individually or simultaneously operated, depending on the thermal duty) enters in the subcooler (a plate heat exchanger) to prevent cavitation in the pump (gear type with inverter driven engine for the mass flow rate tuning). A Coriolis flowmeter (range [0;400] kg·h−1, uncertainty 0.15% of the reading) checks the mass flow rate. The thermodynamic state of the refrigerant at the inlet of the evaporator (8 electric heaters, 9 kW total power, driven by a software control system, providing the heat flow rate to set the test section inlet quality) is determined using a thermocouple (K-type, uncertainty 0.1 K) and a pressure transducer (relative, range [−1;30] bar, uncertainty ±1% of full scale). A calming section (Figure 2) follows; it is made of two parts. The former is a wrapped tube (outer diameter 9.52 mm, length 12 m, wrapping diameter 0.4 m, thermally insulated by a 50 mm thick rubber foam shell) designed to obtain the thermal equilibrium between liquid and vapor leaving. The latter is a straight duct (4.7 m long adiabatic duct and thermally insulated by a 50 mm thick rubber foam shell) designed for the development of the two-phase flow regime. Then, the refrigerant enters in the test section, passes by the visualization apparatus and, in the end, returns to the condenser.
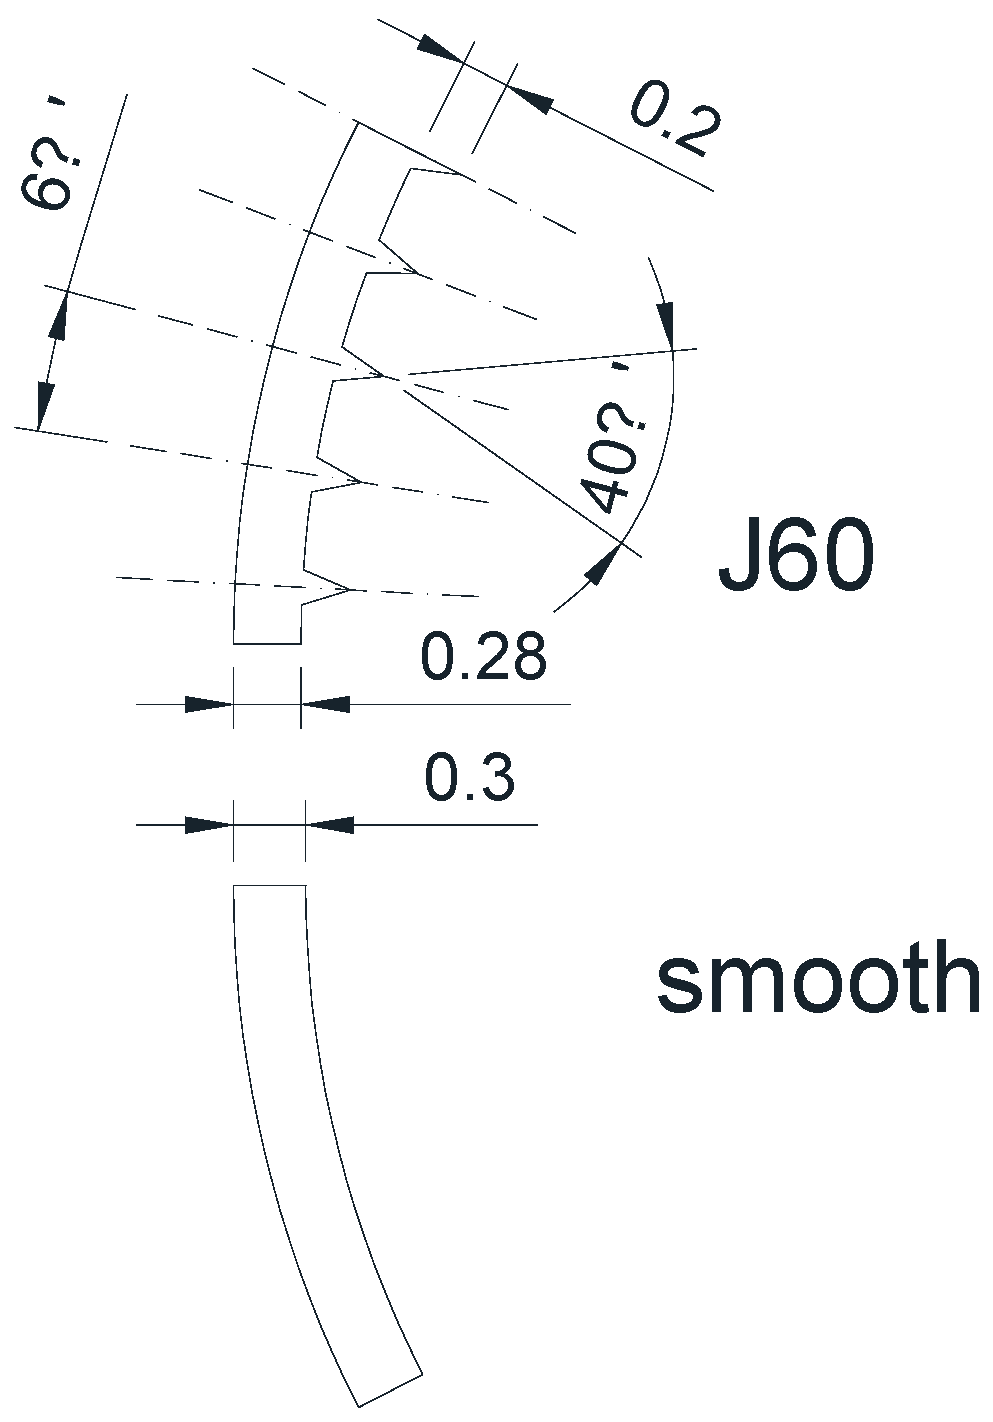
The test section (Figure 2) is a tube in tube heat exchanger (refrigerant inside the microfin tube, demineralized water in the annulus, heat transfer length L = 1.11 m) thermally insulated with 100 mm thick rubber foam shell. The enhanced tube, named J60, was used for the refrigerant duct. Its geometrical features are reported in Table 1, while Figure 3 shows the differences with the reference smooth tube.

Table 1.
Microfin tube geometrical features.
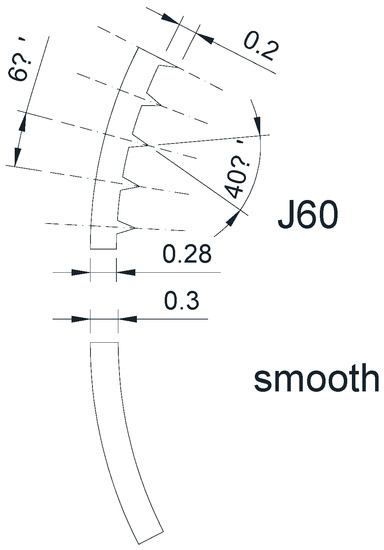
Figure 3.
Microfin tube.
The refrigerant pressure is read by a relative pressure transducer (range [−100;1600] kPa, uncertainty ±0.25% of the full scale), connected to the tap at the inlet of the test section. A differential pressure transducer (range [−103.4;103.4] kPa, uncertainty ±0.1% of the full scale) senses the pressure drop between the inlet and outlet pressure taps, depicted in Figure 2, which are separated by the distance l = 1.3 m. The refrigerant inlet and outlet temperatures are the saturation temperatures given by the pressure readings. To measure the inlet and outlet wall temperatures, on the outside of the inner tube, there are two groups of three thermocouples (glued on top, side and bottom position). The reference junction of each thermocouple (K-type, uncertainty 0.1 K) is inserted in a Dewar flask filled with melting ice.
3. Data Reduction
Preliminary experiments checked if the thickness of the thermal insulation layer covering the evaporator, the calming section, and the test section was suitable to prevent too large thermal losses. Positive feedback came from the tests. The heating test, involving single phase vapor flow of refrigerant in the test section, highlighted that the power transferred, computed using the data of both the refrigerant and demineralized water, matched within ±5%. The complete evaporation test, involving the evaporator and the calming section, was performed tuning the thermal power of the evaporator such that the refrigerant entered as subcooled liquid and left as superheated vapor. The readings of the power-meter connected to the evaporator matched in a ±2% range with the power computed on the refrigerant enthalpy change and mass flow rate.
During the experiments, 12 acquisitions were performed for each operating condition. The single acquisition lasts for 180 s and records (with a sampling frequency of 1 Hz) the readings of all the devices connected to the acquisition board. At the end, 181 samples are stored for every quantity. Once the experiments are finished, a program (acquisition by acquisition) performs the post processing of the raw data. It mainly computes:
- The pressure drop per unit length Z and the heat transfer coefficient h, for each single set of the 181 recordings;
- The averages and the uncertainties related to each quantity using the 181 available values for each acquisition;
- The averages and the uncertainties related to each quantity using the 12 available values for each operating condition (these values represent a single datapoint on a chart).
To check the probes, the test rig, and the computer programs, preliminary experiments were run involving single-phase vapor refrigerant flow inside a smooth tube. It was observed that the power transferred computed for both refrigerant side and water side matched within 5%. Moreover, the outcome of the post-processing agrees within ±5% with the most common correlations for heat transfer and pressure drop.
The post processing of the raw data aims to compute the values and the uncertainties of the parameter that identify the operating conditions and the outcomes of the analysis.
3.1. The Operating Conditions
Once the refrigerant fluid, the tube geometry and the type of experiments (flow boiling or convective condensation) are specified, the operating conditions are defined by four quantities:
- The refrigerant inlet temperature in the test section TrTi;
- The refrigerant mass flux G;
- The quality change in the test section ∆x or the heat flux transferred in the test section q;
- The mean quality in the test section xm.
The post processing, starting from the raw data, computes the above-mentioned quantities according to the following assumptions:
- Steady state;
- The thermal dispersion in the test section (power transfer takes place only between water and refrigerant) is negligible;
- The thermal dispersion in the evaporator is negligible.
3.1.1. Refrigerant Inlet Temperature
The inlet temperature is determined as the saturation temperature corresponding to the refrigerant pressure at the test section inlet prTi
3.1.2. Refrigerant Mass Flux
The refrigerant mass flow rate is provided by the Coriolis flowmeter installed in the refrigerant loop, while the net cross-sectional area of the microfin tube, according to the nominal data in Table 1, is:
their ratio provides the mass flux:
3.1.3. Quality Change and Heat Flux
As the two quantities are related only one can be fixed, the choice of the former or the latter depends on goal of the analysis: one should understand how the pressure drop per unit length and the heat transfer coefficient are affected by the heat flux or the flow regime (test performed keeping a constant quality change). To compute both the quantities the thermal power, (transferred in the test section) is required:
the quality change is
while the heat flux, based on the heat transfer area related to the fin root diameter DR, is:
3.1.4. Mean Quality
The mean quality in the test section is the sum of half of the quality change and the inlet quality. The energy balance on the evaporator, according to the hypothesis, provide the latter quantity
such that the mean quality is
3.2. The Outputs of the Post-Processing
Three are the main outputs of the post-processing: the pressure drop per unit length Z, the heat transfer coefficient h, and the uncertainty analysis for each measured or computed quantity.
3.2.1. Pressure Drop per Unit Length
The pressure drop per unit length is easily computed using the reading of the differential pressure transducer connected at the inlet and outlet of the test section and the distance between the pressure taps (l = 1.3 m), their ratio provides:
3.2.2. Heat Transfer Coefficient
The determination of the refrigerant temperature at the test section outlet is the first step to compute the heat transfer coefficient. It is the saturation temperature corresponding the outlet pressure of the refrigerant (computed subtracting the pressure drop in the test section to the inlet pressure)
Two groups (one at the entrance and one at the exit of the test section) of three thermocouples are glued inside grooves (length 50 mm, depth 0.15 mm, width 0.4 mm) on the outside of the microfin tube (top, side, and bottom position). The average values of the readings given by the thermocouples of each group (Equation (7)) provide the inlet and outlet wall temperatures
The refrigerant temperatures and the wall temperatures are combined together to compute the logarithmic mean temperature difference
In the end the heat transfer coefficient is computed as the ratio of the heat flux (Equation (6)) and the logarithmic mean temperature difference
3.2.3. The Uncertainty Analysis
The uncertainty analysis was carried out using the error propagation algorithm, according to Moffat [32], assuming that all of the quantities are statistically independent (the complete description of the procedure can be found in [31]). The procedure showed that, for each datapoint, the uncertainty related to the parameters identifying the operating conditions, the pressure drop per unit length, and the heat transfer coefficient is lower than 5%.
4. Results
The experiments aimed to compare the performances of the refrigerants R134a and R1234ze(E); the former is commonly used in HVAC systems while the latter, which has better environmental features, is a possible drop-in replacement. Both of the fluids were tested inside the J60 microfin tube (Table 1 and Figure 2 shows the main geometrical characteristics) during flow boiling (nominal refrigerant inlet temperature in the test section is 5 °C) in the operating condition ranges listed in Table 2. As the operating conditions are defined by three quantities (mass flux G, mean quality xm and quality change ∆x, or heat flux q), the tests were performed keeping two of them constant and changing the third.
Table 2.
Experimental operating conditions.
To properly explain the outcome of the flow boiling experiments, it is necessary to keep in mind some facts concerning the flow regimes and the differences in the thermal properties between the two fluids highlighted by Table 3 and Table 4.
Table 3.
Comparison between the thermal properties of R134a (reference fluid) and R1234ze(E) during flow boiling, operating temperature TrTi = 5 °C.
Table 4.
Thermal properties percentage variation.
- A.
- As reported in [33], inside the horizontal microfin tube J60, at the experimental operating conditions tested during flow boiling, both gravity dominated flow regimes (e.g., stratified or slug flow) and shear dominated flow regimes (e.g., helix flow or annular flow) onset. In the former type of flow regimes, the liquid and the vapor are, respectively, in the lower and upper part of the tube; the largest part of the cross-section perimeter is adjoined by vapor. On the contrary, for the latter type of flow regimes, the vapor is in the center of the cross section while its perimeter is mainly, if not completely, adjoined by the liquid. It follows that the pressure drop and the heat transfer coefficient, in gravity dominated flow regimes, depend mainly on the vapor thermal properties, while in shear dominated flow regimes they are mainly related on the liquid thermal properties.
- B.
- R1234ze(E) has, roughly, a 20% smaller vapor density than R134a. It follows that, at the same mass flux, the R1234ze(E) flow has a higher mean velocity than the R134a flow.
- C.
- R1234ze(E) has, roughly, a 5% larger vapor dynamic viscosity than R134a. It follows that, for the same mass flux, it could be expected that the R1234ze(E) flow has higher pressure drop than the R134a flow.
- D.
- The vapor thermal conductivity is the same for R1234ze(E) and R134a, and it is reasonable to assume that, for the same heat flux in gravity dominated flows, the logarithmic mean temperature difference is approximately the same for both the fluids.
- E.
- R1234ze(E) shows a liquid thermal conductivity about 9% smaller than R134a. Accordingly, for the same heat flux in shear dominated flows, the logarithmic mean temperature difference for R1234ze(E) is larger than the one for R134a since, for absolute values, the difference between the bulk temperature and the wall temperature is larger for the R1234ze(E) flow than for the R134a flow.
- F.
- R1234ze(E) has, roughly, a 7% smaller phase change enthalpy than R134a. It follows that, for the same quality change, the R1234ze(E) flow requires a smaller thermal power than the R134a flow. As the experiments were performed in the same test section, the same statement holds for the heat flux too. Conversely, for a fixed heat flux, the quality change for the R1234ze(E) flow is larger than the one for R134a flow.
4.1. The Effect of Mean Quality
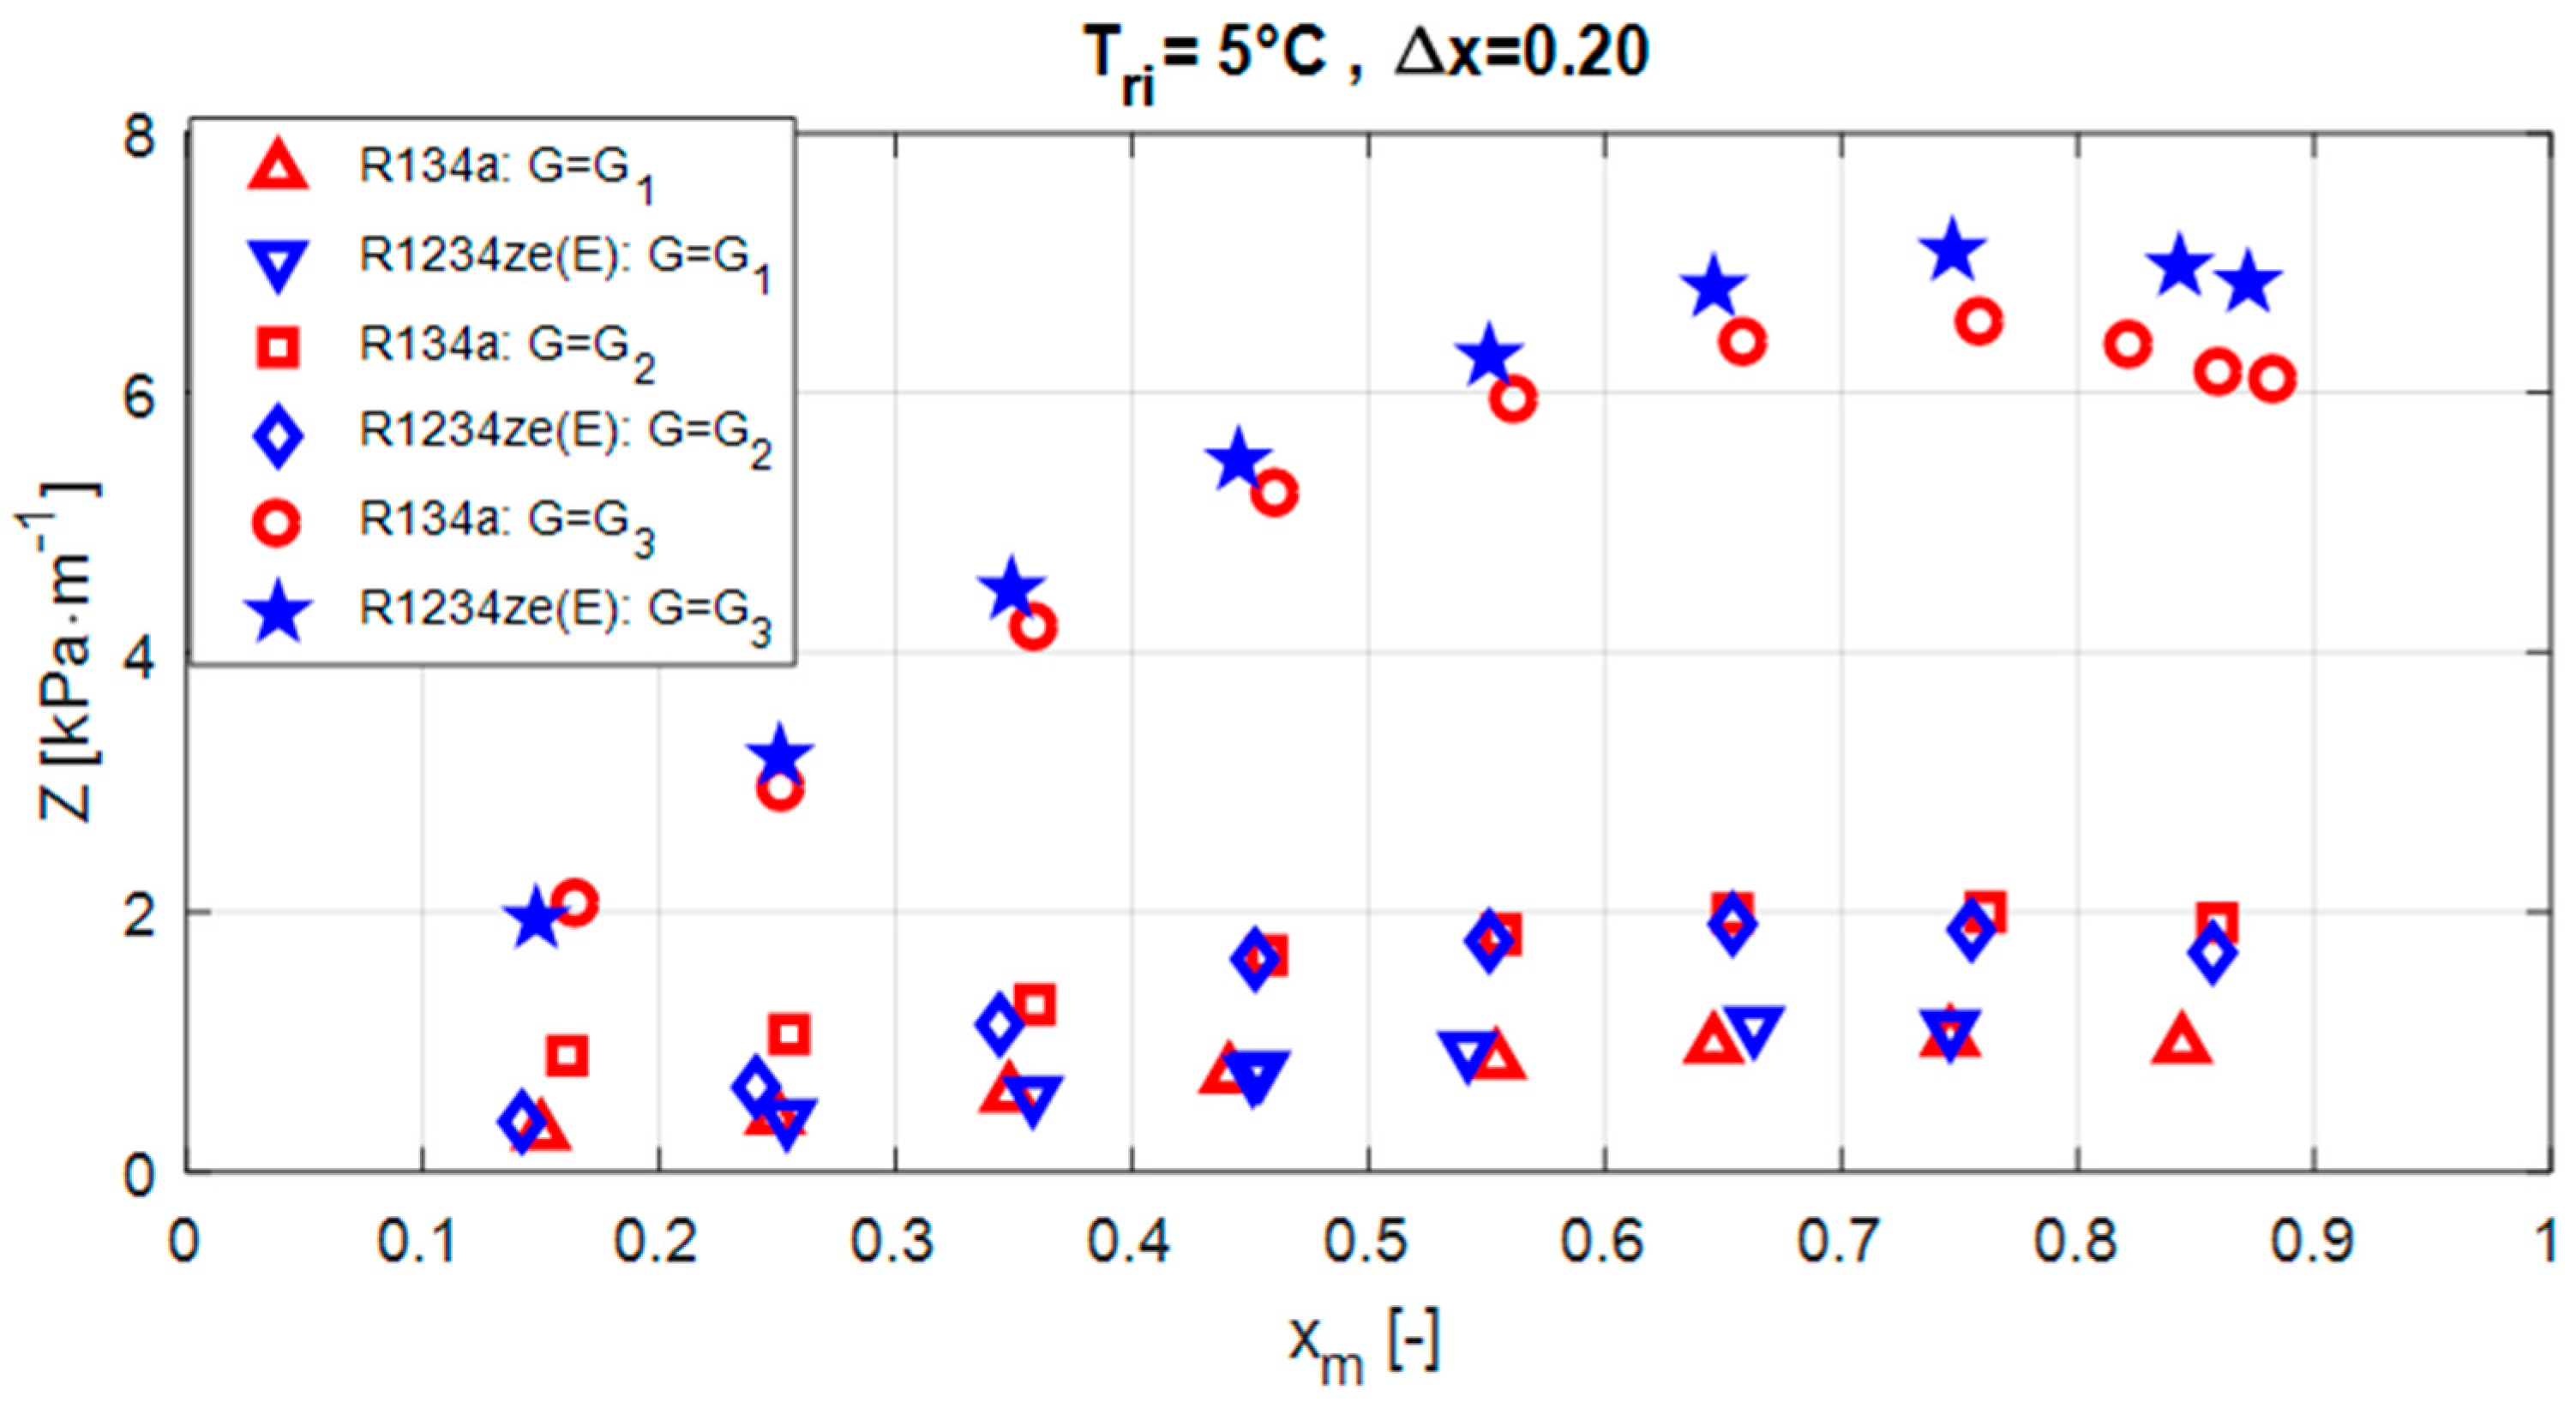
The first step in the analysis aims to understand how the mean quality affects the pressure drop per unit length and the heat transfer coefficient. During the experiments, a single quality change was considered: ∆x = 0.2. This value is the trade-off between the need for a local measure and an evaluation of the heat transfer rate in the test section with an acceptable uncertainty. Moreover, as reported in [33], only in few cases, using the quality change mentioned above, the presence of two different flow regimes could be observed. Three different mass fluxes were taken into account (G1 = 80 kg·m−2·s−1, G2 = 110 kg·m−2·s−1, G3 = 220 kg·m−2·s−1; these values allow one to test different flow regimes).
4.1.1. Pressure Drop per Unit Length
The outcomes of the experiments, performed using R134a and R1234ze(E), are gathered in Figure 4. Their comparison shows that at the highest mass flux, which, for all of the mean qualities, is characterized by shear dominated flow regime, the latter fluid has a higher pressure drop per unit (approximately 10%). A possible explanation could rely, as pointed out in remarks B and C, on its higher mean velocity, which implies higher velocity gradients and its higher dynamic viscosity of the liquid phase. On the contrary at the lower mass fluxes, most probably for the low velocity and the onset of the same flow regime, in most of the cases the same pressure drop per unit length was recorded. The differences occurring for mass flux G = 110 kg·m−2·s−1 and mean quality lower than 0.3 could be explained taking into account that, for the R1234ze(E), the transition from gravity dominated flow regimes to shear dominated flow regimes takes place at lower mean qualities than R134a (due to remark B) [33].
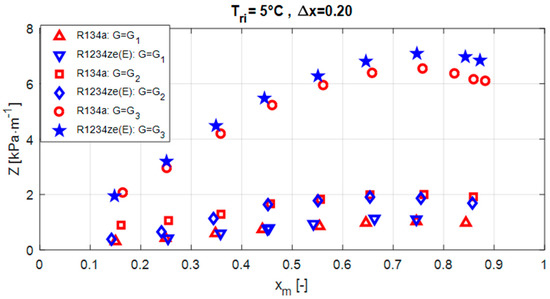
Figure 4.
Pressure drop per unit length as a function of the mean quality for different mass fluxes (G1 = 80 kg·m−2·s−1, G2 = 110 kg·m−2·s−1, G3 = 220 kg·m−2·s−1).
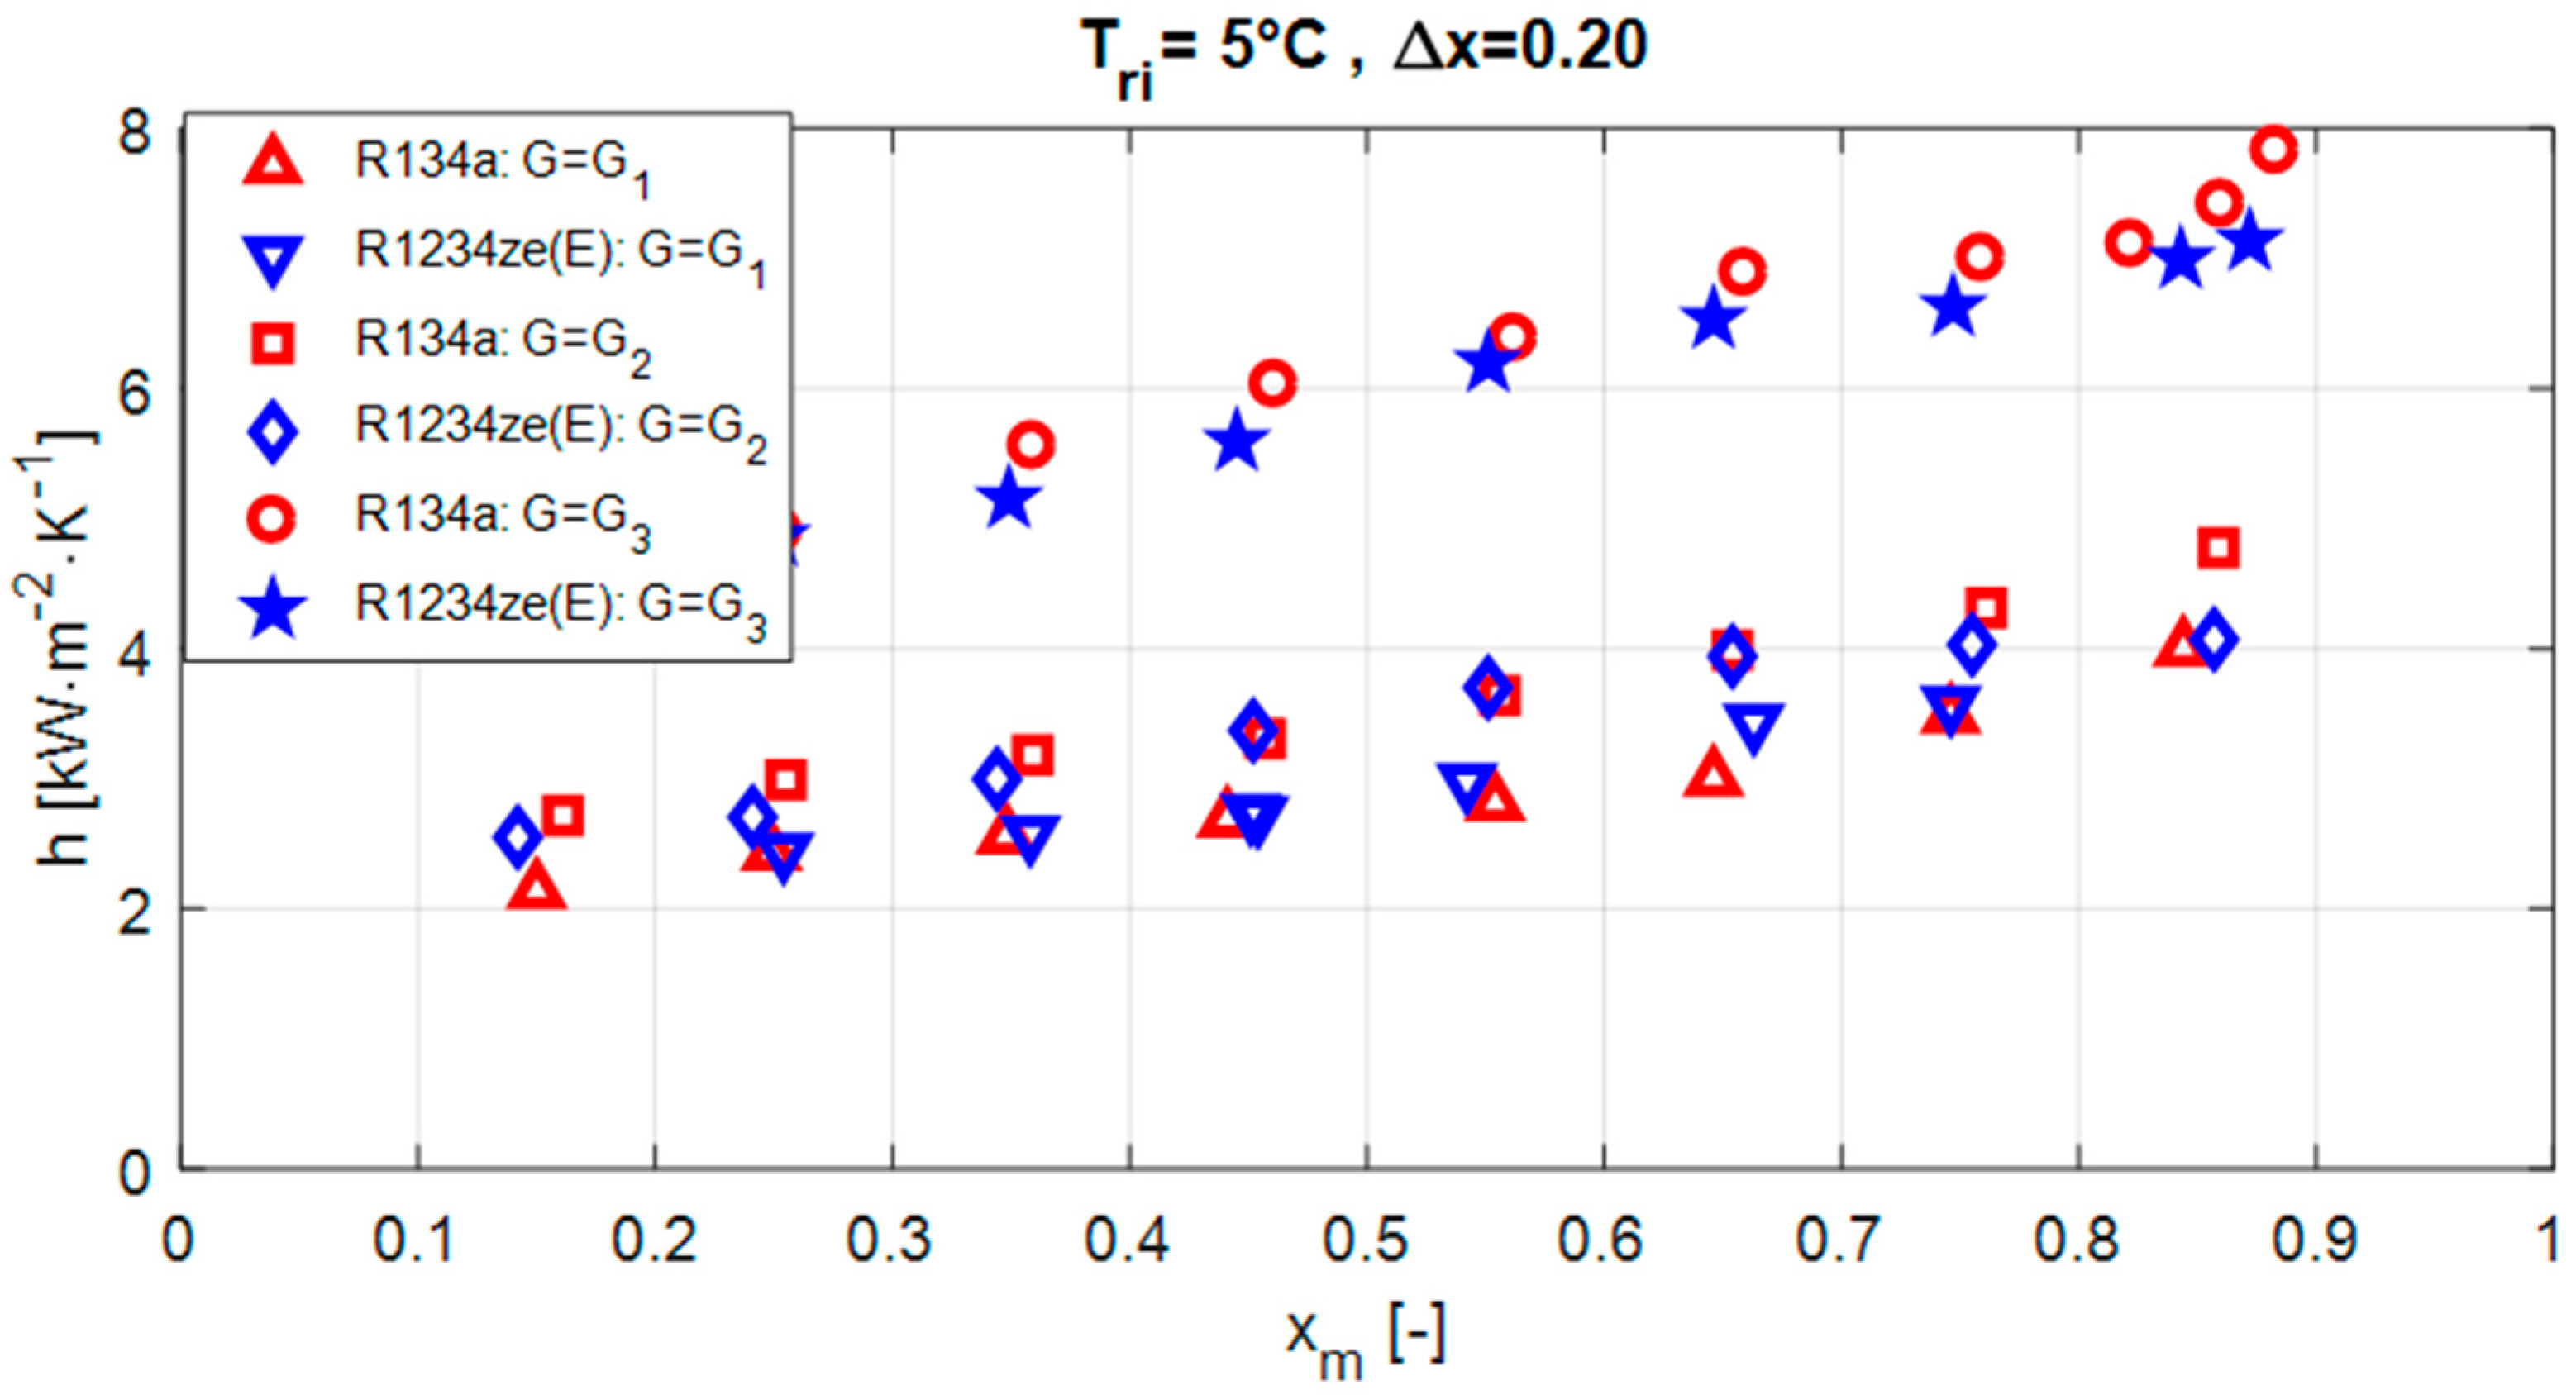
4.1.2. Heat Transfer Coefficient
The data concerning the heat transfer coefficient are reported in Figure 5. The chart highlights that the two fluids behave similarly in all of the operating conditions. That could be explained taking into account that a shear dominated flow regime (remark A) is present in almost all the operating conditions. Furthermore, the percentage variation of the thermal conductivity of the liquid phase (remark E) and the phase change enthalpy (remark F) are very similar, so comparable temperature gradients can be expected in the liquid film adjoining the wall.
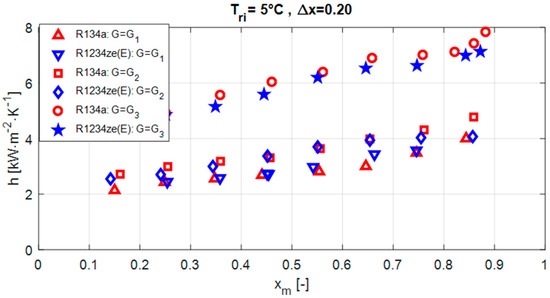
Figure 5.
Effect of the mean quality on the heat transfer coefficient for different mass fluxes (G1 = 80 kg·m−2·s−1, G2 = 110 kg·m−2·s−1, G3 = 220 kg·m−2·s−1).
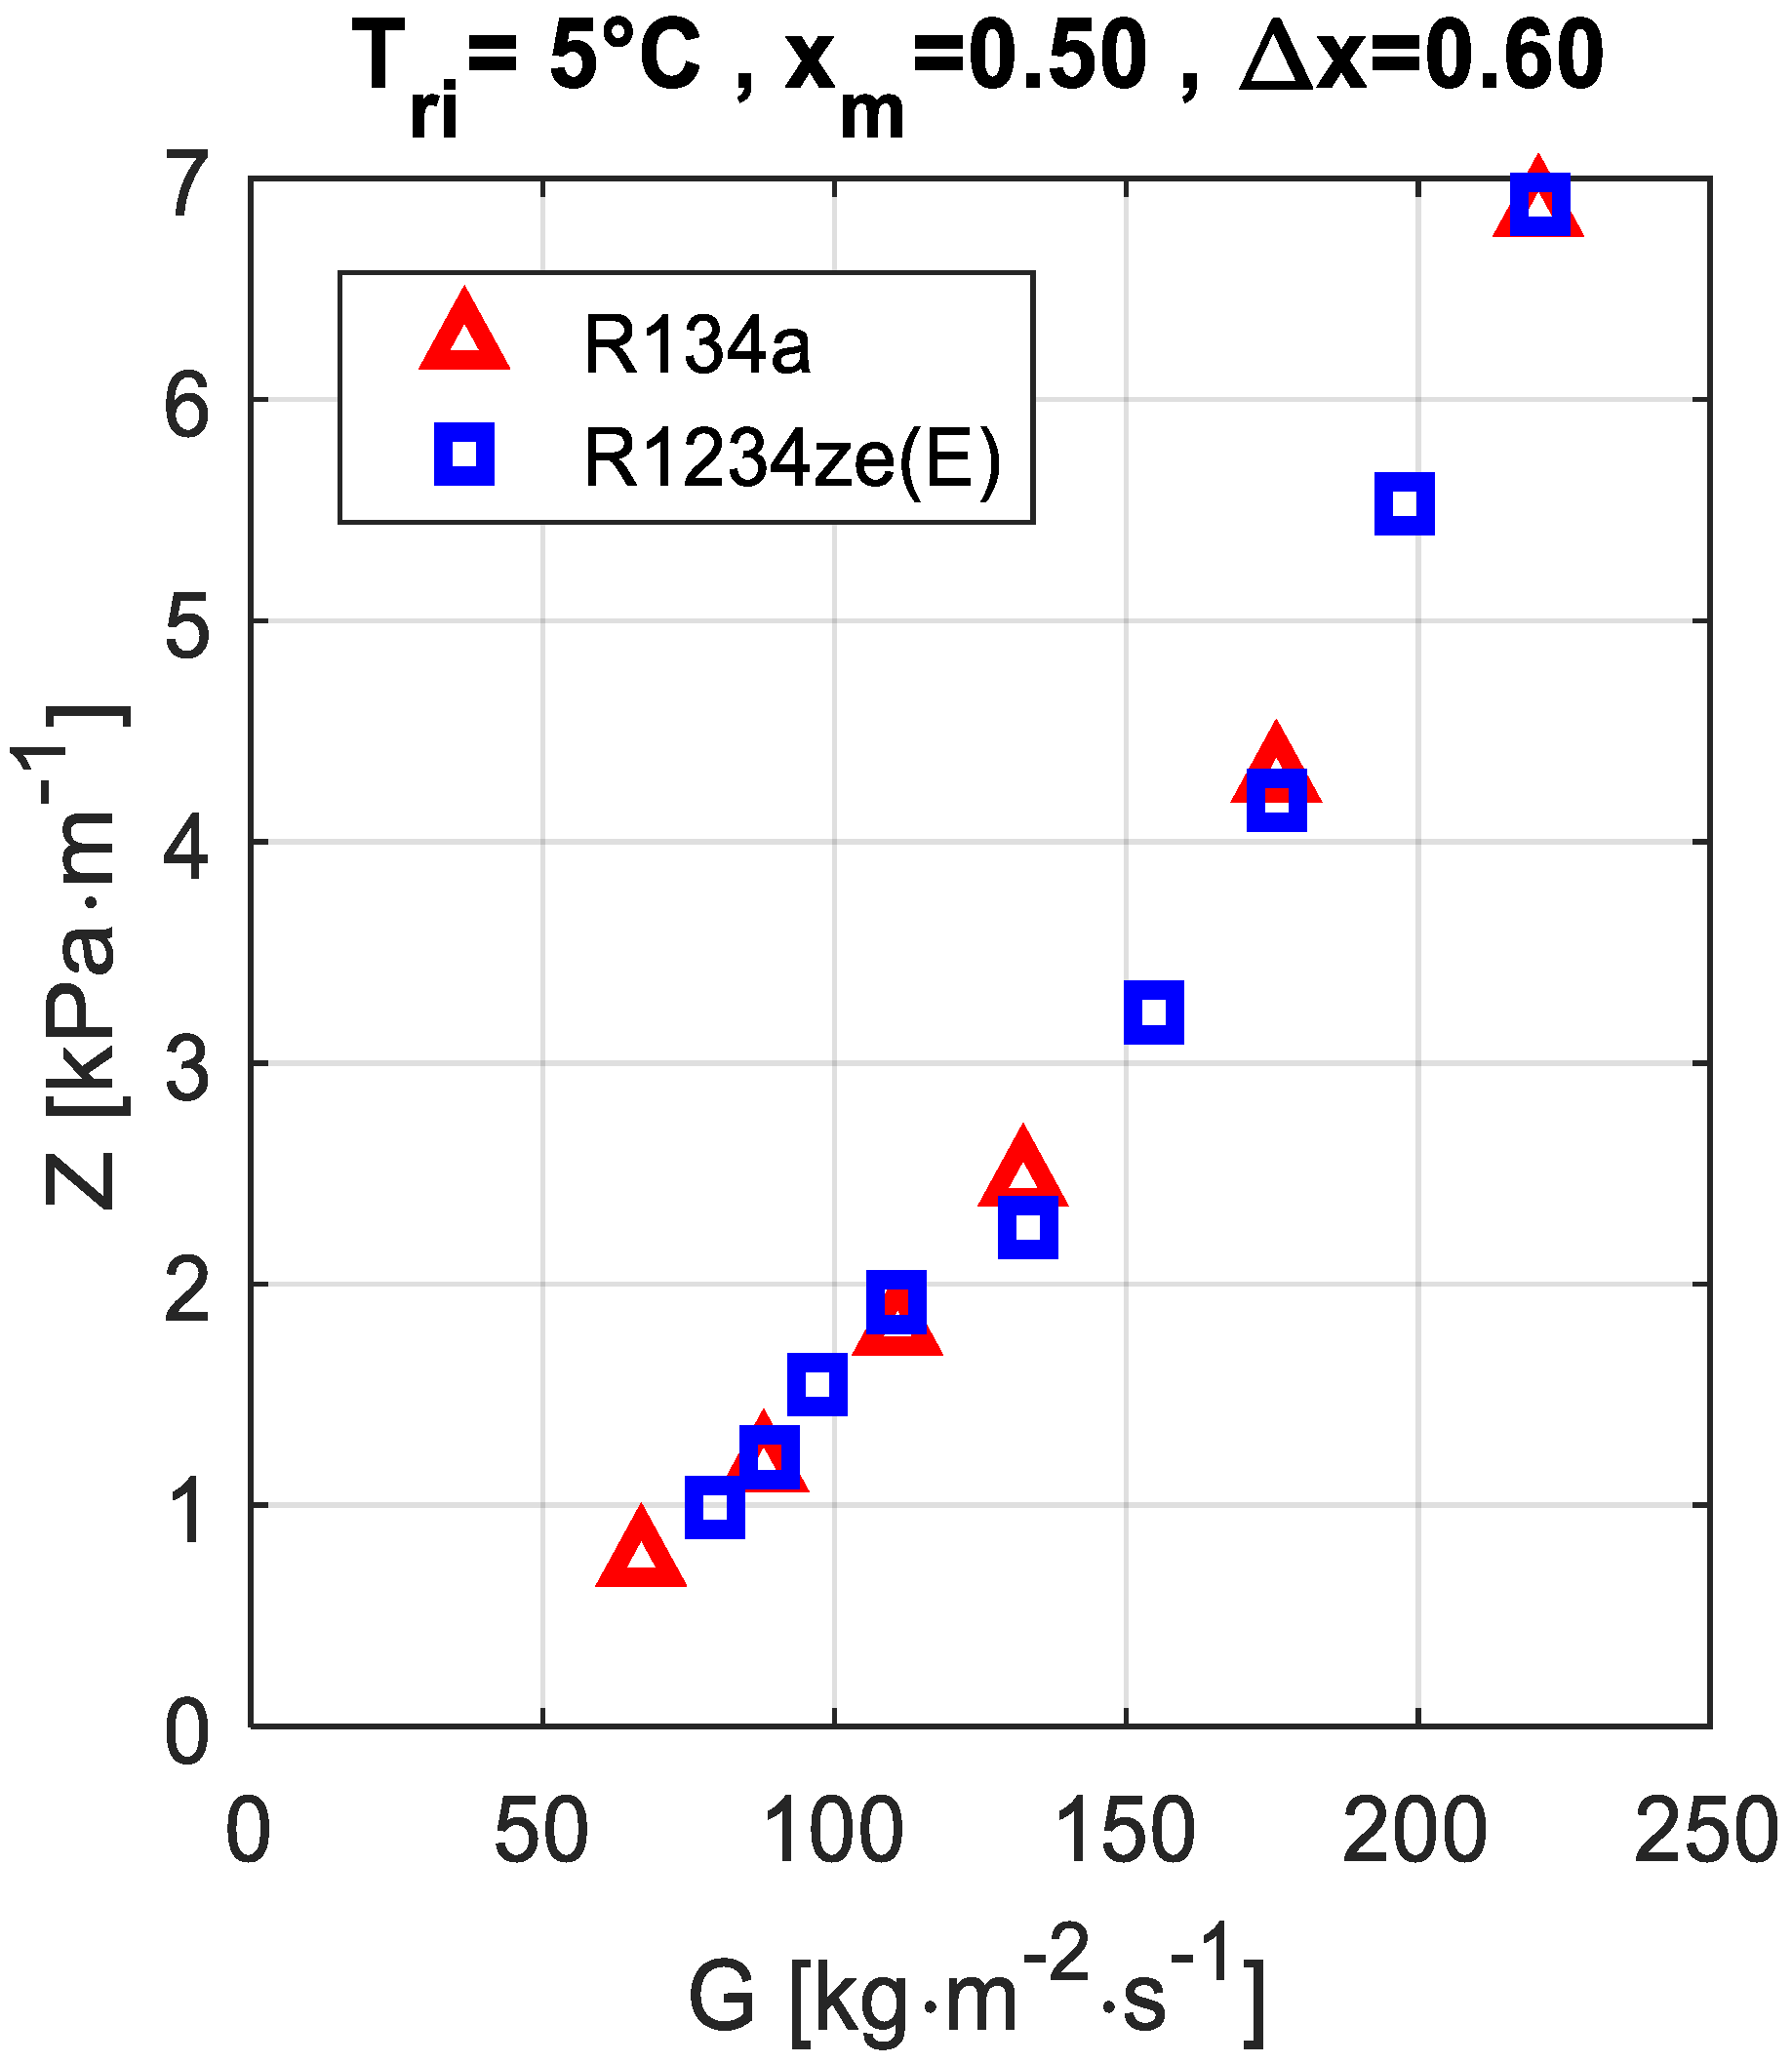
4.2. The Effect of Mass Flux
The effect of mass flux on the pressure drop per unit length (Figure 6) and the heat transfer coefficient (Figure 7) was analyzed by running experiments characterized by mean quality xm = 0.5 and quality change ∆x = 0.6. Such a wide quality variation was chosen to include both the saturated boiling and convective evaporation regions before the onset of the dryout (hence providing the average heat transfer coefficient). The charts show that the two fluids behave similarly, as was already noticed by analyzing the effect of the mean quality. Moreover, it seems that the larger the quality change, the smaller the differences between the fluids.
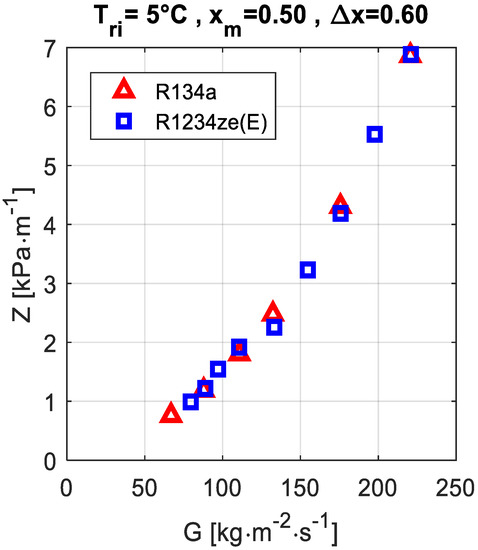
Figure 6.
Pressure drop per unit length as a function of the mass flux.
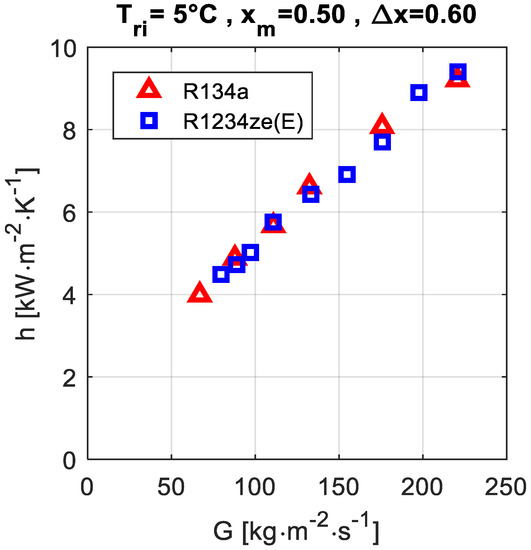
Figure 7.
Heat transfer coefficient as a function of the mass flux.
4.3. Correlations
In the end, the experimental results concerning the pressure drop per unit length and the heat transfer coefficient, collected during the tests run for both fluids, were compared with the predictions of the correlations available in the open literature on the base of the three quantities.
- The mean percentage error:
- The standard deviation of the mean percentage error:
- The mean absolute percentage deviation EA%:
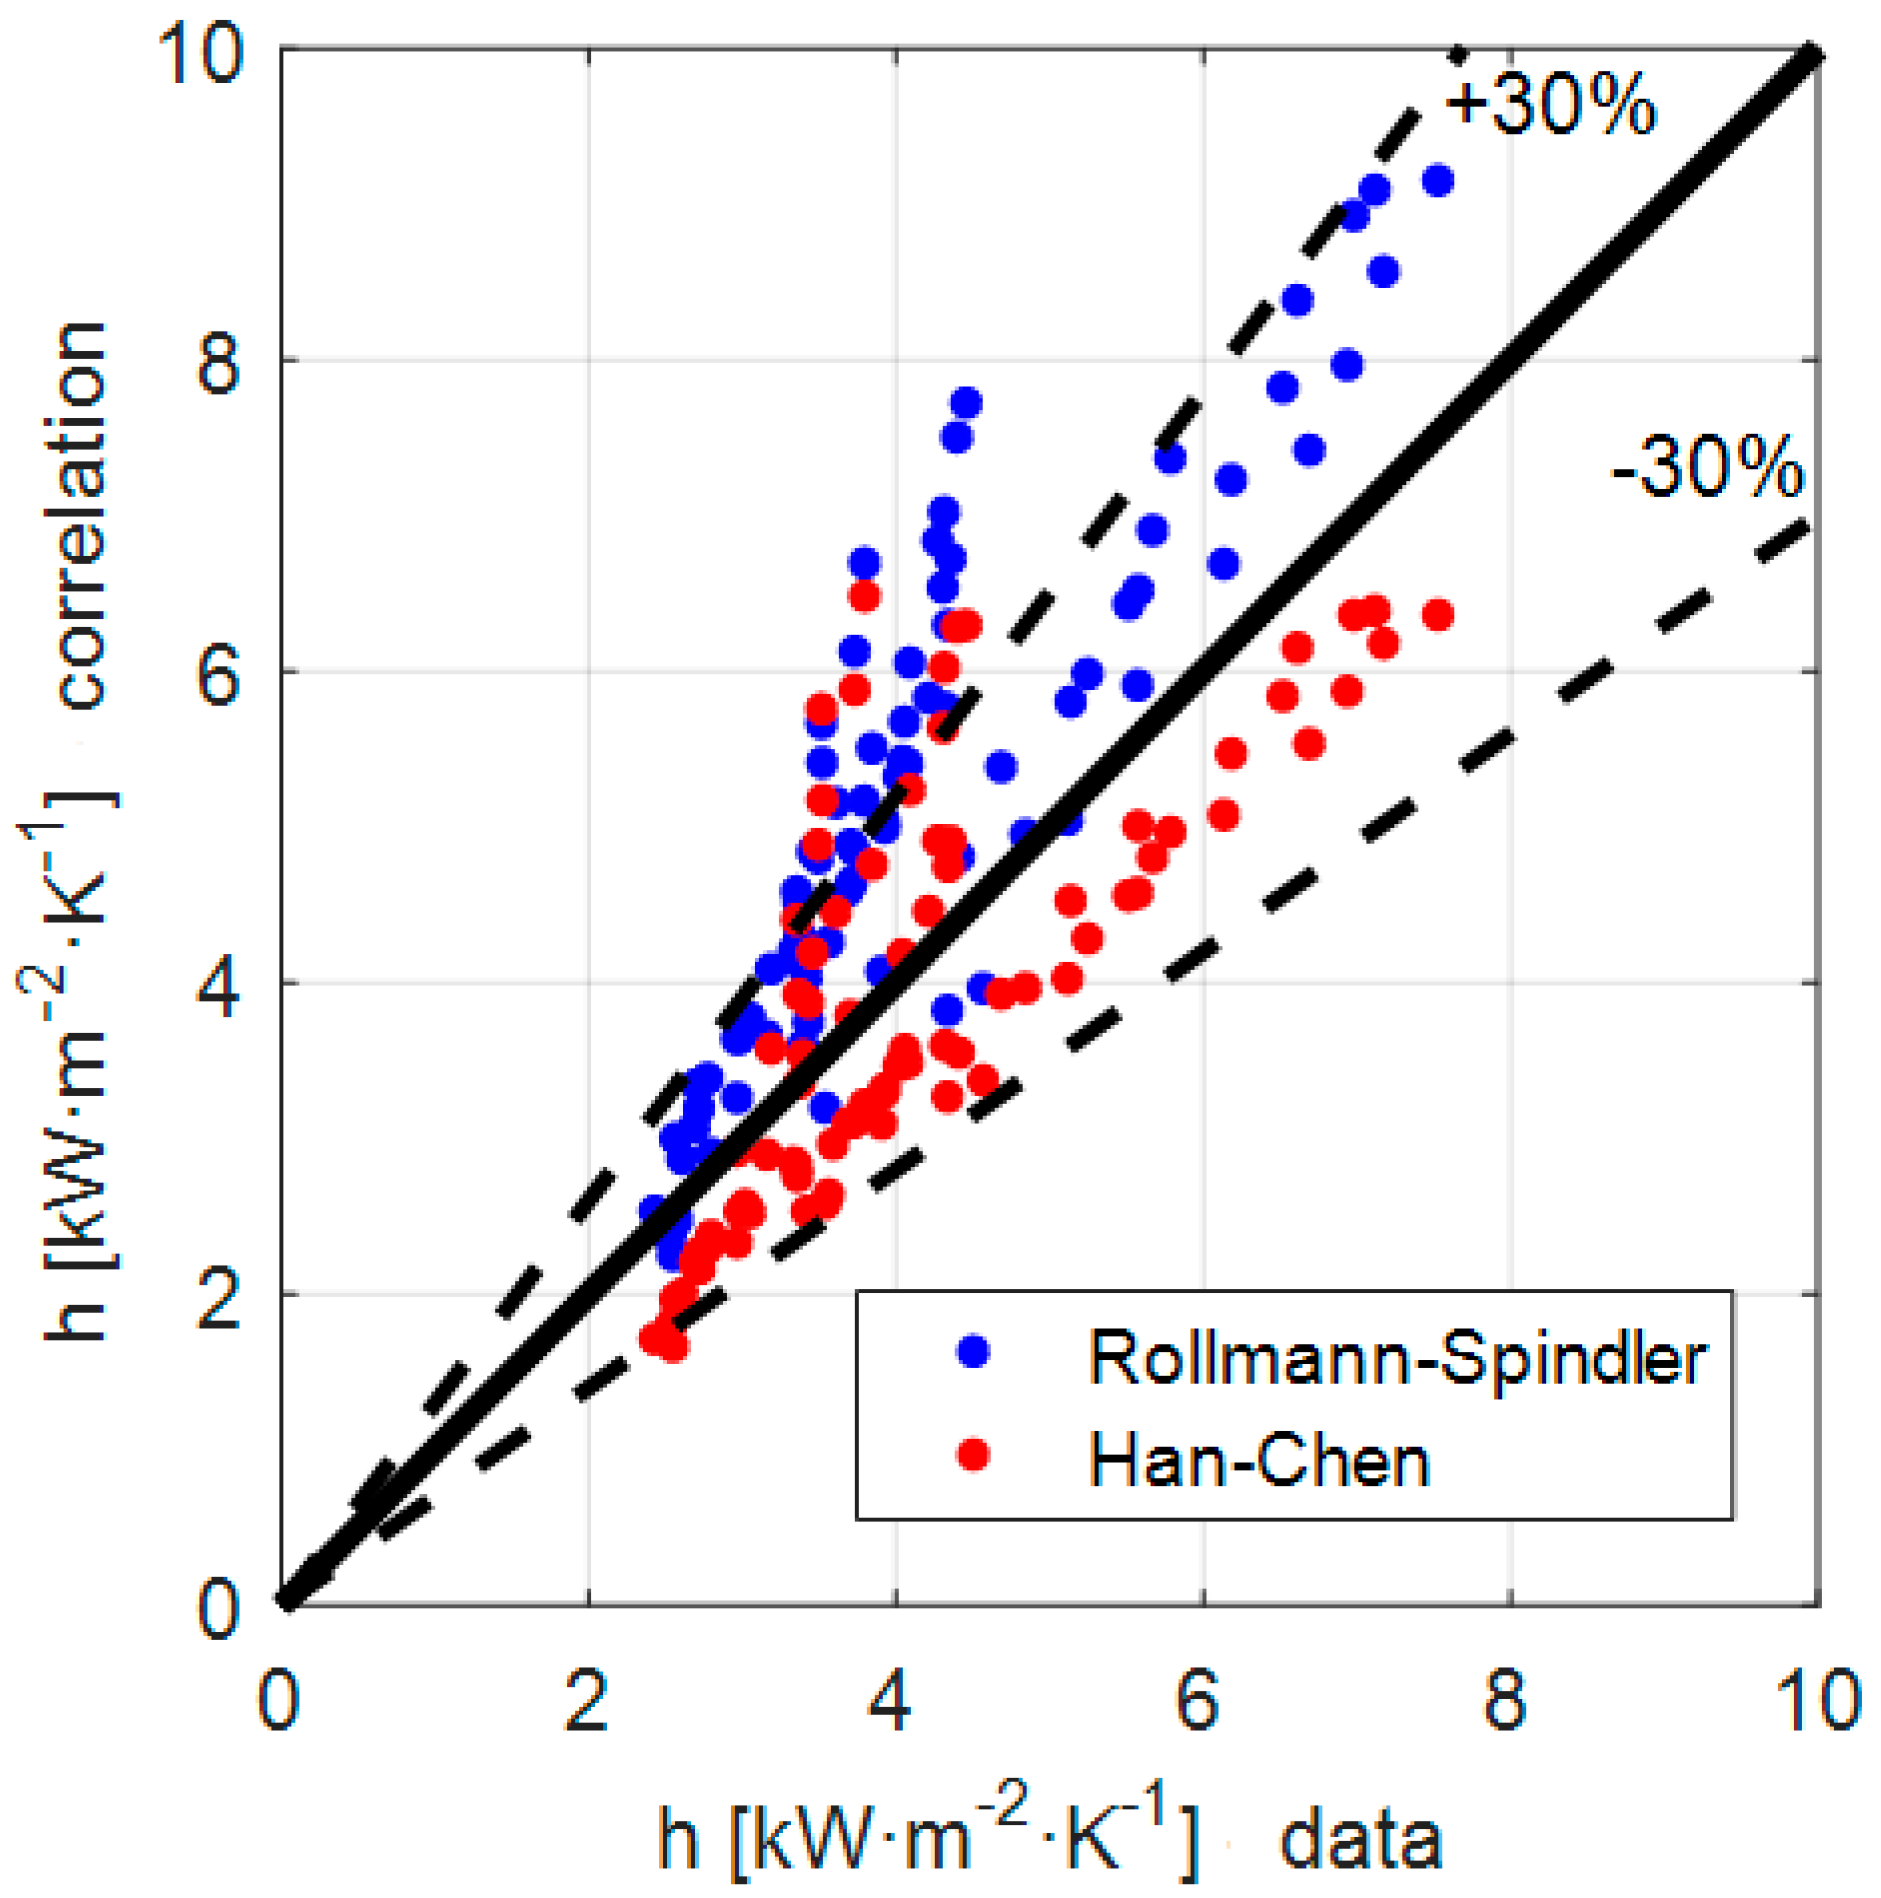
Their numerical values are listed in Table 5 and Table 6; the former concerns the pressure drop per unit length while the latter deals with the heat transfer coefficient. On the contrary Figure 8 and Figure 9 show the behavior of the best performing correlation only for R1234ze(E). Table 5 shows that the best performing correlations (highlighted in blue font) properly take into account the thermal properties and that they prove to be suitable for both the fluids (as the percentage errors are similar and within the range ±30%). On the contrary Table 6 highlights that only the model developed by Han and Chen, among all the correlations for the prediction of the heat transfer coefficient, seems to take into account correctly the thermal properties and to provide accurate prediction for both of the fluids. Focusing only on R1234ze(E), the Rollmann and Spindler correlation also provides predictions with mean absolute percentage deviation within ±30%. Nevertheless, its performance is lower than the Han and Chen correlation.
Table 5.
Comparison between the experimental data concerning the pressure drop per unit length and the predictions provided by some of the correlations available in the open literature.
Table 6.
Comparison between the experimental data concerning the heat transfer coefficient and the predictions provided by some of the correlations available in the open literature.
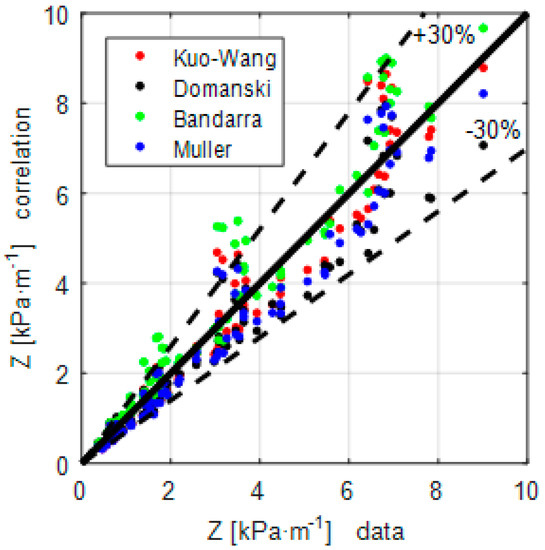
Figure 8.
Comparison between the experimental data and the best performing correlations developed for the pressure drop per unit length.
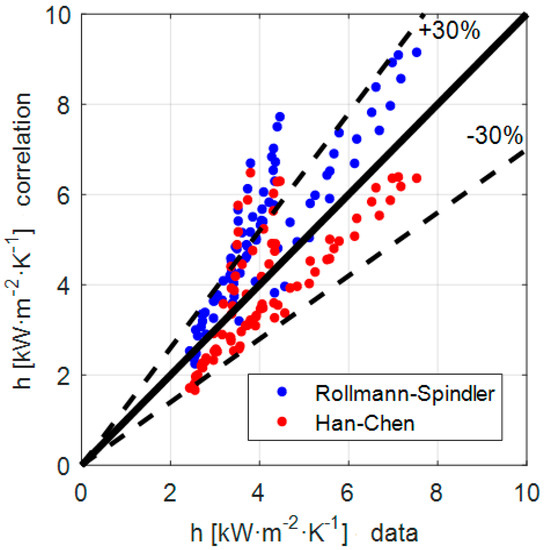
Figure 9.
Comparison between the experimental data and the best performing correlations developed for the heat transfer coefficient.
5. Conclusions
The experiments, performed under operating conditions frequently used in HVAC common practice (boiling, saturation temperature Tsat = 5 °C, mass flux in the range G∈[65,222] kg·m−2·s−1, mean quality xm = 0.5, quality change ∆x = 0.6) confirmed that R1234ze(E) is a good drop-in replacement for R134a. As reported in Figure 5 and Figure 6, no significant differences can be observed in the thermo-fluid dynamic behavior of the two fluids. The comparison between the experimental data and the correlations available in the open literature showed that there are some reliable models (e.g., Kuo-Wang, Domanski, Bandarra, etc.) for the prediction of the pressure drop per unit length for both fluids. However, it is not always the case that the best predictor for R134a turns out to be the best one also for R1234ze(E). On the contrary, for the heat transfer coefficient, only the Han-Chen correlation seems capable to properly account for the thermal properties and provide good predictions for both the fluids. It is particularly evident that the mean absolute percentage deviation of well-known prediction models from the literature is still relatively large (never lower than 15%) for both the heat transfer coefficient and the pressure gradient. Moreover, the scatter of the predictions suggests that the description of data trends needs substantial improvement. Accordingly, additional efforts are required to more properly describe the behavior of the latter quantities.
Author Contributions
Conceptualization, L.P.M.C. and A.L.; methodology, L.P.M.C. and A.L.; software, A.L.; validation, T.N.P., A.L. and I.M.C.; formal analysis, A.L.; investigation, T.N.P.; resources, L.P.M.C.; data curation, A.L. and T.N.P.; writing—original draft preparation, A.L. and I.M.C.; writing—review and editing, I.M.C., P.G.P. and L.P.M.C.; supervision, L.P.M.C.; funding acquisition, L.P.M.C. and A.L. All authors have read and agreed to the published version of the manuscript.
Funding
This research was funded by MIUR through the program PRIN 2015, grant number 2015M8S2PA.
Data Availability Statement
The data present in this study are available on request from the corresponding author.
Acknowledgments
The authors with gratitude thank Adriano Muzzio for the precious support he gave in developing the experimental apparatus and performing the tests. We acknowledge the support of time and facilities from Ho Chi Minh City University of Technology (HCMUT), VNU-HCM for this study.
Conflicts of Interest
The authors declare no conflict of interest.
Nomenclature
| Latin symbols | |||
| A | cross sectional area [m2] | L | heat transfer length [m] |
| cp | specific heat capacity [J·kg−1·K−1] | mass flow rate [kg·s−1] | |
| D | outer diameter [m] | n | fin number [-] |
| E% | mean percentage error [-] | p | refrigerant pressure [Pa] |
| G | refrigerant mass flux [kg·m−2·s−1] | P | wet perimeter [m] |
| g | generic quantity [-] | q | heat flux [W·m−2] |
| H | fin height [m] | thermal power exchanged [W] | |
| h | heat transfer coefficient [W·m−2·K−1] | s | standard deviation [-] |
| hlv | phase change enthalpy [J·kg−1] | T | temperature [K] |
| k | thermal conductivity [W·m−1·K−1] | x | refrigerant quality [-] |
| l | distance between the pressure taps [m] | Z | pressure drop per unit length [Pa·m−1] |
| Greek symbols | |||
| α | apex angle [°] | ∆x | quality change in the test section [-] |
| β | helix angle [°] | μ | dynamic viscosity [kg·m−1·s−1] |
| ∆% | percentage variation of a quantity [-] | ρ | density [kg·m−3] |
| ∆p | pressure drop [Pa] | σ | surface tension [N·m−1] |
| ∆T | temperature difference [K] | ||
| Subscripts | |||
| a | water | m | mean |
| A | absolute | o | outlet |
| b | bottom | O | outer |
| c | correlation | r | refrigerant |
| e | experimental | R | fin root |
| E | evaporator | ref | reference condition |
| H | hydraulic | s | side |
| i | inlet | sat | saturation |
| j | j-th element | t | top |
| lm | log mean | T | test section |
References
- The European Parilament and Council of the European Union European Regulation (EU) No. 517/2014; Europa Law Publishing: Zutphen, The Netherlands, 2014; pp. 195–230.
- Hodnebrog, Ø.; Etminan, M.; Fuglestvedt, J.S.; Marston, G.; Myhre, G.; Nielsen, C.J.; Shine, K.P.; Wallington, T.J. Global warming potentials and radiative efficiencies of halocarbons and related compounds: A comprehensive review. Rev. Geophys. 2013, 51, 300–378. [Google Scholar] [CrossRef] [Green Version]
- Censi, G.; Padovan, A. R1234ze(E) as drop-in replacement for R134a in a micro-fin shell-and-tube evaporator: Experimental tests and calculation model evaporator: Experimental tests and calculation model. In Proceedings of the 18th International Refrigeration and Air Conditioning Conference, West Lafayette, IN, USA, 24–28 May 2021. [Google Scholar]
- Colombo, L.P.M.; Lucchini, A.; Molinaroli, L. Experimental analysis of the use of R1234yf and R1234ze(E) as drop-in alternatives of R134a in a water-to-water heat pump. Int. J. Refrig. 2020, 115, 18–27. [Google Scholar] [CrossRef] [Green Version]
- Zhang, J.; Kaern, M.R.; Ommen, T.; Elmegaard, B.; Haglind, F. Condensation heat transfer and pressure drop characteristics of R134a, R1234ze(E), R245fa and R1233zd(E) in a plate heat exchanger. Int. J. Heat Mass Transf. 2019, 128, 136–149. [Google Scholar] [CrossRef]
- Zyczkowski, P.; Borowski, M.; Łuczak, R.; Kuczera, Z.; Ptaszyński, B. Functional equations for calculating the properties of low-GWP R1234ze(E) refrigerant. Energies 2020, 13, 3052. [Google Scholar] [CrossRef]
- Al Ghafri, S.Z.S.; Rowland, D.; Akhfash, M.; Arami-Niya, A.; Khamphasith, M.; Xiao, X.; Tsuji, T.; Tanaka, Y.; Seiki, Y.; May, E.F.; et al. Thermodynamic properties of hydrofluoroolefin (R1234yf and R1234ze(E)) refrigerant mixtures: Density, vapour-liquid equilibrium, and heat capacity data and modelling. Int. J. Refrig. 2019, 98, 249–260. [Google Scholar] [CrossRef]
- Kedzierski, M.A.; Park, K.J. Horizontal convective boiling of R134A, R1234YF/R134A, and R1234ZE(E) within a micro-fin tube. J. Enhanc. Heat Transf. 2014, 20, 333–346. [Google Scholar] [CrossRef]
- Goto, M.; Inoue, N.; Ishiwatari, N. Condensation and evaporation heat transfer of R410A inside internally grooved horizontal tubes. Int. J. Refrig. 2001, 24, 628–638. [Google Scholar] [CrossRef]
- Bandarra Filho, E.P.; Saiz Jabardo, J.M.; Barbieri, P.E.L. Convective boiling pressure drop of refrigerant R-134a in horizontal smooth and microfin tubes. Int. J. Refrig. 2004, 27, 895–903. [Google Scholar] [CrossRef]
- Rollmann, P.; Spindler, K.; Müller-Steinhagen, H. Heat transfer, pressure drop and flow patterns during flow boiling of R407C in a horizontal microfin tube. Heat Mass Transf. 2011, 47, 951–961. [Google Scholar] [CrossRef]
- Colombo, L.P.M.; Lucchini, A.; Muzzio, A. Flow patterns, heat transfer and pressure drop for evaporation and condensation of R134A in microfin tubes. Int. J. Refrig. 2012, 35, 2150–2165. [Google Scholar] [CrossRef]
- Diani, A.; Mancin, S.; Cavallini, A.; Rossetto, L. Étude expérimentale de l’ébullition en écoulement de R1234ze(E) à l’intérieur d’un tube horizontal à micro-ailettes de diamètre intérieur de 2.4 mm. Int. J. Refrig. 2016, 69, 272–284. [Google Scholar] [CrossRef]
- Li, H.; Hrnjak, P. Heat transfer coefficient, pressure drop, and flow patterns of R1234ze(E) evaporating in microchannel tube. Int. J. Heat Mass Transf. 2019, 138, 1368–1386. [Google Scholar] [CrossRef]
- Soliman, H.M.; Azer, N.Z. Visual studies of flow patterns during condensation inside horizontal tubes. In Proceedings of the International Heat Transfer Conference Digital Library, Tokyo, Japan, 3–7 September 1974; Volume 3, pp. 241–245. [Google Scholar]
- Breber, G.; Palen, J.W.; Taborek, J. Prediction of horizontal tubeside condensation of pure components using flow regime criteria. J. Heat Transf. 1980, 102, 471–476. [Google Scholar] [CrossRef]
- Tandon, T.N.; Varma, H.K.; Gupta, C.P. A new flow regimes map for condensation inside horizontal tubes. J. Heat Transf. 1982, 104, 763–768. [Google Scholar] [CrossRef]
- El Hajal, J.; Thome, J.R.; Cavallini, A. Condensation in horizontal tubes, part 1: Two-phase flow pattern map. Int. J. Heat Mass Transf. 2003, 46, 3349–3363. [Google Scholar] [CrossRef]
- Milkie, J.A.; Garimella, S.; Macdonald, M.P. Flow regimes and void fractions during condensation of hydrocarbons in horizontal smooth tubes. Int. J. Heat Mass Transf. 2016, 92, 252–267. [Google Scholar] [CrossRef]
- Kattan, N.; Thome, J.R.; Favrat, D. Flow boiling in horizontal tubes: Part 1—Development of a diabatic two-phase flow pattern map. J. Heat Transf. 1998, 120, 140–147. [Google Scholar] [CrossRef]
- Rollmann, P.; Spindler, K. A new flow pattern map for flow boiling in microfin tubes. Int. J. Multiph. Flow 2015, 72, 181–187. [Google Scholar] [CrossRef]
- Wojtan, L.; Ursenbacher, T.; Thome, J.R. Investigation of flow boiling in horizontal tubes: Part I—A new diabatic two-phase flow pattern map. Int. J. Heat Mass Transf. 2005, 48, 2955–2969. [Google Scholar] [CrossRef]
- Zhuang, X.; Gong, M.; Chen, G.; Zou, X.; Shen, J. Two-phase flow pattern map for R170 in a horizontal smooth tube. Int. J. Heat Mass Transf. 2016, 102, 1141–1149. [Google Scholar] [CrossRef]
- Yang, Z.Q.; Chen, G.F.; Zhuang, X.R.; Song, Q.L.; Deng, Z.; Shen, J.; Gong, M.Q. A new flow pattern map for flow boiling of R1234ze(E) in a horizontal tube. Int. J. Multiph. Flow 2018, 98, 24–35. [Google Scholar] [CrossRef]
- Müller-Steinhagen, H.; Heck, K. A simple friction pressure drop correlation for two-phase flow in pipes. Chem. Eng. Process. Process Intensif. 1986, 20, 297–308. [Google Scholar] [CrossRef]
- Xu, Y.; Fang, X.; Su, X.; Zhou, Z.; Chen, W. Evaluation of frictional pressure drop correlations for two-phase flow in pipes. Nucl. Eng. Des. 2012, 253, 86–97. [Google Scholar] [CrossRef]
- Sun, L.; Mishima, K. Evaluation analysis of prediction methods for two-phase flow pressure drop in mini-channels. Int. Conf. Nucl. Eng. 2008, 2, 649–658. [Google Scholar]
- Murata, K.; Mashizume, K. Forced convective boiling of nonazeotropic refrigerant mixtures inside tubes. J. Heat Transf. 1993, 115, 680–689. [Google Scholar] [CrossRef]
- Kattan, N.; Thome, J.R.; Favrat, D. Flow boiling in horizontal tubes: Part 3—Development of a new heat transfer model based on flow pattern. J. Heat Transf. 1998, 120, 156–165. [Google Scholar] [CrossRef]
- Mehendale, S. A new heat transfer coefficient correlation for pure refrigerants and near-azeotropic refrigerant mixtures flow boiling within horizontal microfin tubes Nouvelle corrélation entre le coefficient de transfert de chaleur et l’ébullition en écoulement des. Int. J. Refrig. 2018, 86, 292–311. [Google Scholar] [CrossRef]
- Colombo, L.P.M.; Lucchini, A.; Nhan Phan, T.; Molinaroli, L.; Niro, A. Design and assessment of an experimental facility for the characterization of flow boiling of azeotropic refrigerants in horizontal tubes. J. Phys. Conf. Ser. 2019, 1224, 012037. [Google Scholar] [CrossRef]
- Moffat, R.J. Describing the uncertainties in experimental results. Exp. Therm. Fluid Sci. 1988, 1, 3–17. [Google Scholar] [CrossRef] [Green Version]
- Colombo, L.P.M.; Lucchini, A.; Molinaroli, L.; Niro, A.; Phan, T.N.; Pittoni, P.G. Flow patterns during flow boiling and convective condensation of R1234ze(E) inside a microfin tube. In Proceedings of the 5–6th Thermal and Fluids Engineering Conference (TFEC), New Orleans, LA, USA, 26–28 May 2021; pp. 109–119. [Google Scholar]
- Kuo, C.S.; Wang, C.C. In-tube evaporation of HCFC-22 in a 9.52 mm micro-fin/smooth tube. Int. J. Heat Mass Transf. 1996, 39, 2559–2569. [Google Scholar] [CrossRef]
- Choi, J.Y.; Kedzierski, M.A.; Domanski, P. A Generalized Pressure Drop Correlation for Evaporation and Condensation in Smooth and Micro-Fin Tubes; IIF-IIR-Commission B1: Urbana, IL, USA, 2001.
- Cavallini, A.; Del Col, D.; Doretti, L.; Longo, G.A.; Rossetto, L. Heat transfer and pressure drop during condensation of refrigerants inside horizontal enhanced tubes Transfert de chaleur et chute de pression lors de la condensation de frigorigènes à l’intérieur de tubes horizontaux à surface augmentée. Int. J. Refrig. 2000, 23, 4–25. [Google Scholar] [CrossRef]
- Shannak, B.A. Frictional pressure drop of gas liquid two-phase flow in pipes. Nucl. Eng. Des. 2008, 238, 3277–3284. [Google Scholar] [CrossRef]
- Rollmann, P.; Spindler, K. New models for heat transfer and pressure drop during flow boiling of R407C and R410A in a horizontal microfin tube. Int. J. Therm. Sci. 2016, 103, 57–66. [Google Scholar] [CrossRef]
- Cavallini, A.; Del Col, D.; Mancin, S.; Rossetto, L. An updated model for condensation of halogenated refrigerants inside enhanced tubes. In Proceedings of the 22nd International Congress of Refrigeration, Beijing, China, 21–26 August 2007. [Google Scholar]
- Yun, R.; Kim, Y.; Seo, K.; Kim, H.Y. A generalized correlation for evaporation heat transfer of refrigerants in micro-fin tubes. Int. J. Heat Mass Transf. 2002, 45, 2003–2010. [Google Scholar] [CrossRef]
- Han, X.H.; Fang, Y.B.; Wu, M.; Qiao, X.G.; Chen, G.M. Study on flow boiling heat transfer characteristics of R161/oil mixture inside horizontal micro-fin tube. Int. J. Heat Mass Transf. 2017, 104, 276–287. [Google Scholar] [CrossRef]
- Merchant, R.; Mehendale, S. A New Model for Predicting Flow Boiling Heat Transfer Coefficients in Horizontal Microfin Tubes. In Proceedings of the 2016 Proceedings of the ASME International Mechanical Engineering Congress and Exposition, Phoenix, AZ, USA, 11–17 November 2016. [Google Scholar]


Publisher’s Note: MDPI stays neutral with regard to jurisdictional claims in published maps and institutional affiliations. |
© 2021 by the authors. Licensee MDPI, Basel, Switzerland. This article is an open access article distributed under the terms and conditions of the Creative Commons Attribution (CC BY) license (https://creativecommons.org/licenses/by/4.0/).