Article

Experiments and Simulations of Free-Surface Flow behind a Finite Height Rigid Vertical Cylinder

1
Laboratoire Ondes et Milieux Complexes, CNRS and Université Le Havre Normandie, 76600 Le Havre, France
2
Laboratoire PIMM, CNRS, Arts et Metiers Institute of Technologie, Cnam, HESAM Universite, 75013 Paris, France
3
CORIA, CNRS, INSA, Université de Rouen Normandie, 76800 Saint-Etienne-du-Rouvray, France
*
Author to whom correspondence should be addressed.
Fluids 2021, 6(10), 367; https://doi.org/10.3390/fluids6100367
Submission received: 6 September 2021 / Revised: 21 September 2021 / Accepted: 6 October 2021 / Published: 18 October 2021

Abstract

:
We present the results of a combined experimental and numerical study of the free-surface flow behind a finite height rigid vertical cylinder. The experiments measure the drag and the wake angle on cylinders of different diameters for a range of velocities corresponding to 30,000 < R e < 200,000 and 0.2 < F r < 2 where the Reynolds and Froude numbers are based on the diameter. The three-dimensional large eddy simulations use a conservative level-set method for the air-water interface, thus predicting the pressure, the vorticity, the free-surface elevation and the onset of air entrainment. The deep flow looks like single phase turbulent flow past a cylinder, but close to the free-surface, the interaction between the wall, the free-surface and the flow is taking place, leading to a reduced cylinder drag and the appearance of V-shaped surface wave patterns. For large velocities, vortex shedding is suppressed in a layer region behind the cylinder below the free surface. The wave patterns mostly follow the capillary-gravity theory, which predicts the crest lines cusps. Interestingly, it also indicates the regions of strong elevation fluctuations and the location of air entrainment observed in the experiments. Overall, these new simulation results, drag, wake angle and onset of air entrainment, compare quantitatively with experiments.

1. Introduction

The turbulent flow around a fully immersed cylinder has been the object of numerous experimental [1] and numerical studies [2,3]. When a free surface is present, the interaction between the cylinder wall and the flow structure leads to surface Kelvin waves [4] and eventually air entrainment. Turbulent free-surface flows are well documented for vertical flat plates [5,6], hull shapes [7] and hydrofoils [8]. However, the simple configuration of a finite height vertical rigid cylinder partially immersed in water flow has been less studied in the recent years. In 1947, Hay [9] reported an extensive investigation on the flow around a semi-submerged cylinder and provided many photographs from above and below the free surface for a wide range of velocities and diameters. The data uncovered the scaling relationship for the dimension of the various waves ahead and downstream of the cylinder; the wave dimensions seemed proportional to the square of the translating velocity [10,11]. Recent experiments [12] have provided the underneath velocity fields showing the presence of two recirculation regions: the first one below the cylinder’s free-end and the second one behind the cylinder. These correspond to the two modes of vortex shedding attached to the cylinder. This complex flow structure affects the cylinder drag so that it is lower than the drag for fully immersed flow [9,10,13].
The experimental observations described above have been reproduced numerically [14,15,16,17,18,19] by solving the Navier–Stokes equations coupled with additional equations for the free-surface behavior using the large eddy simulation (LES) approach, which allows turbulent flows to be dealt with by simulating large-scale motion and modelling only small-scale motions. The simulated flow is governed by two dimensionless numbers: (i) the Reynolds number, defined as R e = U D / ν , with U being the velocity, D representing the cylinder diameter and ν standing for the kinematic viscosity; and (ii) the Froude number F r = U / g D with the gravitational acceleration g = 9.81 m/s 2 . Note that both R e and F r are proportional to U and quantify the ratio between inertia and viscous effects and the ratio between inertia and gravity effects, respectively. Yu et al. [16] and Koo et al. [18] have computed the flow past a cylinder, the dimensionless drag force, as well as the free-surface elevation for 27,000 < R e < 458,000 and 0.2 < F r < 1.64 . They fixed D and R e , then varied F r by changing g. Similarly, they fixed D and F r , then varied R e by changing ν . These computations showed the sensitivity of the drag, its variation along the cylinder and its weakening close to the free surface.
Although numerical simulations can reproduce the drag on a cylinder, there are few data [20] about the vorticity underneath the free surface and the wake pattern. The present study focuses on experiments for D = 5 and 11 cm. The numerical simulations are for D = 5 cm (with a constant immersion height) at 30,000 < R e < 70,000 and 0.86 < F r < 2 . It is known from two-dimensional simulations [21,22,23] that a large F r results in large vorticity patterns below the free surface. In fact, the surface tension acts to prevent surface curvature. Here, in the case of the air-water interface, the free surface is described by the Bond number, which accounts for the ratio of gravity and surface tension effects. For cylinders, the Bond number can be defined as B o = ρ g D 2 / σ , where σ is the surface tension of water free of contaminants: σ = 72.8 mN/m. With D = 5 and 11 cm, B o 340 and 1630, respectively, which indicates that gravity dominates over capillary effects. Eventually, the breakup of the free surface or the onset of air entrainment is controlled by the ratio of the inertia and surface tension effect, the Weber number, which is calculated as W e = ρ D U 2 / σ = B o F r 2 . W e is O ( 1000 ) , which indicates the inertial and gravity effects dominate over the capillary effects. Nevertheless, the free-surface V-shaped pattern behind the cylinder is observed and is related to capillary-gravity waves [4,24,25,26].
At relatively high velocities, the effects of turbulence lead to free-surface fluctuations. Hence, it is natural to compare the predicted maximum amplitude crest line locations and the elevation height fluctuations in relation to the subsequent air entrainment. The critical conditions for air entrainment behind a translating cylinder have been reported [13] and showed several regimes within the cavity or the wake, depending on R e / F r . It is interesting to note that in wave breaking, the effect of subsurface vorticity seems to be related to the volume of entrained air [27,28,29].
The goal of the present paper is twofold. After describing the experimental setup and the numerical method, the results are given. Using LES, we provide data on the relationship between turbulent flow (pressure and vorticity) and free-surface elevation. The deformation of the free surface and its properties are compared to the capillary-gravity wave theory, which predicts the V-shaped pattern and the location of entrained air bubbles. Finally, the numerical study is compared to experiments in a flume, where the wake and global drag forces on the cylinder highlight the role of wake waves on drag decrease.

2. Experimental Setup

The experiments were performed for cylinders with D = 5 and 11 cm within a flume of 34 m in length, W = 90 cm in width and 120 cm in height filled with water. These are hollow cylinders made of polymethyl methacrylate (PMMA), which has a Young modulus around 3 GPa. Each cylinder was clogged at its free end; the total height was 65 cm and the wall thickness was 5 mm. They were mounted vertically and perpendicular to the water free surface on a carriage. Then, the cylinder immersed height, h, equaled 23 cm and moved along the flume with a velocity U. According to Griffith et al. [30], the critical horizontal blockage width, D / W , for the appearance of confinement effects on three-dimensional flow is 0.2; here D / W = 0.122 . The top of the flume was open to the air and a camera was placed above the free surface in order to obtain the wake angles. The determination of the angles and the critical velocity for air entrainment around the cylinder was measured on images with a 2000 × 2000 pixel charged-coupled device camera (Basler).
The drag on the cylinder was calculated from the axial force, F x , acting on the whole cylinder. It was measured using a piezoelectric sensor (Kistler) with a sensitivity of −7.8 pC/N, placed at the top of the cylinder. It was assumed the contribution of air drag can be neglected, as the density of water is larger. The error on C D was estimated around 0.8%. F x was measured over time, and the time average F ¯ x was done over 5 s. C D was calculated using: C D = 2 F ¯ x / ρ h D U 2 . In the range of R e studied, vortex shedding behind the cylinder was evidenced through the Strouhal number, S t = f D / U = 0.2 ± 0.025 , from f, the peak of the spectrum of the lift-force, F y , signal [31]. Moreover, the natural frequencies of the cylinder are unrelated to the frequency associated with vortex-induced vibration due to the elastic deformation that acts as an oscillator and triggers special modes of vortex shedding [32,33,34]. Further details of the experiment can be found elsewhere [13].

3. Numerical Method

The results were achieved with the YALES2 software [35], which is briefly presented below. Then a focus was given to the level-set method, which was used to treat the interface. Finally, the numerical configuration to reproduce experiments is presented.

3.1. Description of the YALES2 Library

The objective of the YALES2 code is to solve unsteady Navier–Stokes equations with massively parallel computers. It allows the use of unstructured meshes with several billions of elements [36,37], thus permitting the direct numerical simulation and LES of laboratory and semi-industrial configurations. The low-Mach number Navier–Stokes equations are solved with a projection method for constant and variable density flows [38,39]. These equations are discretised with a finite-volume 4th order central scheme in space and a 4th order Runge–Kutta-like scheme in time. The efficiency of projection approaches for low-Mach number flows is usually driven by the performances of the Poisson solver. In YALES2, the linear solver is a highly efficient deflated preconditioned conjugate gradient (DPCG) with a coarse-grid preconditioning [40].

3.2. Treatement of Free-Surfaces in YALES2

Free-surface tracking was ensured by the accurate conservative level-set (ACLS) method [41] and an improved re-initialization algorithm [42]. It predicts precisely the interface dynamics while maintaining the liquid mass. A scalar ψ is transported while the interface Γ is located at ψ = 0.5 , i.e., Γ = { x R 3 | ψ ( x , t ) = 0.5 } . In such a case, the ψ scalar has a hyperbolic tangent profile in the direction normal to the interface: ψ x , t = 1 2 { tanh ϕ ( x , t ) / 2 ε + 1 } , where 2 ε is the thickness of the profile and ϕ = ± | x x Γ | is the signed-distance function. Considering the flow velocity u is divergence-free, the scalar ψ is first advected by the fluid according to:
ψ t + · ψ u = 0 ,
then reshaped using the re-initialisation equation from Chiodi and Desjardins [42]:
ψ τ = · | ϕ m a p · n | | n | 4 cosh 2 ϕ m a p / 2 ϵ n ,
where ϕ m a p = ϵ ln ψ / 1 ψ , τ is a pseudo-time, and n = ϕ is the interface normal. This step ensures that the ψ profile persists as a hyperbolic tangent while convergence criteria is achieved, i.e., ψ / τ = 0 .
The two-phase coupling was provided by the ghost fluid method (GFM) [43]. More details on the principle of the GFM method are described elsewhere [44]. This method has been extended to three-dimensional unstructured meshes [45] and implemented in the YALES2 solver.

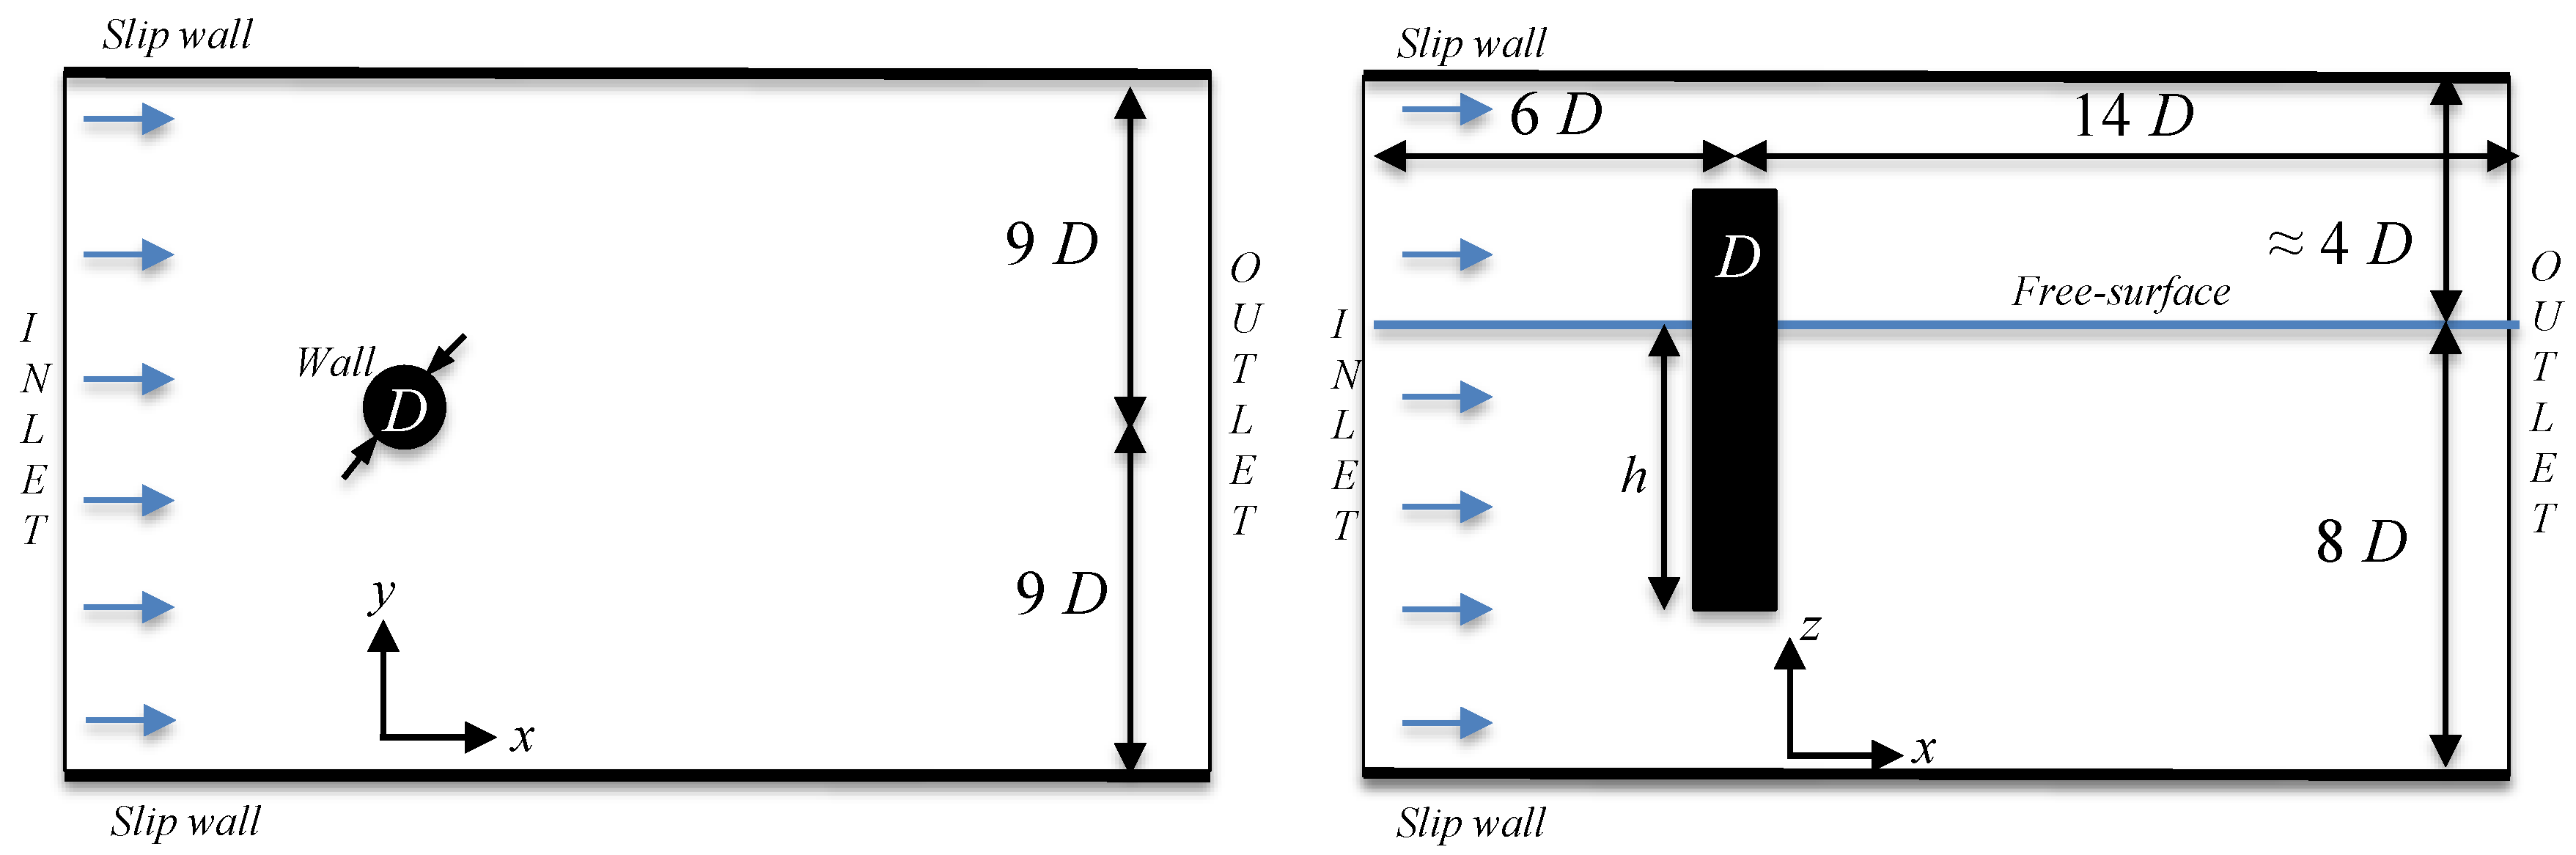
3.3. Dimensionless Coefficient and Setup for the Simulation

The simulations were performed in the frame of reference attached to the cylinder. The length of the computational domain was only 1 m long; the width was W and the height was 12 D around the cylinder. Thus, the inlet velocity was uniform and the slipping walls were moving opposite the reference frame velocity, as depicted in Figure 1. Clearly, the boundary conditions at the free surface, the contact angle on the cylinder and the cylinder wall conditions are critical for the onset of capillary-gravity flows and are known to lead to finite-time dewetting singularities [46]. The cylinder wall was considered as a no-slip boundary condition and a 90 contact angle. Some simulations (not shown) have been carried out with slip boundary conditions and lead to little changes to the free-surface patterns but large changes in the pressure and velocity fields.
A mesh convergence study was performed with the drag coefficient, C D , defined previously. The element’s size was changed from 1.5 to 5 mm on the cylinder wall and from 5 to 20 mm far away in the numerical domain. The final mesh was composed of 47.9 million cells. The edges of the elements were fixed to 2.5 mm on the cylinder wall and to 5 mm in the domain with a growth rate of 1.1. The numerical C D values are compared to the experiments [13].
The drag coefficient, C D , was determined by using the axial force F x on the surface of the cylinder, resulting in pressure expression extracted from Equation (3) and T x determined through the viscous term in Equation (4):
F = S P n d S ,
T = S τ ¯ ¯ n d S ,
where τ ¯ ¯ is the strain tensor. C D ( t ) = F x ( t ) + T x ( t ) / F r e f , with F r e f = ρ h D U 2 / 2 . Moreover, the viscous coefficient, C x , can thus be defined using viscous force T x as: C x ( t ) = T x ( t ) / F r e f .
The wake of the cylinder was characterized by a fully turbulent flow. The smallest eddies could not be captured by the mesh size so the LES formalism accounted for the sub-grid scale impact on the largest scales. Indeed, the Kolmogorov scale, η D R e 3 / 4 , compared to the size of the elements on the cylinder wall, varies between 114 for U = 0.6 m/s and 215 for U = 1.4 m/s. The wall-adapting local eddy-viscosity (WALE) [47], which is based on the Smagorinsky model, was used in the present simulations.
The simulation was computed by setting the maximum Courant–Friedrichs–Lewy number ( CFL ) and a surface tension stability constraint. In the present simulation, CFL = 0.9 , which corresponds to time steps of 1 ms for the simulation at the highest R e . The surface tension stability constraint was 0.5 and the corresponding surface tension time steps were about 0.2 ms (identical for all simulations). Regardless, the time step was always limited by the surface tension constraint. All simulations were performed on 840 Intel Broadwell cores. Each simulation was conducted for 60 U t / D of physical time, which is achieved in approximately 15 h of wall-clock time.
The simulation results were consist over 6 runs at different velocities ranging from R e = 30,000 to 70,000 or F r = 0.86 to 2. Specifically, 4 runs at R e = 30,000, 45,000, 55,000 and 70,000, corresponding to F r = 0.86 , 1,28, 1.57 and 2, respectively, are presented in the next section with a special focus on the vorticity and free-surface effects. All statistics subsequently presented were collected for 42 < U t / D < 60 , with a sampling rate of 100 Hz, in order to eliminate the transient initial state. For example, in our simulation at R e = 40,000, the mass lost for 42 < U t / D < 60 is about 0.012%. Furthermore, the numerical scheme has been validated on test cases for the YALES2 code [48].

4. Results and Discussion

A first set of numerical results provides the instantaneous pressure and vorticity field around the cylinder for D = 5 cm. The second set of results concerns the wake angles, the free-surface height and its fluctuations in order to clarify the interaction between the wake, the free-surface height and the capillary-gravity wave theory. This theory predicts the position of crests that correspond to regions of free-surface height fluctuation and air entrainment. The last set of results compares experimental data of the drag and the wake angles on two cylinders as a function of the velocity with numerical results.

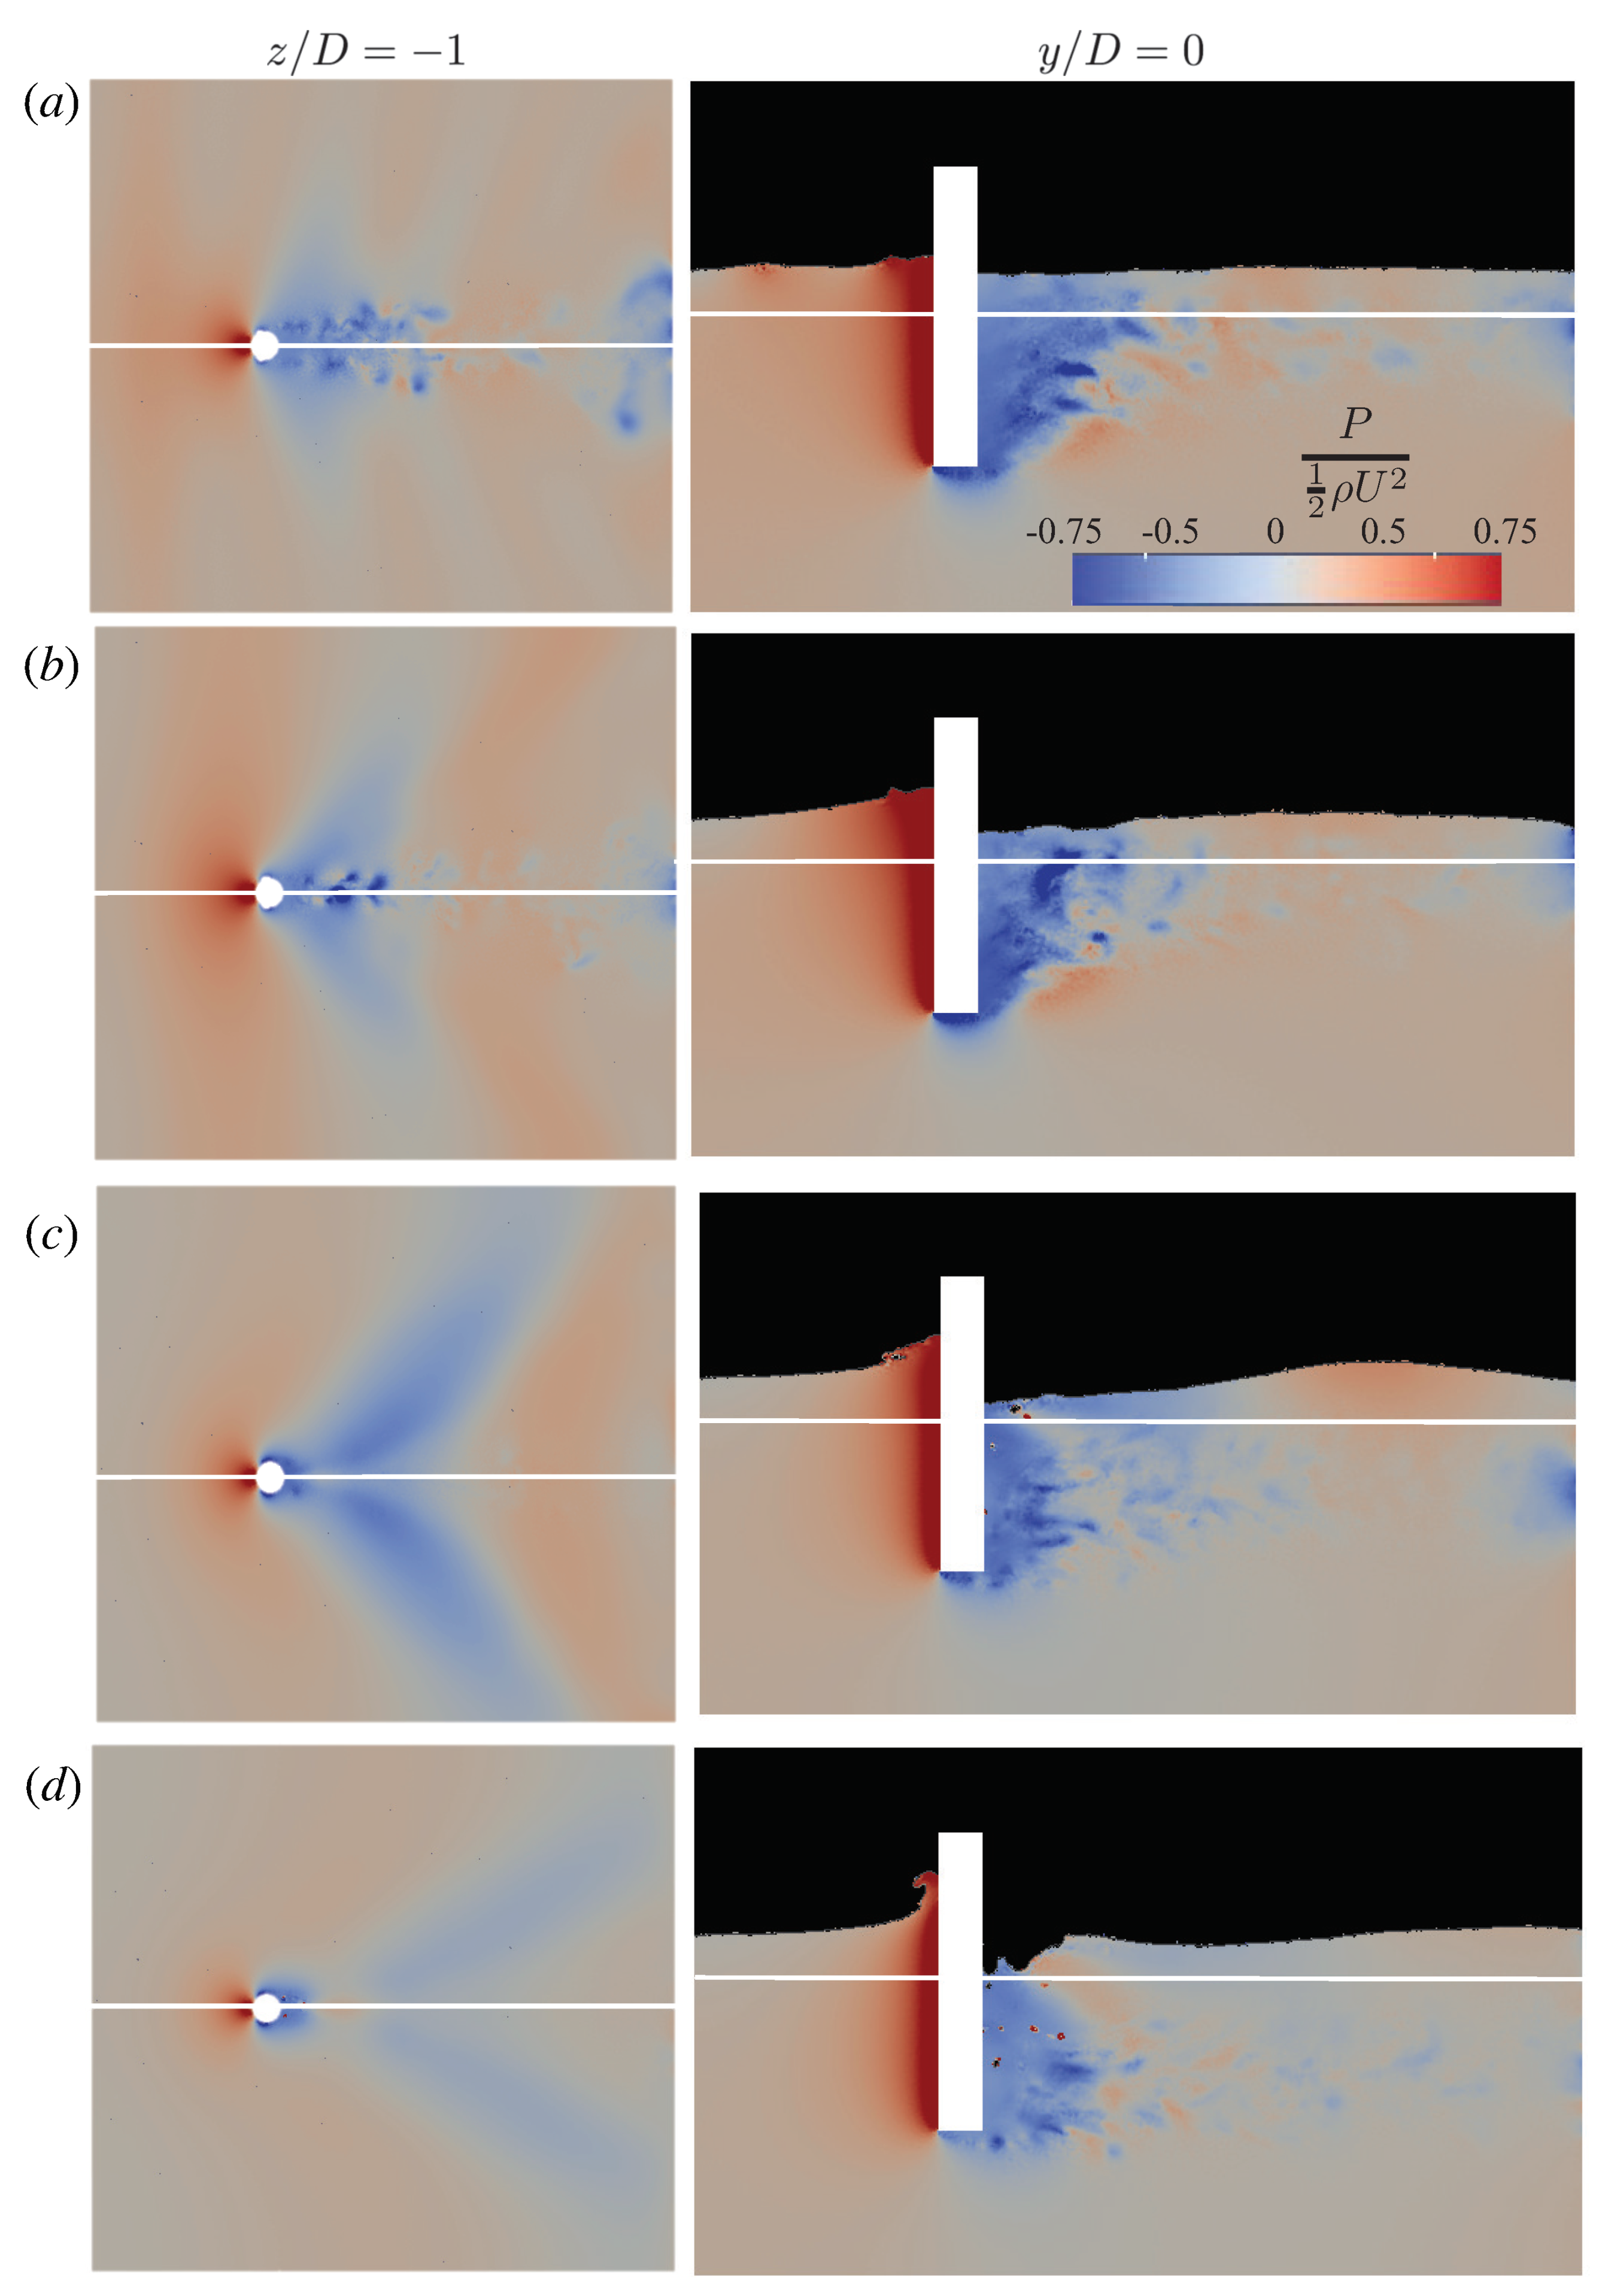
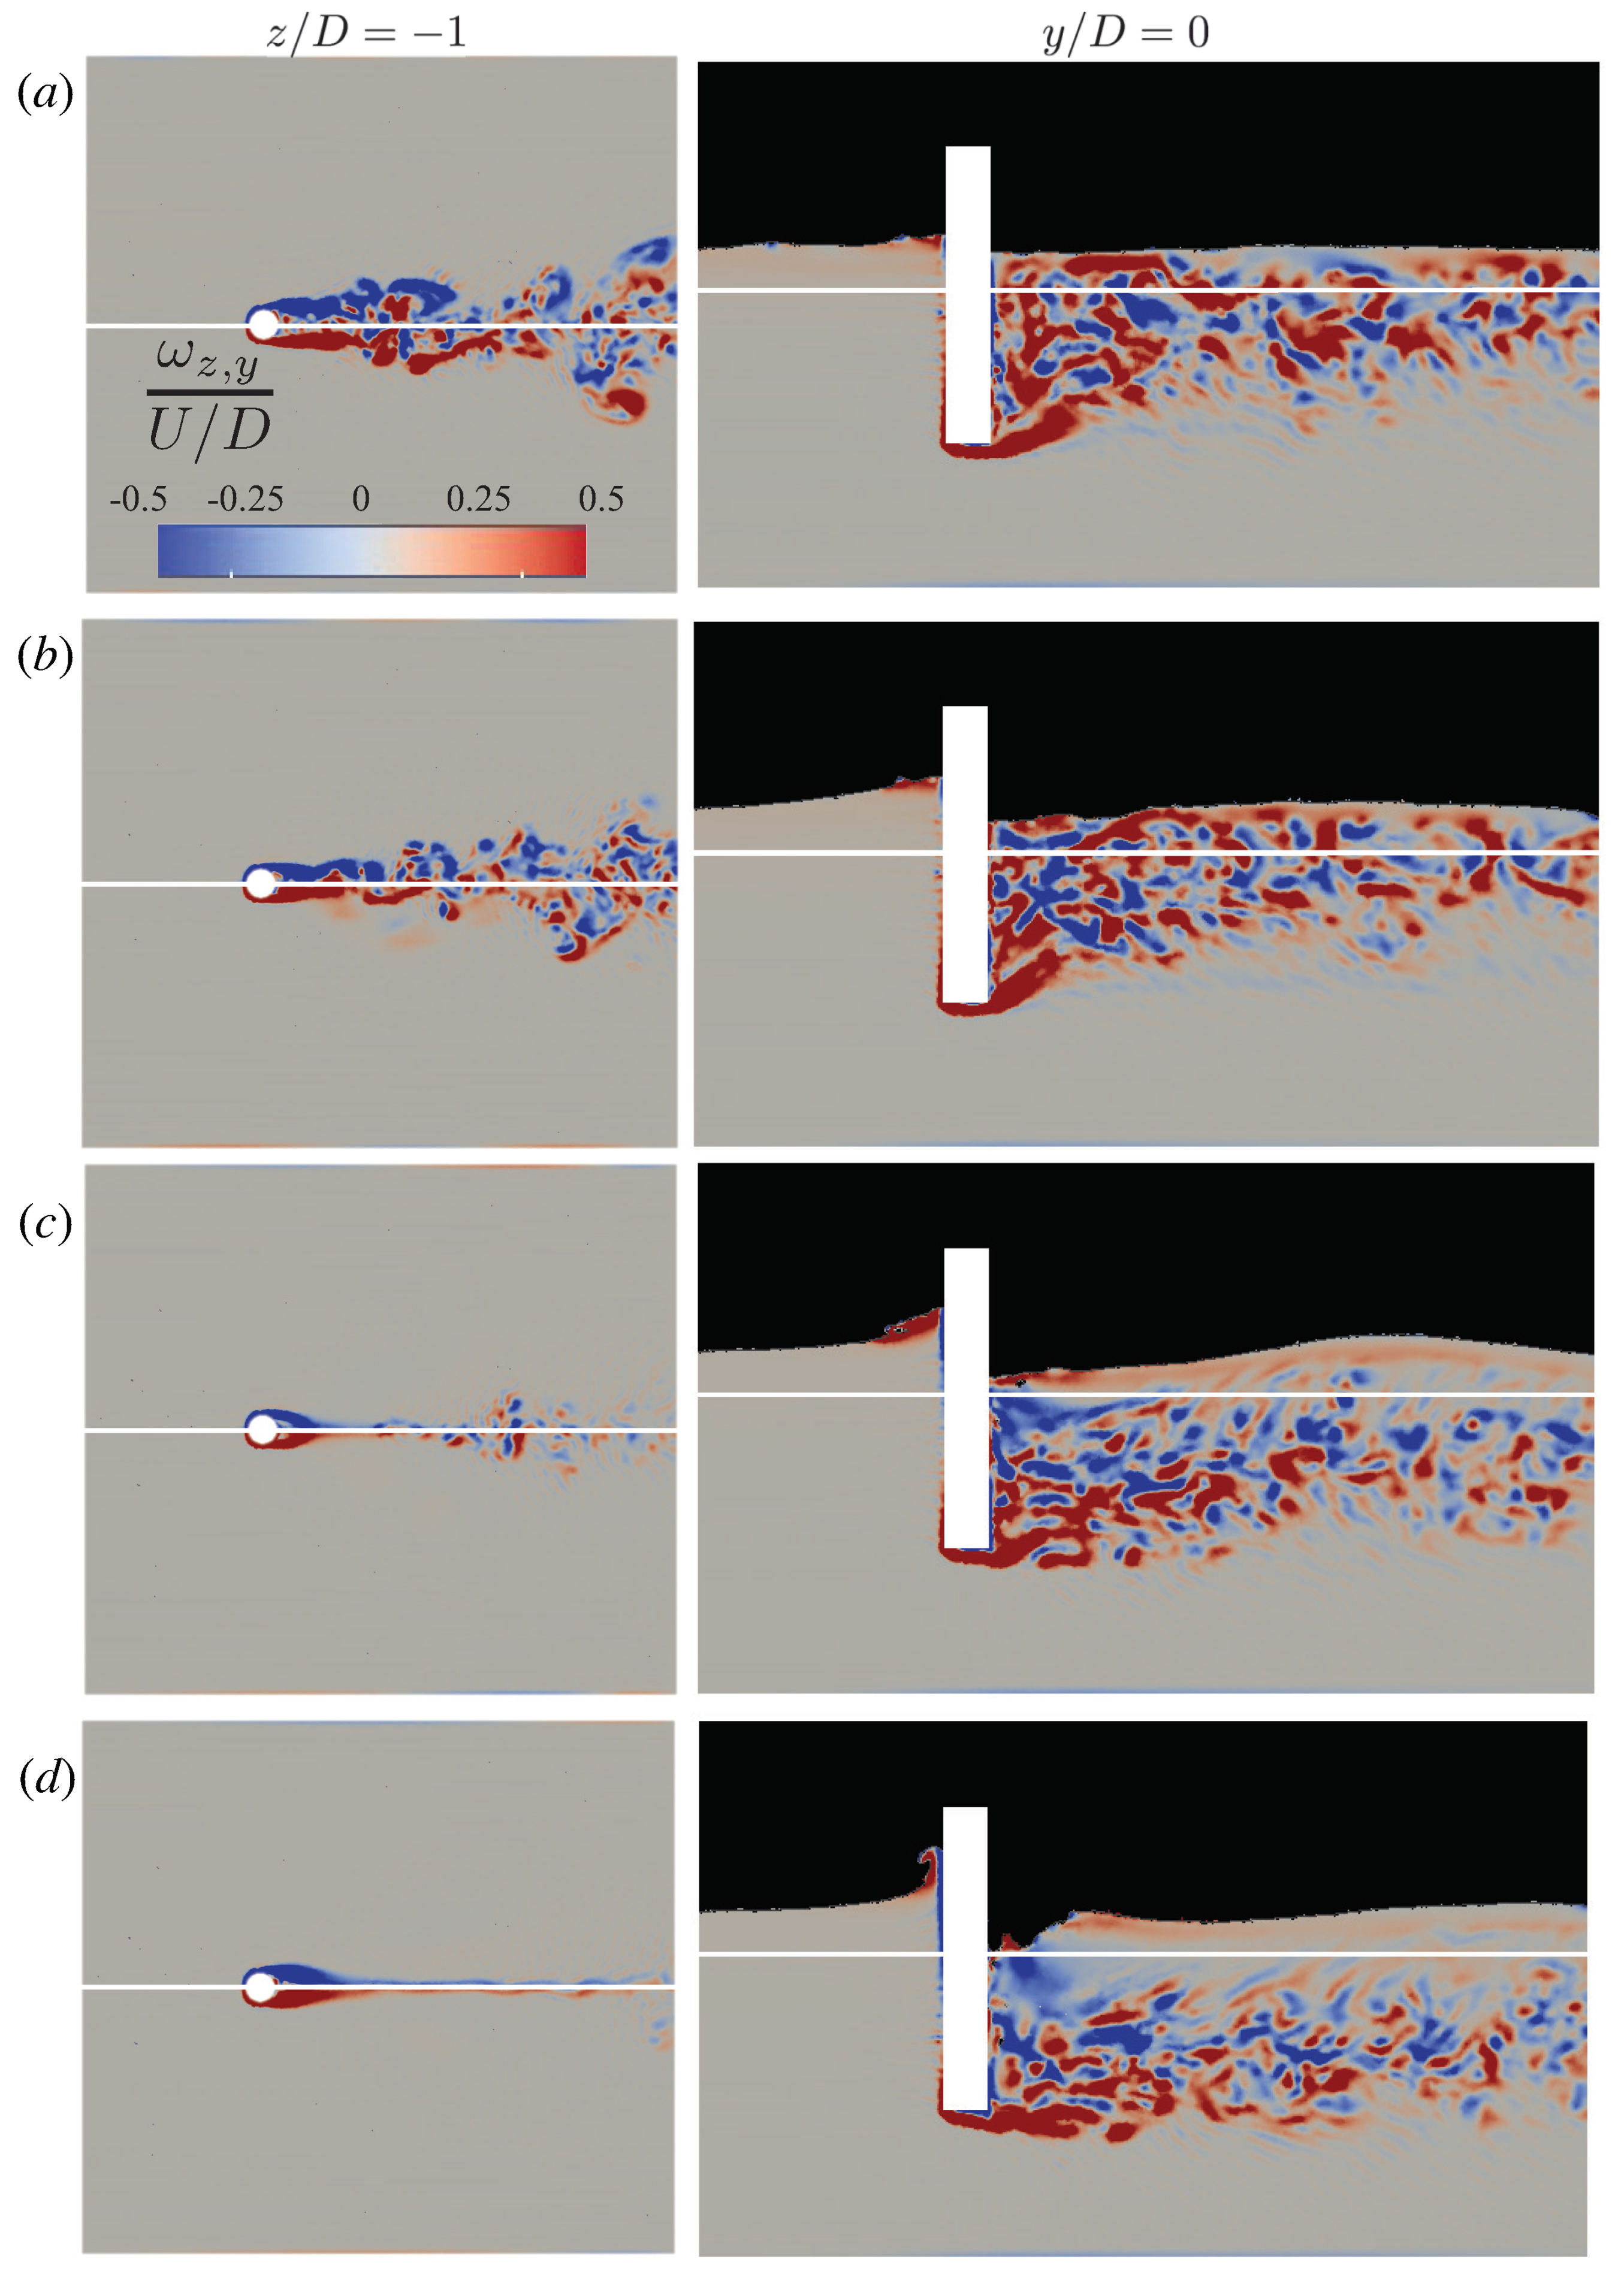
4.1. Pressure and Vorticity Fields

In Figure 2, the evolution of the dimensionless pressure field, P / 1 2 ρ U 2 , is presented for (a) R e = 30,000 or F r = 0.86 , (b) R e = 45,000 or F r = 1.28 , (c) R e = 55,000 or F r = 1.57 and (d) R e = 70,000 or F r = 2 . The elevated height ahead of the cylinder at the bow wave [10] indicates pressure higher than the hydrostatic pressure. Indeed, when increasing R e and F r , high pressure upstream of the cylinder remains roughly constant at P / 1 2 ρ U 2 1 given by Bernoulli’s equation for a stagnation point. However, for large R e and F r , the pressure field differs from the classical vortex street flow. Strong free-surface deformations reduce the pressure drop downstream, as shown in Figure 2c,d. In addition to the strong pressure gradient upstream and downstream of the cylinder, a high-pressure region is located about 10 D from the cylinder downstream of the cavity for R e = 55,000 or F r = 1.57 ; see Figure 2c. It appears after the onset of air entrainment and corresponds to relatively strong free-surface deformation and the V-shaped pattern taking place mainly in the cavity downstream of the cylinder.
Furthermore, the flow dynamics are dominated by vortex shedding along the cylinder for small free-surface deformations visible on pressure (Figure 2a,b) and vorticity fields (Figure 3a,b). From R e = 50,000 or F r = 1.43 , stronger deformations of the free-surface occur and vortex shedding is inhibited in a layer region below the interface as shown in Figure 2c,d and Figure 3c,d. As a result, two steady recirculation regions are formed behind the cylinder. Interestingly, a separated region is observed where a vertical vortex shedding is inhibited, in agreement with previous numerical works [16,17,18].
The small vortices formed deeper are transported toward the free surface further in the wake at a distance which increases with R e and F r . The recirculation region below the cylinder is then pushed downward and deformed by the finite length of the cylinder. Below the free surface around the cylinder, the vorticity is at its maximum value, and it has been reported that secondary flows could be the origin of bubbly wakes [49]. The observed vorticity patterns in Figure 3 at the free end of the cylinder are similar to the ones observed in LES simulations of a finite height cylinder without free surface [50,51]. These detailed simulations shown the presence of: (i) a pair of vortices or tip vortices on the sides at the free-end of the cylinder and (ii) an arch vortex attached to the stagnation point at the bottom of the cylinder, which makes an angle with the horizontal that varies with R e . In fact, this flow structure is responsible for the concentration of vorticity in a layer region behind the free end of the cylinder, in contrast to the re-laminarized region below the free surface.

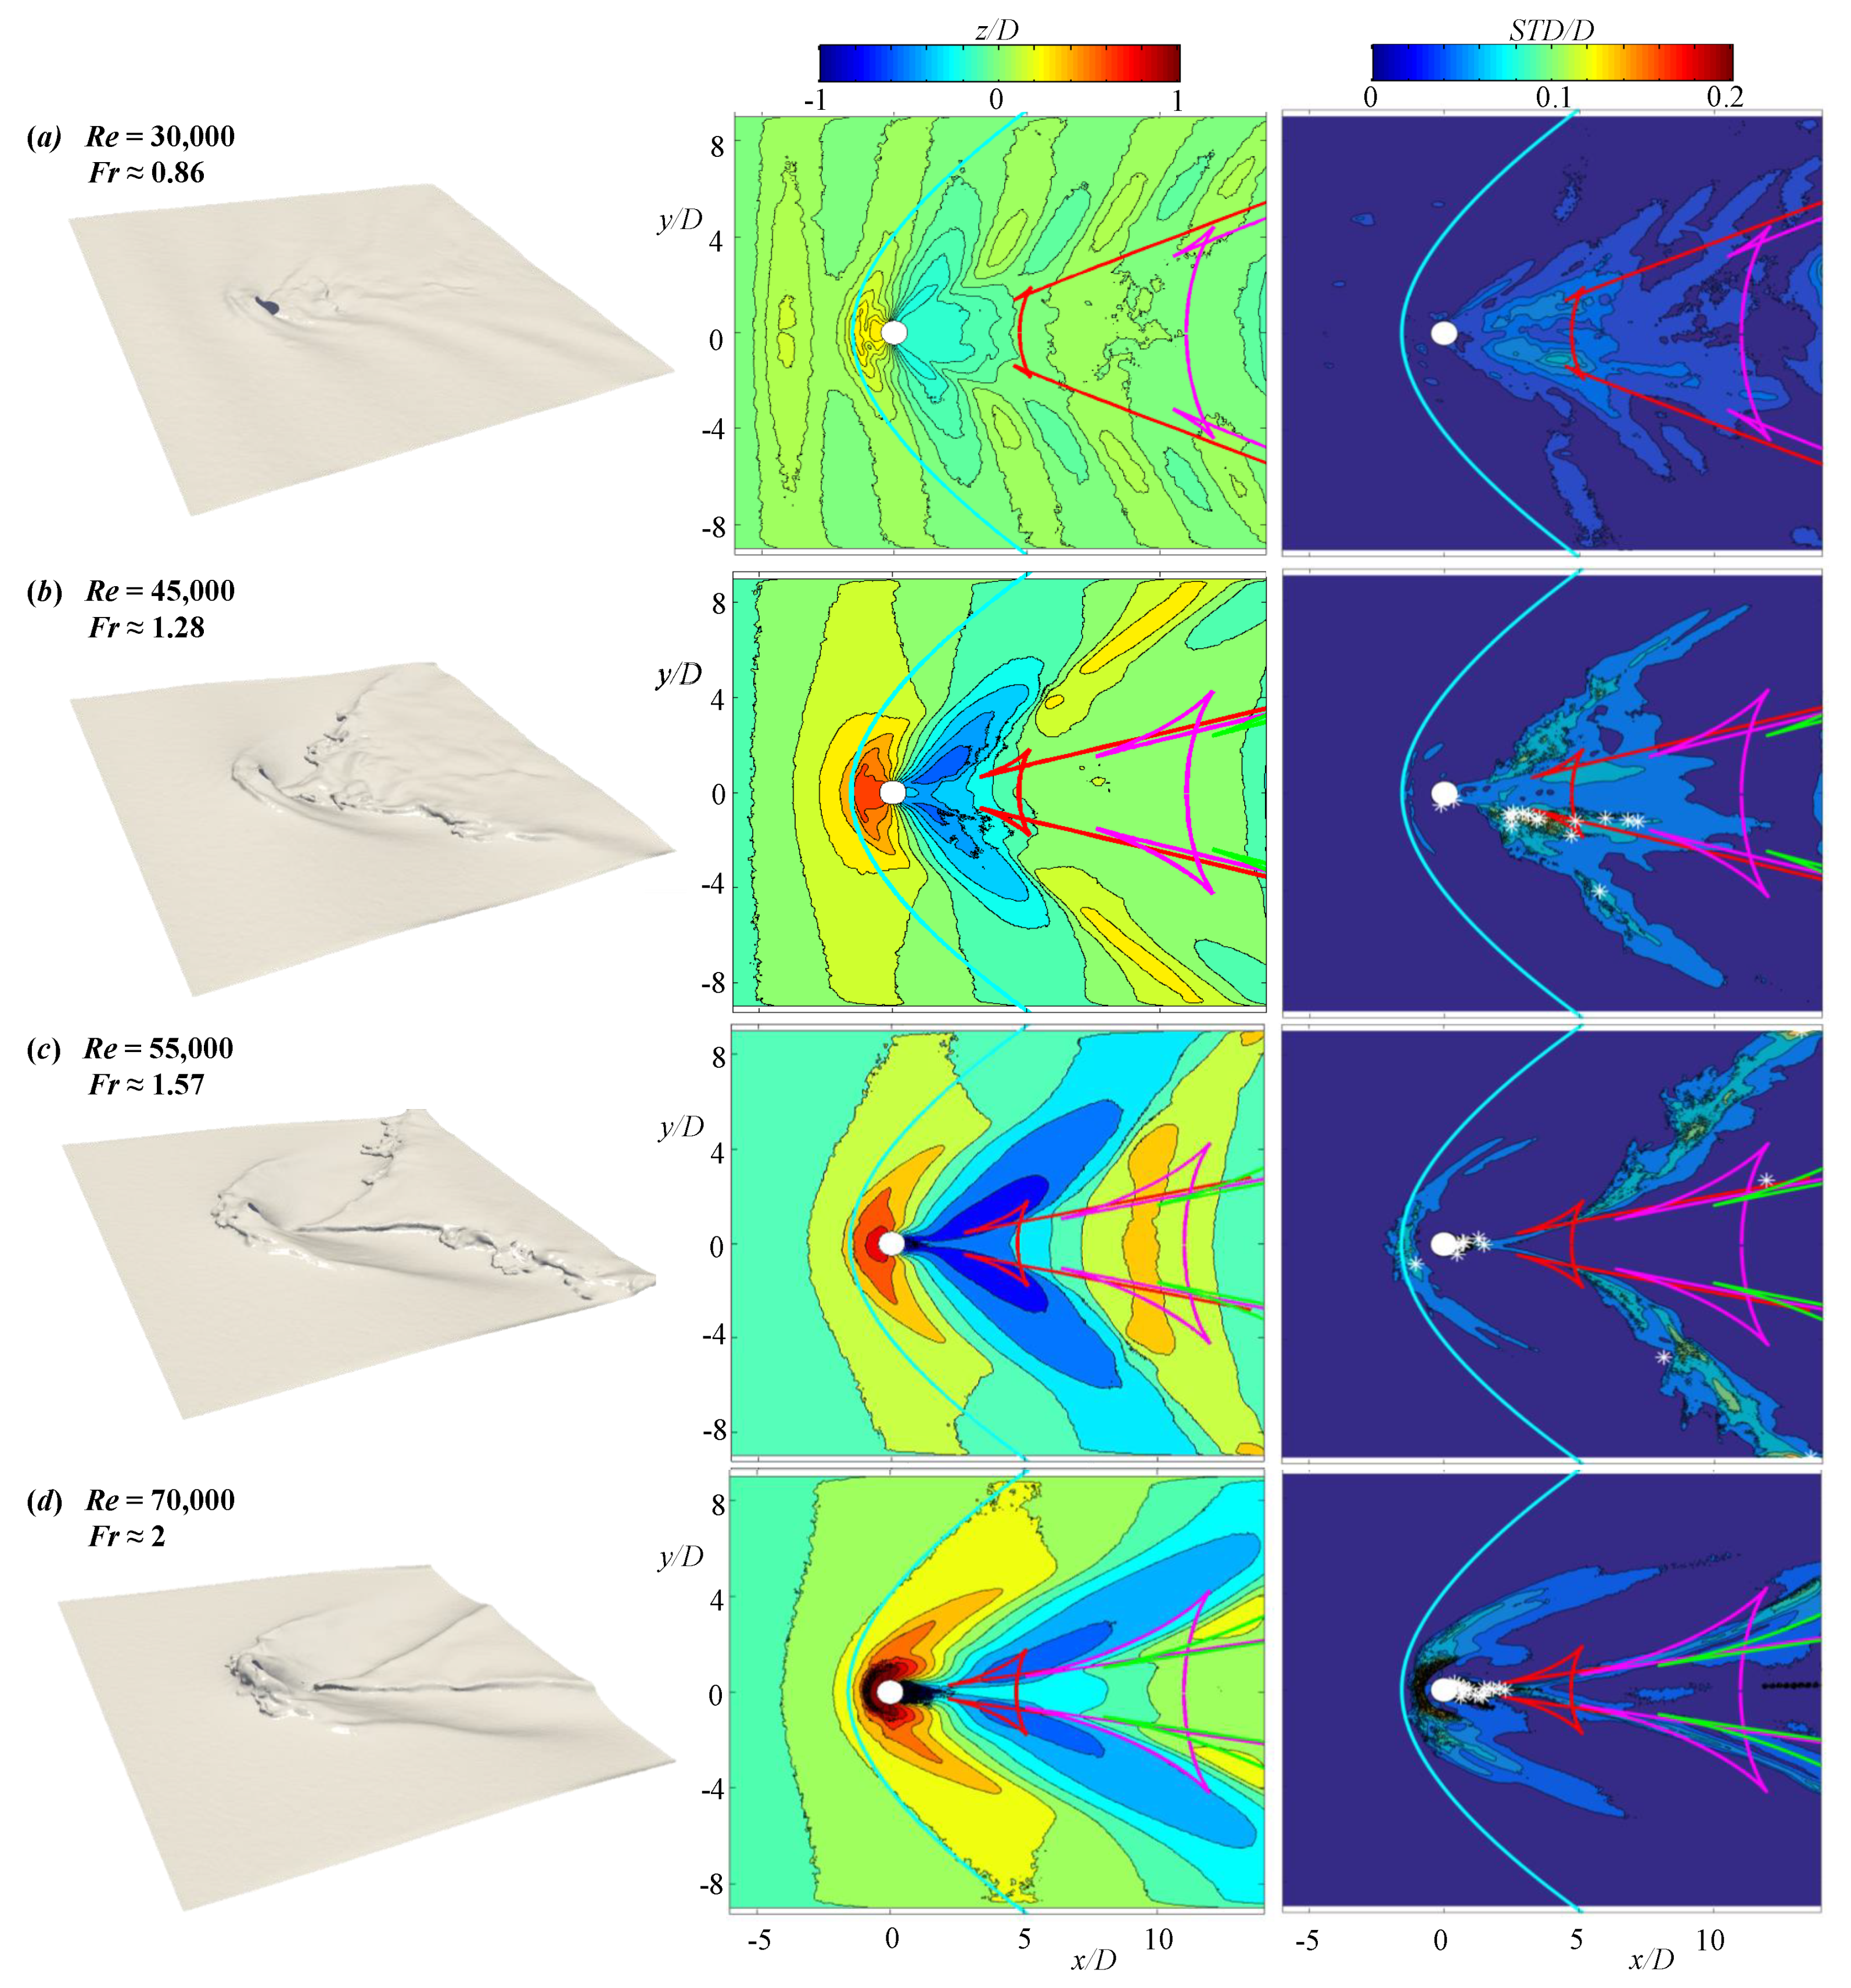
4.2. Deformation of the Free Surface

The flow behind the cylinder concentrates vorticity. In Figure 4, the instantaneous vertical vorticity component at U t / D = 60 on the free surface is represented for R e = 30,000 and 60,000, corresponding to F r = 0.86 and 1.57, respectively. The transition from sub-critical ( F r < 1 ) to super-critical ( F r > 1 ) flow clearly modifies the free-surface vorticity distribution. The sub-critical vorticity distribution (see Figure 4a) resembles the classical vortex street distribution of the flow past a cylinder, whereas the super-critical vorticity (see Figure 4b) concentrates vorticity in the neighbourhood of the cylinder. For R e = 60,000, F r = 1.72 , the vortices are concentrated in the cavity, as the flow far downstream the cylinder and below the free surface is almost laminar. Consequently, the shape of the wake changes from the Kelvin wake to a narrower V-shaped free-surface pattern [26,52].
Figure 4c,d display experimental snapshots of the view from above the free surface at corresponding values of R e and F r for comparison. The lighting is from above, so the white areas are surfaces directed normal to the horizontal (maximum or minimum elevation height areas). The analysis of the pictures from the top view allows the wake angles, α and β , to be estimated as a function of the velocity U. The wake half-angle α is defined as the radiated wake angle corresponding to the maximum wave amplitude [26]. The half-angle β is defined as the angle made by the cusp attached to the cylinder. An example for the determination of the half-angles α and β are sketched on the photographs in Figure 4c,d.
The free-surface elevations, presented in Figure 5, describe the bow wave, the cavity region downstream of the cylinder and the Kelvin waves [11,18,25]. The oblique views presented in the first column of Figure 5 show the emergence and decrease of the cusp wake half-angle β . The instantaneous free-surface and the time-averaged elevation height highlight the Kelvin wake’s stationary patterns generated by the flow around the cylinder. For instance, at R e = 30,000 and F r = 0.86 , the radiation angle is above that which is predicted by Kelvin [4]. The time-averaged elevation heights (second column of Figure 5) were computed for 42 < U t / D < 60 . As F r increases, the bow wave height increases, and the cavity behind the cylinder gets deeper. For the highest F r (Figure 5b–d), the radiation angle seems to evolve as 1 / F r , which is consistent with the experiments of Moisy and Rabaud [26], although the present computation domain only contains several wavelengths.
The crest lines are defined from the capillary-gravity waves theory [24,26,53]. They are compared with the time-averaged free surfaces and the associated relative standard deviations ( S T D / D ) obtained from the numerical simulations. Three crest lines, represented by lines of different colours on Figure 5, have been plotted following the equations of Binnie [53] and considering radiated wavelengths of order 2 π D . This far-field theory provides the wake pattern as determined by the parameter U / c m i n , where c m i n = 4 g σ / ρ 1 / 4 = 23 cm/s is the minimum phase velocity of the capillary-gravity waves. For the finite ratio U / c m i n > 1.938 , the evolution of the radiation angle with the wavenumber presents two local extrema, leading to the formation of two cusps in the crest lines where energy concentrates [26]. When increasing R e and F r , the lower extrema of the cusp angle greatly decreases, leading to a narrower V-shaped pattern towards the cylinder wall (see Figure 5d).
The cusps are correlated with strong unsteady fluctuations, as seen in the last column of Figure 5. For F r = 0.86 and F r = 1.28 , the locations of free-surface strong fluctuations coincide with the cusps of the first crest line downstream of the cylinder. For increasing F r , stronger fluctuations occur in the cavity behind the cylinder where the crest lines approach the cylinder. Other fluctuations occur further in the wake and are not far from the cusp of the second and third crest line. These unsteady fluctuations correspond to wave-breaking phenomena at the edge of the V-shaped pattern and seem to be related with air entrainment phenomena. Indeed, instantaneous bubble locations at U t / D = 60 are represented as white stars on Figure 5. Although those locations correspond to newly formed bubbles and advected bubbles which where previously formed, they coincide reasonably well with strong unsteady fluctuations in the wake (last column on Figure 5b), then in the cavity behind the cylinder as F r increases (Figure 5c,d).
Indeed, air entrainment observed in the wake is due to wave breaking located downstream of the stationary V-shaped pattern from R e = 45,000 or F r = 1.28 , whereas air entrainment in the unsteady cavity occurs upstream of the V-shaped pattern close to the cylinder wall. There is a relation between the modification of the flow dynamics below the free surface and the characteristic V-shaped pattern observed for increasing R e and F r . The V-shaped pattern coincides with vortex shedding inhibition observed on the free surface (Figure 4) and in the sub-surface flow (plane z / D = 1 on Figure 2 and Figure 3c,d).

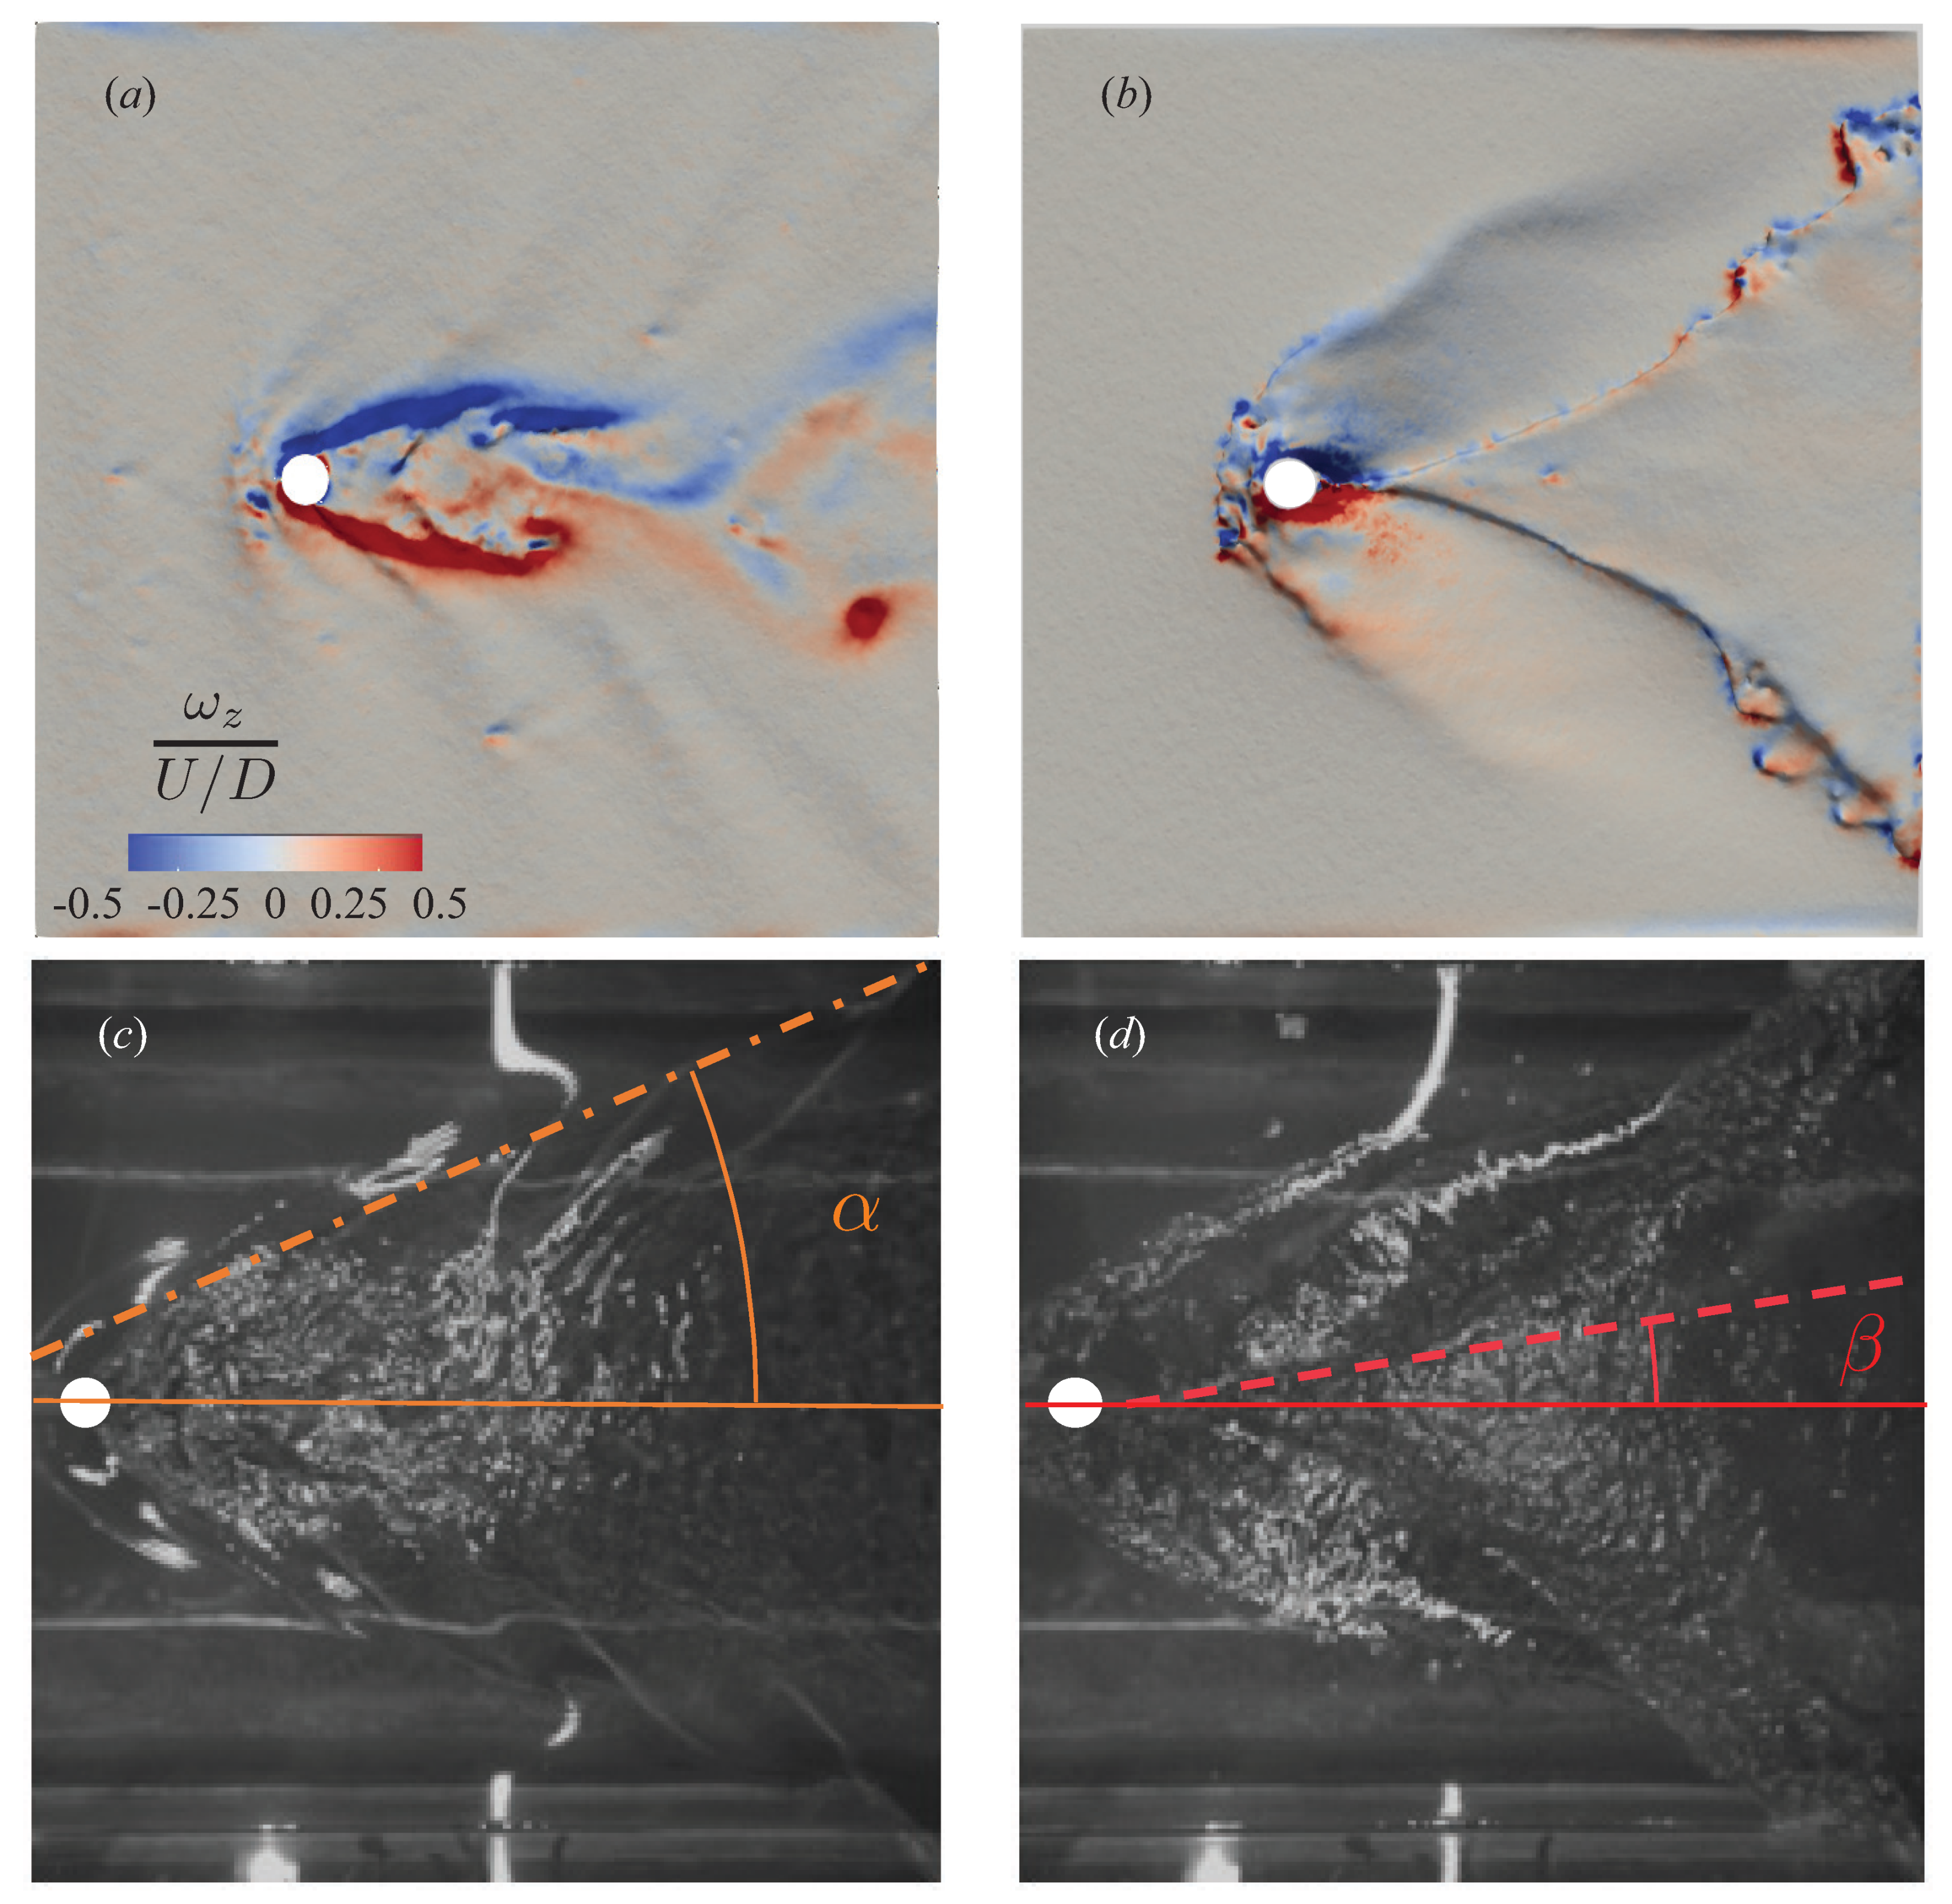
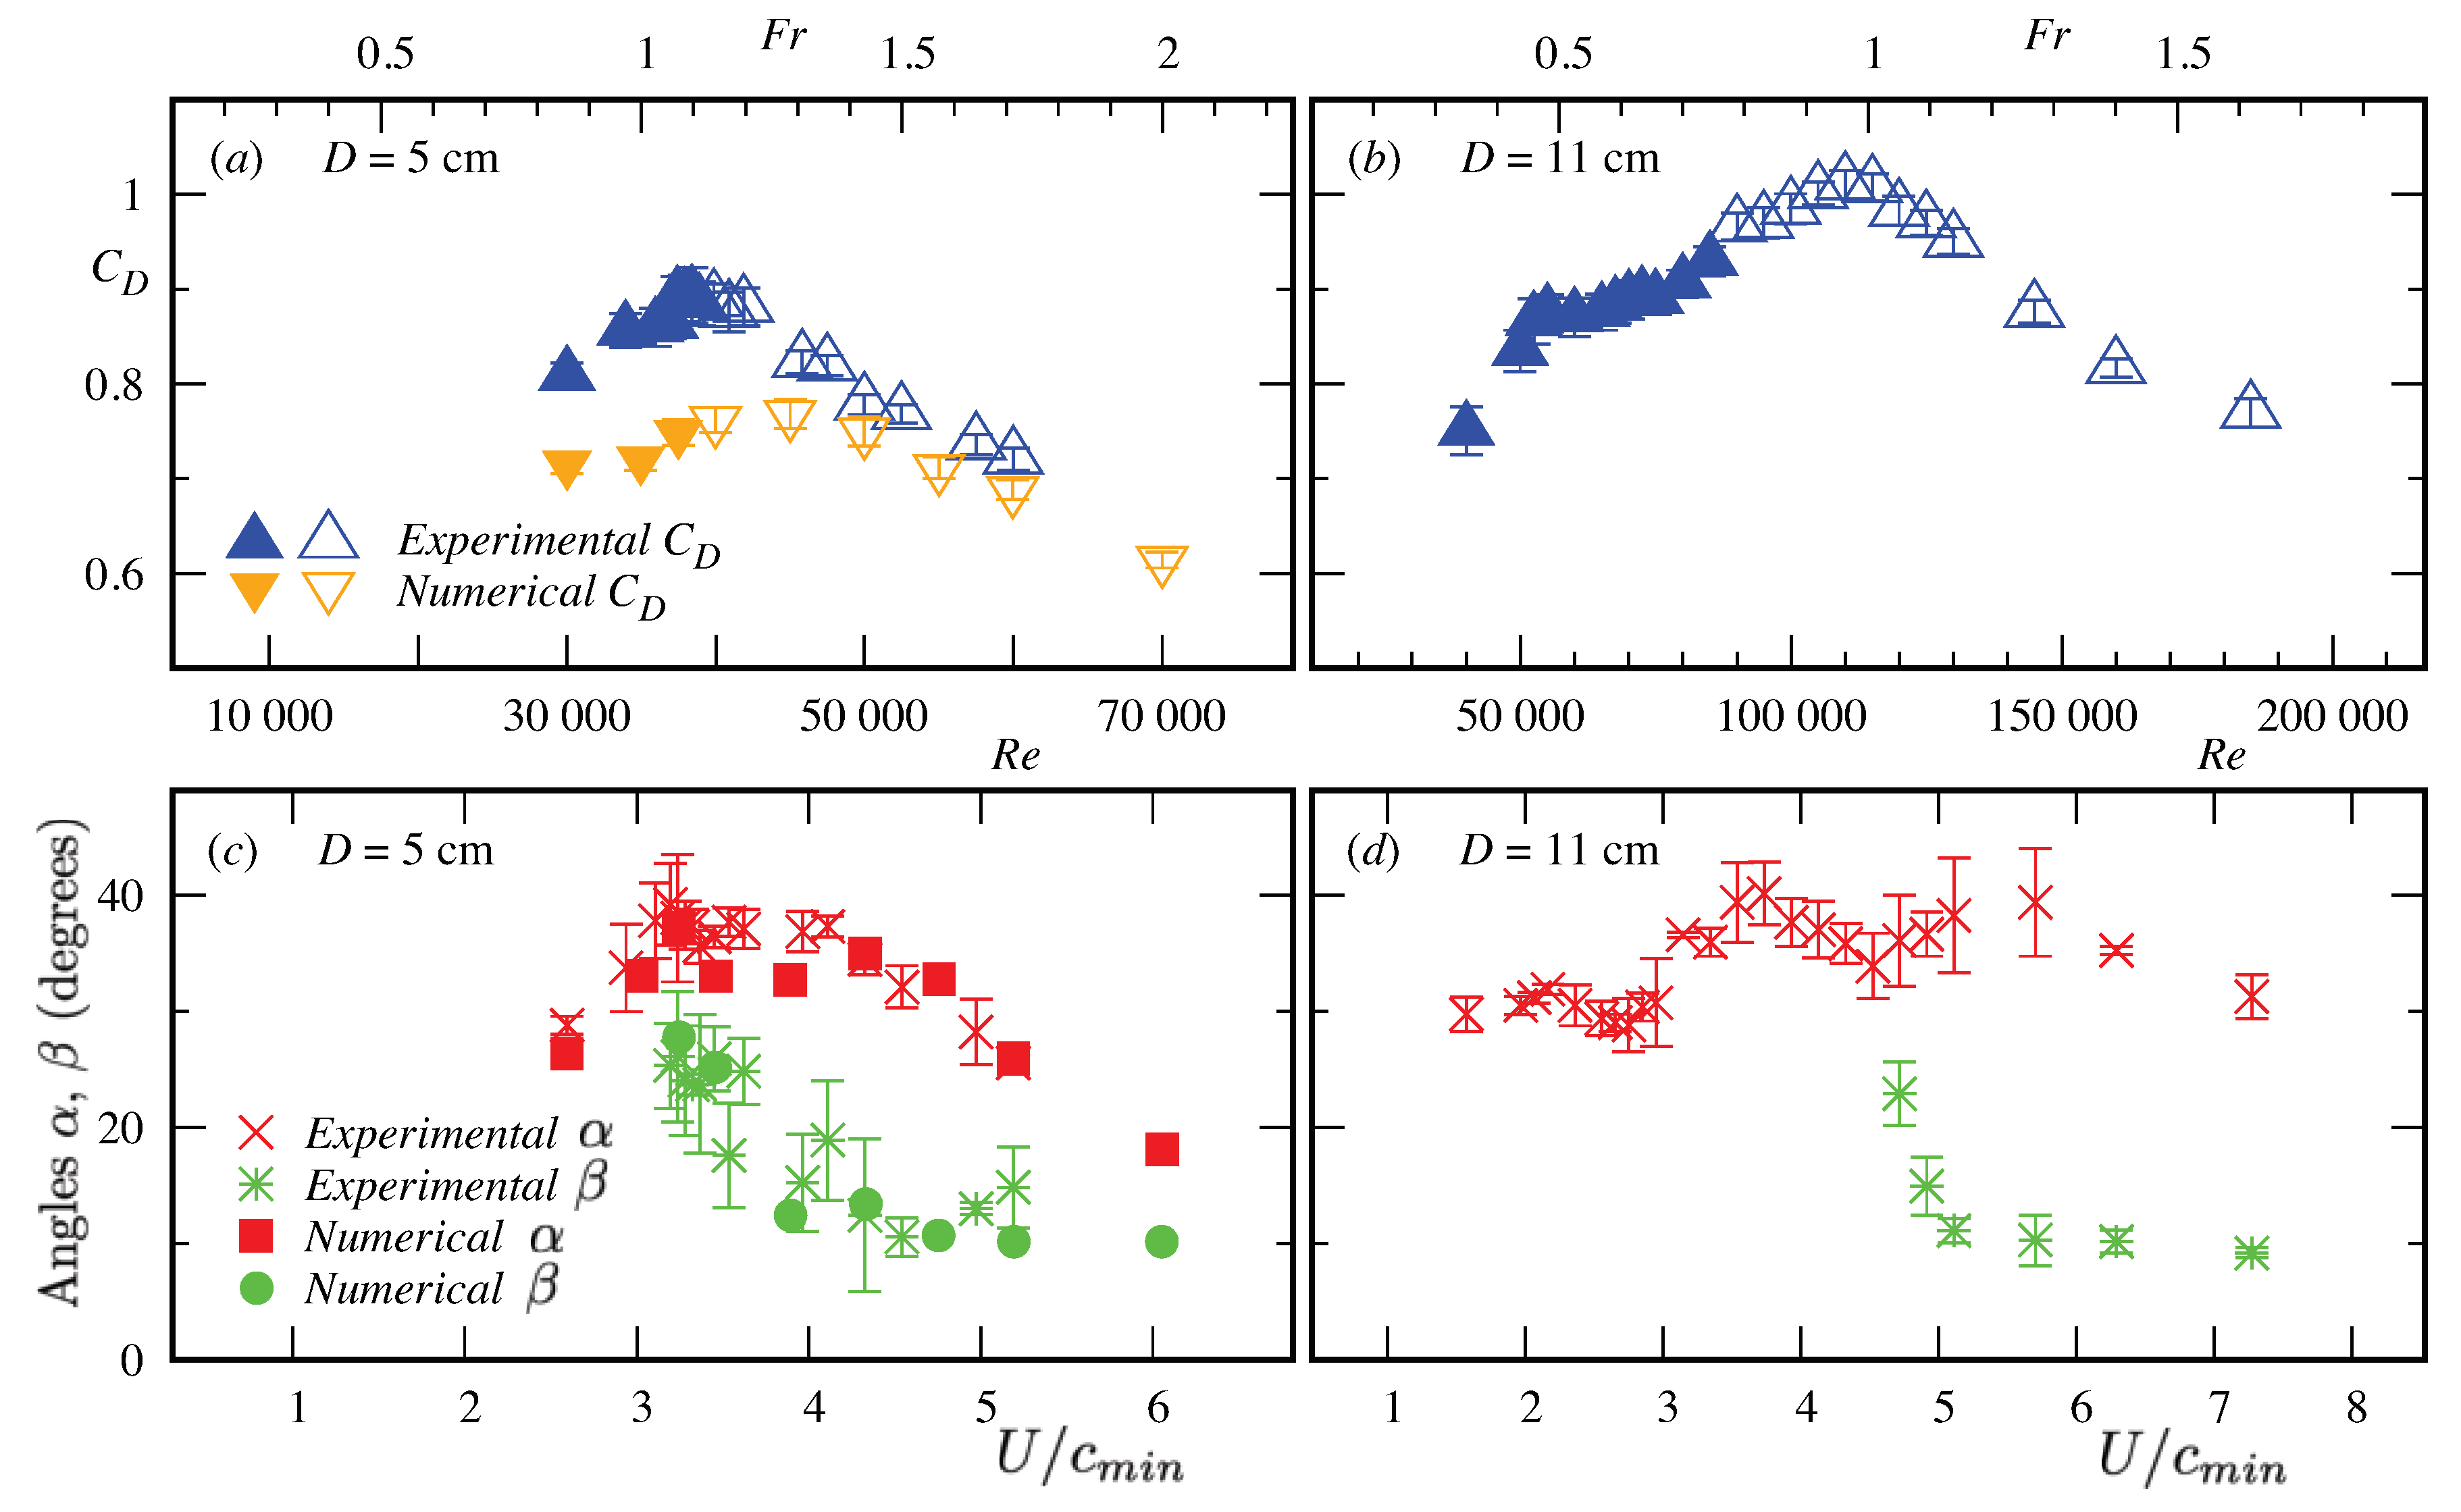
4.3. Drag and Wake Angles

The vortex inhibition described above should be translated into global drag. Now, Figure 6a,b, presents the values of C D for D = 5 cm and 11 cm as a function of F r and R e . C D is first found to slightly increase; then, it passes through a maximum corresponding roughly to the onset of air entrainment. The error bars in Figure 6a represent the standard deviation in the simulation run for 42 < U t / D < 60 . Note that the numerical simulations reproduce the experimental air entrainment found in experiments [13]. At the onset of air entrainment, represented by the transition from filled symbols to empty symbols, the appearance of small bubbles is insufficient to modify the pressure and the drag around the cylinder. Then, after a plateau, the evolution of C D seems to decrease with R e or F r at the same rate, suggesting a linear dependence, which is in agreement with two-phase flow simulations [54]. The numerical results slightly underestimate C D , but reproduce quantitatively the onset of air entrainment and C D at high F r or R e . A similar evolution of the drag coefficient is observed for D = 11 cm. However, the maximum of C D occurs at a much larger Reynolds number than the onset of air entrainment, suggesting that the entrapped air is not the only cause of C D ’s decrease. As the F r increases, the free-surface evolution modifies the pressure distribution around the cylinder and, thus, modifies the drag coefficient.
Concerning the angles’ evolution, for U / c m i n > 1 , where c m i n = ( 4 g σ / ρ ) 1 / 4 = 23 cm/s is the minimum phase velocity of the capillary-gravity waves, α remains constant and decreases for large U / c m i n for D = 5 cm (see Figure 6c. For D = 11 cm, the wake half-angle α remains constant at small U / c m i n ; then, it oscillates at higher values (see Figure 6d). Such high values may be explained by blockage effects, the multiple reflection from the walls and the limited visualization area away from the cylinder. Both simulations and experiments indicate that the wake half-angle α reduces with an increase in velocity. Note that the simulation results predict quantitatively the half-angles α and β for D = 5 cm. The role of free-surface deformation on global forces is highlighted by the appearance of the β angle at the maximum value of the drag coefficient for both diameters.

5. Conclusions

In this article, we presented experimental and numerical results of three-dimensional simulations on the drag, the wake angles, the pressure fields, the vorticity fields and the free-surface elevation of a vertical finite height rigid cylinder in turbulent free-surface flow. The experiments were conducted on cylinders of D = 5 and 11 cm. The simulations were performed for D = 5 cm in the range of parameters 30,000 < R e < 70,000 or 0.86 < F r < 2 , which coincides with the occurrence of the V-shaped pattern on the free surface and the onset of air entrainment. The numerical and experimental results are in good agreement. They quantify and illustrate the intricate relation between the viscous, inertial, gravity and capillary effects.
Concerning the drag, C D first increases, then decreases, with R e and F r . Interestingly, this decline of C D coincides with the occurrence of cusps attached to the cylinder associated with vortex shedding inhibition in a layer region below the free surface. The simulations predict quantitatively the onset of air entrainment [13]. The free-surface elevation simulations are compared to the V-shaped patterns predicted by the capillary-gravity waves theory [26]. The crest lines from the theory indicate the presence of cusps, where energy is concentrated, which seems to correspond to unsteady free-surface elevation fluctuations and air entrainment location in the simulations. In the wake, air entrainment is due to wave breaking, while behind the cylinder, air entrainment is caused by the unsteady cavity. From R e = 50,000 or F r = 1.43 , the emergence of a stationary free-surface V-shaped pattern pushes unsteady wave-breaking areas far away from the cylinder. These results are the basis of more realistic situations taking into account wind and surface waves.

Author Contributions

Conceptualization, J.P. and G.P.; methodology, V.A., J.P., G.P.; software, V.A., G.L. and V.M.; validation, V.A.; formal analysis, V.A., J.P. and G.P.; investigation, V.A.; resources, V.A. and G.P.; data curation, V.A., J.P. and G.P.; writing—original draft preparation, V.A., J.P., G.P. and G.L.; writing—review and editing, V.A., J.P., G.P., G.L. and V.M.; visualization, V.A., J.P. and G.P.; supervision, J.P., G.P., G.L. and V.M.; project administration, V.A., J.P., G.P. and V.M.; funding acquisition, J.P., G.P. and V.M. All authors have read and agreed to the published version of the manuscript.

Funding

The authors acknowledge the financial support of the Normandy Region and the European Union ERDF funding’s through the NEPTUNE project. Our work has also benefited from the financial support of the Agence Nationale de la Recherche (ANR) through the programme ‘Investissement d’Avenir’ from the laboratoire d’excellence Energy Materials and Clean Combustion Center (LabEx EMC3).

Acknowledgments

The authors would like to acknowledge the CRIANN (Centre Régional Informatique et d’Applications Numériques de Normandie) for providing the HPC resources that contributed to the research results reported in this paper.

Conflicts of Interest

The authors declare no conflict of interest.

References

  1. Schewe, G. On the force fluctuations acting on a circular cylinder in crossflow from subcritical up to transcritical Reynolds numbers. J. Fluid Mech. 1983, 133, 265–285. [Google Scholar] [CrossRef]
  2. Braza, M.; Perrin, R.; Hoarau, Y. Turbulence properties in the cylinder wake at high Reynolds numbers. J. Fluids Struct. 2006, 22, 757–771. [Google Scholar] [CrossRef] [Green Version]
  3. Rodríguez, I.; Lehmkuhl, O.; Chiva, J.; Borrell, R.; Oliva, A. On the flow past a circular cylinder from critical to super-critical Reynolds numbers: Wake topology and vortex shedding. Int. J. Heat Fluid Flow 2015, 55, 91–103. [Google Scholar] [CrossRef] [Green Version]
  4. Thompson, W. On ship waves. Proc. Inst. Mech. Engrs 1887, 38, 409–434. [Google Scholar] [CrossRef]
  5. Satheesh, S.; Huera-Huarte, F.J. Effect of free surface on a flat plate translating normal to the flow. Ocean Eng. 2019, 171, 458–468. [Google Scholar] [CrossRef]
  6. Díaz-Ojeda, H.R.; Huera-Huarte, F.J.; González-Gutiérrez, L.M. Hydrodynamics of a rigid stationary flat plate in cross-flow near the free surface. Phys. Fluids 2019, 31, 102108. [Google Scholar] [CrossRef]
  7. Benham, G.P.; Boucher, J.P.; Labbé, R.; Benzaquen, M.; Clanet, C. Wake drag on asymmetric bodies. J. Fluid Mech. 2019, 878, 147–168. [Google Scholar] [CrossRef] [Green Version]
  8. Harwood, C.; Young, Y.; Ceccio, S.L. Ventilated cavities on a surface-piercing hydrofoil at moderate Froude numbers: Cavity formation, elimination and stability. J. Fluid Mech. 2016, 800, 5–56. [Google Scholar] [CrossRef]
  9. Hay, A. Flow about Semi-Submerged Cylinders of Finite Length; Technical Report; Princeton University: Princeton, NJ, USA, 1947. [Google Scholar]
  10. Chaplin, J.R.; Teigen, P. Steady flow past a vertical surface-piercing circular cylinder. J. Fluids Struct. 2003, 18, 271–285. [Google Scholar] [CrossRef]
  11. Keough, S.J.; Kermonde, I.L.; Amiet, A.; Philip, J.; Ooi, A.; Monty, J.P.; Anderson, B. Time resolved measurements of wake characteristics from vertical surface-piercing circular cylinders. In Proceedings of the 20th Australian Fluid Mechanics Conference, Perth, Australia, 5–8 December 2016. [Google Scholar]
  12. Gonçalves, R.T.; Franzini, G.R.; Rosetti, G.F.; Meneghini, J.R.; Fujarra, A.L.C. Flow around circular cylinders with very low aspect ratio. J. Fluids Struct. 2015, 54, 122–141. [Google Scholar] [CrossRef]
  13. Ageorges, V.; Peixinho, J.; Perret, G. Flow and air-entrainment around partially submerged vertical cylinders. Phys. Rev. Fluids 2019, 4, 064801. [Google Scholar] [CrossRef] [Green Version]
  14. Inoue, M.; Baba, N.; Himeno, Y. Experimental and numerical study of viscous flow field around an advancing vertical circular cylinder piercing a free-surface. J. Kansai Soc. Naval Arch. 1993, 220, 57–64. [Google Scholar]
  15. Kawamura, T.; Mayer, S.; Garapon, A.; Sørensen, L. Large eddy simulation of a flow past a free surface piercing circular cylinder. J. Fluids Eng. 2002, 124, 91–101. [Google Scholar] [CrossRef]
  16. Yu, G.; Avital, E.J.; Williams, J.J. Large eddy simulation of flow past free surface piercing circular cylinders. J. Fluids Eng. 2008, 130, 101304. [Google Scholar] [CrossRef]
  17. Suh, J.; Yang, J.; Stern, F. The effect of air–water interface on the vortex shedding from a vertical circular cylinder. J. Fluids Struct. 2011, 27, 1–22. [Google Scholar] [CrossRef]
  18. Koo, B.; Yang, J.; Yeon, S.M.; Stern, F. Reynolds and Froude number effect on the flow past an interface-piercing circular cylinder. Int. J. Nav. Archit. Ocean Eng. 2014, 6, 529–561. [Google Scholar] [CrossRef] [Green Version]
  19. Benitz, M.A.; Carlson, D.W.; Seyed-Aghazadeh, B.; Modarres-Sadeghi, Y.; Lackner, M.A.; Schmidt, D.P. CFD simulations and experimental measurements of flow past free-surface piercing, finite length cylinders with varying aspect ratios. Comp. Fluids 2016, 136, 247–259. [Google Scholar] [CrossRef] [Green Version]
  20. Rosetti, G.F.; Vaz, G.; Hoekstra, M.; Gonçalves, R.T.; Fujarra, A.L.C. CFD calculations for free-surface-piercing low aspect ratio circular cylinder with solution verification and comparison with experiments. In Proceedings of the ASME 32nd International Conference on Ocean, Offshore and Arctic Engineering, Nantes, France, 9–14 June 2013; Volume 7: CFD and VIV. [Google Scholar]
  21. Reichl, P.; Hourigan, K.; Thompson, M.C. Flow past a cylinder close to a free surface. J. Fluid Mech. 2005, 533, 269–296. [Google Scholar] [CrossRef] [Green Version]
  22. Bouscasse, B.; Colagrossi, A.; Marrone, S.; Souto-Iglesias, A. SPH modelling of viscous flow past a circular cylinder interacting with a free surface. Comp. Fluids 2017, 16, 190–212. [Google Scholar] [CrossRef]
  23. González-Gutierrez, L.M.; Gimenez, J.M.; Ferrer, E. Instability onset for submerged cylinders. Phys. Fluids 2019, 31. [Google Scholar] [CrossRef]
  24. Lamb, H. Hydrodynamics; Cambridge University Press: Cambridge, UK, 1932. [Google Scholar]
  25. Rabaud, M.; Moisy, F. Ship wakes: Kelvin or Mach angle? Phys. Rev. Lett. 2013, 110, 214503. [Google Scholar] [CrossRef] [PubMed]
  26. Moisy, F.; Rabaud, M. Mach-like capillary-gravity wakes. Phys. Rev. E 2014, 90, 023009. [Google Scholar] [CrossRef] [PubMed] [Green Version]
  27. Lubin, O.; Kimmoun, O.; Véron, F.; Glockner, S. Discussion on instabilities in breaking waves: Vortices, air-entrainment and droplet generation. Eur. J. Mech./B Fluids 2019, 73, 144–156. [Google Scholar] [CrossRef]
  28. Mailybaev, A.A.; Nachbin, A. Explosive ripple instability due to incipient wave breaking. J. Fluid Mech. 2019, 863, 876–892. [Google Scholar] [CrossRef] [Green Version]
  29. Yu, X.; Hendrickson, K.; Yue, D.K.P. Scale separation and dependence of entrainment bubble-size distribution in free-surface turbulence. J. Fluid Mech. 2020, 885. [Google Scholar] [CrossRef] [Green Version]
  30. Griffith, M.D.; Leontini, J.; Thompson, M.C.; Hourigan, K. Vortex shedding and three-dimensional behaviour of flow past a cylinder confined in a channel. J. Fluids Struct. 2011, 27, 855–860. [Google Scholar] [CrossRef]
  31. Ageorges, V. Écoulement et Entraînement d’air Autour d’un Cylindre Vertical Partiellement Immergé. Ph.D. Thesis, Université Le Havre Normandie, Le Havre, France, 2019. [Google Scholar]
  32. Fujarra, A.L.C.; Pesce, C.P.; Flemming, F.; Williamson, C.H.K. Vortex-induced vibration of a flexible cantilever. J. Fluids Struct. 2001, 15, 651–658. [Google Scholar] [CrossRef]
  33. Sarpkaya, T. A critical review of the intrinsic nature of vortex-induced vibrations. J. Fluids Struct. 2004, 19, 389–447. [Google Scholar] [CrossRef]
  34. Williamson, C.H.K.; Govardhan, R. Vortex-induced vibrations. Annu. Rev. Fluid Mech. 2004, 36, 413–455. [Google Scholar] [CrossRef] [Green Version]
  35. Moureau, V.; Lartigue, G. YALES2. Available online: https://www.coria-cfd.fr/index.php/YALES2 (accessed on 2 February 2018).
  36. Moureau, V.; Domingo, P.; Vervisch, L. Design of a massively parallel CFD code for complex geometries. C. R. Mécanique 2011, 339, 141–148. [Google Scholar] [CrossRef]
  37. Moureau, V.; Domingo, P.; Vervisch, L. From large-eddy simulation to direct numerical simulation of a lean premixed swirl flame: Filtered laminar flame-PDF modeling. Combust. Flame 2011, 158, 1340–1357. [Google Scholar] [CrossRef]
  38. Chorin, A.J. Numerical solution of the Navier-Stokes equations. Math. Comput. 1968, 22, 745–762. [Google Scholar] [CrossRef]
  39. Pierce, C.D.; Moin, P. Progress-variable approach for large-eddy simulation of non-premixed turbulent combustion. J. Fluid Mech. 2004, 504, 73–97. [Google Scholar] [CrossRef]
  40. Malandain, M.; Maheu, N.; Moureau, V. Optimization of the deflated conjugate gradient algorithm for the solving of elliptic equations on massively parallel machines. J. Comp. Phys. 2013, 238, 32–47. [Google Scholar] [CrossRef]
  41. Desjardins, O.; Moureau, V.; Pitsch, H. An accurate conservative level set/ghost fluid method for simulating turbulent atomization. J. Comp. Phys. 2008, 227, 8395–8416. [Google Scholar] [CrossRef]
  42. Chiodi, R.; Desjardins, O. A reformulation of the conservative level set reinitialization equation for accurate and robust simulation of complex multiphase flows. J. Comp. Phys. 2017, 343, 186–200. [Google Scholar] [CrossRef]
  43. Fedkiw, R.P.; Aslam, T.; Merriman, B.; Osher, S. A non-oscillatory Eulerian approach to interfaces in multimaterial flows (the ghost fluid method). J. Comp. Phys. 1999, 152, 457–492. [Google Scholar] [CrossRef]
  44. Ageorges, V.; Peixinho, J.; Perret, G.; Lartigue, G.; Moureau, V. Numerical and experimental studies of the flow around a partially submerged vertical cylinder. In Proceedings of the 24ème Congrès Français de Mécanique, Brest, France, 26–29 August 2019. [Google Scholar]
  45. Luo, H.; Baum, J.; Lohner, R. An improved finite volume scheme for compressible flows on unstructured grids. In Proceedings of the 33rd Aerospace Sciences Meeting and Exhibit, Reno, NV, USA, 9–12 January 1995; pp. 1–9. [Google Scholar]
  46. Pham, C.T.; Nore, C.; Brachet, M.E. Critical speed for capillary-gravity flows in the disperse shallow water limit. Phys. Fluids 2005, 17, 062104. [Google Scholar] [CrossRef] [Green Version]
  47. Ducros, F.; Nicoud, F.; Poinsot, T. Wall-adapting local eddy-viscosity models for simulations in complex geometries. In Numerical Methods for Fluid Dynamics VI; 1998; pp. 293–299. [Google Scholar]
  48. Janodet, R.; Moureau, V.; Mercier, R.; Lartigue, G.; Benard, P.; Ménard, T.; Berlemont, A. An interface capturing procedure for simulating incompressible two-phase flows on adaptive unstructured grids. In APS Division of Fluid Dynamics Meeting Abstracts; APS: Washington, DC, USA, 2020; pp. F09. 018. [Google Scholar]
  49. Pogozelski, E.M.; Katz, J.; Huang, T.T. The flow structure around a surface piercing strut. Phys. Fluids 1997, 9, 1387–1399. [Google Scholar] [CrossRef]
  50. Palau-Salvador, G.; Stoesser, T.; Fröhlich, J.; Kappler, M.; Rodi, W. Large eddy simulations and experiments of flow around finite-height cylinders. Flow Turbul. Combust. 2010, 84, 239–275. [Google Scholar] [CrossRef]
  51. Krajnović, S. Flow around a tall finite cylinder explored by large eddy simulation. J. Fluid Mech. 2011, 676, 294–317. [Google Scholar] [CrossRef] [Green Version]
  52. Gnevyshev, V.; Badulin, S. Wave Patterns of Gravity–Capillary Waves from Moving Localized Sources. Fluids 2020, 5, 219. [Google Scholar] [CrossRef]
  53. Binnie, A.M. Solutions of the fish-line problem at intermediate velocities. Br. J. Appl. Phys. 1965, 16, 1755. [Google Scholar] [CrossRef]
  54. Sugiyama, K.; Calzavarini, E.; Lohse, D. Microbubbly drag reduction in Taylor–Couette flow in the wavy vortex regime. J. Fluid Mech. 2008, 608, 21–41. [Google Scholar] [CrossRef] [Green Version]
Figure 1. Schematic of the domain and boundary conditions for D = 5 cm. Top and side views of the numerical domain. The blue arrows indicate the inlet velocity.
Fluids 06 00367 g001
Figure 2. Instantaneous dimensionless pressure fields at U t / D = 60 for D = 5 cm. (a) R e = 30,000, F r = 0.86 ; (b) R e = 45,000, F r = 1.28 ; (c) R e = 55,000, F r = 1.57 ; and (d) R e = 70,000, F r = 2 . The white line in the horizontal planes, z / D = 1 , indicates the vertical plane. In the the vertical planes, y / D = 0 , the white line represents the horizontal plane.
Fluids 06 00367 g002
Figure 3. Instantaneous normal vorticity component at U t / D = 60 for D = 5 cm. (a) R e = 30,000, F r = 0.86 ; (b) R e = 45,000, F r = 1.28 ; (c) R e = 55,000, F r = 1.57 ; and (d) R e = 70,000, F r = 2 . The white line in the horizontal planes, z / D = 1 , indicates the vertical plane. In the vertical planes, y / D = 0 , the white line represents the horizontal plane.
Fluids 06 00367 g003
Figure 4. Instantaneous ( U t / D = 60 ) vertical dimensionless vorticity component at the free surface for D = 5 cm with (a) R e = 30,000 or F r = 0.86 and (b) R e = 60,000 or F r = 1.72 . The associated experimental visualization of the free-surface: (c) R e = 30,000 or F r = 0.86 with the dotted-dashed lines representing approximately the half-angle α and (d) R e = 60,000 or F r = 1.72 with the dashed lines sketching the approximate half-angle β .
Fluids 06 00367 g004
Figure 5. From left to right, the instantaneous isosurface of ψ = 0.5 , the time average of the elevation height and the associated relative standard deviation (STD/D). The coloured lines represent crest lines, as discussed in the text. (a) R e = 30,000, F r = 0.86 ; (b) R e = 45,000, F r = 1.28 ; (c) R e = 55,000, F r = 1.57 ; and (d) R e = 70,000, F r = 2 . White stars on the right column correspond to air bubble locations computed at U t / D = 60 .
Fluids 06 00367 g005
Figure 6. Drag coefficients, C D , and wave half-angles, α and β , as a function of R e , F r and U / c m i n for cylinders of diameter D = 5 and 11 cm. (a) C D from experiments and simulations for D = 5 cm. (b) C D for D = 11 cm. The filled symbols represent cases without air entrainment and the open symbols are for cases with air entrainment. (c,d) are the wake half-angles, α and β (defined in Figure 6c,d) for D = 5 and 11 cm, respectively.
Fluids 06 00367 g006
Publisher’s Note: MDPI stays neutral with regard to jurisdictional claims in published maps and institutional affiliations.

