1. Introduction
The need of separating different environment zones (limiting heat and mass transfer) is normally addressed using walls and doors. However, in recent decades, the technology of air curtains has emerged as being capable of providing sufficient separation without impairing the movement of people. Air curtains have been used with several objectives, such as Heating, Ventilation and Air Conditioning (HVAC) [
1,
2,
3], smoke control in passageways [
4,
5] and airborne pollutant and biological control [
6,
7,
8]. Regarding the need to avoid the contaminant spreading, several developments and applications have been reported, namely, in operating rooms [
7,
9,
10,
11,
12,
13,
14], for tobacco smoke control [
15,
16], for protection of art works in museums and of cultural heritage [
17,
18], in open refrigerated display cabinets [
19,
20,
21], in offices [
22], in personalized air curtains [
23] and in public transportation [
24]. These studies show that air curtains have the potential to reduce the pollutants transferred from one compartment to another.
The Nanoguard2ar project (European Union’s Horizon 2020 research and innovation programme under the Marie Sklodowska-Curie grant agreement N 690968) had, as its main objectives, the goal of developing, designing, testing, validating and demonstrating an innovative nanomaterial-based ‘microbial free’ engineering solution to ensure indoor air quality in buildings. The development of this engineering solution required not only an advanced nanomaterial-based oxidation process to kill bacteria in the air in a compartment, but also an air curtain to provide a separation between the spaces that were to be kept free of cross contamination. The development of the nanomaterial-based technology to clean the air was presented by Danilenko et al. [
25] and falls outside the aim of this paper.
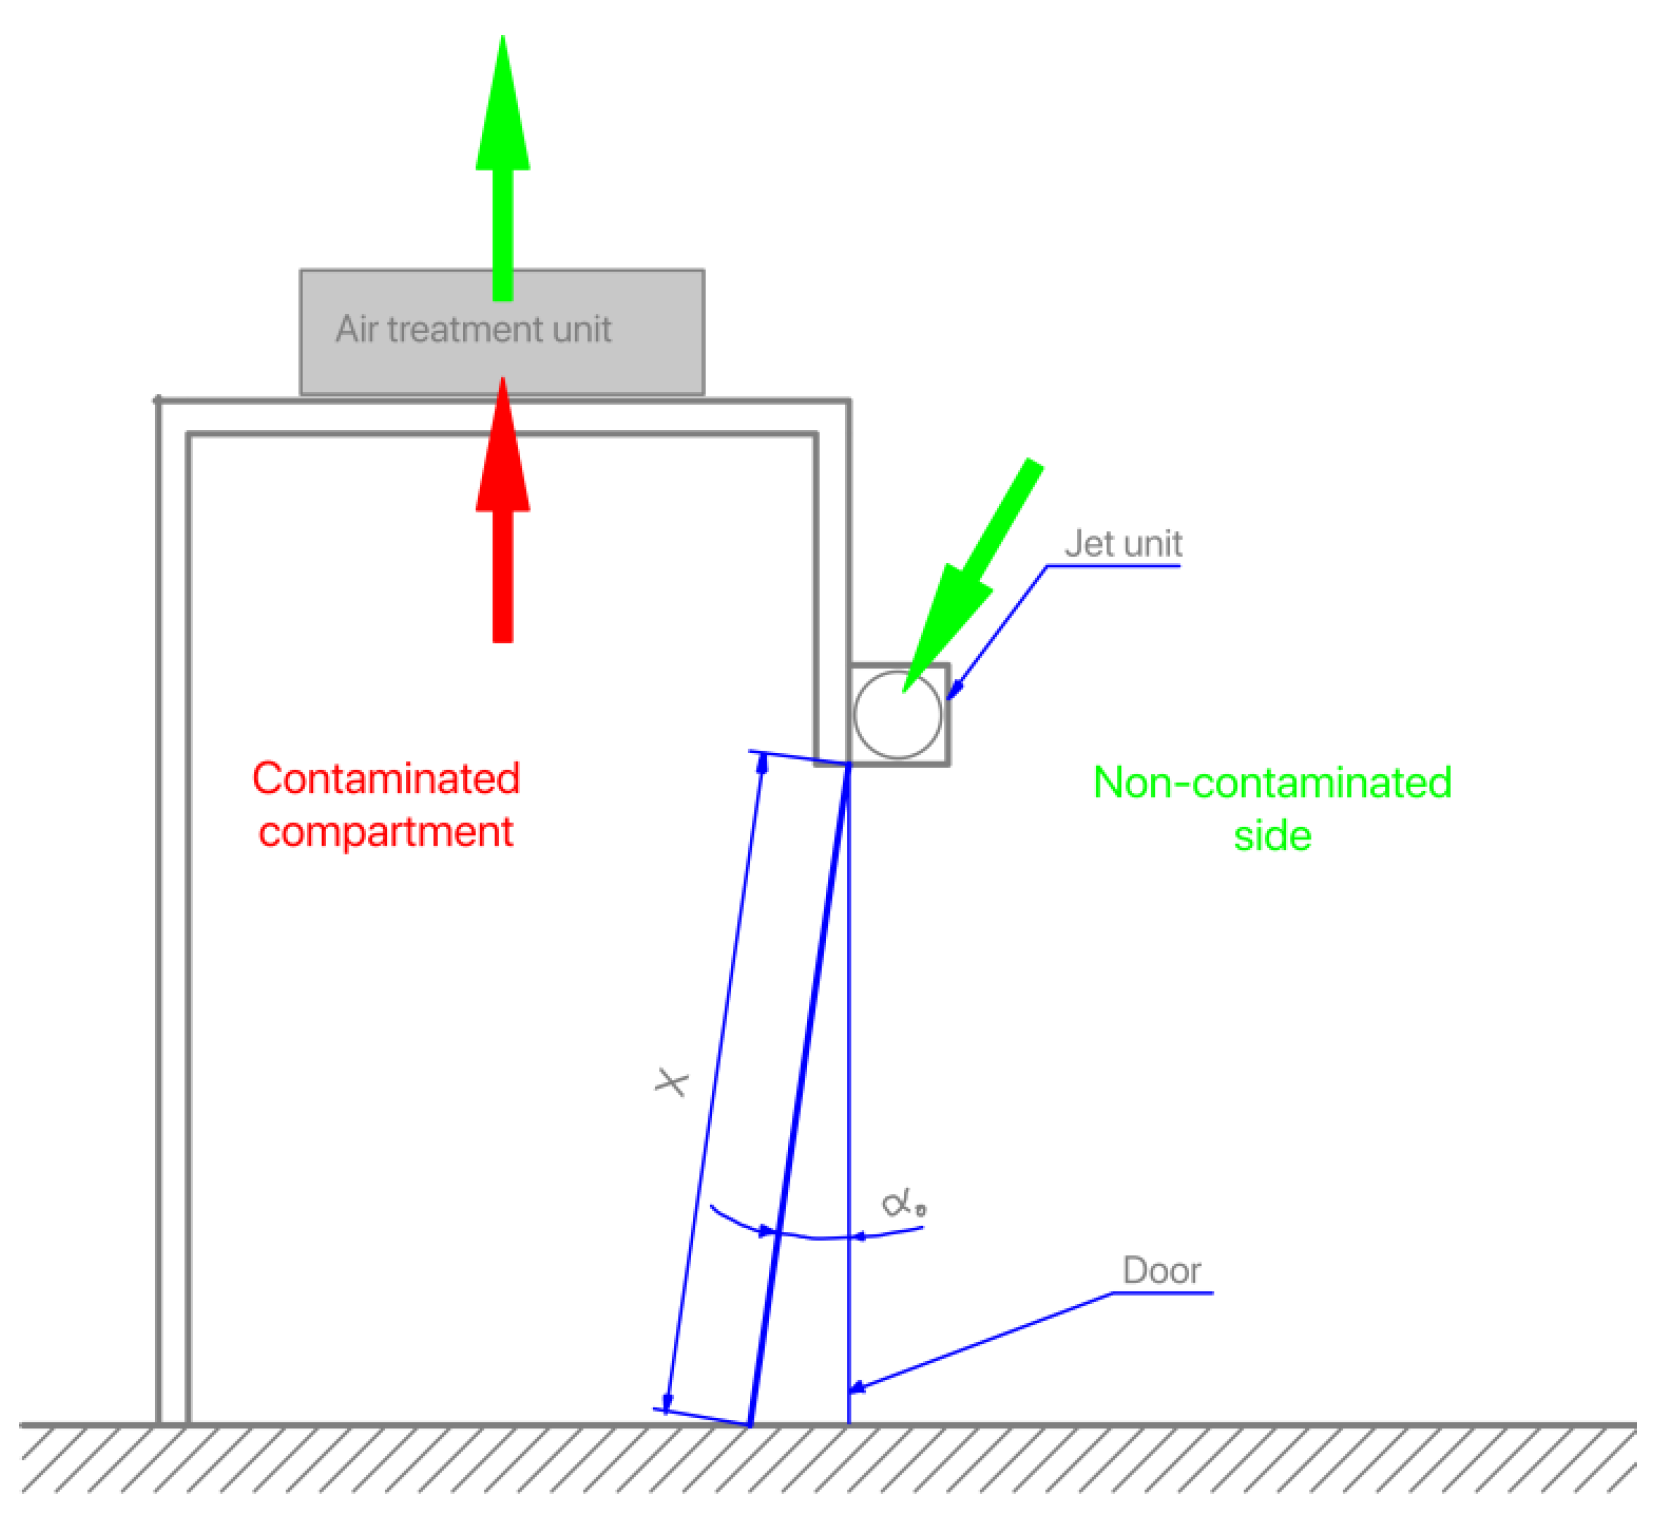
The study presented in this paper aims to contribute to the definition of the plane jet characteristics that allow one to achieve the best aerodynamic sealing of the air curtain. The plane jet entrains air from both faces and promotes its turbulent mixing. The downward jet is split into two parts, one flowing to the exterior and another into the interior of the compartment, after impinging the floor. This process promotes the mass transport of the contaminants (although diluted) from one side of the air curtain to the other. To avoid the transport of airborne pollutants (which, in general, may include microorganisms, bacteria, fungus, particles), the air is extracted from the contaminated compartment, which induces a flow crossing the air curtain. This behaviour, in specific conditions, may avoid the flow to be released from the contaminated compartment to the non-contaminated side at the jet impinging zone, as shown in
Figure 1 (see Section 2.1 of reference [
26] for a more detailed analysis). The air extracted from the contaminated compartment should be decontaminated. In the frame of this research project, a bactericide process based on a nanomaterial was used. It is expensive to carry out the treatment of the “dirty” air removed from the “contaminated” compartment before releasing it to the environment. Considering that the jet entrainment air increases with the volume flow rate at the air curtain nozzle, it is beneficial to use jet velocities that are as low as possible. A more detailed description of these aspects can be found in [
27].
For an undisturbed environment (e.g., isothermal flow), it is possible to achieve the aerodynamic sealing through the imposition of a very small uniform horizontal air stream through the opening. In practice, however, some disturbances are likely to occur (e.g., temperature differences, air drafts due to the wind, people crossing the opening), which require, in order to improve the aerodynamic sealing of the opening, the use of an air curtain. In this context, the optimal air curtain is the one that provides an acceptable aerodynamic sealing performance for airborne contaminants but requires the minimum flow rate.
To obtain the exhaust flow rate that provides aerodynamic sealing under different air curtain characteristics, a research program was established, consisting of the following phases: (i) small-scale experiments using water as the work fluid [
26]; (ii) Computational Fluid Dynamics (CFD) simulations to verify if the small-scale test results were applicable to a full-size air curtains [
28]; (iii) full-size air curtain experiments. The full-size experiments were subdivided into two sets of tests, namely: (iiia) assessment of the aerodynamic sealing for PM10 and comparison with the visual assessment [
27] and (iiib) optimisation of the aerodynamic sealing for low Reynolds number jet velocities. The typical dimension of bacteria ranged from 0.5 μm to 5 μm and, for the purpose of the assessment of the aerodynamic sealing, can be associated with the corresponding particle sizes. Therefore, in a previous study [
27], the aerodynamic sealing of the curtain for bacteria was analysed for the aerodynamic sealing of PM10 particulate. In the phase (iiia) assessment using PM10, detection was compared with the visual assessment of the aerodynamic sealing using a cold smoke source to validate the visual assessment method, and it was proved that such a method can be used to assess plane jet aerodynamic sealing. In the same study, a limited number of results, obtained at a low Reynolds number for the jet, were also presented, and it was pointed out that the presented data were insufficient to characterize the air curtain aerodynamic sealing under such conditions.
This paper describes the research carried out in phase (iiib), exploring the possibility of using a low nozzle velocity to optimize the use of plane jets for separating two different spaces. It presents a much larger set of results compared to the previous paper [
27]. This paper also reviews the previous results obtained by the authors (under both isothermal and high temperature conditions [
3,
26,
27,
28,
29]) and updates the equations to predict the air curtain sealing performance applicable for both isothermal flow and for when the air curtain is disturbed by heat sources. The contamination was made with cold smoke, and the aerodynamic sealing assessment was visual, as validated in a previous experimental work [
27].
The flow, in the air curtain applications at door height openings, is characterized by a turbulent or transition regime. When very low air curtain speeds are used, the air curtain reconstitution time is longer when people walk through the air curtain. This action can increment contaminant leakage through the air curtain. Avoiding using air curtains in a laminar regime can minimize this problem.
The aerodynamic sealing performance of vertical air curtains has been studied by Hayes and Stoecker [
30,
31,
32], who defined the deflection modulus (Dm), which is an indication of the deflection of the air curtain jet and expresses the ratio of the outlet momentum to the transverse forces on the jet [
32]. They defined [
31] the operation conditions called ‘optimum condition’, in which the air curtain jet reaches the floor, and ‘inflow breakthrough condition’, in which the air curtain flow is curved inwards and does not reach the floor [
33,
34].
A recent application of this concept was presented by Elicer-Cortés et al. [
35]. To study the ability of Double Stream–Twin Jet (DS-TJ) air curtains to confine heat, they performed simulations with imposed low jet velocities to reduce the fan’s power as much as possible, while still ensuring confinement. In the DS-TJ proposed solution, no smoke exhaust from the cell containment zone is provided, besides the smoke recirculated by the hot side aid curtain. Thus, it is not possible to avoid the release of heat from the confinement zone without air extraction due to two phenomena: (i) the heating of the air in the confinement zone causes the expansion of the air and the increase of the volume flow rate and (ii) the outside air is entrained by the air curtain and mixed in the plane jet turbulent flow; therefore, due to continuity, this outside entrained flow rate will be rejected and heat will be transferred to the outside (see [
29] for further explanation of the phenomena). Although they showed that the DS-TJ can keep a relevant temperature difference between its two sides, they were not able to confine the smoke near the floor impinging zone, “where larger transfers occurred.” This observation points towards the conclusion that it is not possible to confine the smoke into a dell without any exhaust.
The ideal condition, in our research, corresponds to the limit between the optimum condition and the inflow breakthrough condition (taking
Figure 1 as a reference), where the contamination brought to the jet with the air entrained from inside the compartment is mixed up in the jet flow and is rejected to the contaminated compartment. To reach this condition in a compartment, it is necessary to have an air exhaust.
There are several applications of this concept that are aimed at avoiding contaminant spreading. Qi et al. [
36] presented a parametric study of air curtain performance based on reduced-scale experiments and full-scale numerical simulations. They found that, when it is operated under the “optimum condition” and “inflow break-through condition”, increasing air curtain supply angle improves the air curtain performance. This aspect is due to the increment of the plane jet momentum component, which alters the momentum balance of the jet split at the floor impinging zone and causes the flow deflected to one side being higher than to the other side. Huang [
37] faced the problem of dust containment and removal in a coal mine. An air curtain was used to isolate the cutting head of the digging machine and its rear. There was an air extraction near the cutting head and an air supply in the rear zone of the machine. The author presents the effectiveness of aerodynamic sealing provided by the air curtain. Lv et al. [
38] developed an air curtain range hood and studied its beneficial effect on preventing spillage of contaminants to the kitchen. It was found that the variables affecting the performance of the air curtain range hood were the exhaust rate, the intensity of the heat source, the air curtain velocity, the interaction between the air curtain velocity and slot width, the air curtain slot width and the air curtain angle. Compared with range hoods without an air curtain, contaminant removal efficiency was enhanced with the air curtain range hood. Xiao et al. [
39] developed a transverse-flow sealing dust control system with four air curtain generators arranged in a square pattern within the region where dust was generated to create end-to-end planar transverse-flow air curtains and achieve aerodynamic sealing. The air suction inlet was located above the dust generating area. The concept of this system is physically similar to the one developed in our research, because they both consider a complementary air extraction from the dusty zone to improve the aerodynamic sealing of the air curtains. It was shown that the dust control efficiency of the soft-sealing system reached 92.6% when the air curtain outlet velocity was 6.27 m/s, the exhaust-to-pressure ratio was 0.6 and the jet angle was 15°. Moreover, they showed that, with a greater air supply and air suction rate, the airflow exhibited a more obvious entrainment effect and stronger dust exhaust and discharge and, simultaneously, the tracing smoke area had a clearer boundary. The key issue for the success of the findings reported by [
37,
38,
39] is the combination of a plane jet with an exhaust on the contaminated side.
These works show the importance of the pressure difference between the exterior and the interior of the compartment, due to the air exhaust. However, none of them presents any law (equation) to relate the aerodynamic sealing of the devices with the air curtain parameters and the air exhaust flow rate. To increase the effectiveness and to reduce air cleaning costs, it is important to reduce, as much as possible, the air curtain velocity. Therefore, the lowest values of air velocity and the corresponding Reynolds number (Re) reported in our research (Re between 175 and 13,245, but most of the test results lay below Re = 4000) are much lower when compared to the corresponding values referred to in these works. In our research, we also obtain a clear relation between the physical parameters of the air curtain (nozzle velocity and thickness) and the aerodynamic sealing. Therefore, to the best of our knowledge, our study constitutes an added value to the research in the field.
The research questions are:
- (a)
Is the full-size air curtain able to create an effective aerodynamic sealing of the enclosure for airborne contaminants?
- (b)
What is the lowest acceptable nozzle velocity to achieve a practical aerodynamic sealing?
The aerodynamic sealing of an air curtain combined with air extraction (from the contaminated compartment) was previously studied for smoke control in case of fire in the framework of a Portuguese national research project [
4,
29]; the physical laws that allow the containment of the hot smoke inside the contaminated compartment were developed and the efficacy of the system was shown. In the Nanoguard2ar project, the focus was on the quasi-isothermal aerodynamic sealing for bacteria, which, for the purpose of this study, are considered as particles. Therefore, it was necessary to develop the research on the isothermal case, which is considered a limit condition (in opposition to the work presented in [
4,
29], which was carried out at high temperature). Previous work, carried out in the framework of the Nanoguard2ar project, showed that sealing can be achieved in a small-scale test rig [
26] and developed the corresponding physical laws. It was also shown, by Computational Fluid Dynamics (CFD), that aerodynamic sealing can be expected for full-size applications [
28] and it established the equations to predict the air curtain sealing performance applicable, both for isothermal flow and when the air curtain is disturbed by heat sources. This paper reviews and updates these equations in light of the full set of experimental results.
Considering that the typical dimension of bacteria ranges from 0.5 μm to 5 μm, which can be assimilated to the corresponding sized particles, the work previously presented [
27] considered that the aerodynamic sealing of the curtain for bacteria could be analysed as the aerodynamic sealing of PM10 and PM2.5 particulate. It was shown, considering the ratio between the outside and inside concentration of PM10 and PM2.5 for different air curtain working parameters (jet nozzle angle and velocity), that the air curtain presents a relevant aerodynamic sealing for PM10 and PM2.5. It was also shown that the minimum air exhaust rate from the compartment to achieve aerodynamic sealing is similar when the assessment is carried out using the ratio between the outside and inside concentration of PM10 and PM2.5 or when using a visual assessment. Therefore, in this work, we adopt a visual assessment of the aerodynamic sealing, having in mind, the problem of bacteria retention inside the compartment.
The objectives of the work of this research are:
To demonstrate that the full-size air curtain can provide an efficient aerodynamic sealing at a low Reynolds number jet flow.
To obtain a general physical law that relates the jet parameters (angle, nozzle thickness and jet velocity at the nozzle) with the exhaust flow rate (for the condition of acceptable contaminant tightness).
The approach described hereafter was followed:
It was considered that the physics in the case of the “contaminated” compartment, presented in
Figure 1, is relevant for analysis of the performance of the air curtain device.
The results from previous research for the non-isothermal case [
4,
29] and for the isothermal case [
26,
27,
28] are considered.
Visual assessment was used to evaluate the sealing performance of the air curtain device considering different working parameters (jet nozzle angle, thickness and velocity), having in mind the assessment of aerodynamic sealing for bacteria.
2. Methods
The same test rig and the same procedures of the tests reported in [
27] were used; therefore, this section of the methods is similarly described. The measurement uncertainty analysis for this test rig has already been presented in [
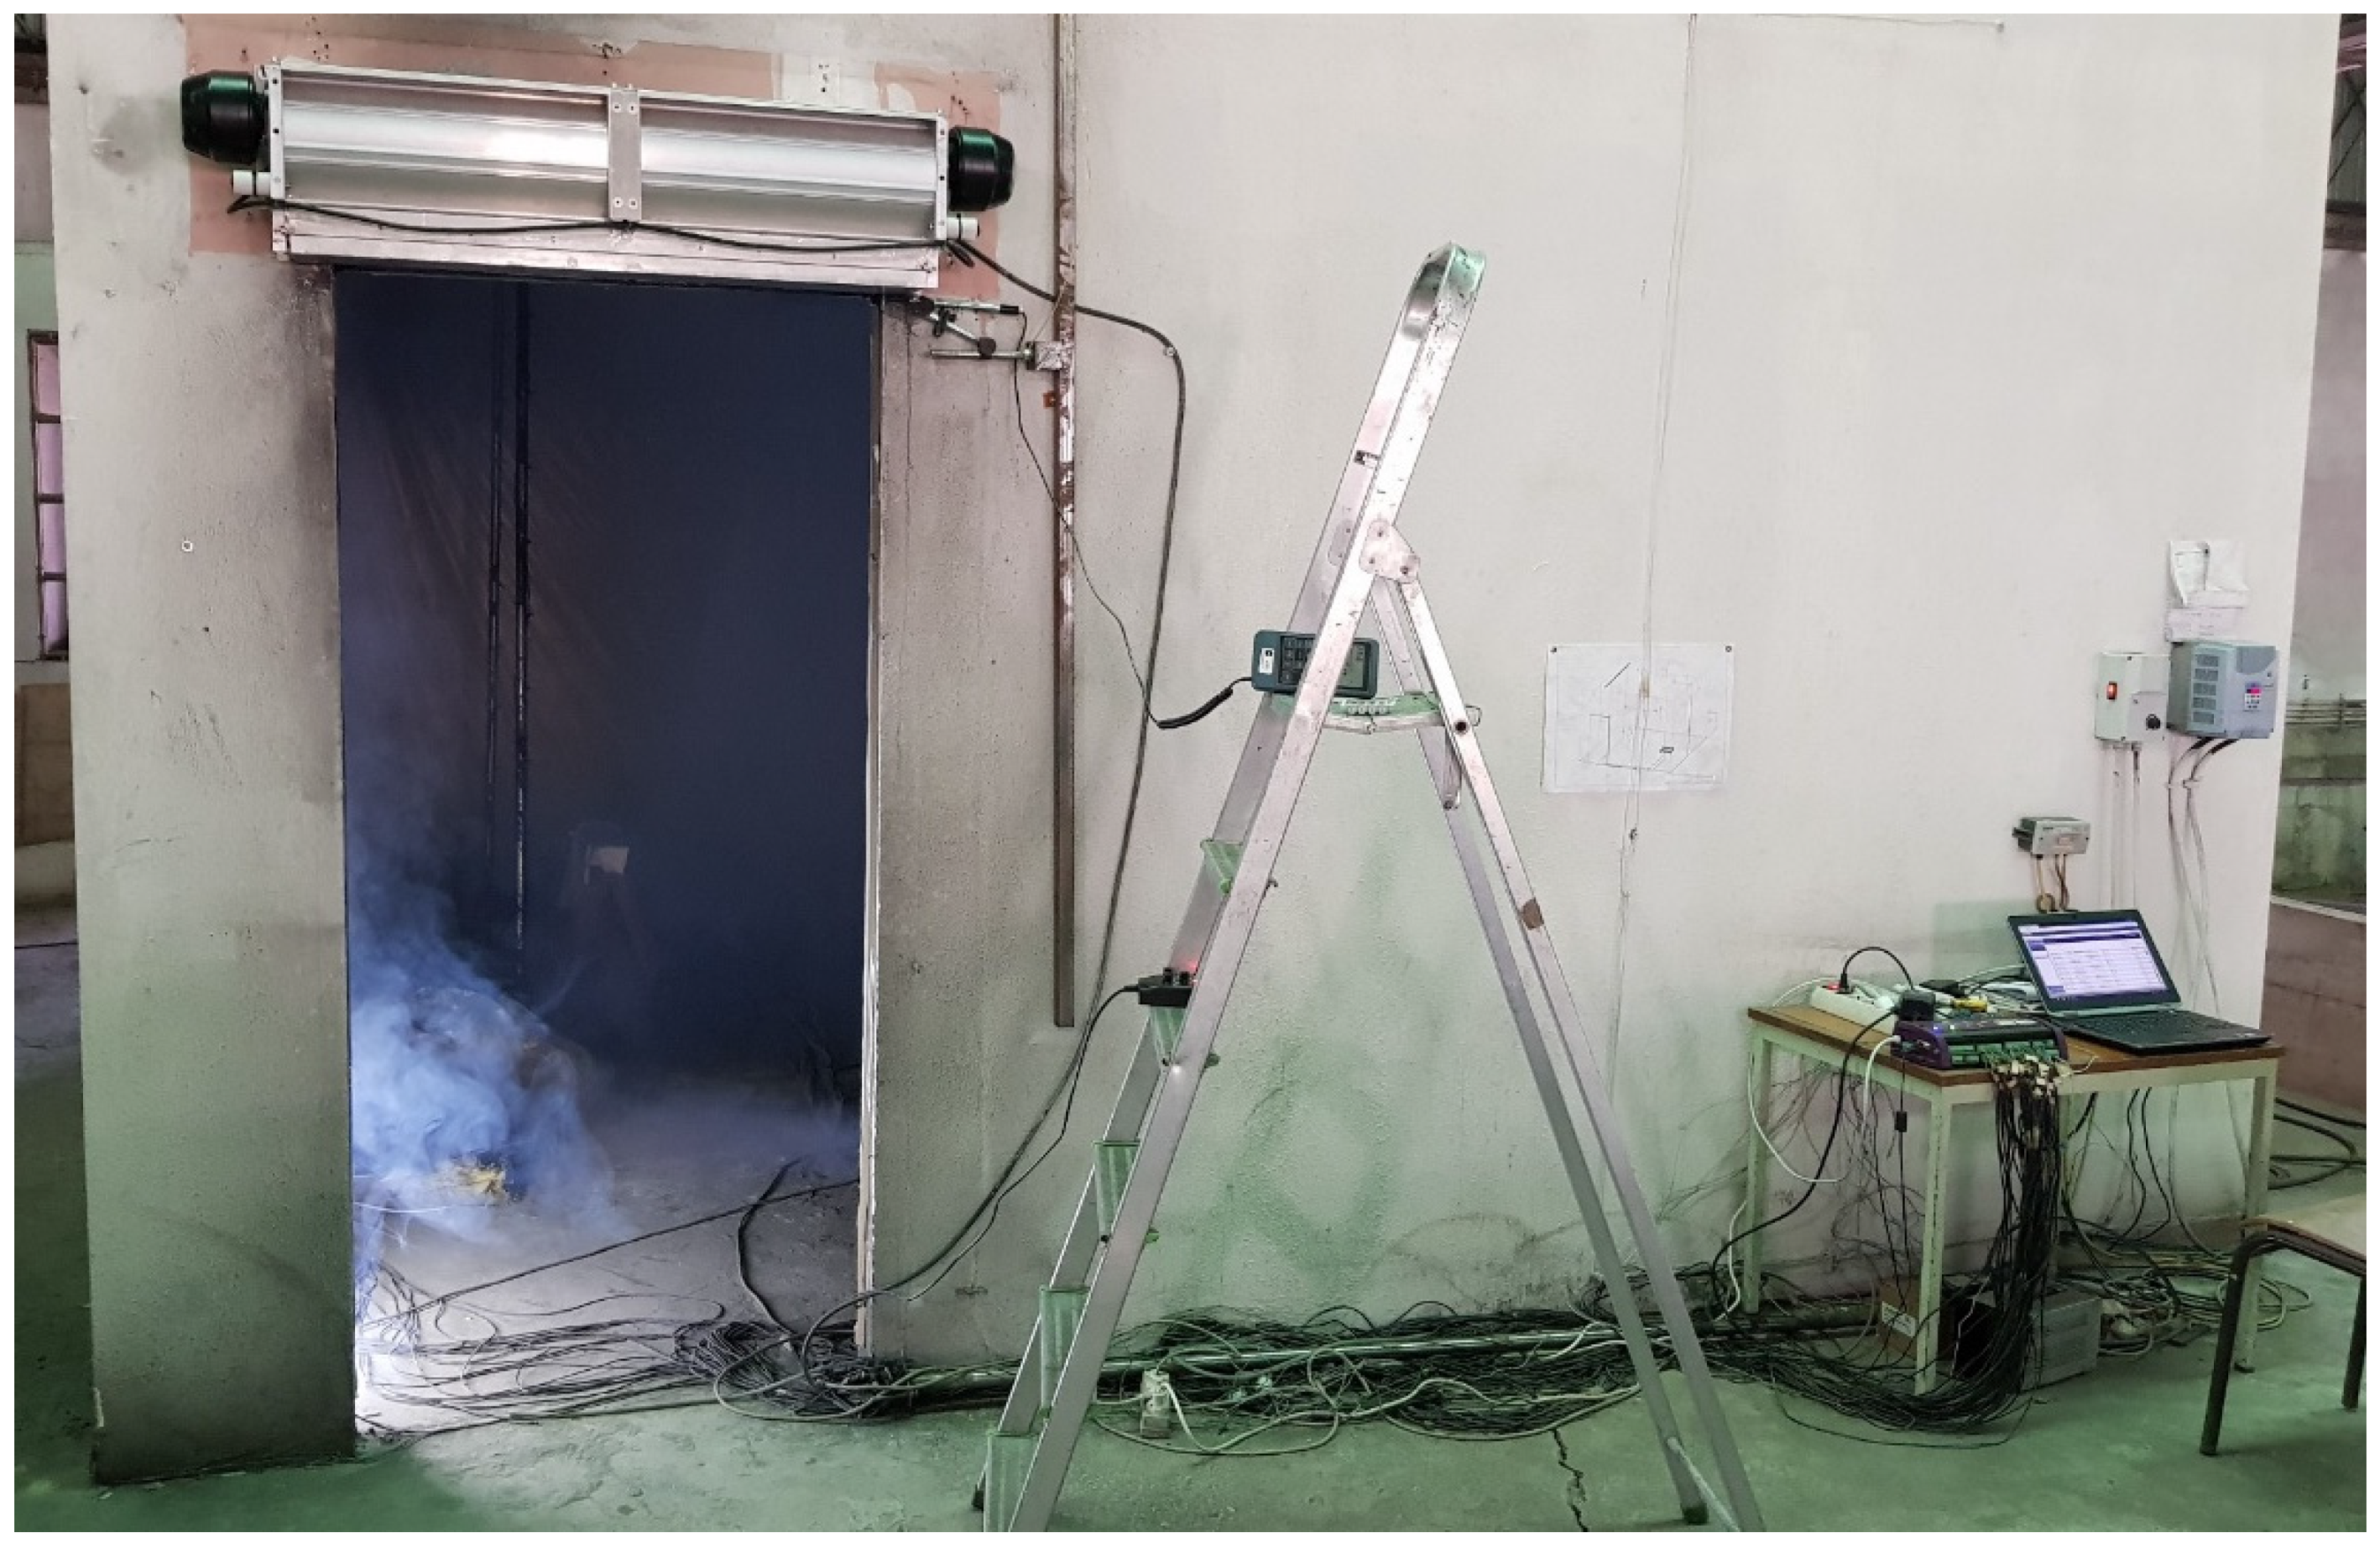
29]. The compartment presented in
Figure 2 was built for assessing the aerodynamic sealing of a full-size air curtain. The walls were composed of a double 10 mm thick gypsum board with a 50 mm insulation layer inside. To avoid wind disturbances, the experiments were performed in a hangar. Indoor air and cold smoke were exhausted by a fan via a 625 mm × 535 mm opening, which was located near the ceiling in the opposite wall to the door. The exhaust fan was controlled by a variable-frequency drive, and the exhaust volume flow rate at the compartment exhaust opening was correlated by calibration with the displayed frequency (the estimated standard uncertainty of the measurement varied from 0.055 m
3/s, for a low flow rate, up to a maximum of 0.084 m
3/s, for a flow rate of 0.97 m
3/s). The maximum flow rate of the exhaust fan was 0.86 m
3/s in these tests. The average door velocity was estimated based on the continuity in relation to exhaust flow rate.
The air curtain fan developed for this research project consists of two crossflow ventilators, which, combined with a plenum chamber and an adjustable nozzle, generate the intended air curtain (See
Figure 3,
Figure 4 and
Figure 5). The ventilators were assembled side by side on a support structure with the rotors aligned. The main criteria when designing this prototype was to minimize the amount of structural and functional elements to be added to the two-ventilator assembly. This was achieved by using the ventilator frame as the structural core of the prototype, thus creating a relatively compact solution. This prototype was designed with the following objectives in mind: (i) reduced weight, while maintaining adequate structural sturdiness; (ii) ease of production; (iii) versatility to provide a wide range of jet configurations in terms of jet orientation, jet thickness and jet velocity. The jet unit prototype allows for jet thickness in the range of 5 mm to 30 mm and plane jet orientations from 0° to 30° in relation to the vertical plane. Depending on nozzle configurations, the jet nozzle velocity starts at 0 m/s and is able to reach 20 m/s.
The air curtain fan was suspended on the external side of the soffit of the door (
Figure 3). The curtain flow velocity, which was controlled in frequency, was continuously measured with a hot wire anemometer (model Airflow TSI 8455) located at the jet origin. The measurements of this anemometer were correlated with the average jet velocity by calibration (estimated standard uncertainty of 0.46 m/s). The curtain nozzle velocity ranged from 0.0 m/s to 12.0 m/s. In these tests, the nozzle thickness ranged from 5 mm to 16 mm (estimated standard uncertainty of 0.50 mm), and the plane jet angle ranged from 0° to 20° (estimated standard uncertainty of 1°). The plane jet angle was assessed using a sewing thread hanging from the nozzle, which showed the flow direction. The angle measurement was made with a protractor.
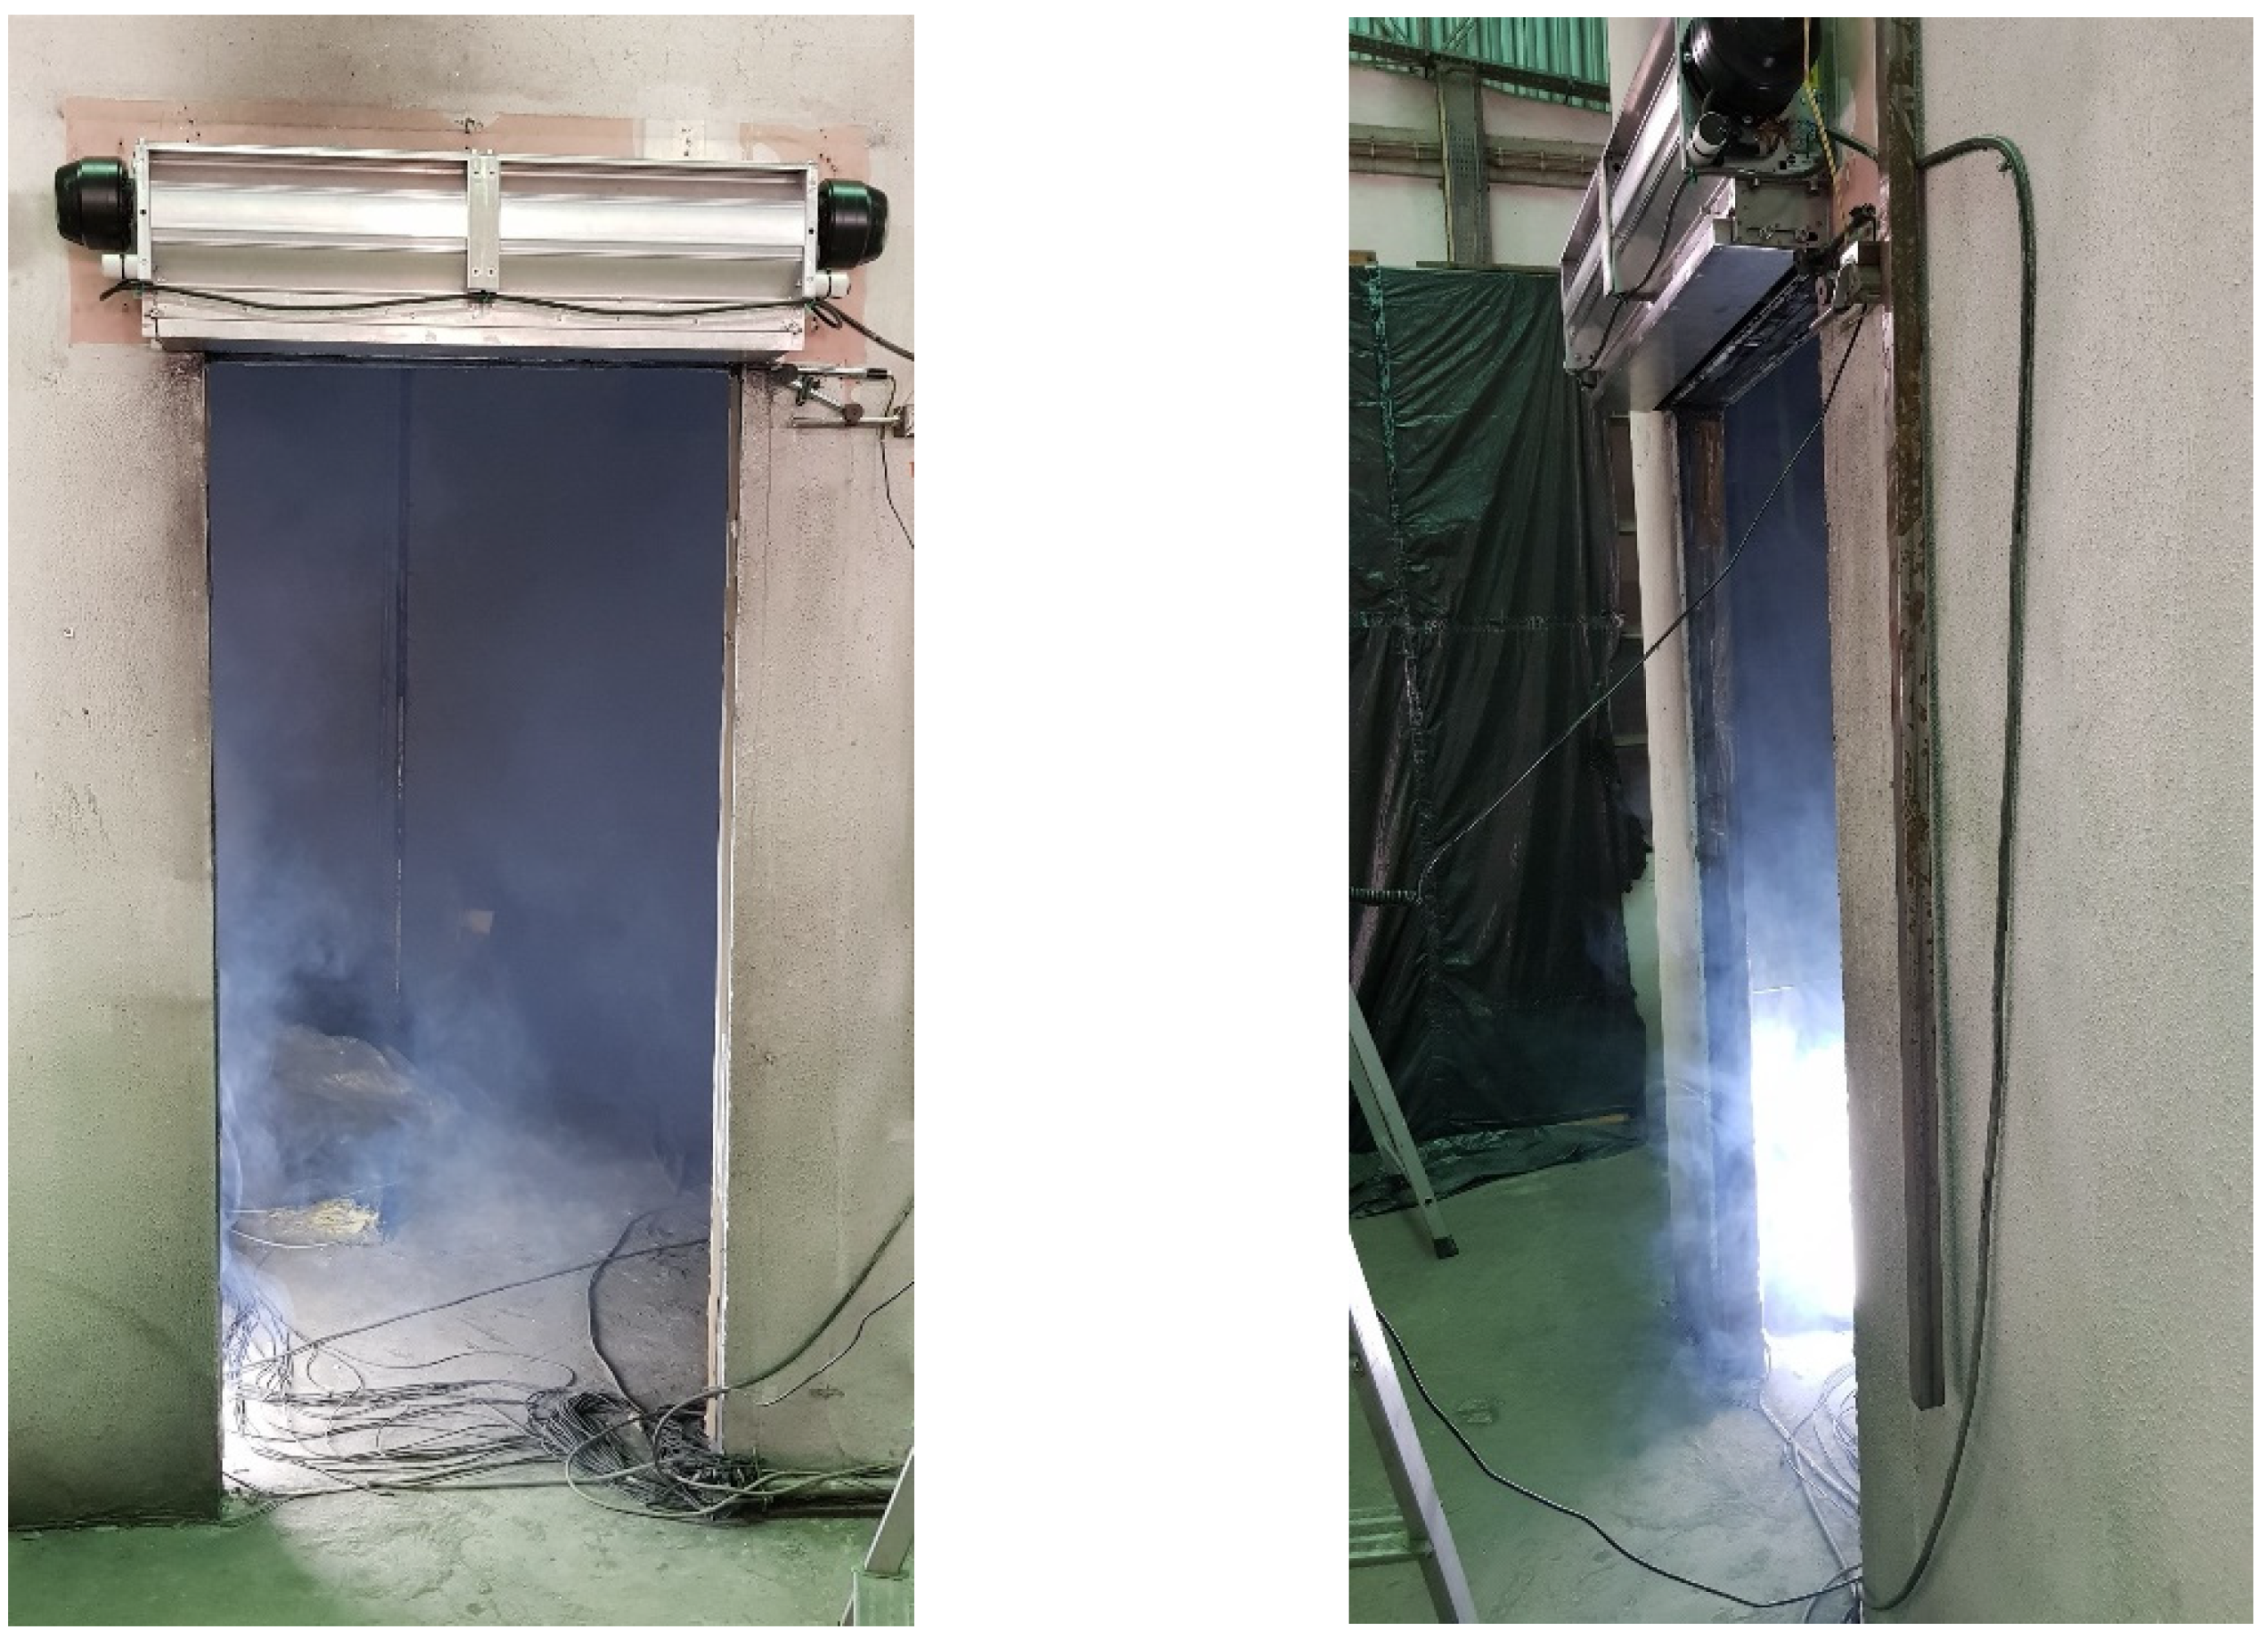
In these experiments a cold smoke source was activated inside the test compartment (
Figure 4). An air curtain (plane jet), protecting an open door, was activated and an exhaust fan was also activated (
Figure 5). The exhaust flow rate from the compartment and the nozzle jet velocity were reduced as much as possible during each test, while the aerodynamic sealing at the opening was kept. The concentration of PM10 and PM2.5 was assessed in these experiments because the work previously carried out [
27] showed that the visual assessment gives similar results. The results corresponding to the lowest exhaust flow rate necessary to obtain the aerodynamic sealing (assessed visually) were retained. In order to make steady state measurements, the waiting time after every change of test parameter was considered. As the exhaust flow rate necessary for these tests is very low, it was noticed that the influence of outside pressure due to the wind through the exhaust fan duct was relevant; therefore, in these tests, the exhaust fan duct released the extraction air to the interior of the hangar where the test compartment was located.
Three sets of tests were carried out, organized by the jet nozzle thickness. They are presented in
Table 1 (nominal jet thickness of 5 mm),
Table 2 (nominal jet thickness of 10 mm) and
Table 3 (nominal jet thickness of 16 mm). There were also tests carried out where the air curtain was inactive. Their results are included in
Table 3 (tests 237 and 281).
The definition of the Reynolds number currently used for plane jets,
, was considered [
40]. Therefore, these full-size tests at low jet velocity (mainly for the nominal jet nozzle thicknesses of 5 mm and 10 mm), with Re ranging from 175 to 2288, were carried out mostly in the transition regime. For the main set of tests with the nominal jet nozzle thickness of 16 mm, the Re ranged from 290 to 3640 for the plane jet angle of 0°, 5°, 10° and 20°. For the angle of 15°, this study was expanded up to an Re of 13,245. Therefore, for the nominal jet thickness, both transition and turbulent regimes are involved.
3. Results
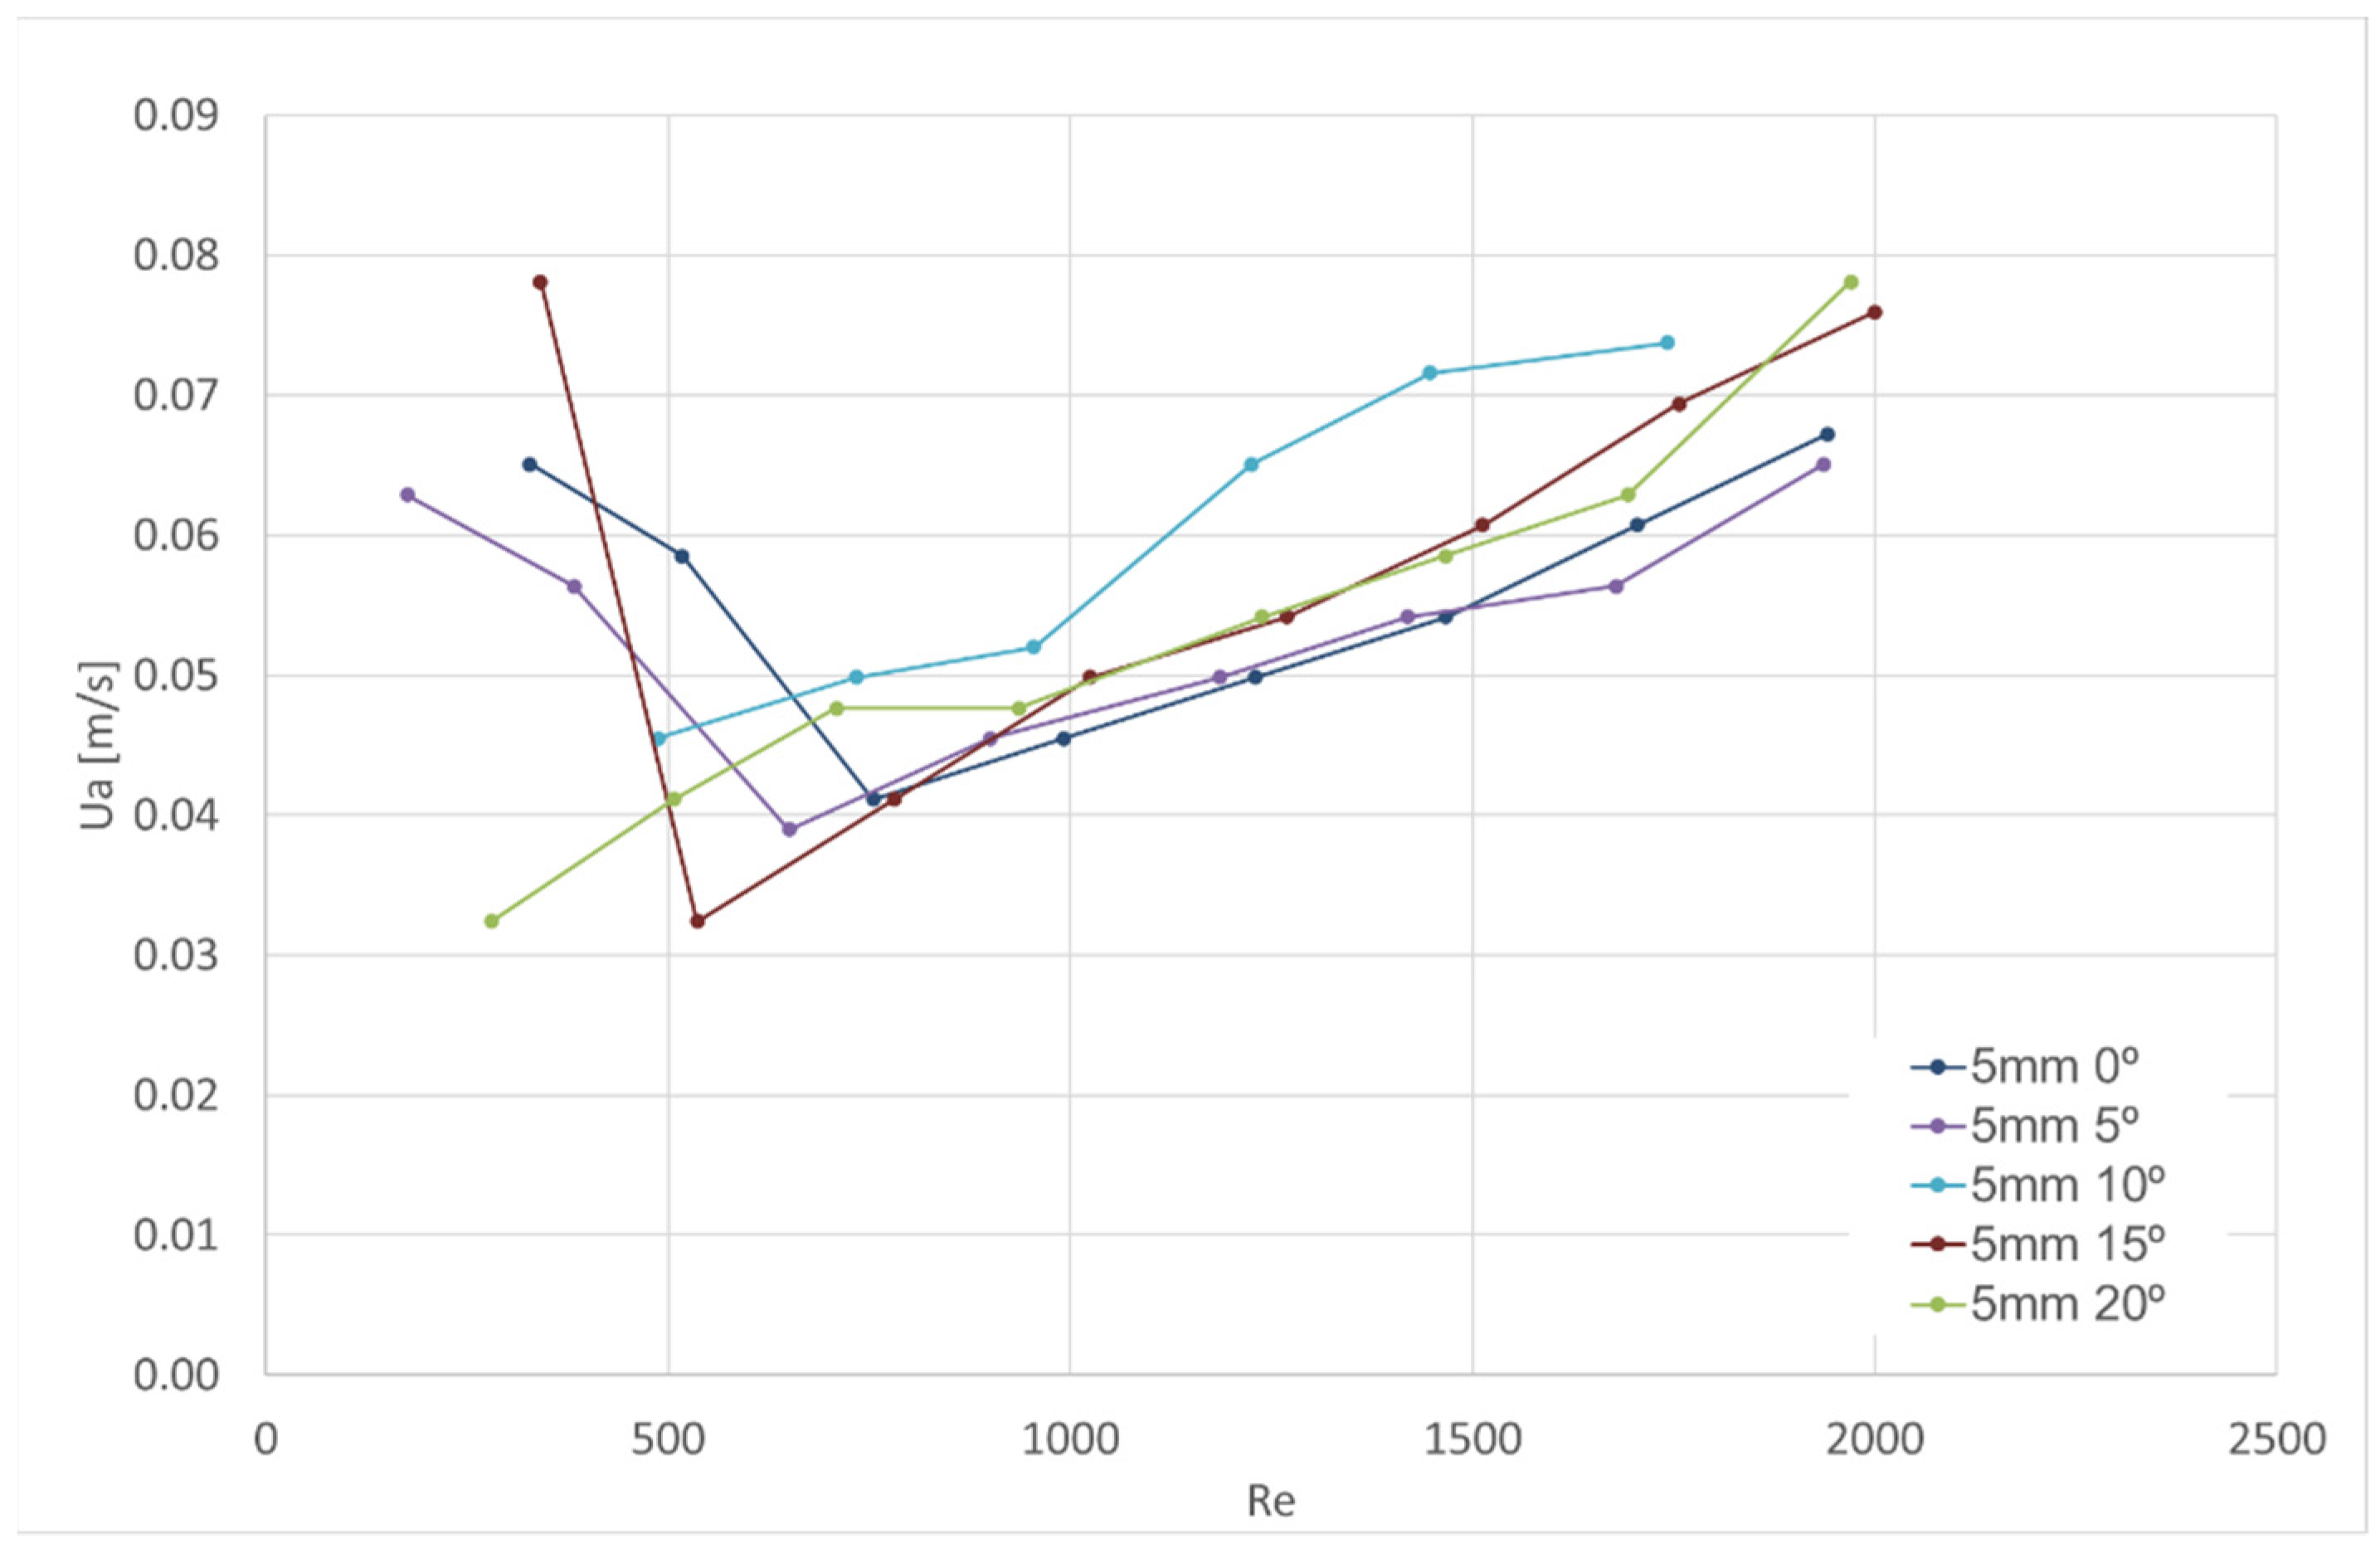
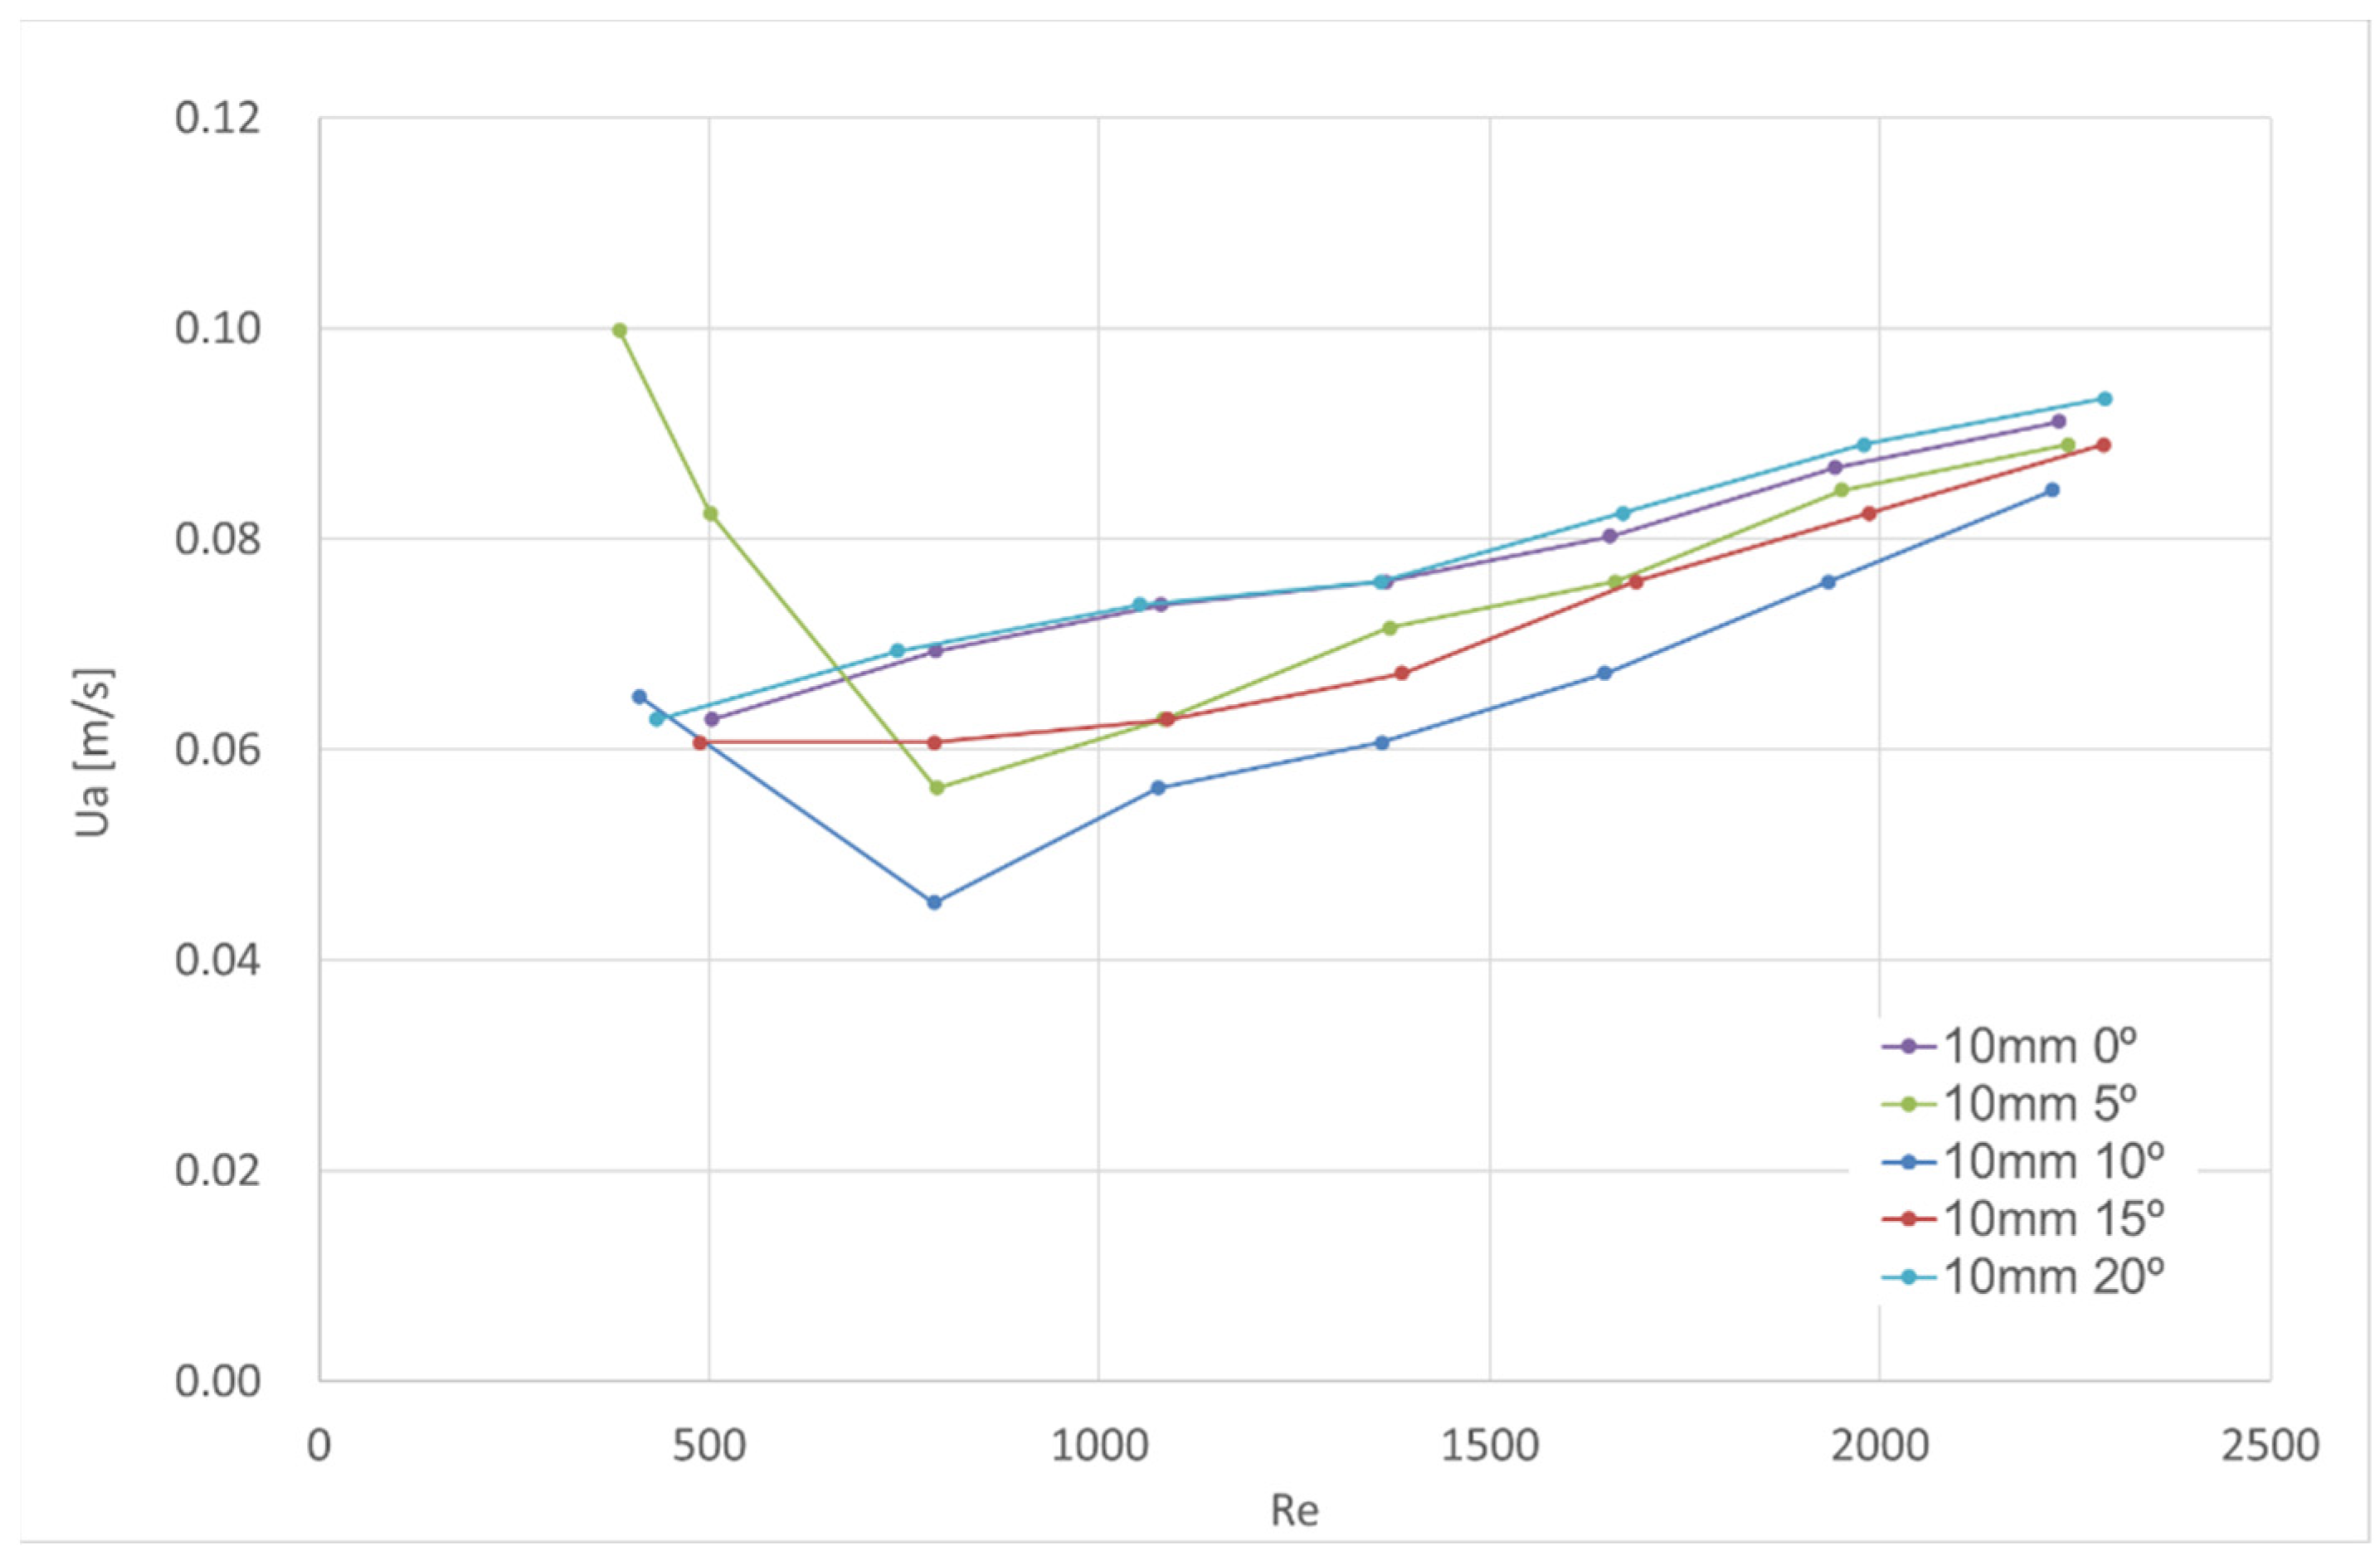
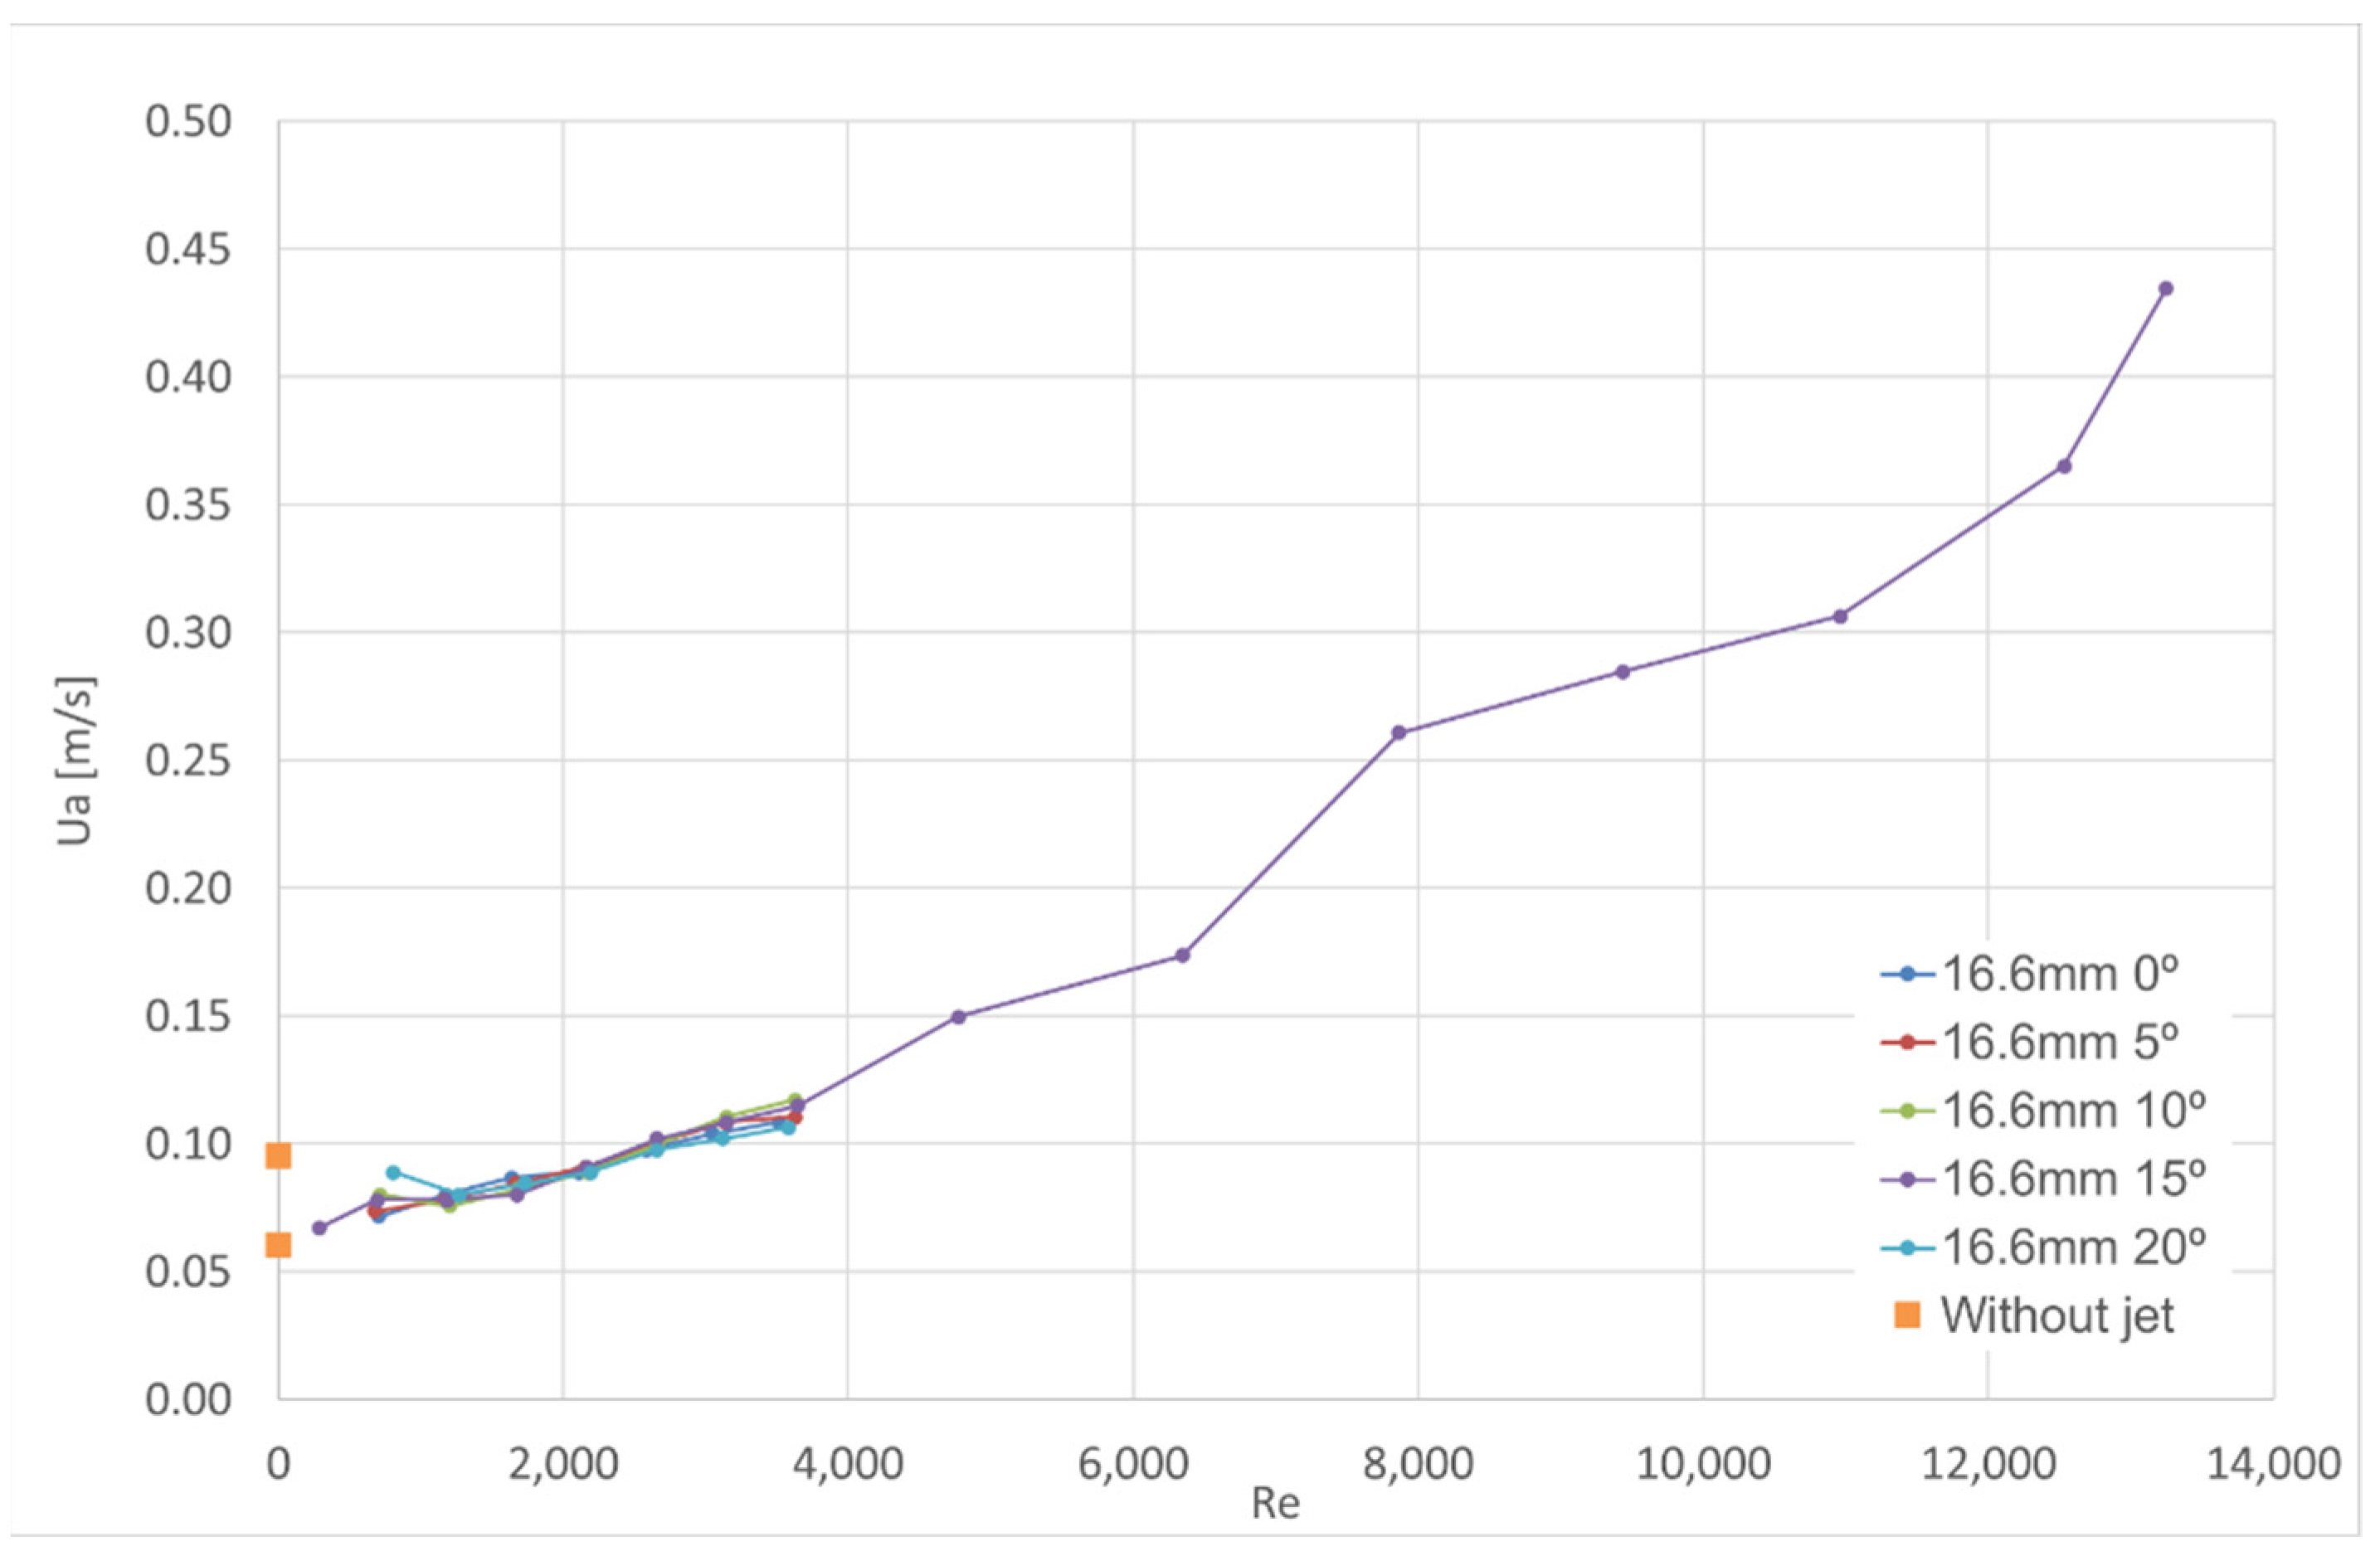
The following figures (
Figure 6,
Figure 7 and
Figure 8) show the relevant experimental results for the 5 mm, 10 mm and 16 mm jet thicknesses. The
x-axis corresponds to the plane jet Reynolds number and the
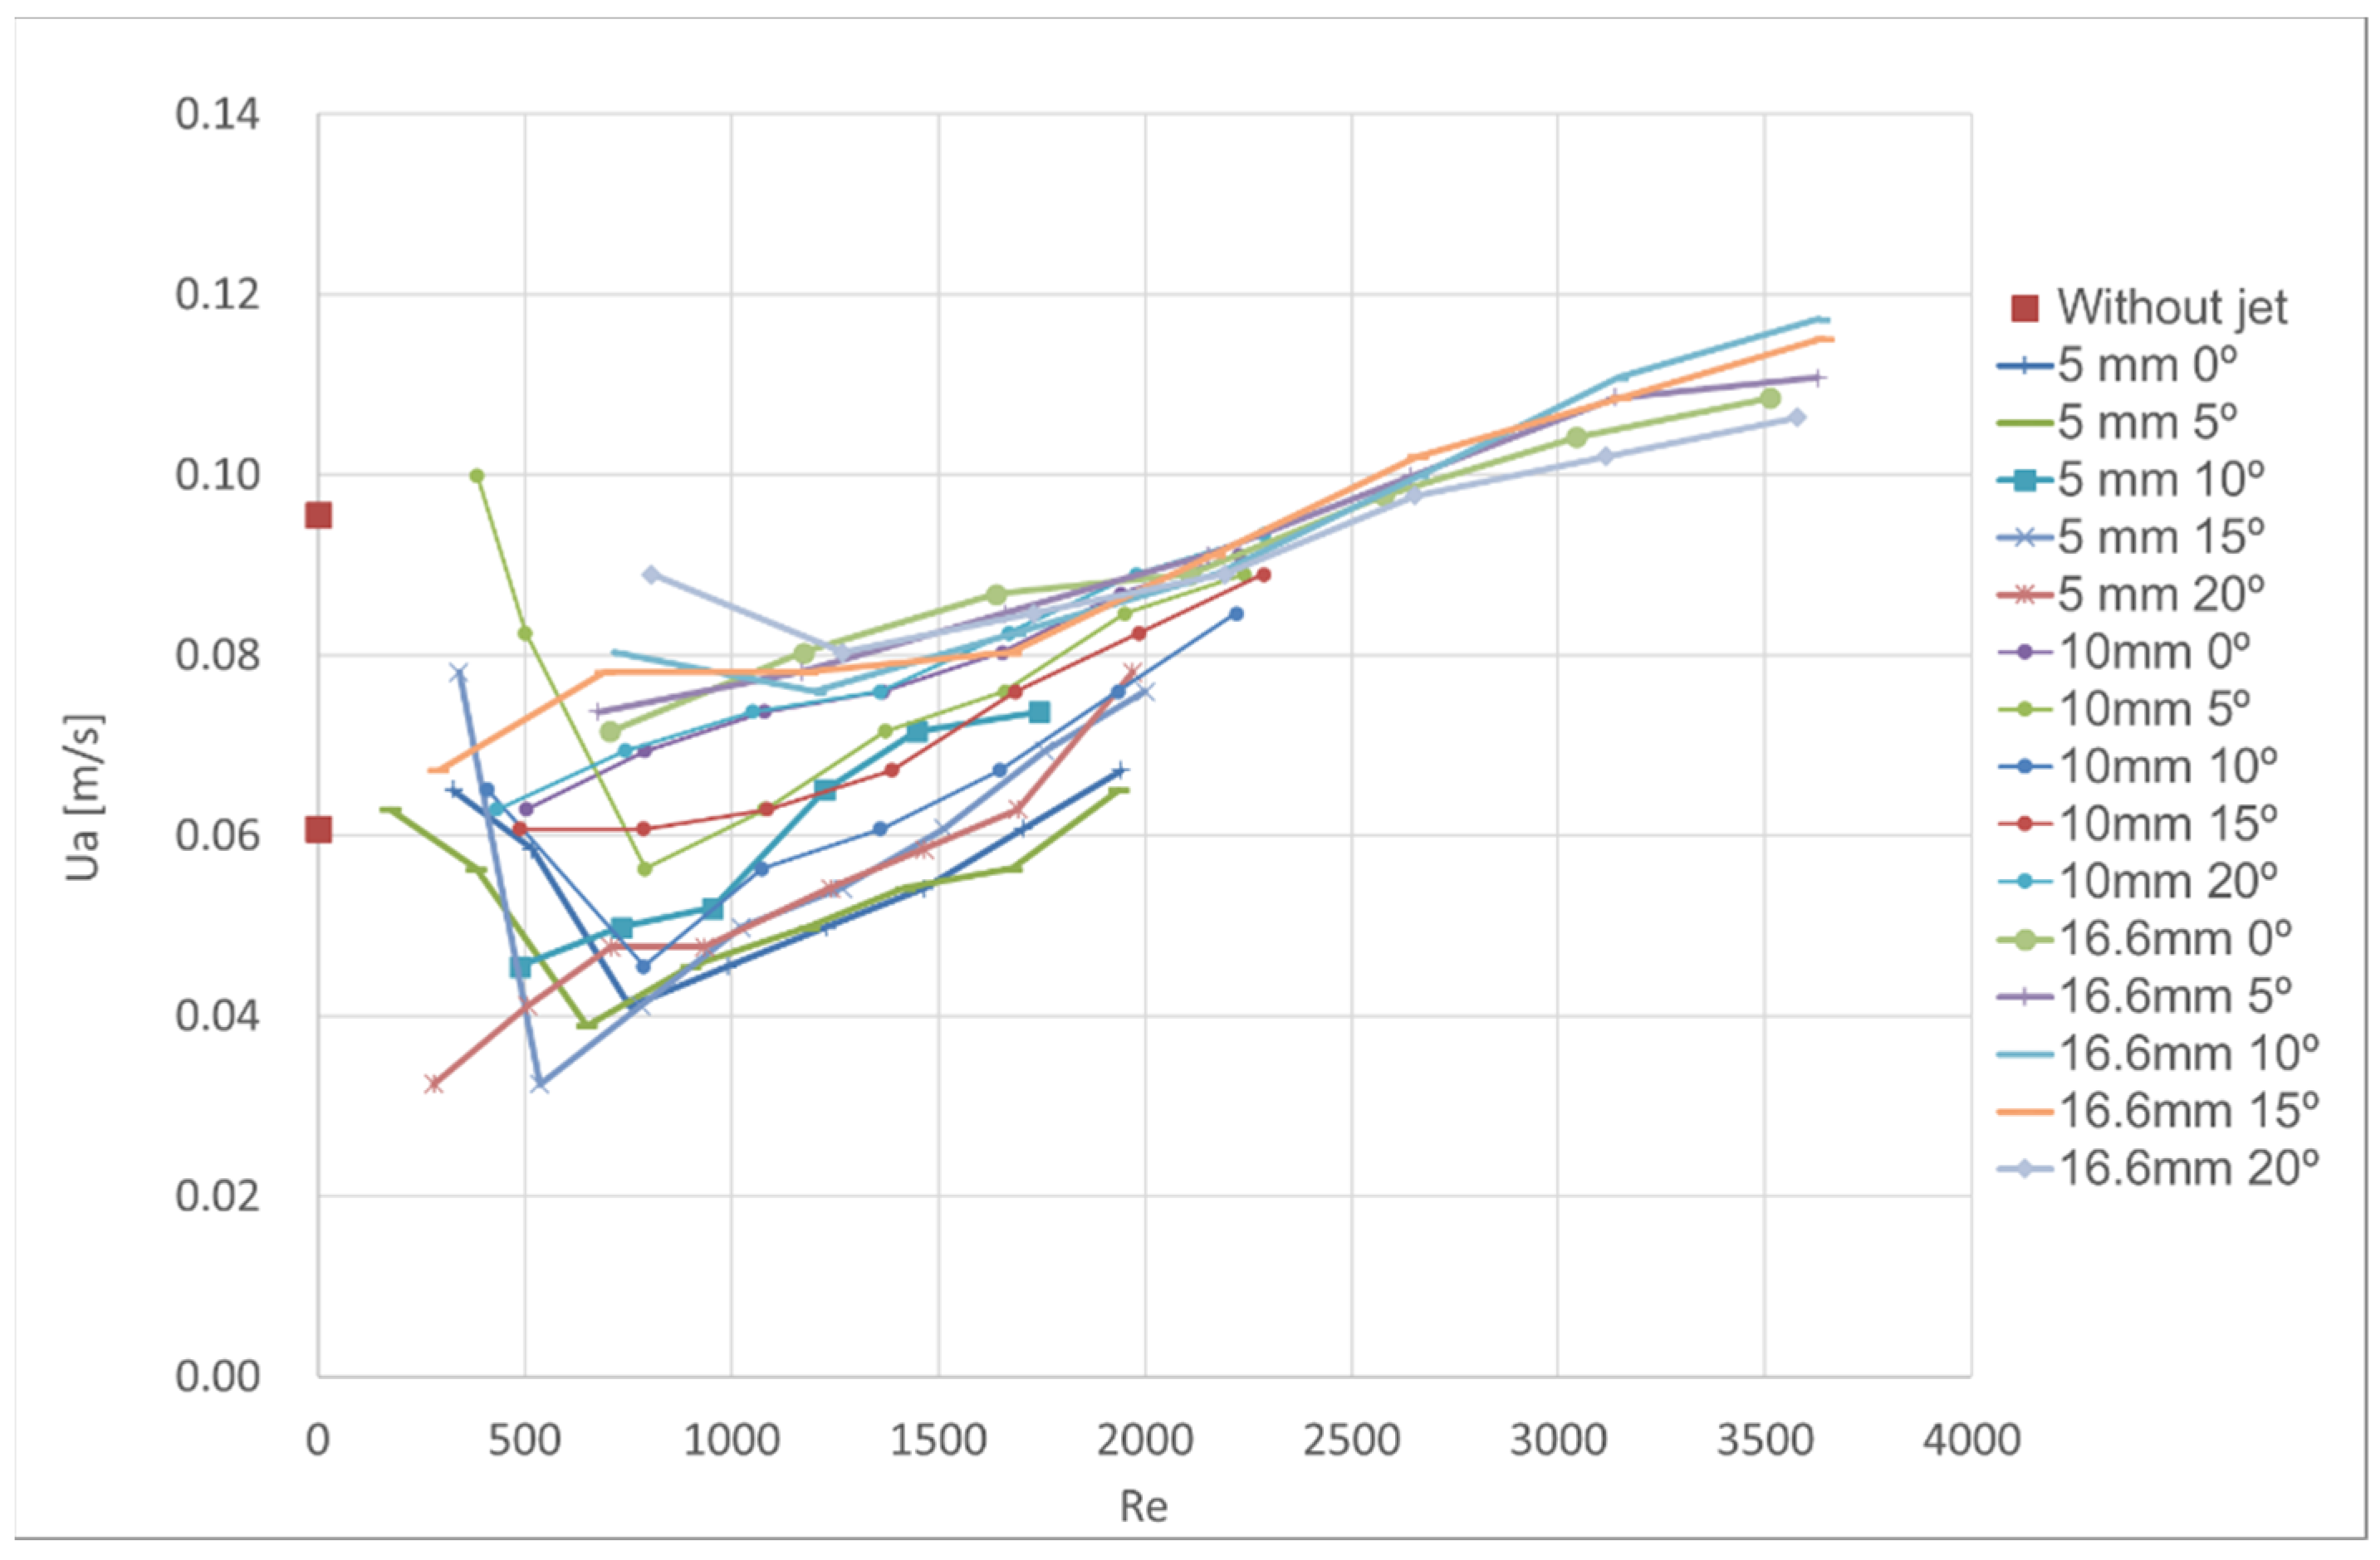
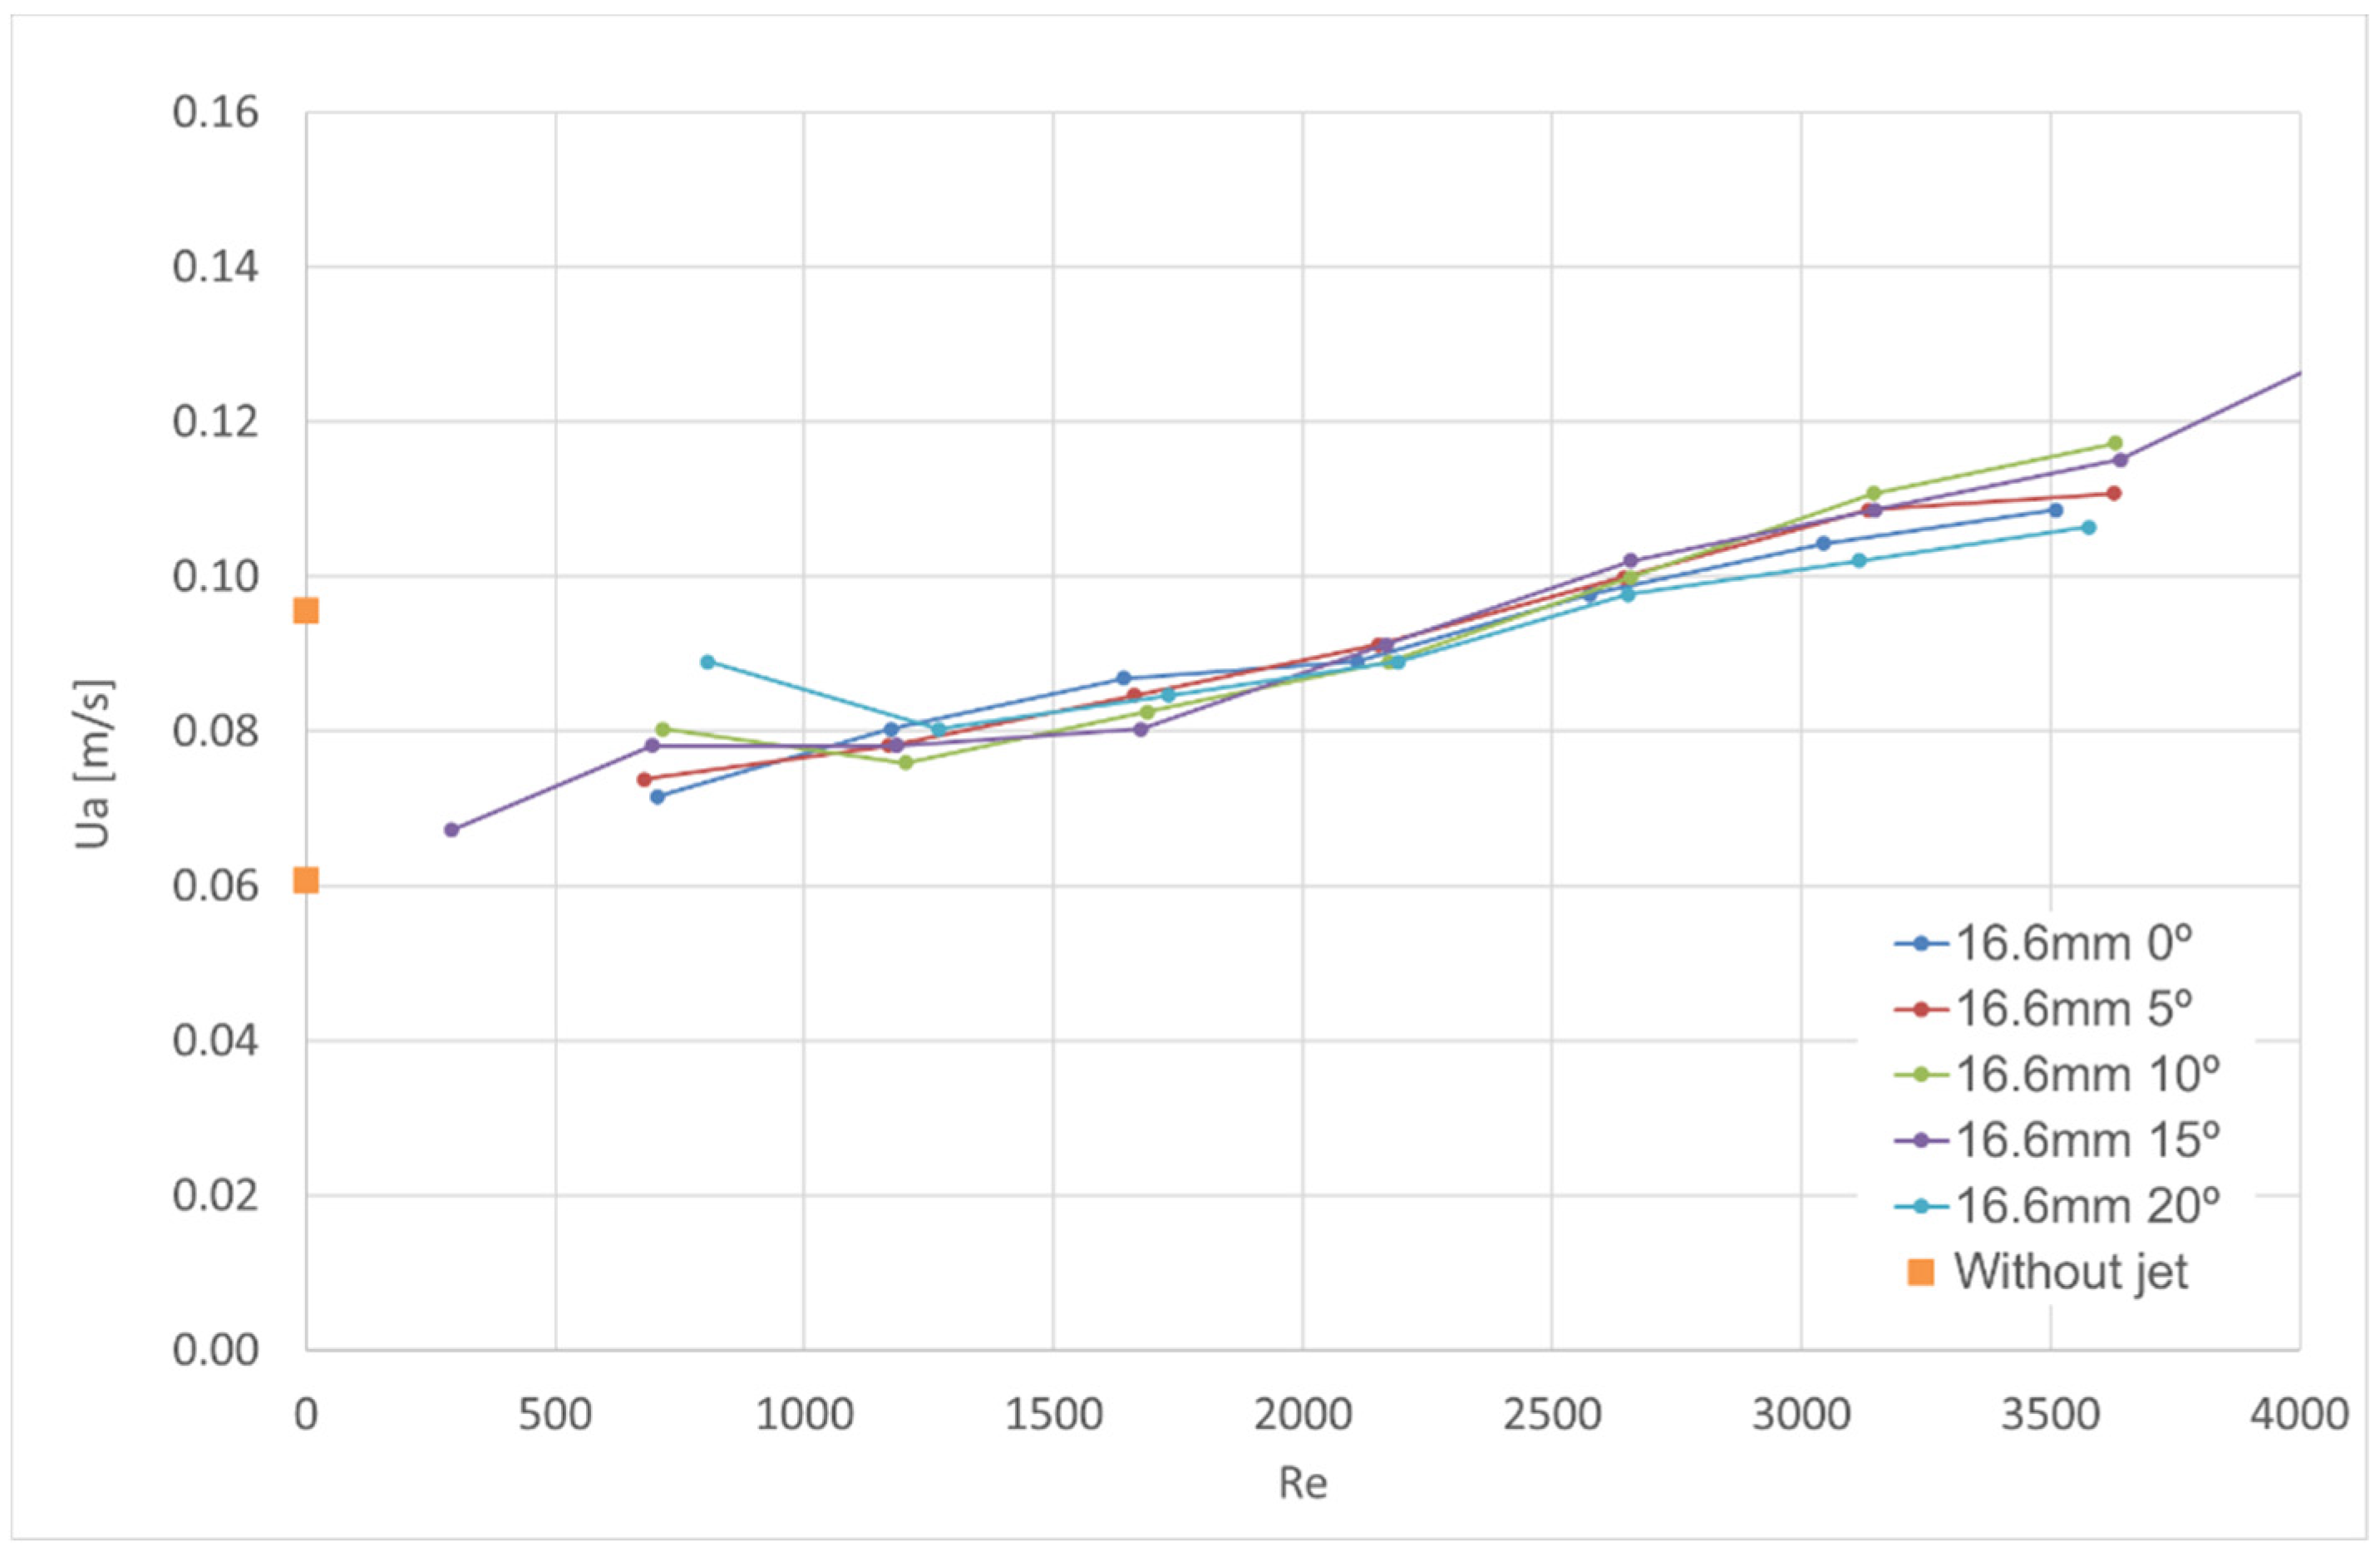
y-axis corresponds to the minimum average velocity through the door to obtain the visual aerodynamic sealing. Every figure presents the results for several angles (0°, 5°, 10°, 15° and 20°) between the plane jet and the vertical plane. As the tests for the nozzle thickness of 16.6 mm and angle of 15° were carried out for a wide range of Reynolds numbers, two images present the results: the upper image in
Figure 8 shows the whole set of results and the lower image shows the test results for the Reynolds number interval from 0 to 2400.
The results show that the average velocity of the flow across the door () needed to avoid the release of the contaminated air (with cold smoke) from the compartment increases linearly with the average jet nozzle velocity (); thus, it also increases linearly with the Reynolds number. The air flow rate entrained by the plane jet (from both sides), which forms the air curtain, increases with ; therefore, the air plane jet flow rate, when impinging the floor, increases with . The plane jet reduces the admission of uncontaminated air through the upper part of the protected door; therefore, the incoming air flow is concentrated at the lower part of the door, where it is needed to avoid the plane jet being split when impinging the floor and being rejected to the outside of the compartment. As expected, the increases linearly with the plane jet flow rate. Although a zone between the sides of the plane jet (which is tilted to inside due to the incoming flow) and the vertical limits of the door opening seems to be unprotected, the incoming air () is sweeping any contaminant leakage inside the compartment when the incoming flow rate is large enough. Additionally, some contaminant (which is entrained from inside to the plane jet, mixed in the plane jet and rejected to the outside in the floor impinging zone) is again captured by the jet entrainment from outside, assisted by the incoming flow rate (). This limit condition is considered to correspond to “no contaminant leakage” because the contaminant is kept persistently in the air curtain action zone.
The analysis of the results shows that:
The dispersion of the results does not correspond to a sequence (increasing or decreasing) of the plane jet angles, so it was concluded that the jet angle has no significant influence. It was observed that, for low momentum jets, the effect of the compartment exhaust flow rate is a determinant. As the compartment has only one outlet and one inlet opening, the continuity applies and the inlet flow rate through the door is equal to the exhaust flow rate. The momentum of this inlet flow rate is significant enough to impose the deflection of the air curtain approximately to the same angle, independently of the initial angle imposed at the nozzle of the plane jet (only for low momentum jets). This conclusion is in agreement with the results obtained in the CFD analysis carried out by Dias, Gogotsi and Viegas [
28], who showed that, with respect to the angle of the jet, it is important to define the flow path near the nozzle, whereas far from the nozzle, the flow path of the jet depends mainly on the extraction flow rate from the compartment.
At thicknesses of 5 mm and 10 mm, there are experimental results showing an inflection (for Re between 800 and 1800), with the average door flow velocity () values being higher for lower Reynolds numbers. This behaviour is consistent with the average door velocity value measured for the inactive air curtain condition. For the thickness of 16.6 mm, the number of measurements for Re < 500 is small, which does not allow analysis of this behaviour. This aspect will be analysed in the next section.
4. Discussion
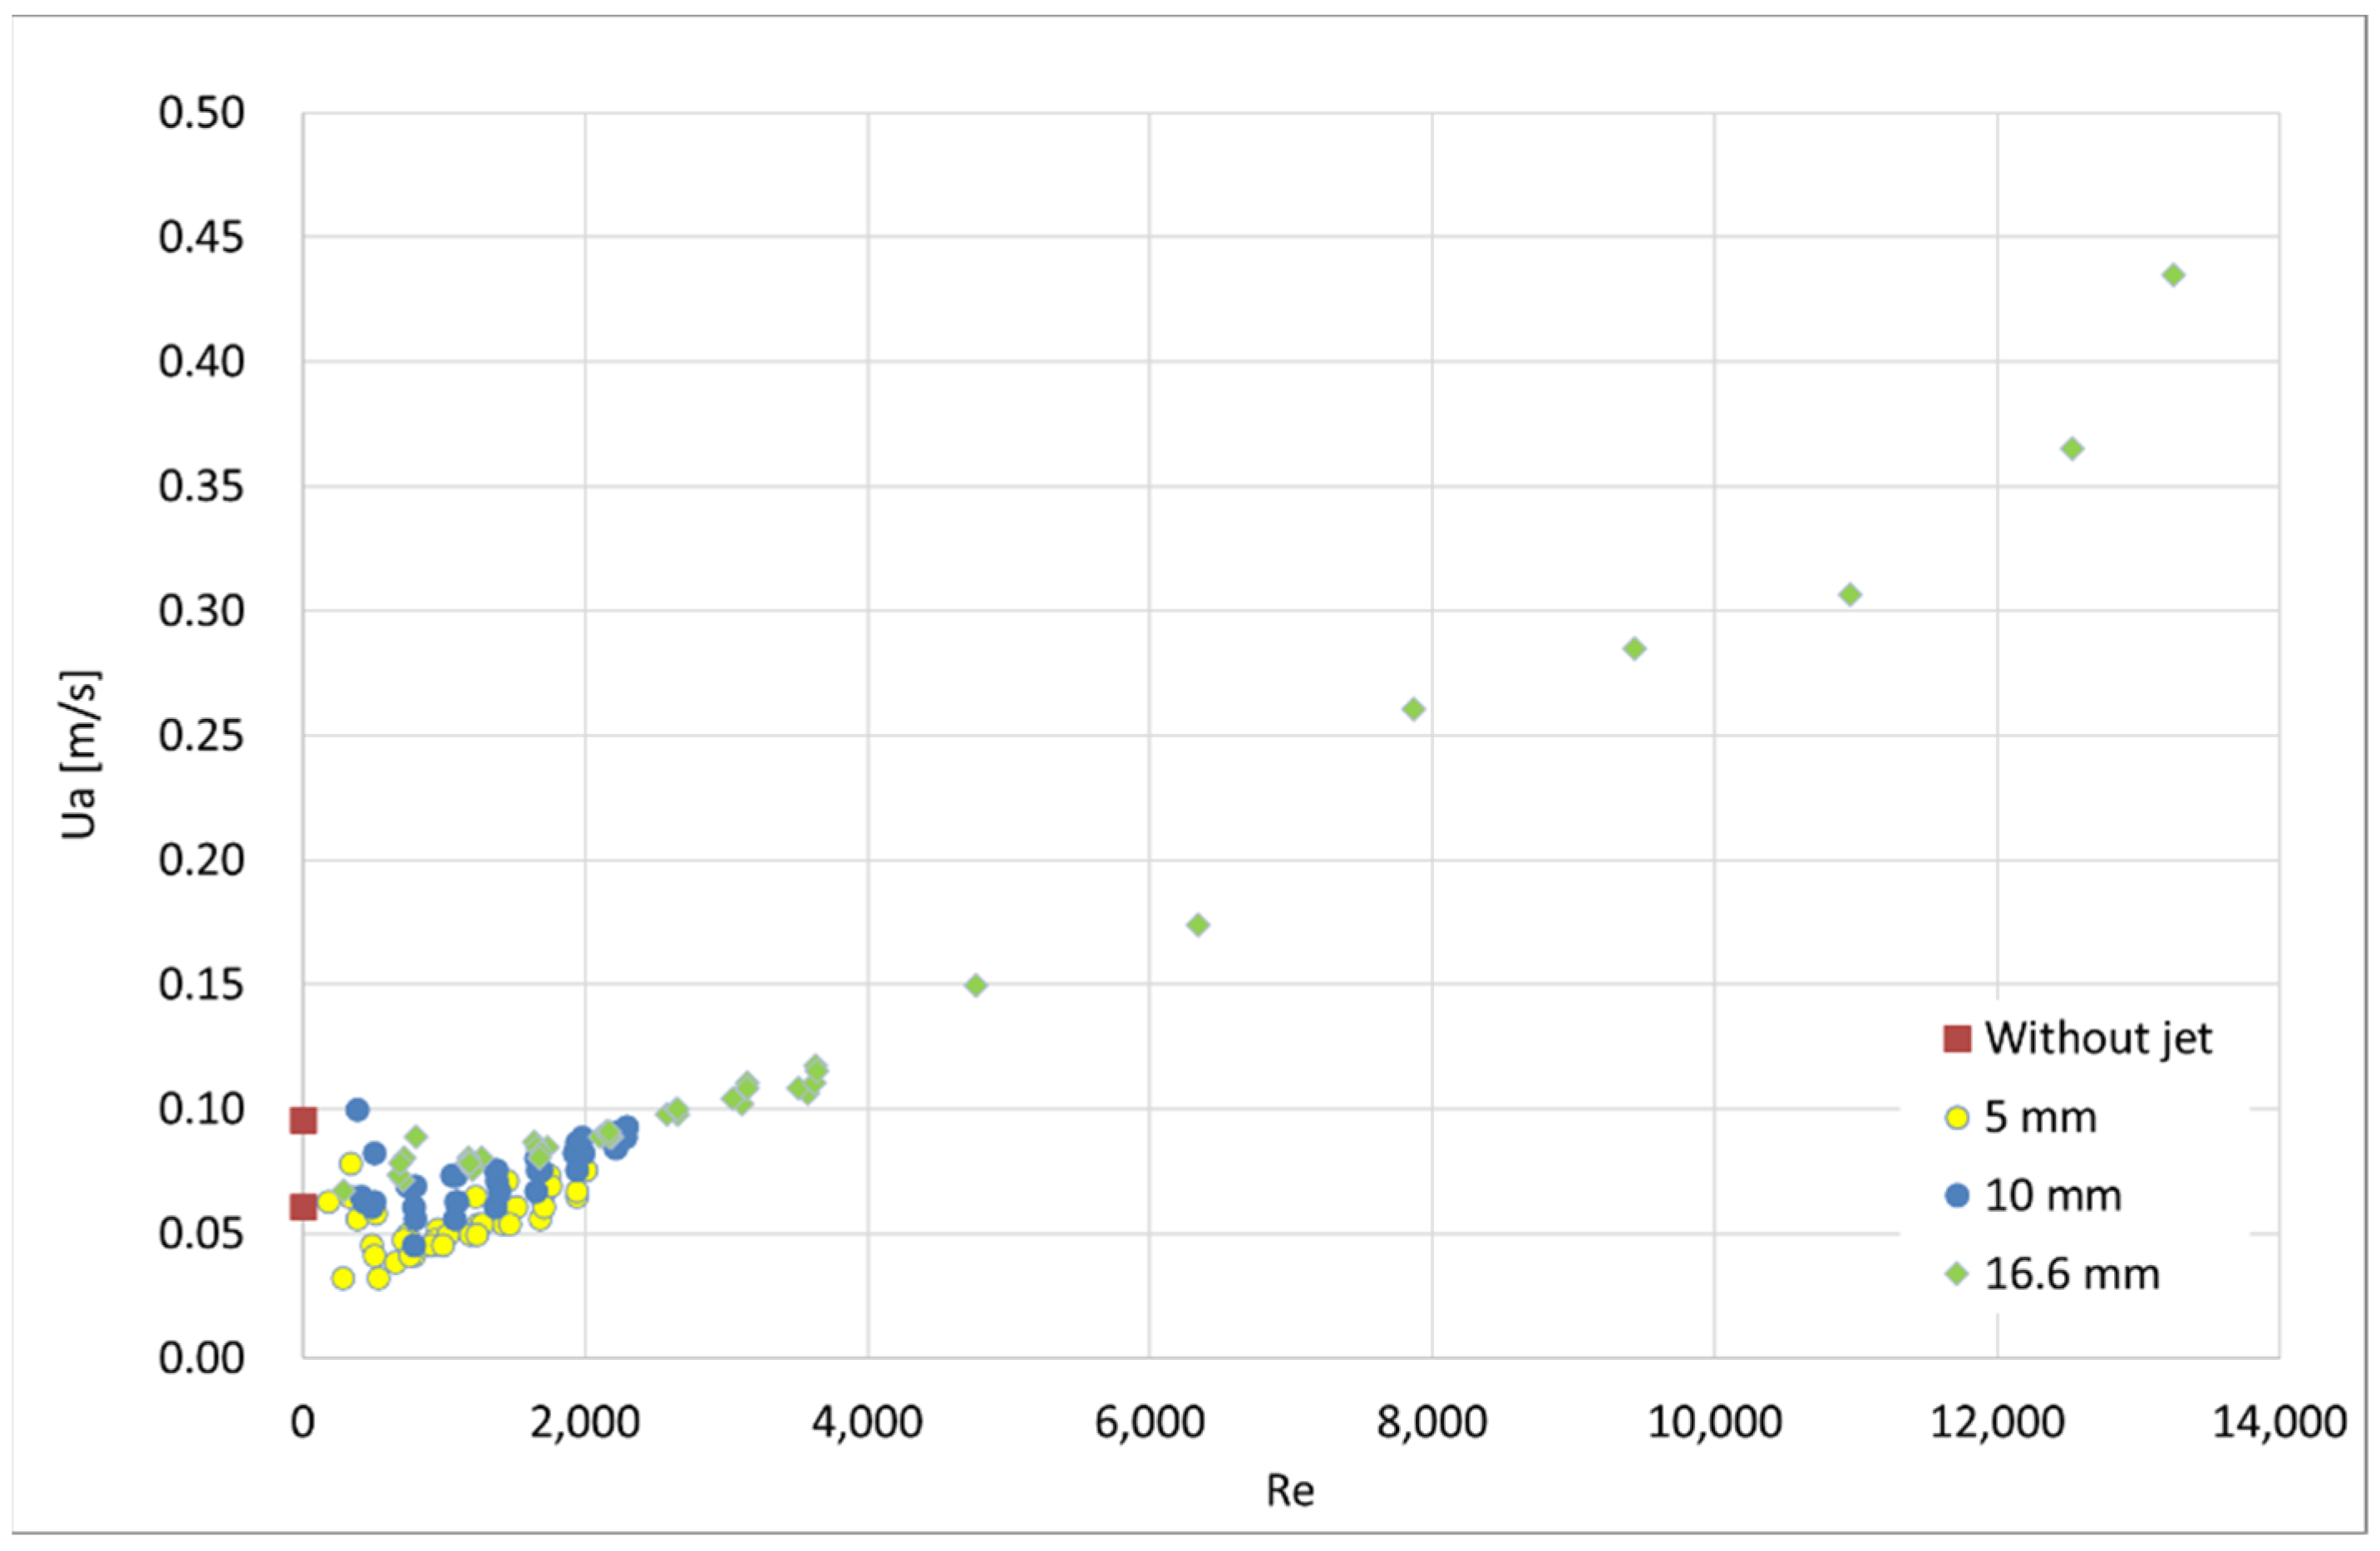
Figure 9 and
Figure 10 show the sets of results, in the first case (0 ≤ Re < 3700) according to jet angle and nozzle thickness and, in the second case (0 ≤ Re < 14,000), only according to nozzle thickness.
The pictures show that:
The average door velocity value increases with the jet thickness.
It is confirmed that the average door velocity values for low Reynolds numbers (Re < 800) are consistent with the average door velocity value measured for the inactive air curtain condition.
The jet entrains fluid from both sides, but only the flow rate coming from the exterior (of the compartment) and the flow rate at the nozzle correspond to the mass intake to the compartment. The aerodynamic sealing at the opening requires that at least this flow rate is extracted from the compartment. This process corresponds to an intrinsic characteristic of the jet and occurs both for isothermal cases and cases where there is a temperature difference between the outside and the inside of the compartment. In [
28] (see also [
26,
29]) it is shown that the aerodynamic sealing may be expressed by Equation (1), where K is an empirical constant.
In this case, it is important to assess if the test results can be expressed by such an equation. Although it was concluded that the jet angle (
) has no significant influence on the experimental results, Equation (1) depends on the jet angle. In this equation, the influence for small values of
is small; therefore, it is compatible with the test results. The least square fit of Equation (2) was performed on the experimental results:
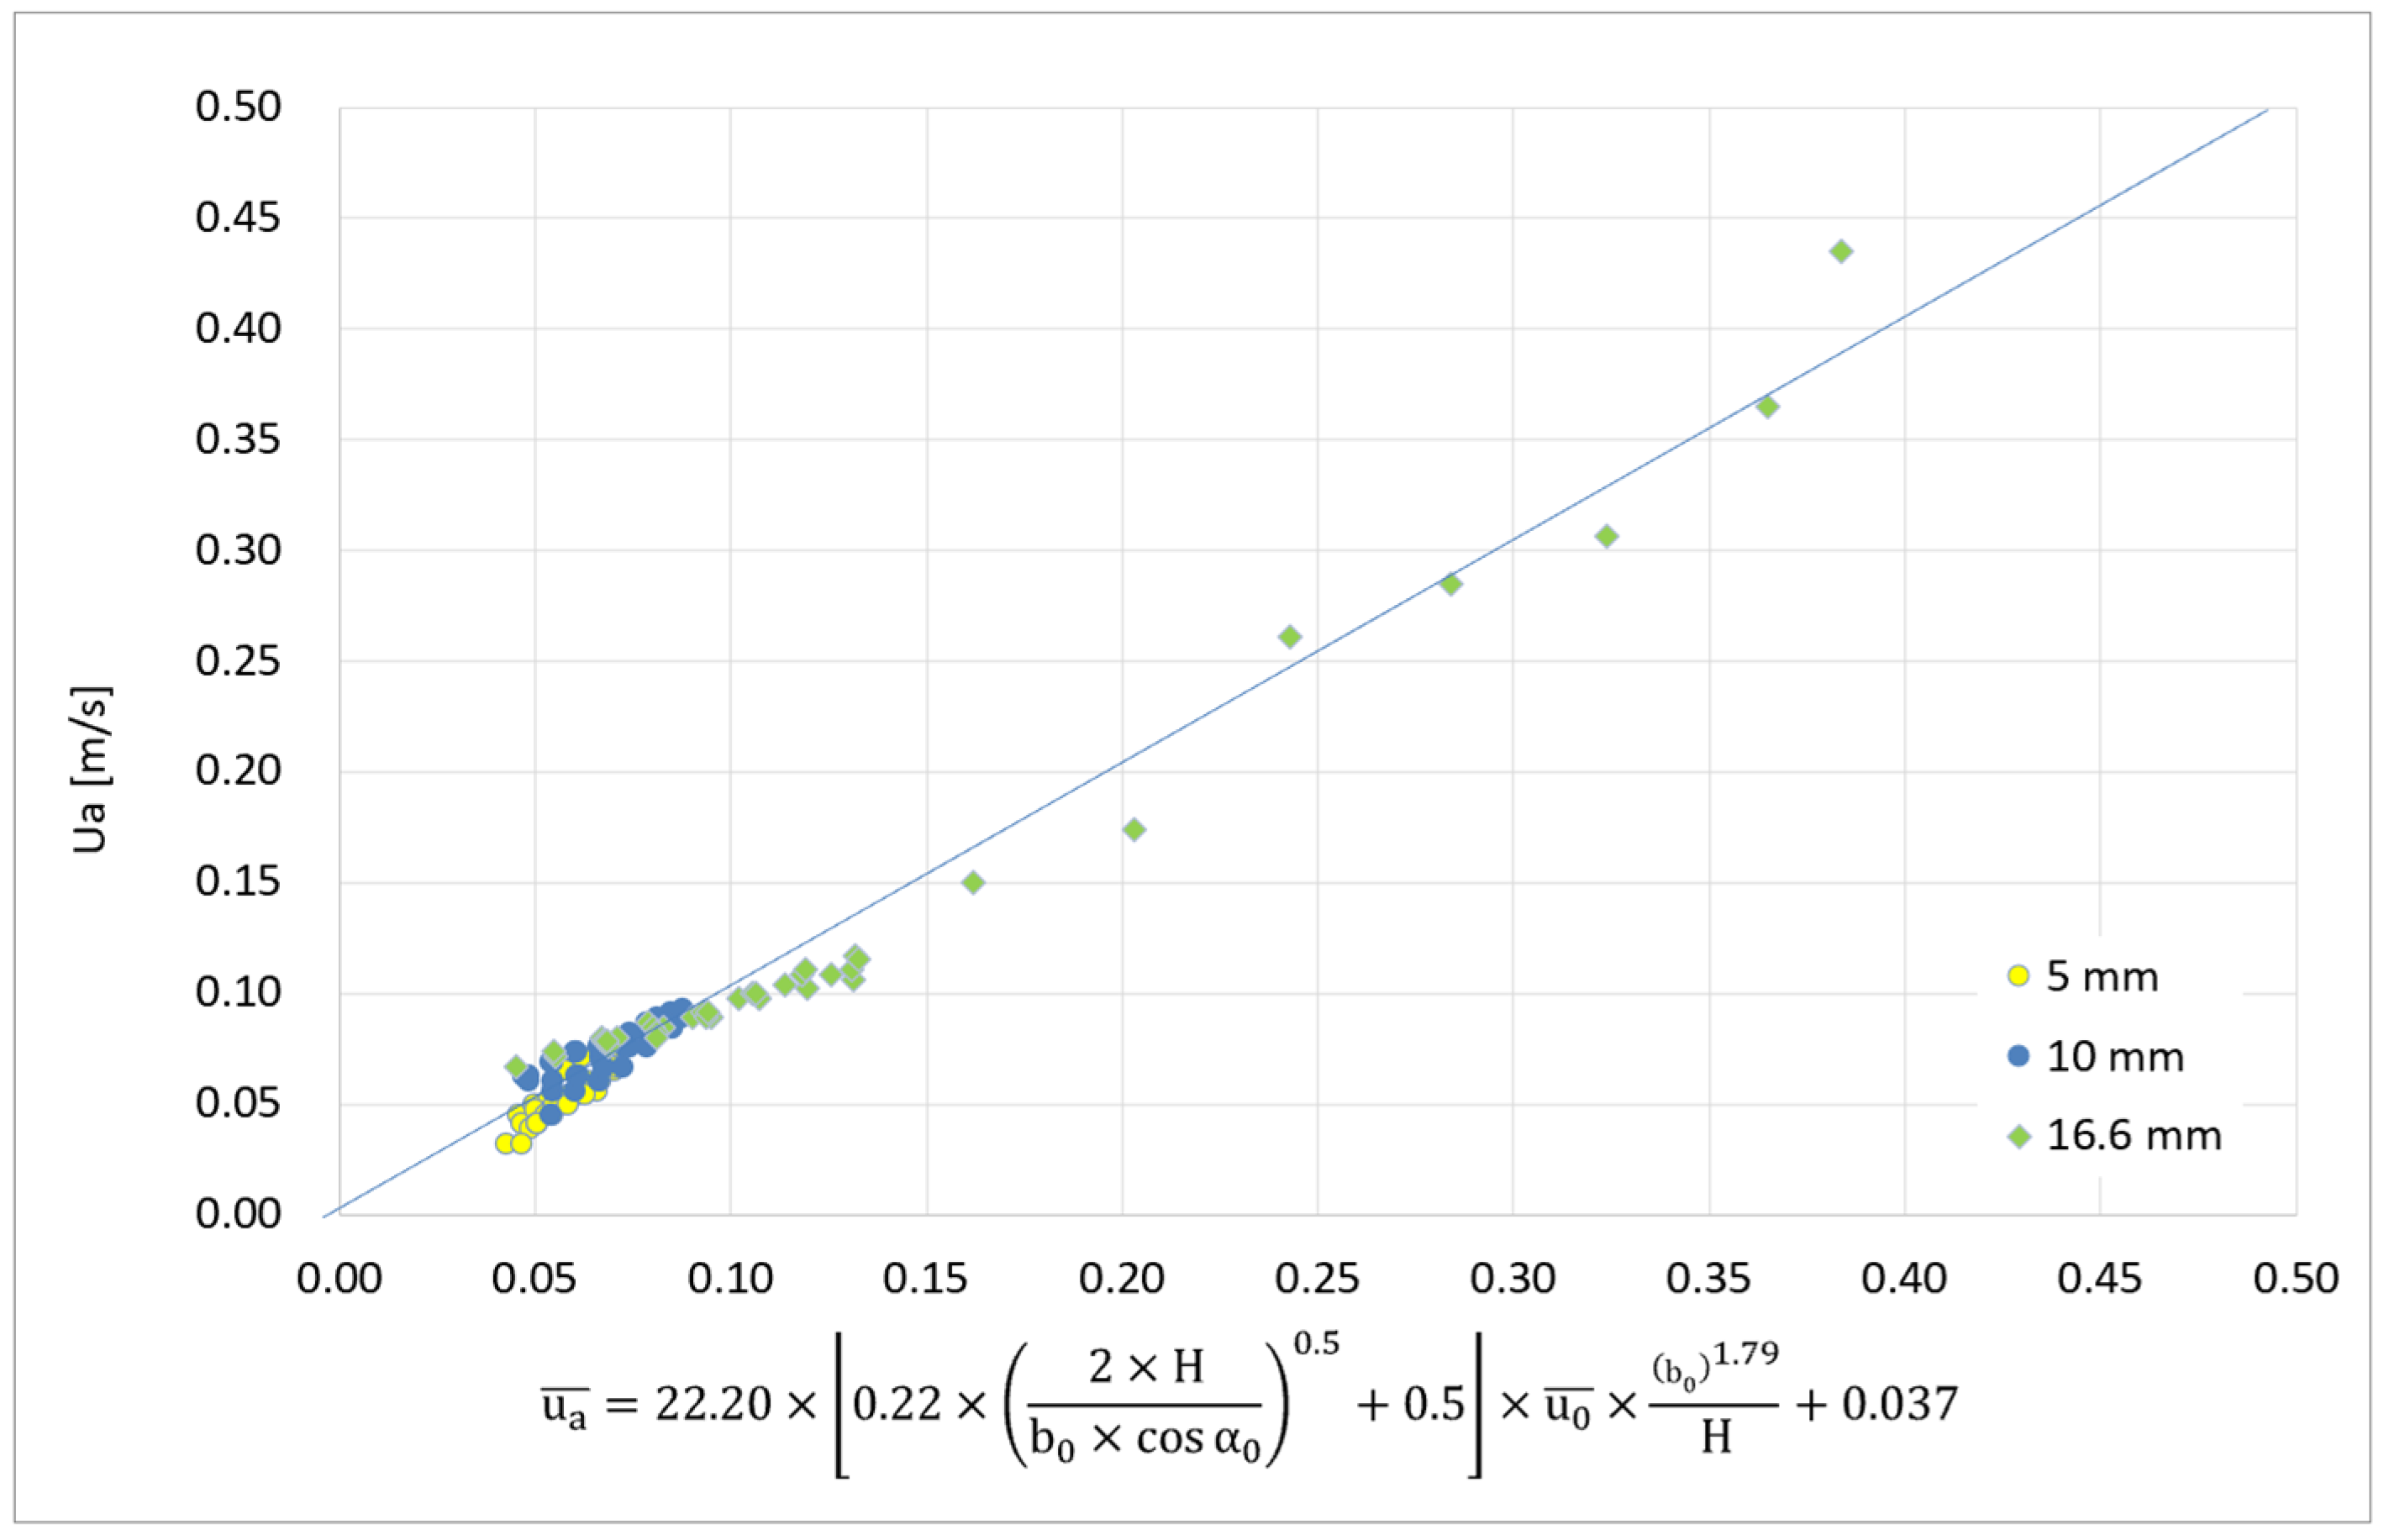
In order to generate an expression closer to the deduced theory (Equation (1)) the values C = 0.5 and D = 0.5 were imposed. The remaining parameters of Equation (3) were adjusted by the least square method, and the results are presented in
Figure 11 (R
2 = 0.967):
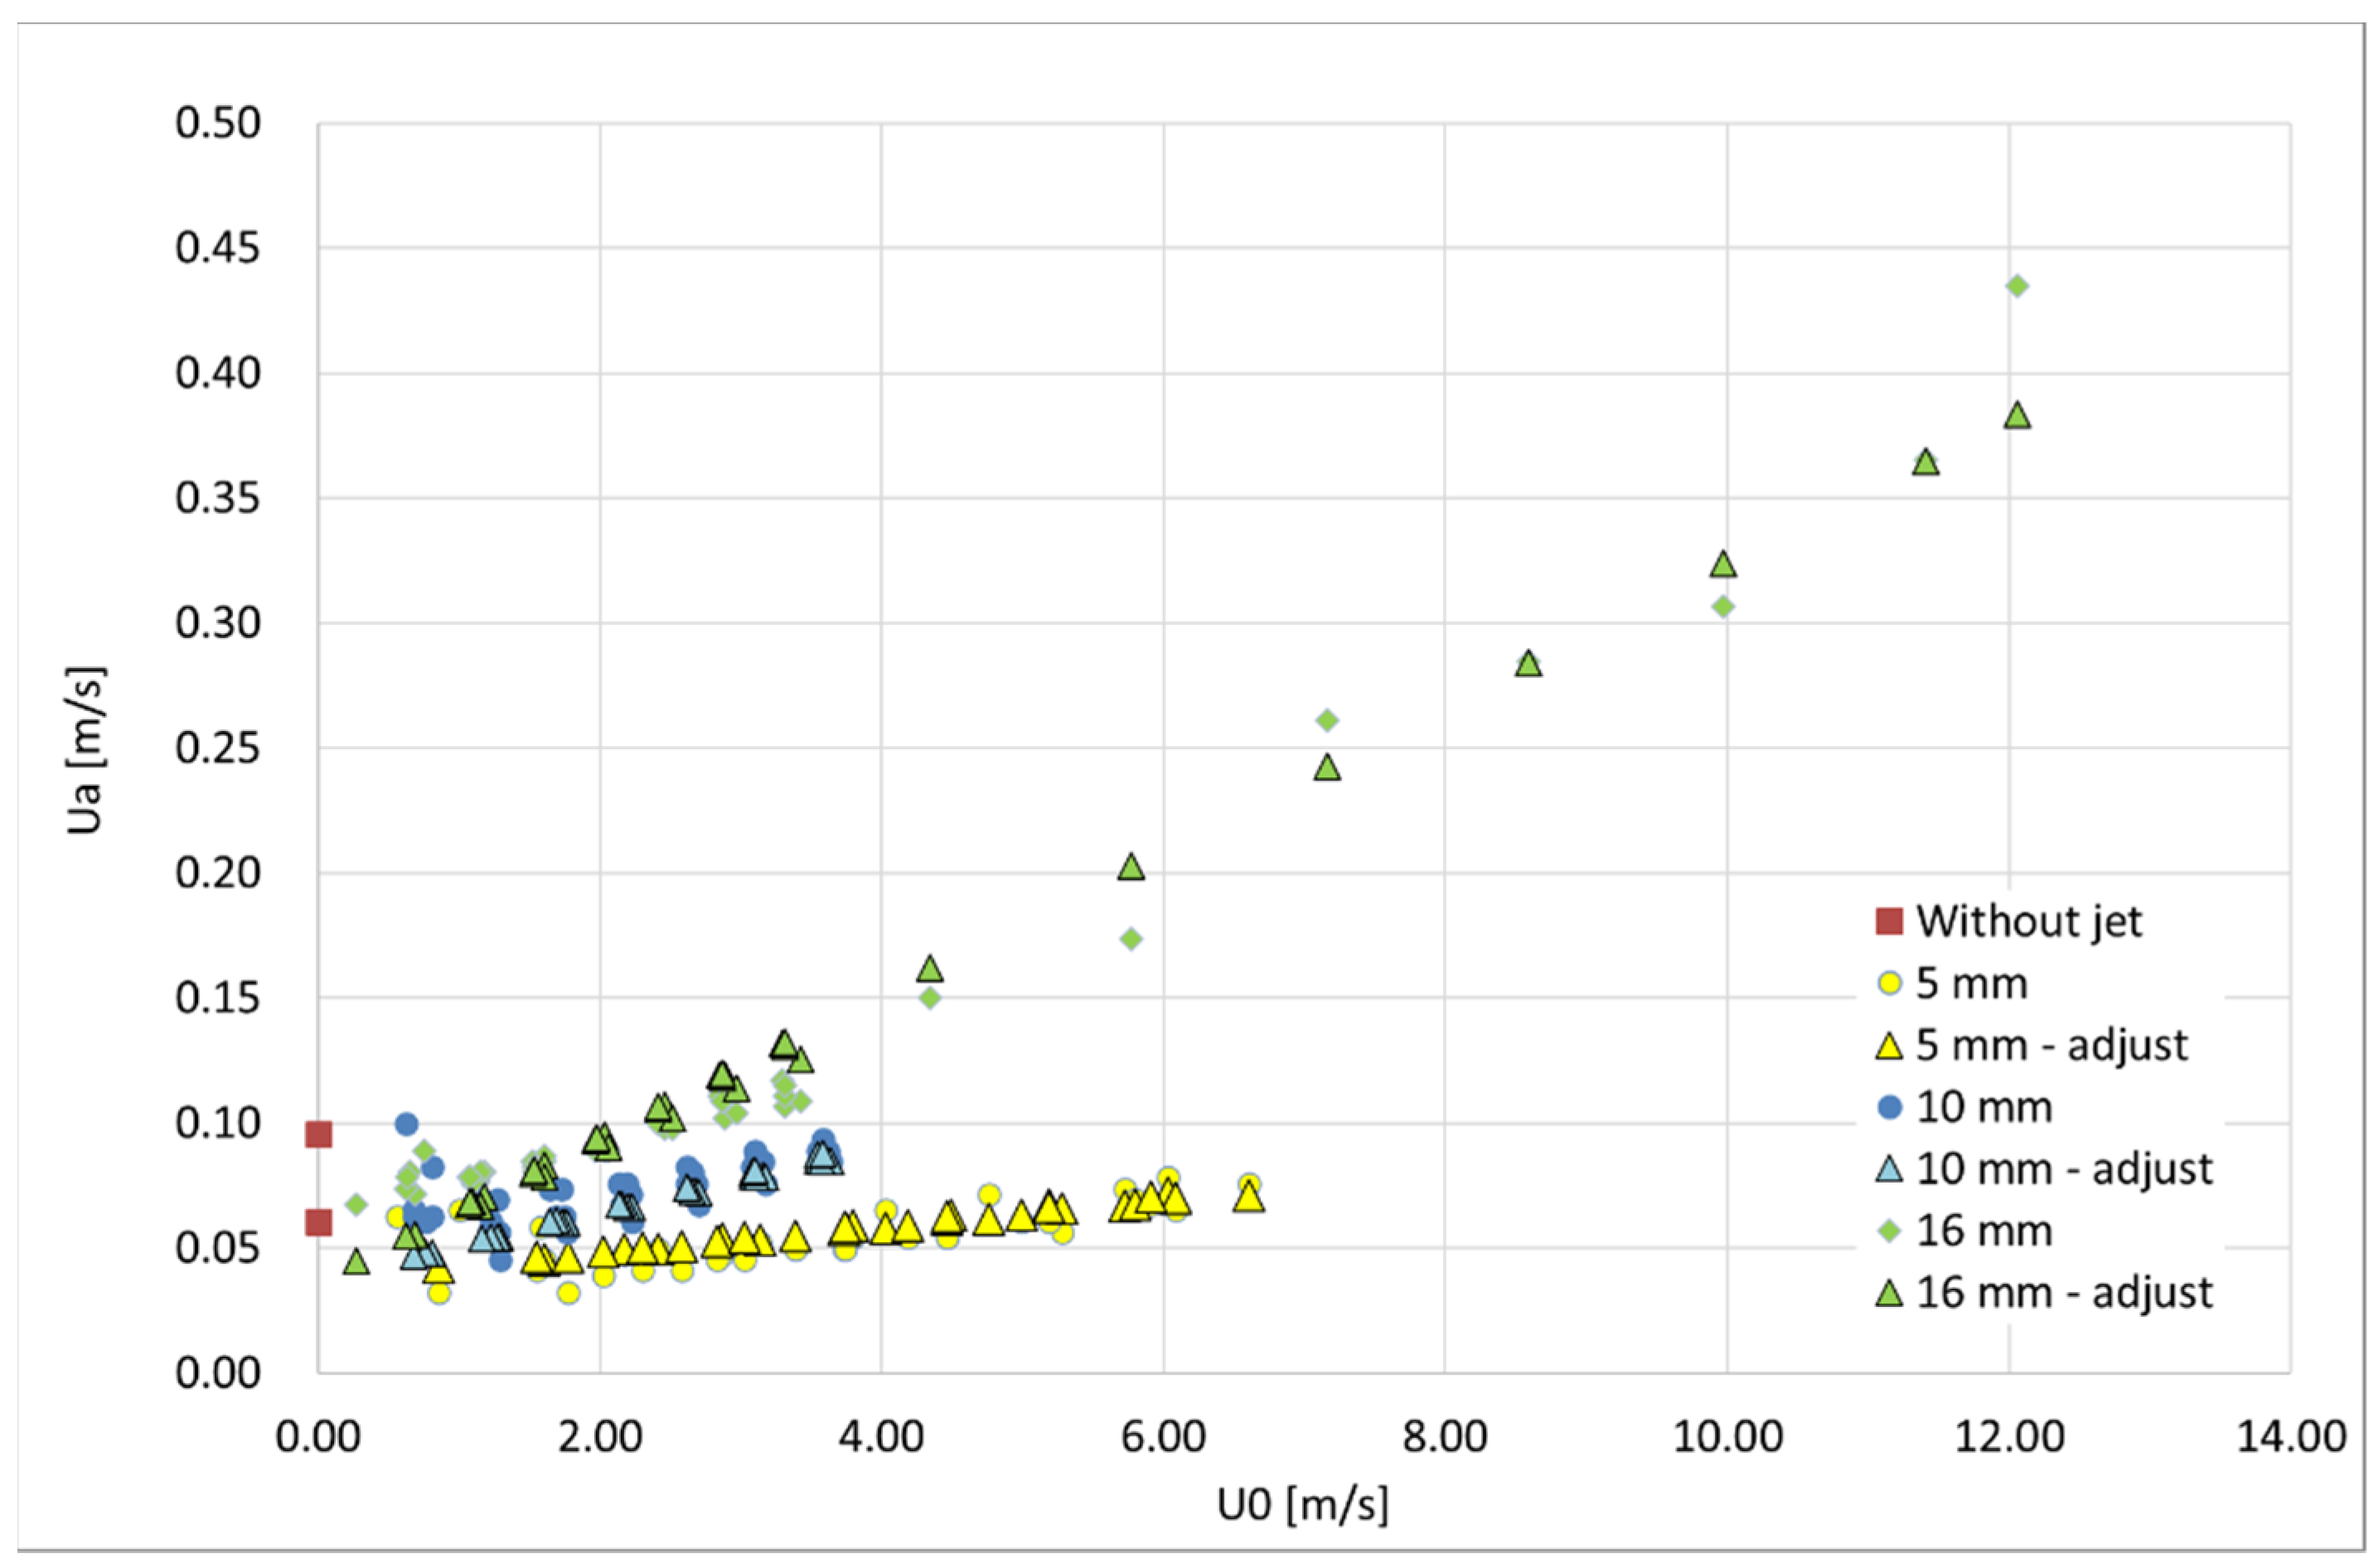
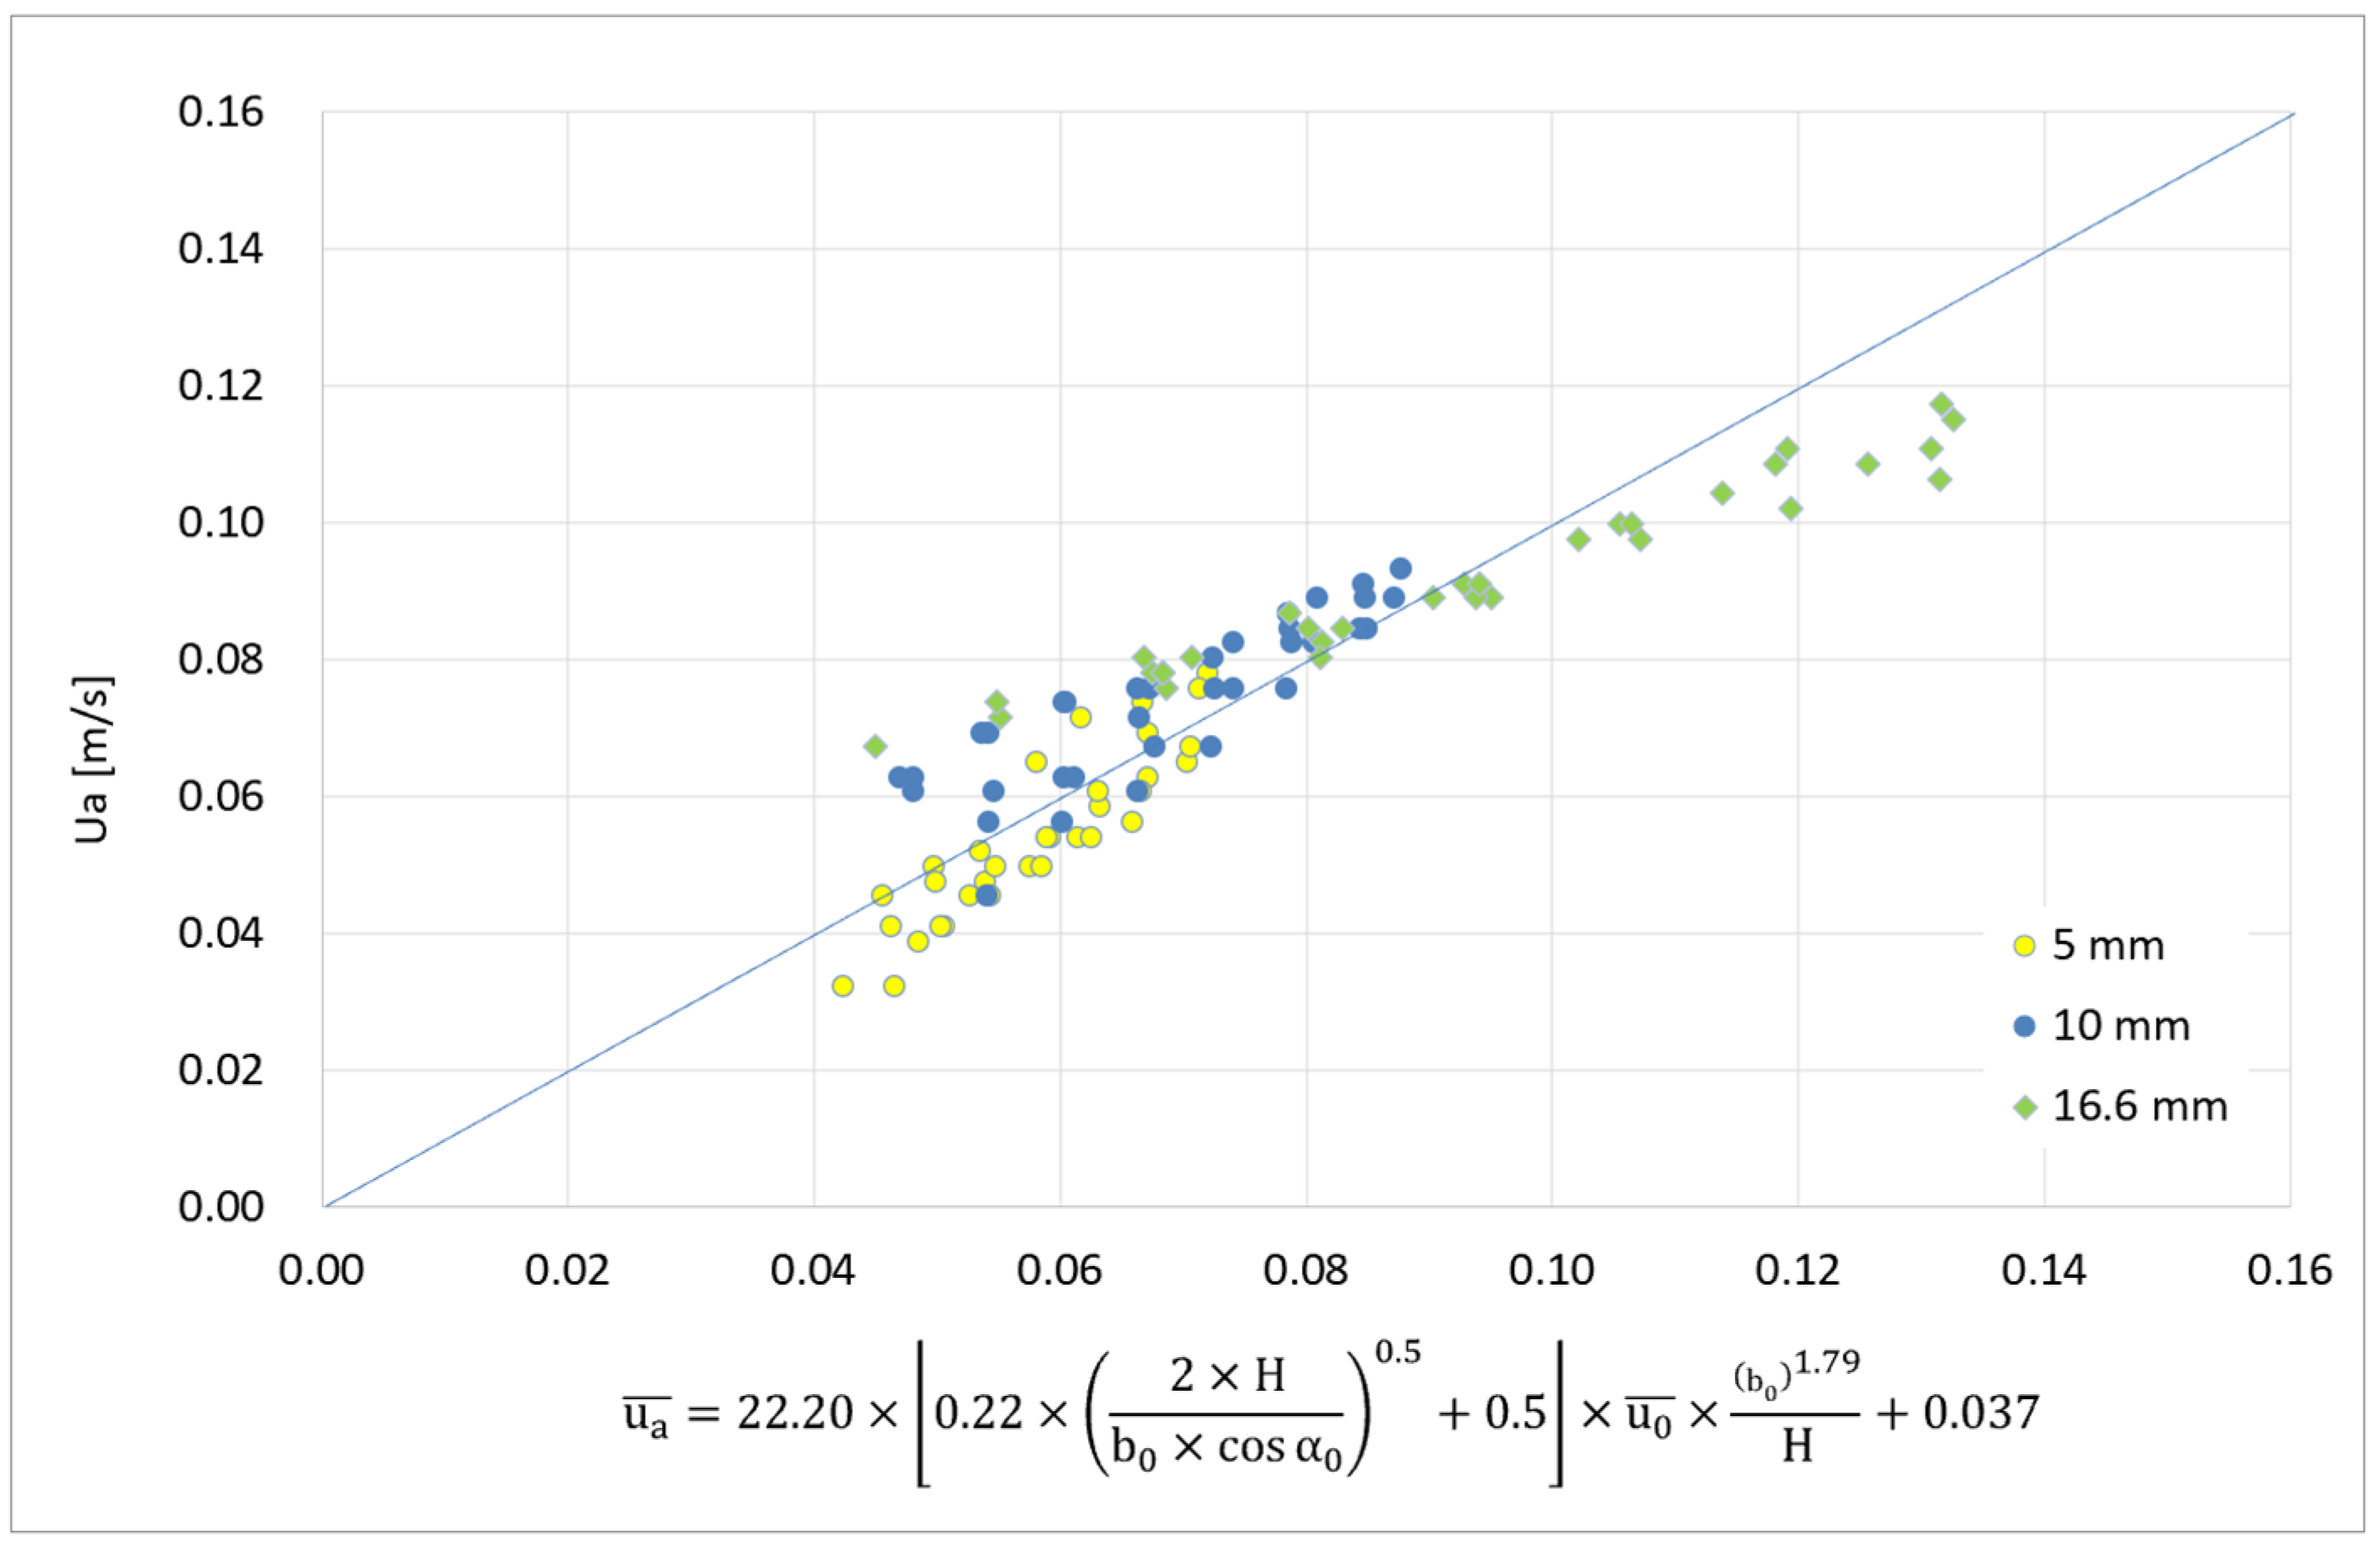
Figure 12 presents a graph with the experimental results, with the average flow velocity at the opening (
) as a function of the jet velocity at the nozzle (
) compared with the predictions obtained with Equation (3).
The sensitivity analysis of Equation (3) to the parameter thickness, , height, h, and angle, , was carried out. The values of the parameters , , and were taken as a reference for the value of .
When
, the value of
is 29% of the reference. When
, the value of
is 82% of the reference. When
, the value of
is 2.5% higher than the reference. These results show that the sensitivity of
to
is very small, which is in accordance with the experimental results (see
Figure 8). The sensitivity of
to the range of thickness values adopted is high, as can be observed in
Figure 12.
5. General Aerodynamic Sealing
The paper [
27] presented the results corresponding to the lowest exhaust flow rate necessary to obtain the aerodynamic sealing (assessed visually) in full-size isothermal tests for the jet nozzle thickness of 16.2 mm, for the jet angle varying from 22.5° and 30° and for Reynolds numbers in the range of 6500 to 19,400. That paper also presented test results where particulate matter sensors had been positioned inside and outside the compartment to assess the particulate matter concentration inside and outside. The ratio between outside and inside concentration was analysed to assess the aerodynamic sealing of the air curtain. In those experiments, different extract flow rates were used to obtain variable aerodynamic sealing. For every set of tests (with the same angle, the same thickness and the same velocity), only the results of the test with the lowest exhaust flow rate for the best aerodynamic sealing were considered. In the final presentation of the test results, the average velocity through the door replaced the exhaust flow rate. This replacement was made to present the results using only local quantities directly influencing the flow at the door protected by the air curtain. This set of results is reproduced in
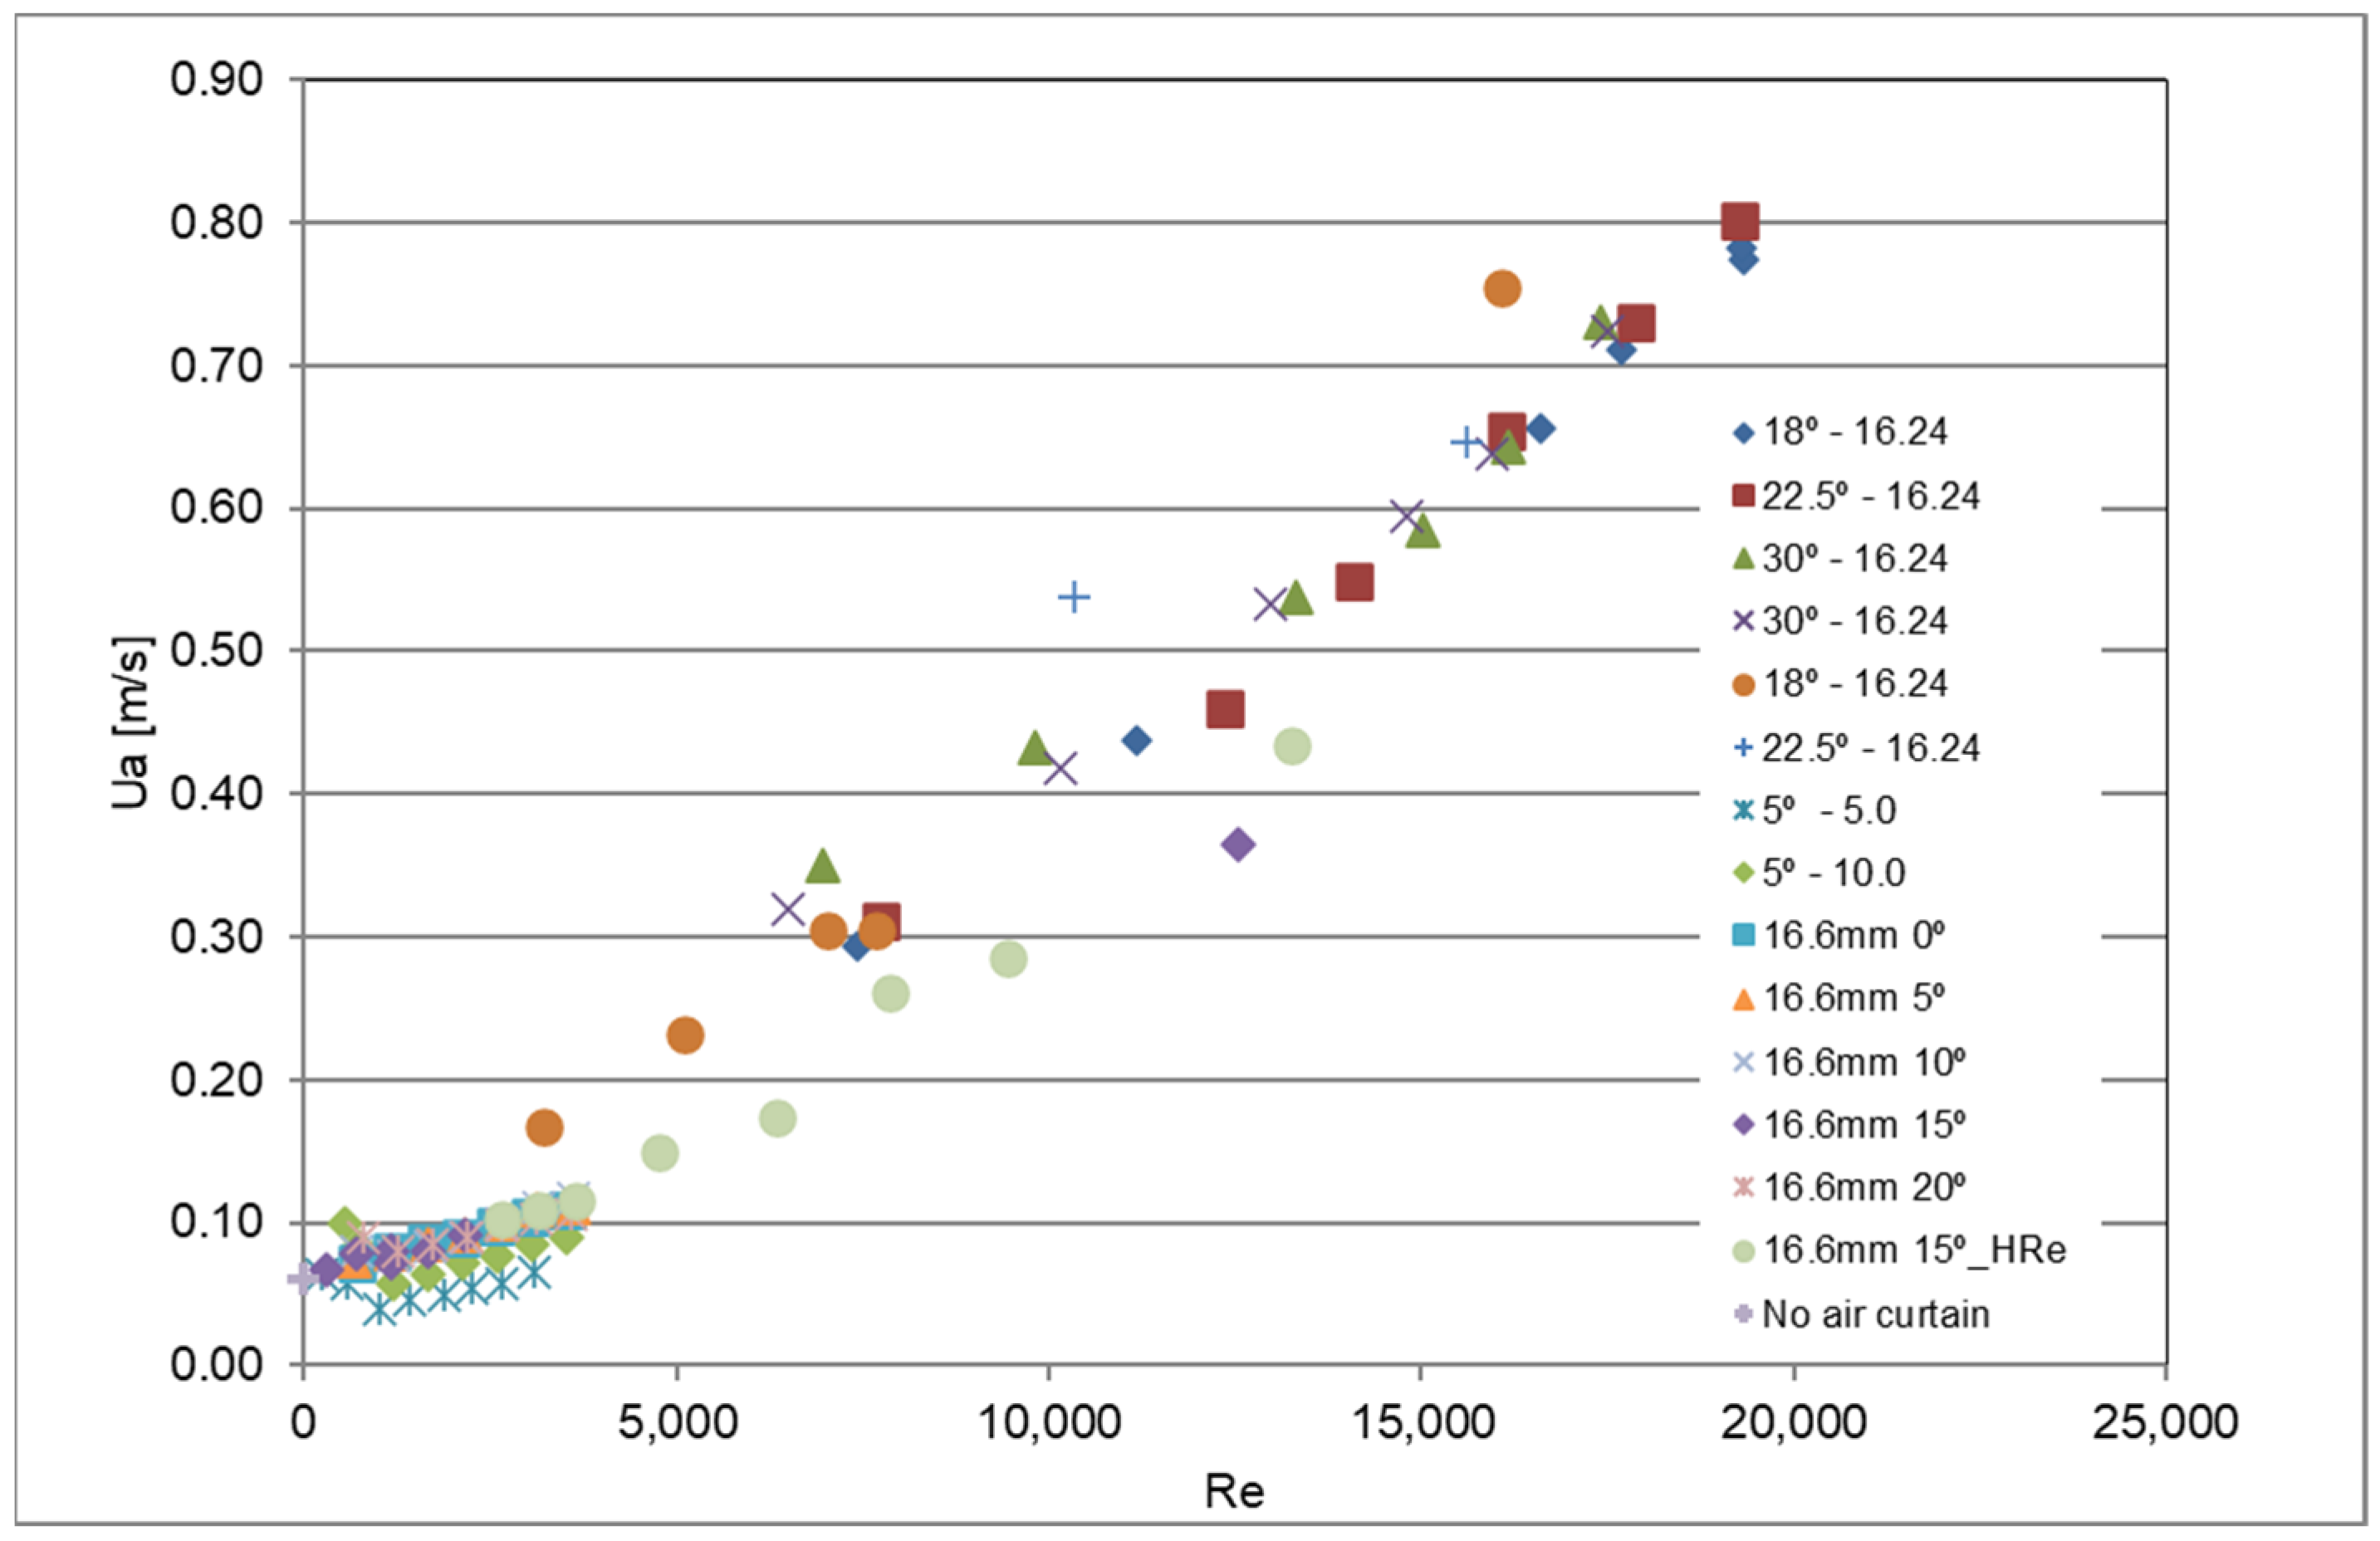
Figure 13, together with the test results presented previously in this paper for the thickness of 16.6 mm and jet angle ranging from 0° to 20°.
It is found that:
The most recent results (jet nozzle thickness of 16.6 mm) differ slightly from previous results.
This divergence is due to the isolation of the exhaust from the (outside) wind action, which reduced disturbances in the door and allowed aerodynamic sealing for lower average door velocity.
This divergence does not preclude the finding that the results are aligned along a straight line, except for low Reynolds numbers.
In
Figure 14 and
Figure 15, the same set of results presented in
Figure 13 are shown, except that the results obtained for 18° and 22.5° (both for the jet thickness of 16.2), as well as the result for the case where the exhaust fan was inactive, are significantly above the line. The results obtained for low Reynolds numbers (Re < 3820) present a different behaviour, as shown in
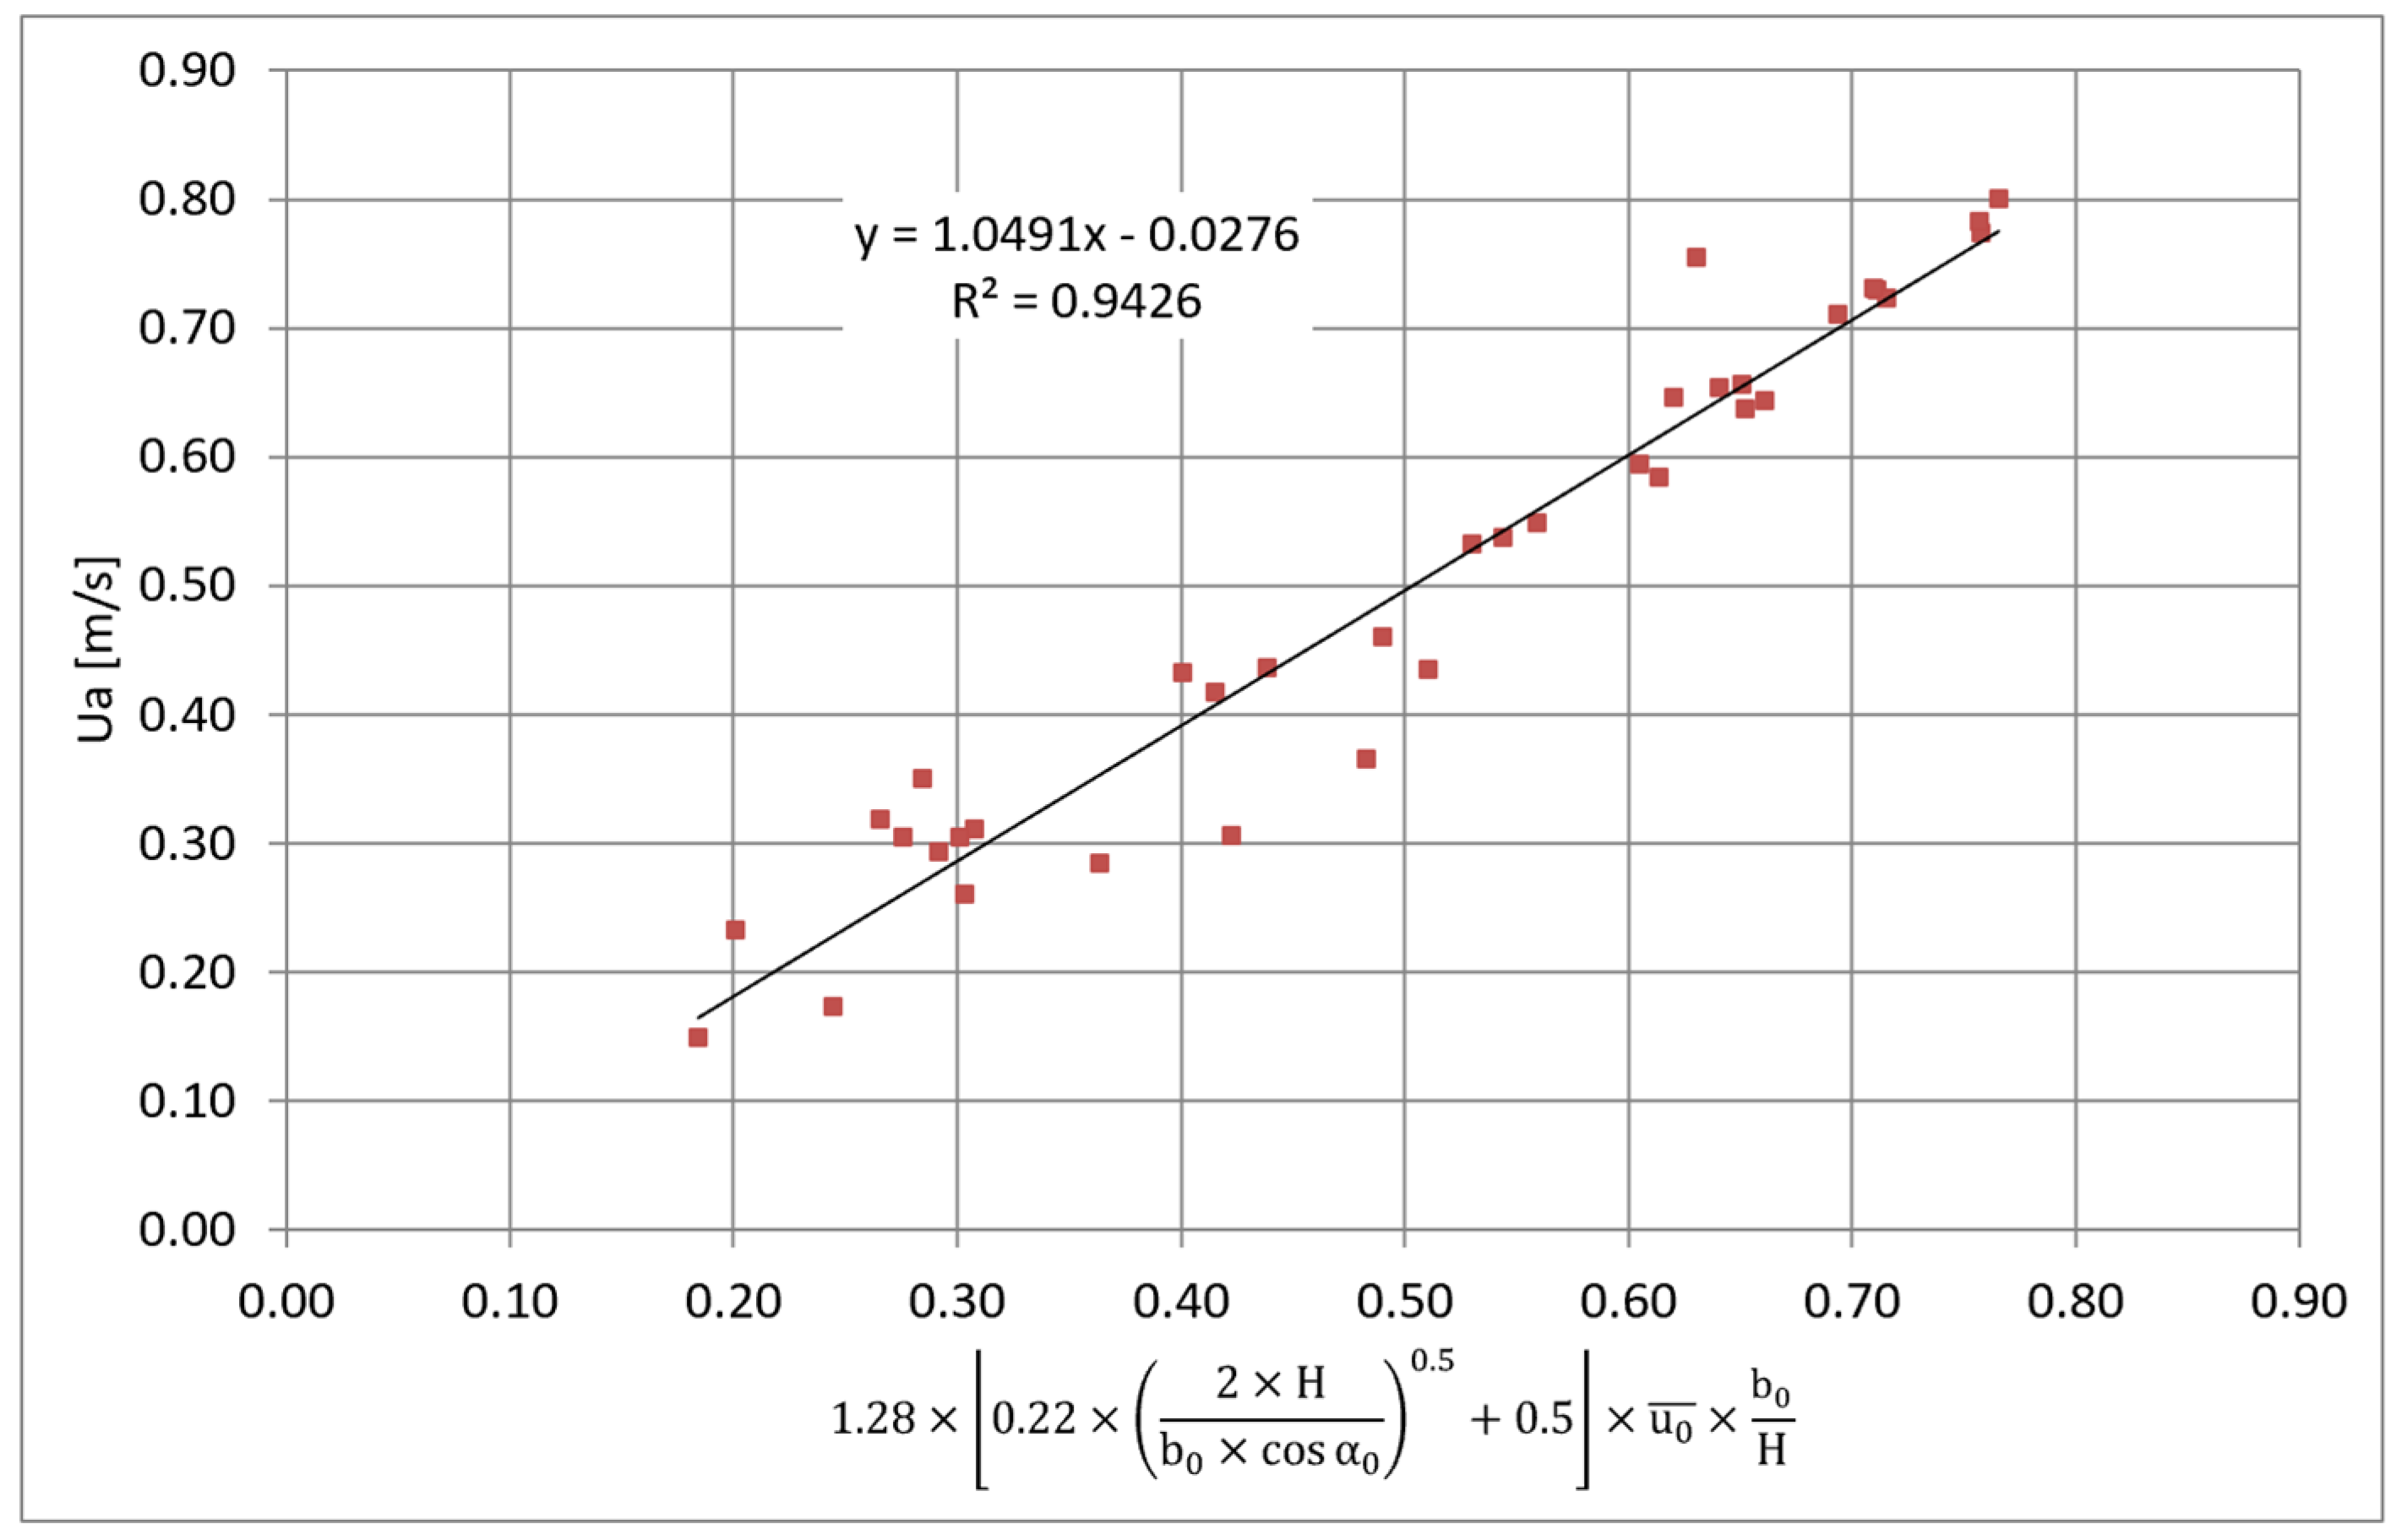
Figure 13. Therefore, we will use different functions for Reynolds numbers above and below 3820. The best fit for the results corresponding to a Reynolds number above 3820 is presented in
Figure 14, showing that R
2 = 0.94. The corresponding equation is (4):
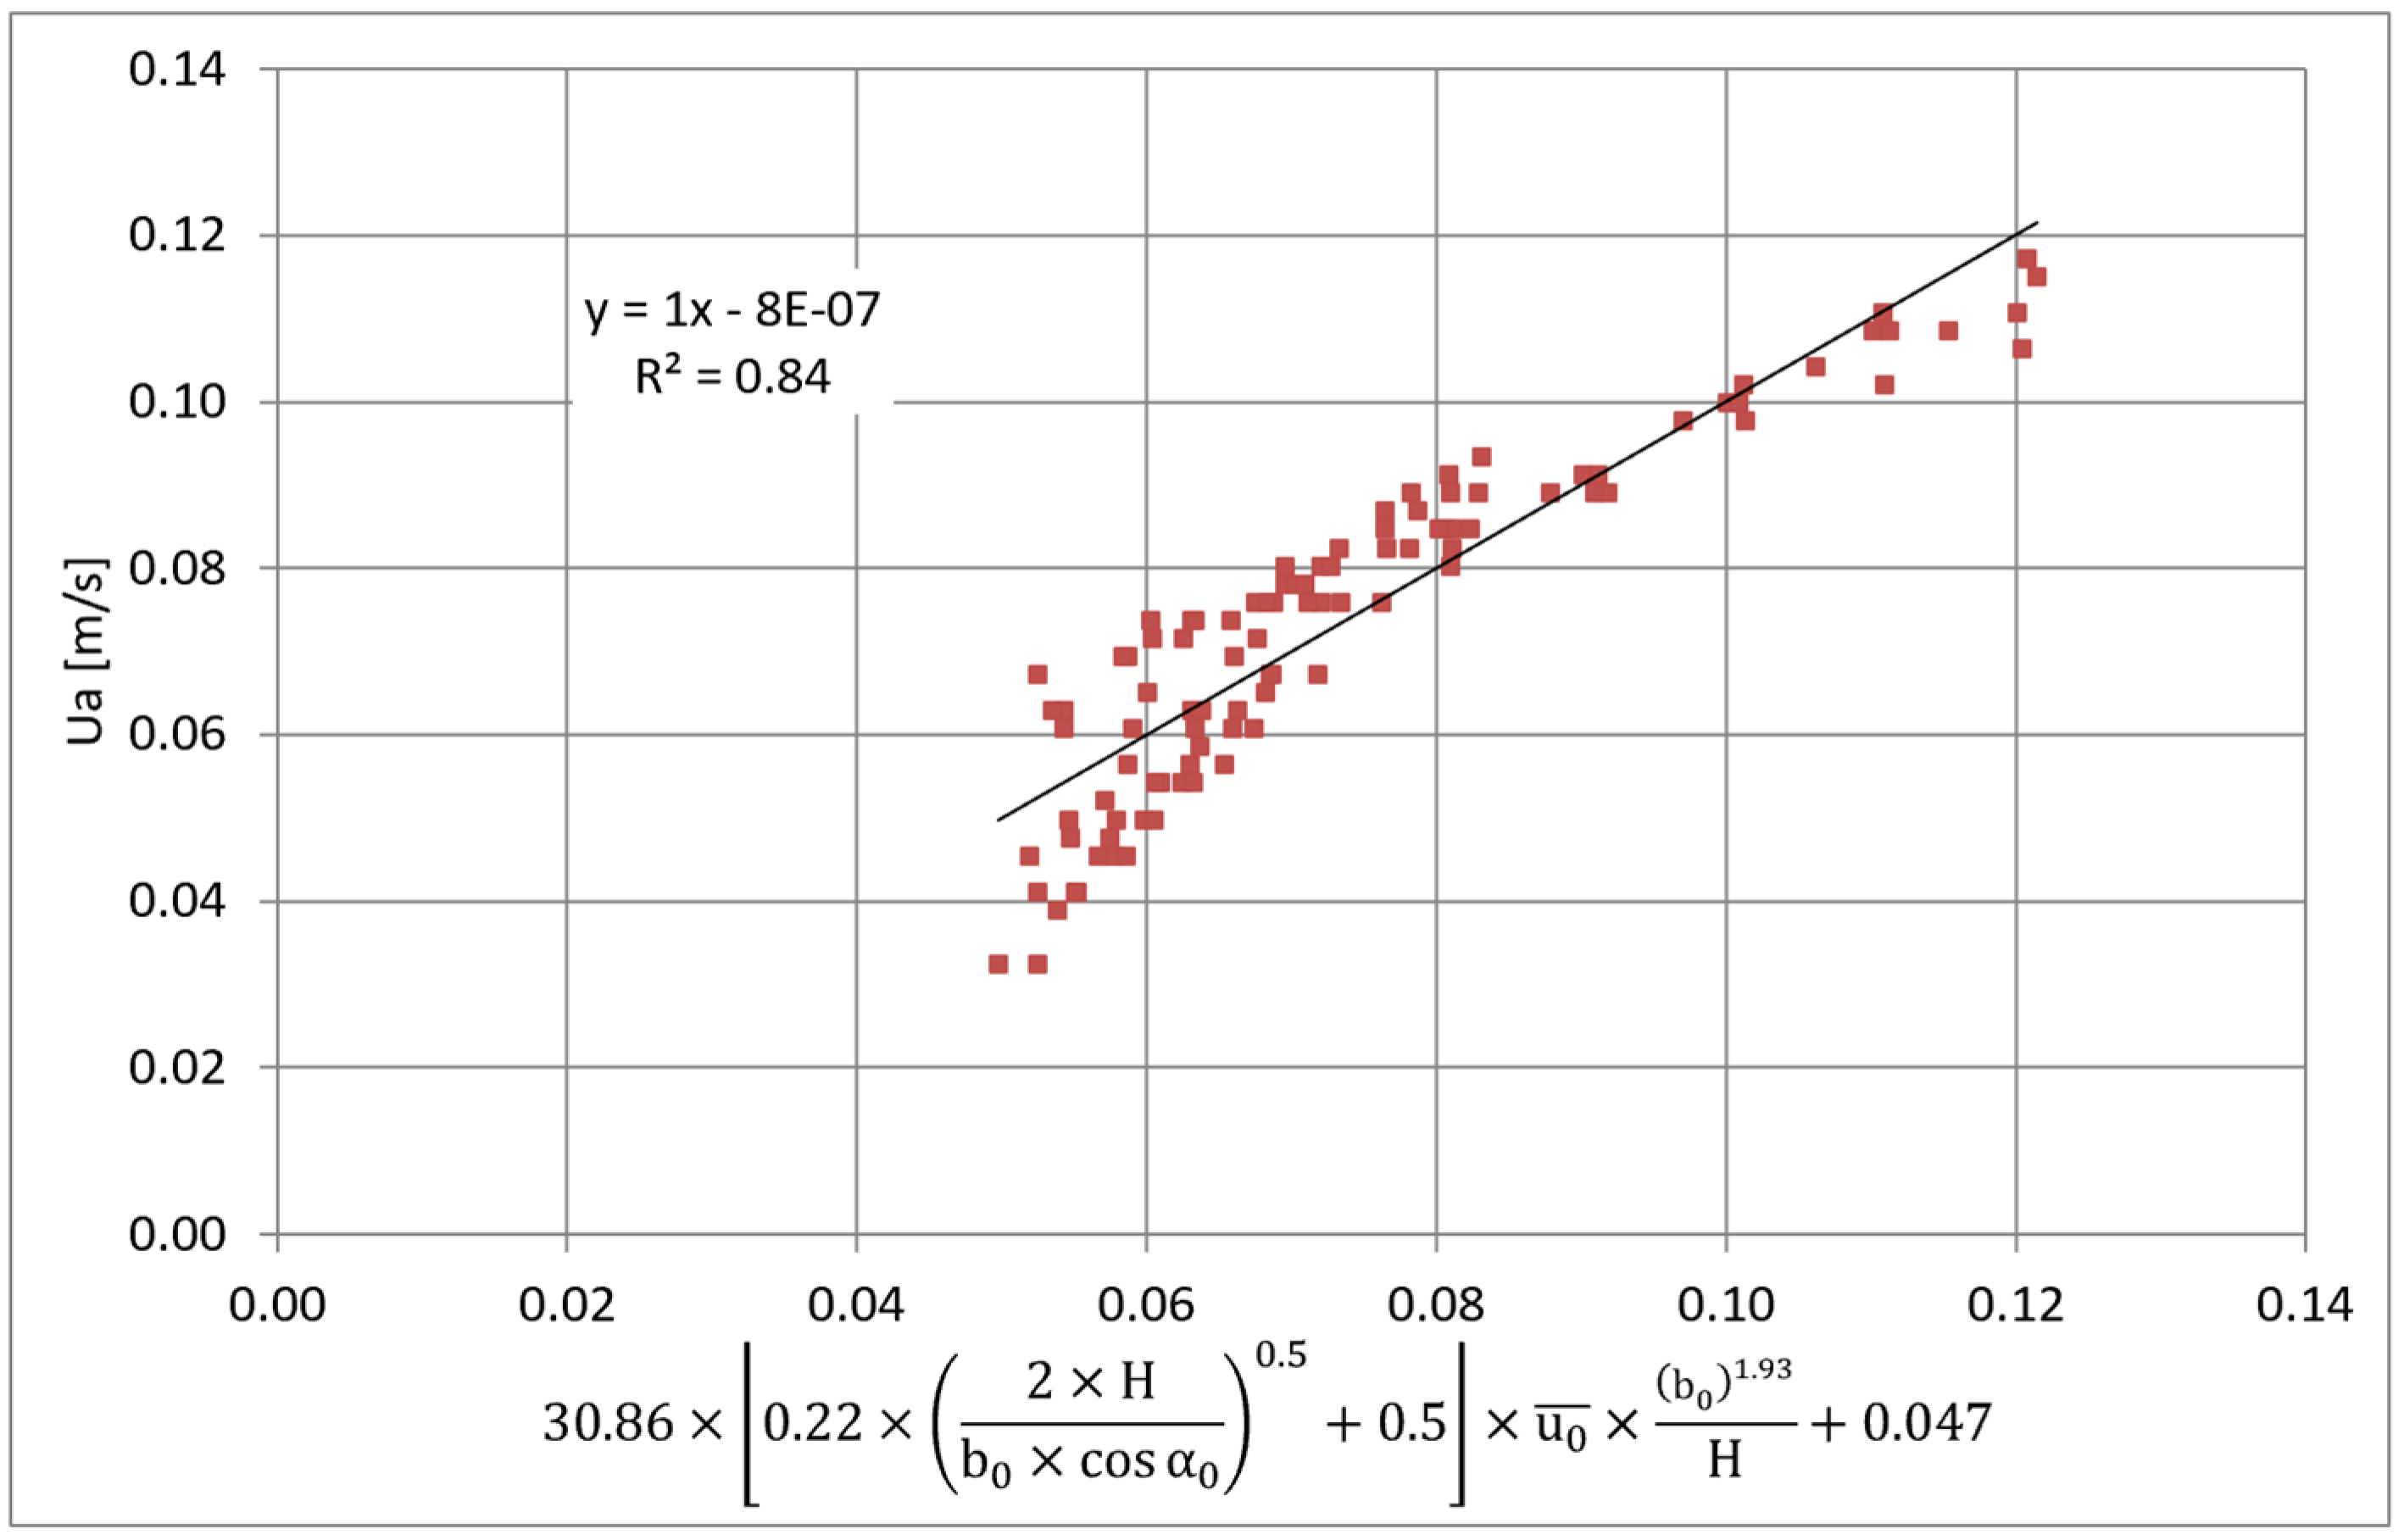
The best fit for the results corresponding to the Reynolds numbers below 3820 is presented in
Figure 15, showing that R
2 = 0.83 (this lower value is due to the inclusion of the test results obtained without the external wind effect). The corresponding equation is (5).
Finally,
Figure 16 shows the comparison of the predictions carried out with Equations (4) and (5) with the test results.
Using previous small-scale saltwater test results [
4], the average velocity of the flow through the door,
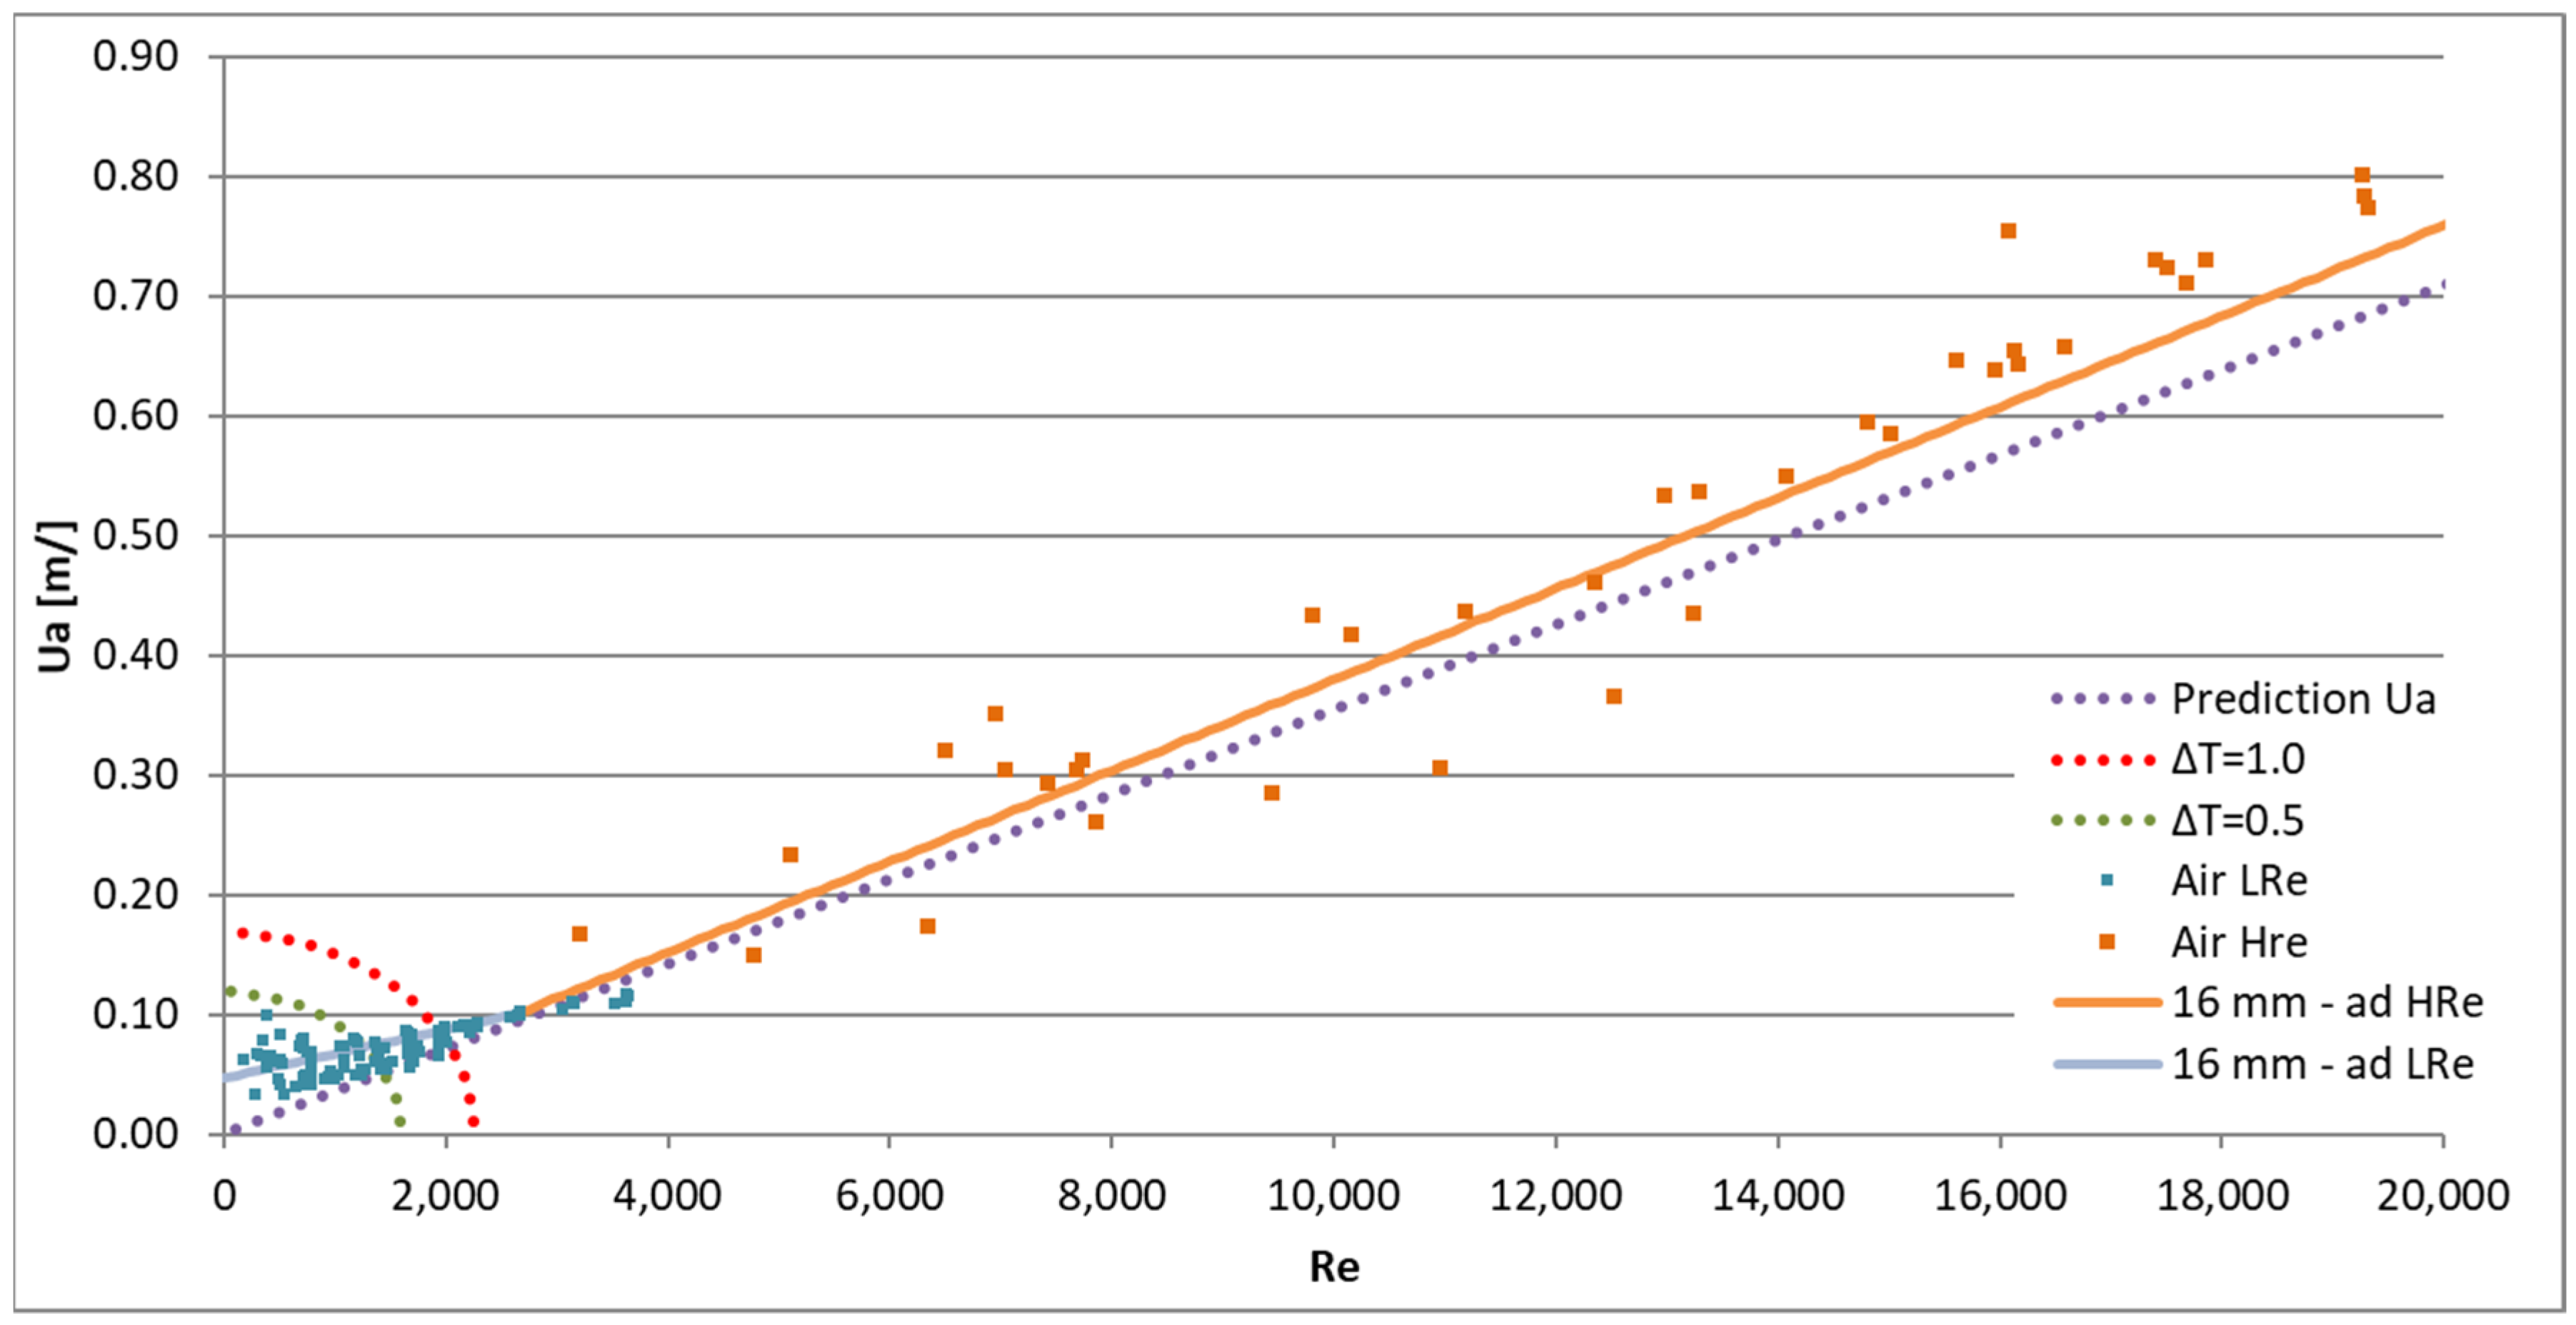
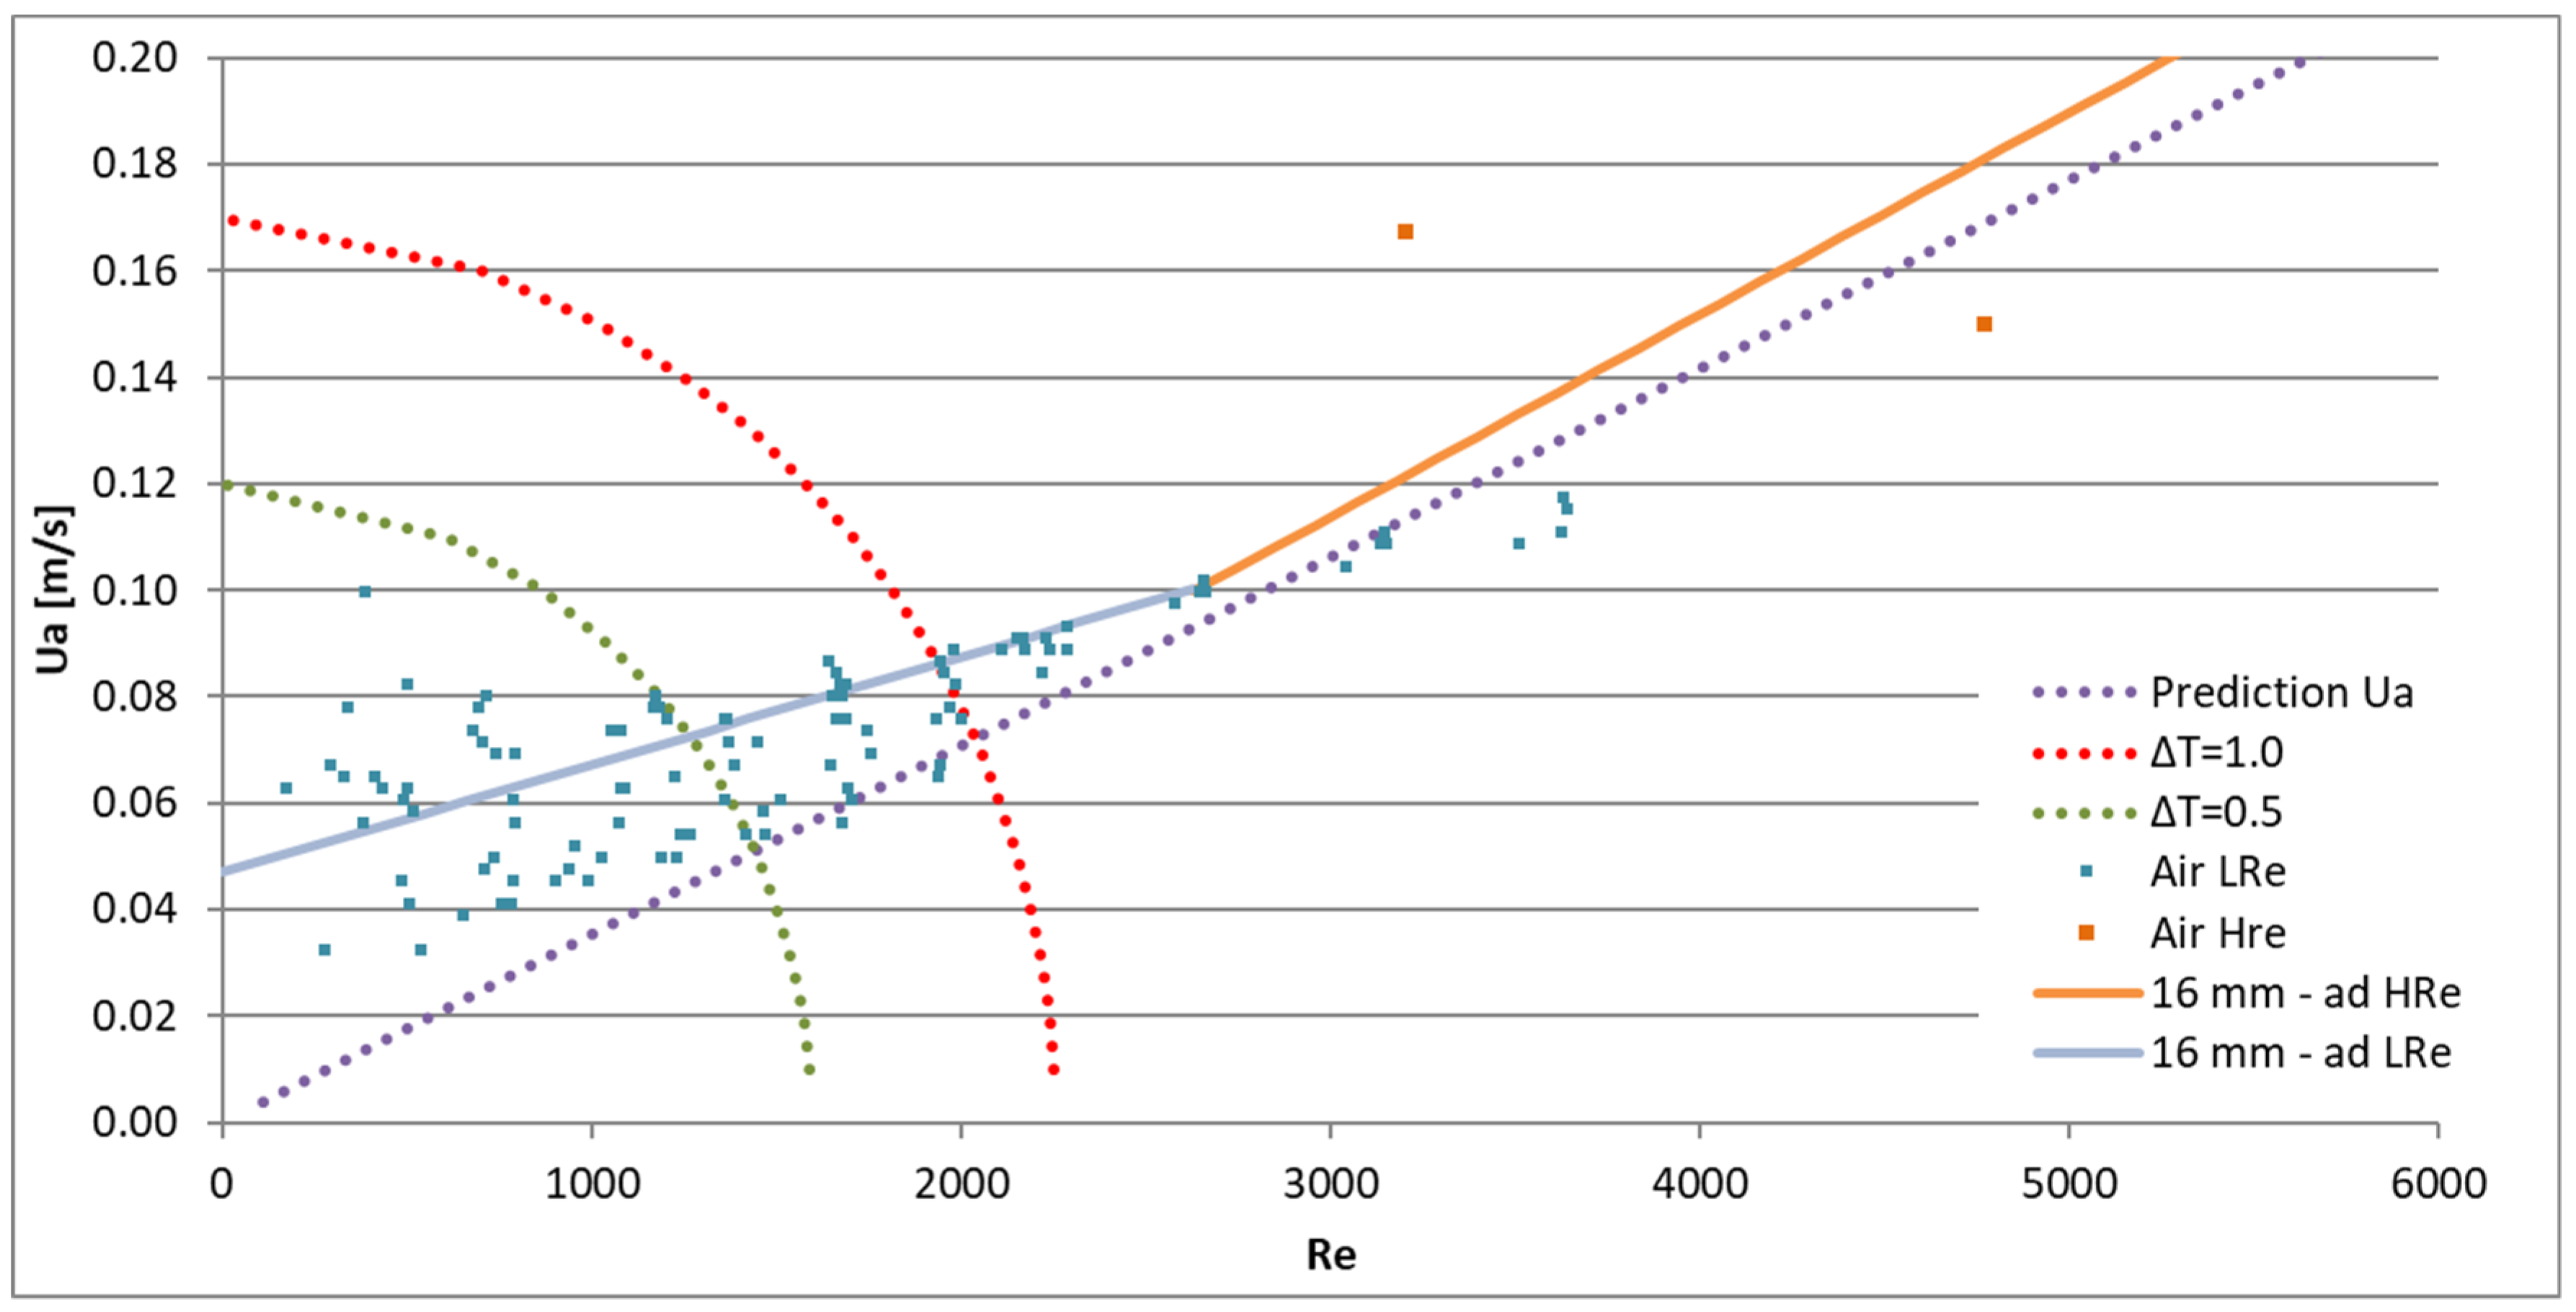
, which is necessary to avoid contaminant transport through the plane jet, was related to the plane jet characteristics by Equation (6). Although the effect of buoyancy was important in these tests, the behaviour shown by Equation (6) only corresponds to the intrinsic characteristics of the jet, as presented in Equation (1) and subsequent equations. The comparison of the curves obtained with Equations (4) (named “16 mm—ad HRe” in the figure), (5) (named “16 mm—ad LRe” in the figure) and (6) (named “Prediction Ua” in the figure) is presented in
Figure 17 [
26], together with the test results.
Figure 17 confirms that the curves of Equations (4) and (6) show a similar trend.
A previous research project [
29] analysed the possibility of using air curtains to prevent smoke flow from fire compartments. Full-size experiments were developed, and several conditions were tested to assess aerodynamic sealing (smoke-tightness). The smoke temperature during the tests ranged from 182 °C to 351 °C, the angle measured between the curtain plane and the vertical plane ranged from 18° to 26°, the nozzle thickness ranged from 17 mm to 45 mm and the velocity at the nozzle ranged from 8.3 m/s to 19.9 m/s. During the tests, the air curtain’s nozzle was positioned as in the tests reported in this paper (horizontally at the top outside edge of a permanent opening, generating an approximately vertical downward jet through the opening). It was concluded that it is possible to achieve an aerodynamic sealing (smoke-tightness), provided that the adequate plane jet parameters and the compartment’s smoke exhaust were correctly adjusted. According to this analysis, the smoke-tightness lower limit corresponds to equation
(with
), which allows relating the smoke exhaust flow rate to the nozzle air curtain velocity (see Equation (8)).
Equation (7) has the same physical meaning as that presented for Equations (6) and (8) and expresses the pressure balance at the door (the balance of the dynamic pressure of the jet, the dynamic pressure of the average velocity at the door and the smoke pressure). The aerodynamic sealing at the door should respect the two physical restrictions arising from these equations. and are, respectively, the absolute temperatures outside and inside the compartment. The variable g is the gravity acceleration.
Considering the definition of Equation (7), it is clear that Equation (6), obtained for saltwater, expresses the same physical process, being . It is now clear that the results obtained for small-scale modelling can be used in a full-size prototype.
Equation (6) shows a development compatible with Equations (4) and (5) (but the dependence of on is not the same). Nonetheless, Equations (4) and (5) require a higher flow rate through the door to reach the aerodynamic sealing of the curtain than the one predicted by Equation (6). It is important to note that, even under such different test conditions (with or without buoyancy), a similar trend can be observed.
We also admit that the analytical model [
29], obtained for high temperature differences (fire smoke control case), is still valid for low temperatures. According to that model, if
, it will be possible to obtain
. Furthermore, Equation (8) can be expressed in terms of the Reynolds number, as shown in Equation (9).
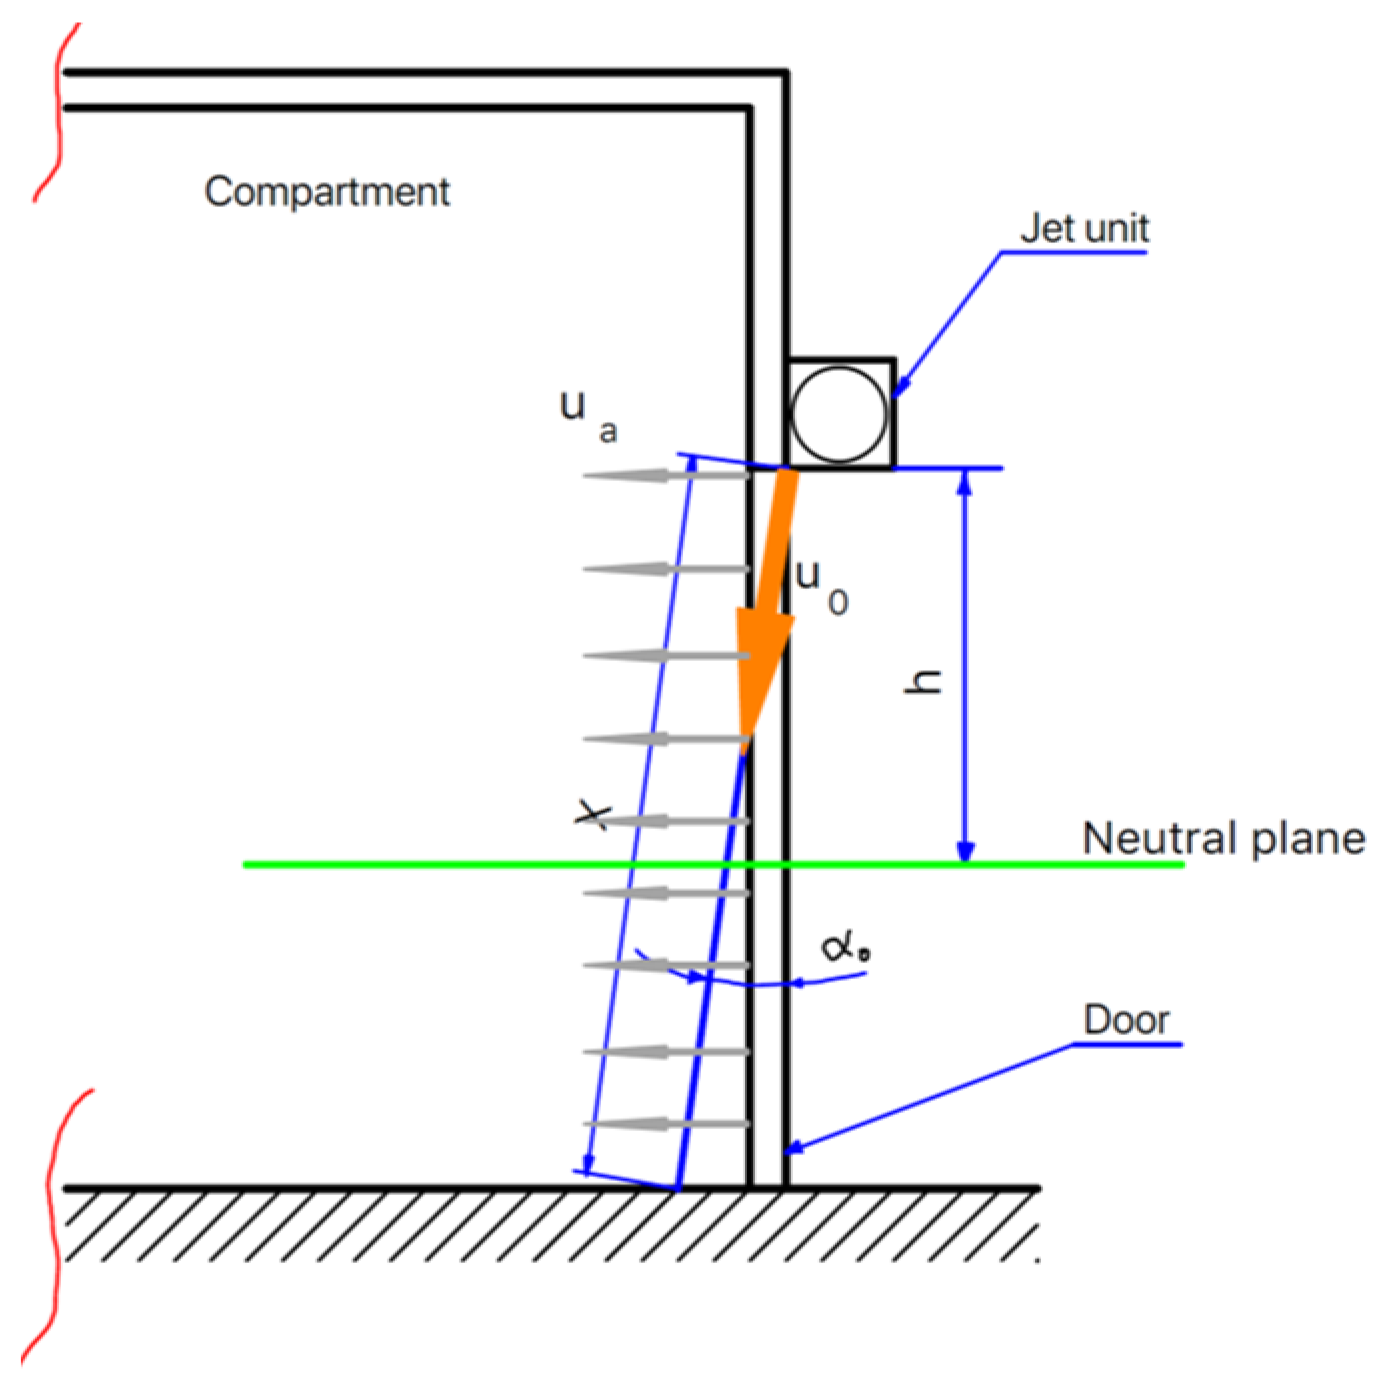
Figure 17 also includes Equation (9), applied for temperature differences of 1.0 K and 0.5 K. The dotted straight line (“Prediction Ua”) corresponds to Equation (6); this line corresponds to the contaminant tightness, which depends on the turbulent behaviour of the air curtain (which also occurs for the isothermal flow). Above this line, the exhaust flow rate is supercritical, and then an aerodynamic sealing (contaminant tightness) is obtained. The curved dotted lines (the temperature difference between the exterior and the interior of the compartment) represent the limit of the aerodynamic sealing when a temperature difference exists (Equation (9)); in the direction of the graphic origin, the buoyancy flow is too strong and there is no aerodynamic sealing (loss of contaminant tightness). Equation (9) is presented in the graph for the case of
and h = 0.66 m (the predicted location of the neutral plane below the door soffit; the door being 2 m high, see
Figure 3). This condition must be considered together with the condition due to the turbulent behaviour of the air curtain (also occurring for the isothermal flow) (Equation (6)). Therefore, it must be assumed that only the zone above the dotted line is relevant. The figure shows that, when there is a disturbance due to different temperatures inside and outside the compartment, the adoption of an air curtain allows the reduction of the average velocity through the door (
).
Figure 17 clearly shows that, only for the isothermal flow, it is possible to avoid the contaminant transport through the opening by imposing a very low exhaust flow rate in the “contaminated” compartment (
= 0.047 m/s, from Equation (5)). Even for a very small temperature difference (e.g., ΔT =
= 0.5), the required exhaust flow rate in the “contaminated” compartment is higher with the air curtain inactive than with the air curtain active. The inflection exhibited by the test results (for Re between 800 and 1800), with the average door flow velocity (
) values being higher for lower Reynolds numbers (see
Figure 6 and
Figure 7), is consistent with the possibility that the aerodynamic sealing during these tests had been influenced by a small temperature difference between the inside and the outside of the test compartment.
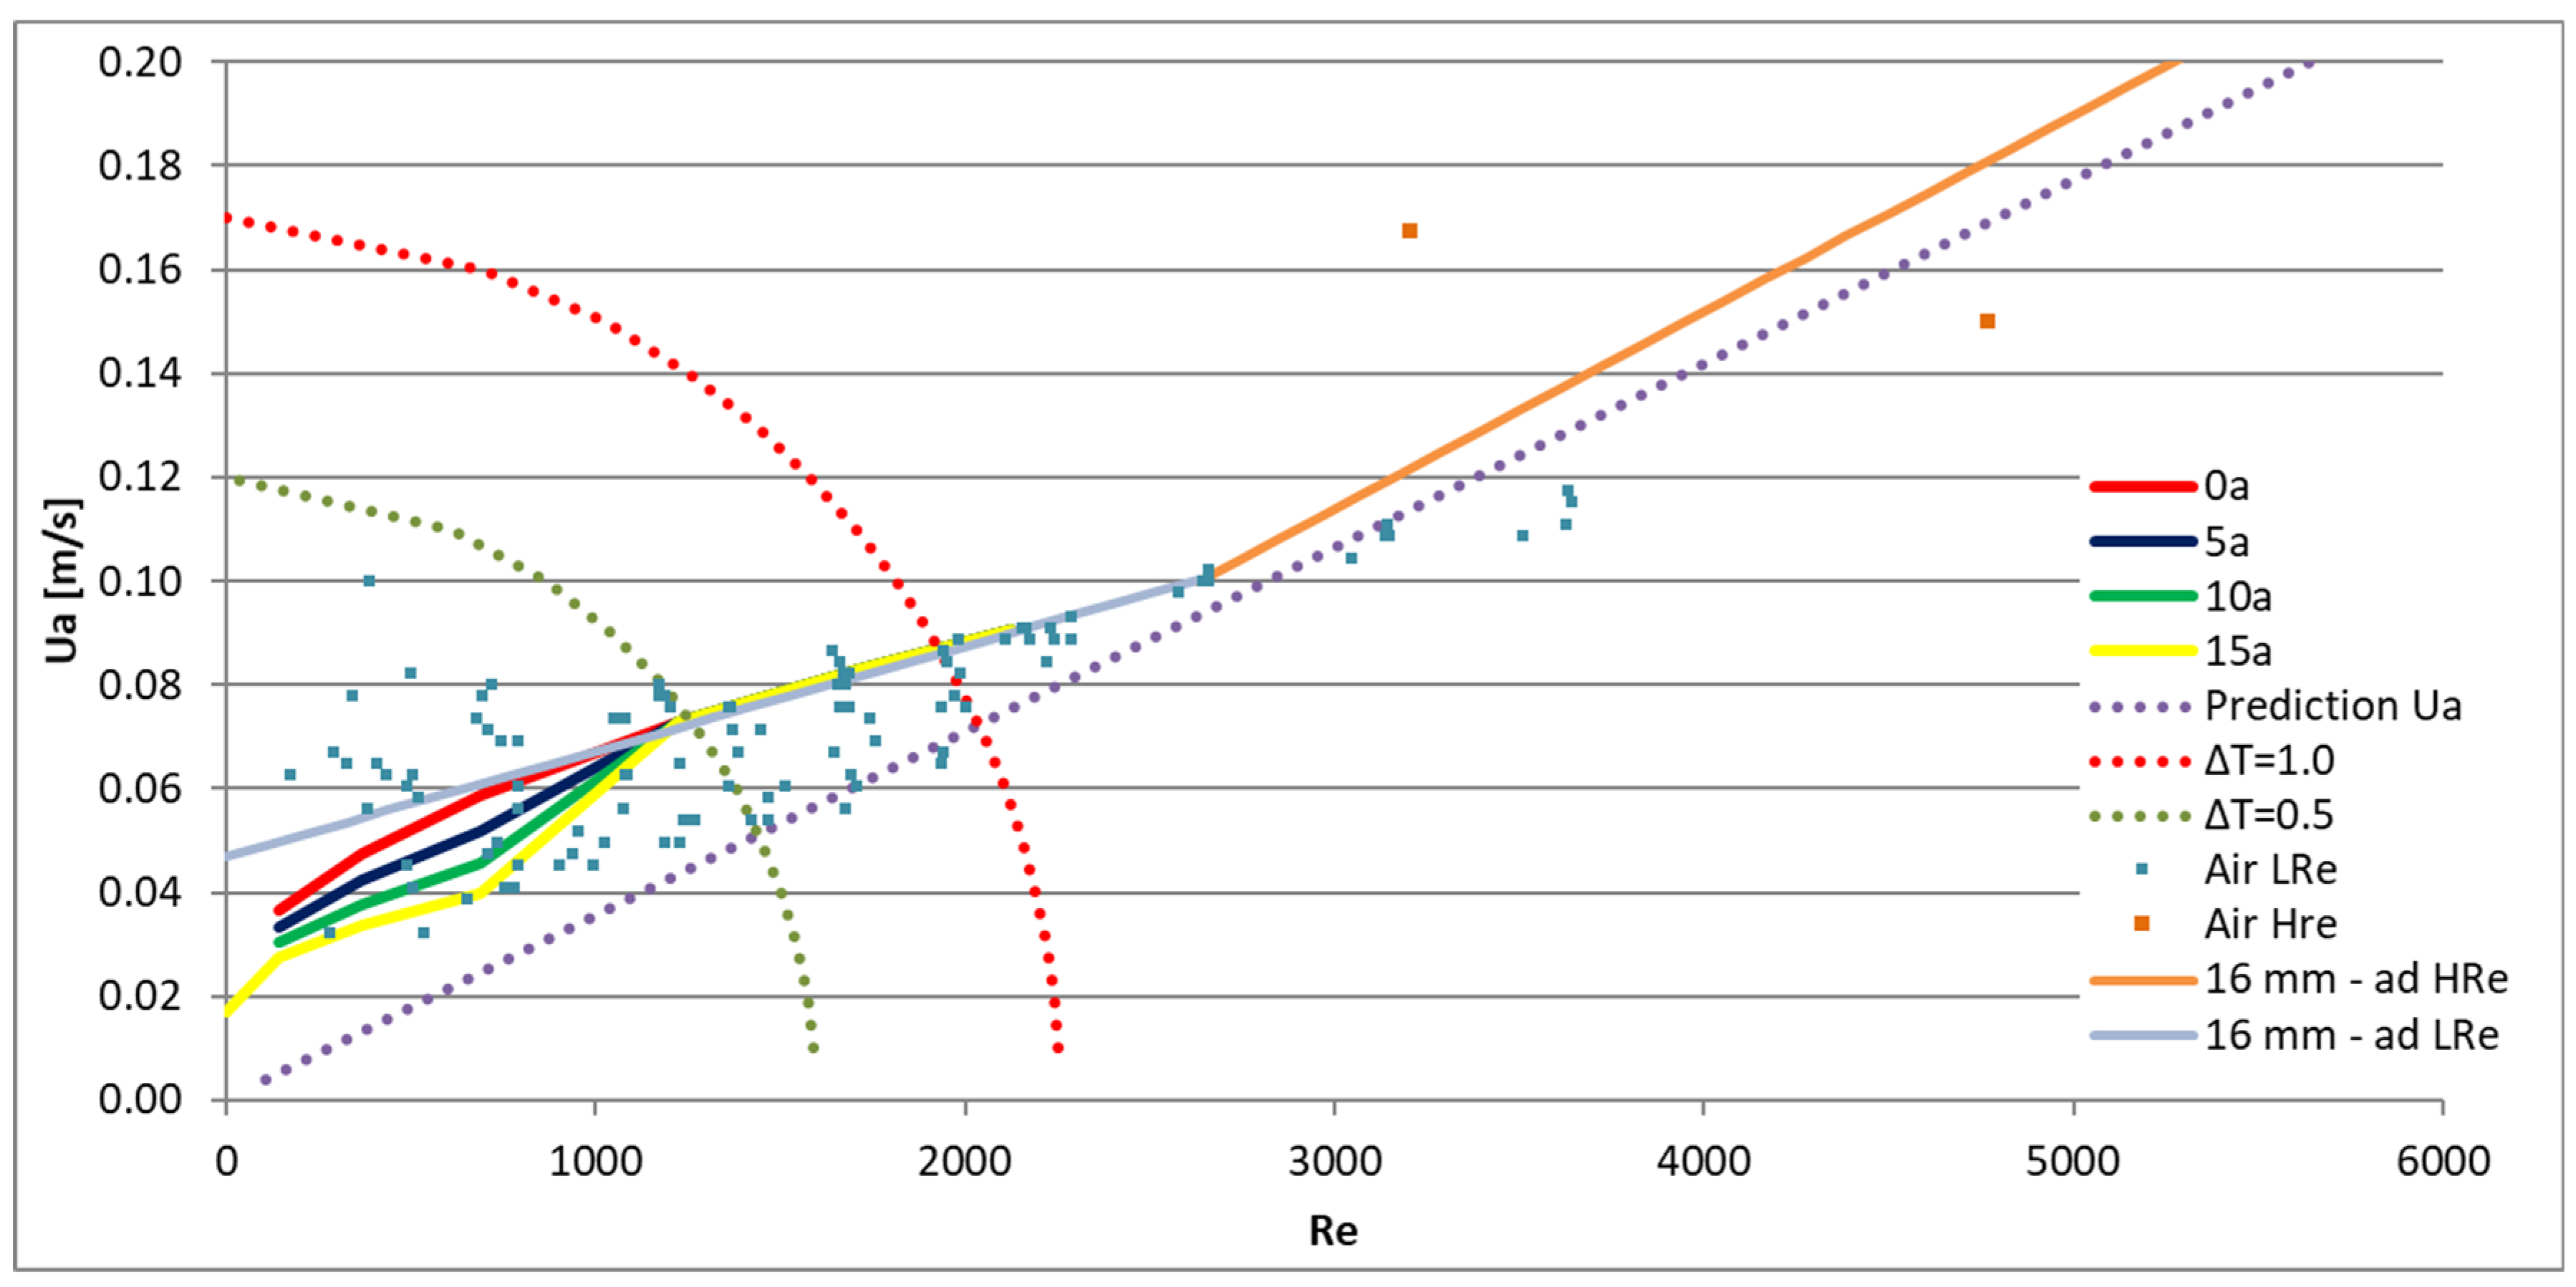
Finally, in
Figure 18, the small-scale water test results reported by Viegas, Oliveira and Aelenei [
26] are also included. The curves 5a to 15a correspond, respectively, to nozzle angles from 5° to 15°. In these tests, it was possible to find that the hydrodynamic sealing of the water curtain obeys Equation (10), where
. The value
corresponds to the minimum velocity at the door necessary to obtain the hydrodynamic sealing of the water curtain. This velocity must be higher than the transport velocity due to the diffusion process. In this case, we are working with the fluid air, where the diffusivity values differ from those of water. If we replace
with another value in the range obtained in the full-size tests for air (e.g.,
), it is possible to obtain a good agreement between Equation (5) and the results of Equation (10) for an angle of 0°. However, we recall that the lowest value obtained in the full-size tests with air as the working fluid was
and that the variable
does not show a relevant dependence on the angle of the jet. However, Viegas, Oliveira and Aelenei [
26] state that Equation (11) represents the balance between the momentum of the flow through the door (corresponding to the exhaust mass flow rate of the ‘contaminated’ compartment) and the momentum of the flow rate rejected (after the jet impinges the floor) to the ‘non-contaminated’ side. They showed that Equation (11) is close to the experimental results only for the jet angle of 15° and for Re < 1224. They suggested that the balance expressed by Equation (11), although relevant for low Re, is not applicable for higher Re due to the processes related to the turbulent behaviour of the jet at the floor impingement zone. Regarding the intersection of Equation (11) with Equation (5) and considering an angle of 15°, it would be expected that the test results could approach Equation (11) for Re < 580 (if
), for Re < 960 (if
) and for Re < 1500 (if
).
Figure 6,
Figure 7 and
Figure 8 show that the experimental results below these limits are scarce and could have been disturbed by small temperature differences. Although the full-size test results are compatible with the behaviour obtained in small-scale water tests, the full-size test results do not clearly evidence the same behaviour; therefore, deeper research is needed.


 ,
, 


