Abstract
The glacier retreat observed during the last decades at Potter Cove (PC) causes an increasing amount of suspended particulate matter (SPM) in the water column, which has a high impact on sessile filter feeder’ species at PC located at the West Antarctic Peninsula. SPM presents a highly-fluctuating dynamic pattern on a daily, monthly, seasonal, and interannual basis. Geostatistical interpolation techniques are widely used by default to generate reliable spatial information and thereby to improve the ecological understanding of environmental variables, which is often fundamental for guiding decision-makers and scientists. In this study, we compared the results of default and configured settings of three geostatistical algorithms (Simple Kriging, Ordinary Kriging, and Empirical Bayesian) and developed a performance index. In order to interpolate SPM data from the summer season 2010/2011 at PC, the best performance was obtained with Empirical Bayesian Kriging (standard mean = −0.001 and root mean square standardized = 0.995). It showed an excellent performance (performance index = 0.004), improving both evaluation parameters when radio and neighborhood were configured. About 69% of the models showed improved standard means when configured compared to the default settings following a here proposed guideline.
1. Introduction
Mean surface air temperature records show rapid warming, although regionally variable, by approximately +0.5 °C per decade at the Western Antarctic Peninsula (WAP) between the 1950s and the early 2000s [1,2]. The temperature increase has contributed to the shortening of the winter sea ice season [3], the disintegration of major ice shelves [4], and accelerated the retreat of 90% of tidewater glaciers on the Peninsula and the adjacent archipelagos [5,6]. Some of the strongest effects of this warming are manifested in Western Antarctic coastal systems, including bays and fjords with melting glaciers. The regional and episodic glacier melt events, among others, driven by advection of lower latitude warm air masses, amplify the environmental and ecological variability of coastal systems through discharge waves of meltwater and calving ice growlers [6,7,8]. A widely observed consequence of glacial melt and erosion of sub- and proglacial regions are the surface plumes of suspended particulate matter (SPM) dispersing in the coastal and shelf systems [9,10,11,12]. All of these coastal processes shape fjordic ecosystems at the level of community composition [13,14,15,16,17,18,19,20,21] and species phenology down to the level of gene transcription [22,23,24].
Suspended particulate matter (SPM) dispersal with surficial meltwater plumes strongly alters the physicochemical nearshore environment by increasing turbidity, which reduces light availability for primary producers [16,25,26]. It also affects the benthic fauna, especially sessile filter feeders [27,28,29,30]. The SPM deposition alters biogeochemical processes, such as sedimentary redox conditions, producing different types of defined meltwater habitats [31].
A quantitative understanding of climate change effects in WAP nearshore and coastal marine communities must be gained based on glaciological processes knowledge, on the one hand, and spatial knowledge of melt effects in well-studied showcase regions, on the other hand. If both sources of knowledge are available, geostatistical modeling can be applied to quantify and spatially predict future changes of the current SPM-related processes of coastal climate change at the WAP.
Geostatistical interpolation techniques are often applied in environmental analyses on, e.g., atmospheric [32,33,34], terrestrial [35,36,37], freshwater [38], and marine ecosystems [39,40,41], to generate a spatial surface prediction of a target variable from point measurements [42]. In this context, geostatistical interpolation algorithms, such as Kriging, are probabilistic methods relying on variogram models that account for the spatial structure of measured values at given locations and their overall spatial arrangement, as well as the prediction location [43]. Semivariances for pairs of measurement stations for chosen distance intervals can be quantified through variogram analysis, allowing to model possible spatial autocorrelation patterns. Corresponding models then enable Kriging predictions at unmeasured locations in terms of moving weighted averages of surrounding sampled data points to assure a minimal interpolation error [44]. The application of geostatistical models requires a robust sampling design, which anticipates certain data coverage and distribution for a statistically valid assessment of the spatial process [38,45]. Consequently, geostatistical models are not only site and data-dependent but also rely on all configured parameters that define the model strategy, such as the distances between the measured points and the number of “neighbors”. Nevertheless, besides a minimized interpolation error, a final model should also take into account expert knowledge about the natural dynamics of the target variable.
The provision of a full parameter list and configuration that defines the model strategy allows a reproducible interpolation of a target variable. Few studies related to precipitation and soil prediction inform about the model strategy, focusing on certain parameters configuration, such as algorithm used, amount of samples, and surrounding search with a detailed description on the data [34,36,37,38,40]. Since software packages allow simple and straightforward analyses of randomly collected data sets without previous testing of quality standards and with default modeling configuration, more often, thematic maps get published without quality check and error estimation.
In Potter Cove (PC), a small fjord at the Antarctic Peninsula, glacial sediment discharge is a well-known and intensely investigated seasonal phenomenon. At three stations, SPM sampling in the water column has been conducted for 20 years, ranging from 1992–2012 as a part of the environmental long-term series for horizontal and vertical dynamics at Carlini research station [26]. More than 30 spatially distributed short cores and water column samples were taken during two summer seasons (2010/2012), yielding dense horizontal and latitudinal SPM distribution snapshots under different melt and runoff conditions at two vertical levels of the water column [46]. Besides, measurements of SPM in the water at four stations and depths have been sampled for ecological research during the summer season [27]. Just like the release of meteoric water studied by Meredith et al. [8], the concentration of SPM in any sampling point of the surface prediction depends on the meteorological conditions, mainly driven by air temperature and wind, which could also define the residual time of the particles in the column water or the resuspension of SPM from the sea-bed [46,47]. Therefore, SPM is highly variable in space and time, and its interpolation remains challenging. Even if a four-dimensional data set is available by combining different sources, the bias interpolation could increase if such variations in sources, space, and time are belittled. Further, the SPM variable with its morphology and structure characteristics in the water column is eligible as it is continuously distributed and dispersed depending on environmental conditions as long it is not captured in a water mass with a distinct density from another. In a shallow coastal system such as at PC with meltwater discharges to the upper layers, the stratification remains unstable up to depth close to the sea-bed with an occasional pycnocline in the near-surface layer at ~5 m [8,26,48]. For these reasons, a partition of the input data is necessary to reduce the variation in space and time to increase the resolution for the interpolation of SPM data. This interpolation represents a snapshot of one day only under certain meteorological conditions with maximum sample sites spatially distributed within the study area.
Here, we aimed to evaluate systematically the performance of differently configured geostatistical models using the same SPM input data to generate the optimized picture of SPM distribution in Potter Cove as a case study and to assess the improvement through model configuration according to three indices developed.
2. Materials and Methods
2.1. Study Area
The 8.5 km² wide PC is a coastal fjord that disembogues into Maxwell Bay at the south-western 25 de Mayo/King George Island, the biggest island of the South Shetland archipelago (58°35.0′ to 58°41.0′ W and 62°13.9′ to 62°15.7′ S). The Fourcade Glacier surrounds the fjord in the North and the East. Like neighboring ice sheets off King George Island, a fast retreat of Fourcade Glacier has been observed by comparing satellite records going back into the 1950s [6,49,50]. Wölfl et al. [51] described the glacial retreats and advances through bedforms at the bottom of the fjord, identified as moraine formations. Two of them (M1 and M4) divide the fjord into three main sections: the inner (~1.07 km2; <50 m depth), middle (~1.65 km2; >50 m depth), outer cove (~2.5 km2; <240 m depth). They influence the bottom water circulation, resulting in higher wave energy impacts in the inner than in the outer cove [52]. Today, the glacier is almost on land, and its retreat induces fine sediment discharge directly from beneath the glacier or through four main proglacial melt water streams (MWS) (MWS 1, 2, 4, 5; Figure 3) of between 23 × 103 t yr-1 and 39 × 103 t yr−1 into the fjord [46].
2.2. Workflow Geostatistical Modeling
Geostatistical modeling was applied using ArcGIS, Geostatistical Analyst extension (10.4.1, Geostatistical Wizard tool code, ESRI Inc., Redlands, CA, USA [53]), and RStudio (3.1.3) following a six steps workflow (Figure 1 and Figure 2). The data compilation, georeference, and exploration (step 1) are most laborious and time-consuming and required for further data pre-processing (step 2). After these two steps, the model can be built by applying interpolation techniques with a low computational cost. The configuration of the parameters included in the model is the essential step since it defines the modeling strategy (step 3) and, consequently, the prediction of values at unsampled locations (step 4) and the outcome: a surface map based on statistically and spatially reasonable results for predictions and interpolation error (step 5) that displays the distribution pattern of the phenomenon (step 6). Expert knowledge on the processes involved for the target variable to model as well as statistically significant evaluation values, provide the continuity on the workflow to the use of the final output or a re-start of the workflow.
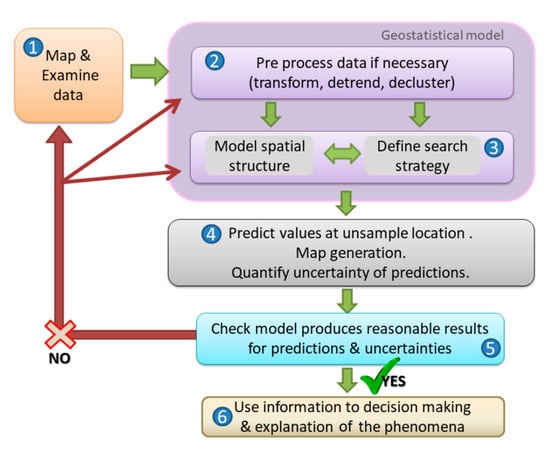
Figure 1.
Six steps workflow (modified from ESRI ArcGIS Pro) to build and to evaluate geostatistical models for spatial studies using ArcGIS 10.4.1 (ESRI, Inc.). The different steps involve the data examination, the parameter definition to structure the model strategy, the prediction, and the evaluation, resulting in an optimized model to explain the phenomena. If the resulted model is a non-precise, the process should be iterated at data examination and selection (step 1) or by restructuring the model (steps 2 and 3). Detailed configurations for each step are given in Figure 2.
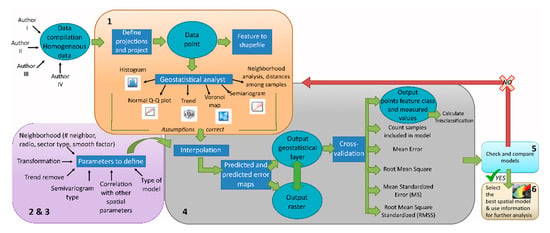
Figure 2.
Detailed workflow for geostatistical studies and building a spatial model from step 1 to 6. The arrows in color show the workflow of the different processes (in boxes) to apply an accurate geostatistical model. In the circles are the outputs to be spatially georeferenced into a shapefile. The black arrows that come out of a process box indicate a result, while when they point to the process, it means input for the application.
2.3. Data Exploration and Pre-Processing
For this study, a PC-SPM georeferenced data set of 20 years (1992–2012), sampled at least once during the summer season, was compiled [26,54,55,56,57], reinforced with daily meteorological data on wind, air temperature, precipitation, humidity (Servicio Meteorológico Nacional Argentino and Schloss et al., 2012) (n = 1352, Table 1), and published through the data archive PANGAEA [58]. Data from Carlini long-term ecological research since 1996/1997 were georeferenced by overlapping a high-resolution satellite image and in situ spatial references using the ‘Fit to display’ ArcGIS tool and individually uploaded to the data archive [59].

Table 1.
Suspended particulate matter (SPM) data compiled and published by several authors [26,27,54,55,56,57] among 20 years of research in Potter Cove (PC), Antarctic (joint in Neder et al. [58]). Data increasing time resolution reduced by semivariogram cloud and normality analysis to apply the geostatistical model with two approaches (in grey): with meltwater streams discharges with SPM inputs -MWS- and without.
Figure 3 shows the spatial distribution of the compiled PC-SPM data set. The following two-decades PC-SPM statistical data exploration in space and time (step 1) leads to a reduced but homogeneous data set (Table 1, grey-shaded), which is required for an optimized geostatistical 2D-modeling of SPM in PC (step 6).
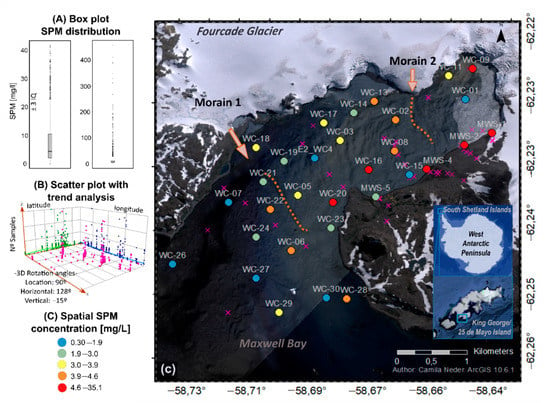
Figure 3.
Suspended particulate matter (SPM) measured at least once during summers among two decades (1992–2012) in Potter Cove. (A) Data distribution by a boxplot. (B) Scatter plot with trends in sample densities variability. (C) One-day of SPM concentration sampling on 9 February 2010 in Potter Cove’s upper water column (WC stations) and its meltwater streams (MWS stations). Red and blue colors highlight extreme high and low values. Moraine from Wölfl et al. [51]. Base map: Digital Globe (2014).
2.3.1. Normality and Autocorrelation Analysis for a Valid Data Set to Model
Normality analysis applied to the PC-SPM data set consisted of scatter plot, skewness as a measure of data set symmetry, kurtosis for tail-heaviness analysis, and Normal Q-Q plots comparing quartile per quartile the data distribution to a standard normal distribution. Spatial autocorrelation was tested with semivariogram for data interpolation. Trend analysis was carried out by the Wizard-ArcGIS tool to check the possible spatial trends for varying expected values of the random variable.
Data distribution and autocorrelation were checked to define the data set to model. The four-dimensional PC-SPM data set spanning two decades (summer 1992–2012, n = 1352) showed the highest variation with an asymmetric distribution with outliers excluded by ± 3 interquartile and without (Figure 3A, left and right respectively) and according to the semivariogram, with no autocorrelation (Figures S1 and S2). This reflects a strong heterogeneity of lithogenic particle concentration in water and meltwater distribution, which increases the bias and supports misclassification of a mean SPM surface distribution pattern. Hence, the data set compiled during two decades was subdivided according to the following criteria: (i) time window (sampling from one day only) and (ii) sufficient spatial resolution from three to two dimensions (longitudinal and latitudinal) in a consistent depth layer of 0–5 m (Table 1). The statistical summary (Table 1) highlights that as skewness and kurtosis values improve among the data sets, the smaller the time window and the denser the spatial coverage of the data at the same time. The one-summer surficial SPM data set (December 2010–February 2011) showed the highest standard deviation of the SPM concentration mean (Table 1, 46.13 ± 188.27 mg/L) resulting from an extreme year of two maximum events of meltwater discharge and, therefore, could cause a high SPM variability [46]. These data display a non-normal and asymmetric distribution, without autocorrelation based on semivariogram analysis.
The data exploration of the highest temporally resolution, one day with mean summer meteorological conditions (n = 28, 09/02/2011, [46]), identified the most homogenous data set, spatially distributed across the area (Figure S3), shallow depths of 0–5 m, normally distributed with a more reliable variance, based on Robinson and Metternicht [60], due to its low negative skewness and an improved autocorrelation compared to the other data sets explored. Consequently, this data set was determined as the most suitable, meeting the requirements for geostatistical modeling (data set A).
In a second modeling approach, SPM stations of four meltwater streams (MWS 1,2,4,5) sampled three days before (06/02/2011) were added to the one-day data set (data set B), which indeed reduces the time resolution and increases the asymmetry of data distribution but represents a more realistic situation of the phenomena expected in PC during a summer. With that, we tested the influence of local MWS lithological input on SPM distribution in surface waters. The sample points and its spatial distribution of the data used for modeling are shown in Figure 3, where stations in pink ‘X’ were excluded from geostatistical modeling. SPM concentration goes from 0–31.5 mg/L, on a colored scale per quartile from blue to orange, where the extreme values in red belong to the MWS stations.
2.3.2. Spatial Variability
Voronoi analysis interpolates SPM concentrations by Thiessen polygons corresponding to the Delaunay triangulation for the sampled points in the center and a geometrical distance to the neighbors [61]. The SPM value assigned to a polygon with simple Voronoi is the value recorded at the sample point within that polygon, whereas the one with mean Voronoi represents the mean value of samples within a given polygon and its neighbors [62]. Neighborhood analysis consists of the Euclidean distances’ analysis between the samples closest and furthest away, and the spatial natural neighborhood based on the weighted overlap of Voronoi polygons and a new polygon around an interpolation point [53]. This defines the parameter neighborhood’s radius by the number of neighbors included in the modeling step (step 3). We tested the spatial variability of the SPM concentrations with Voronoi and neighborhood analysis.
2.4. Modeling Strategy
Simple Kriging (SK), Ordinary Kriging (OK), and Empirical Bayesian Kriging (EBK) were the three different interpolation algorithms applied in the default version suggested by ESRI and configured to both one-day SPM data sets (data set A and B, Section 2.3, Table 1, grey-shaded). A total of 22 geostatistical models was calculated (step 4) and visualized as SPM concentration (mg/l) surface prediction with associated predicted standard error maps (PredSE). For the PredSE map, natural breaks classification was chosen. When configured, semivariogram was optimized for SK and OK with nugget and partition sill calculation and without anisotropy, and for EBK with 100 simulations, one overlap and power type except when transforming the data (Figures S4 and S5). The sampling neighborhood influences the accuracy of interpolations and is optimized for each case by configuring the following neighborhood parameters: neighborhood radius, the ratio of the maximum and the minimum number of neighbors, sector type based on trend analysis and spatial variability, smooth factor, and data transformation factor (see Supplementary Materials section II).
2.5. Model Evaluation and Performances Indices
The resulting changes in different modeling strategies were evaluated by comparing statistical errors. As an outcome of step 4, an uncertainty analysis (cross-validation) of the predicted values reveals the degree of precision by providing the misclassification difference between measured and predicted value, mean squared error (MSE), root mean square error (RMS), mean standardized (MS), root mean square standardized error (RMSS), and average standard error (ASE). The model evaluation (step 5) considered MS ≈ 0, RMSS ≈ 1, and the smallest ASE, as well as a reasonably interpolated surface that matches the general expert knowledge about the SPM distribution (Figure 5a from Monien et al. [46], Figure 2d -band 4 of satellite image- from Jerosch et al. [63]). How to assess the performance of a model and the improvement after tuning the model configuration (e.g., radius, number of neighbors, smoothing factor, etc.) is not defined in the bibliography nor internet forums. In this study, we developed three indices for model evaluation (step 5) to define the best algorithm and configuration to represent the SPM plume extension on 9 February 2011 on a solid and traceable basis (step 6).
Three indices were developed to evaluate performance differences regarding the modeling strategy applied. The MS (1) and RMSS (2) improvement indices were based, respectively, on the MS or RMSS change rate percentage between a configured geostatistical model by default and the tuned model and by the distance to the optimal value (zero for MS and one for RMSS). Each index presumes an improvement of the default model in the configured model. A weighted performance index was applied for each model as RMSS is assumed to be the most restrictive parameter (RMSS factor 0.7; MS, factor 0.3).
For Equations (1) and (2), ideal values are close to +100%, with a positive scale representing an improvement of the model, whereas negative values imply diminishment of the model confidentiality and, hence, its performance due to a distancing of the statistical parameter from the optimal value. For Equation (3), ideal values are close to zero.
3. Results
3.1. Pre-Process: Voronoi and Neighborhood Analysis
One-day SPM data without (data set A) and with meltwater streams (MWS) input (data set B) differ spatially concerning the interpolated pattern of SPM concentration. In both cases, Voronoi (Figure 4) and natural neighbor (Figure 5) analyses indicate higher values in the inner cove and near the southern Potter Peninsula coast as well as low values in the outer cove close to Maxwell Bay. The simple Voronoi SPM distribution based on the measured values recorded at the sampled location reveals high spatial variability of SPM concentrations with three areas with high values or outliers (Figure 4A1,B1). Remarkably, high values or outliers (5.2–6.6 mg/L SPM) identified by the red polygon class surrounded by low values (0–2.71 mg/L SPM) appear in data without meltwater discharge points included near MWS-5 and in the northern regions of the inner cove (Figure 4A1). On the contrary, the simple Voronoi with local MWS discharge input identifies high values near the area of all MWS except the MWS-5 (Figure 4B1). The mean Voronoi for data set B produces a smooth gradient of SPM concentrations across the entire cove from the outer western edge toward the inner south-eastern coastline (Figure 4B2).
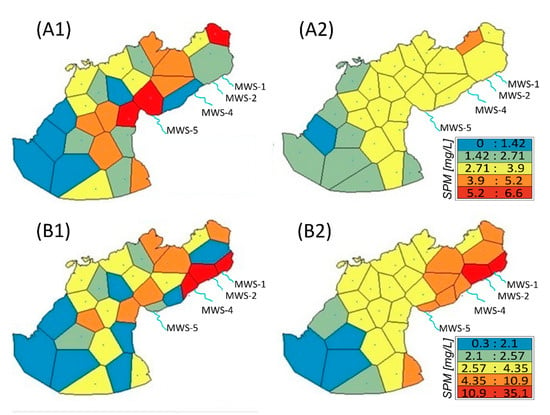
Figure 4.
Simple (A1,B1) and mean (A2,B2) Voronoi interpolation map for one-day suspended particulate matter (SPM) data without meltwater streams -MWS- input (A1,A2) and with MWS (B1,B2). Interpolated SPM concentrations in (mg/L) differ by data set and Voronoi type used, where blue means low, green mid-low, yellow middle, orange mid-high, and red high SPM concentration. Light blue lines show meltwater streams (MWS); thus, the source of SPM discharges into the cove.
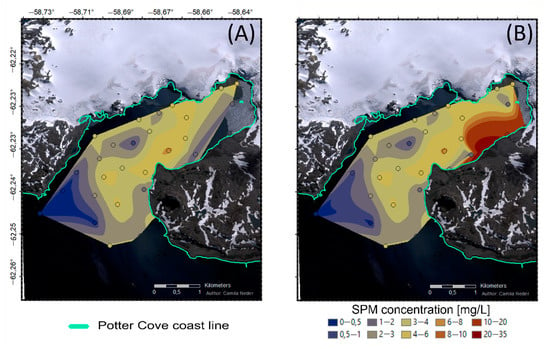
Figure 5.
Natural neighborhood interpolation for (A) one-day SPM data without meltwater streams SPM concentration inputs data (B) with meltwater streams discharges. The SPM concentration is interpolated to generate a surface raster based on the determination of the natural neighbors based on an overlap of Voronoi polygons and a new polygon around an interpolation point.
Depending on the data used with or without MWS input, the neighborhood analysis reveals different mathematical distances of closer and further away neighbors to additionally delimit the model neighborhood’s radius through applying the sum or the mean of such distances (Table 2). Furthermore, the natural neighborhood analysis identifies spatial differences in the SPM concentration (Figure 5), similar to mean Voronoi (Figure 4A2,B2), with higher values at the eastern coastline of the inner cove close to the glacier front line.

Table 2.
Neighborhood analysis for one-day SPM data (A) without and (B) with meltwater streams data (MWS). Values are used to delimit the maximum and the minimum number of neighbors to include in the geostatistical model and the neighborhood’s radius. Distances calculated are the mean (MN) of all neighbors, the sum (∑CN) and mean (MCN) of the closest neighbor, the sum (∑FAN), the mean (MFAN), and half of the mean (½ MFAN) of the furthest away neighbor.
3.2. Geostatistical Modeling Differences
Eleven geostatistical interpolation models are applied to each one-day SPM data set without (data set A) and with meltwater streams input (data set B) with default (Figure 6) and configured settings (Figure 7). Figure 8 summarizes the parameter configuration for each of these models. The SPM concentrations result in similar visual patterns in all models, varying mainly for the type of input data set. High variability of the SPM concentration prevails in the area of the inner cove close to the two meltwater streams (MWS-1 and MWS-2), entering SPM directly from the melting glacier and carrying abundant eroded SPM. In general, Empirical Bayesian Kriging generates the lowest standard deviation errors compared to the other geostatistical methods. Default models (Figure 6) produce distinct SPM plume extensions in comparison to the smooth gradients given in the configured models (Figure 7). Smoothing effects can be achieved by transforming the input data (compare Figure 6, EBK0 and Figure 7II, EBK5) and by the configuration of a smooth parameter (Figure 7II, EBK6). On the contrary, when the neighborhood search is a ‘full sector’ and a minimal number of neighbors as the mean of the closest Euclidean distances among pairs, it results in a polygon output similar to Voronoi polygons (Figure 7I, EBK4).
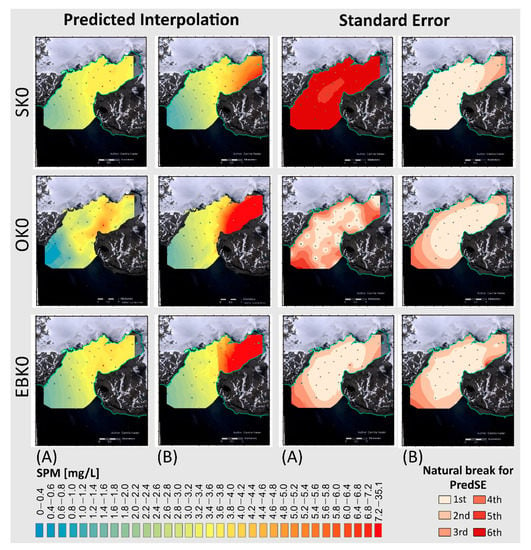
Figure 6.
Six default geostatistical models. (Left): data distribution and interpolation results for SPM in Potter Cove for 09/02/2011 without (A) and including meltwater with SPM input by meltwater streams (B) using Simple Kriging (SK), Ordinary Kriging (OK), and Empirical Bayesian Kriging (EBK) models. (Right), (A,B): predicted standard error (PredSE) to reveal the scope of feasible interpolation area. Best models are determined automatically by the ArcGIS tool with a mean close to zero and a root mean squared standardized error close to one.
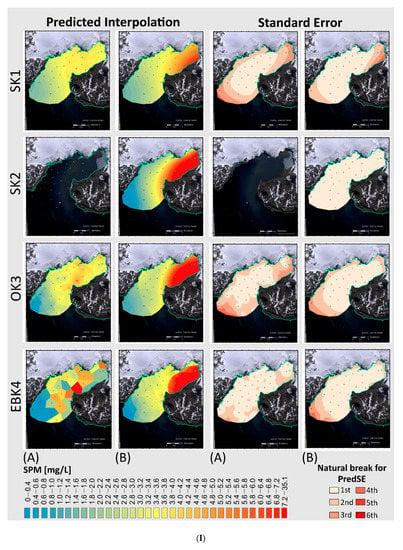
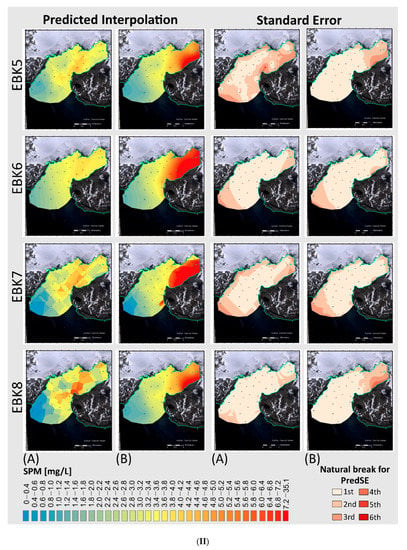
Figure 7.
(I) Predicted suspended particulate matter (SPM) interpolations and predicted standard error (PredSE) maps for one mean meteorological summer day (A) without and (B) with meltwater streams SPM concentration data (continued in II). Eight tuned geostatistical models: Simple Kriging (SK), Ordinary Kriging (OK), and Empirical Bayesian Kriging (EBK) models The SK2A model in Figure 7I, was not performed because the trend removal with optimization was not applicable due to a required estimation of the tendency at each location instead of a general one.
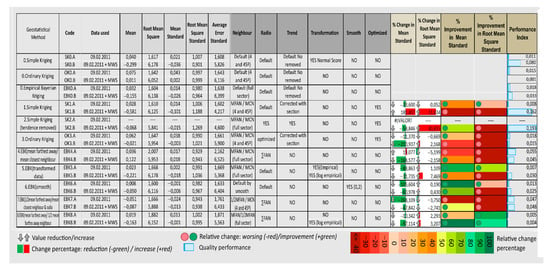
Figure 8.
Statistical analysis, parameters definition, and comparison of eight geostatistical interpolation models for suspended particulate matter (data set A) and its inputs MWS into the marine system (data set B). In colors, improvement, and performance of the model. Interpolation methods: SK (Simple Kriging), OK (Ordinary Kriging), and EBK (Empirical Bayesian Kriging). Neighborhood definition: maximum neighbor/minimum neighbor; MFA (mean of furthest away neighbor); MCN (mean of closest neighbor); 1/2 MFAN (half of furthest away neighbor); Sector type of neighbor research full sector or 4 sections in 45°. Radio type: default; optimized; ∑FAN (sum of furthest away neighbors at each sample point). When a trend, a first-order trend is removed. When smooth, the factor is 0.2. For further details on parameters definition and model comparison, see Supplementary Materials Table S1.
3.3. Evaluation and Performance of the Model
For each of the geostatistical methods applied, the predicted standard error maps project higher errors for default models (Figure 6) than for the configured models (Figure 7). Considering all models, the Empirical Bayesian Kriging algorithm shows a lower predicted standard error compared to Simple or Ordinary Kriging. For the configured models (Figure 7), the predicted standard errors are lower for one-day SPM data with MWS input than without MWS discharge included.
The deviation error between predicted and observed SPM concentrations at each station among the different geostatistical models increases from stations in the west toward the eastern stations (Figure 9, Figure S6). The data set with MWS discharge input deviates stronger (up to +12 mg/L or −30 mg/L) at stations near coastal meltwater run-off (Figure 9B) compared to ±4 mg/L for the data set without MWS (Figure 9A). This results in a higher over- or underestimation of the predicted values with different deviations within the stations (Figure S7). Models of data with MWS input, over-predicted SPM concentration in stations WC-16 and WC-02, proximal to the meltwater streams. Contrarily, MWS-5 and MWS-4 concentrations are rather under-predicted due to their spatial proximity to open water stations with low SPM concentrations.
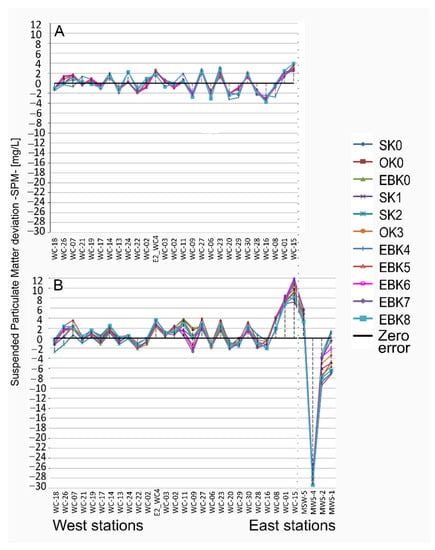
Figure 9.
Statistical deviation error (DEs) per station resulting from each geostatistical model. Suspended particulate matter (SPM) predictions reveal a misclassification gradient from the west to the east in Potter Cove, coincident with a gradient of distance to the meltwater stream (MWS) discharge areas. (A) Deviation error for data sets without MWS represents ±4 mg/L from the SPM concentration measured. (B) Deviation error for data sets with MWS represent −30 mg/L and +12 mg/L from SPM concentration measured.
A statistical error analysis is used for the assessment of improved/deteriorated model performance (Figure 8). Ordinated by mean standardized (MS) ~0 and root mean square standardized error (RMSS) ~1, the default model OK0 and the configured model EBK8 perform best, while SK2 performs worst (Table S2). Regarding improvements indices Equations (1) and (2), about 70%, i.e., 11 out of 16 geostatistical models, have achieved an improved MS, whereas only ~31%, i.e., 5 out of 16, are improved in RMSS. EBK8 is the only configured model with improvement in MS and RMSS for both SPM data sets with and without MWS input. A particularly high improvement in MS (97.11%) and RMSS (74.92%) is for the EBK8B model of one-day SPM data with MWS sediment discharges (Table S1).
According to the performance index, Simple Kriging achieves the weakest improvements. The performances between the two approaches for one-day SPM data with and without MWS are more similar among Empirical Bayesian Kriging than for Simple or Ordinary Kriging. Particularly, the combination of the configured neighborhood with a full sector radius as maximized distances between neighbors in the EBK8 model performs better in both SPM data sets with and without data transformation. The best geostatistical models are interpolated with one-day SPM data with MWS input (data B). Ordinary Kriging by default performs best (OK0, Figure 6), with a performance index of 0.001, and second, the Empirical Bayesian Kriging configured for a maximum and a minimum number of neighbors with the mean of the Euclidian distances of furthest away neighbor as maximum, and the half of it as the minimum, (EBK8, Figure 7II) with a performance index of 0.004.
4. Discussion
4.1. Evaluation of Geostatistical Modeling Approaches of SPM Run-Off Plume in Potter Cove
We have tested and evaluated different strategies to identify the spatial extension of the SPM plume caused by glacial melting by applying geostatistical modeling in PC as a case study. With this geostatistical application to SPM concentration data in PC to achieve its spatial distribution of a normal summer day, we provide the baseline of the natural variability of this meteorological dependent variable by a homogeneous daily snapshot. The analysis of 20 years of PC-SPM concentration data has revealed a high data variability in space (latitudinal, longitudinal, and depth) and time. Despite a relatively high total number of data collection within two decades (n = 1352), this has led to a reduced data set with a temporal snapshot of one day for spatial modeling with a correct autocorrelation assumption. To test the improvement of model performances after tuning the model configuration, we have developed an evaluation strategy and applied three statistical performance indices. The estimation of the sediment plume extent represents a summer scenario of strong glacial melting. We present a detailed workflow to assess an improved performance when configuring geostatistical models.
We have shown a successful application of geostatistical modeling to the highly fluctuating SPM variable, measured and scattered inconsistently, albeit required an immense reduction of the input data to a minor time window to reduce the sampling bias to the minimum. Despite a comprehensive, spatially distributed data collection, covering three levels of the water column (0–5 m, 15 m, >15 m), the data analysis has revealed the difficulty to merge the data sets from different researches due to high variability and sampling heterogeneity caused by the different sampling years, stations, and the number of repetitions per stations. However, when the foci are on a surficial prediction, we can combine homogeneous temporal data from long-term studies and spatial snapshot data from different research activities, e.g., [26,46,55], to compensate for some sampling deficits and further identify spatial-temporal trends to make future projections.
The semivariogram analysis is crucial to presume the model performance to reduce systematic statistical errors. Comparing the spatial variability of the different time windows helps to understand the need for increasing the time resolution of SPM sampling to a snapshot of one-day. Consequently, the two-dimensional reduced but homogeneous data set is reliable for spatial interpolation, while the two decades PC-SPM data set of joint researches data set is not (Table 2). A supplementary analysis of the weather conditions of up to five days before the measurements has shown intensified discharge of eroded sediments and can explain delayed sediment plume after days of high temperature and intensive melting. A theoretical model considering the dynamics and variation of SPM in time is the following:
where each term means: the time variation (1°), the vertical advection (2°), the horizontal advection (3°), the vertical diffusion (4°) equal to the difference of SPM regarding a variety of wind and temperature
The inclusion of local SPM sources from MWS discharge allows for a better understanding of the transition zone between the cryosphere and the coastal waters. High SPM concentrations are projected in the inner cove and low in the outer cove by the most suitable models. Inclusion of the MWS discharge points has highlighted misclassification of predicted SPM concentration in the peripheral areas (e.g., WC-16, WC-2 stations), which has created a major bias for the surface prediction of the general meltwater plume extension and concerning SPM concentrations in the central plume areas. We propose the comparison of SPM concentration and SPM plume extension with and without the inclusion of MWS discharge data to represent different aerial warming states or phases and, consequently, melt scenarios. While the first scenario (without MWS data) represents an early warming phase after a cold period when MWS is still frozen, the second scenario applies more to the 2nd and 3rd day of a warm air inflow when the streams have thawed, and the maximum discharge has been reached (see also Meredith et al. [8]). Thus, both scenarios are valid for short periods of only a few days of melt event and could exemplify a mean stage of the SPM distribution in the specific summer from December 2010 until February 2011 since the data represent the weather conditions on mean summer melt days (2.3 °C mean air temperature, Servicio Meteorológico Nacional Argentino). However, it cannot generalize the SPM phenomenon and its dynamic. For a general scenario (e.g., seasonally or monthly mean) on SMP distribution in PC, a significant number of homogeneous snapshot data sets like those we processed in this study would be needed to calculate a mean or a median SPM distribution map from those.
4.2. Geostatistical Modeling Strategies
The outcomes of this study recommend the configuration of models (Figure 7). Default Simple Kriging and Empirical Bayesian Kriging methods for SPM data without MWS input have shown a smooth and similar SPM interpolation pattern with a concentration between ~3 and 4 mg/L (Figure 6). Ordinary Kriging by default differs in the area between the moraines (M1 and M4) where SPM concentration values increase to ~5–8 mg/L. Instead, OK interpolation is more comparable to the Voronoi map (Figure 4A) and natural neighbor (Figure 5A), showing the spatial variability and a general distribution trend in a robust way. These projections reveal a higher SPM concentration near the MWS-5 at the middle cove, even if the meltwater stream is not considered. In this area, additional variables, such as currents and sediment transport, would improve the prediction of the SPM concentration. In this transition area between meltwater habitat and fjord habitat [31], it is harder to predict SPM concentrations in comparison to the inner cove close to the glacier front and the meltwater stream discharge (consistent high SPM values) or to the outer cove in the open sea to Maxwell Bay (consistent low SPM values). This coincides with a new approach on a hydrographical model in PC, showing a vortex water circulation point in this area, retaining the SPM to be exported outside the cove [47].
For all tested parameters to configure the model in this study, the neighborhood is the most important as in other studies (e.g., [36,38,60]). The sampling neighborhood can explain the general trend induced due to different sample densities among the study area by defining the maximum search area and the number of neighbors included. Here, we recommend following the Euclidean distances’ analysis and calculation of MFAN and the half of it (Table 2).
4.3. Limits on Methodology Evaluation
The creation of indices to assess the performance of geostatistical models and their improvement on MS or RMSS when configuring the models provide a methodology to compare different model performances. In this study, the best model with a performance index close to zero (Figure 8) is OK0 by default (0.001), followed by EBK8 (0.004) with MWS inputs, and in the third position by EBK8 (0.005) without MWS. Even if the EBK8 model is placed second and third, we consider it the best one to explain the SPM distribution in PC because different to OK0, (i) it performs well independently of the data set used: approaches with and without MWS, (ii) after the configuration, it improves in both MS ≈ 0 and RMSS ≈ 1, ~97% for MS and ~75% for RMSS (Figure 8) with an improved variogram (Figure S5.II), (iii) it projects coincident results with a robust interpolation as the natural neighborhood map and with the SPM plume expected from satellite image from Jerosch et. al. [63] or modeled by Monien et al. [46], and (iv) coincident with Monien et al. [46], it reflects that the SPM concentration is influenced by the distance between the four meltwater streams analyzed and the glacier front. Hence, it shows an SPM concentration gradient increasing from south to north of the cove and from east to west from the further away stream MWS-5, whose origins of lithogenic particles are not from the Fourcade Glacier to the direct glacier run-off stream MWS-1.
This selected model (EBK8) with MWS inputs show a clear gradient of SPM distribution from high to low from the inner east coast to the outer west coast. An approximate area of 2 km2, between 1.5 and 1.7 km of distance to the Fourcade Glacier front, has mid-high values (4–35 mg/L) with high concentrations (7–35 mg/L) up to ~300 m distance to the SPM origins of MWS stations. Low concentrations (0–2 mg/L) are close to open sea conditions with more than 2 km of distance to MWS. These areas coincide, respectively, with the meltwater fjord and marine habitats at the inner and outer cove from Jerosch et al. [31] (Figure 4d from Jerosch et al., 2018), which shows the spatial extent of glacier influence in the cove. Glacier retreat with non-measured SPM input at the west coast or underwater could affect the predicted SPM concentrations. This material input will either sediment in a significant proportion, remain in the water column and transported among the cove, or be exported into Bransfield Strait [46]. But the outcome of this study has shown its superficial distribution. The high SPM concentration at the inner cove could also be deposited or be longer suspended, modifying the marine ecosystem (e.g., salinity conditions, light availability, carbon and iron concentrations) and making this area vulnerable to changes in the pelagic and benthic community [14,17,64,65]. Consequently, since glaciers are retreating among the entire west Antarctic Peninsula [5], ecosystem changes at PC due to increased SPM concentration can be expected in Antarctic fjords and coastal areas influenced by retreating glaciers.
5. Conclusions
The configuration of the model’s parameters affects the resulting interpolation, and thus, for replicable results, they have to be reported. The default and configured interpolations applied in this study determine the detailed steps in Figure 1 and Figure 2 for building a geostatistical model where the crucial ones are:
- Data exploration: Explore data via Semivariogram for a homogeneous data set and Voronoi plot to identify measurement errors or extreme values, consider as ‘outliers’, and to evaluate their inclusion. To also evaluate spatial variances of the target variable in a short distance among stations.
- Model parameters configuration: Run natural neighborhood analysis and calculate the Euclidean distances’ sum and mean of furthest away and closest neighbor to determine the radius and neighborhood configuration.
- Model strategy definition: Build either Ordinary Kriging by default or Empirical Bayesian Kriging with a maximum neighborhood configuration as the value of the mean of the furthest away neighbors’ distances and a minimum as the half of it; a configuration of a radius that is the sum of all furthest away distances. Compare models’ performances with and without data transformation.
- Model evaluation and selection: Calculate performance index -Equation (3)- for each geostatistical model to decide and select best spatial interpolation based on mean standardized (MS), root mean squared standardized (RMSS), and previous knowledge of the system and parameter to interpolate.
As these steps reach a good interpolation performance for a highly fluctuating variable, such as SPM, we assume that these main steps of the workflow (Figure 2) could also guide the modeling of stable variables, such as soil grain size or total organic carbon content in the sediment. All tested geostatistical interpolations from this study show the importance of the model’s parameter configuration and the necessity for further researches of combined interdisciplinary planning when sampling to achieve a well spatial explanation of the target phenomenon.
Supplementary Materials
The following are available online at https://www.mdpi.com/2311-5521/5/4/235/s1, Section I: Data Exploration: Figure S1: Scatter plot of suspended particulate matter values in different station points in Potter Cove. Figure S2: Semivariogram cloud plots of SPM data partitioning. Figure S3: Trend analysis for one-day SPM data with and without meltwater streams input. Section II: Detailed procedure configuration and statistical differences between geostatistical models: Table S1: Detailed numbers of the configuration of the different parameters applied. Figure S4. (I and II), S5. (I and II): Semivariogram and semivariogram model of each Simple Kriging (SK), Ordinary Kriging (OK), and Empirical Bayesian Kriging (EBK) by default and configured of suspended particulate matter data with and without meltwater streams input. Section III – Model evaluation: Cross-validation and deviation: Figure S6: Zoom of statistical error variation among the different interpolation methods applied delineated by station location sorted from west to east. Figure S7ab: Scatter plot of observed vs. predicted values for all interpolation methods of one-day SPM data with and without meltwater streams input. Table S2: Order of the improvement in mean standardized (MS) and root mean squared standardized (RMSS) of the 22 geostatistical models configured.
Author Contributions
Following CRediT authorship contribution: Conceptualization, C.N., R.S., D.A., and K.J.; Data curation, C.N.; Formal analysis, C.N.; Funding acquisition, C.N., R.S., K.J., D.A., and K.J.; Investigation, C.N., and K.J.; Methodology, C.N., R.P., and K.J.; Resources, R.S., and D.A.; Software, C.N.; Supervision, K.J.; Validation, C.N., and R.P.; Visualization, C.N.; Writing – original draft, C.N.; Writing—review and editing, C.N., R.S., D.A., R.P., and K.J. All authors have read and agreed to the published version of the manuscript.
Funding
This research was funded by EU-Project IMCONet (FP7 IRSES, action no. 319718) and the European Union’s Horizon 2020 research and innovation programme under the Marie Skłodowska-Curie grant agreement No 872690, Alfred Wegener Institute (AWI), Consejo Nacional de Investigaciones Científicas y Técnicas (CONICET- Res. N° 4252/116), ALEARG’18 (ref N° 91700957) by Deutscher Akademischer Austauschdienst (DAAD) and Ministerio de Educación Argentina.
Acknowledgments
The authors are grateful to the members of the BMBF-project IMCOAST and EU-project IMCONet, who provide scientific knowledge, technical assistance, and recollection on data in Antarctic campaigns at Carlini Station. Logistic and financial support to facilitate the possible Antarctic expeditions were provided by Instituto Antártico Argentino and Alfred Wegener Institute. In addition, we would like to thank the TRESS ACADEMY for providing insightful comments to this paper and the two reviewers for their positive and constructive comments on the manuscript.
Conflicts of Interest
The authors declare no conflict of interest. The funders had no role in the design of the study; in the collection, analyses, or interpretation of data; in the writing of the manuscript, or in the decision to publish the results.
References
- Barrand, N.E.; Vaughan, D.G.; Steiner, N.; Tedesco, M.; Kuipers Munneke, P.; Van Den Broeke, M.R.; Hosking, J.S. Trends in Antarctic Peninsula surface melting conditions from observations and regional climate modeling. J. Geophys. Res. Earth Surf. 2013, 118, 315–330. [Google Scholar] [CrossRef]
- Turner, J.; Lu, H.; White, I.; King, J.C.; Phillips, T.; Hosking, J.S.; Bracegirdle, T.J.; Marshall, G.J.; Mulvaney, R.; Deb, P. Absence of 21st century warming on Antarctic Peninsula consistent with natural variability. Nature 2016, 535, 411–415. [Google Scholar] [CrossRef] [PubMed]
- Stammerjohn, S.E.; Martinson, D.G.; Smith, R.C.; Iannuzzi, R.A. Sea ice in the western Antarctic Peninsula region: Spatio-temporal variability from ecological and climate change perspectives. Deep-Sea Res. Part II Top. Stud. Oceanogr. 2008, 55, 2041–2058. [Google Scholar] [CrossRef]
- Sziło, J.; Bialik, R. Recession and Ice Surface Elevation Changes of Baranowski Glacier and Its Impact on Proglacial Relief (King George Island, West Antarctica). Geosciences 2018, 8, 355. [Google Scholar] [CrossRef]
- Cook, A.J.; Holland, P.R.; Meredith, M.P.; Murray, T.; Luckman, A.; Vaughan, D.G. Ocean forcing of glacier retreat in the western Antarctic Peninsula. Science 2016, 353, 283–286. [Google Scholar] [CrossRef]
- Falk, U.; Gieseke, H.; Kotzur, F.; Braun, M. Monitoring snow and ice surfaces on King George Island, Antarctic Peninsula, with high-resolution TerraSAR-X time series. Antarct. Sci. 2015, 28, 135–149. [Google Scholar] [CrossRef]
- Falk, U.; López, D.A.; Silva-Busso, A. Multi-year analysis of distributed glacier mass balance modelling and equilibrium line altitude on King George Island, Antarctic Peninsula. Cryosphere 2018, 12, 1211–1232. [Google Scholar] [CrossRef]
- Meredith, M.P.; Falk, U.; Valeria, A.; Mackensen, A.; Schloss, I.R.; Barlett, E.R.; Jerosch, K.; Silva, A.; Abele, D. Anatomy of a glacial meltwater discharge event in an Antarctic cove. Philos. Trans. R. Soc. A Math. Phys. Eng. Sci. 2018, 376, 20170163. [Google Scholar] [CrossRef]
- Dierssen, H.M.; Smith, R.C.; Vernet, M. Glacial meltwater dynamics in coastal waters west of the Antarctic peninsula. Proc. Natl. Acad. Sci. USA 2002, 99, 1790–1795. [Google Scholar] [CrossRef]
- Etherington, L.L.; Hooge, P.N.; Hooge, E.R.; Hill, D.F. Oceanography of Glacier Bay, Alaska: Implications for biological patterns in a glacial fjord estuary. Estuaries Coasts 2007, 30, 927–944. [Google Scholar] [CrossRef]
- Howe, J.A.; Austin, W.E.N.; Forwick, M.; Paetzel, M.; Harland, R.; Cage, A.G. Fjord systems and archives: A review. Geol. Soc. Lond. Spec. Publ. 2010, 344, 5–15. [Google Scholar] [CrossRef]
- Koppes, M.; Hallet, B.; Rignot, E.; Mouginot, J.; Wellner, J.S.; Boldt, K. Observed latitudinal variations in erosion as a function of glacier dynamics. Nature 2015, 526, 100–103. [Google Scholar] [CrossRef] [PubMed]
- Quartino, M.L.; Deregibus, D.; Campana, G.L.; Latorre, G.E.J.; Momo, F.R. Evidence of Macroalgal Colonization on Newly Ice-Free Areas following Glacial Retreat in Potter Cove (South Shetland Islands), Antarctica. PLoS ONE 2013, 8, e58223. [Google Scholar] [CrossRef] [PubMed]
- Sahade, R.; Lagger, C.; Momo, F.R.; Torre, L.; Abele, D.; Barnes, D.K.A.; Tarantelli, S. Climate change, glacier retreat drive shifts in an Antarctic benthic ecosystem. Sci. Adv. 2015, 1, e1500050. [Google Scholar] [CrossRef]
- Valdivia, N.; Díaz, M.J.; Garrido, I.; Gómez, I. Consistent richness-biomass relationship across environmental gradients in a marine macroalgal-dominated subtidal community on the western antarctic peninsula. PLoS ONE 2015, 10, e0138582. [Google Scholar] [CrossRef]
- Deregibus, D.; Quartino, M.L.; Campana, G.L.; Momo, F.R.; Wiencke, C.; Zacher, K. Photosynthetic light requirements and vertical distribution of macroalgae in newly ice-free areas in Potter Cove, South Shetland Islands, Antarctica. Polar Biol. 2016, 39, 153–166. [Google Scholar] [CrossRef]
- Lagger, C.; Nime, M.; Torre, L.; Servetto, N.; Tatián, M.; Sahade, R. Climate Change, Glacier Retreat and a New Ice-Free Island Offer New Insights on Antarctic Benthic Responses. Ecography 2017, 40, 1–12. [Google Scholar] [CrossRef]
- Torre, L.; Tabares, P.C.C.; Momo, F.; Meyer, J.F.C.A.; Sahade, R. Climate change effects on Antarctic benthos: A spatially explicit model approach. Clim. Chang. 2017, 141, 733–746. [Google Scholar] [CrossRef]
- Campana, G.L.; Zacher, K.; Deregibus, D.; Momo, F.R.; Wiencke, C.; Quartino, M.L. Succession of Antarctic benthic algae (Potter Cove, South Shetland Islands): Structural patterns and glacial impact over a four-year period. Polar Biol. 2018, 41, 377–396. [Google Scholar] [CrossRef]
- Kim, S.; Kim, J.H.; Lim, J.H.; Jeong, J.H.; Heo, J.M.; Kim, I.N. Distribution and control of bacterial community composition in marian cove surface waters, king george island, antarctica during the summer of 2018. Microorganisms 2020, 8, 1115. [Google Scholar] [CrossRef]
- Friedlander, A.M.; Goodell, W.; Salinas-de-leo, P.; Ballesteros, E.; Berkenpas, E.; Capurro, A.P.; Cárdenas, C.A.; Hüne, M.; Lagger, C.; Landaeta, M.F.; et al. Spatial patterns of continental shelf faunal community structure along the Western Antarctic Peninsula. PLoS ONE 2020, 15, e0239895. [Google Scholar] [CrossRef] [PubMed]
- Clark, M.S.; Husmann, G.; Thorne, M.A.S.; Burns, G.; Truebano, M.; Peck, L.S.; Abele, D.; Philipp, E.E.R. Hypoxia impacts large adults first: Consequences in a warming world. Glob. Chang. Biol. 2013, 19, 2251–2263. [Google Scholar] [CrossRef] [PubMed]
- Husmann, G.; Abele, D.; Rosenstiel, P.; Clark, M.S.; Kraemer, L.; Philipp, E.E.R. Age-dependent expression of stress and antimicrobial genes in the hemocytes and siphon tissue of the Antarctic bivalve, Laternula elliptica, exposed to injury and starvation. Cell Stress Chaperones 2013, 19, 15–32. [Google Scholar] [CrossRef] [PubMed]
- Abele, D.; Vasquez, S.; Buma, A.G.J.; Hernandez, E. Pelagic and benthic communities of the Antarctic ecosystem of Potter Cove: Genomics and ecological implications. Mar. Genom. 2017, 33, 1–11. [Google Scholar] [CrossRef] [PubMed]
- Schloss, I.R.; Ferreyra, G.A.; Mercuri, G.; Kowalke, J. Particle flux in an Antarctic shallow coastal environment: A sediment trap study. Sci. Mar. 1999, 63, 99–111. [Google Scholar] [CrossRef]
- Schloss, I.R.; Abele, D.; Moreau, S.; Demers, S.; Bers, A.V.; González, O.; Ferreyra, G.A. Response of phytoplankton dynamics to 19-year (1991–2009) climate trends in Potter Cove (Antarctica). J. Mar. Syst. 2012, 92, 53–66. [Google Scholar] [CrossRef]
- Philipp, E.E.R.; Husmann, G.; Abele, D. The impact of sediment deposition and iceberg scour on the Antarctic soft shell clam Laternula elliptica at King George Island, Antarctica. Antarct. Sci. 2011, 23, 127–138. [Google Scholar] [CrossRef]
- Torre, L.; Servetto, N.; Eöry, M.L.; Momo, F.; Tatián, M.; Abele, D.; Sahade, R. Respiratory responses of three Antarctic ascidians and a sea pen to increased sediment concentrations. Polar Biol. 2012, 35, 1743–1748. [Google Scholar] [CrossRef]
- Torre, L.; Abele, D.; Lagger, C.; Momo, F.; Sahade, R. When shape matters: Strategies of different Antarctic ascidians morphotypes to deal with sedimentation. Mar. Environ. Res. 2014, 99, 179–187. [Google Scholar] [CrossRef] [PubMed]
- Pasotti, F.; Manini, E.; Giovannelli, D.; Wölfl, A.; Monien, D.; Verleyen, E.; Braeckman, U.; Abele, D.; Vanreusel, A. Antarctic shallow water benthos in an area of recent rapid glacier retreat. Mar. Ecol. 2015, 36, 716–733. [Google Scholar] [CrossRef]
- Jerosch, K.; Pehlke, H.; Scharf, F.; Weber, L.; Braun, M.H.; Abele, D. Benthic meltwater fjord habitats formed by rapid glacier recession on King Subject Areas. Philos. Trans. R. Soc. A 2018, 376, 20170. [Google Scholar]
- McLaughlin, R.L.; Carl, L.M.; Middel, T.; Ross, M.; Noakes, D.L.G.; Hayes, D.B.; Baylis, J.R. Potentials and Pitfalls of Integrating Data From Diverse Sources: Lessons from a Historical Database for Great Lakes Stream Fishes. Fisheries 2001, 26, 14–23. [Google Scholar] [CrossRef]
- Plouffe, C.C.F.; Robertson, C.; Chandrapala, L. Comparing interpolation techniques for monthly rainfall mapping using multiple evaluation criteria and auxiliary data sources: A case study of Sri Lanka. Environ. Model. Softw. 2015, 67, 57–71. [Google Scholar] [CrossRef]
- Javari, M. Geostatistical and Spatial Statistical Modelling of Precipitation Variations in Iran. J. Civ. Environ. Eng. 2016, 6, 1–30. [Google Scholar] [CrossRef]
- Hengl, T.; Toomanian, N.; Reuter, H.I.; Malakouti, M.J. Methods to interpolate soil categorical variables from profile observations: Lessons from Iran. Geoderma 2007, 140, 417–427. [Google Scholar] [CrossRef]
- Do Amaral, L.R.; Della Justina, D.D. Spatial dependence degree and sampling neighborhood influence on interpolation process for fertilizer prescription maps. Eng. Agric. 2019, 39, 85–95. [Google Scholar] [CrossRef]
- Eljebri, S.; Mounir, M.; Faroukh, A.T.; Zouahri, A.; Tellal, R. Application of geostatistical methods for the spatial distribution of soils in the irrigated plain of Doukkala, Morocco. Modeling Earth Syst. Environ. 2019, 5, 669–687. [Google Scholar] [CrossRef]
- Büttner, O.; Becker, A.; Kellner, S.; Kuehn, B.; Wendt-Potthoff, K.; Zachmann, D.W.; Friese, K. Geostatistical Analysis of surface sediment in an acid mining lake. Water Air Soil Pollut. 1998, 108, 297–316. [Google Scholar] [CrossRef]
- Jerosch, K.; Schlüter, M.; Pesch, R. Spatial analysis of marine categorical information using indicator kriging applied to georeferenced video mosaics of the deep-sea Håkon Mosby Mud Volcano. Ecol. Inform. 2006, 1, 391–406. [Google Scholar] [CrossRef]
- Jerosch, K. Geostatistical mapping and spatial variability of surficial sediment types on the Beaufort Shelf based on grain size data. J. Mar. Syst. 2013, 127, 5–13. [Google Scholar] [CrossRef]
- Zananiri, I.; Vakalas, I. Geostatistical mapping of marine surficial sediment types in the Northern Aegean Sea using indicator kriging. Geo-Mar. Lett. 2019, 39, 363–376. [Google Scholar] [CrossRef]
- Kumar, A.; Maroju, S.; Bhat, A. Application of ArcGIS geostatistical analyst for interpolating environmental data from observations. Environ. Prog. 2007, 26, 220–225. [Google Scholar] [CrossRef]
- Krivoruchko, K. Introduction to Modeling Spatial Processes Using Geostatistcal Analyst. Esri 2004, 1–27. Available online: https://www.esri.com/library/whitepapers/pdfs/intro-modeling.pdf (accessed on 1 December 2020).
- Mabit, L.; Bernard, C.; Makhlouf, M.; Laverdière, M.R. Spatial variability of erosion and soil organic matter content estimated from 137Cs measurements and geostatistics. Geoderma 2008, 145, 245–251. [Google Scholar] [CrossRef]
- Webster, R.; Oliver, M.A. Geostatistics for Environmental Scientists, 2nd ed.; Senn, S., Scott, M., Barnett, V., Eds.; Jonh Wiley & SoNS. Ltd: Chichester, UK, 2007; Volume 2, ISBN 9780470028582. [Google Scholar]
- Monien, D.; Monien, P.; Brünjes, R.; Widmer, T.; Kappenberg, A.; Silva Busso, A.A.; Schnetger, B.; Brumsack, H.-J. Meltwater as a source of potentially bioavailable iron to Antarctica waters. Antarct. Sci. 2017, 29, 277–291. [Google Scholar] [CrossRef]
- Neder, C.; Fofonova, V.; Androsov, A.; Kuznetsov, I.; Abele, D.; Jerosch, K. A new hydrodynamic model for terrestrial run-off in West Antarctic glaciated coves. In Proceedings of the 5th Young Earth Scientist YES Network Congress, Berlin, Germany, 9–13 September 2019. [Google Scholar]
- Klöser, H.; Ferreyra, G.A.; Schloss, I.R.; Mercuri, G.; Laturnus, F.; Curtosi, A. Hydrography of Potter Cove, a Small Fjord-like Inlet on King George Island (South Shetlands). Estuar. Coast. Shelf Sci. 1994, 38, 523–537. [Google Scholar] [CrossRef]
- Rückamp, M.; Braun, M.; Suckro, S.; Blindow, N. Observed glacial changes on the King George Island ice cap, Antarctica, in the last decade. Glob. Planet. Chang. 2011, 79, 99–109. [Google Scholar] [CrossRef]
- Falk, U.; Silva-Busso, A.; Pölcher, P. A simplified method to estimate the run-off in Periglacial Creeks: A case study of King George Islands, Antarctic Peninsula. Philos. Trans. R. Soc. A Math. Phys. Eng. Sci. 2018, 376, 20170166. [Google Scholar] [CrossRef]
- Wölfl, A.-C.; Wittenberg, N.; Feldens, P.; Hass, H.C.; Betzler, C.; Kuhn, G. Submarine landforms related to glacier retreat in a shallow Antarctic fjord. Antarct. Sci. 2016, 12, 1–12. [Google Scholar] [CrossRef]
- Lim, C.H.; Lettmann, K.; Wolff, J.-O. Numerical study on wave dynamics and wave-induced bed erosion characteristics in Potter Cove, Antarctica. Ocean Dyn. 2013, 63, 1151–1174. [Google Scholar] [CrossRef]
- ESRI. Inc Environmental Systems Research Institute, Inc. Desktop 10.4.1, United States. Available online: https://support.esri.com/es/Products/Desktop/arcgis-desktop/arcmap/10-4-1 (accessed on 1 December 2020).
- Monien, D.; Monien, P.; Schnetger, B.; Brumsack, H.-J. Suspended particulate matter in melt water streams on Potter Peninsula, King George Island, maritime Antartica; Institute for Chemistry and Biology of the Marine Environment, Carl-von-Ossietzky University of Oldenburg: Oldenburg, Germany, 2013. [Google Scholar]
- Philipp, E.E.R.; Husmann, G.; Abele, D. Suspended paticulate matter and respiration experiments of Laternula elliptica in Potter Cove, King George Island, Western Antarctic Peninsula. Publ. Earth Environ. Sci. 2011. [Google Scholar] [CrossRef]
- Schloss, I.R. Suspended Particulate Matter Measured on Water Samples of Station PotterCove_3, King George Island, Western Antarctic Peninsula (2002–2010). Publ. Earth Environ. Sci. 2010. [Google Scholar] [CrossRef]
- Schloss, I.R. Suspended Particulate Matter Measured on Water Samples of Two Stations at Potter Cove, King George Island, Western Antarctic Peninsula (1992–2010). Publ. Earth Environ. Sci. 2010. [Google Scholar] [CrossRef]
- Neder, C.; Jerosch, K.; Monien, D.; Philipp, E.E.R.; Schloss, I.R. Suspended particulate matter (SPM) and meteorological data in Potter Cove (74 stations), Carlini Station, King George Island (Isla 25 de Mayo) of 21 years German-Argentinian cooperation (1992–2013) compiled within IMCONet. Publ. Earth Environ. Sci. 2016. [Google Scholar] [CrossRef]
- Schloss, I.R.; Neder, C.; Jerosch, K. Suspended particulate matter (SPM) stations of 3 georeferenced transects in Potter Cove 1996–1997. Publ. Earth Environ. Sci. 2016. [Google Scholar] [CrossRef]
- Robinson, T.P.; Metternicht, G. Testing the performance of spatial interpolation techniques for mapping soil properties. Comput. Electron. Agric. 2006, 50, 97–108. [Google Scholar] [CrossRef]
- Huisman, O.; de By, R.A. Principles of Geographic Information Systems, 4th ed.; Huisman, O., de By, R., Eds.; ITC International Institute for Geo-Information Science and Earth Observation: Enschede, The Netherlands, 2009; ISBN 978–90–6164–269–5 ITC. [Google Scholar]
- Johnston, K.; Ver Hoef, J.M.; Krivoruchko, K.; Lucas, N. Using ArcGIS Geostatistical Analyst; Esri: Redlands, CA, USA, 2003; Volume 300, ISBN 1589480066. [Google Scholar]
- Jerosch, K.; Scharf, F.K.; Deregibus, D.; Campana, G.L.; Zacher, K.; Pehlke, H.; Falk, U.; Hass, H.C.; Quartino, M.L.; Abele, D. Ensemble Modeling of Antarctic Macroalgal Habitats Exposed to Glacial Melt in a Polar Fjord. Front. Ecol. Evol. 2019, 7, 207. [Google Scholar] [CrossRef]
- Quartino, M.L.; Klöser, H.; Schloss, I.R.; Wiencke, C. Biomass and associations of benthic marine macroalgae from the inner Potter Cove (King George Island, Antarctica) related to depth and substrate. Polar Biol. 2001, 24, 349–355. [Google Scholar] [CrossRef]
- Lagger, C.; Servetto, N.; Torre, L.; Sahade, R. Benthic colonization in newly ice-free soft-bottom areas in an Antarctic fjord. PLoS ONE 2017, 12, e0186756. [Google Scholar] [CrossRef]
Publisher’s Note: MDPI stays neutral with regard to jurisdictional claims in published maps and institutional affiliations. |
© 2020 by the authors. Licensee MDPI, Basel, Switzerland. This article is an open access article distributed under the terms and conditions of the Creative Commons Attribution (CC BY) license (http://creativecommons.org/licenses/by/4.0/).