Abstract
A new class of problems in free surface hydrodynamics appeared after the groundbreaking discovery by Yves Couder and Emmanuel Fort. A bouncing droplet in association with Faraday surface waves gives rise to new nonlinear dynamics, in analogy with the pilot-wave proposed by de Broglie. The droplet and the underlying vibrating bath are of silicon oil. A weakly viscous potential theory model should be used. Numerical simulations are presented with one and two bouncing droplets oscillating while confined to their cavities. These oscillators are implicitly coupled by the underlying surface wave field. In certain regimes, the oscillators can spontaneously synchronize, even when placed at a distance. Cavity parameters are varied in order to highlight the sensitive wave-mediated coupling. The present nonlinear wave-mediated oscillator synchronization is more general than that displayed by the celebrated Kuramoto model and therefore of general interest.
1. Introduction
Free surface hydrodynamics is an extremely rich and important area of research with applications in surface ocean waves, internal ocean waves and flows in rivers and open channels, among many others in geophysics. In mathematics it is also of much current interest, ranging from more applied studies, such as asymptotic theories, reduced modeling and numerical simulations [1,2], all the way to rigorous analysis [3,4]. The books mentioned above are good sources of references and problems in the literature. The mathematical setup in this article is very similar to water waves but we consider surface waves of silicon oil.
The present study addresses small scale problems in free surface hydrodynamics where we need to account for surface tension. This class of problems appeared after the groundbreaking discovery by Yves Couder and Emmanuel Fort [5]. In this past decade, a great amount of research addressed a new wave-particle association, namely, that of a bouncing (silicon oil) droplet associated with the underlying wave field generated by each bounce. These bouncing droplets levitate over a vibrating bath of the same fluid. Under appropriate conditions, the droplet does not coalesce with the underlying fluid due to a thin air layer that prevents contact. If the vibrational forcing reaches a certain amplitude, the bouncing droplet can destabilize laterally and start “walking” over the free surface; namely, it is self-propelled by the Faraday waves it generates. The Faraday wave-droplet system is a macroscopic hydrodynamic analogue of what de Broglie envisioned in quantum mechanics as a pilot-wave system [5,6]. Harris and Bush [7] have a YouTube video displaying the droplet dynamics in a way which is quite useful for the modeling to be presented.
The hydrodynamic pilot-wave system is an object that was not imagined to exist in classical mechanics, namely, an object with the dynamical properties of both a particle and a wave. The dynamics of the wave-particle association are new and highly non-trivial, as will be shown in the present article. New laboratory and numerical findings are fostering further theoretical developments. The Faraday waves generated by a certain number of droplet-bounces give rise to a wave field with memory [5,6]. As will be further detailed in the next section, these Faraday surface waves are generated just below the Faraday instability threshold. The droplet-generated waves are governed by a system of partial differential equations (PDEs) through a weakly viscous, quasi-potential linear theory, as presented by Dias, Dyachenko and Zakharov [8]. This set of wave equations along the free surface is coupled to a trajectory equation for the droplet. The trajectory equation arises from Newton’s law as a weakly damped, mass-spring-type ordinary differential equation (ODE). As will be further explained, the feedback between the wave and droplet is highly nonlinear. Hence, we present a new nonlinear problem in free surface hydrodynamics, even though the waves are linear. The nonlinearity is present in the forcing terms of the PDE and ODE system.
Conformal mapping plays an important role in the mathematical modeling and in the numerical scheme. Through conformal mapping, the two-dimensional fluid dynamics are mathematically restricted to the one-dimensional free surface. In their reference work [9] conformally mapped the wave-free water surface onto a canonical flat boundary. In the present work we map nonsmooth polygonal bottoms, namely, the cavities, onto a flat bottom by using a numerical Schwarz-Christoffel mapping [10]. The mapping allows for the construction of a Dirichlet-to-Neumann (Fourier-type) operator, making computations more efficient. A brief bibliographic review on the conformal mapping of surface wave problems, and on the numerical construction of Dirichlet-to-Neumann operators, is presented at the beginning of Section 2.1.
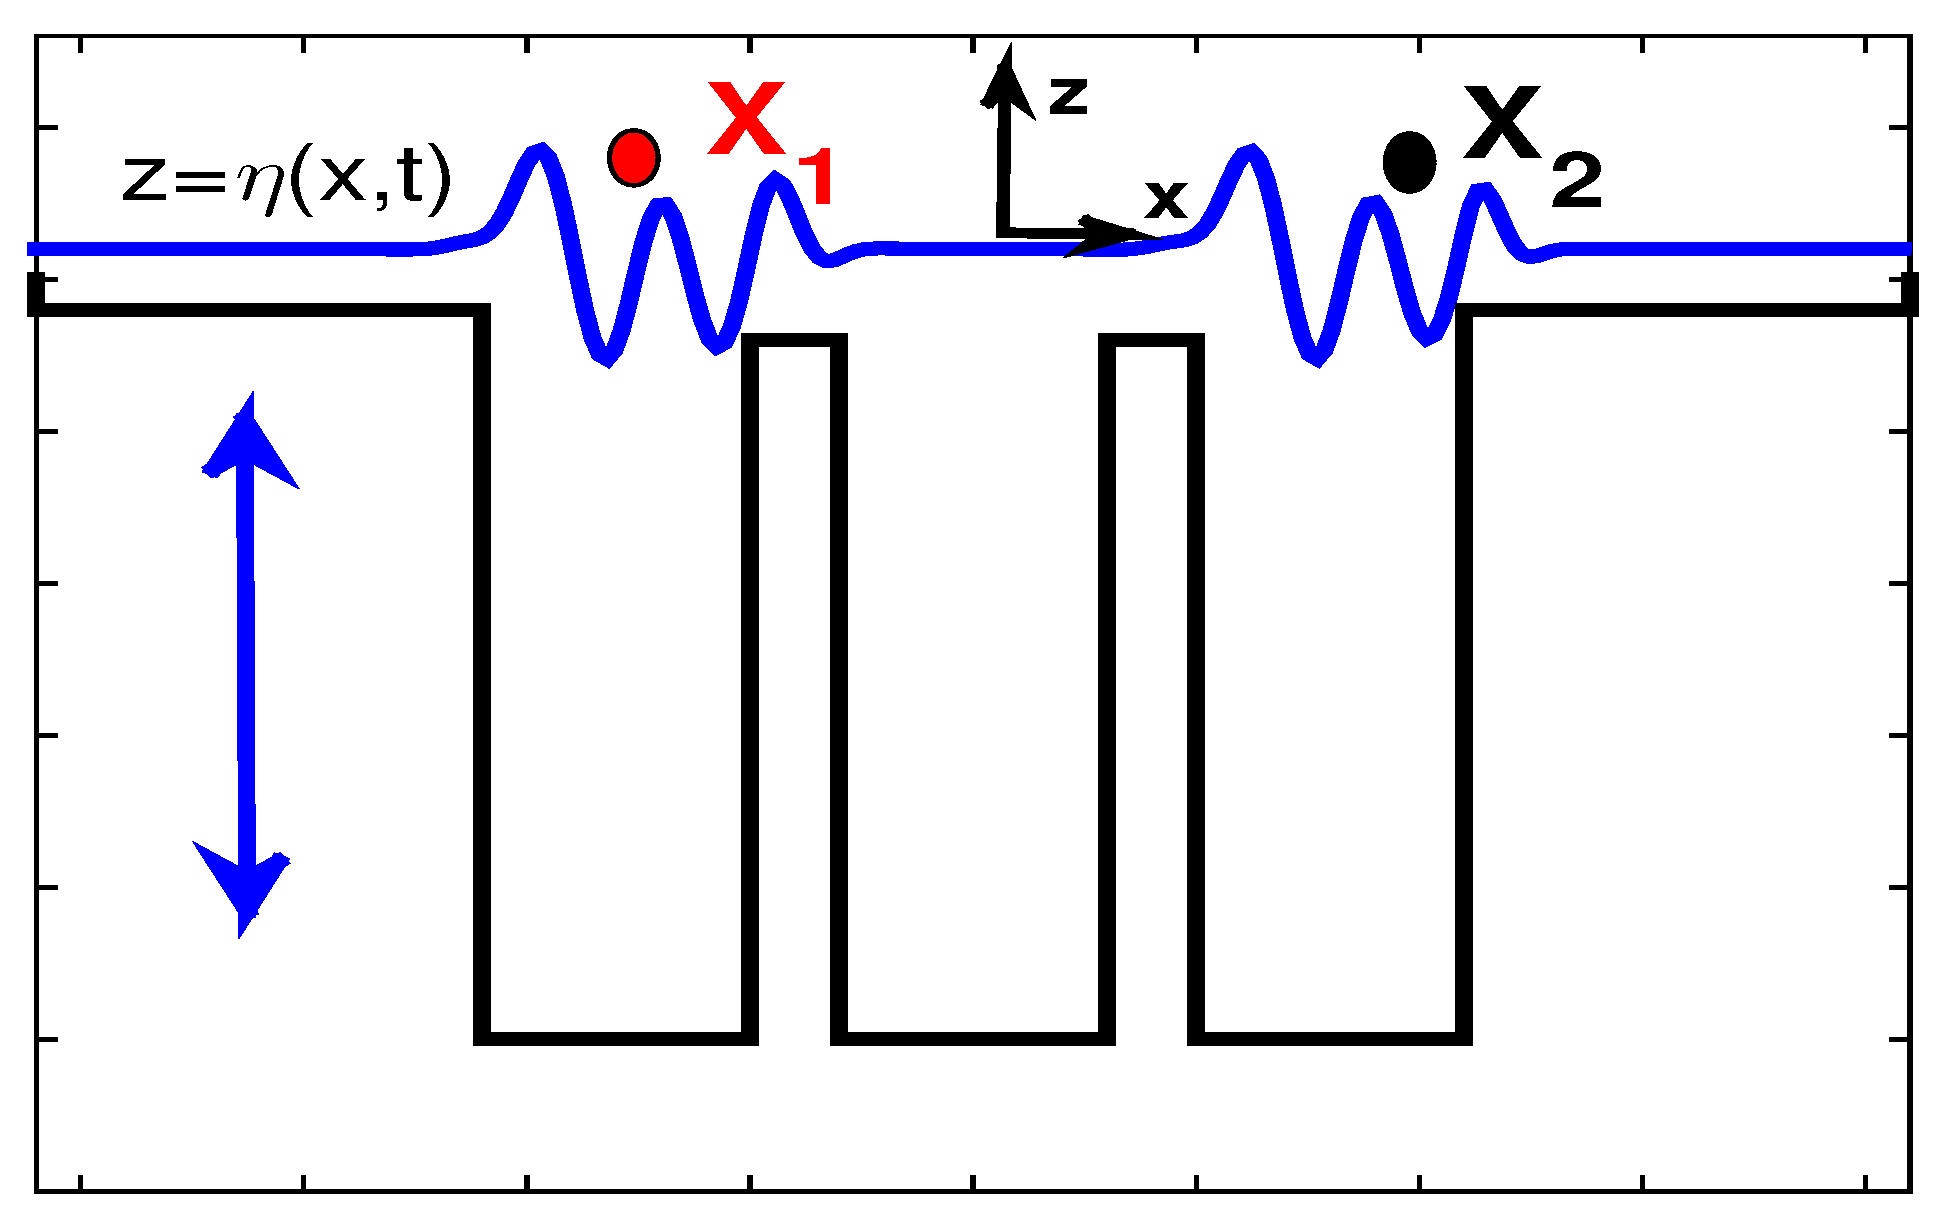
Over the past decade researchers have presented several analogies of the hydrodynamic pilot-wave with quantum mechanics, as found in the review papers by Bush [6] and Bush and Oza [11]. The contribution of our present work is not only due to the recent discovery and its connections with quantum mechanics. An important aspect in their own right are the novel and nontrivial nonlinear dynamics that lead to many theoretical questions. There are many mathematical problems that arise, or become connected, and that might have impacts on different topics. Here our main issue is the wave-mediated nonlinear dynamical coupling of oscillators. We confine two droplets in fluid cavities separated by a distance. The fluid problem is set up in two dimensions, where the free surface is one-dimensional, as indicated in Figure 1. In a certain vibrational regime these droplets will oscillate back and forth within each cavity without escaping. We will exhibit a regime where these oscillators will spontaneously synchronize, even though they are separated by a large distance. Their implicit nonlinear coupling is promoted by the underlying Faraday wave field. This spontaneous synchronization, and its connections/generalizations regarding the celebrated Kuramoto model [12,13], were recently discovered in Nachbin [14]. In the present article the synchronization is further studied and detailed.
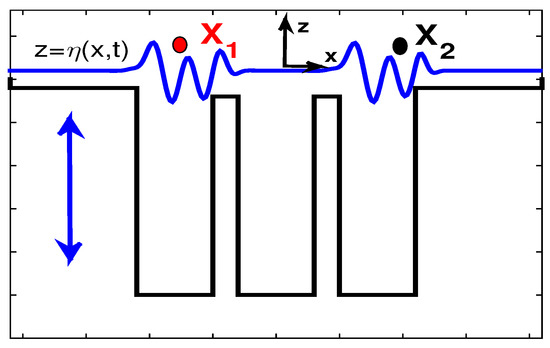
Figure 1.
This is a schematic representation of the fluid domain with 3 cavities. All cavities are of the same width and depth but do not need to be the same. The arrows indicate that the bath is vibrating vertically at a prescribed frequency . Some simulations have one droplet, while others have two droplets confined in different cavities, as shown by the dots above the surface wave profile .
As mentioned, these new dynamical features are of interest in other fields. The hydrodynamic coupling between oscillators has a recent biological application. Guo et al. [15] studied how cilia and flagela can beat in synchrony. They coupled an elastic rod model, for the force and bending moment exerted on a filament, together with an incompressible Stokes equation for the highly viscous hydrodynamic flow component. This allowed the authors to study two hydrodynamically coupled elastic filaments separated by a distance D and subject to same the driving moment at their base. The distance D has to be small so that the filaments can interact, but large enough so that they do not intersect while oscillating. The coupling between oscillators is due to hydrodynamic interactions only. Synchrony arises autonomously (i.e., spontaneously) only due to the hydrodynamic coupling and filament elasticity. The work of Guo et al. [15], mathematically models the full hydrodynamic interactions between filaments based on earlier experimental findings by Brumley et al. [16]. This former article reports qualitative features also observed with the present pilot-wave model, which has more subtleties, for example, the interaction/coupling being switched on-and-off. In the present model the bouncing droplet flies for 3/4 of a Faraday period and therefore only interacts with the underlying wave field for 1/4 of the period. We call attention to some quotes from Brumley et al. [16]. The authors mention that for sufficiently strong hydrodynamic coupling, through the fluid flow, a common phase-locked frequency can arise through a mutual perturbation from their intrinsic limit cycles. For several different regimes, we will numerically study droplet cycles in phase space and observe a similar mutual perturbation of their intrinsic limit-cycles. Here, wave-mediated forcing affects oscillators at a distance. Brumley et al. [16] mention that the precise role that filament flexibility plays in facilitating synchrony is unknown. We display some scenarios which seem to facilitate droplets oscillating in synchrony, but the precise ingredients and regimes with which spontaneous synchronization takes place are also unknown. Finally, ref. Brumley et al. [16] mention that there is a spatial dependence between oscillators (filaments); at close spacings, robust synchrony is observed. However, as the separation between filaments increases, synchrony degrades and is replaced by a stochastic behavior. This is also observed in some cases where the oscillating droplets are further removed from each other. Nevertheless, as first exhibited in Nachbin [14], we found cases where distant oscillators lost the usual state of coherence (sychrony) but displayed a new form, which was called statistical coherence. The droplets were considered statistically indistinguishable due to their identical (numerical) probability density functions, constructed from their respective cycles in phase space.
It is also worth mentioning work on nonlinear particle kinematics of ocean waves. Sclavounos [17] derived an equation for Lagrangian kinematics of fluid particles on the surfaces of nonlinear ocean waves. The particle trajectory equation accepts as input a prescribed ambient wave surface elevation, specified in a deterministic or stochastic fashion. Hence, there is no feedback, as in our case. Horizontal particle trajectories, for example, in a study involving the interaction of ocean waves and floating structures, may potentially have a singular behavior. The finite time blow-up of solutions is ruled out in a Hamiltonian formulation presented by Fedele et al. [18].
The present article is organized in the following manner. In Section 2 we present the mathematical model for droplet trajectories , , based on Newton’s law, where the damped oscillator forcing arises from the underlying wave field . These ODEs are coupled to the surface wave system of PDEs, obtained asymptotically from the Navier-Stokes equation as a weakly-viscous potential theory model. With the harmonic component of the flow at hand, a conformal mapping from the canonical domain onto the physical domain, and the respective construction of a Dirichlet-to-Neumann (DtN) operator, are then discussed in this modeling Section 2. The DtN operator allows for the 2D fluid dynamics to be reduced to the 1D free surface. The numerical formulation of the 1D coupled wave-particle dynamics is outlined in Section 3. Numerical results leading to a generalized Kuramoto-like spontaneous synchronization of oscillating droplets are presented in Section 4. In Section 5 we end with a discussion on the results presented and on issues of interest for future studies.
2. Mathematical Model
Consider a bouncing droplet walking in free space (no boundaries) generating two-dimensional (2D) surface waves at each bounce. Small droplet deformations are ignored and it effectively behaves as a bouncing sphere. A 2D wave model was asymptotically deduced from the 3D, free surface, linear Navier-Stokes equation by Milewski et al. [19]. The free surface wave equations arise as a quasi-potential model along the lines of that proposed by Dias, Dyachenko and Zakharov [8]. Namely it is a viscous perturbation of the usual kinematic and Bernoulli free surface conditions. The viscous perturbation arises in the form of a diffusion term. The asymptotic formulation [8,19] gives rise to a diffusion term which represents, to leading order, the vortical component of the velocity field along the free surface. In other words, it is the leading order contribution arising from the streamfunction, after the Helmholtz decomposition has been invoked. The diffusive form of the quasi-potential model was tested with very good agreement against laboratory data in Milewski et al. [19]. Hence the asymptotic reduction of the Navier-Stokes equation, together with other hypotheses, are all in place. For example, due to the quasi-potential formulation, the no-slip condition is not applied at the bottom. On the other hand, Faraday waves are not long enough to experience bottom friction in the cavities. More importantly, as will be seen, the wave field depends on the aspect ratio of the cavities and viscosity plays a role mostly in the wave memory and in the extent of the pilot-wave modulation. We note that the kinematic viscosity and the vibrational forcing are the two main parameters controlling the pilot-wave memory [6]. The reduced (quasi-potential) wave model is forced by a localized pressure term representing the presence of a bouncing droplet. The pressure term has different versions used by the author and collaborators. It can vary in space [19], being stronger at the center of the droplet’s circular “footprint”, or a constant pressure over the entire “footprint”, as will be used here. In Milewski et al. [19] the model involved the droplet’s vertical dynamics. The droplet had a dynamically computed footprint that grew from 0 up to a disk, and then back to 0 when the droplet was about to bounce off into flight, under the effect of surface tension .
The free space model deduced by Milewski et al. [19] was reduced to a 1D wave model when studying tunneling [20] in the presence of submerged barriers. Barriers form cavities which play the role of potential wells trapping a particle/droplet. In this case, the fluid domain is 2D, and conformal mapping is used with the highly irregular submerged topography to analytically reduce the 2D fluid dynamics solely along the free surface, namely, by using a Dirichlet-to-Neumann (DtN) operator, as will be discussed later.
To formulate our model we need equations for the droplet dynamics. The nonlinearity of this problem is hidden in the feedback between wave and droplet. In the spirit of a free boundary problem, the bouncing droplet generates linear waves which guide the droplet to the next point where waves will be generated. Hence, it is not clear, from one instant in time to another, where the bouncing droplet will press the free surface and generate new waves. This takes place periodically in time, at intervals the length of a Faraday period.
As formulated in [20], we consider a 1D model permitting one or two droplets. The physical domain has several cavities, as depicted schematically in Figure 1. The droplet dynamics are studied in the context of a vibrating bath, which is shaken vertically at 80 Hz, as indicated by the arrows. A trajectory equation for each particle follows from Newton’s law [6]. One droplet is positioned at and the other at . Along the lines of a damped oscillator model, the wave-particle association reads as follows:
where the surface wave elevation is denoted as . The droplet’s mass is indicated by m, while the skin-friction, due to the droplet’s pressing on the free surface, is given by . The coefficient is a restoring force that depends on surface tension [6,19,20]. The particle’s skidding friction (damping) constant c follows the modeling presented in [19]. Throughout our simulations it will be taken as . A surface wave model is coupled to the droplet dynamics. The velocity potential denoted by is a harmonic function in the fluid domain, satisfying Laplace’s equation. The fluid velocity in the bulk is given by . The fluid bath oscillates vertically at frequency . We formulate our model in the bath’s reference frame, with a periodically varying gravity coefficient . The constant g is the usual acceleration due to gravity, and indicates the strength of the vertical shaking. The free surface wave equations [19,20] at are:
where the pressure term in Equation (4) indicates the presence of droplet-j, , acting as a wave-maker at position during the contact-time interval.
Recall the standard damped mass-spring oscillator. Here we can interpret the wave elevation in (1) and (2) playing the role of a dynamically evolving potential for the spring. The particles feel the submerged cavities, and each other, through the underlying wave-field. Our goal is to study different effects of these wave-mediated dynamics, where particles generate waves and are self-propelled at different speeds, depending on the local wave slope .
The model in Milewski et al. [19] considered the vertical dynamics of the droplet. The respective mode was denoted by (M,N), where over M cycles of the bath the droplet would bounce N times. In principle the bounces were different, but the pattern would repeat after every M cycles. In the present simplified model, vertical dynamics are not considered. Here we impose the period doubling regime (2,1) so that the droplet bounces once after two cycles of the bath. We also impose that the droplet presses the free surface by a prescribed time interval, as explained below. Hence, only the horizontal droplet dynamics are accounted for. With this constraint the forcing term and the coefficient are prescribed to be activated and to be switched off during a Faraday period . As explained in [6,19] this regime refers to the period doubling regime: for each droplet bounce the vibrating bath undergoes two cycles. In this regime the droplet is in resonance with the most unstable (subharmonic) Faraday mode [6,19].
Following values observed in laboratory experiments [21], we impose as the length of the contact-interval . During this time interval the bath surface acts as an elastic membrane which at the end of throws the droplet back into flight. The droplet flies for 3/4 of the Faraday period, when and are switched off. The nonlinear feedback terms are the droplet wave-making in (4) and the propulsive wave forces in (1) and (2). The former is the droplet feedback and the latter the wave’s feedback acting on the droplet. They switch on and off during every Faraday period. The droplets’ pressure terms are compactly supported in space. Their support equals the projected area (“footprint”) of the droplet. Both feedback terms play an important role in the novel coupled-oscillator study here presented.
Faraday waves depend on the shaking strength [6]. Thus, a few comments are called for. In the absence of a droplet the fluid is quiescent for , where is the Faraday threshold. When a subharmonic instability takes place and standing Faraday waves of wavelength arise. The linear problem is unstable above this threshold, but nonlinearity arrests the amplitude growth and produces standing waves with beautiful patterns which depend on eigenfunctions of the Laplacian [6,22]. While in our study is always below , the droplet at each bounce locally triggers the subharmonic, most unstable Faraday mode [6,19]. In the bouncing mode , a droplet can bounce indefinitely at a given point above the free surface [7]. This was first identified by Walker [23]. When the parameter exceeds the walking threshold , the droplet executes horizontal motion [6]. Namely, as one increases the shaking strength the bouncing droplet destabilizes laterally and starts “walking”, self-propelled by the wave field it generates [7].
As mentioned, we consider period doubling in the walking regime , where the droplet bounces at every two bath cycles, with frequency . The self-propelled droplet is in resonance with the Faraday wave, namely, at the same period as the underlying wave field [22]. In Milewski et al. [19] the droplet could dynamically adjust to different bouncing modes since the model incorporated an equation for the vertical dynamics. After a few bounces, a coherent wave structure forms around the droplet. This composite wave field has a memory from a number of previous bounces [5,6]. The local wave field that dresses the particle is a nearly monochromatic modulated wavetrain. The wave-particle association is thus established as a unit and the droplet is guided by its hydrodynamic pilot-wave.
In the following subsection we present the nonlocal formulation through the use of a Dirichlet-to-Neumann operator which allows the 2D problem to be analytically reformulated considering only one spacial variable along the undisturbed fluid free surface.
2.1. Conformal Mapping and the Dirichlet-to-Neumann Operator
In this section we present an overview of the conformal mapping, which flattens the bottom topography, allowing for the construction of a Dirichlet-to-Neumann (DtN) operator in the canonical flat bottom strip. First, we briefly mention some earlier work.
Conformal mapping of the fluid domain is a known and very useful technique in free surface hydrodynamics. A reference work on the subject is that of Dyachenko et al. [9], wherein the wave-free water surface is mapped onto a canonical flat boundary. Among others, the Hamiltonian structure has been explored in cases wherein the free surface elevation and the trace of the velocity potential are the canonical Hamiltonian variables. Nachbin [24], on the other hand, used a conformal mapping to deal with a highly variable bottom topography, without flattening the free surface. In the weakly nonlinear case, the Jacobian, to leading order, is time independent along the undisturbed free surface and several Boussinesq-type systems were derived in the presence of large amplitude, rapidly varying topographies. These included nonsmooth, polygonal-shaped bottoms where the Schwarz-Christoffel mapping is applicable [25]. In the presence of randomly varying nonsmooth topographies, this combined (long-wave/conformal-mapping) modeling captured the apparent diffusion of water waves [26] and their time-reversed waveform inversion (refocusing) [27,28]. A composite conformal mapping, combining in two steps the flattening of the bottom and of the free surface, was presented by Ruban [29]. An iterative Fourier integral method was presented by Flamarion et al. [30] mapping the canonical strip onto the physical domain, consisting of a smooth bottom and a dynamically changing free surface. It was used for surface wave generation by a sheared current interacting with a submerged mound. The mapping approximation is limited to certain cases, and only in one direction of the mapping. However, it was effective as further used by Flamarion et al. [31] in studying the submarine interaction of a Kelvin cat-eye structure with a topography. In Andrade and Nachbin [32] conformal mapping was used in a 3D potential theory formulation, but having a 1D ridge-like topography. The Laplacian is no longer invariant under the change of coordinates, but a long-wave Boussinesq-type equation was deduced for 2D, weakly nonlinear surface waves propagating over highly variable, nonsmooth ridges.
In the absence of bottom variations many authors used DtN operators to analytically resolve the vertical structure of the harmonic velocity potential. One reference work on the subject is that by Craig and Sulem [33], where for weakly nonlinear waves, the DtN operator was approximated by an iteration of the undisturbed DtN operator. The DtN iterates were also obtained in a reduced potential theory modeling by Artiles and Nachbin [34] which generalized the work by Matsuno [35]. Using complex function theory Matsuno [35] deduced a fully dispersive Boussinesq-type system over a flat bottom. Using conformal mapping and the iterated DtN operator, this fully dispersive Boussinesq model was formulated in the presence of nonsmooth topographies [34]. A DtN operator was numerically constructed by Andrade and Nachbin [36] for 3D potential theory over general highly variable topographies. One cannot use conformal mapping, and the DtN operator is constructed using both modes of the harmonic extension of Fourier modes along the depth.
In the present study the conformal mapping and DtN operator are formulated as follows. By we denote the two-dimensional highly variable fluid domain. The profile of the bottom topography, namely, the cavity distribution with high barriers, is represented by the function . The velocity potential in the bulk of the silicon oil follows the usual water-wave models [24,37]. The fluid velocity is given by and we have Laplace’s equation
together with a Neumann condition
along the impermeable bottom. We take the domain to be long so that at the endpoints () the flow can be assumed to be at rest.
Conformal mapping plays an important role in calculating the Dirichlet-to-Neumann (DtN) operator in the presence of several cavities. Having the DtN operator at hand, the 2D fluid problem analytically reduces to a (nonlocal) dynamical system only along the undisturbed free surface .
The desired Neumann condition along the undisturbed free surface is the vertical speed in Equation (3). A Fourier-type operator is constructed, taking into account information of an underlying harmonic function in the bulk, having a homogeneous Neumann condition along the variable bottom. We will now briefly describe the steps for numerically computing the DtN operator.
In order to construct the DtN operator we first need to perform a conformal mapping from a uniform/canonical strip of unit height onto our corrugated fluid domain defined in the complex Z-plane, where . In the presence of cavities and barriers, the lower boundary is a polygonal line. Hence, we use the Schwarz-Christoffel mapping [25] which is formulated for polygonal domains. In the complex w-plane () we have our canonical strip. The Schwarz-Christoffel mapping is denoted by , where is equal to the Jacobian for the change of variables. The harmonic functions and satisfy the Cauchy-Riemann equations and therefore . It also follows for the velocity potential that
Inverting a linear system [24] yields
The waves have small amplitudes and the linear free surface conditions are used. The undisturbed canonical free surface is mapped to the undisturbed physical free surface. Therefore, the above relation becomes
The DtN operator in the physical domain is therefore related to the DtN operator in the canonical domain.
Due to the numerical mapping scheme to be used, the undisturbed free surfaces in the physical and canonical domains are respectively given by and . Along the undisturbed free surface we have that . We call our metric coefficient.
In the canonical domain the Fourier representation of the DtN operator is easily obtained. The time-dependent Dirichlet data is given by in the w-plane. Therefore, its Fourier representation is
The harmonic extension of the Dirichlet data into the unit strip, after differentiation in , yields the Dirichlet-to-Neumann operator in the w-plane:
Putting together (5) and (6), we obtain the DtN operator in the physical domain:
The DtN operator is first computed in the w-plane in terms of the -variable (c.f. (6)). After rescaling with the metric coefficient, the DtN operator is then evaluated in the physical domain. An important step is to use the inverse-map to compute . Numerically speaking, given a set of uniformly distributed points in the physical domain, we obtain their pre-image , where quantities of interest will be numerically evaluated. In possession of this non-local operator, the 2D variable-depth fluid problem has been (analytically) reduced to a dynamical system in only one space variable, namely, in terms of x only, along the undisturbed free surface.
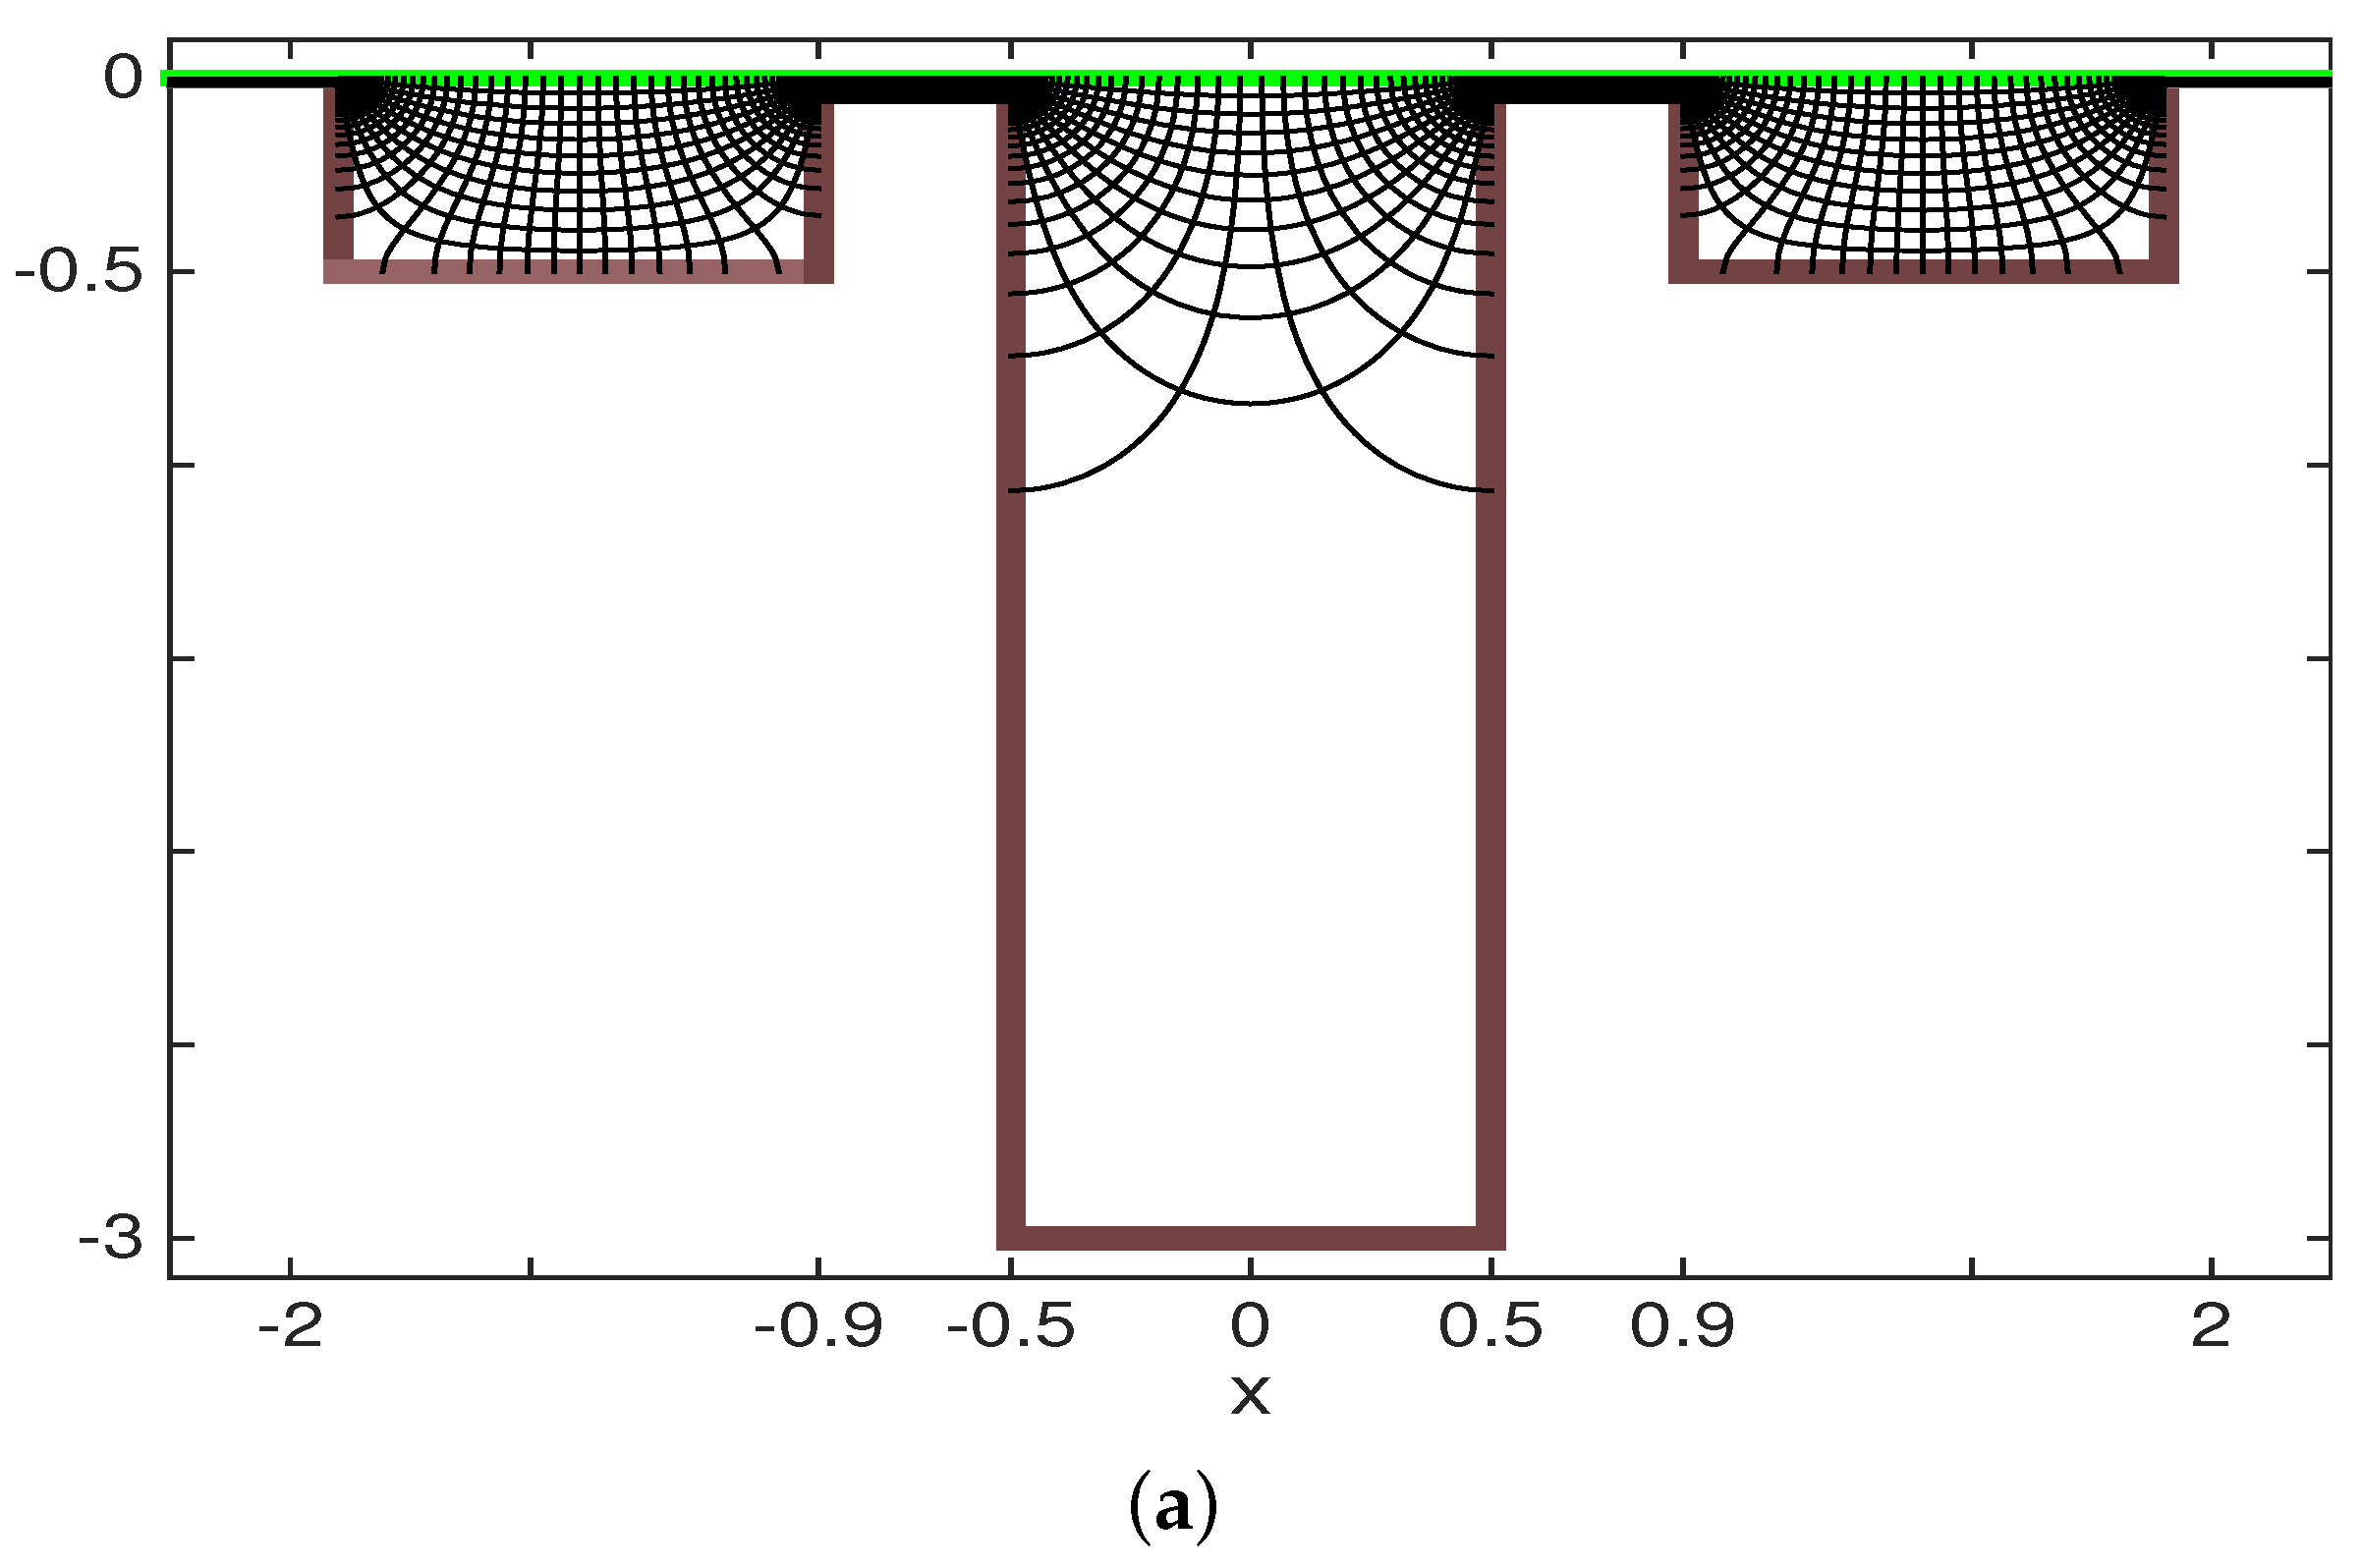
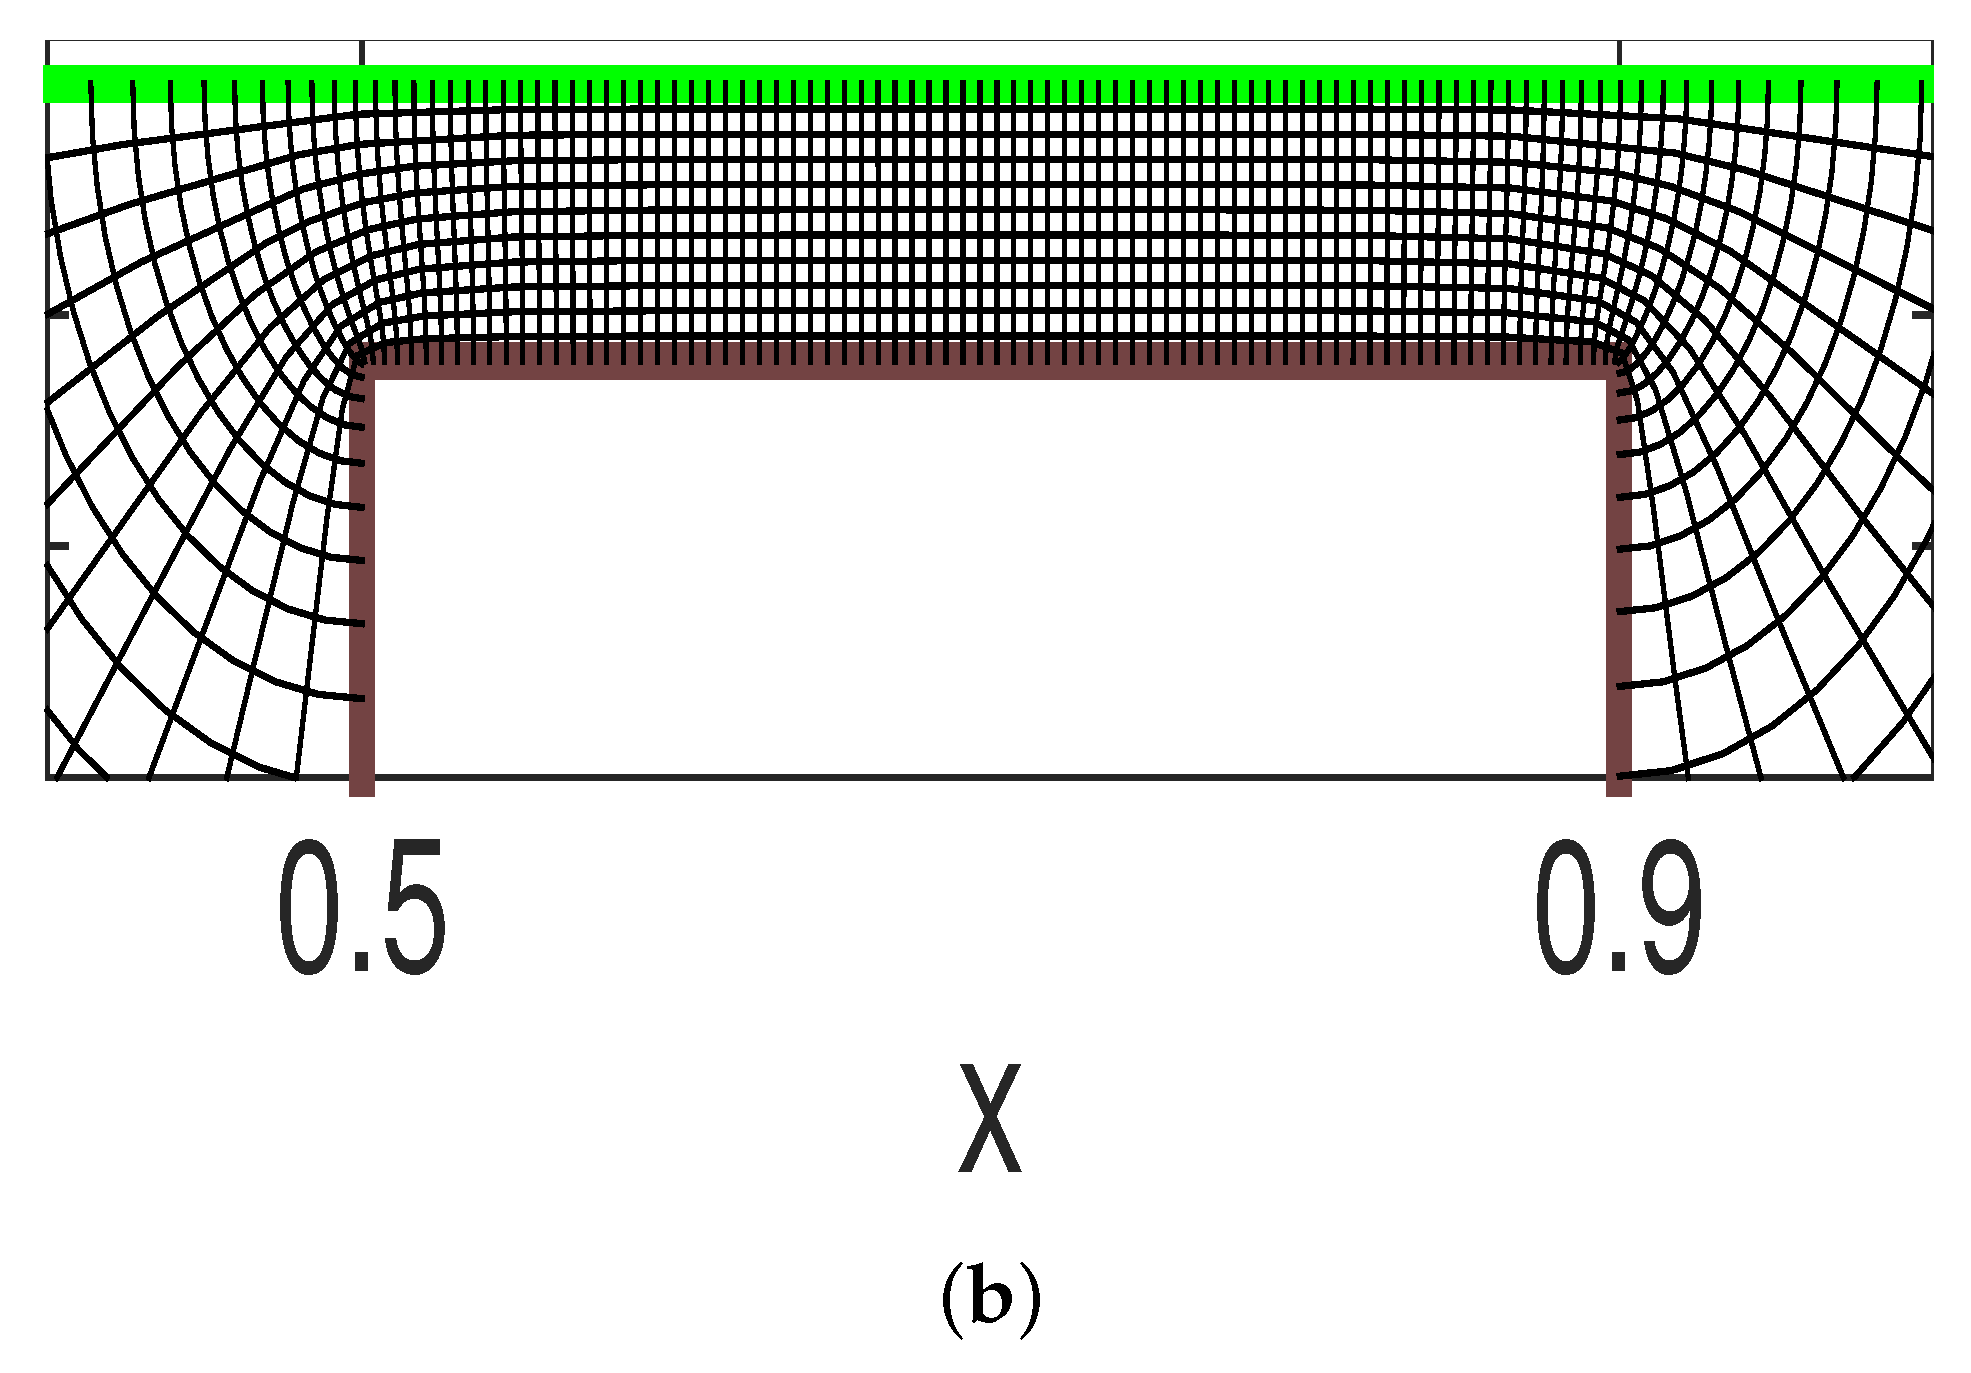
The Fourier integral in (6) represents a pseudo-differential operator with the symbol (i.e., Fourier multiplier) equal to . In our wave-regime of interest the symbol can not be simplified. The underlying effect of the barrier, through its width and height, comes into the model through the Fourier integral in a nontrivial fashion, both through the metric term M and the relation. In Figure 2 we have three cavities with two barriers. The Cartesian coordinate system, with equally spaced level lines in the w-plane, becomes a highly distorted (orthogonal) curvilinear coordinate system in the Z-plane. Note that the bottom of the mid-cavity is effectively not “seen” with the graphing resolution used in the visualization of the conformal map’s level curves. The resolution used was 300 curves in and 10 curves in . The curvilinear coordinate system appears well resolved in the side cavities. The relation is highly nontrivial.
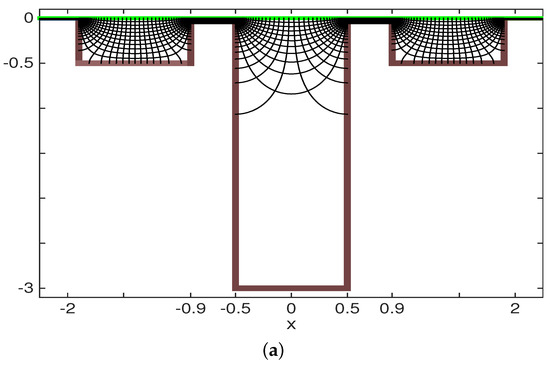
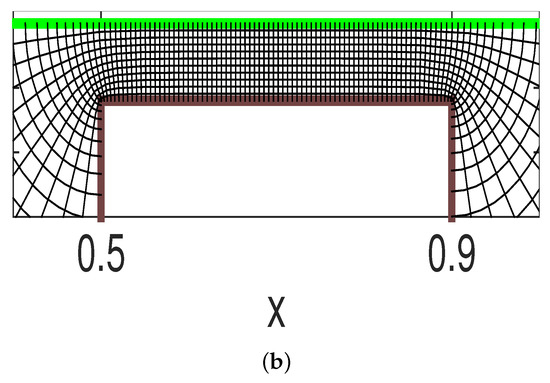
Figure 2.
(a) At the top: Three cavities with the orthogonal level curves from the conformal mapping . The Schwarz-Christoffel Toolbox (SCT) used 300 points for , and 10 depth levels for . (b) At the bottom: Detail of the level curves over the barrier, displaying the high degree of distortion from a uniform grid in one domain when mapped to the other.
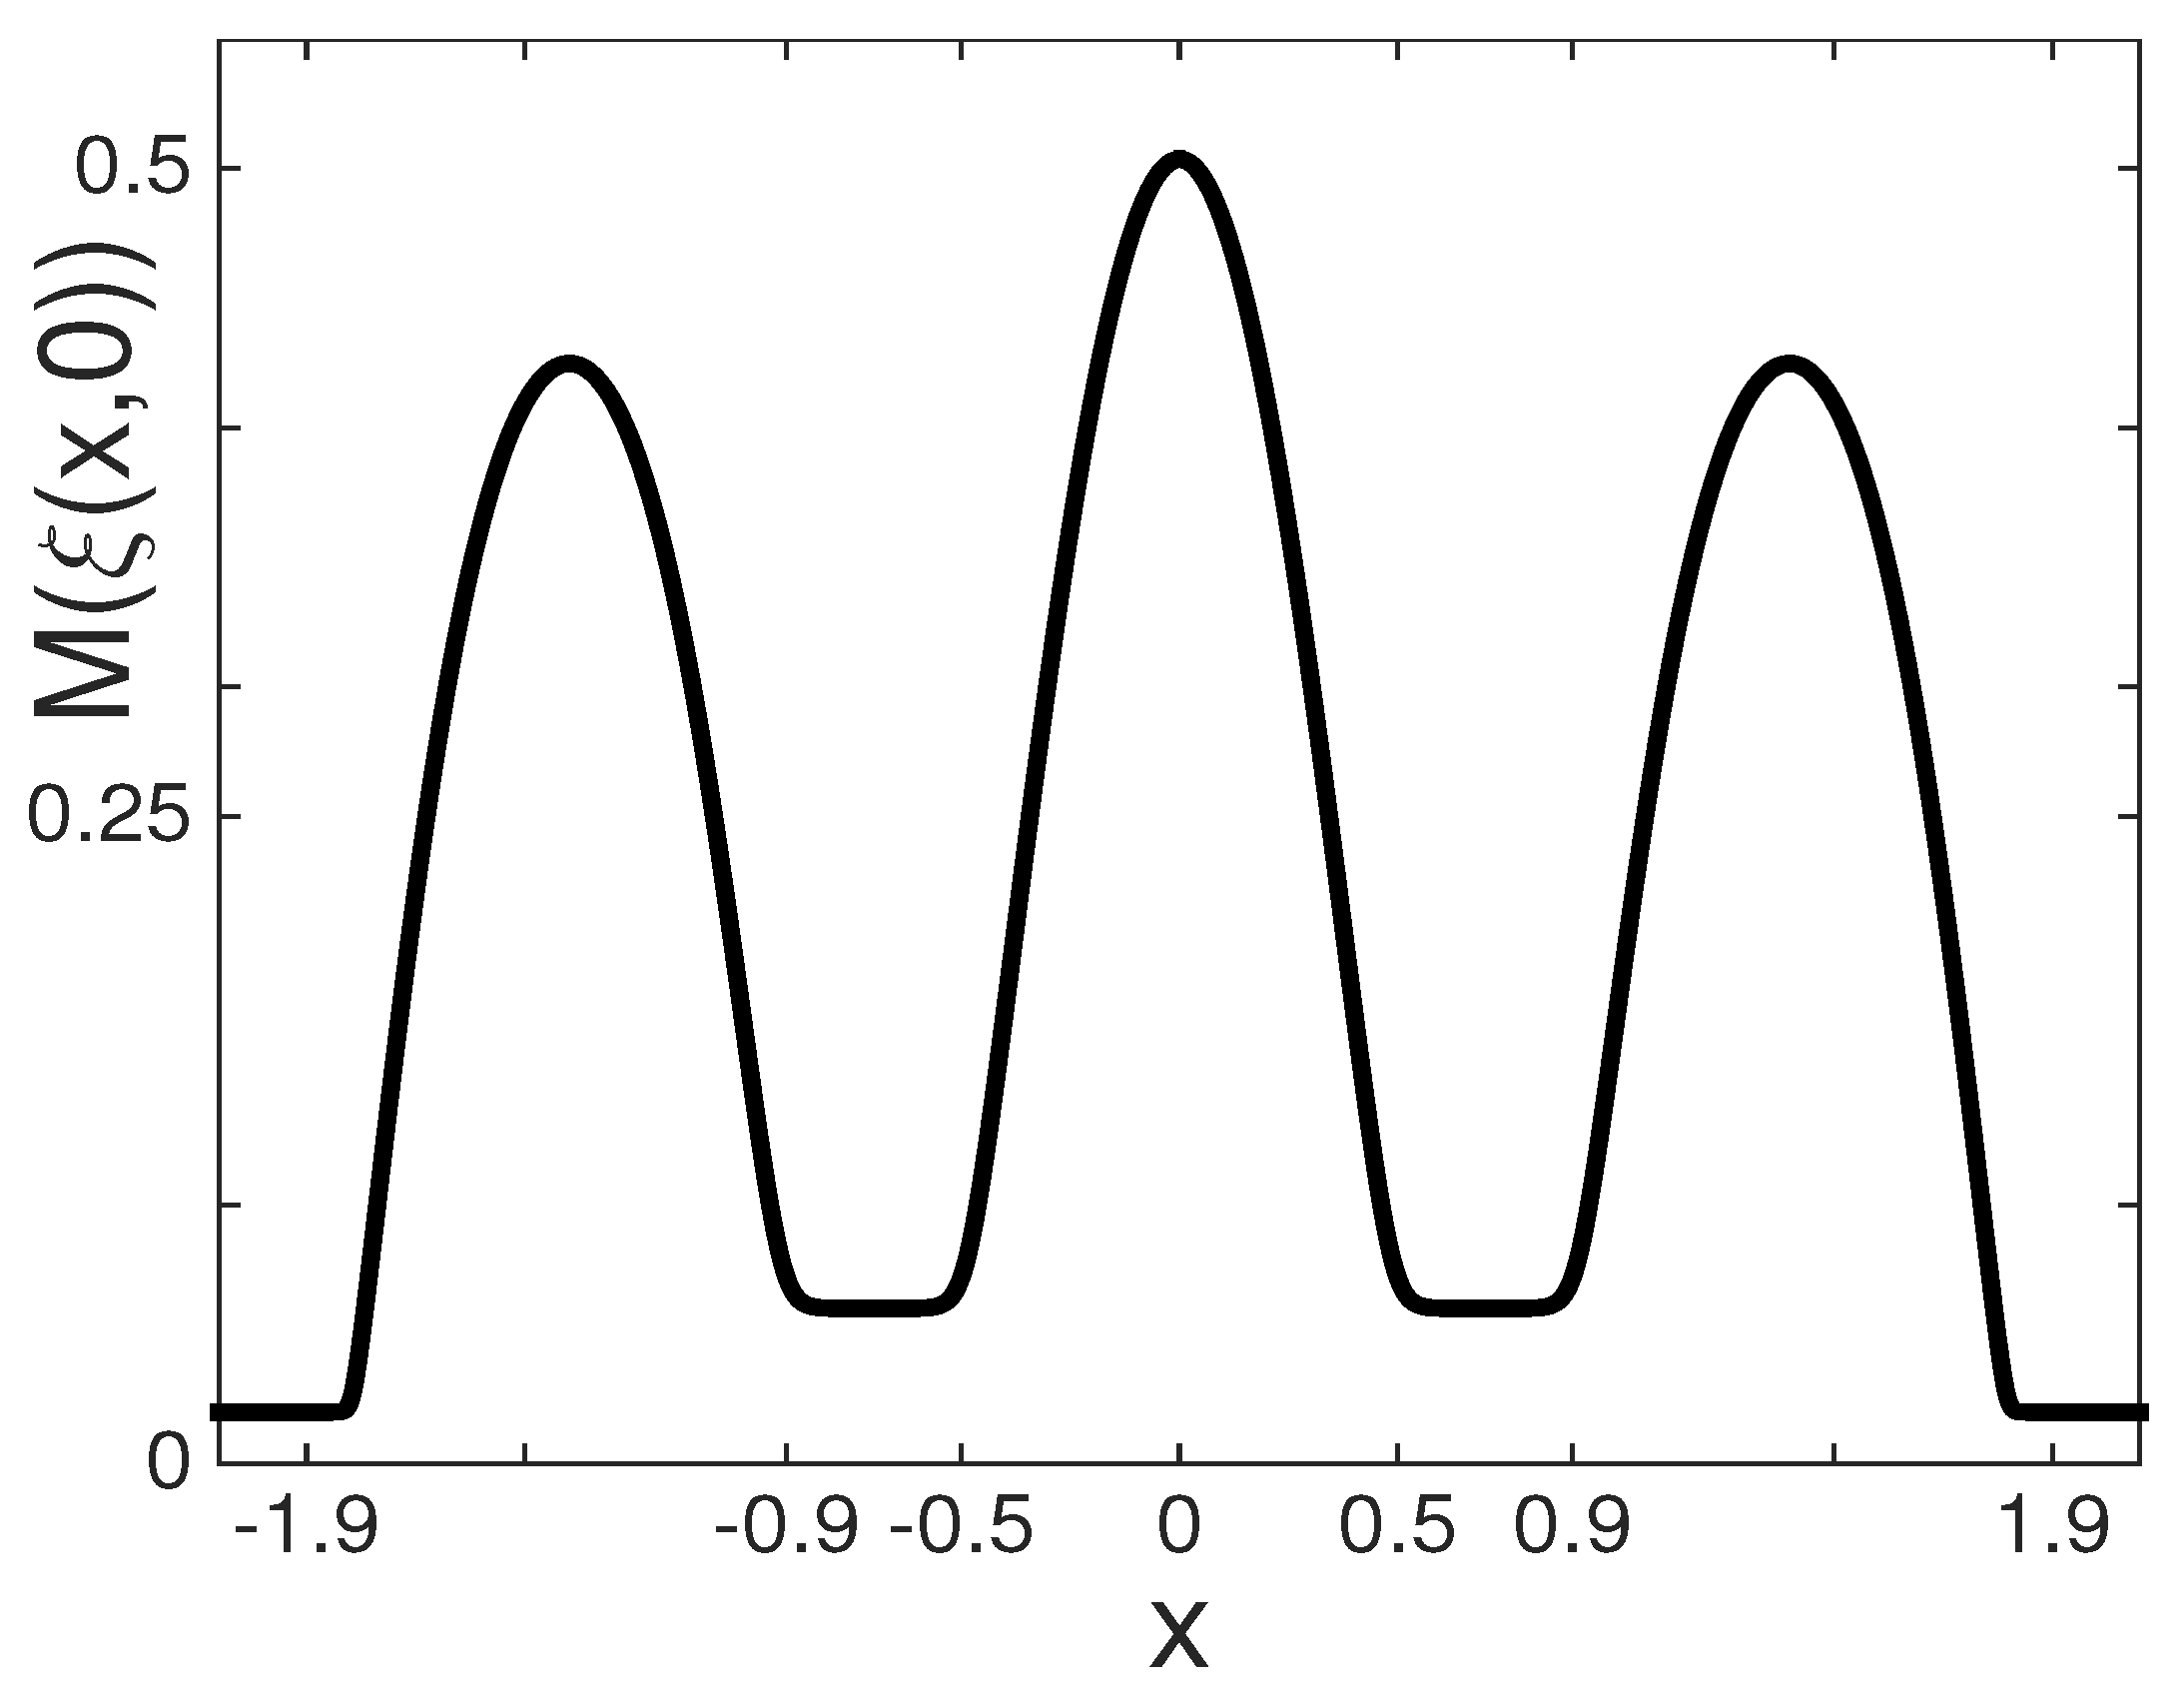
In Figure 3 the metric coefficient M, namely, the square root of the Jacobian along the undisturbed free surface, is graphed as a function of x. As discussed in Nachbin et al. [20] the value of controls the local shallow water speed for long waves. In the present work the Faraday waves are not in the long wave regime.
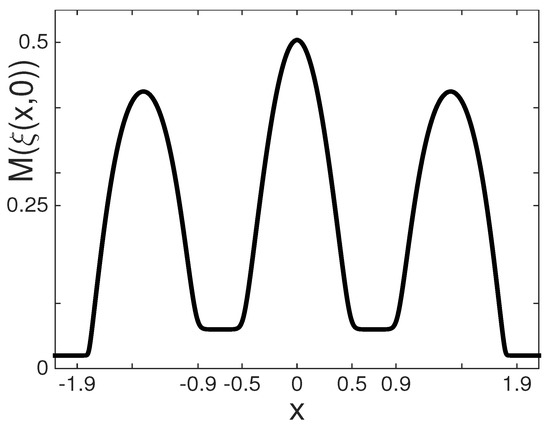
Figure 3.
The metric coefficient .
3. Numerical Method
All spatial derivatives found in the Equations (1)–(4) are computed through a Fourier spectral method, namely, using the fast fourier Transform (FFT) in x. The very shallow parts, to the sides of the cavity-region, extend sufficiently far insuring periodic (quiescent) conditions. The DtN operator (6), which yields , is also computed through an FFT, but in this case being a Fourier transform in . This is performed in steps. First, the conformal mapping is numerically executed using the Schwarz-Christoffel Toolbox (SCT) [10]. The SCT numerically maps a flat strip of unit height onto a polygonal-shaped (2D) fluid domain [24,38]. Since our coefficients are evaluated along the undisturbed free surface, the mapping is computed only once, at the beginning of a simulation. Detailed instructions with just a few Matlab commands, are available in Fokas and Nachbin [38]. An FFT in the -coordinate, here denoted by , computes the vertical speed (7) in the physical domain as follows:
The Fourier multiplier is .
It is important to recall that for a given uniform grid along the free surface in the physical domain, the conformal mapping generates a nontrivial distortion in the canonical domain, as expressed through the real part of the inverse map. This distortion gives rise to grid points distributed in a very irregular fashion. The FFT in (8) is computed with equally spaced points. Therefore, the Dirichlet data need to be interpolated onto a uniform grid in . This interpolation is done through the use of cubic splines. Details are given in Nachbin et al. [20]. Figure 2 shows the great deal of distortion encountered going from one domain to the other. A single (well resolved) Fourier mode in the physical domain will get highly modulated (in frequency) when mapped to the canonical domain. Its amplitude is not affected, but the underlying grid-points will get highly compressed in some regions. Hence, the operation uses a higher resolution than needed for the evolution scheme in the physical domain. This is achieved with an oversampling of the original Fourier mode in the physical domain [20]. Usually, 256 Fourier modes are enough to physically resolve the pilot-waves in our spectral evolution scheme. However, for the procedure we use the oversampling with a factor of 8 in our cubic spline interpolation at nonuniform grid-points , which are the images of the uniform FFT-grid . We should emphasize that present method is more efficient than solving the harmonic problem in the physical domain.
In summary, the geometrical information of the cavities and barriers is encoded in the variable (metric) coefficient M and through the relation . Both are predefined along the undisturbed free surface, when a simulation starts. The evolution problem is reduced to only one space-dimension, but containing depth effects. The time evolution is performed with a second-order fractional-step Verlet method.
4. Results
In this section we present results from numerical simulations with one and two droplets oscillating confined to their cavities. The physical parameters are the same as used by Milewski et al. [19]. As discussed in the introduction, this is a new class of problems regarding a wave-particle association, in analogy with the pilot-wave dynamics proposed by de Broglie in quantum mechanics. Most importantly in the present results is the property of oscillators, coupled by an underlying surface wave field, to display spontaneous synchronization even when they are placed at a distance. The present nonlinear wave-mediated oscillator coupling is more general than that displayed by the Kuramoto model and therefore of general interest.
First, results with a single droplet are presented to highlight the nonlocal effect of forcing at a distance. Small amplitude surface waves transmitted to empty cavities can generate, from a distance, new harmonics on the oscillator of interest, namely, the confined droplet.
Subsequently, we present simulations with two droplets exploring parameters that can impact and enhance the nonlinear coupling at a distance. With these results we explore synchronization issues related to nonlinear oscillators coupled implicitly.
4.1. Single Droplet Oscillations and Cavity-Forcing at a Distance
The goal in the first series of simulations is to show how an empty cavity, placed at a distance, can generate a forcing component on an oscillating droplet confined to another cavity. In principle the cavities are isolated from each other, having high barriers in between them. At a given shaking strength , the form and strength of the long-distance pulsating forcing are determined by some parameters such as barrier height and cavity sizes, namely, their widths and depths. We show that varying these parameters can locally affect the Faraday wave regime and remarkably optimize (or not) the wave-mediated communication between oscillators. For example, controlling locally within a cavity how close the vertical shaking is to the Faraday wave-instabilty threshold. This can depend on the cavity’s width and depth. The combination of all (geometrical and physical) parameters is very rich. Therefore, we choose to vary a few parameters, which will still display the complexity of the wave-mediated droplet dynamics.
Droplets oscillating while trapped within cavities have similarities to particles confined to potential wells. It is our goal to show that the underlying cavity design, together with the complex wave field generated by the droplets, promotes an effective potential for the droplet. This will become clear in the following subsections through our numerical simulations.
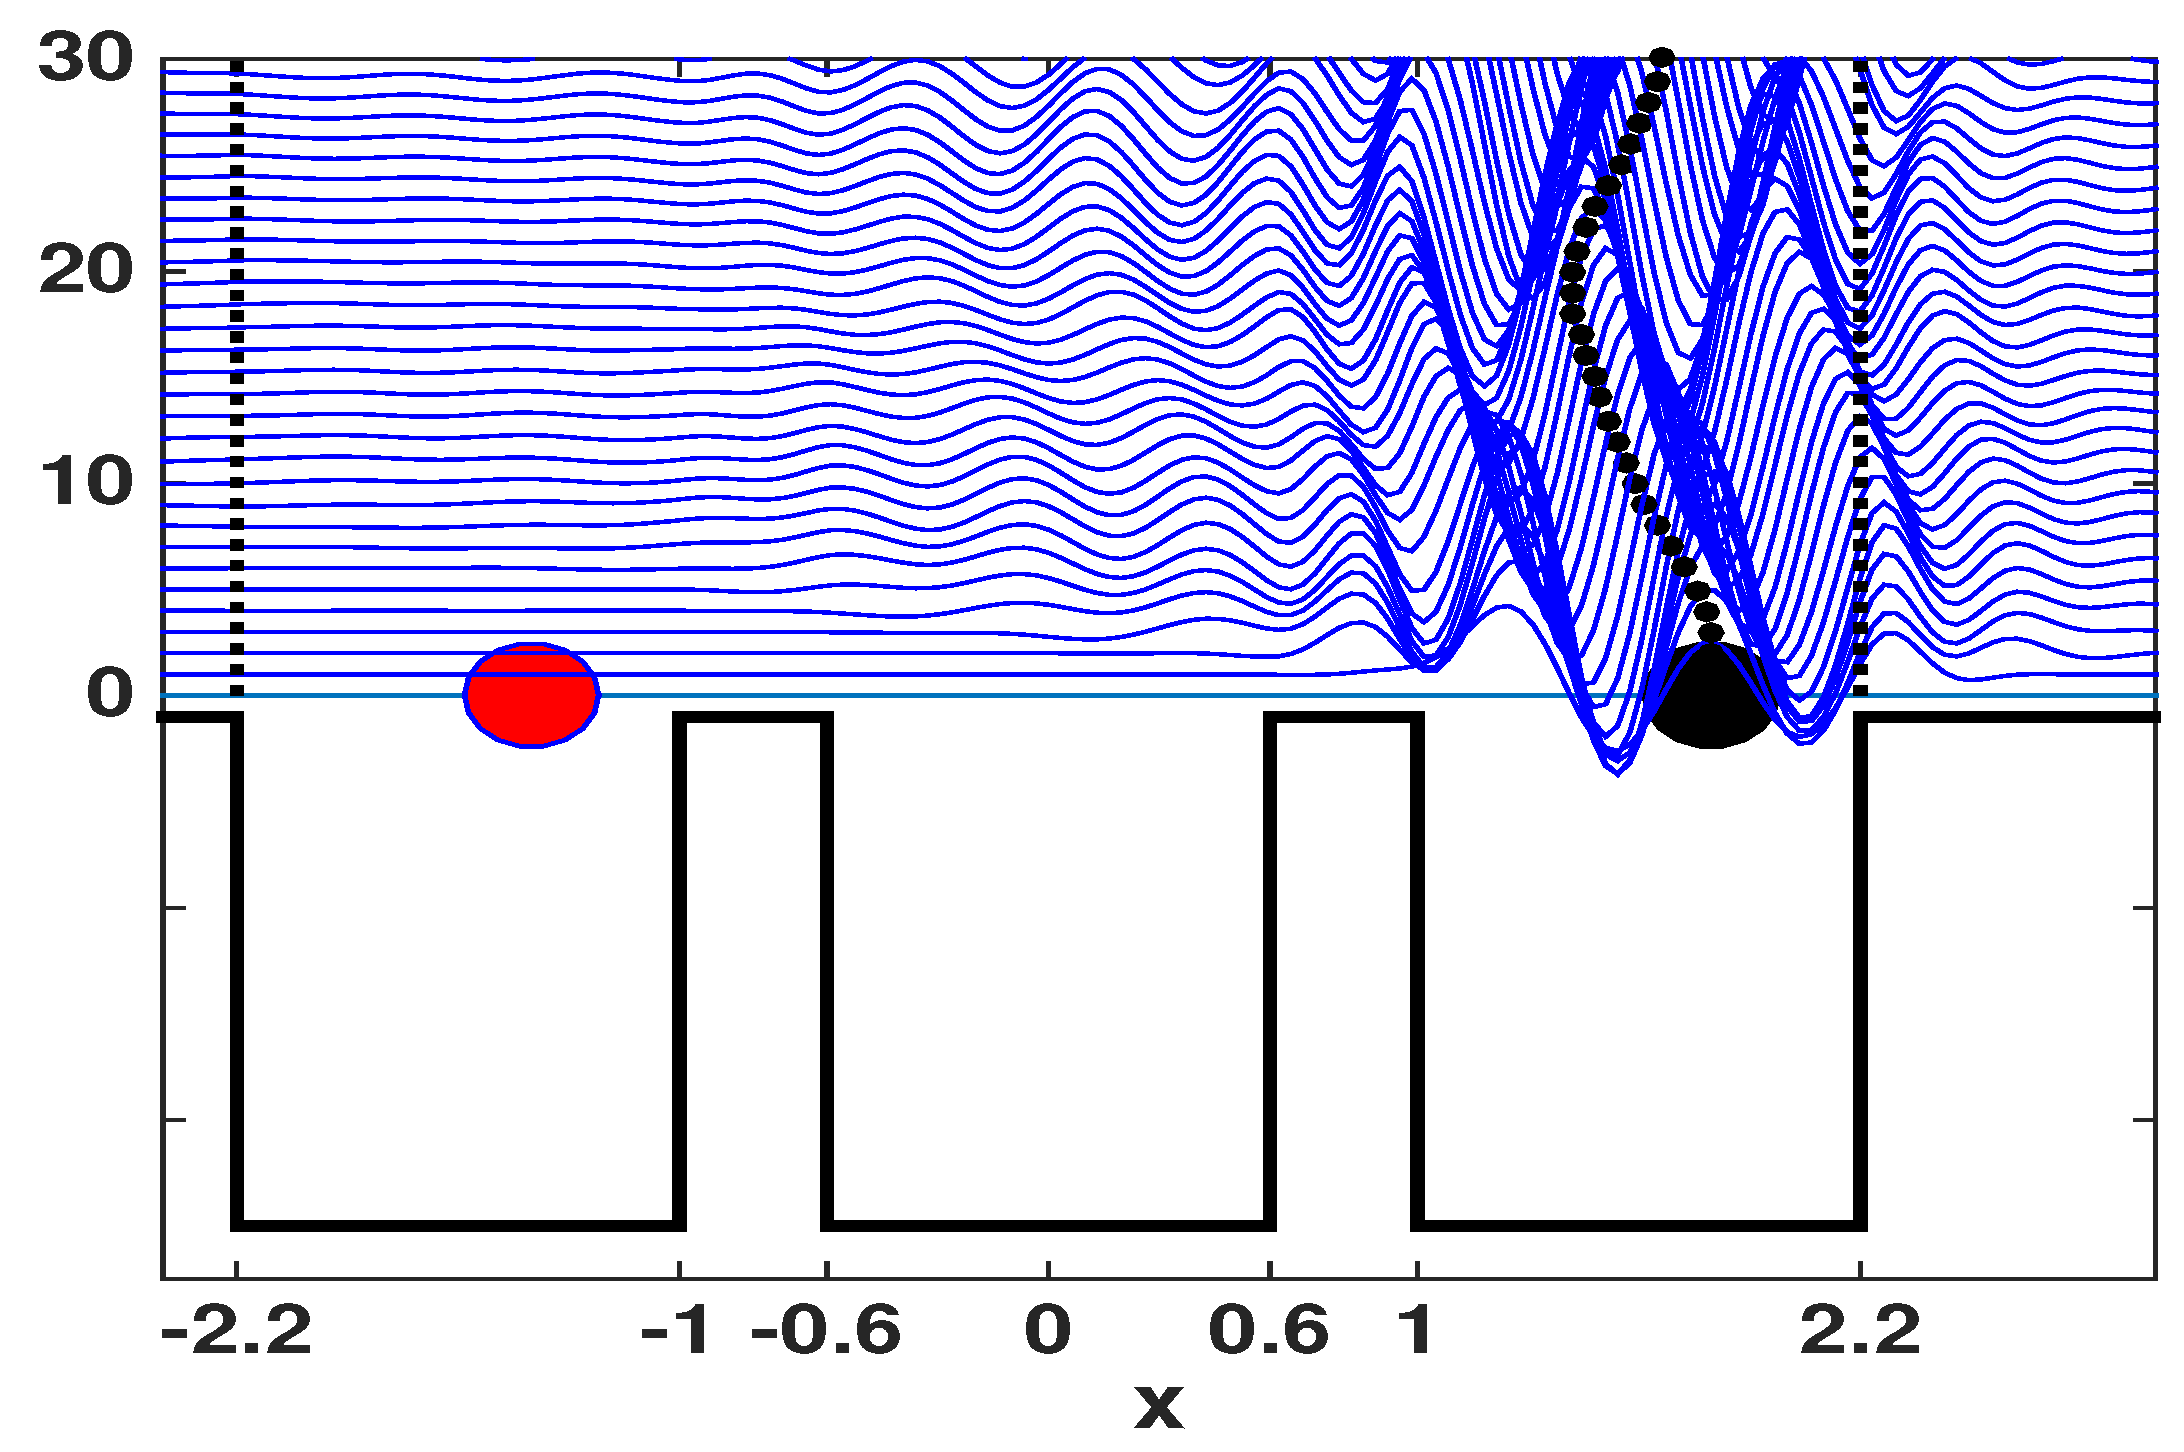
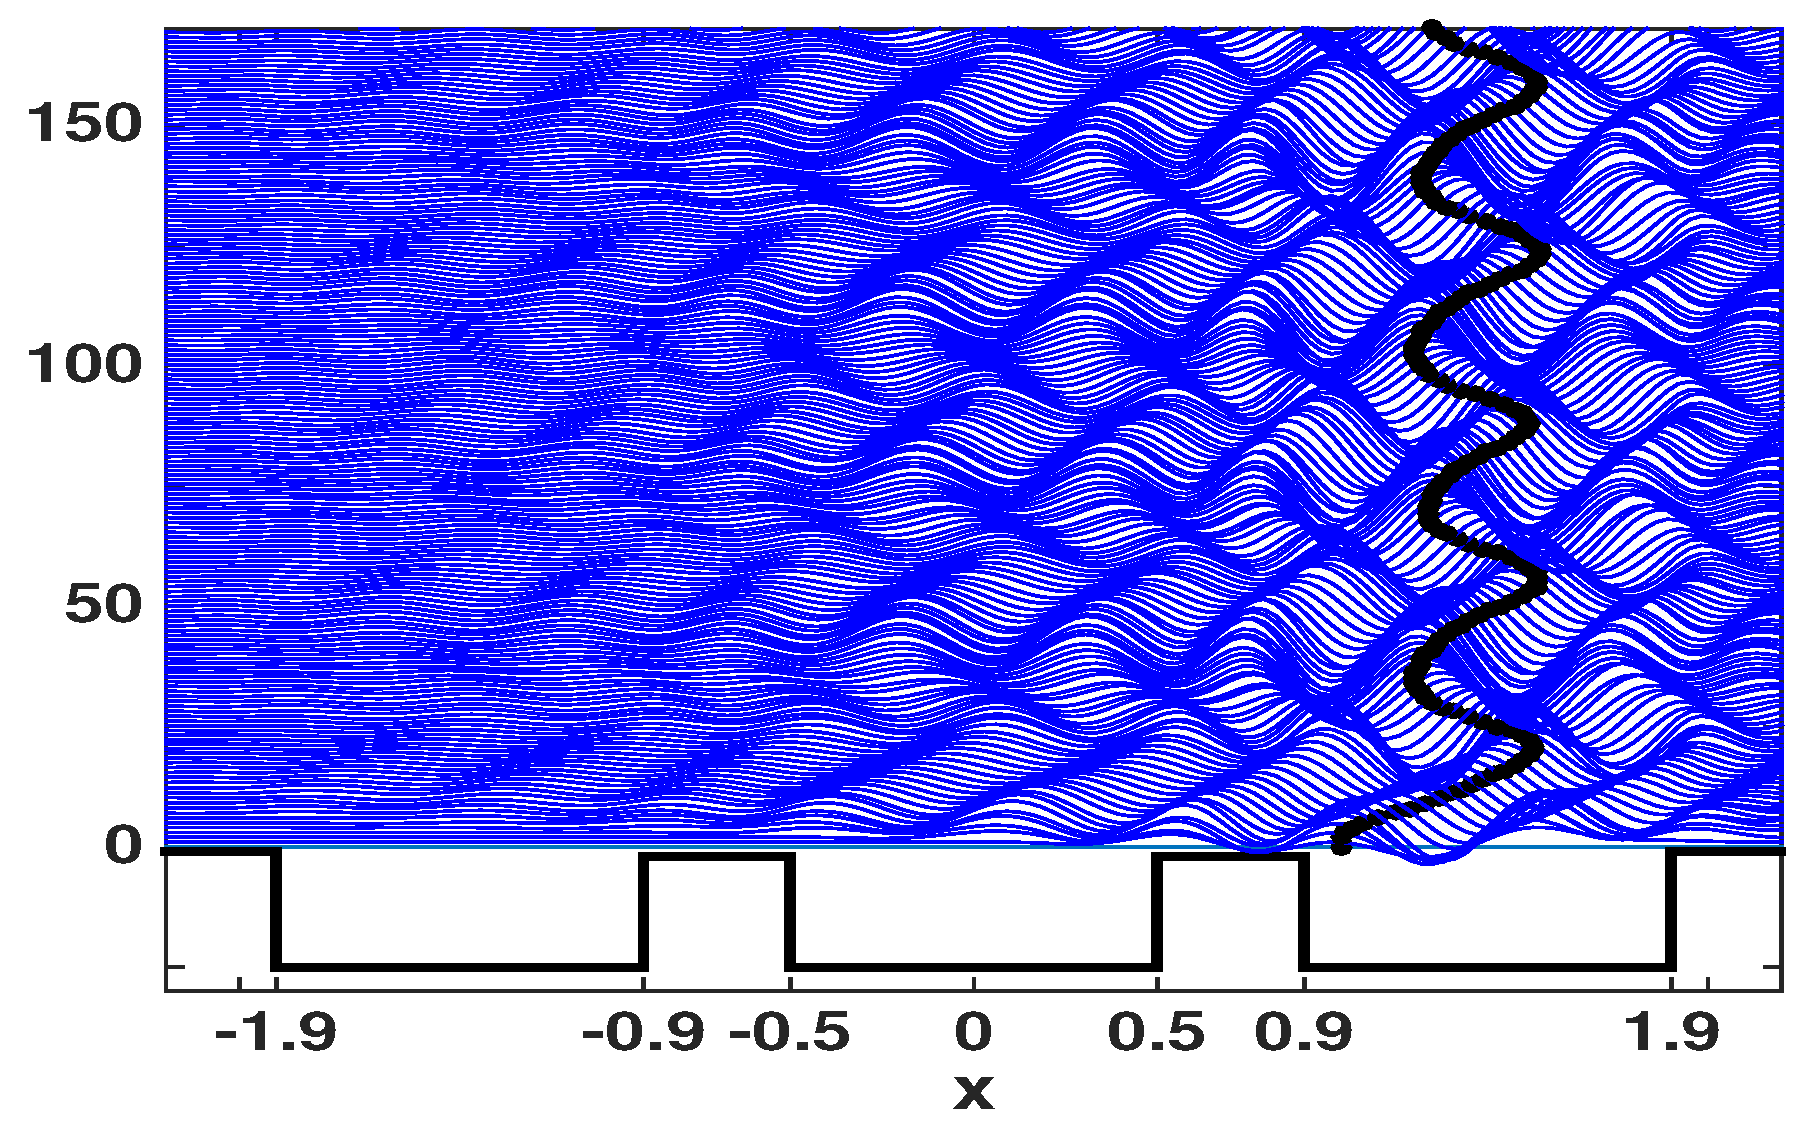
The surface wave domain considered is depicted in Figure 4. Three cavities of the same width and depth are shown. At first we will consider cavity widths all equal to 1.2 cm with depths equal to 0.5 cm. Two submerged barriers of width 0.4 cm are positioned to the left and right of the origin. At first we consider very high barriers, where the fluid depth above them is equal to 0.02 cm. These scales are comparable with those in laboratory experiments. These barriers are designed to confine a droplet within its respective cavity, such as a particle confined to a potential well. The probability of the droplet escaping its cavity was studied in Nachbin et al. [20] where tunneling was observed for different barrier heights and widths. Eventually, in the present study we will consider two droplets set apart and confined to separate cavities. In Figure 4 this is indicated by the two dots along the free surface at rest, at the level curve with a 0 on the vertical axis.
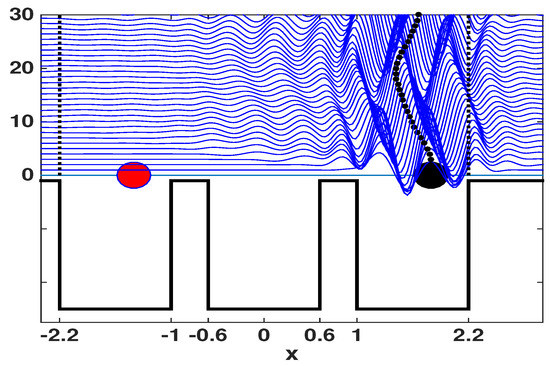
Figure 4.
This is a schematic representation of our domain with 3 cavities, all of width 1.2 cm and depth 0.5 cm. The vertical axis represents time in terms of Faraday periods . Each wave trace is depicted in a Faraday period, namely, at , n integer. Two barriers (of width 0.4 cm) separate the cavities. The fluid depth above the barrier is small, so that the droplets are confined to their initial cavities. The small dots indicate the droplet’s orbit in time. A small amplitude surface wave is transmitted to the left, over the barrier. There is very little wave-activity in the mid-cavity and no activity in the left cavity. Eventually a second droplet will be placed in the left-most cavity, as indicated by the dot at rest.
In the first part of the study only one droplet is allowed to bounce, namely, by using only the droplet shown on the right of Figure 4. The left droplet is only shown schematically and will be activated later on. As the right droplet starts bouncing and walking, it generates waves, as seen in Figure 4. The one-dimensional wave profiles are shown in time, at every Faraday period, and displayed in a waterfall plot along the vertical axis. The scale is exaggerated for better visualization. As important as the individual wave generation by a droplet, in the present study we pay attention to wave transmission over barriers and its impact on other cavities and eventually other droplets. In Figure 4 a small amplitude surface wave is transmitted to the left over the barrier. The wave motion in the mid-cavity can persist or die out according to the parameters used. The wave motion is damped by viscosity, but can also be sustained if the shaking regime, controlled by , is close enough to the Faraday threshold. In Figure 4 the barriers are high, and the shaking not too strong, so that the left-most cavity effectively has no wave motion. In what follows we will vary the barrier heights and observe how this affects the underlying wave motion in each cavity, and more importantly for this study, how it may couple oscillators (droplets) confined to potential wells at a distance.
We call attention to the shallow region outside the main wave-particle domain. In Figure 4 we display part of this region to the right, beyond , where it is shallow and long enough so that there is no wave activity at the end of the computational domain. The same happens to the left of the computational domain, not shown in Figure 4. This observation is relevant in justifying the use of periodic boundary conditions with our spectral numerical method. The shallow part also prevents the pilot-wave from driving the droplet to these regions where it does not walk and would eventually get stuck.
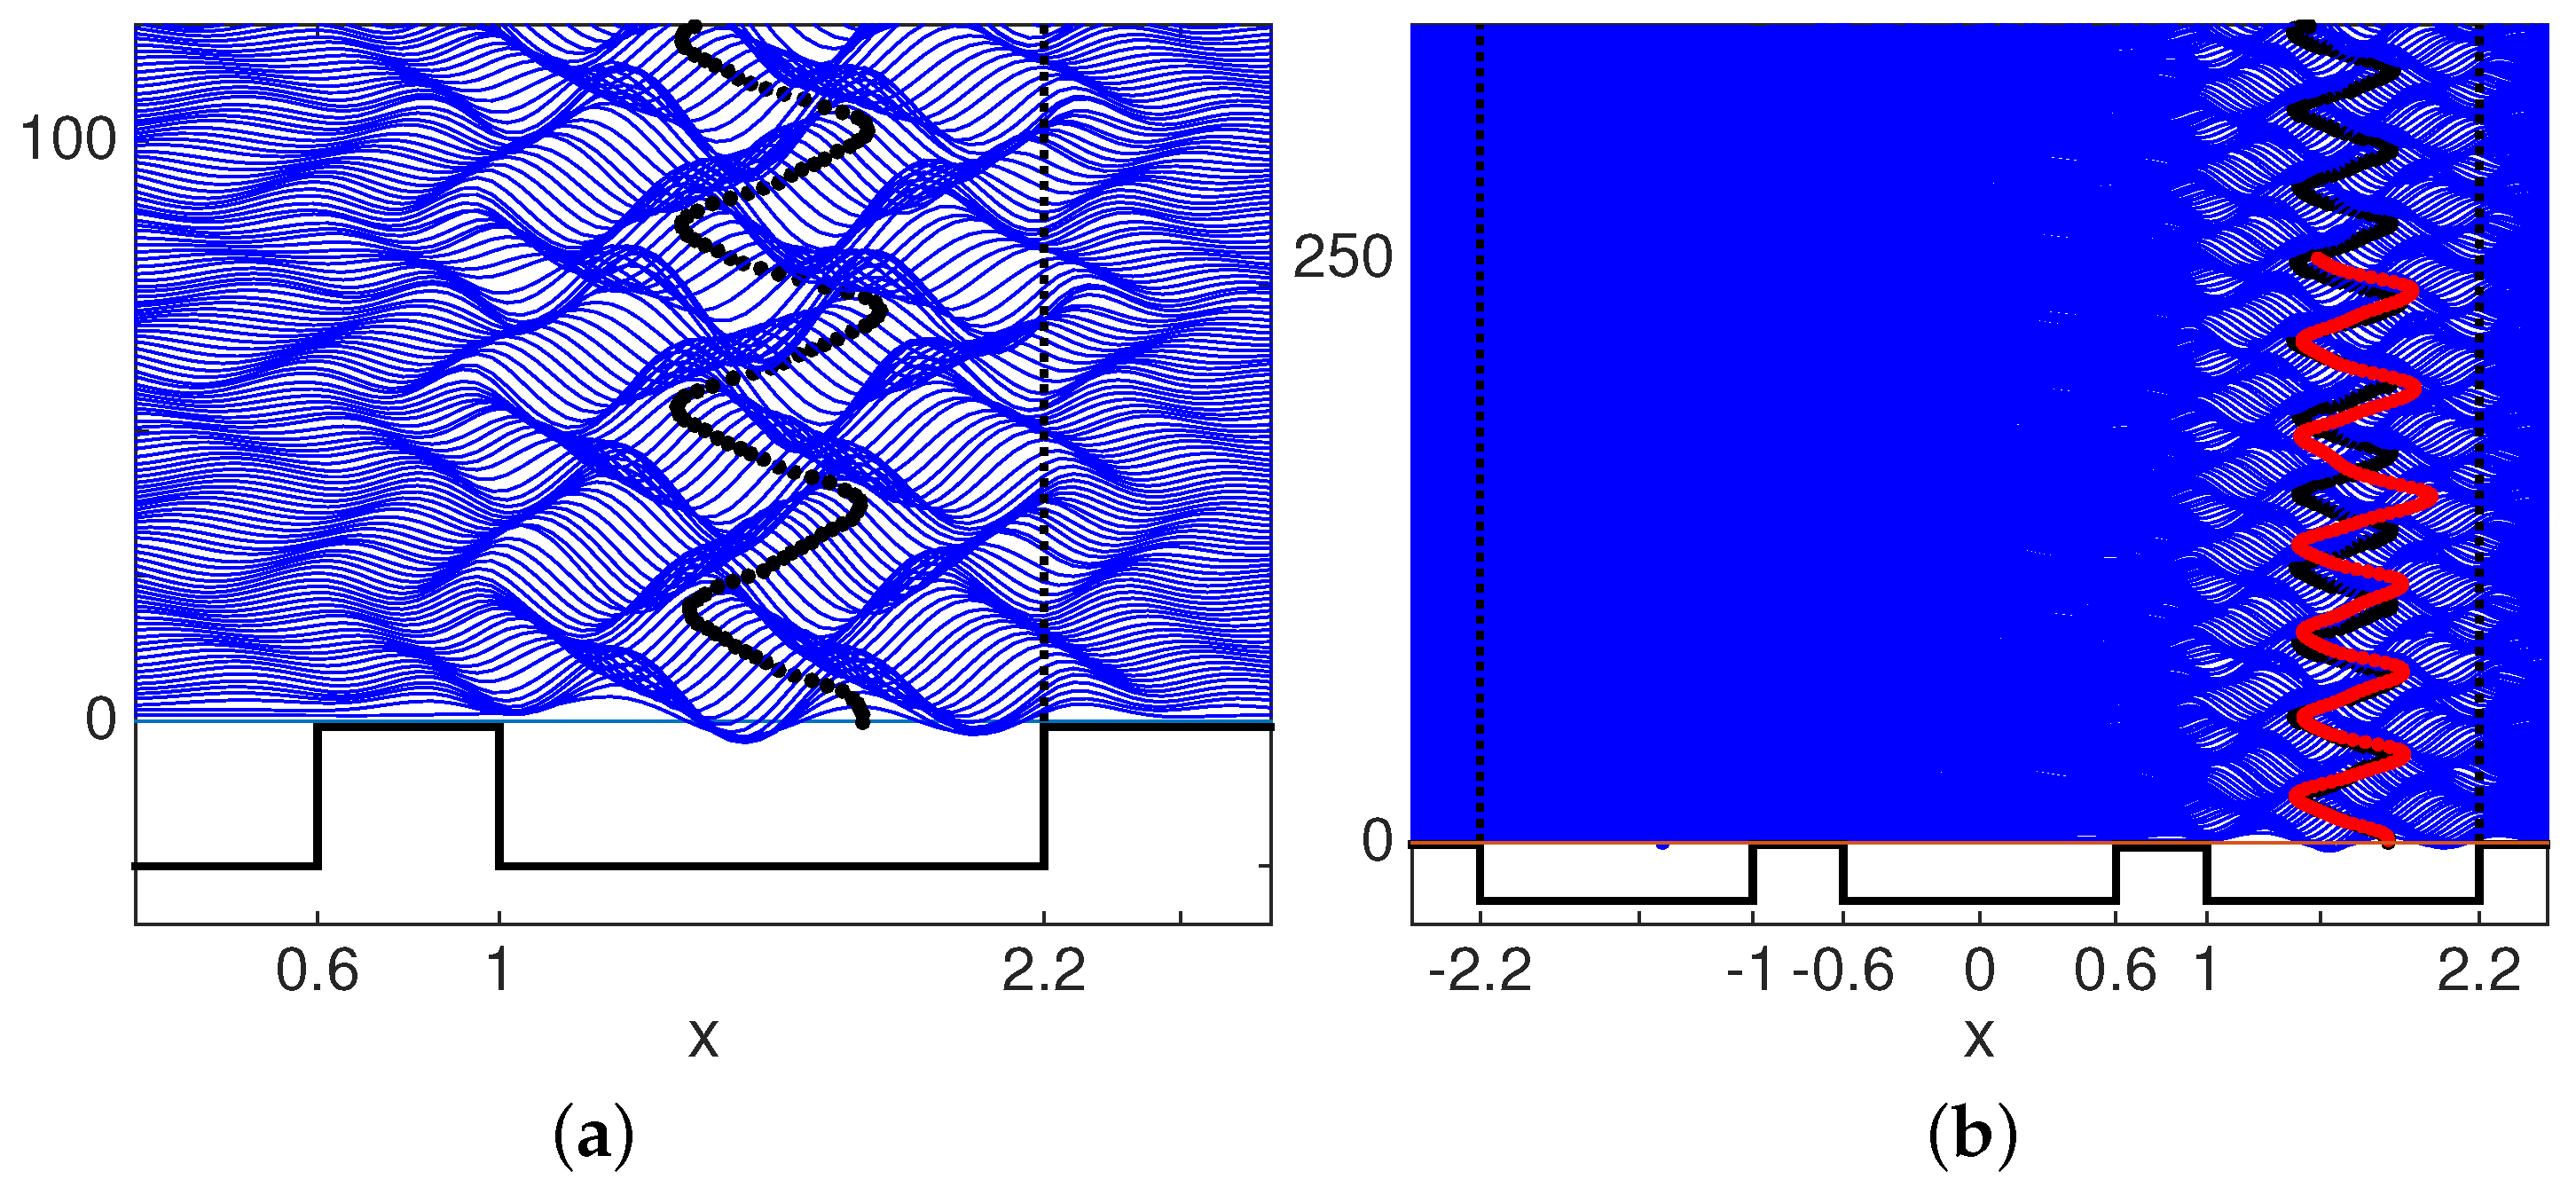
In the first simulation presented we have a droplet confined to its cavity on the right of the domain. The droplet’s oscillations, as shown in Figure 5, indicate a periodic motion in space and time, where time runs vertically with wave traces and droplet position shown at every Faraday period. The parameters used are , the geometry as in Figure 4, where both barriers are high with a fluid depth above them equal to 0.02 cm. In the detail in Figure 5 (left), we see a very regular wave sloshing within the cavity, guiding the droplet in a well defined oscillation, switching sides on the face of the wave and never reaching the cavity borders. We also observe a small transmitted wave over to the mid-cavity. In this detail, time runs a little beyond 100. A longer display of this wave-particle interaction is displayed on the right of Figure 5. The well defined periodic oscillator is seen beyond time . This space-time trace resembles a harmonic oscillator and therefore it is instructive to check its phase space dynamics.
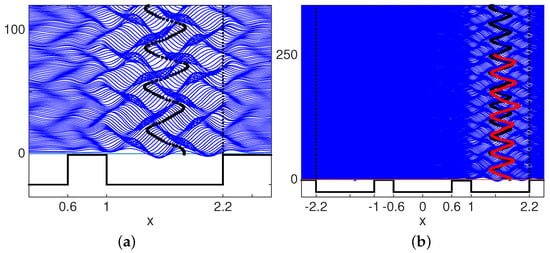
Figure 5.
(a) On the left, a single droplet is confined to the right-most cavity and oscillates uniformly. The underlying wave sloshing is depicted for the first 100 Faraday periods. The barriers are high with a fluid depth of only 0.02 cm above each barrier. There is very mild wave activity in the mid-cavity. (b) On the right graph the droplet dynamics are viewed for two different heights of the right-most barrier. The left barrier is kept unchanged with a fluid depth of 0.02 cm above it. In black, and running beyond time , is the case for a fluid depth of 0.02 cm above both barriers. In red is the case for a lower right barrier, with a fluid depth of 0.04 cm above it. A secondary forcing from a distance is observed, due to the wave action in the mid-cavity.
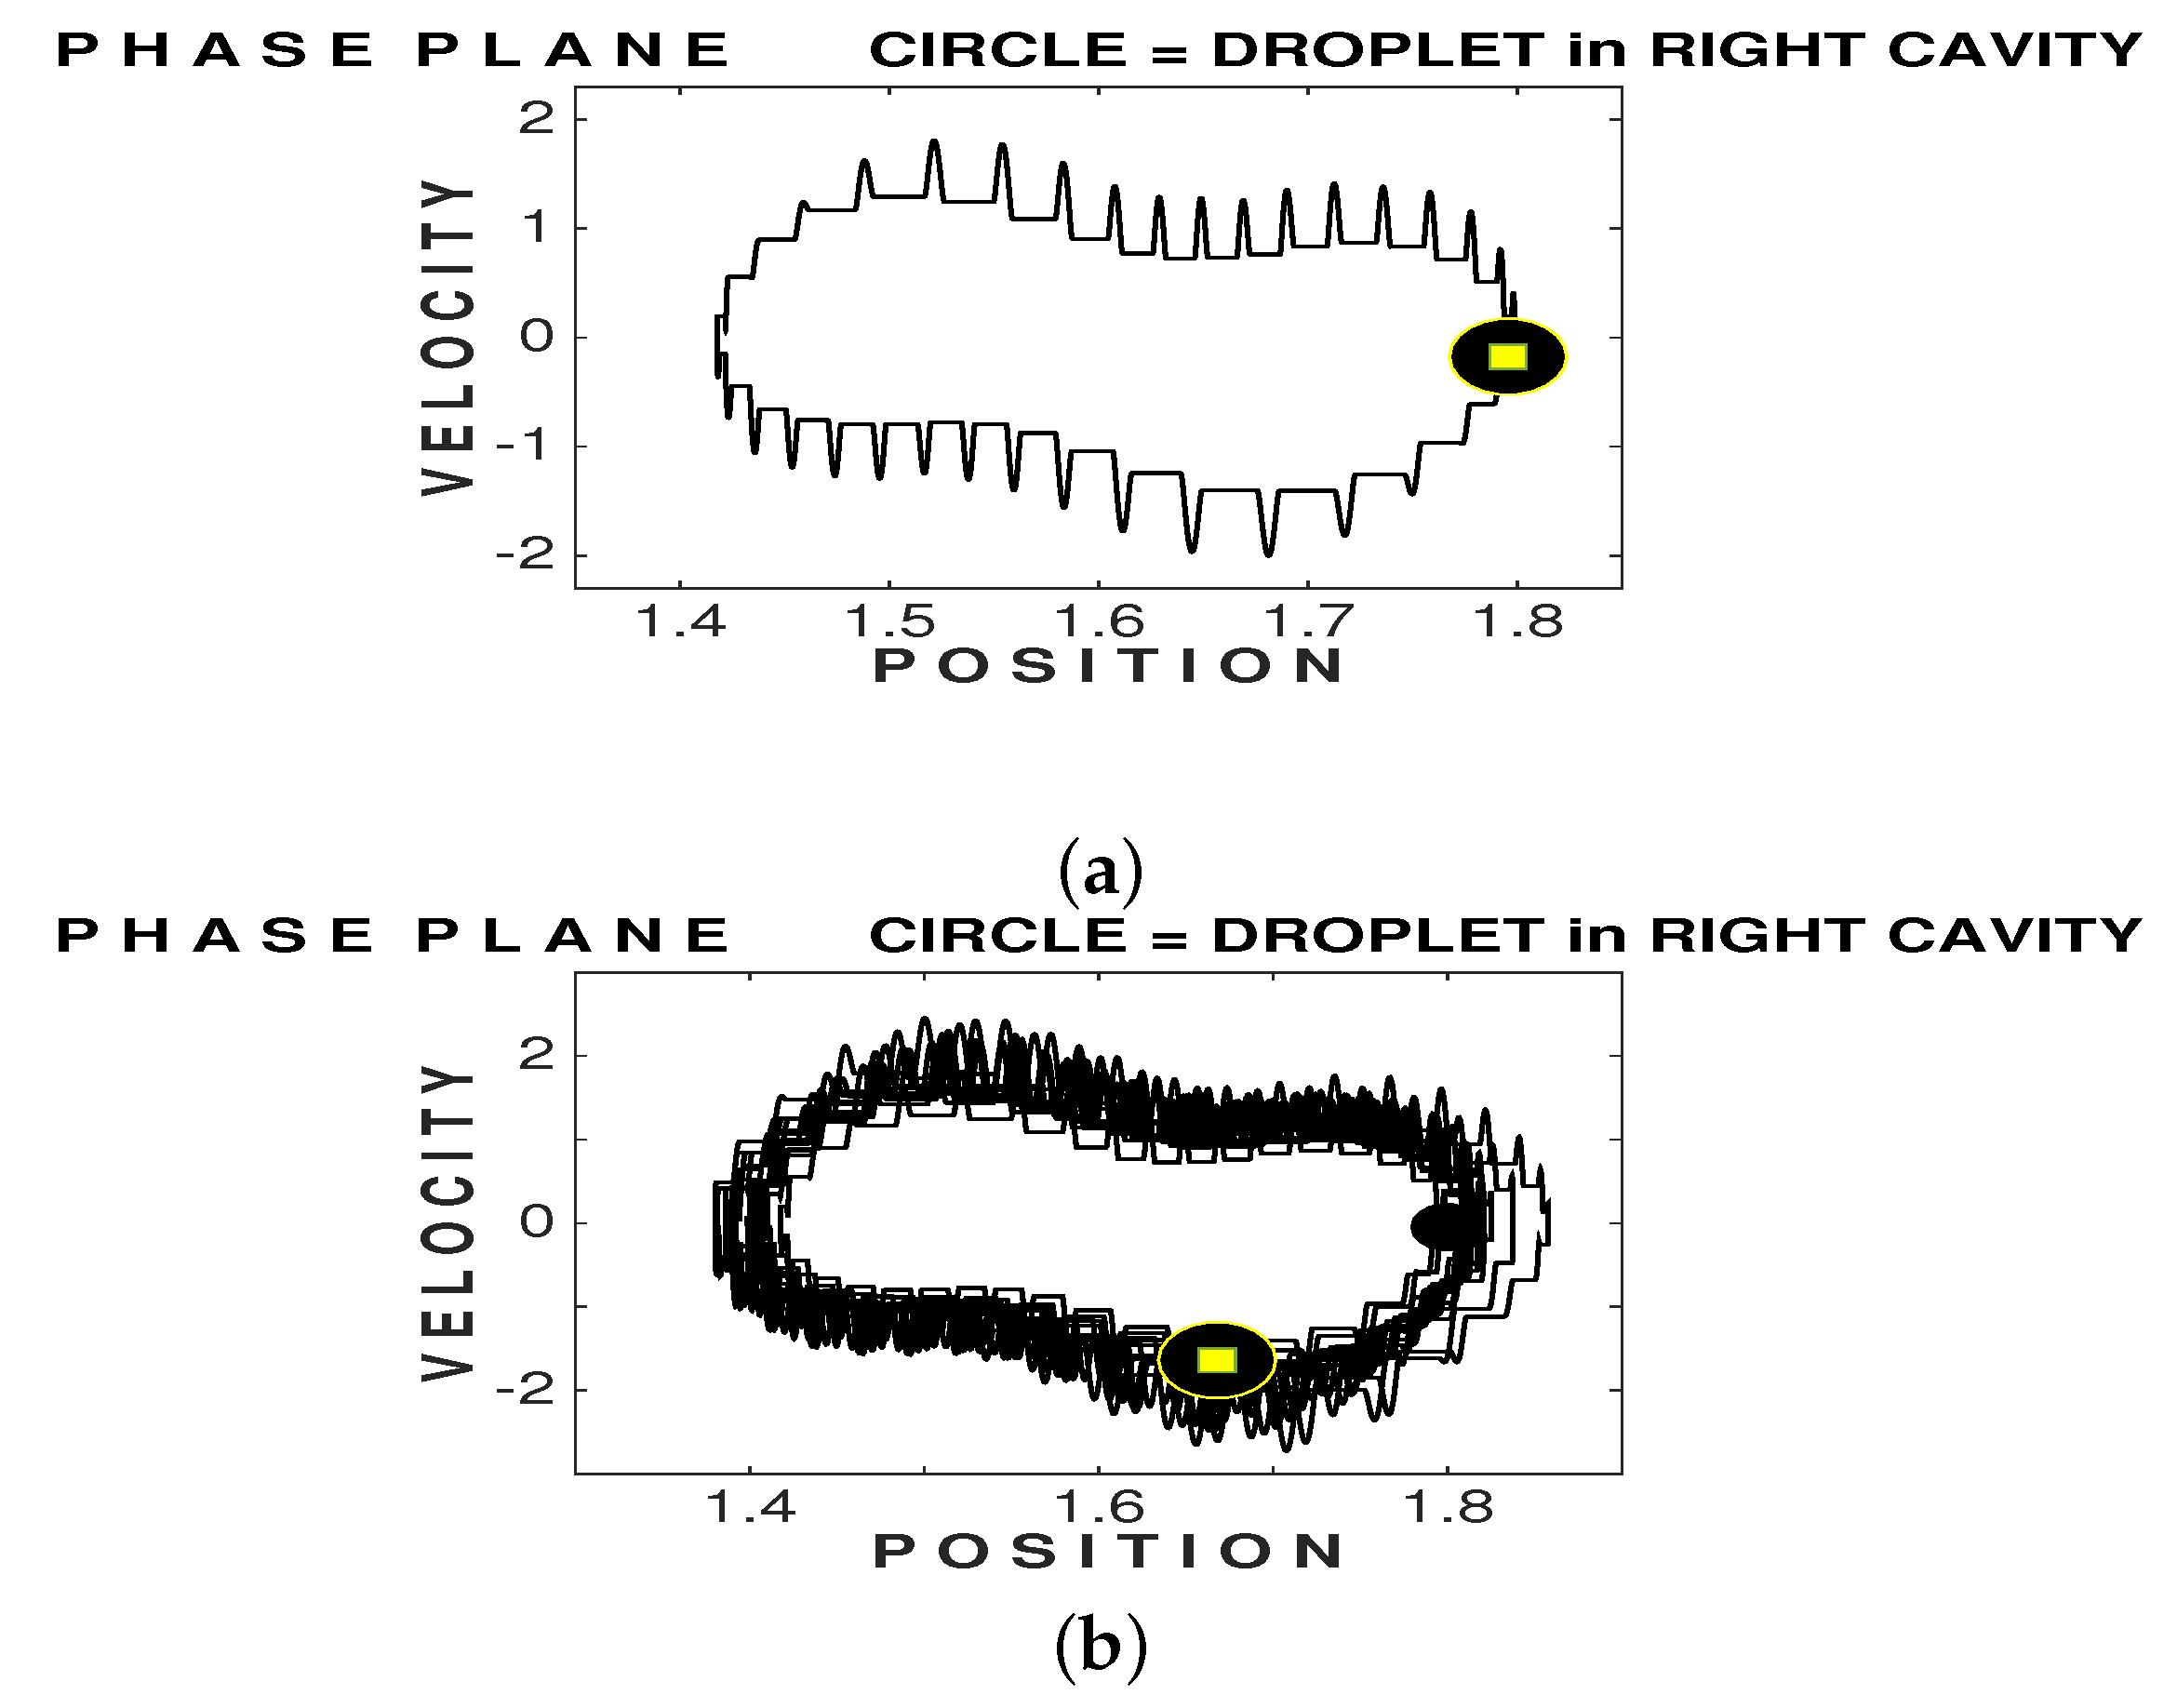
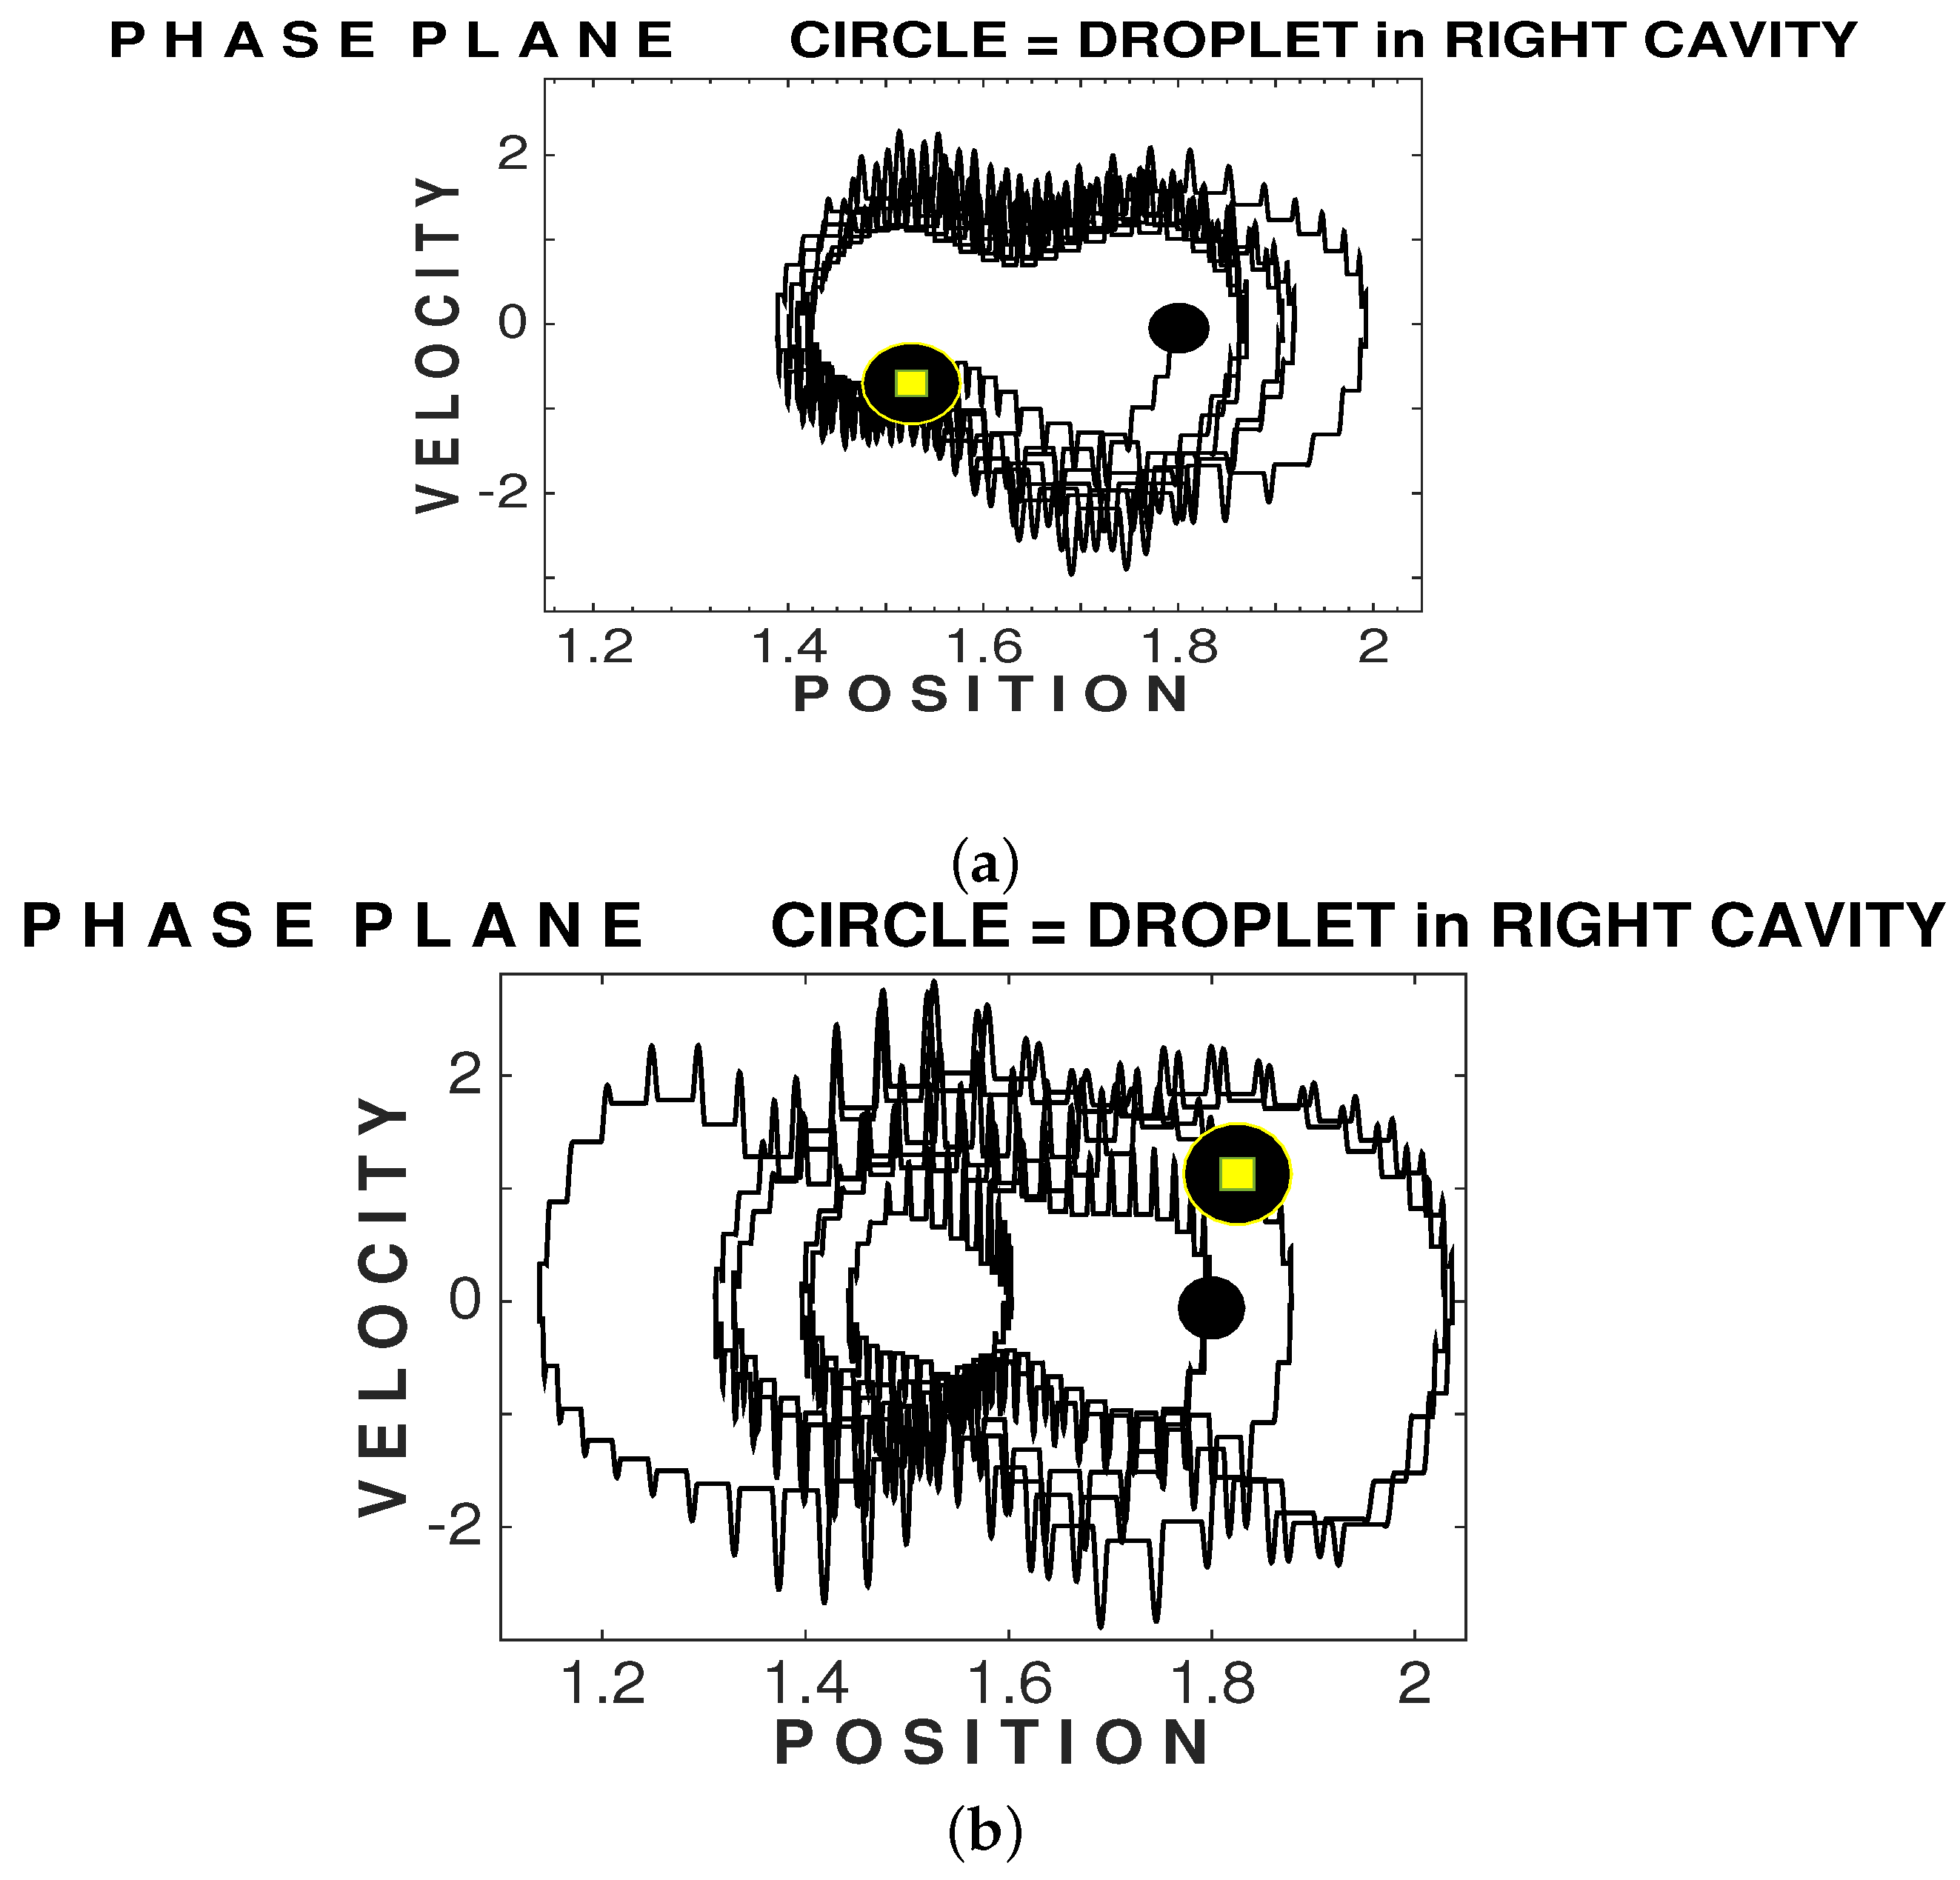
At the top in Figure 6 we graph one full cycle of this oscillator. Several cycles are depicted in the graph just below it. Using the single-cycle graph it is instructive to make a few comments. The starting and final points are the same, represented by the dot with a square within. The spikes indicate the contact interval, when the droplet is exerting pressure on the underlying fluid surface. As explained earlier, there is no physical contact of the droplet with the bath, or else it would coalesce. The sudden increase in speed takes place when the particle feels the slope of the underlying pilot-wave. The droplet is accelerated by the wave but then decelarated due to the skin friction with the free surface. Please refer to system (1) and (2). The droplet then has constant speed while flying. As clearly seen through different spike heights, the impact of the underlying Faraday wave varies in time, not always with the same intensity in accelerating the droplet.
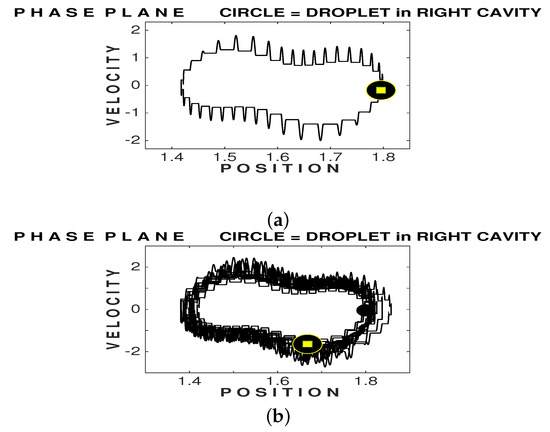
Figure 6.
Phase plane dynamics for the simulation presented on the left of Figure 5. The black dot shows the droplet’s starting position, while the dot with an inner square indicates its final position. (a) At the top: A single cycle in phase space. Each spike represents the contact interval when the droplet is first accelerated by the underlying surface wave and then slowed down by surface friction. The spikes are separated by a Faraday period and their duration is . (b) At the bottom we observe the effectively periodic motion after many cycles, for a time interval of 500.
On the right of Figure 5, superimposed with the previous simulation, is another simulation where the right barrier height was lowered, so the fluid depth was 0.04 cm. The left barrier still had a fluid depth of 0.02 cm above it. This minor change in the right barrier allowed a slightly stronger transmitted wave, still having a small amplitude. The wave sloshing in the mid-cavity (not displayed) was enough to disturb the nearly uniform oscillations seen in Figure 5 beyond time . The new oscillations, shown up to time , were not uniform in space and displayed a frequency shift in time. It is therefore instructive to see what type of cycle is observed in phase space. As displayed at the end of this subsection, we do not have a simple closed phase-space cycle anymore. We observe some cycles with an excursion larger than before, indicating an external forcing from the mid-cavity.
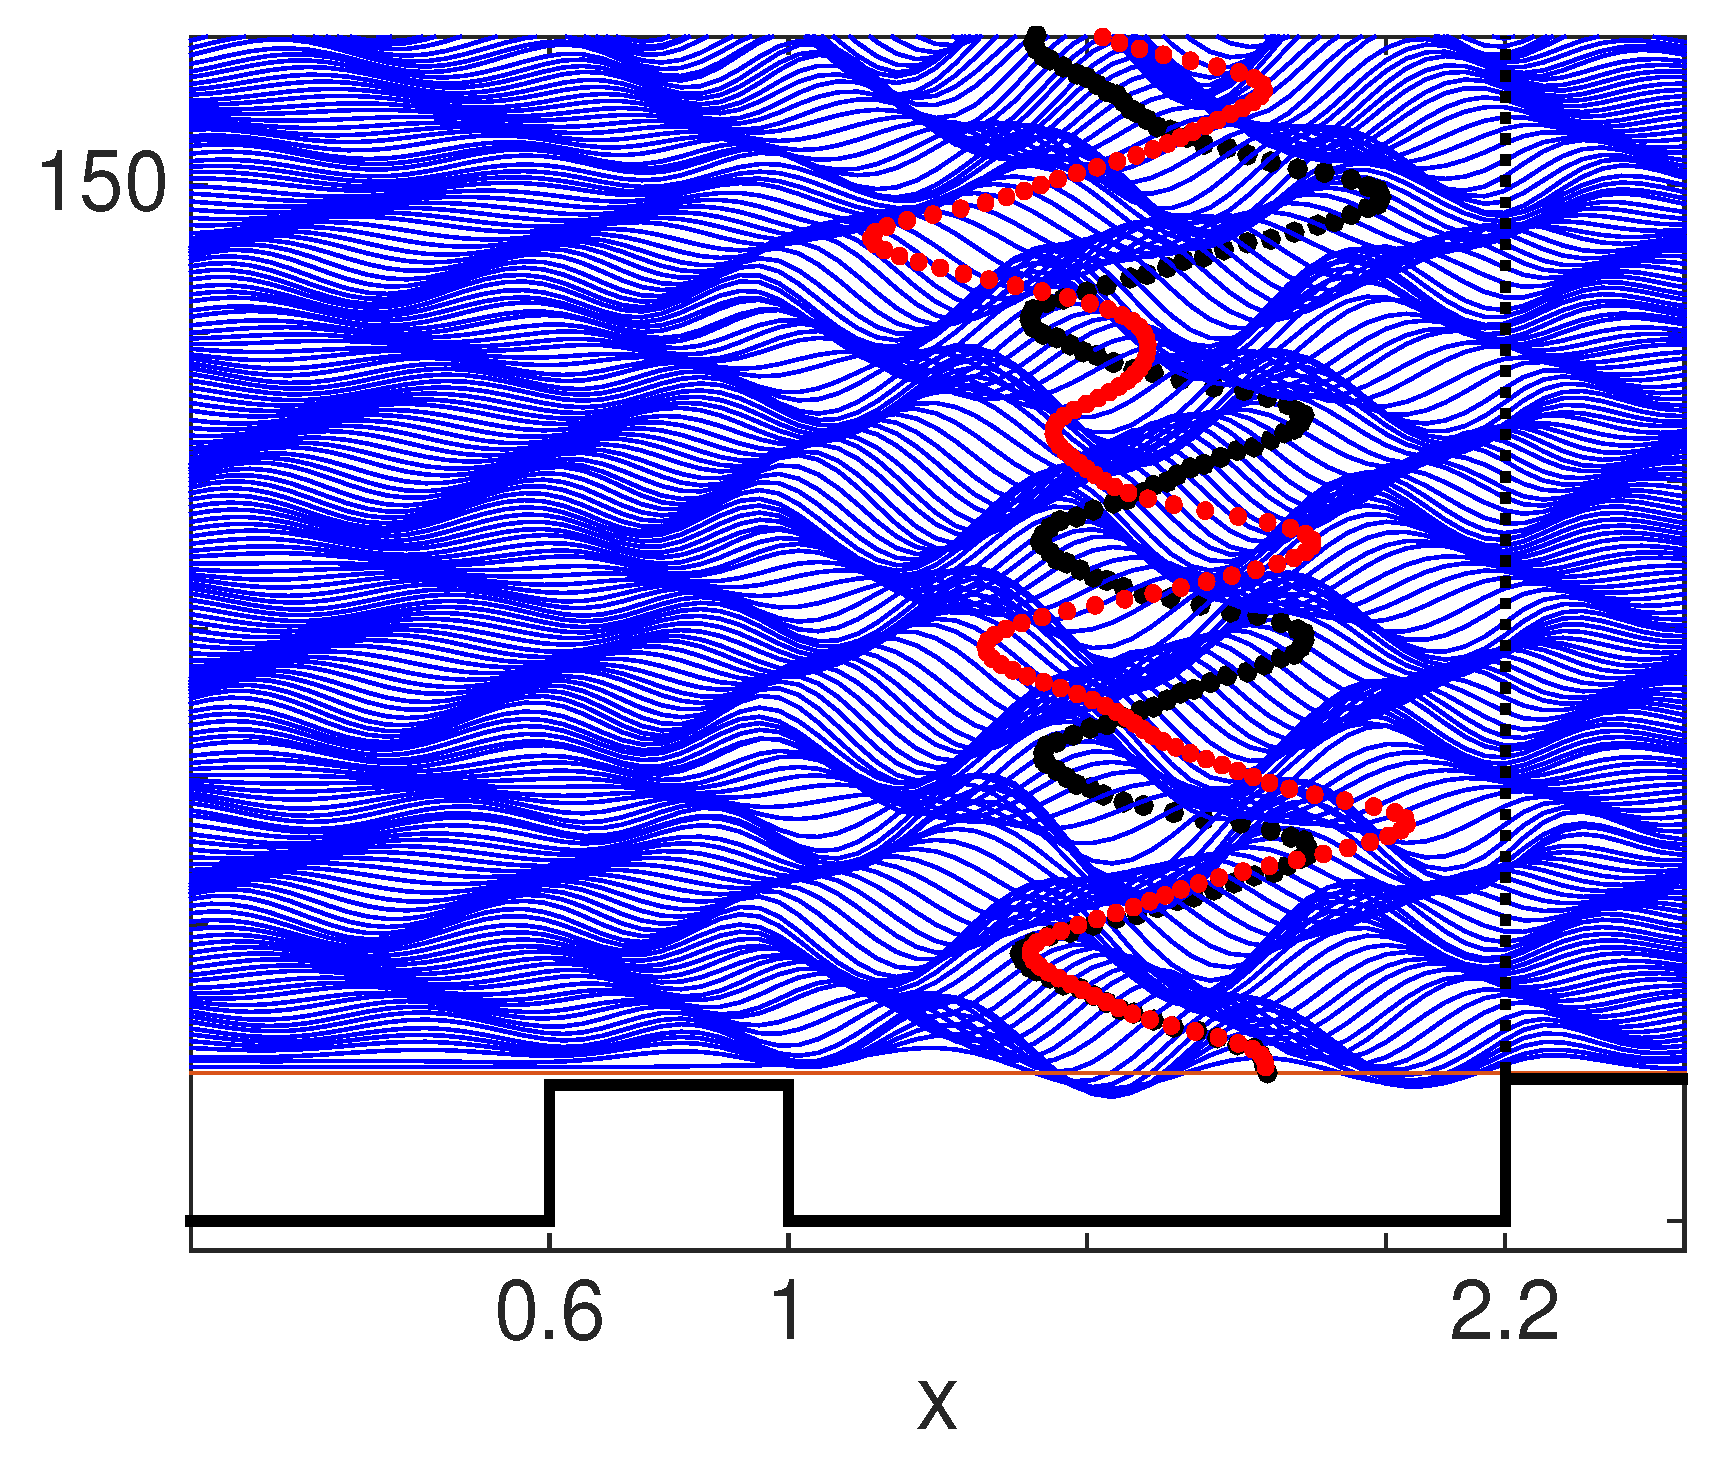
The left barrier is now lowered to same level as the right barrier and the fluid depth above them is equal to 0.04 cm. The wave activity far away, in the empty left-most cavity, has an impact on the droplet’s oscillations. In Figure 7 we observe an oscillation over a much larger range in space now that both barriers were lowered. The underlying oscillation and wave field displayed are for the case where only the right cavity was lowered. The complexity generated by the wave-mediated forcing at a distance (left cavity) is clearly seen in phase spase, as shown at the bottom of Figure 8. The oscillation range is much wider. The particle performs loops (cylces) of various forms. On a longer time interval the particle might repeat most of these cycles. We will come back to this when we study the joint dynamics of two droplets.
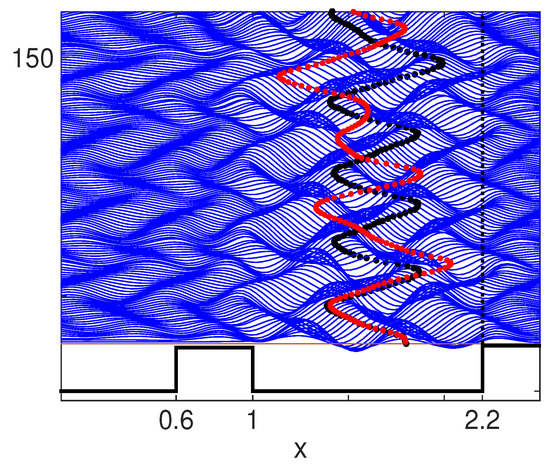
Figure 7.
The droplet dynamics are now viewed for two different heights of the left-most barrier, which is not depicted here. The right barrier is kept unchanged with a fluid depth of 0.04 cm above it. In black, and displayed in the background, is the case for a fluid depth of 0.02 cm above the barrier on the left. In red, displayed in the foreground, is the case where both barriers are lower with a fluid depth of 0.04 cm above them. The more complex droplet oscillation is due to an additional distant forcing arising due to wave transmission reaching the left-most cavity. The wave activity in the left cavity affects the droplet, far away in the right cavity.
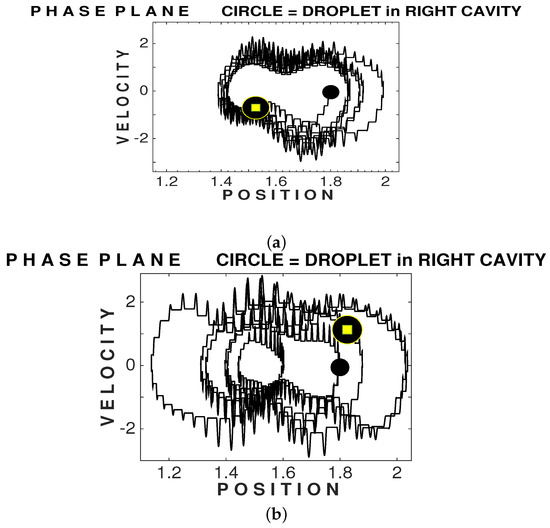
Figure 8.
Phase plane dynamics for the simulations presented in Figure 7. The black dot shows the droplet’s starting position, while the dot with an inner square indicates its final position. (a) At the top: The droplet dynamics after the right-most barrier was lowered to having a fluid depth of 0.04 cm. The left barrier still had a fluid depth of 0.02 cm. The increased interaction with the mid-cavity is clearly seen through the appearance of cycles of different amplitudes. (b) At the bottom: The left-most barrier is also lowered to having a fluid depth of 0.04 cm above it. There is a small amount of wave activity in the left-most cavity which is enough to affect the oscillator in the right-most cavity far away. The phase space dynamics are much more complex.
4.2. The Underlying Nonlinear Dynamics
We pause briefly in order to highlight the nonlinearity contained in the wave-droplet feedback. First the wave’s feedback upon the droplet. Newton’s law for the droplet’s trajectory equation has ingredients along the lines of a damped mass-spring ODE. In the standard mass-spring model if we allow the (quadratic) potential to oscillate back and forth, in the form , we have that
The values of , and determine the amplitude of oscillations, in particular when close to resonance. To the left of Figure 5, we observe a sinusoidal-like wave sloshing as the droplet performs a harmonic-like oscillation in the right-most cavity. Motivated by this sloshing wave, take as the mass-spring oscillating potential
Without the external periodic forcing this is a damped nonlinear pendulum. Expanding leads to a cubic non-linear “spring” as in Duffing’s equation. Hence, the effective time-dependent potential for an oscillating droplet, confined to a cavity, is quite more complex than the examples mentioned and has a built-in nonlinearity.
The droplet’s feedback onto the system is felt in the wavemaking pressure term . During each Faraday period, the precise position for this forcing term is unknown. In the spirit of a free boundary problem, the wave generation term is another nonlinear component in the wave-particle dynamics.
4.3. Two Droplets Interacting at a Distance
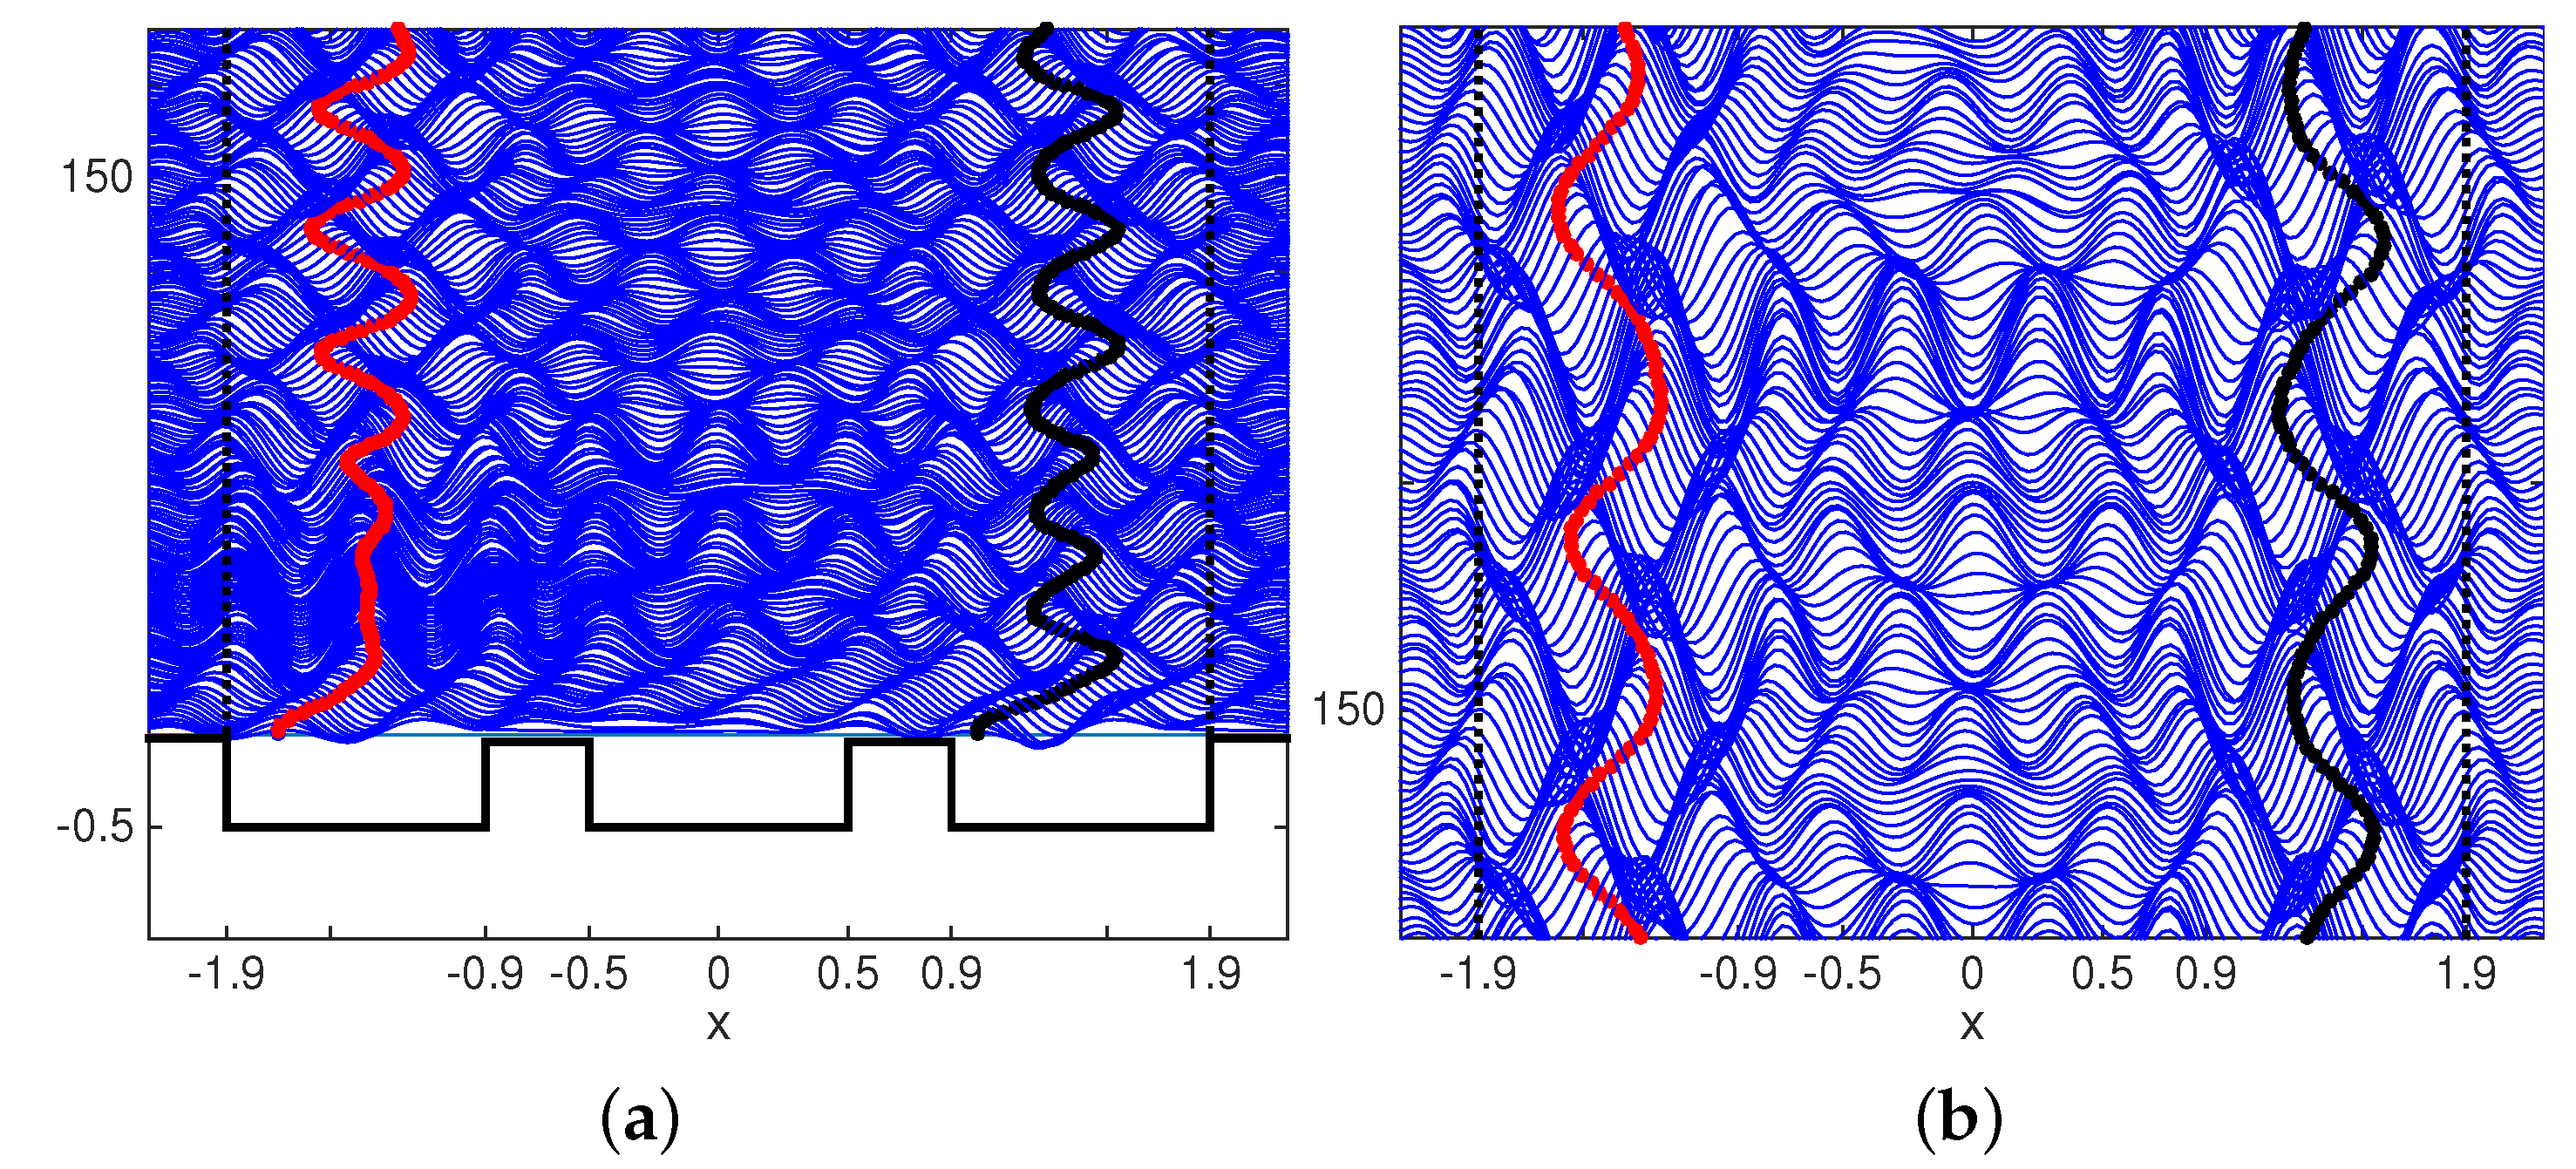
Next we consider simulations with two droplets. We want to exhibit regimes where droplet interaction at a distance has special properties, being of course mediated by Faraday waves. The domain geometry is similar to before, where we perform a little change in cavity sizes, now all having width equal to 1.0 cm. The barriers are 0.4 cm wide with a fluid depth of 0.04 cm above them. The shaking strength will initially be set at .
For the sake of comparison, in Figure 9 we display the entire domain regarding the oscillation of a single droplet in this 3-cavity scenario. A nearly uniform oscillation is observed, even with these lower barriers. By making the cavity widths a bit smaller, the droplet is more strongly confined in connection with a slightly tighter wave sloshing. In Figure 10 the left droplet is allowed into the dynamics and a mild interaction at a distance is observed. In the left graph of Figure 10, we see that the right droplet’s trace was a bit altered by the presence of the left one. The detail of the wave field is presented to the right. The detail is for a time interval around . This wave-field detail will be used for a comparison later.
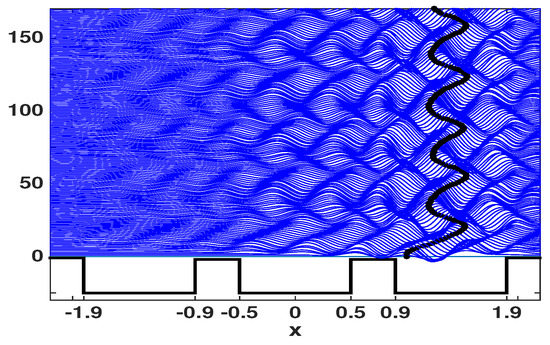
Figure 9.
A droplet oscillates by itself in the right-most cavity. The vertical trace indicates a nearly uniform oscillation of the droplet trapped in the respective cavity.
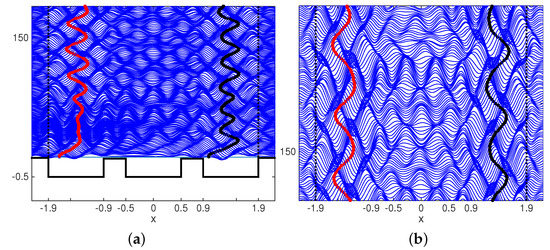
Figure 10.
(a) On the left, we observe two droplets oscillating within their respective cavities. Through transmission over the barriers, the wave-mediated dynamics allow for a mild interaction between the two droplets. (b) On the right graph we observe a detail of the more complex wave-field pattern, in contrast to the simpler wave sloshing seen in Figure 9. The current wave pattern indicates some crossing of information in both directions.
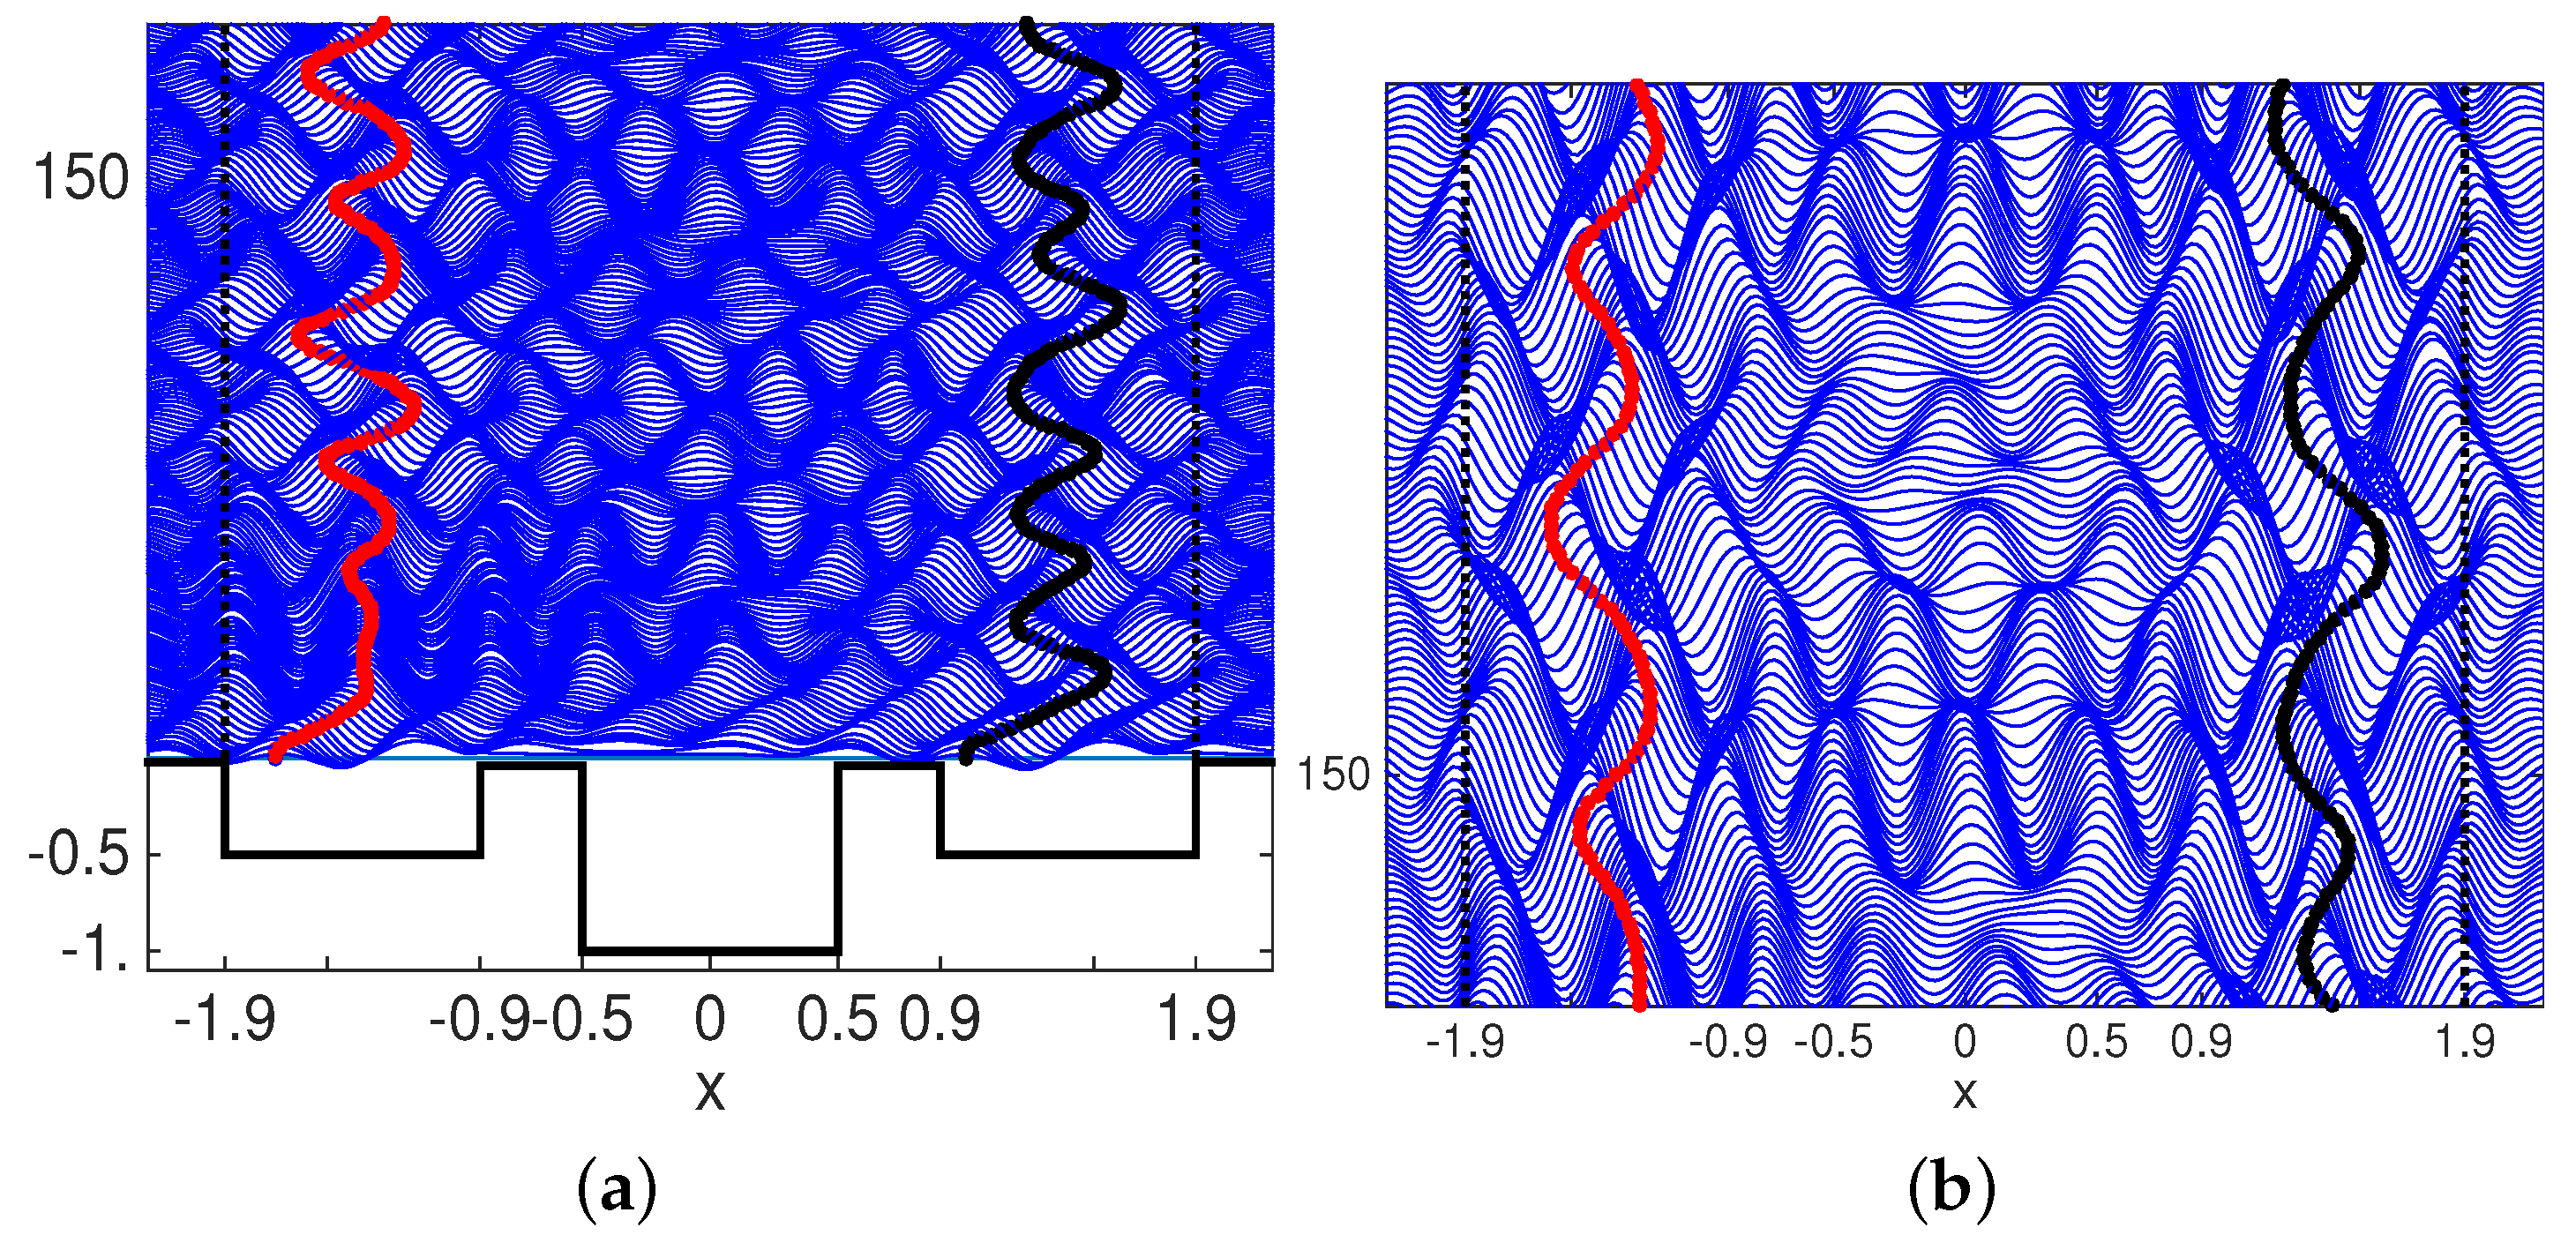
In the simulation presented in Figure 11 the mid-cavity was made deeper. A deeper cavity lowers the Faraday threshold locally and therefore is closer to the unstable resonant regime. Hence a small amplitude wave transmitted over to the mid-cavity might be amplified to establish a stronger interaction with the other droplet. The wave pattern in the middle cavity has dark regions, indicating steeper profiles and more structure. See Figure 11 to the right, and note, for example, at time .
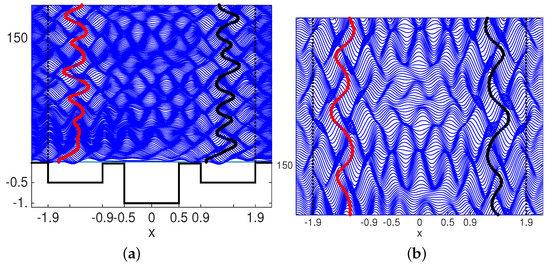
Figure 11.
(a) On the left, we observe two droplets oscillating within their respective cavities. The deeper mid-cavity acts as an amplifier for waves transmitted over barriers. This enhanced wave-mediated dynamics allow for a stronger interaction between the two droplets. The vertical (droplet position) traces are more complex than those observed in Figure 10. (b) On the right graph we observe the detail of the wave-field pattern, which is more intense than that from the case in Figure 10. The mid-cavity-amplifier has enhanced the wave-mediated communication between oscillators.
4.4. Kuramoto-Like Spontaneous Synchronization
The celebrated Kuramoto system of ODEs [12,13] became an important phenomenological model in phase transition due to the spontanous synchronization that can be displayed by its coupled oscillators. The Kuramoto system has been greatly studied, being a nonlinearly coupled system of phase oscillators. This limit-cycle dynamical system focuses on phase dynamics. The model can be used for phase transition from an incoherent to a coherent or partially coherent state. Coherence arises with a phase-locked regime, with all oscillators in synchrony. In Appendix A we briefly introduce this important finite-dimensional model where all oscillators are explicitly coupled by a nonlinear term.
Nachbin, Couchman and Bush [39] presented a laboratory experiment with two droplets oscillating in their respective cavities separated by an empty cavity in the middle. The rectangular cavities had an aspect ratio leading to a one dimensional droplet oscillation. The presence of a second droplet, located two cavities to the left, generated a second harmonic in the right-most oscillations. When the second droplet was removed the second harmonic disappeared. It was the first laboratory evidence that two droplets interact at a distance through their underlying wave field, displaying an inter-cavity forcing. With numerical simulations Nachbin [14] then showed that droplets can spontaneously synchronize even at a distance. Even the possibility of statistical coherence was discovered, where oscillators become identical in a statistical sense. Sáenz et al. [40] presented laboratory experiments showing the collective behavior of droplet oscillations in a 2D lattice. In the present work we explore parameter space indicating how subtle differences in the cavity settings and shaking strengths can establish an adequate scenario for the spontaneous synchronization to take place.
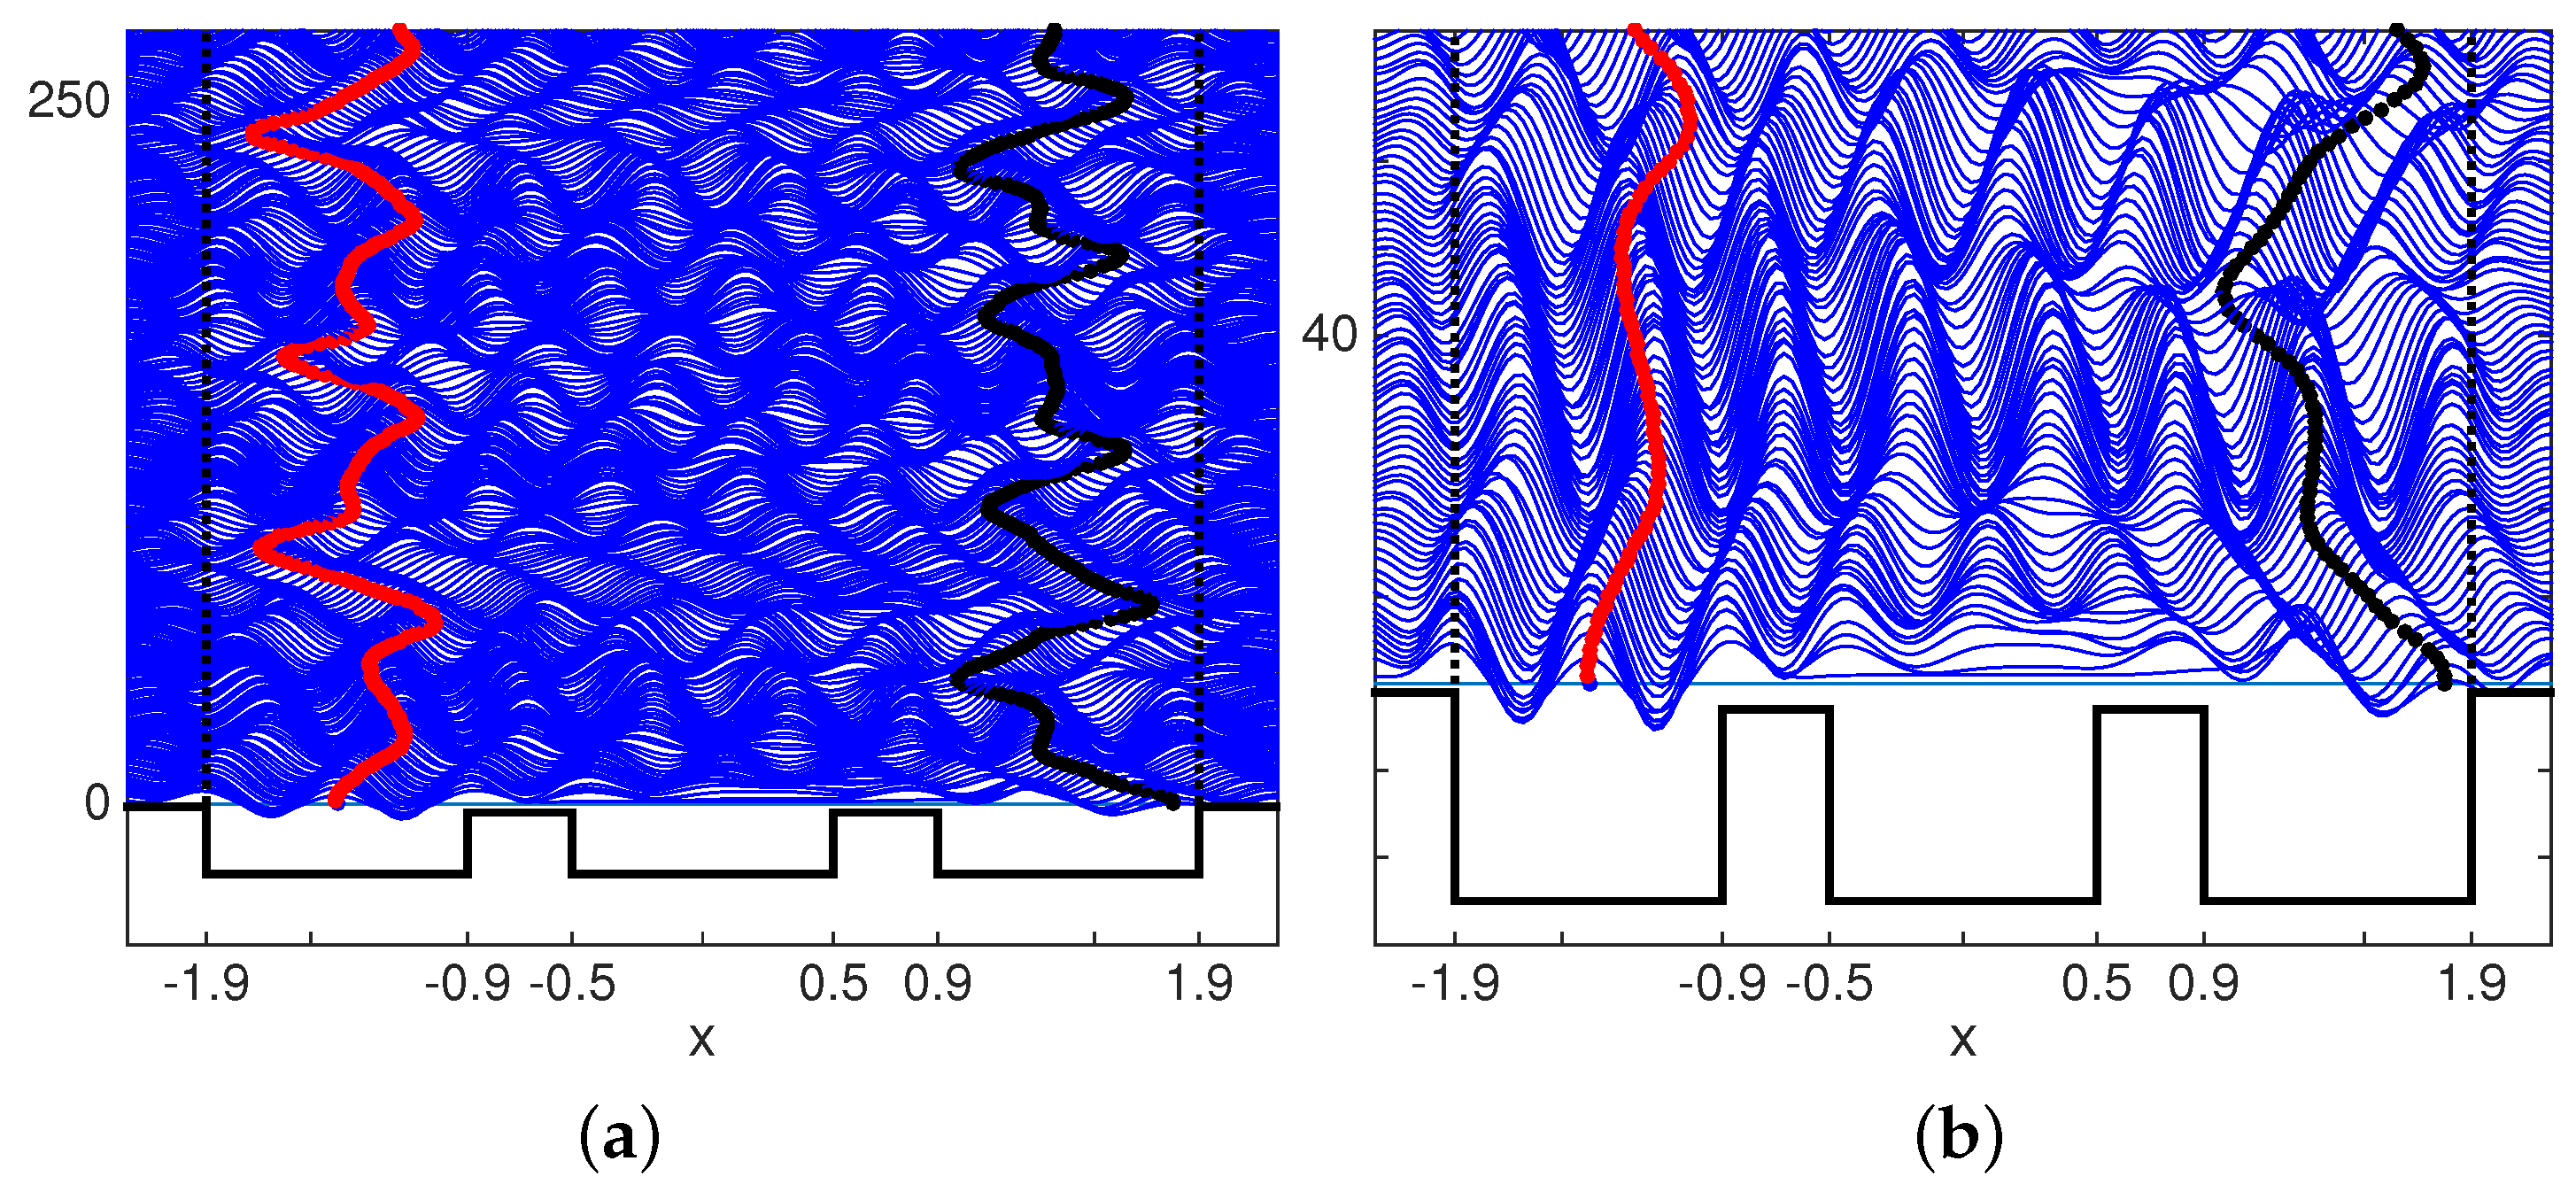
The cavity widths are kept to 1.0 cm and the fluid depth above barriers is increased to 0.06 cm. In the first simulation all cavities have depth equal to 0.5 cm. Since the barriers are lower we expect some interaction between the droplets. This can be readily oberved in Figure 12 where nontrivial wave activity is seen in the mid-cavity, even with a slightly weaker shaking strength of . The droplets’ vertical traces in time do not look antisymmetric which indicates they do not synchronize. This is confirmed by animating the droplets’ dynamics in phase space, as seen in the Supplementary Material Movie01. For a better comparison of the phase space dynamics of the two droplets we reflect the left droplet dynamics about the origin, by multiplying both the position and velocity by . In the synchronization cases of interest, we will see one droplet marker exactly on top of the other. We also animate the dynamics of the average position and average velocity, indicated by a a diamond marker. Markers only indicate the droplet position in phase space and are not related to droplet size, which have about 1 mm of diameter. During the time intervals when the diamond marker rests at the origin, the droplets are in synchrony. This is not seen in Movie01 but can be observed in Movie02, mentioned next.
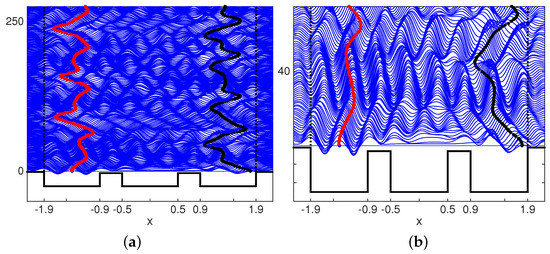
Figure 12.
The shaking intensity is less intense and equal to . On the other hand the barrier heights have been lowered so that the fluid depth above them is equal to 0.06 cm. More wave transmission is being allowed. (a) On the left, we observe two droplets oscillating within their respective cavities. The mid-cavity has the same depth as the side ones and is equal to 0.5 cm. The vertical axis indicates that the simulation goes a bit beyond time . (b) On the right graph we observe a detail of the wave-field pattern. The mid-cavity is allowing for some communication between oscillators due to more wave transmission over both barriers.
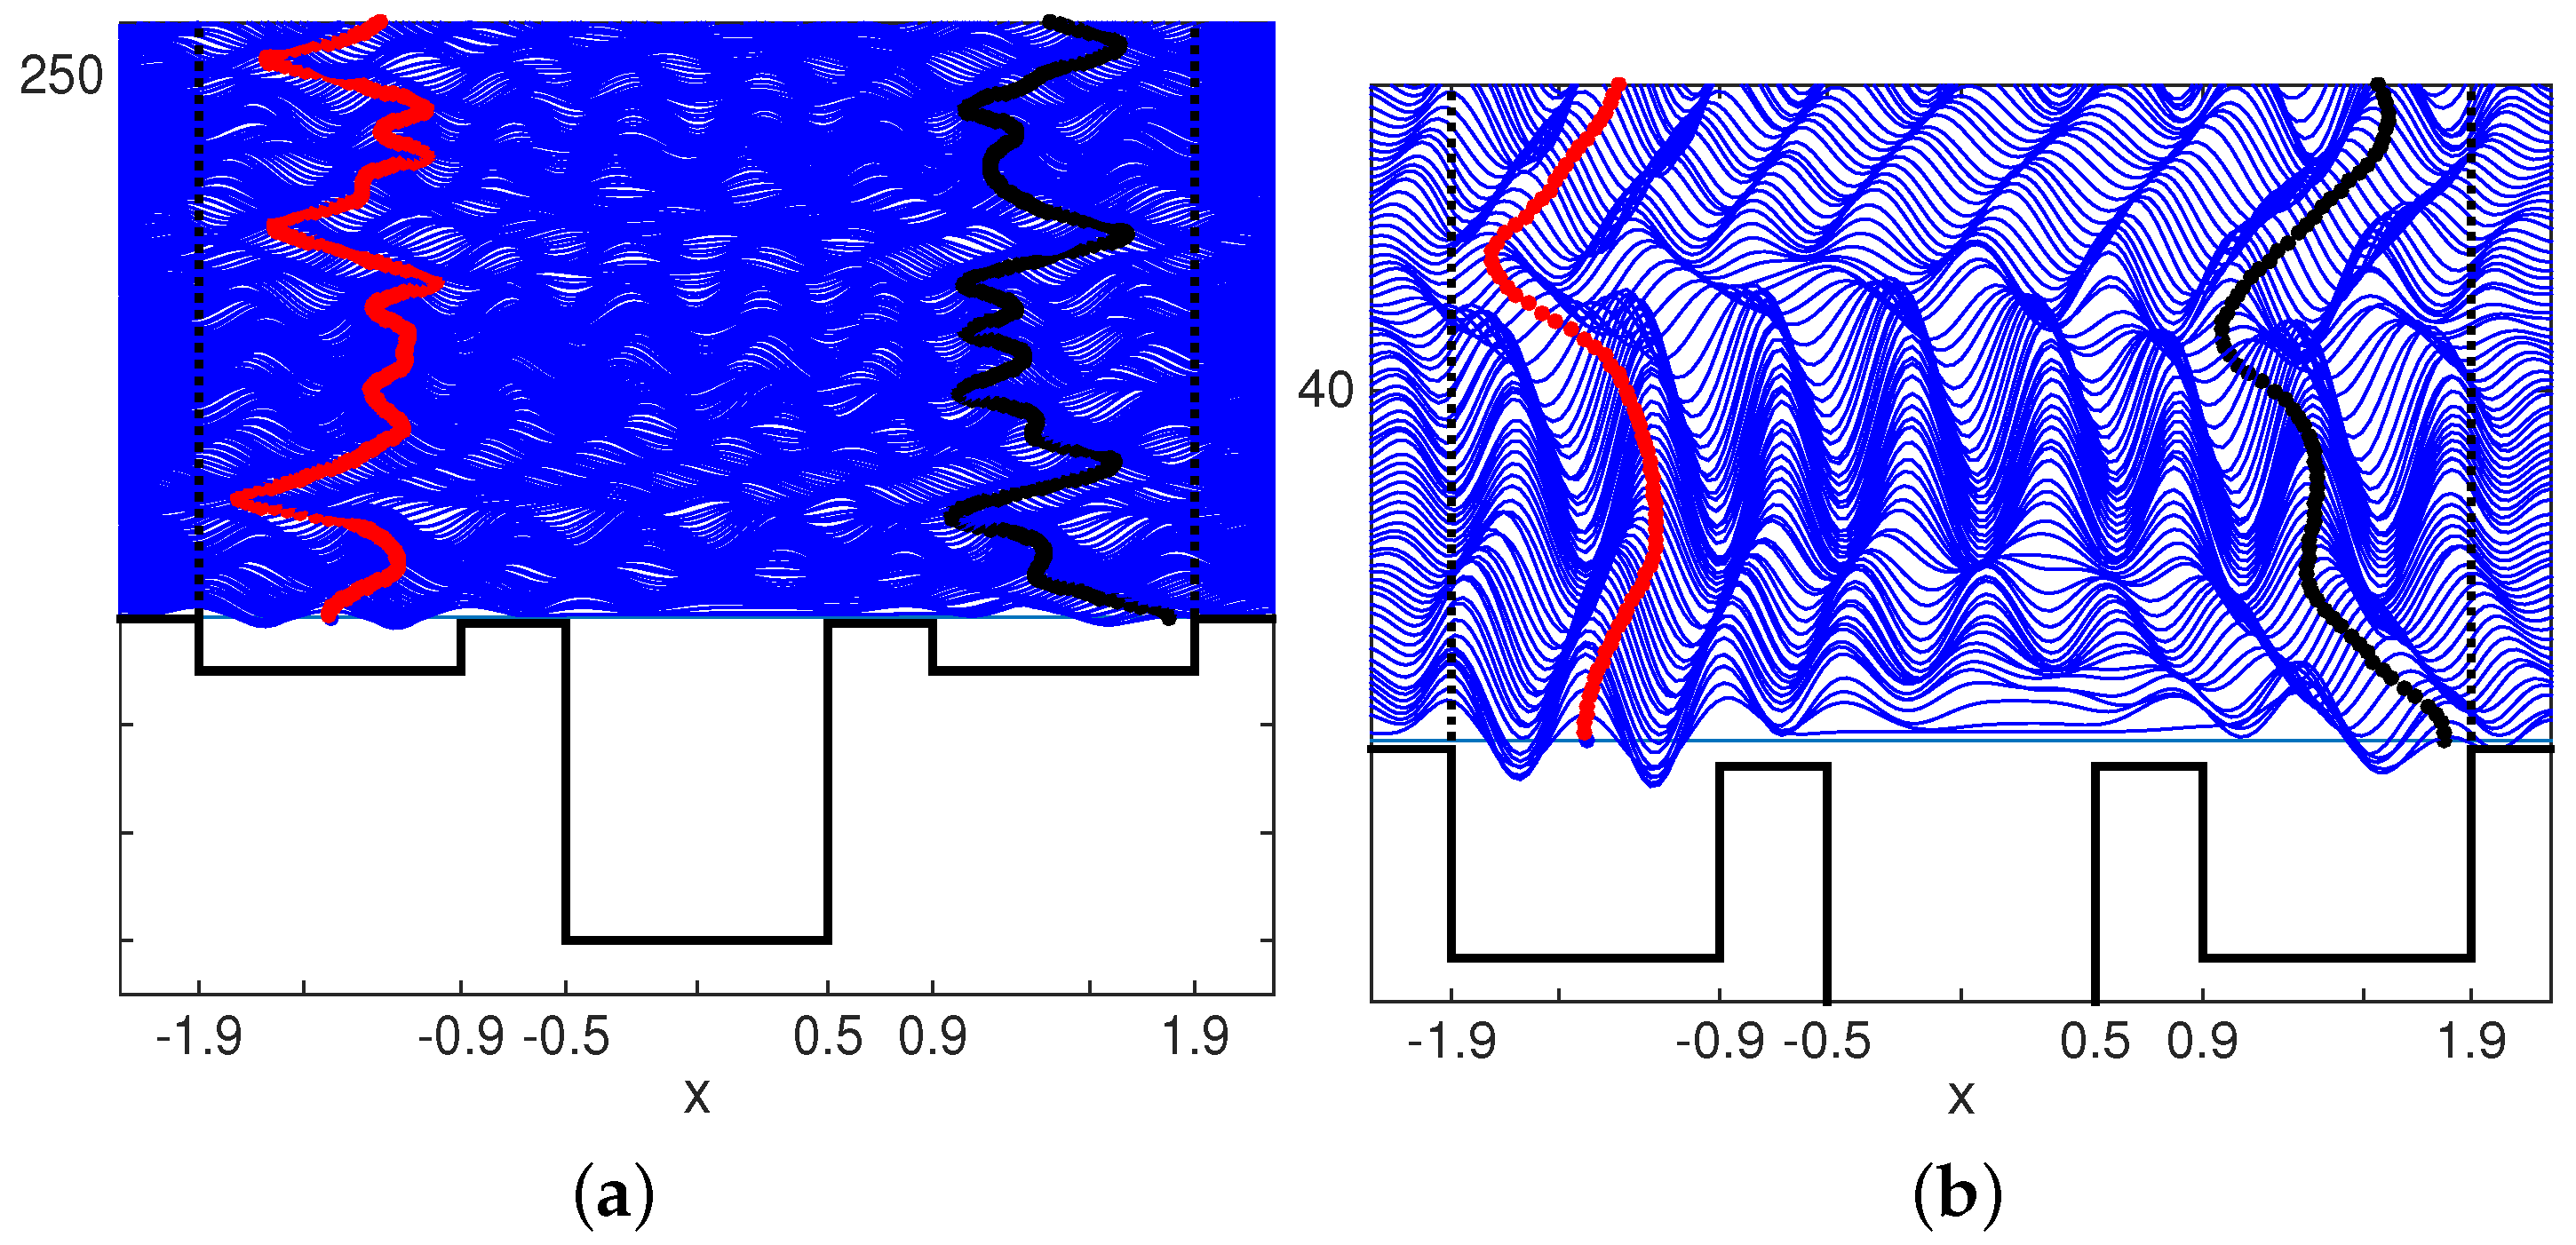
The mid-cavity depth was then increased to 2.0 cm, which lowers the Faraday threshold locally. Transmitted waves to the mid-cavity should enhance, to some degree, the coupling at a distance. We observed a few time intervals in which the droplets were spontaneously in sync. In the interests of space, this simulation is not presented. In order to further enhance the wave-mediated coupling between the droplets, the mid-cavity depth was further increased to 3.0 cm. In the Kuramoto model stronger coupling increases synchronization, namely, through the number of phase oscillators recruited into phase locking. Here we only have two oscillators, so stronger coupling promotes longer periods of spontaneous synchronization. This is observed in the phase-plane animation connected with Figure 13 (Supplementary Material Movie02). Comparing animations (Movie01 with Movie02) we observe that stronger wave-mediated coupling gives rise to a more consistent set of cycles/loops traversed by both droplets.
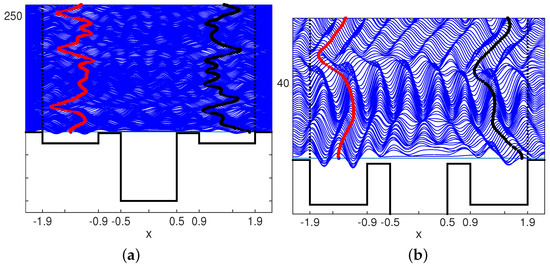
Figure 13.
The data are similar to those of the simulation in Figure 12, but now the depth of the mid cavity has been increased to 3.0 cm, thereby enhancing communication between droplets. (a) On the left, we observe two droplets oscillating within their respective cavities. The pattern is different from that of Figure 12. The vertical axis indicates that the simulation goes a bit beyond . The deeper mid-cavity acts as an amplifier for waves transmitted over barriers. This enhanced wave-mediated dynamics allow for a stronger interaction between the two droplets. The vertical droplet traces have more structure than before. (b) On the right graph we observe the detail of the wave field pattern. Just after time we see how the sudden turn to the left of the right droplet causes the other droplet to also move to the left. This was not observed in Figure 12.
One indication of a stronger coupling, promoted by having a deeper mid-cavity, is displayed by comparing the graphs on the right of Figure 12 and Figure 13. The wave fields and droplet traces are, namely, the same up to time . In Figure 13 we see that the sudden move to the left of the right-most droplet affects the droplet at the far left. The entire set of standing waves in the mid-cavity is immediately bent to the left and affects the right droplet’s trace, which is also bent to the left. This is not observed in Figure 12 where the set of standing waves, including those in the left cavity, was not affected.
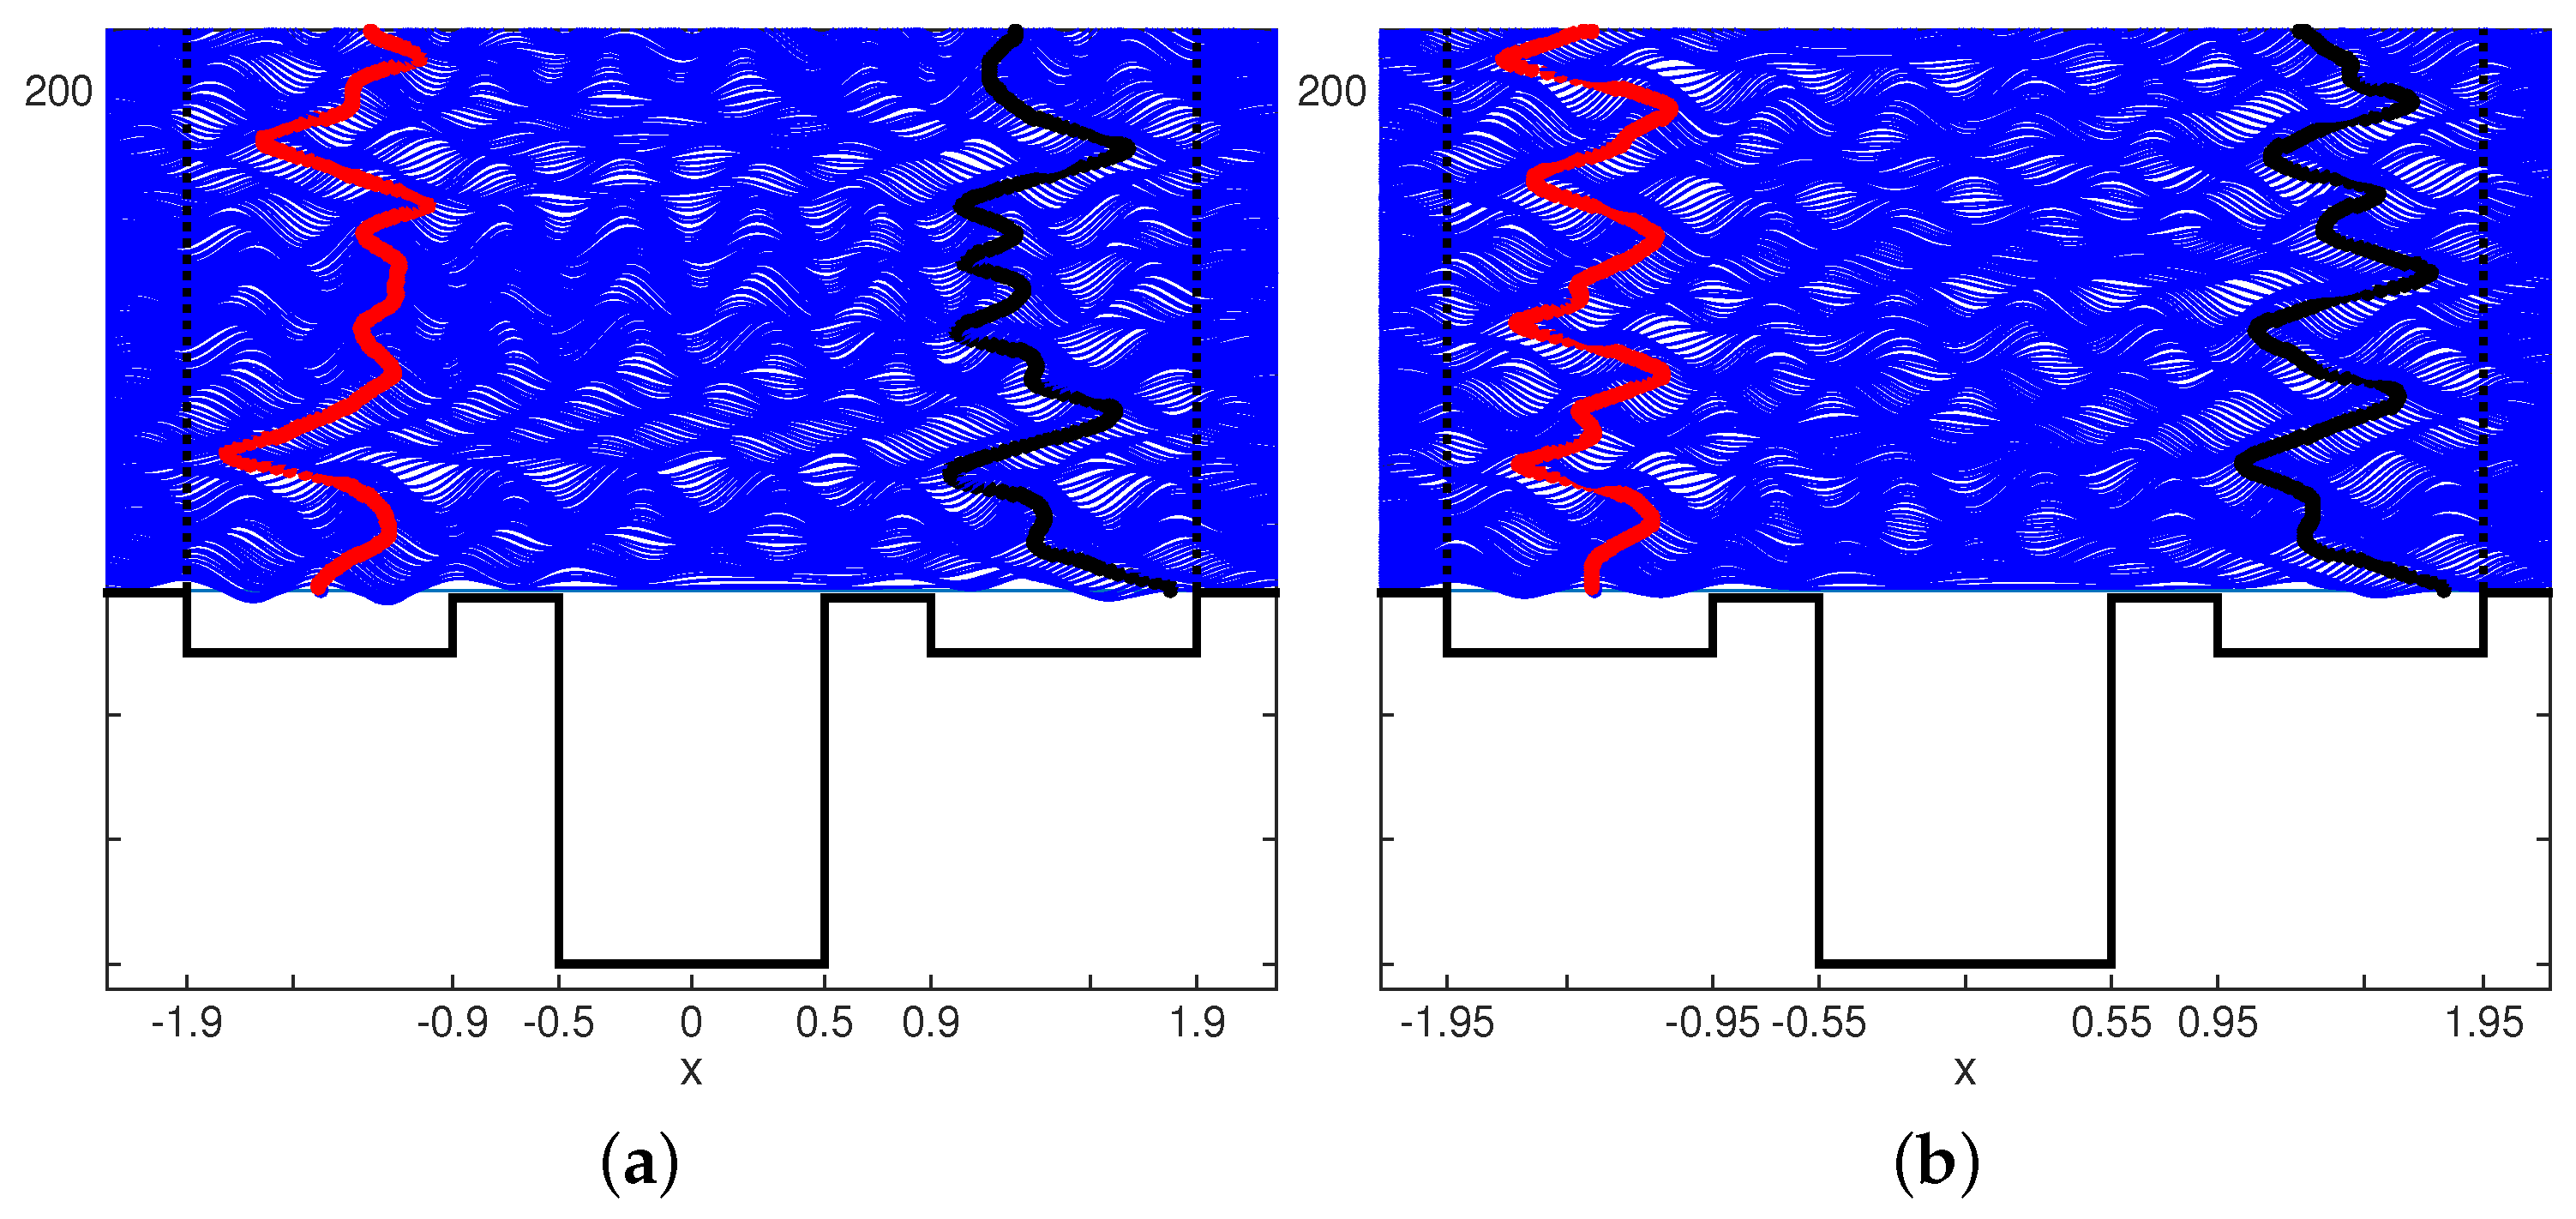
In Figure 14 we compare the previous simulation with a new configuration where the mid-cavity is slightly wider, now of width equal to 1.1 cm. This small change of 10% in width affects the long distance transmission between oscillators. The droplet traces, on the right of Figure 14, are completely different from the previous example—for convenience, repeated on the left of Figure 14. With a wider mid-cavity, synchrony degrades. As mentioned in the introduction, and refering to the work of Brumley et al. [16], the precise role played by hydrodynamic coupling in facilitating synchrony is unknown.
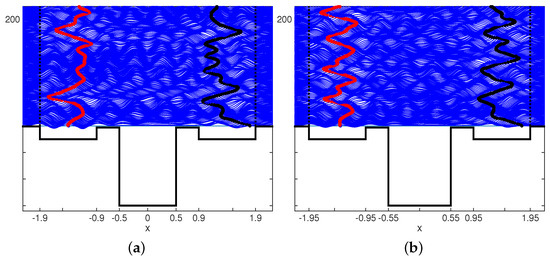
Figure 14.
(a) On the left, the same simulation as in Figure 13. The vertical axis indicates that the simulation goes a bit beyond . (b) On the right graph, a simulation with a slightly wider mid-cavity, of width equal to 1.1 cm.
5. Discussion
The main goal in this study was to detail the wave-mediated, spontaneous, Kuramoto-like synchronization of droplets oscillating confined to cavities separated by a distance. Our findings relate to the Kuramoto model and to some biological applications, as mentioned in the introduction. Here the nonlinear coupling is more general. It is established through the underlying free surface wave field. Mathematically the coupling is established implicitly in the ODE system through the solution of a PDE system, which through the free surface hydrodynamics, creates an underlying time-dependent potential for the particle/droplet oscillator. There is a nonlinear feedback between oscillators and the wave-mediated coupling mechanism. We explored a certain parameter range but there are several features of interest to be explored and understood in the future.
As mentioned, the hydrodynamic pilot-wave analogy with quantum mechanics is of interest but was not our main goal here. It is important to briefly comment on the work of some authors in quantum mechanics with an interest in wave-mediated dynamics. de la Peña et al. [41] have produced a great amount of work in stochastic eletrodynamics (SED). The SED modeling considers, for example, a charged particle on a zero-point, randomly vibrating energy background [42]. Valdés-Hernández, de la Peña and Cetto [42] showed how the wave-mediated dynamics, in the SED case, lead to non-separable bipartite dynamics which relate to entanglement.
In conclusion, further research in wave-mediated particle dynamics is of broad interest to applications, and for stimulating work regarding the underlying mathematical theory.
Supplementary Materials
The following are available online at https://www.mdpi.com/2311-5521/5/4/226/s1, Video S1: Movie01, Video S2: Movie02.
Funding
This research was funded by by CNPq under (PQ-1B) 301949/2007-7 and FAPERJ Cientistas do Nosso Estado Project Number 150.036/2018.
Conflicts of Interest
The author declares no conflict of interest. The funders had no role in the design of the study; in the collection, analyses or interpretation of data; in the writing of the manuscript, or in the decision to publish the results.
Appendix A. The Kuramoto Model
Consider the phase dynamics of N coupled oscillators [12,13], where the respective cycle-amplitudes are not so important. In this class of problems we have the celebrated Kuramoto model given as
where is the phase and is the oscillator’s natural frequency, while are the coefficients of the coupling matrix regarding oscillator-i with oscillator-j. The natural frequencies can be randomly chosen from a Gaussian distribution. Incoherence refers to a state in which dynamically every phase is equally probable [12]. Phase-locking indicates that all oscillators have evolved to the same frequency. An order parameter [12,13] controls phase coherence: where . The larger R the greater is the degree of coherence. Different coupling matrix models are found in Acebrón et al. [12]. We remark that, in contrast with our hydrodynamic model, the oscillation amplitudes are fixed and the nonlinear (sinusoidal) phase-coupling term is given and does not change in time.
In our present model the phase-coupling is performed implicitly and dynamically through the free surface hydrodynamics. There are no equations explicitly coupling the oscillators. Here the droplets generate waves at discrete, short periods of time, namely, for 1/4 of the Faraday period. The wave-cavity interaction creates a time-varying potential for the oscillators. This dynamic-potential is controlled by the free surface hydrodynamics. In the spirit of a free boundary problem, this ingredient adds great mathematical difficulty to the present problem.
References
- Bühler, O. Waves and Mean Flows; Cambridge University Press: Cambridge, UK, 2014. [Google Scholar]
- Mei, C.C.; Stiassnie, M.; Yue, D.K.-P. Theory and Applications of Ocean Surface Waves; World Scientific Publishing Company: Singapore, 2005. [Google Scholar]
- Constantin, A. Nonlinear Water Waves with Applications to Wave-Current Interactions and Tsunamis; SIAM: Philadelphia, PA, USA, 2011. [Google Scholar]
- Lannes, D. The Water Wave Problem, Mathematical Analysis and Asymptotics; American Mathematical Society: Providence, RI, USA, 2013. [Google Scholar]
- Couder, Y.; Fort, E.T. Single-particle diffraction and interference at a macroscopic scale. Phys. Rev. Lett. 2006, 97, 154101. [Google Scholar] [CrossRef] [PubMed]
- Bush, J.W.M. Pilot-wave hydrodynamics. Ann. Rev. Fluid Mech. 2015, 47, 269. [Google Scholar] [CrossRef]
- Harris, D.; Bush, J.W.M. The Pilot-Wave Dynamics of Walking Droplets, YouTube Video. 2012. Available online: https://www.youtube.com/watch?v=nmC0ygr08tE&t=7s (accessed on 28 November 2020).
- Dias, F.; Dyachenko, A.I.; Zakharov, V.E. Theory of weakly damped free-surface flows: A new formulation based on potential flow solutions. Phys. Lett. A 2008, 372, 1297–1302. [Google Scholar] [CrossRef]
- Dyachenko, A.I.; Kuznetsov, E.A.; Spector, M.D.; Zakharov, V.E. Analytical description of the free surface dynamics of an ideal fluid (canonical formalism and conformal mapping). Phys. Lett. A 1996, 221, 73–79. [Google Scholar] [CrossRef]
- Driscoll, T.A. Schwarz-Christoffel Toolbox. Available online: tobydriscoll.net/project/sc-toolbox/ (accessed on 28 November 2020).
- Bush, J.W.M.; Oza, A.U. Hydrodynamic Quantum Analogs. Rep. Prog. Phys. 2020. in Press. [Google Scholar] [CrossRef]
- Acebrón, J.; Bonilla, L.; Perez, V.; Ritort, F.; Spigler, R. The Kuramoto model: A simple paradigm for synchronization phenomena. Rev. Mod. Phys. 2005, 77, 137–185. [Google Scholar] [CrossRef]
- Strogatz, S. From Kuramoto to Crawford: Exploring the onset of syn- chronization in populations of coupled oscillators. Physica D 2000, 143, 1–20. [Google Scholar] [CrossRef]
- Nachbin, A. Walking droplets correlated at a distance. Chaos 2018, 28, 096110. [Google Scholar] [CrossRef]
- Guo, H.; Fauci, L.; Shelley, M.; Kanso, E. Bistability in the synchronization of actuated microfilaments. J. Fluid Mech. 2018, 836, 304–323. [Google Scholar] [CrossRef]
- Brumley, D.R.; Wan, K.Y.; Polin, M.; Goldstein, R.E. Flagellar synchronization through direct hydrodynamic interactions. eLife 2014, 3, e02750. [Google Scholar] [CrossRef]
- Sclavounos, P.D. Nonlinear particle kinematics of ocean waves. J. Fluid Mech. 2005, 540, 133–142. [Google Scholar] [CrossRef]
- Fedele, F.; Chandre, C.; Farazmand, M. Kinematics of fluid particles on the sea surface: Hamiltonian theory. J. Fluid Mech. 2016, 801, 260–288. [Google Scholar] [CrossRef]
- Milewski, P.A.; Galeano, C.A.; Nachbin, A.; Bush, J.W.M. Faraday pilot-wave dynamics: Modelling and computation. J. Fluid Mech. 2015, 778, 361–388. [Google Scholar] [CrossRef]
- Nachbin, A.; Milewski, P.A.; Bush, J.W.M. Tunneling with a hydrodynamic pilot-wave model. Phys. Rev. Fluids 2017, 2, 034801. [Google Scholar] [CrossRef]
- Moláček, J.; Bush, J.W.M. Drops walking on a vibrating bath: Towards a hydrodynamic pilot-wave theory. J. Fluid Mech. 2013, 727, 612–647. [Google Scholar] [CrossRef]
- Benjamin, T.B.; Ursell, F. The stability of the plane free surface of a liquid in vertical periodic motion. Proc. R. Soc. Lond. A 1954, 225, 505–515. [Google Scholar]
- Walker, J. Drops of liquid can be made to float on the liquid. What enables them to do so? Sci. Am. 1978, 238, 151–158. [Google Scholar] [CrossRef]
- Nachbin, A. A terrain-following Boussinesq system. SIAM J. Appl. Math. 2003, 63, 905–922. [Google Scholar] [CrossRef]
- Driscoll, T.A.; Trefethen, L.N. Schwarz-Christoffel Mapping; Cambridge University Press: Cambridge, UK, 2002. [Google Scholar]
- Muñoz Grajales, J.C.; Nachbin, A. Dispersive wave attenuation due to orographic forcing. SIAM J. Appl. Math. 2004, 64, 977–1001. [Google Scholar]
- Fouque, J.-P.; Garnier, J.; Nachbin, A. Time reversal for dispersive waves in random media. SIAM J. Appl. Math. 2004, 64, 1810–1838. [Google Scholar]
- Muñoz Grajales, J.C.; Nachbin, A. Improved Boussinesq-type equations for highly variable depth. IMA J. Appl. Math. 2006, 71, 600–633. [Google Scholar] [CrossRef][Green Version]
- Ruban, V.P. Water waves over a strongly undulating bottom. Phys. Rev. E 2004, 70, 066302. [Google Scholar] [CrossRef] [PubMed]
- Flamarion, M.V.; Milewski, P.A.; Nachbin, A.T. Rotational waves generated by current-topography interaction. Stud. Appl. Math. 2019, 141, 433–464. [Google Scholar] [CrossRef]
- Flamarion, M.V.; Nachbin, A.; Ribeiro, R.T., Jr. Time-dependent Kelvin cat-eye structure due to current-topography interaction. J. Fluid Mech. 2020, 889, A11. [Google Scholar] [CrossRef]
- Andrade, D.; Nachbin, A. Two-dimensional surface wave propagation over arbitrary ridge-like topographies. SIAM J. Appl. Math. 2018, 78, 2465–2490. [Google Scholar] [CrossRef]
- Craig, W.; Sulem, C. Numerical simulation of gravity waves. J. Comput. Phys. 1993, 108, 73–83. [Google Scholar] [CrossRef]
- Artiles, W.; Nachbin, A. Nonlinear evolution of surface gravity waves over highly variable depth. Phys. Rev. Lett. 2004, 93, 234501. [Google Scholar] [CrossRef]
- Matsuno, Y. Nonlinear evolution of surface gravity waves on fluid of finite depth. Phys. Rev. Lett. 1992, 69, 609. [Google Scholar] [CrossRef]
- Andrade, D.; Nachbin, A. A three-dimensional Dirichlet-to-Neumann operator for water waves over topography. J. Fluid Mech. 2018, 845, 321–345. [Google Scholar] [CrossRef]
- Whitham, G. Linear and Nonlinear Waves; John Wiley: Hoboken, NJ, USA, 1974. [Google Scholar]
- Fokas, A.S.; Nachbin, A. Water waves over a variable bottom: A non-local formulation and conformal mappings. J. Fluid Mech. 2012, 695, 288–309. [Google Scholar] [CrossRef]
- Nachbin, A.; Couchman, M.; Bush, J.W. Non-local features of a hydrodynamic pilot-wave system. APS Div. Fluid Dyn. 2016, 2016, L16.005. [Google Scholar]
- Sáenz, P.; Pucci, G.; Goujon, A.; Cristea-Platon, T.; Dunkel, J.; Bush, J.W.M. Spin lattices of walking droplets. Phys. Rev. Fluids 2018, 3, 100508, and YouTube Video, 2017. Available online: https://www.youtube.com/watch?v=-2yYgfaU6Ik&t=1s (accessed on 28 November 2020). [CrossRef]
- De la Peña, L.; Cetto, A.; Valdés-Hernández, A. The Emerging Quantum; Springer International Publishing: Berlin/Heidelberg, Germany, 2015. [Google Scholar]
- Valdés-Hernández, A.; de la Peña, L.; Cetto, A. Bipartite entanglement induced by a common background (zero-point) radiation field. Found. Phys. 2011, 41, 843–862. [Google Scholar] [CrossRef]
Publisher’s Note: MDPI stays neutral with regard to jurisdictional claims in published maps and institutional affiliations. |
© 2020 by the author. Licensee MDPI, Basel, Switzerland. This article is an open access article distributed under the terms and conditions of the Creative Commons Attribution (CC BY) license (http://creativecommons.org/licenses/by/4.0/).

