Article

Aerodynamic Investigation of a Morphing Wing for Micro Air Vehicle by Means of PIV

by
Rafael Bardera
1,*,
Ángel Rodríguez-Sevillano
2 and
Adelaida García-Magariño
1
1
Experimental Aerodynamics Branch, Instituto Nacional de Técnica Aeroespacial (INTA), 28850 Torrejón de Ardoz, Spain
2
Escuela Técnica Superior de Ingeniería Aeronáutica y del Espacio (ETSIAE), Universidad Politécnica de Madrid (UPM), 28040 Madrid, Spain
*
Author to whom correspondence should be addressed.
Fluids 2020, 5(4), 191; https://doi.org/10.3390/fluids5040191
Submission received: 6 October 2020 / Revised: 22 October 2020 / Accepted: 26 October 2020 / Published: 27 October 2020
(This article belongs to the Special Issue Aerodynamics and Aeroacoustics of Vehicles)

Abstract

:
A wind tunnel tests campaign has been conducted to investigate the aerodynamic flow around a wing morphing to be used in a micro air vehicle. Non-intrusive whole field measurements were obtained by using PIV, in order to compare the velocity and turbulence intensity maps for the modified and the original version of an adaptive wing designed to be used in a micro air vehicle. Four sections and six angles of attack have been tested. Due to the low aspect ratio of the wing and the low Reynold number tested of 6.4 × 10⁴, the influence of the 3D effects has been proved to be important. At high angles of attack, the modified model prevented the detachment of the stream, increased the lift of the wing and reduced the turbulence intensity level on the upper surface of the airfoil and in the wake.

1. Introduction

The idea of changing the wing shape or geometry in an aircraft to adapt to each aerodynamic condition of a typical mission profile is inspired by the observation of flight in nature, and it is far from new. Traditionally, the limitations related to the materials technology, which added complexity and weight, have prevented the implementation of this idea, and have led to more rigid aircraft that are optimized only for a limited flight conditions, with wings being designed as a compromise geometrically. An adaptive wing would diminish the compromises required to ensure the operation of airplane in multiple flight conditions, and in this context the concept of morphing aircraft arises in the aeronautical field, the word “morphing” being short for metamorphose. An early review of morphing aircraft in 2011 can be found in [1].
The appearance during the last few decades of the new materials and structures known as “smart” allows the concept of morphing aircraft to become more attractive. Smart materials can respond to changes in the environment and are not only structural materials but also active materials [2,3]. The main smart materials applied to aircraft are shape memory alloys (SMA) [4,5,6,7,8], piezoelectric such as macro fiber component (MFC) [9,10,11,12,13], shape memory polymers (SMP) [14,15] and electro-active polymers (EAP) [16]. For further information on the smart materials applied in morphing aircraft, the reader is referred to the recent review by Sun et al. [17].
The lower aerodynamic load in UAVs, their greater efficiencies requirements, and their short time-to-deliver because of reduced certifications issues and qualification tests increases the number of potential morphing technologies [1]. Recently, in a previous work by some of the authors [18], the case of morphing of changing the camber profile during flight have been investigated to optimize performance of a morphing micro air vehicle and a prototype of an adaptive wing using MFC was built and characterized.
This paper presents the wind tunnel tests campaign of a new Micro Air Vehicle (MAV) concept based on a bioinspired geometry combined with the possibility of flight with adaptive wing geometry depending on the flight conditions, occupying a gap that is not covered by the most of MAVs. These test experiments are dedicated to investigate the aerodynamic flow around the wing morphing to be used in our MAV.

2. Description of the Experimental Setup

The flowfield generated by a morphing model was obtained experimentally by means of particle image velocimetry (PIV). These experiments were conducted at the Low Speed Wind Tunnel 1 at the Instituto Nacional de Técnica Aeroespacial (INTA) in Spain. In Figure 1 is shown a photograph of the experimental setup. The experimental setup consists of the morphing model, a wind tunnel and the PIV system.

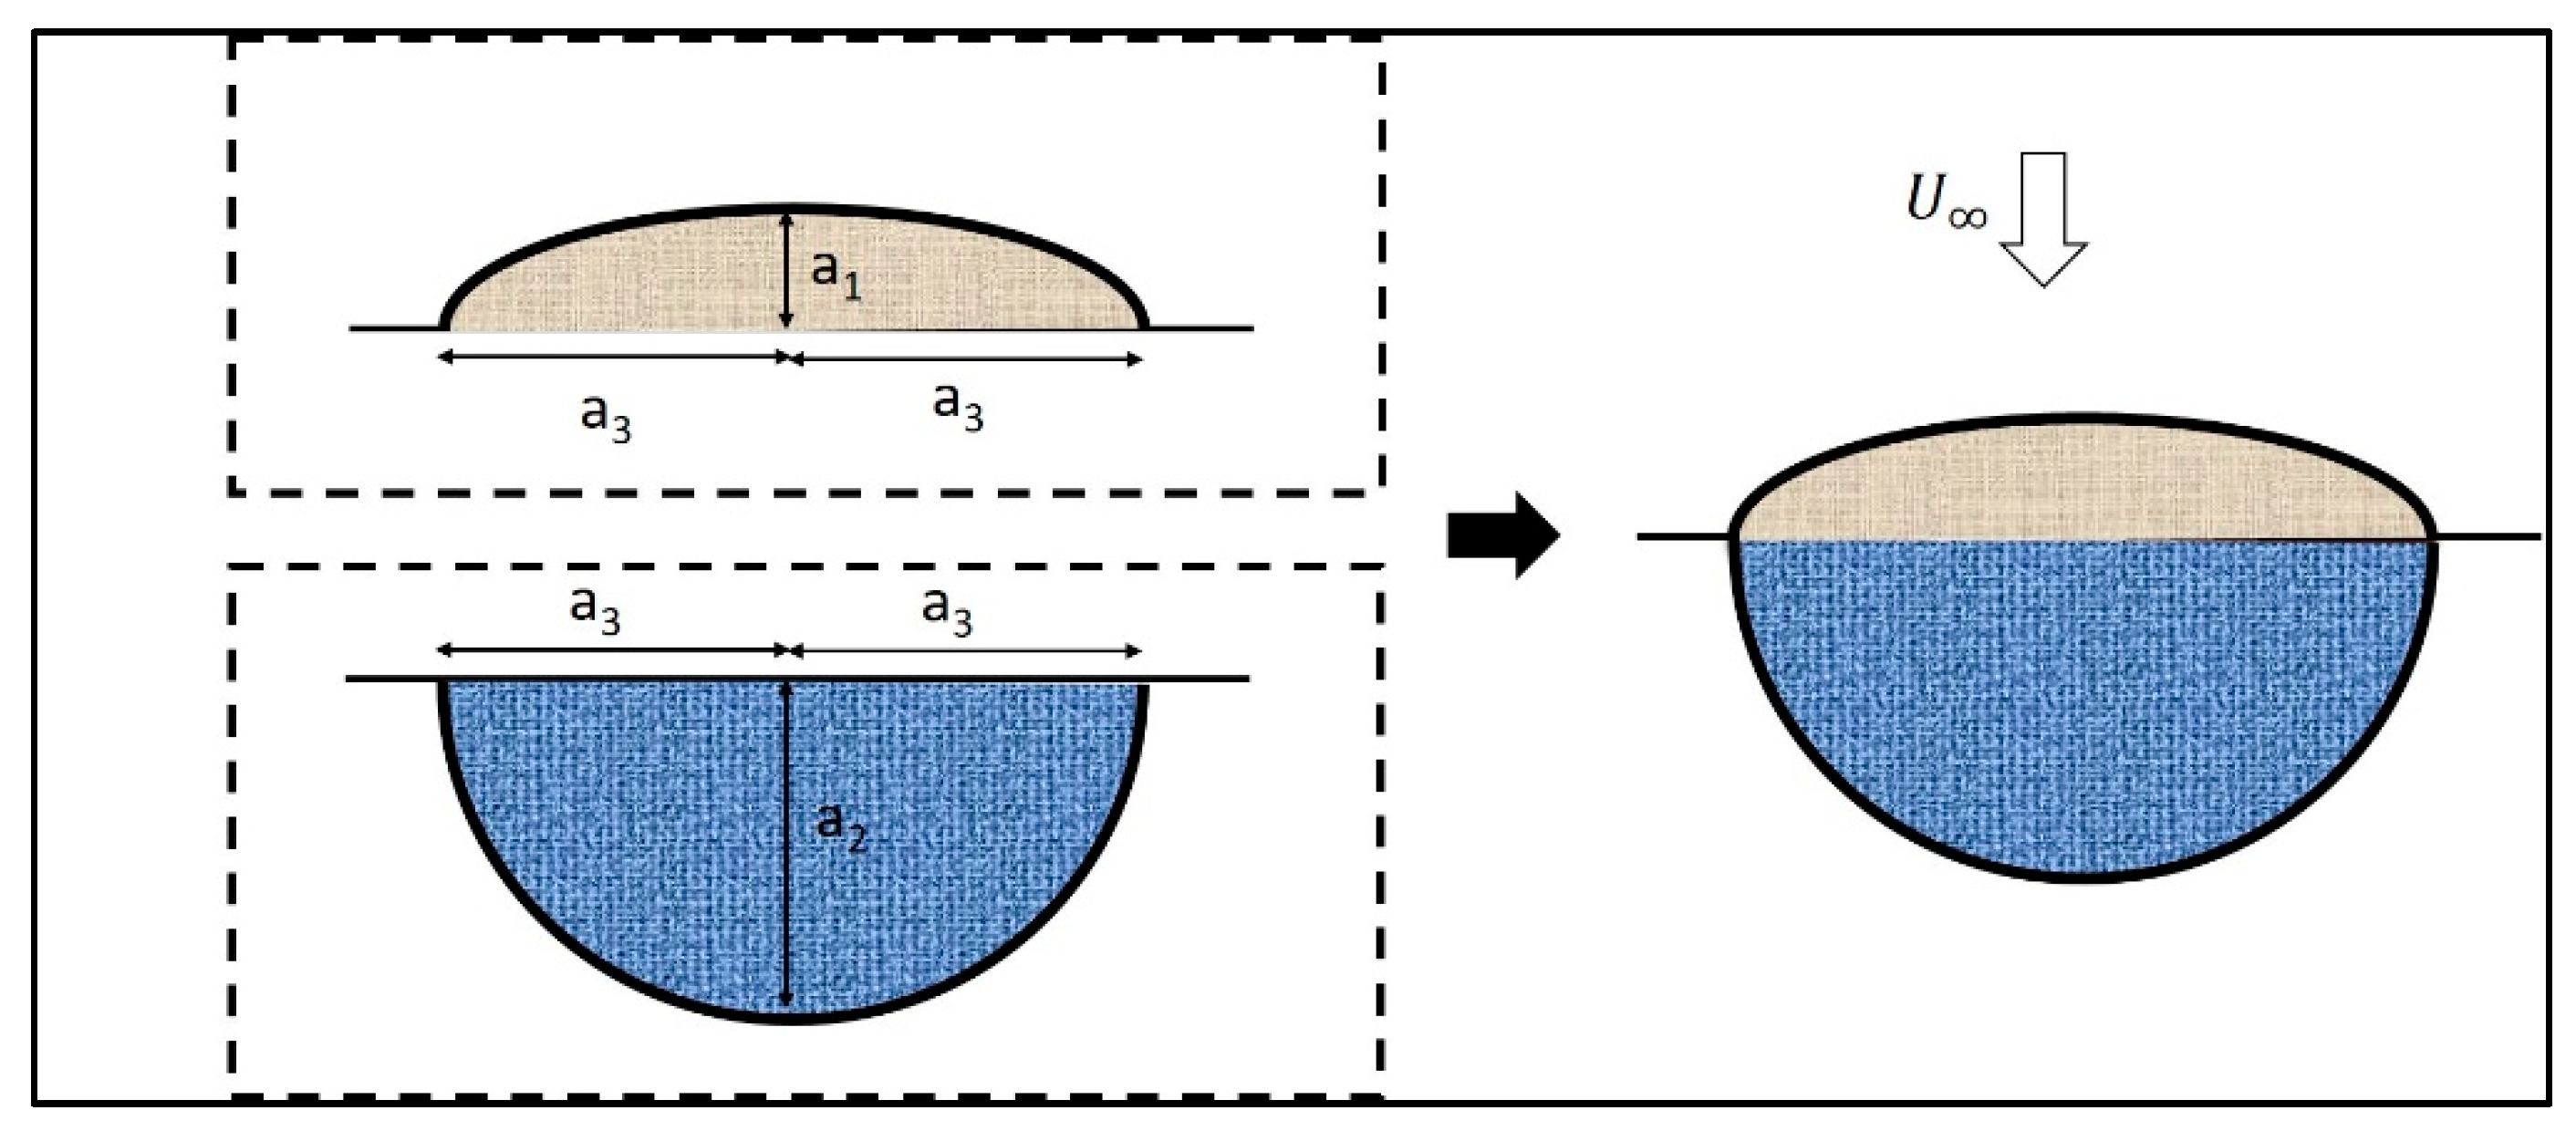
2.1. The Morphing Model

A micro UAV wing was designed and developed in the Universidad Politécnica de Madrid (UPM) that modifies its chamber using Macro Fiber Composites actuators [18]. The wing planform corresponds to the Zimmerman wing type, which consists of two half-ellipses joined at 25% and 75% of the chord (see Figure 2). This planform wing has an aspect ratio of 2.3 and is very efficient.
The profile of the unmodified wing was the Eppler 61 profile. The actuators were installed in the concavity of the intrados at 40% of the chord and four modified configurations were defined depending of the voltage applied to the material in Ref [18]. In the present investigation, the modified version Mod 4 is compared with the unmodified version corresponding to the Eppler 61 airfoil (See Figure 3). In Table 1, the main characteristics of both profiles are shown.
Due to its symmetry, only half-models were tested and the method of images was employed. Two half-models were made up of wood as 1:2 scaled versions of both airfoils (see Figure 3 again). Figure 4 shows the top and side views of the two models. The mean aerodynamic chord was 9.35 cm, while the area of the half-model was 0.011 m2. The models were attached to the wall (see Figure 1) by means of a screw that allows selecting the angle of attack. The model was placed at 30 mm height respect to the floor of the platform, in order to neglect ground effects. The model and its surroundings were painted in black to avoid light reflections.

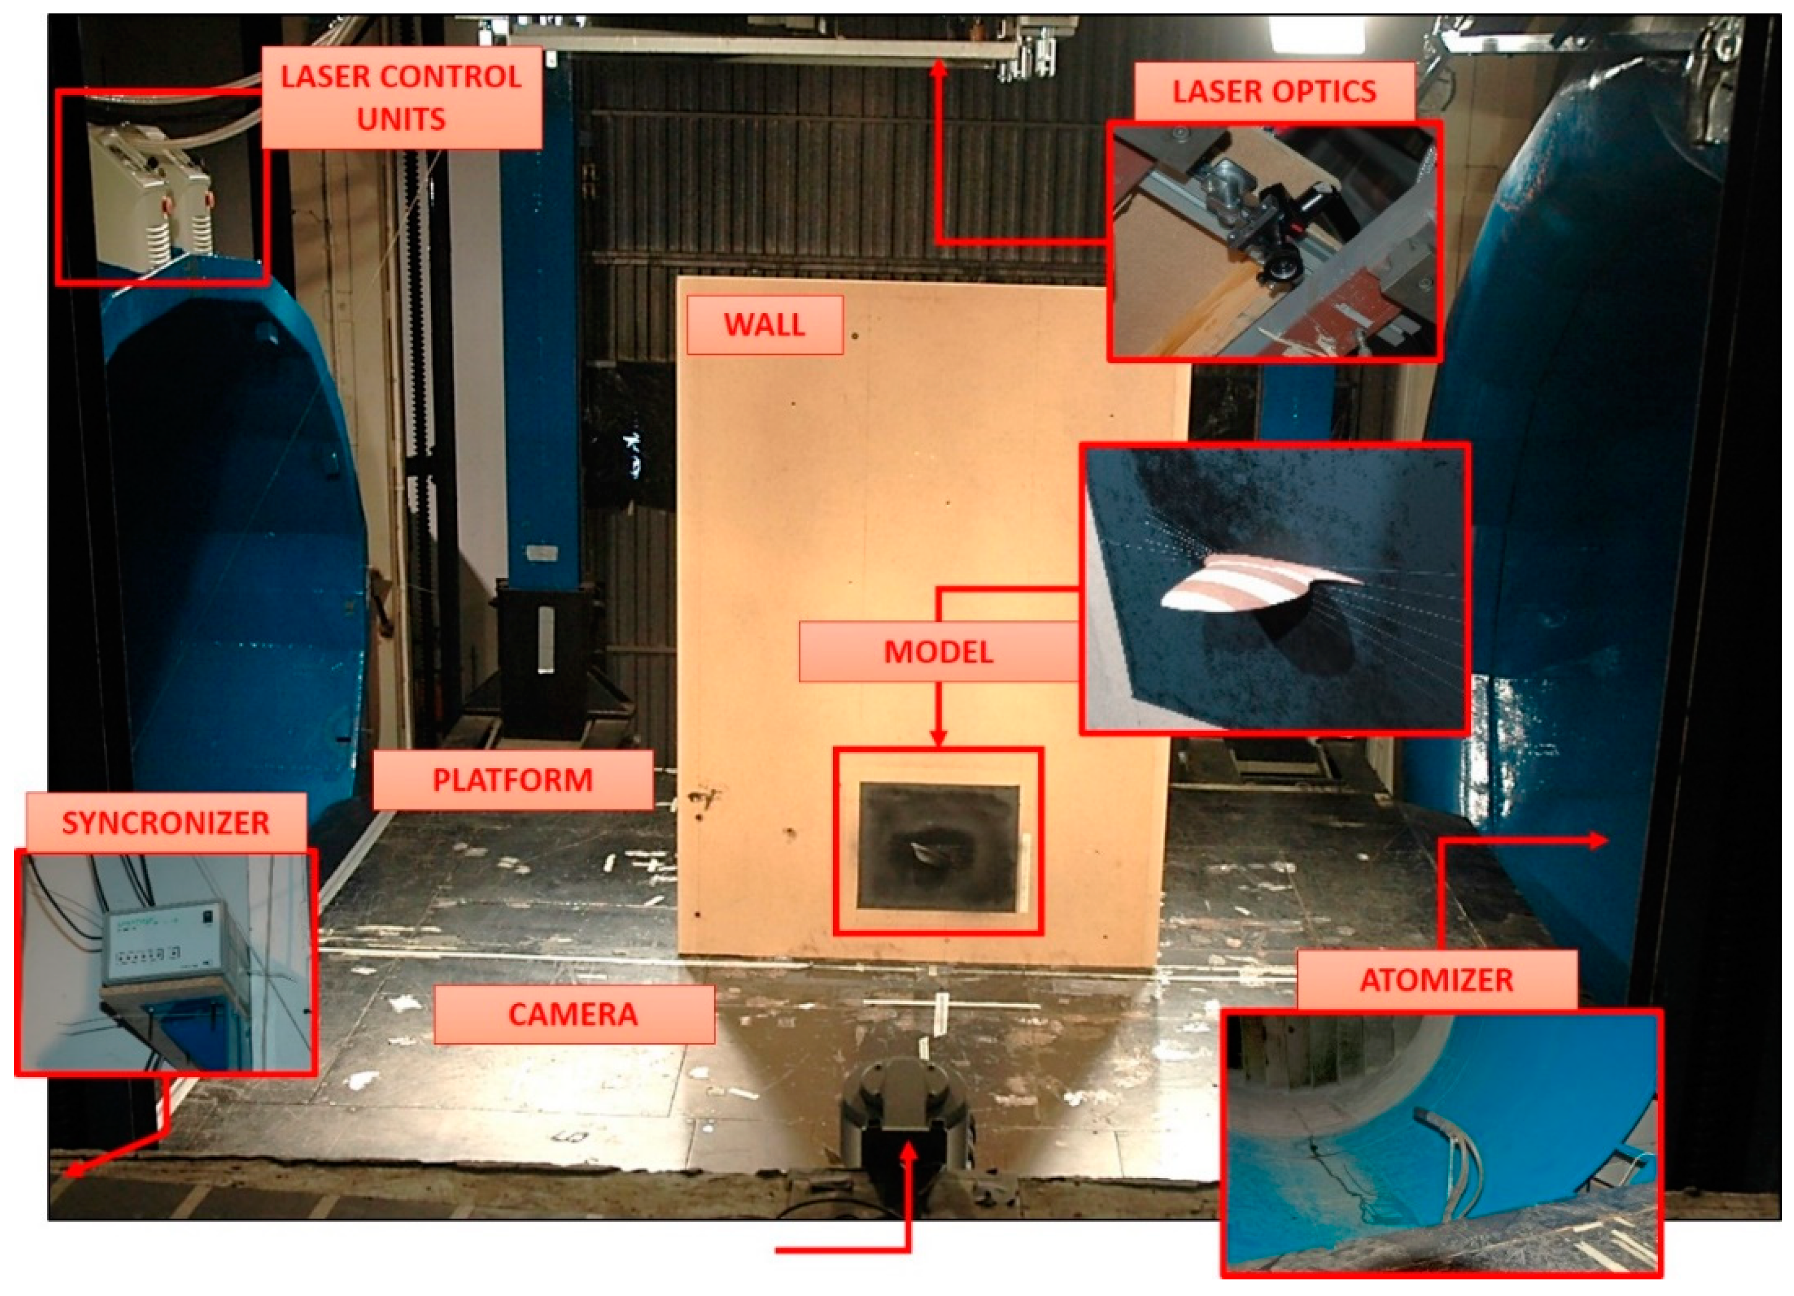
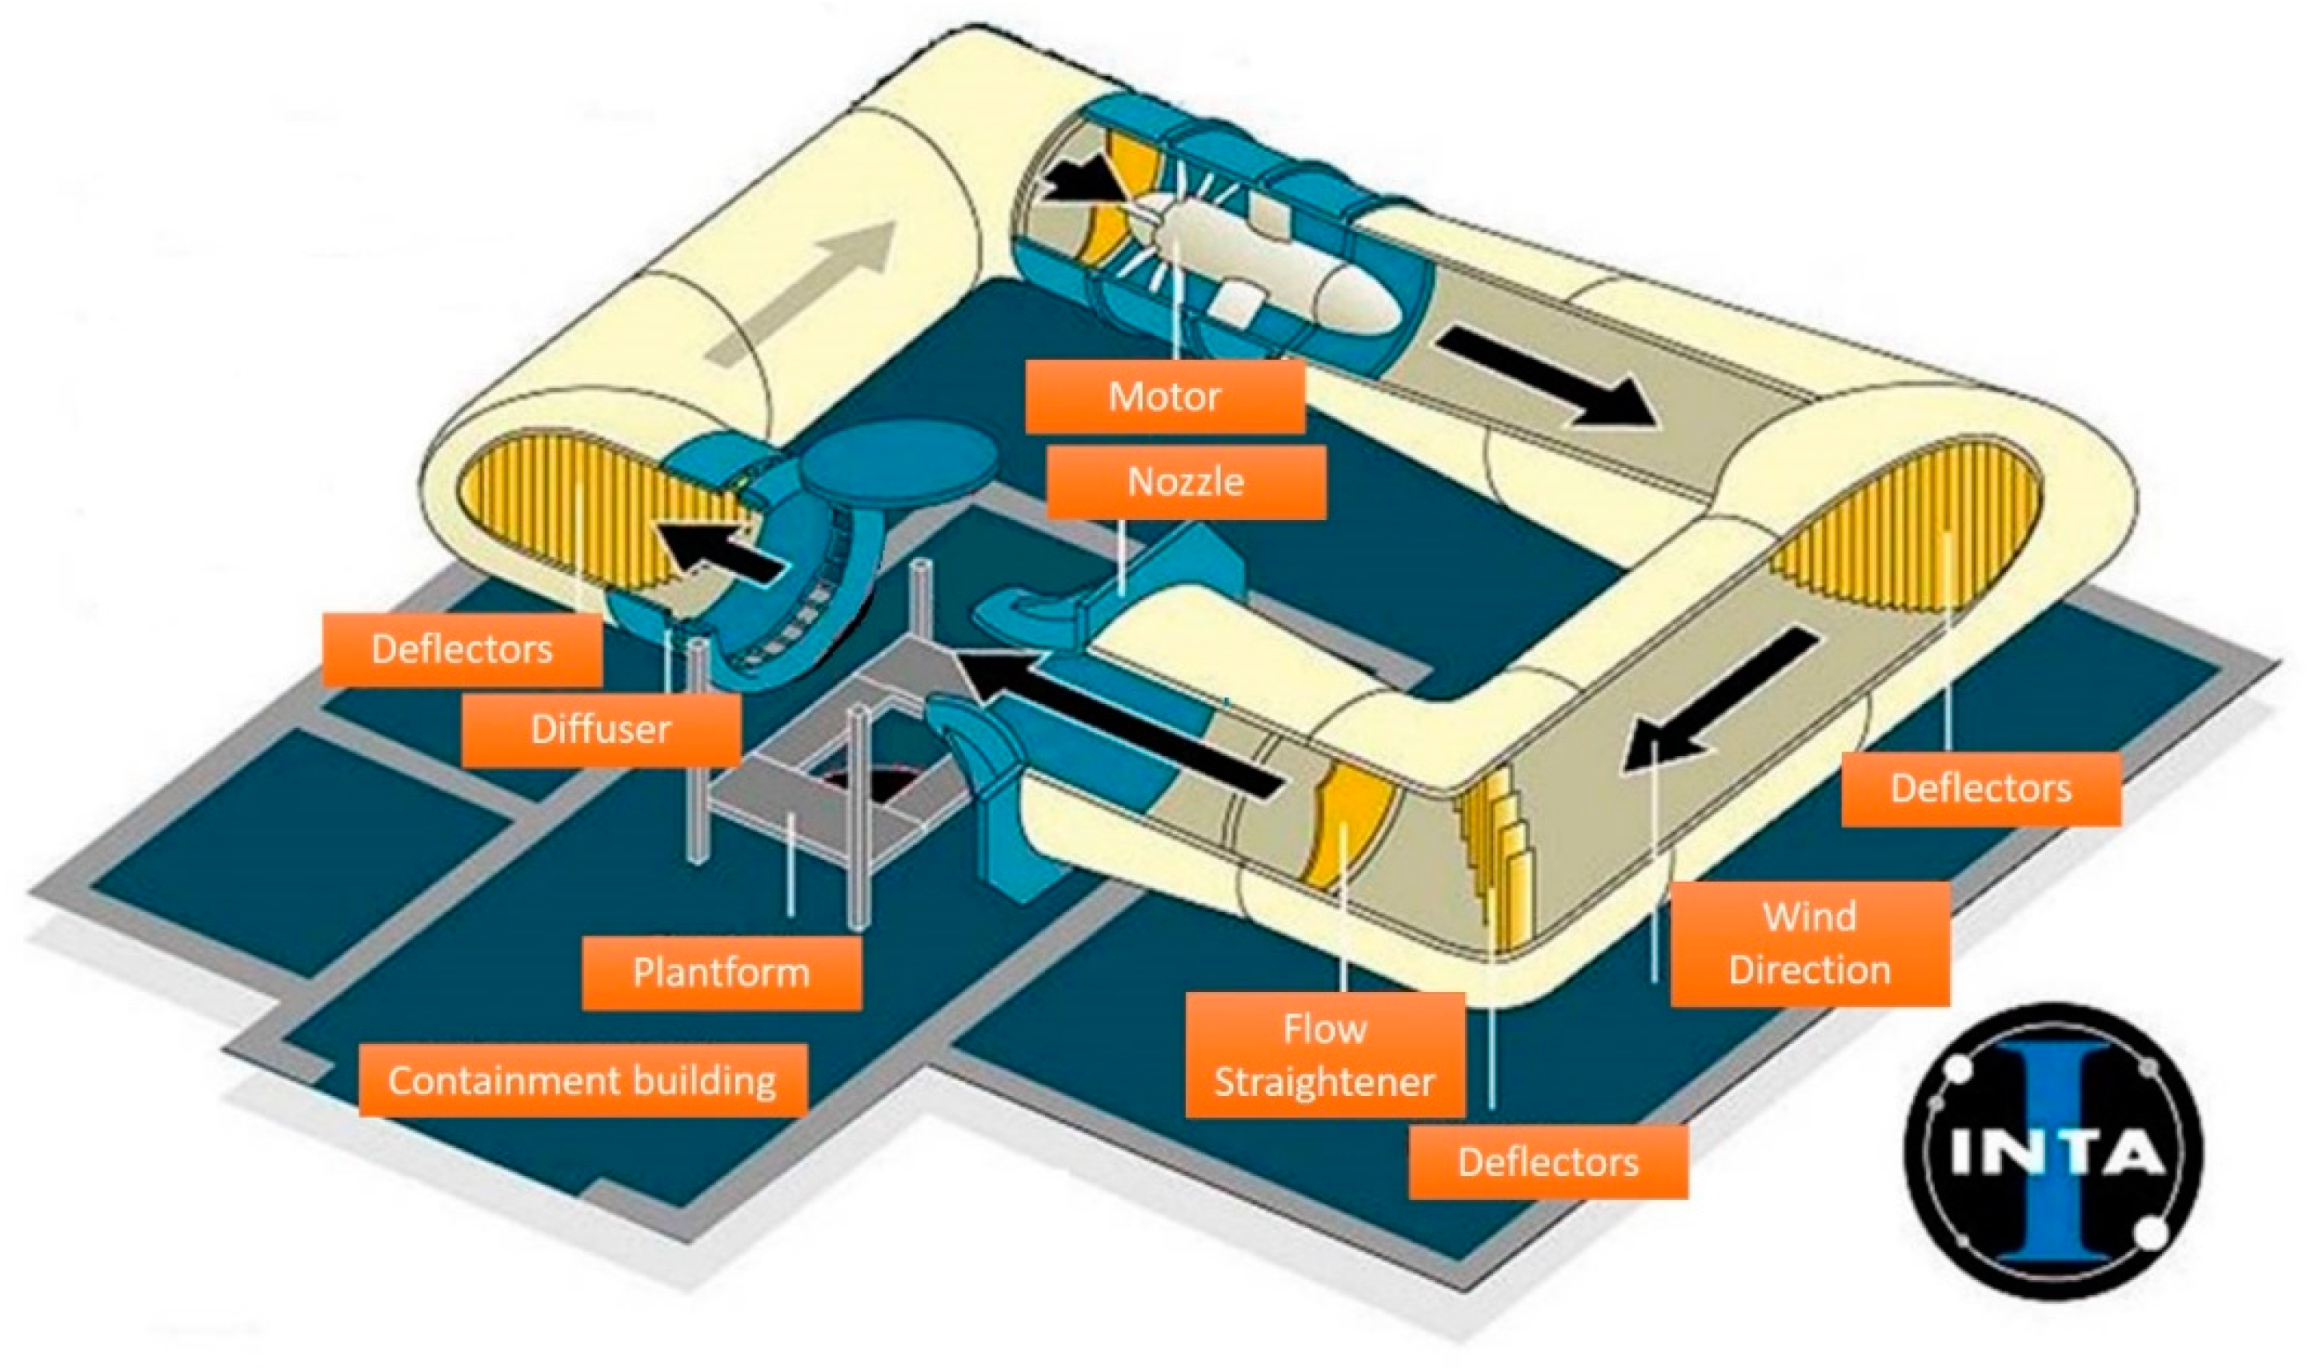
2.2. The Wind Tunnel

The INTA Low Speed Wind Tunnel 1 is a closed-circuit open-section wind tunnel. A sketch of the wind tunnel configuration is observed in Figure 5. The test section is a 3 m × 2 m elliptic section. The nozzle contraction ratio is 5:1. The motor power (DC 450 kW, 420 V) allows velocities up to 60 m/s. The wind stream velocity was 10 m/s, which led to a Reynold number of 6.4 × 10⁴. The turbulence intensity of the wind tunnel at the velocity of the experiment (10 m/s) was 0.9%.

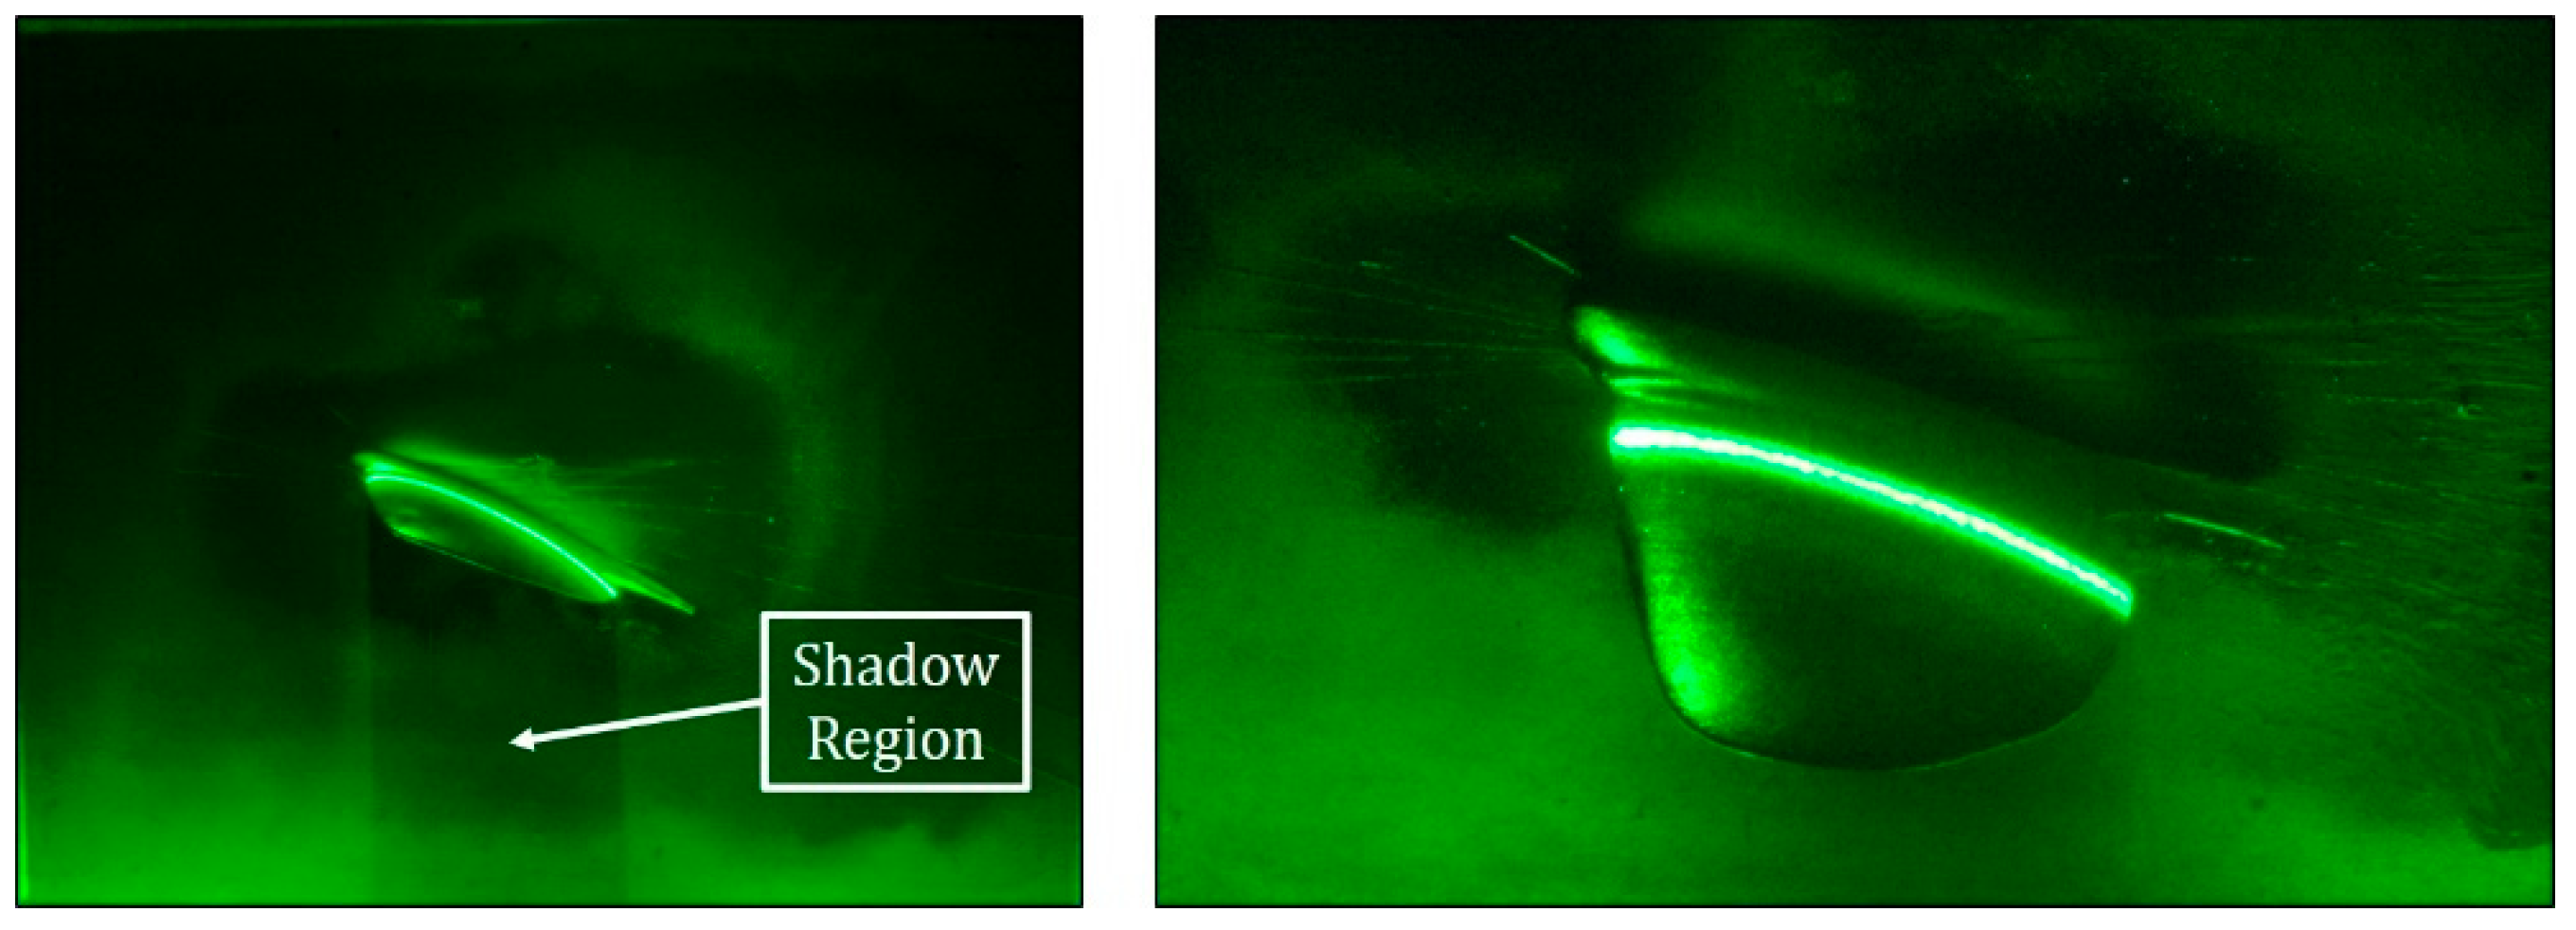
2.3. PIV Measurements

The flowfield maps at four sections of the morphing model was obtained using a commercial PIV system from TSI. Figure 6 shows the position of these four measurements regions named S0, S1, S2, and S3. Region S1 does not intersect the wing model, while the rest of the regions intersect the model at distances from the wall of 40, 60, and 85 mm.
Flow illumination was provided by two pulsed Nd:YAG 190 mJ lasers with a 8 ns of pulse duration. Images were taken using a Power View Plus 4MP camera with a 2048 pixels × 2048 pixels resolution that was placed outside the air stream at a distance to the test section of 1.5 m. Via a 64-bit camera link, data transmission directly to the PC RAM was allowed with an information transfer up to 512 MB per second, which is sufficient for the information budget considered in this study. The camera lenses were AF Nikkor 80–200 mm f/2.8 D IF-ED. The flow in the wind tunnel was seeded using two Laskin atomizers, which provided olive oil droplets having a diameter of 1 µm, which is small enough to follow the flow. Synchronization between image capturing and flow illumination and the analysis was carried out using the TSI Insight 3G software and the TSI Laser Pulse Synchronizer Model 610,035. The size of the interrogation window was 240 mm × 240 mm, which lead to a pixel size of 117 µm, which is small enough to follow the phenomena being analysed. Each recording sequence consisted of 200 pairs of frames separated from each other 0.06 s, corresponding to 15Hz and lasting for a total of 13.3 s. The time between pulses was 25 µs, which means that a particle moving at 10 m/s would move only 0.25 mm. Each PIV area was divided into smaller sub-interrogation areas containing 32 pixels × 32 pixels, which corresponded to a geometrical area of the size 3.7 mm × 3.7 mm, and during the post-processing an overlapping of 50% was employed. Due to the intersection of the laser plane (that illuminates from the top) with the model, there is a shadow region below the model for Sections S2 and S3 (see Figure 7).

3. Results and Discussion

In order to show the 3D flowfield structures generated around the airfoil, vertical velocity maps were measured at different sections of the airfoil. Additionally, different angles of attack were tested to compare the flowfield generated by the original airfoil and the modified airfoil at those angles. Therefore, three parameters were modified during the tests:
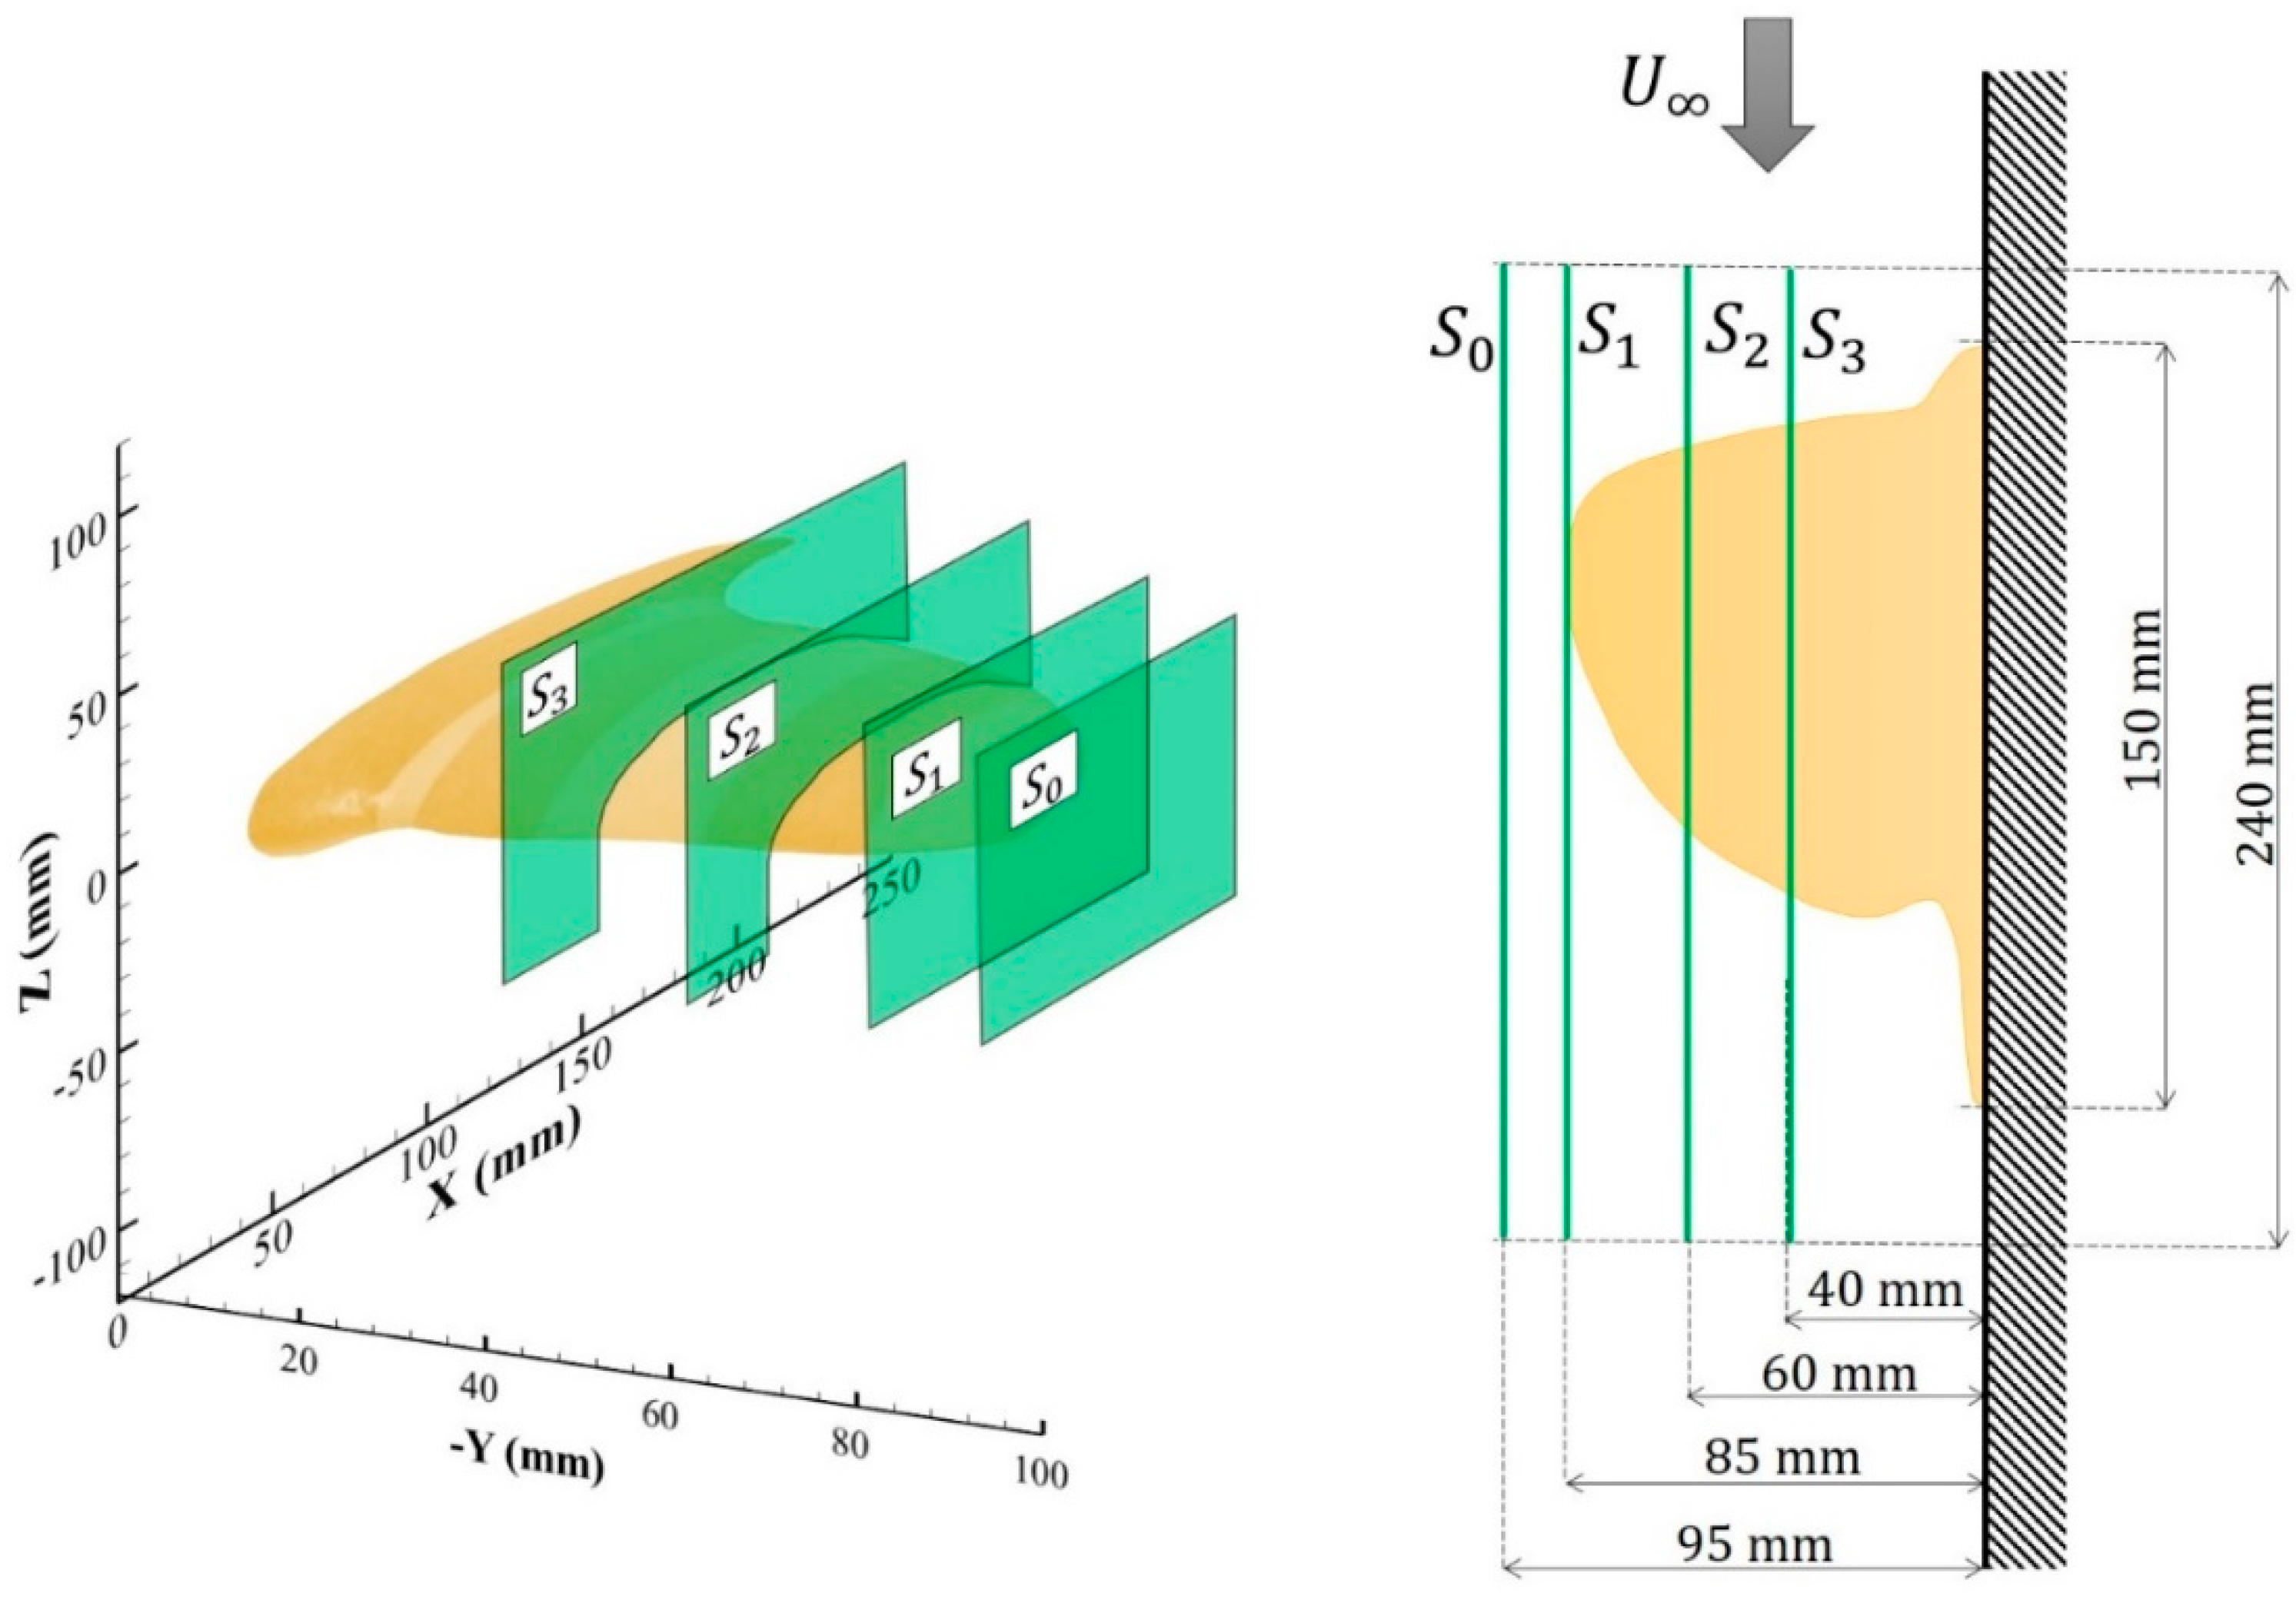
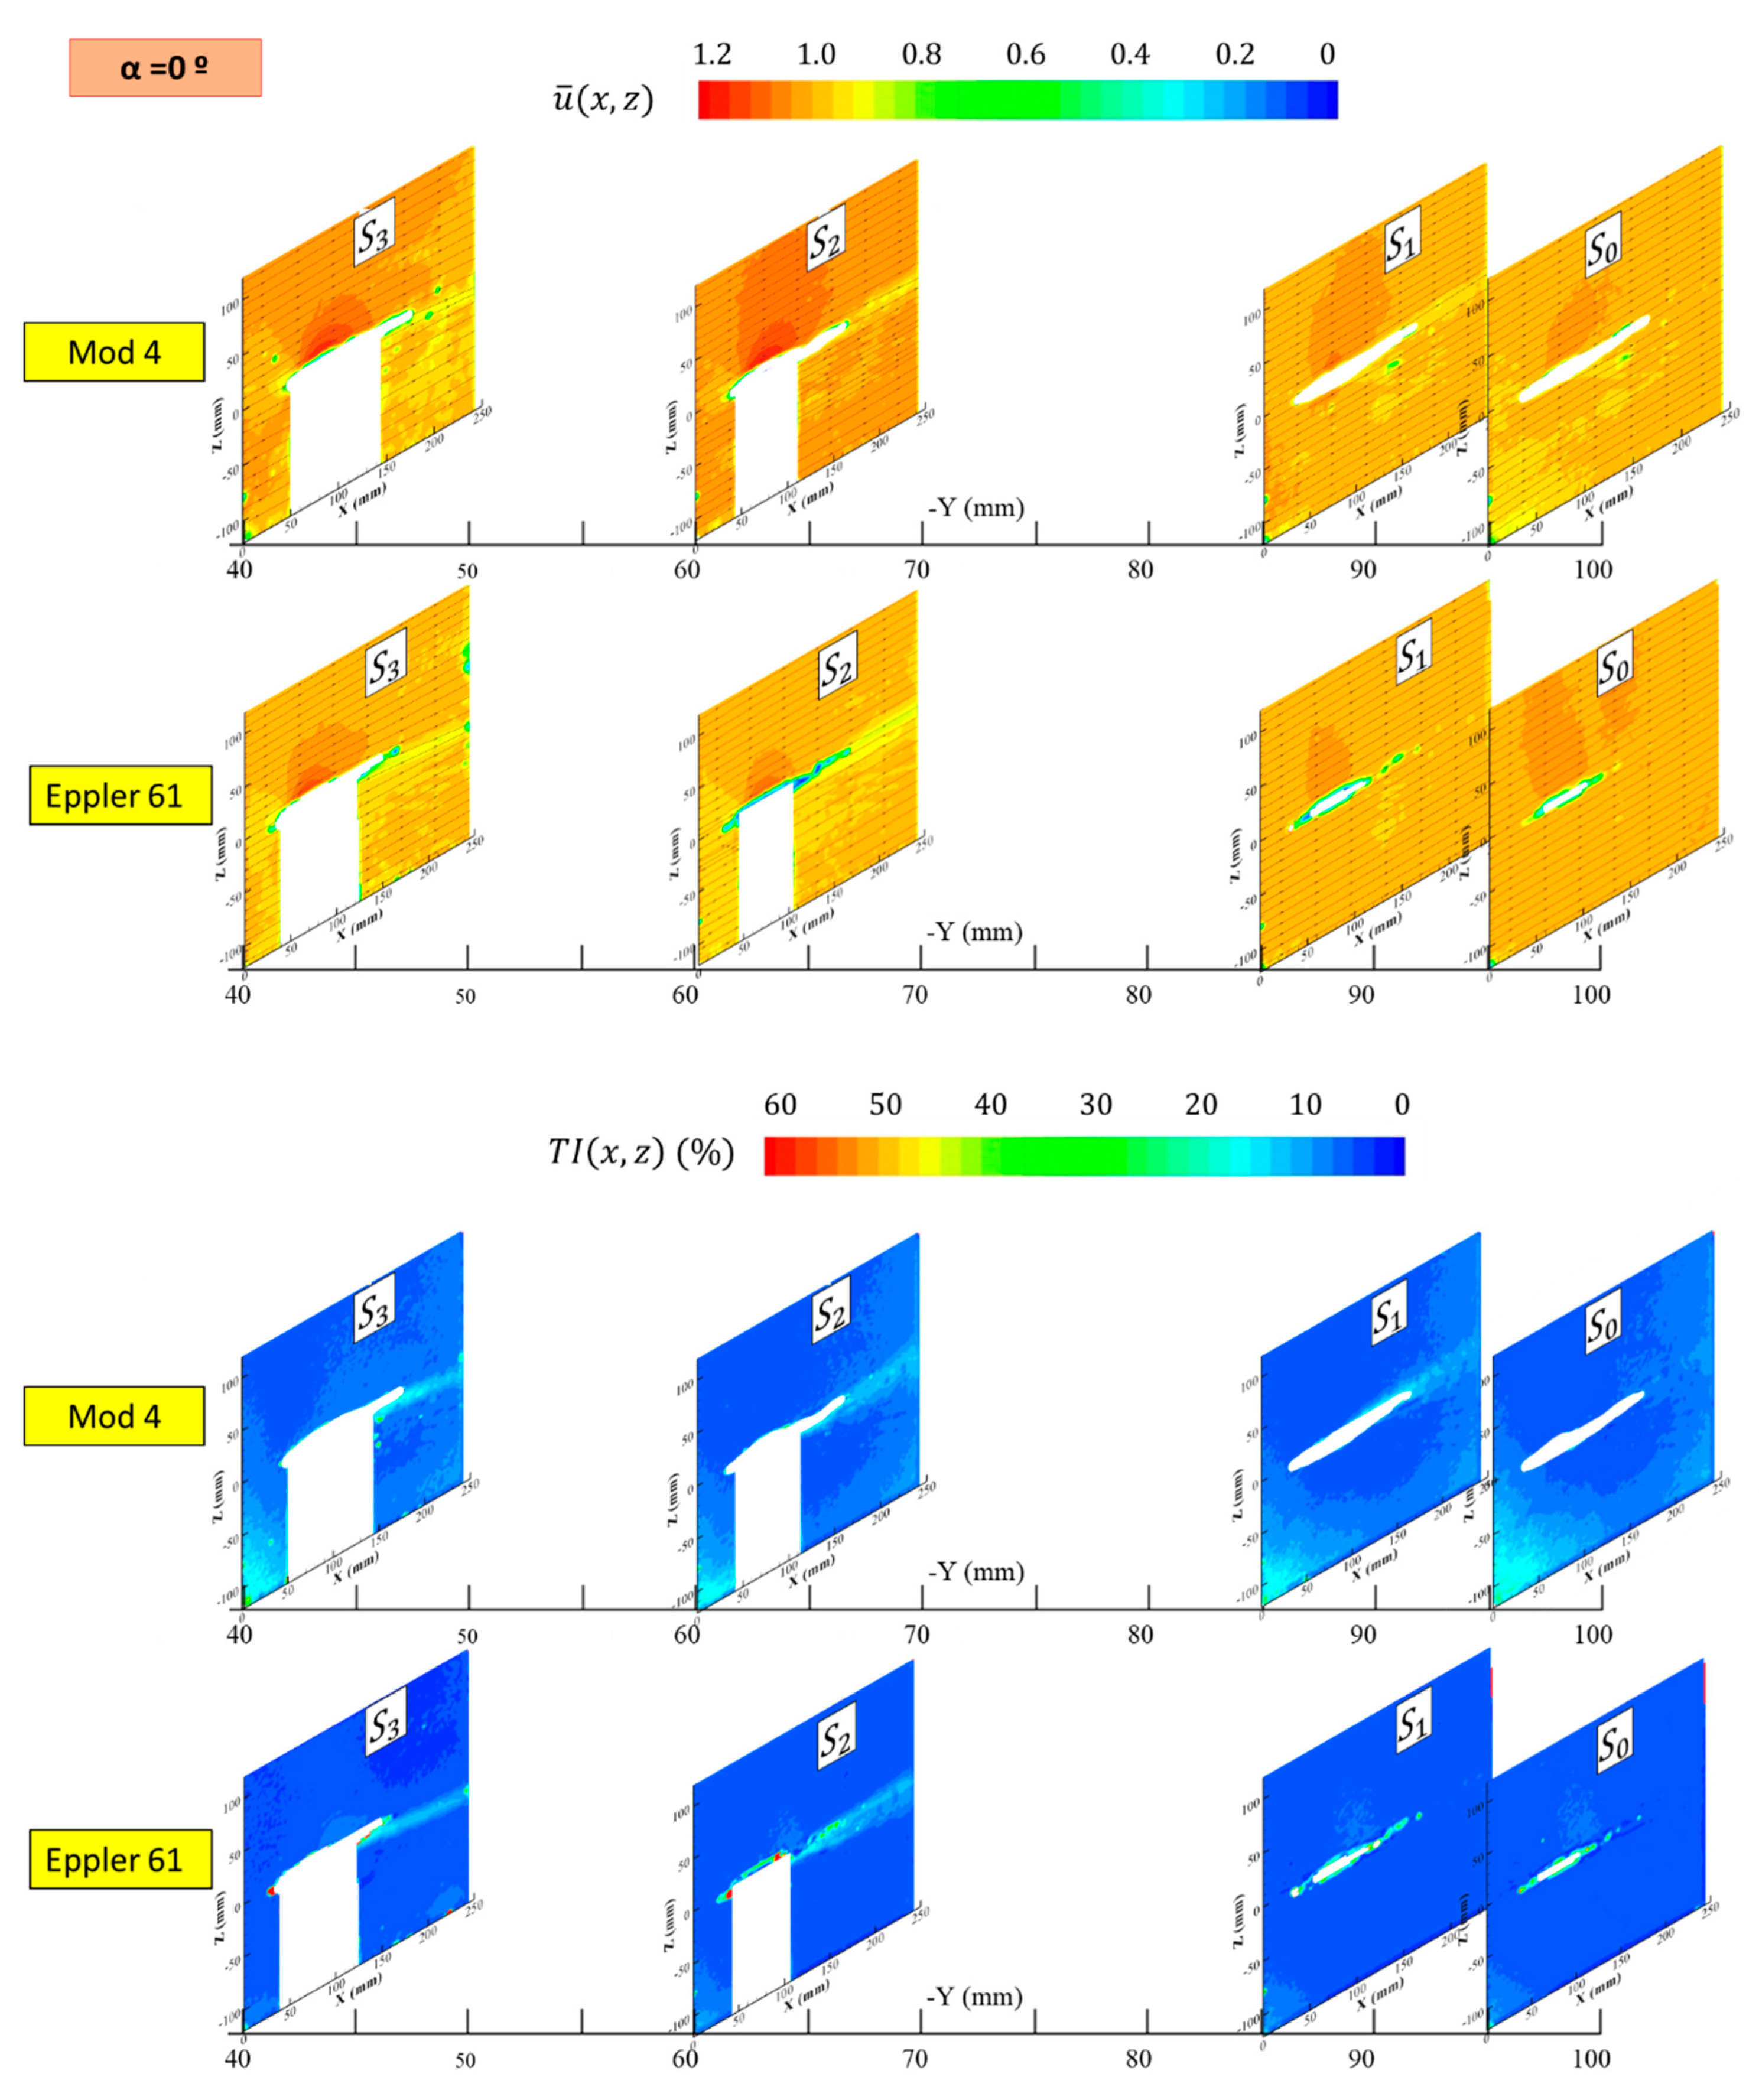
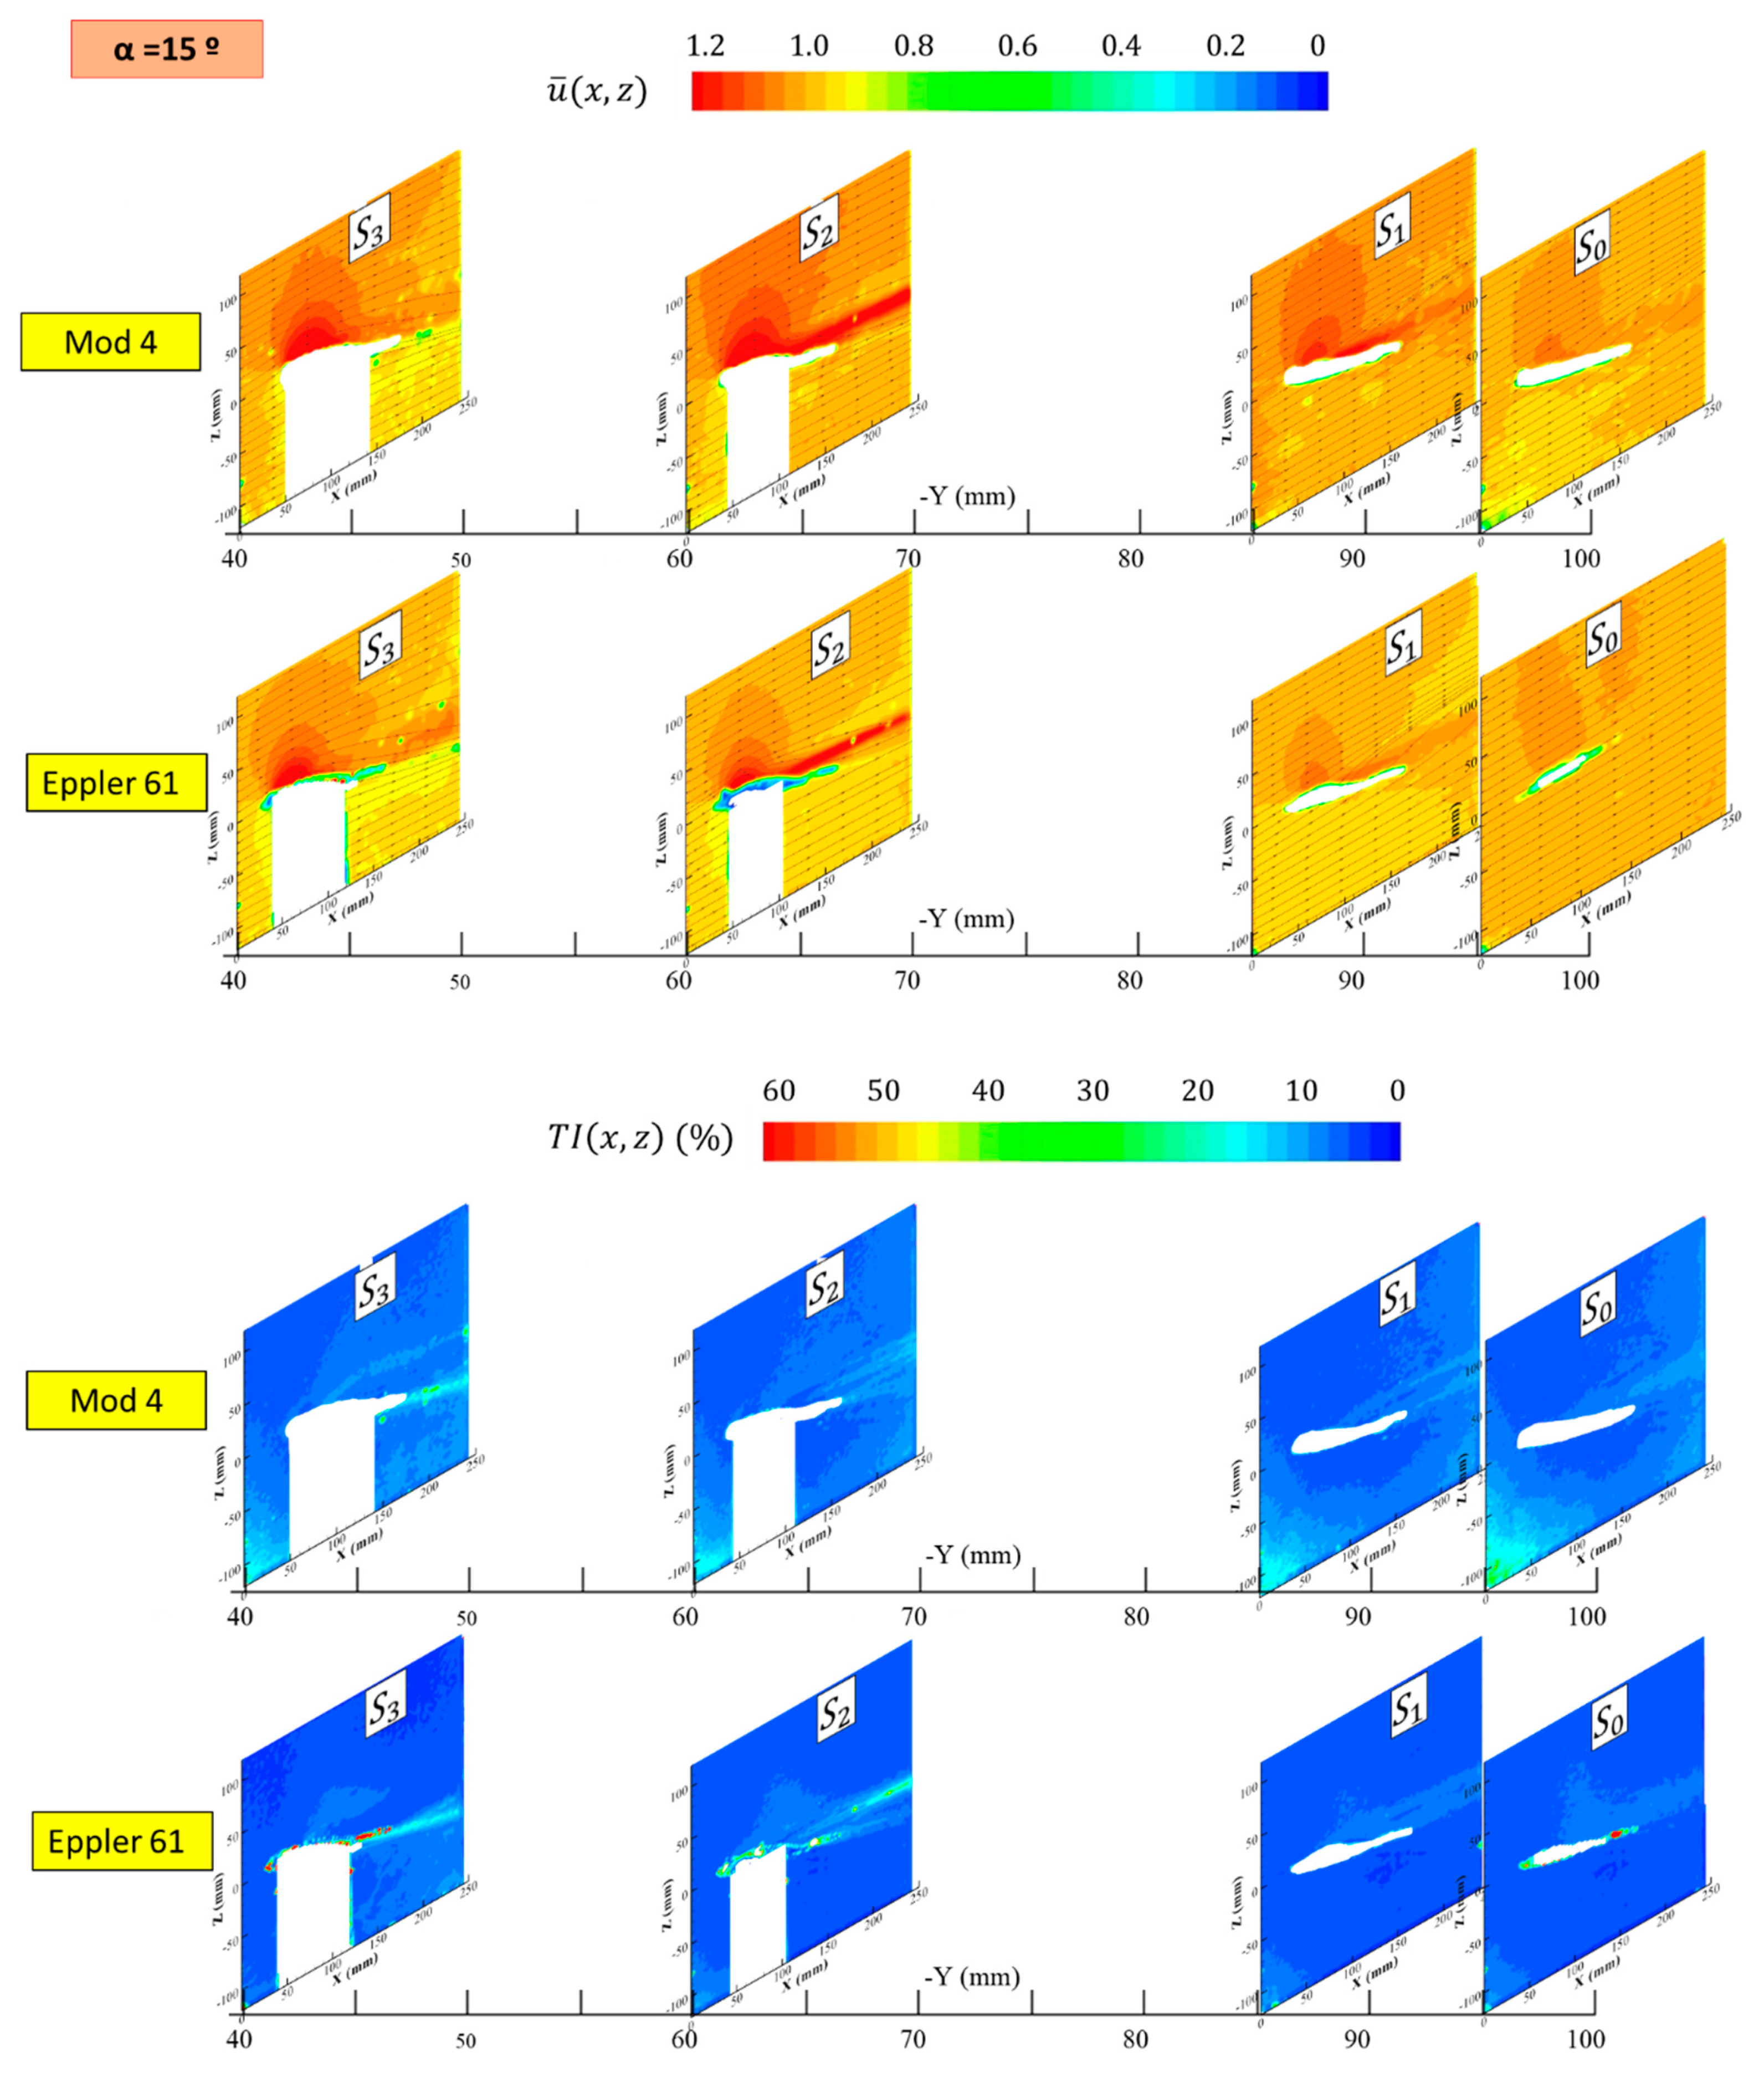
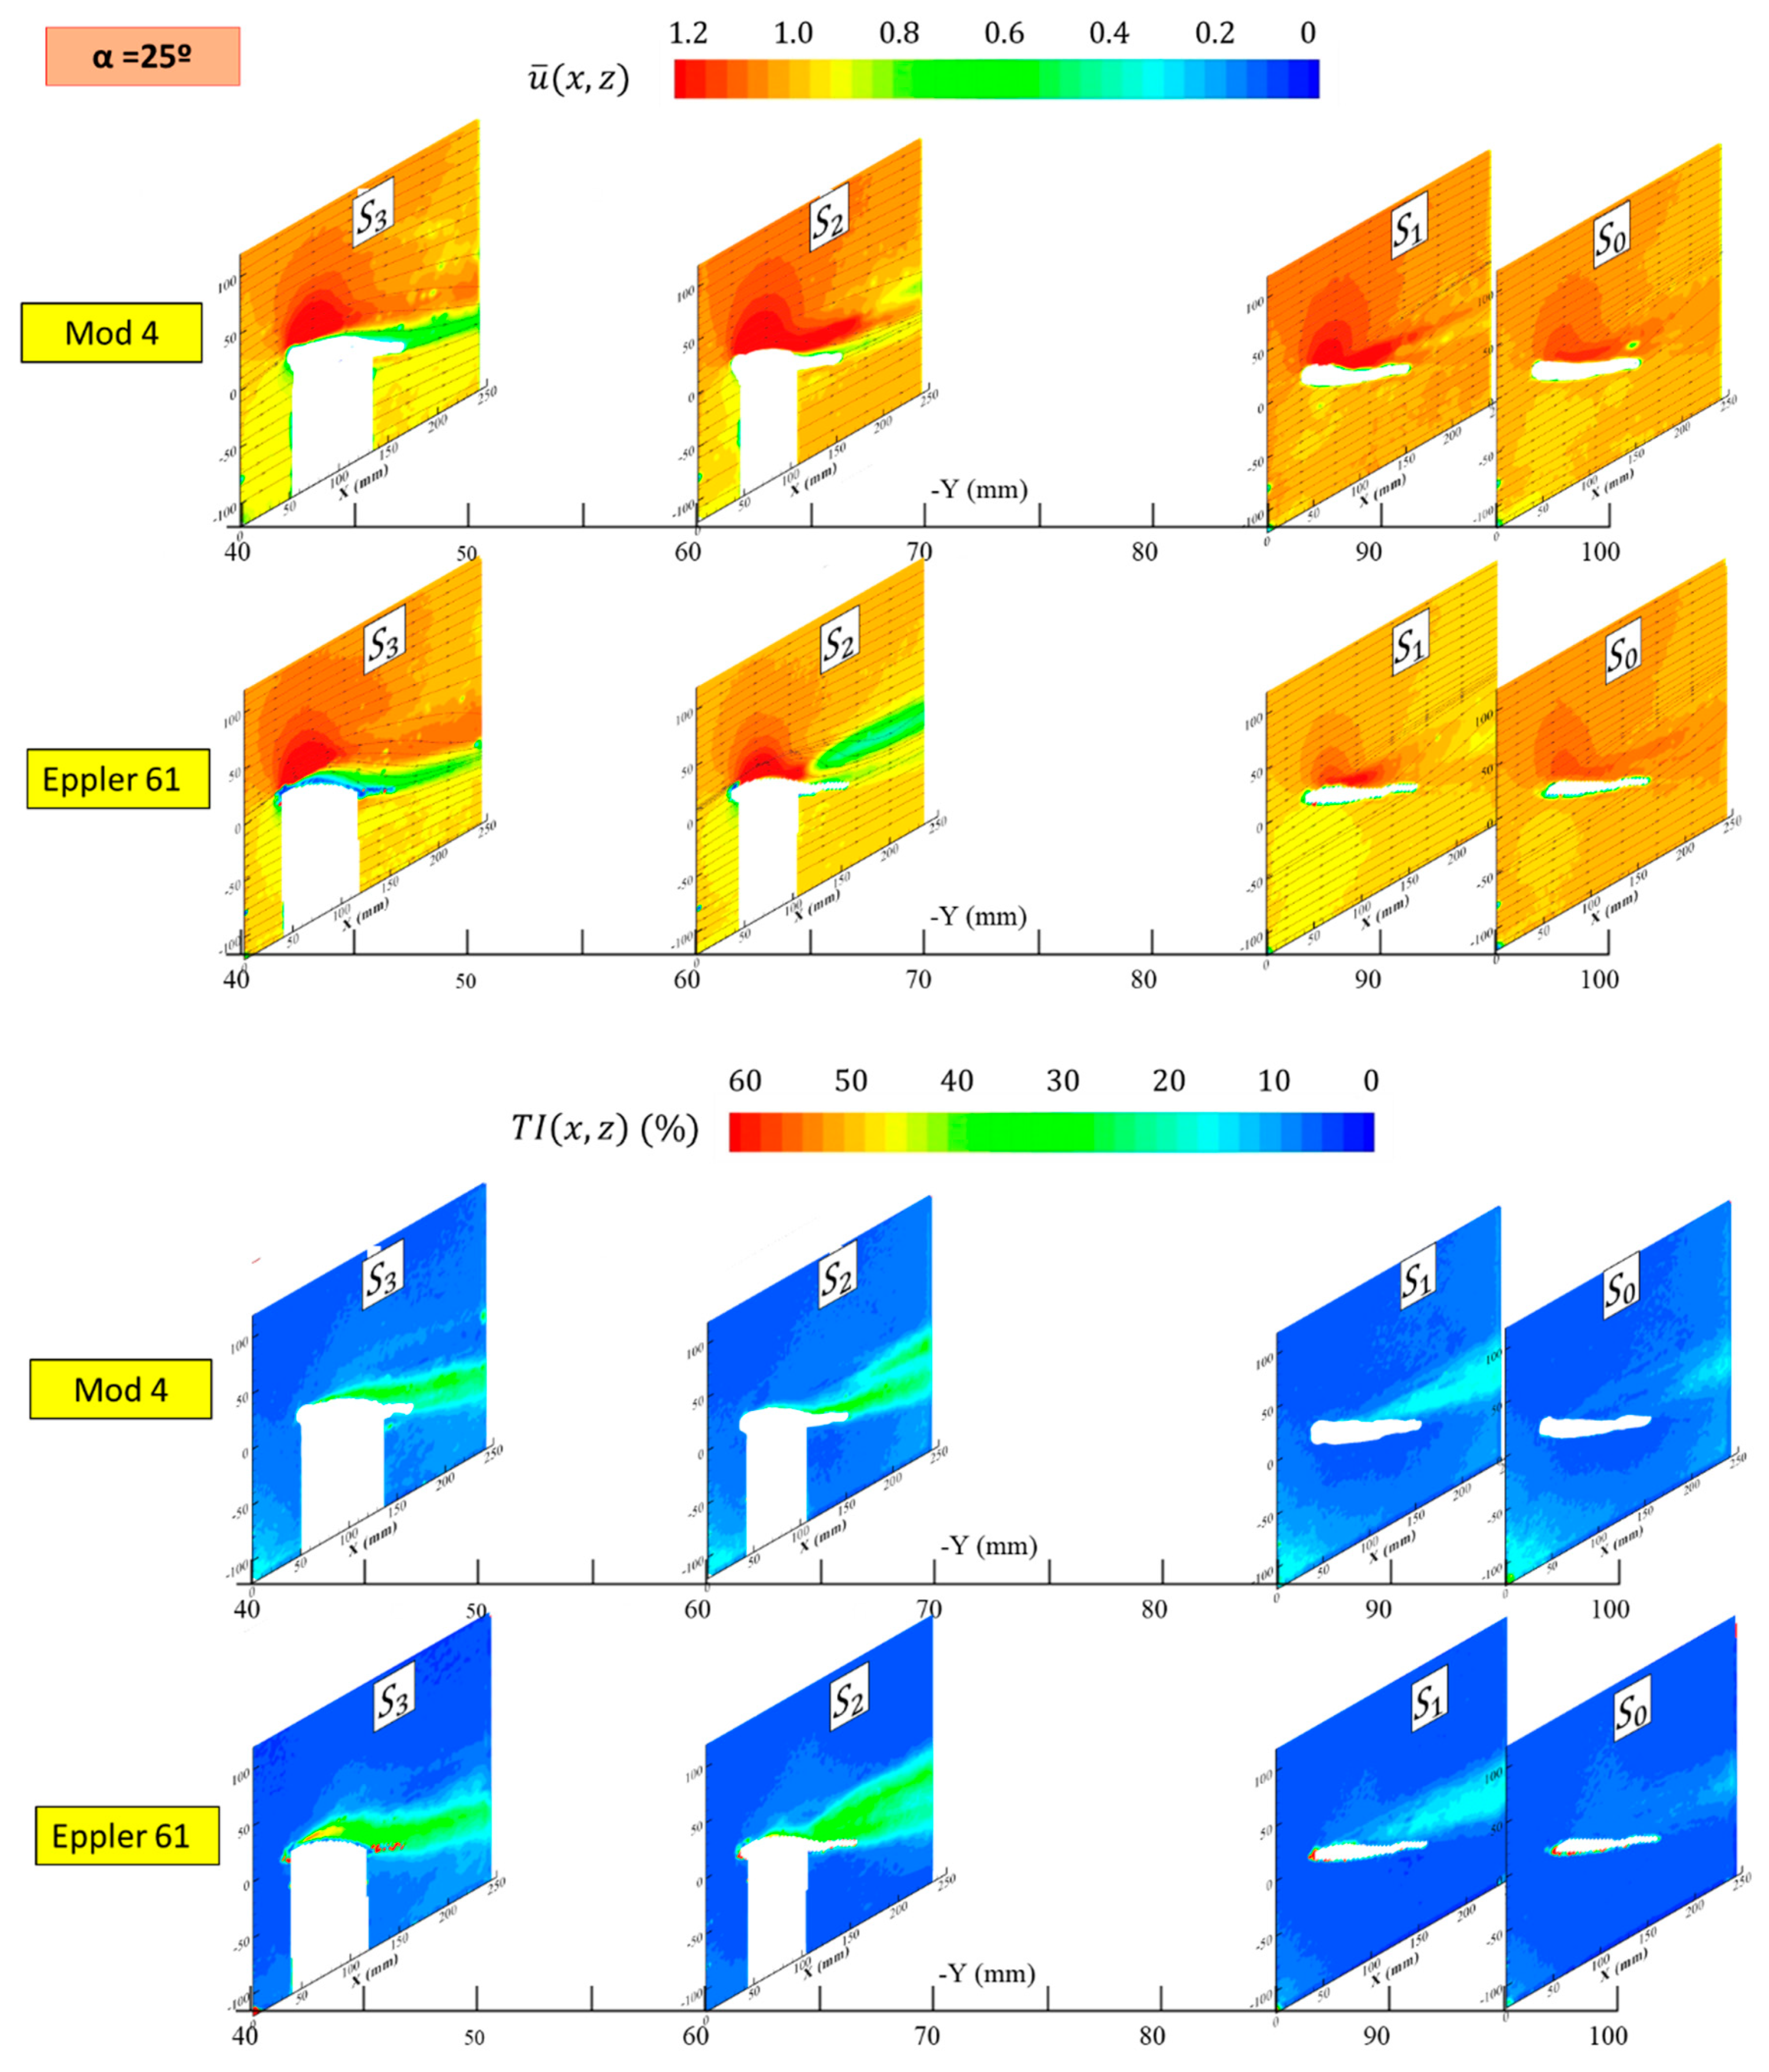
  • Test section distance to the wall: 40 (S3), 60 (S2), 85 (S1), and 95 mm (S0). Each test section corresponds to planes parallel to the wall placed in the symmetric plane of the morphing model (See Figure 6)
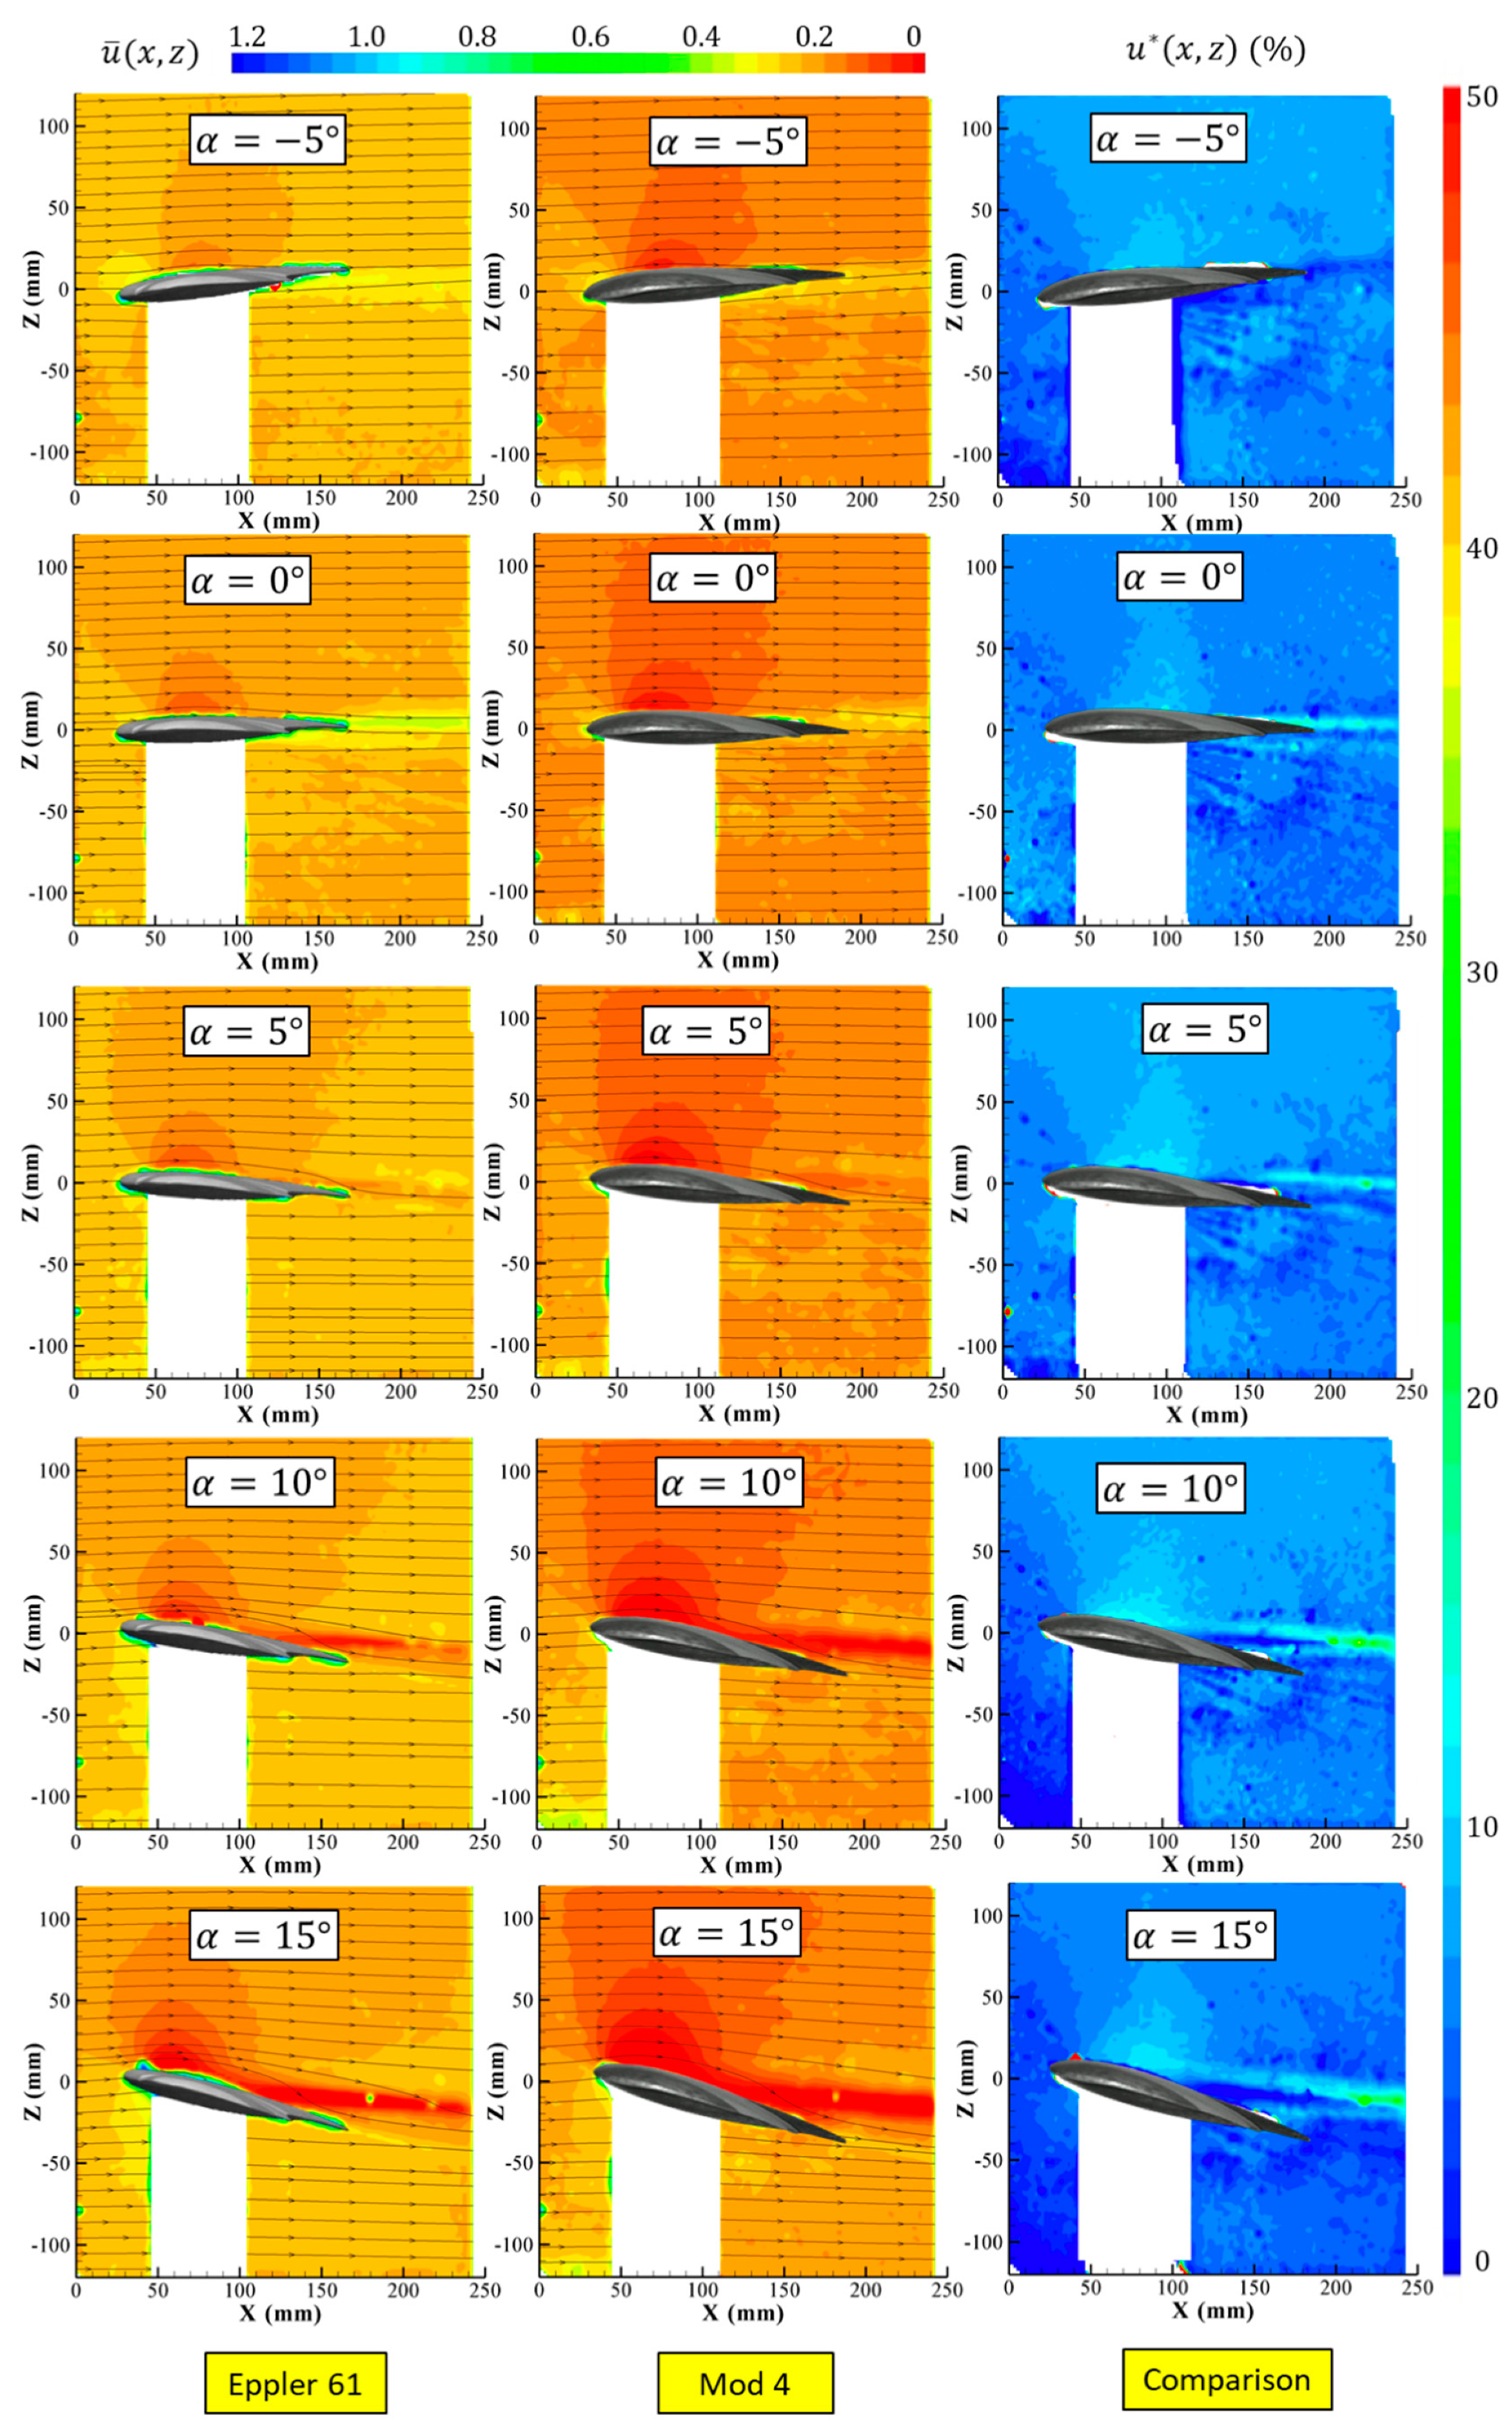
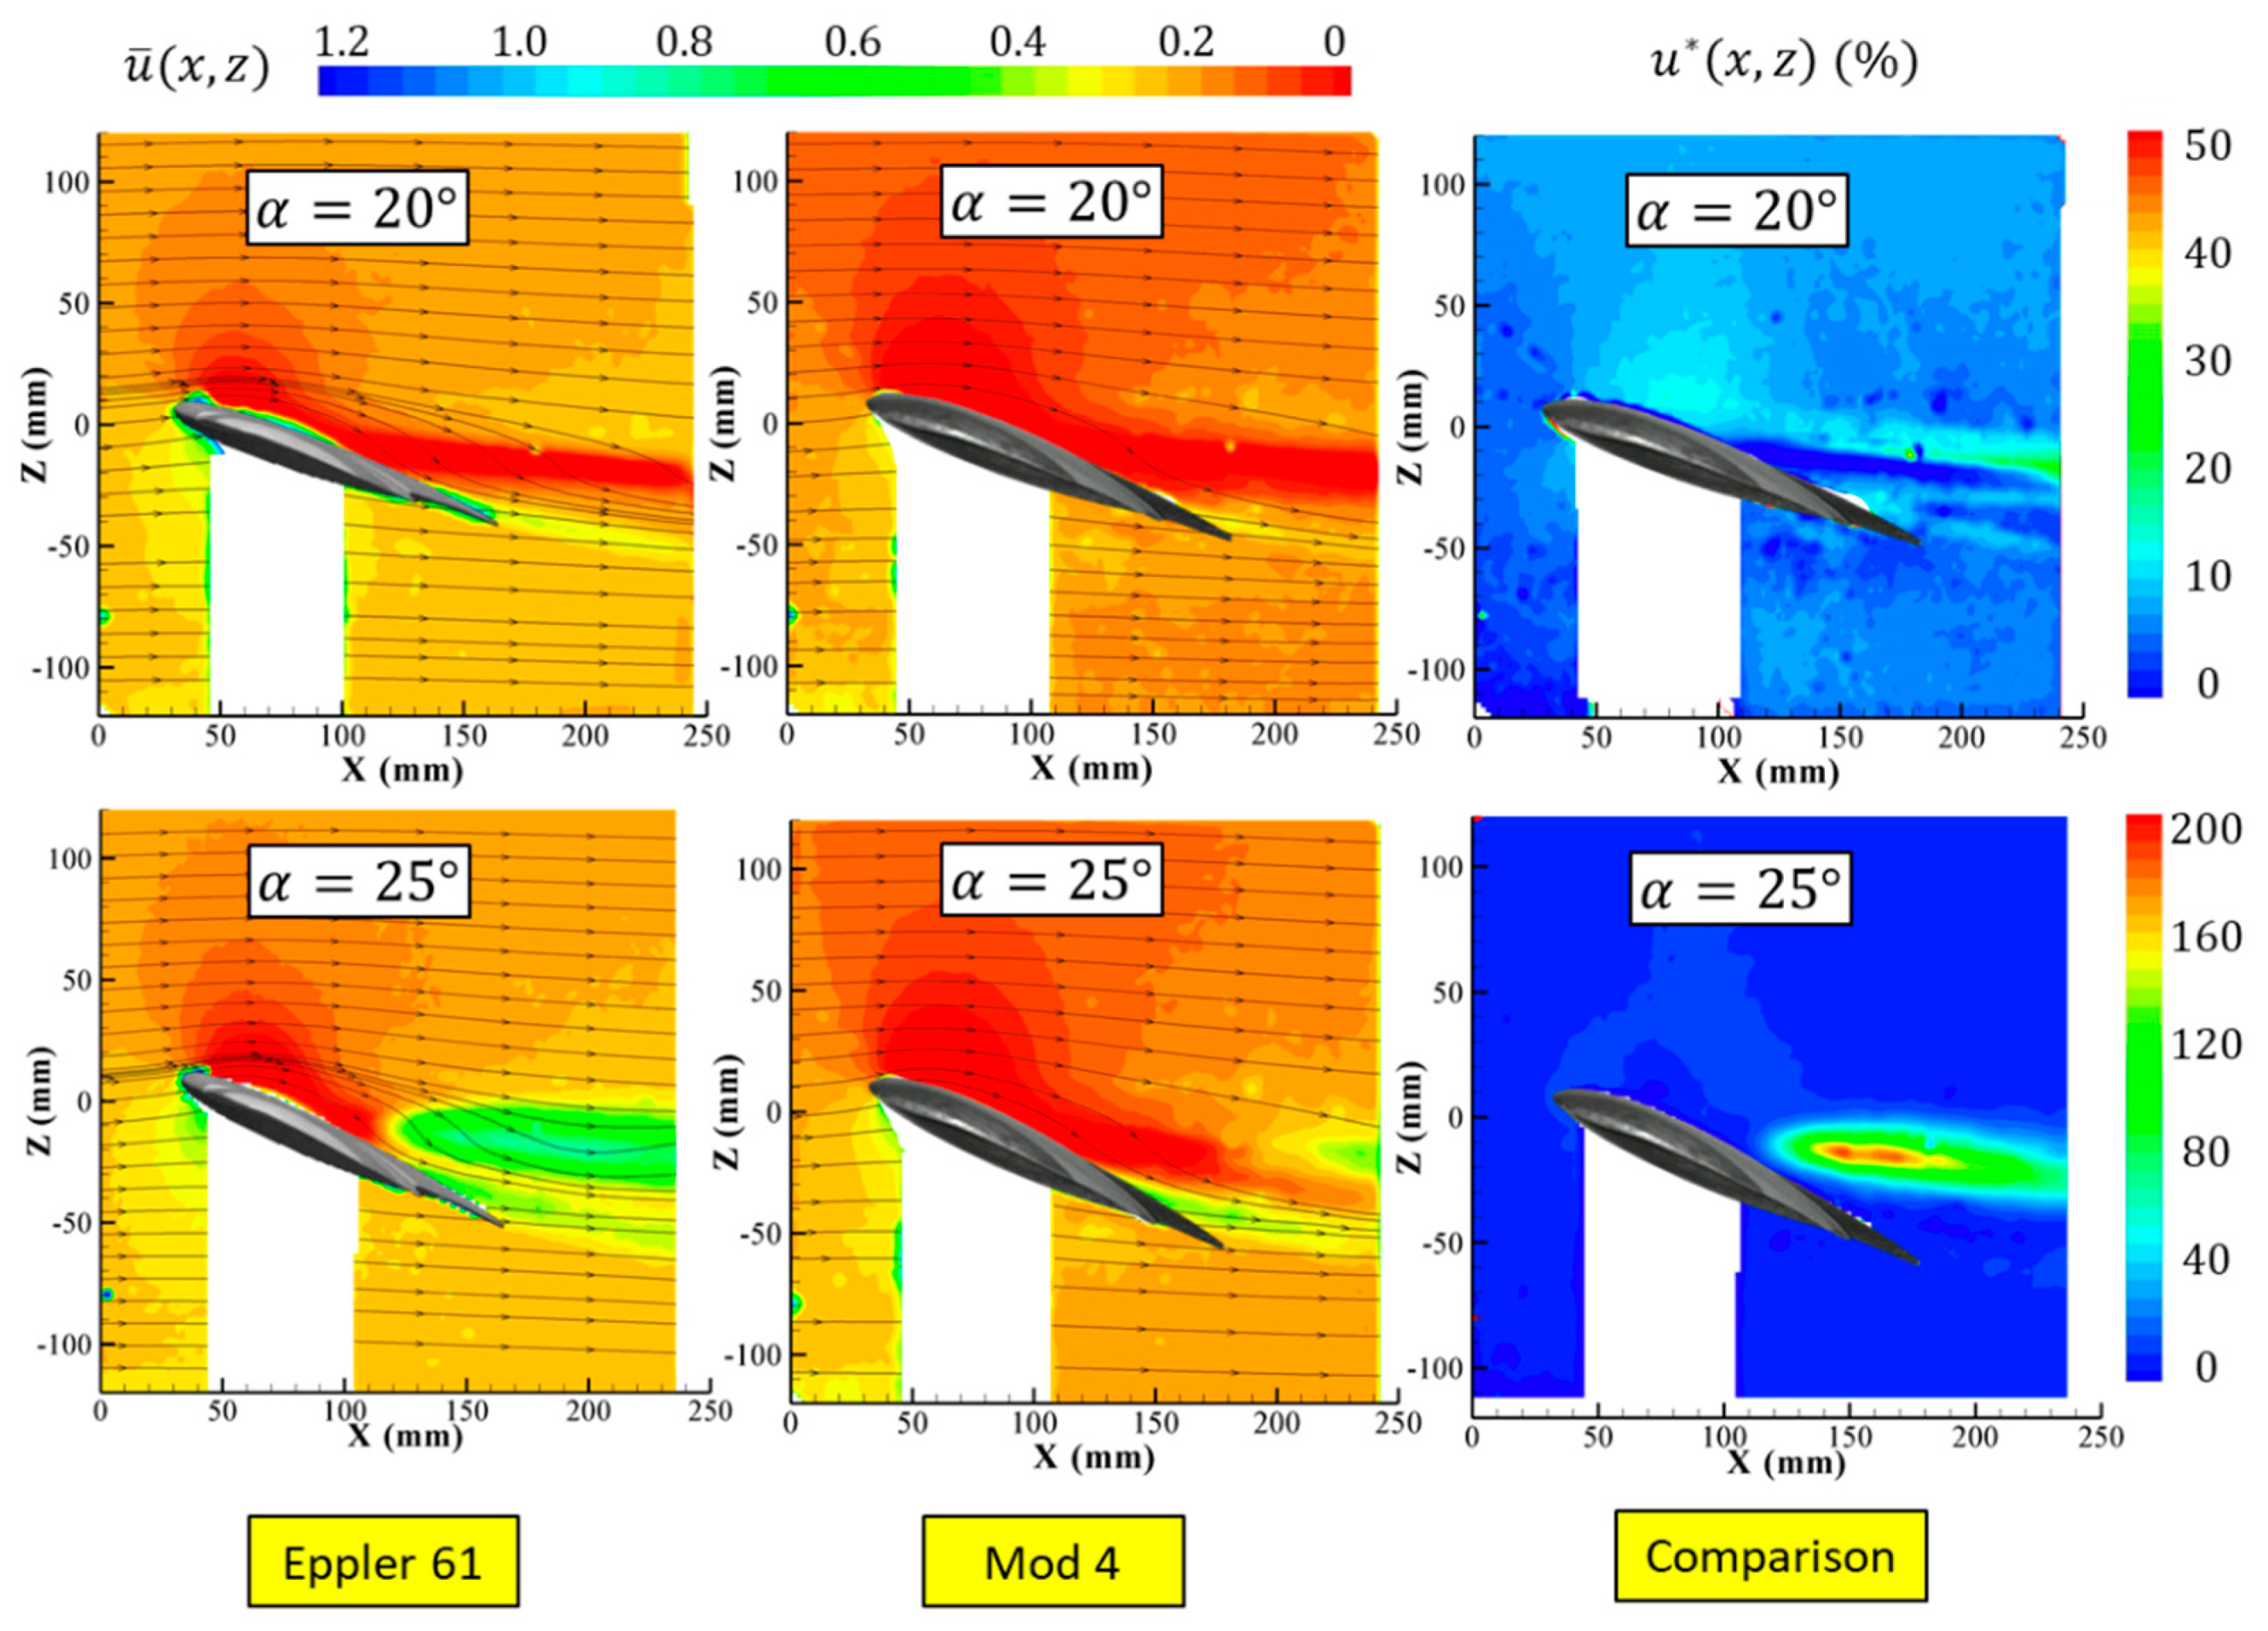
  • The angle of attack of the model: 0°, 5°, 10°, 15°, 20°, and 25°
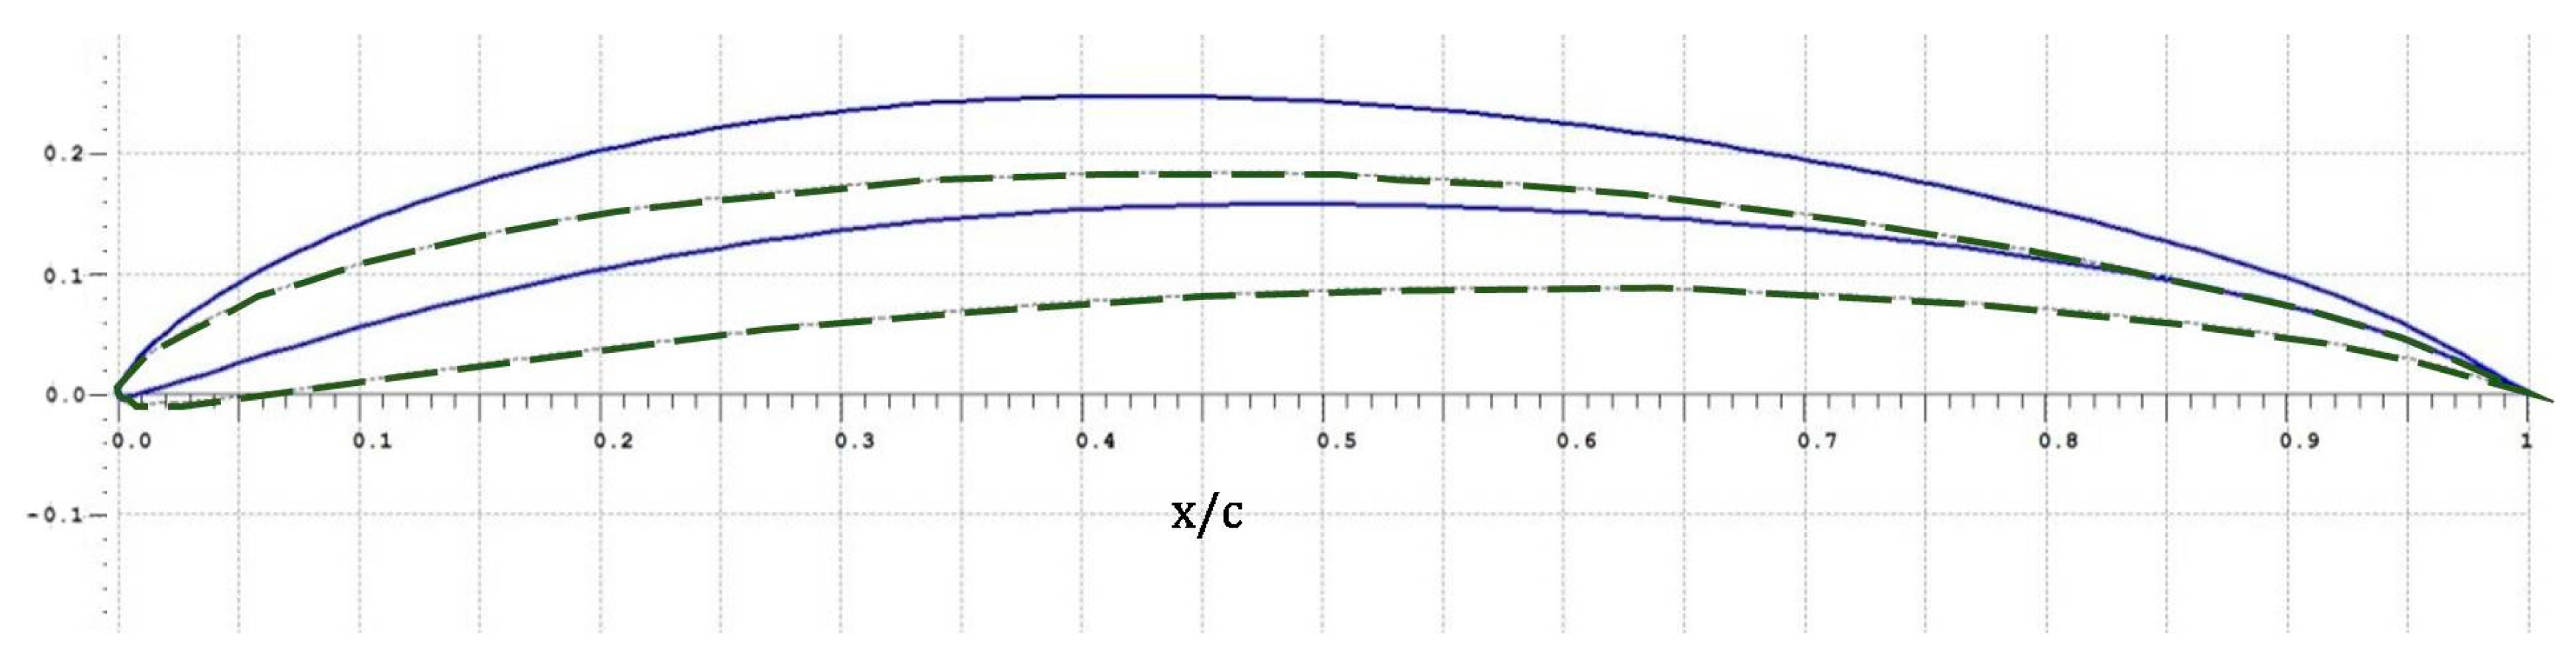
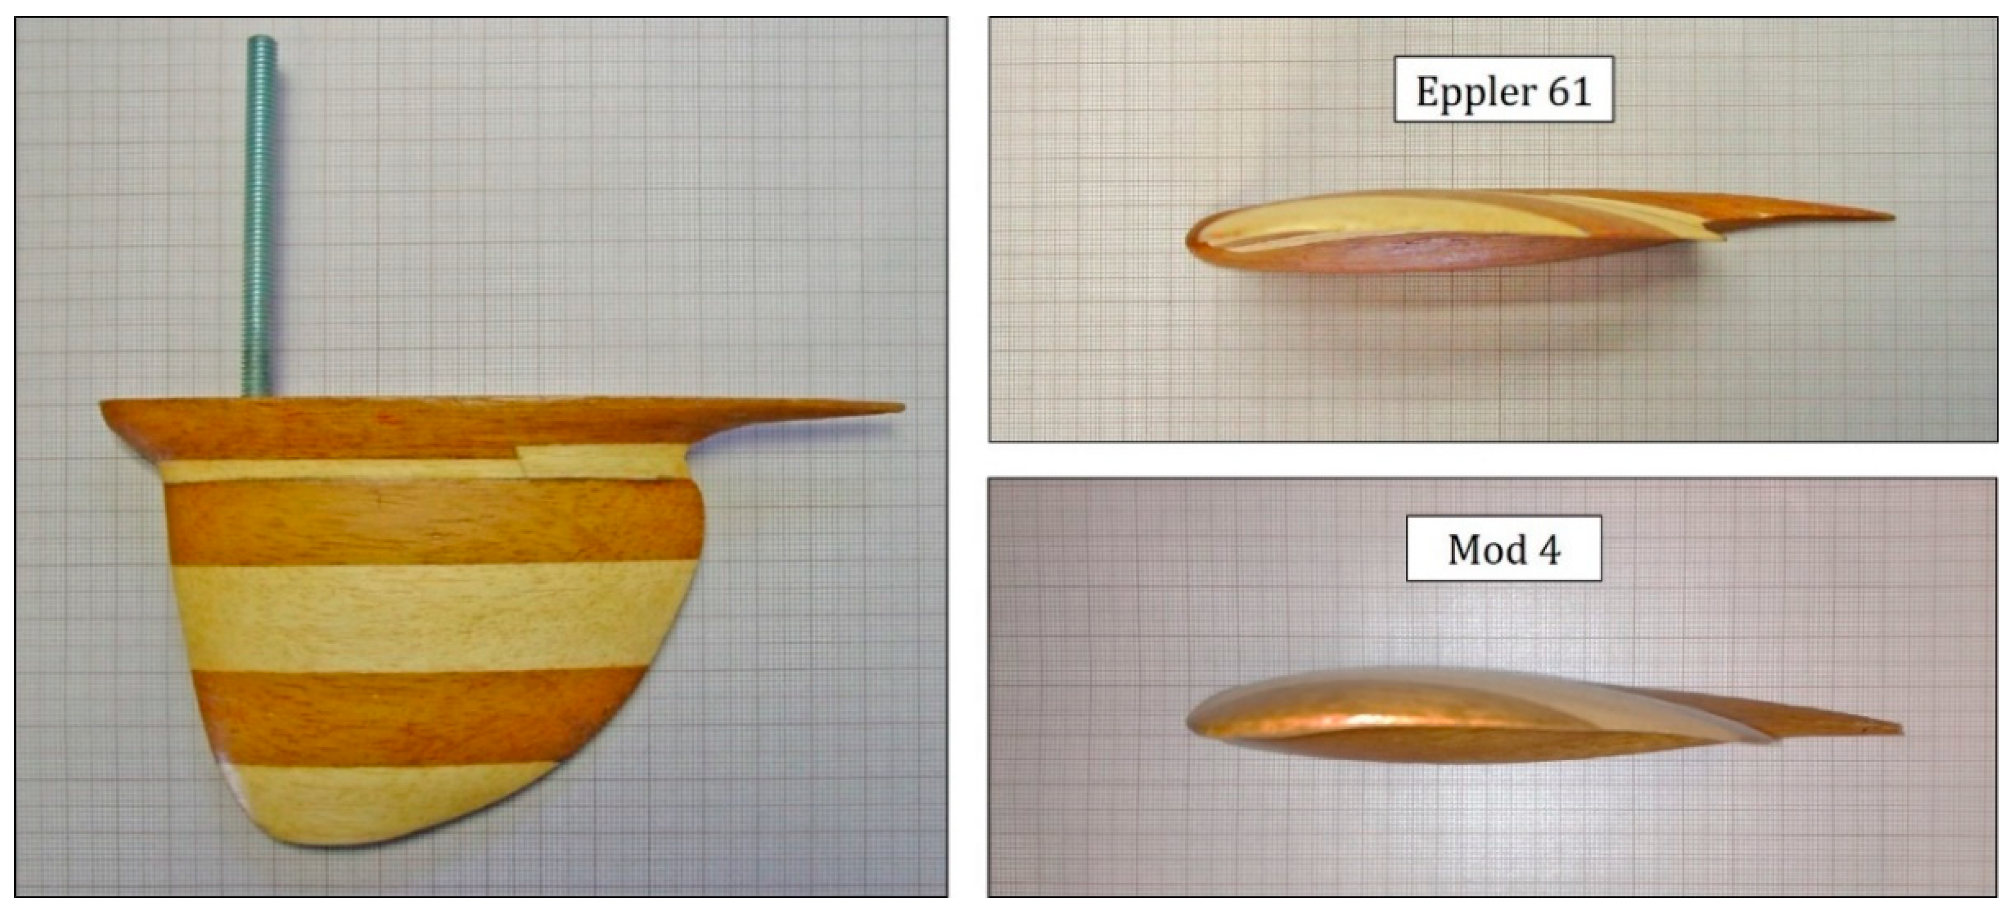
  • Airfoil model: original model (Eppler 61) and modified version (Mod 4)
First, comparisons between the original model versus the modified version are presented in Figure 8, Figure 9 and Figure 10 for angles of attack of 0°, 15°, and 25°, respectively. In each figure, the vertical non-dimensional velocity maps and the turbulence intensity maps are shown for each section in a perspective way in order to provide insight into the flow structures encountered. The non-dimensional velocity is calculated as the measured velocity divided by the wind tunnel velocity ( u ¯ ( x ,   z ) = u ( x ,   z ) / U ). However, in order to augment the comparison in a clearer way, dimensionless velocity maps and the local velocity difference map for Section S2 are plotted in Figure 11 and Figure 12 at low and high angle of attack respectively. The velocity difference shown in those maps is defined as follows:
u * ( x , z ) ( % ) = u M o d   4 ( x , z ) u E p p l e r   61 ( x , z ) u E p p l e r ( x , z ) × 100 ,
where u M o d   4 ( x , z ) ann u E p p l e r   61 ( x , z ) stand for the velocity modulus measured for the modified and the original airfoils, respectively, at each ( x , z ) position.
From the velocity maps shown in Figure 8, which corresponds to 0° angle of attack, the structures of the flow could be inferred. It is observed that the flow accelerated in the upper surface, the larger accelerations being found in Section S2. It is also observed that the velocities found in the modified model are greater than the original model. This is more obvious in Figure 11, where velocity maps and the local difference velocity is shown in Section S2. Greater velocities in the subsonic regimes, as is the case, implies lower pressures in the upper surface, which lead to a greater lift. Therefore, the modified version increases the lift in the wing. Table 2 shows the lift and drag coefficient at each angle of attack for the original airfoil and the modified airfoil. Indeed, the lift coefficient is increased in the modified airfoil as expected from the velocity maps.
On the other hand, from the turbulence intensity maps in Figure 8, it is observed that there is a region downstream where the turbulence intensity increases, which corresponds to the wake. This region is larger in Section S2 for both original and modified airfoil, being larger in the original airfoil. Figure 13 shows the velocity profile downstream at 1.2 chords, where it can be observed that the velocity defect in the wake is larger for the original airfoil, as expected from the turbulence intensity maps.
Similar conclusions can be obtained from the velocity maps for angle of attack of 15° (see Figure 9). However, for an angle of attack of 25° (see Figure 10, Section S2), new flow structures appear. A recirculated region downstream of the wing due to the detachment of the stream appears for the original model in region S2. However, for the modified model in the same section the stream remains attached. This is the main difference in the structure found in the comparison between both models. Figure 12 shows the comparison between the velocity maps. It can be observed that differences up to 200% can be found in the detachment region. It has to be noted that in this region, the velocity value for the unmodified model is small, and that is the reason to obtain such high differences. The fact that the stream remain attached in the modified airfoil allows an increase of 50% of the lift coefficient, as observed in Table 2.

4. Conclusions

A wind tunnel tests campaign has been conducted to investigate the aerodynamic flow around a wing morphing to be used in a micro air vehicle. Non-intrusive whole field measurements were obtained by using PIV, in order to compare the velocity and turbulence intensity maps for the modified and the original version of an adaptive wing designed to be used in a micro air vehicle. Four sections and six angles of attack have been tested. Due to the low aspect ratio of the wing and the low Reynold number tested, the influence of the 3D effects has been proved to be important. The main differences have been encountered for the Section S2 at an angle of attack of 25°, where stall has occurred for the original model. Differences in local velocities up to 200% of the original velocity has been observed in the detached region. It can be concluded that the modified model can prevent the detachment of the stream.
It is also concluded from the rest of comparisons that the modified model increases the lift of the wing and reduces the turbulence intensity level on the upper surface of the airfoil and in the wake. Finally, we can conclude that morphing wing configuration provides an augmentation of the global aircraft performance, mainly at high angles of attack.

Author Contributions

Conceptualization, R.B. and Á.R.-S.; methodology, R.B. and Á.R.-S.; software, A.G.-M.; validation, R.B., Á.R.-S. and A.G.-M.; formal analysis, R.B., Á.R.-S. and A.G.-M.; investigation, R.B., Á.R.-S. and A.G.-M.; resources, A.G.-M.; data curation, R.B., Á.R.-S. and A.G.-M.; writing—original draft preparation, R.B., Á.R.-S. and A.G.-M.; writing—review and editing, R.B., Á.R.-S. and A.G.-M.; visualization, R.B. and Á.R.-S.; supervision, R.B. and Á.R.-S.; project administration, R.B. and Á.R.-S.; funding acquisition, R.B. and Á.R.-S. All authors have read and agreed to the published version of the manuscript.

Funding

This research was funded by Ministry of Defense under the project Termofluidodinámica, IGB 99001.

Conflicts of Interest

The authors declare no conflict of interest. The funders had no role in the design of the study; in the collection, analyses, or interpretation of data; in the writing of the manuscript, or in the decision to publish the results.

References

  1. Barbarino, S.; Bilgen, O.; Ajac, R.M.; Friswell, M.; Inman, D. A review of morphing aircraft. J. Intell. Mater. Syst. Struct. 2011, 22, 823–877. [Google Scholar] [CrossRef]
  2. Cao, W.; Cudney, H.H.; Waser, R. Smart materials and structures. Proc. Natl. Acad. Sci. USA 1999, 96, 8330–8331. [Google Scholar] [CrossRef] [PubMed] [Green Version]
  3. Bhavsar, R.; Vaidya, N.Y.; Ganguly, P.; Humphreys, A.; Robisson, A.; Tu, H.; Wicks, N.; Mckinley, G.H.; Pauchet, F. Intelligence in novel materials. Oilfield Rev. 2008, 20, 32–41. [Google Scholar]
  4. Colorado, J.; Barrientos, A.; Rossi, C.; Breuer, K.S. Biomechanics of smart wings in a bat robot: Morphing wings using SMA actuators. Bioinspir. Biomim. 2012, 7. [Google Scholar] [CrossRef] [PubMed] [Green Version]
  5. Prajapati, M.; Dasharathi, K.; Kumar, A.; Mahapatra, D.R. Shape memory composite cellular plan-forms for shape and area morphing. J. Micro Smart Syst. ISSS 2017, 6, 161–171. [Google Scholar]
  6. Kojima, T.; Ikeda, T.; Senba, A.; Tamayama, M.; Arizono, H. Wind Tunnel Test of Morphing Flap Driven by Shape Memory Alloy Wires. Trans. Jpn. Soc. Aeronaut. Space Sci. Aerosp. Technol. Jpn. 2017, 15, a75–a82. [Google Scholar] [CrossRef]
  7. Jodin, G.; Scheller, J.; Duhayon, E.; Rouchon, J.F.; Triantafyllou, M.; Braza, M. An Experimental Platform for Surface Embedded SMAs in Morphing Applications. Solid State Phenom. 2017, 260, 69–76. [Google Scholar] [CrossRef] [Green Version]
  8. Barbarino, S.; Pecora, R.; Lecce, L.; Ameduri, S.; Calvi, E. A novel SMA-based concept for airfoil structural morphing. J. Mater. Eng. Perform. 2009, 18, 696–705. [Google Scholar] [CrossRef]
  9. Bilgen, O.; Kochersberger, K.; Diggs, E.C.; Kurdila, A.J.; Inman, D.J. Morphing wing micro-air-vehicles via macro-fiber-composite actuators. In Proceedings of the 48th AIAA/ASME/ASCE/AHS/ASC Structures, Structural Dynamics, and Materials Conference, Honolulu, HI, USA, 23–26 April 2007. [Google Scholar]
  10. Ohanian, O., III; David, B.; Taylor, S.; Kochersberger, K.; Probst, T.; Gelhausen, P.; Climer, J. Piezoelectric morphing versus servo-actuated MAV control surfaces, part II: Flight testing. In Proceedings of the 51st AIAA Aerospace Sciences Meeting including the New Horizons Forum and Aerospace Exposition, Grapevine, TX, USA, 7–10 January 2013. [Google Scholar]
  11. Ohanian, O.J., III; Karnia, E.D.; Oliena, C.C.; Gustafsonb, E.A.; Kochersbergerb, K.B.; Gelhausenc, P.A.; Brownd, C.B.L. 2011 Piezoelectric composite morphing control surfaces for unmanned aerial vehicles. In Proceedings of the SPIE Smart Structures and Materials + Nondestructive Evaluation and Health Monitoring, San Diego, CA, USA, 6–10 March 2011. [Google Scholar]
  12. Kimaru, J.; Bouferrouk, A. Design, manufacture and test of a camber morphing wing using MFC actuated mart rib. In Proceedings of the 8th International Conference on Mechanical and Aerospace Engineering (ICMAE), Prague, Czech Republic, 22–25 July 2017; pp. 791–796. [Google Scholar]
  13. Kochersberger, K.B.; Ohanian, O.J., III; Probst, T.; Gelhausen, P.A. Design and flight test of the generic micro-aerial vehicle (GenMAV) utilizing piezoelectric conformal flight control actuation. J. Intell. Mater. Syst. Struct. 2017. [Google Scholar] [CrossRef]
  14. Keihl, M.M.; Bortolin, R.S.; Sanders, B.; Joshi, S.; Tidwell, Z. Mechanical properties of shape memory polymers for morphing aircraft applications. In Proceedings of the SPIE Smart Structures and Materials + Nondestructive Evaluation and Health Monitoring, San Diego, CA, USA, 5 May 2005; pp. 143–151. [Google Scholar]
  15. Liu, Y.; Du, H.; Liu, L.; Leng, J. Shape memory polymers and their composites in aerospace applications: A review. Smart Mater. Struct. 2014, 23. [Google Scholar] [CrossRef]
  16. Liu, Y.; Lv, H.; Lan, X.; Leng, J.; Du, S. Review of electro-active shape-memory polymer composite. Compos. Sci. Technol. 2009, 69, 2064–2068. [Google Scholar] [CrossRef]
  17. Sun, J.; Guan, Q.; Liu, Y.; Leng, J. Morphing aircraft based on smart materials and structures: A state-of-the-art review. J. Intell. Mater. Syst. Struct. 2016, 27, 2289–2312. [Google Scholar] [CrossRef]
  18. Barcala-Montejano, M.A.; Rodríguez-Sevillano, A.A.; Crespo-Moreno, J.; Bardera-Mora, R.; Silva-González, A.J. Optimized performance of a morphing micro air vehicle. In Proceedings of the International Conference on Unmanned Aircraft Systems (ICUAS), Denver, CO, USA, 9–12 June 2015; pp. 794–800. [Google Scholar]
Figure 1. Experimental Setup.
Fluids 05 00191 g001
Figure 2. Zimmerman wing type.
Fluids 05 00191 g002
Figure 3. Eppler 61(dashed black line) vs. Mod 4 (continuous blue line) airfoils.
Fluids 05 00191 g003
Figure 4. Morphing models. Top view is shown on the left while on the right it is shown side views of the original (Eppler 61) and modified (Mod 4) models.
Fluids 05 00191 g004
Figure 5. Wind tunnel configuration.
Fluids 05 00191 g005
Figure 6. Measurements regions location definition. On the left, a 3D view of the model and the measurements region is presented, while on the right there is a top view sketch.
Fluids 05 00191 g006
Figure 7. Photograph of the laser illumination on the model.
Fluids 05 00191 g007
Figure 8. Non-dimensional velocity maps and turbulence intensity maps for each section at an angle of attack of 0°.
Fluids 05 00191 g008
Figure 9. Non-dimensional velocity maps and turbulence intensity maps for each section at an angle of attack of 15°.
Fluids 05 00191 g009
Figure 10. Non-dimensional velocity maps and turbulence intensity maps for each section at an angle of attack of 25°.
Fluids 05 00191 g010
Figure 11. Comparison of the velocity maps in Section S2, for angles of attack −5°, 0°, 5°, 10°, and 15°.
Fluids 05 00191 g011
Figure 12. Comparison of the velocity maps in Section S2, for angles of attack 20° and 25°.
Fluids 05 00191 g012
Figure 13. Velocity profile in the wake in Section S2.
Fluids 05 00191 g013
Table 1. Geometry parameter of Eppler 61 profile and its modified version. In the table f stands for the curvature, t stands for the thickness and c stands for chord.
( f c ) m a x   ( % ) ( x c ) ( f c ) m a x   ( % ) ( t c ) m a x   ( % ) ( x c ) ( t c ) m a x   ( % )
Eppler 616.4515.6725.29
Mod 410.0455.6725.29
Table 2. Lift and drag coefficient for the original and modified airfoil at different angle of attack.
α (°)Eppler 61Mod 4
CLCDCLCD
00.190.1020.310.075
50.420.1020.670.114
100.620.1430.940.187
150.900.2041.190.285
201.110.4071.410.404
251.030.5501.540.527
Publisher’s Note: MDPI stays neutral with regard to jurisdictional claims in published maps and institutional affiliations.

