1. Introduction
Flow transport in and around coral reef systems plays a major role in coral reef survival due to many reef species (e.g., corals and fishes) having an initial larval dispersal phase. As such, understanding the material transport in reef environments is critical to understanding the reef population connectivity over a range of scales [
1], from the fine-scale (order 10s to 100s of meters) transport pathways that govern the retention and export from individual reefs to the larger-scale (regional) connectivity between different reef systems. Flow transport also plays other key roles in shaping environmental conditions within reef waters, such as determining the reef water quality [
2], controlling the exchange of heat between the coral reef and the open ocean [
3], predicting the impact of contaminant spills [
4], and helping understand the migration of pests and invasive species [
5,
6]. To quantify the transport across reef environments, we are increasingly reliant on ocean circulation models to drive particle-tracking studies that define probable transport patterns [
7]. While useful, these approaches are sensitive to the location and timing of particle seeding, and typically do not identify the underlying structures that control flow transport and hence exchange processes for coral reefs, where the flows are invariably spatially and temporally complex.
Given that ocean transport is based on time-integrated information locally following the flow field, the structures relevant to understanding transport are inherently Lagrangian in nature and may not be evident through the direct inspection of the velocity fields at any given time. Here, we show that data analysis methods based on the concept of Lagrangian coherent structures (LCS), developed to reveal key and often hidden flow transport structures [
8], can be useful for application to morphologically complex reef systems. The approach identifies the key repelling and attracting structures, as well as the boundaries of Lagrangian eddies that trap material, hence identifying zones within a reef system that will favor either high material dispersal or conversely accumulation or trapping. In pursuing this study, we note that, because coral reef systems have both fixed bathymetry (e.g., unlike sandy coasts) and experience persistent flow-forcing mechanisms (e.g., due to wave-breaking or tides), they have well-defined length and time-scales that are conducive to generating persistent LCS within reefs.
2. Methods
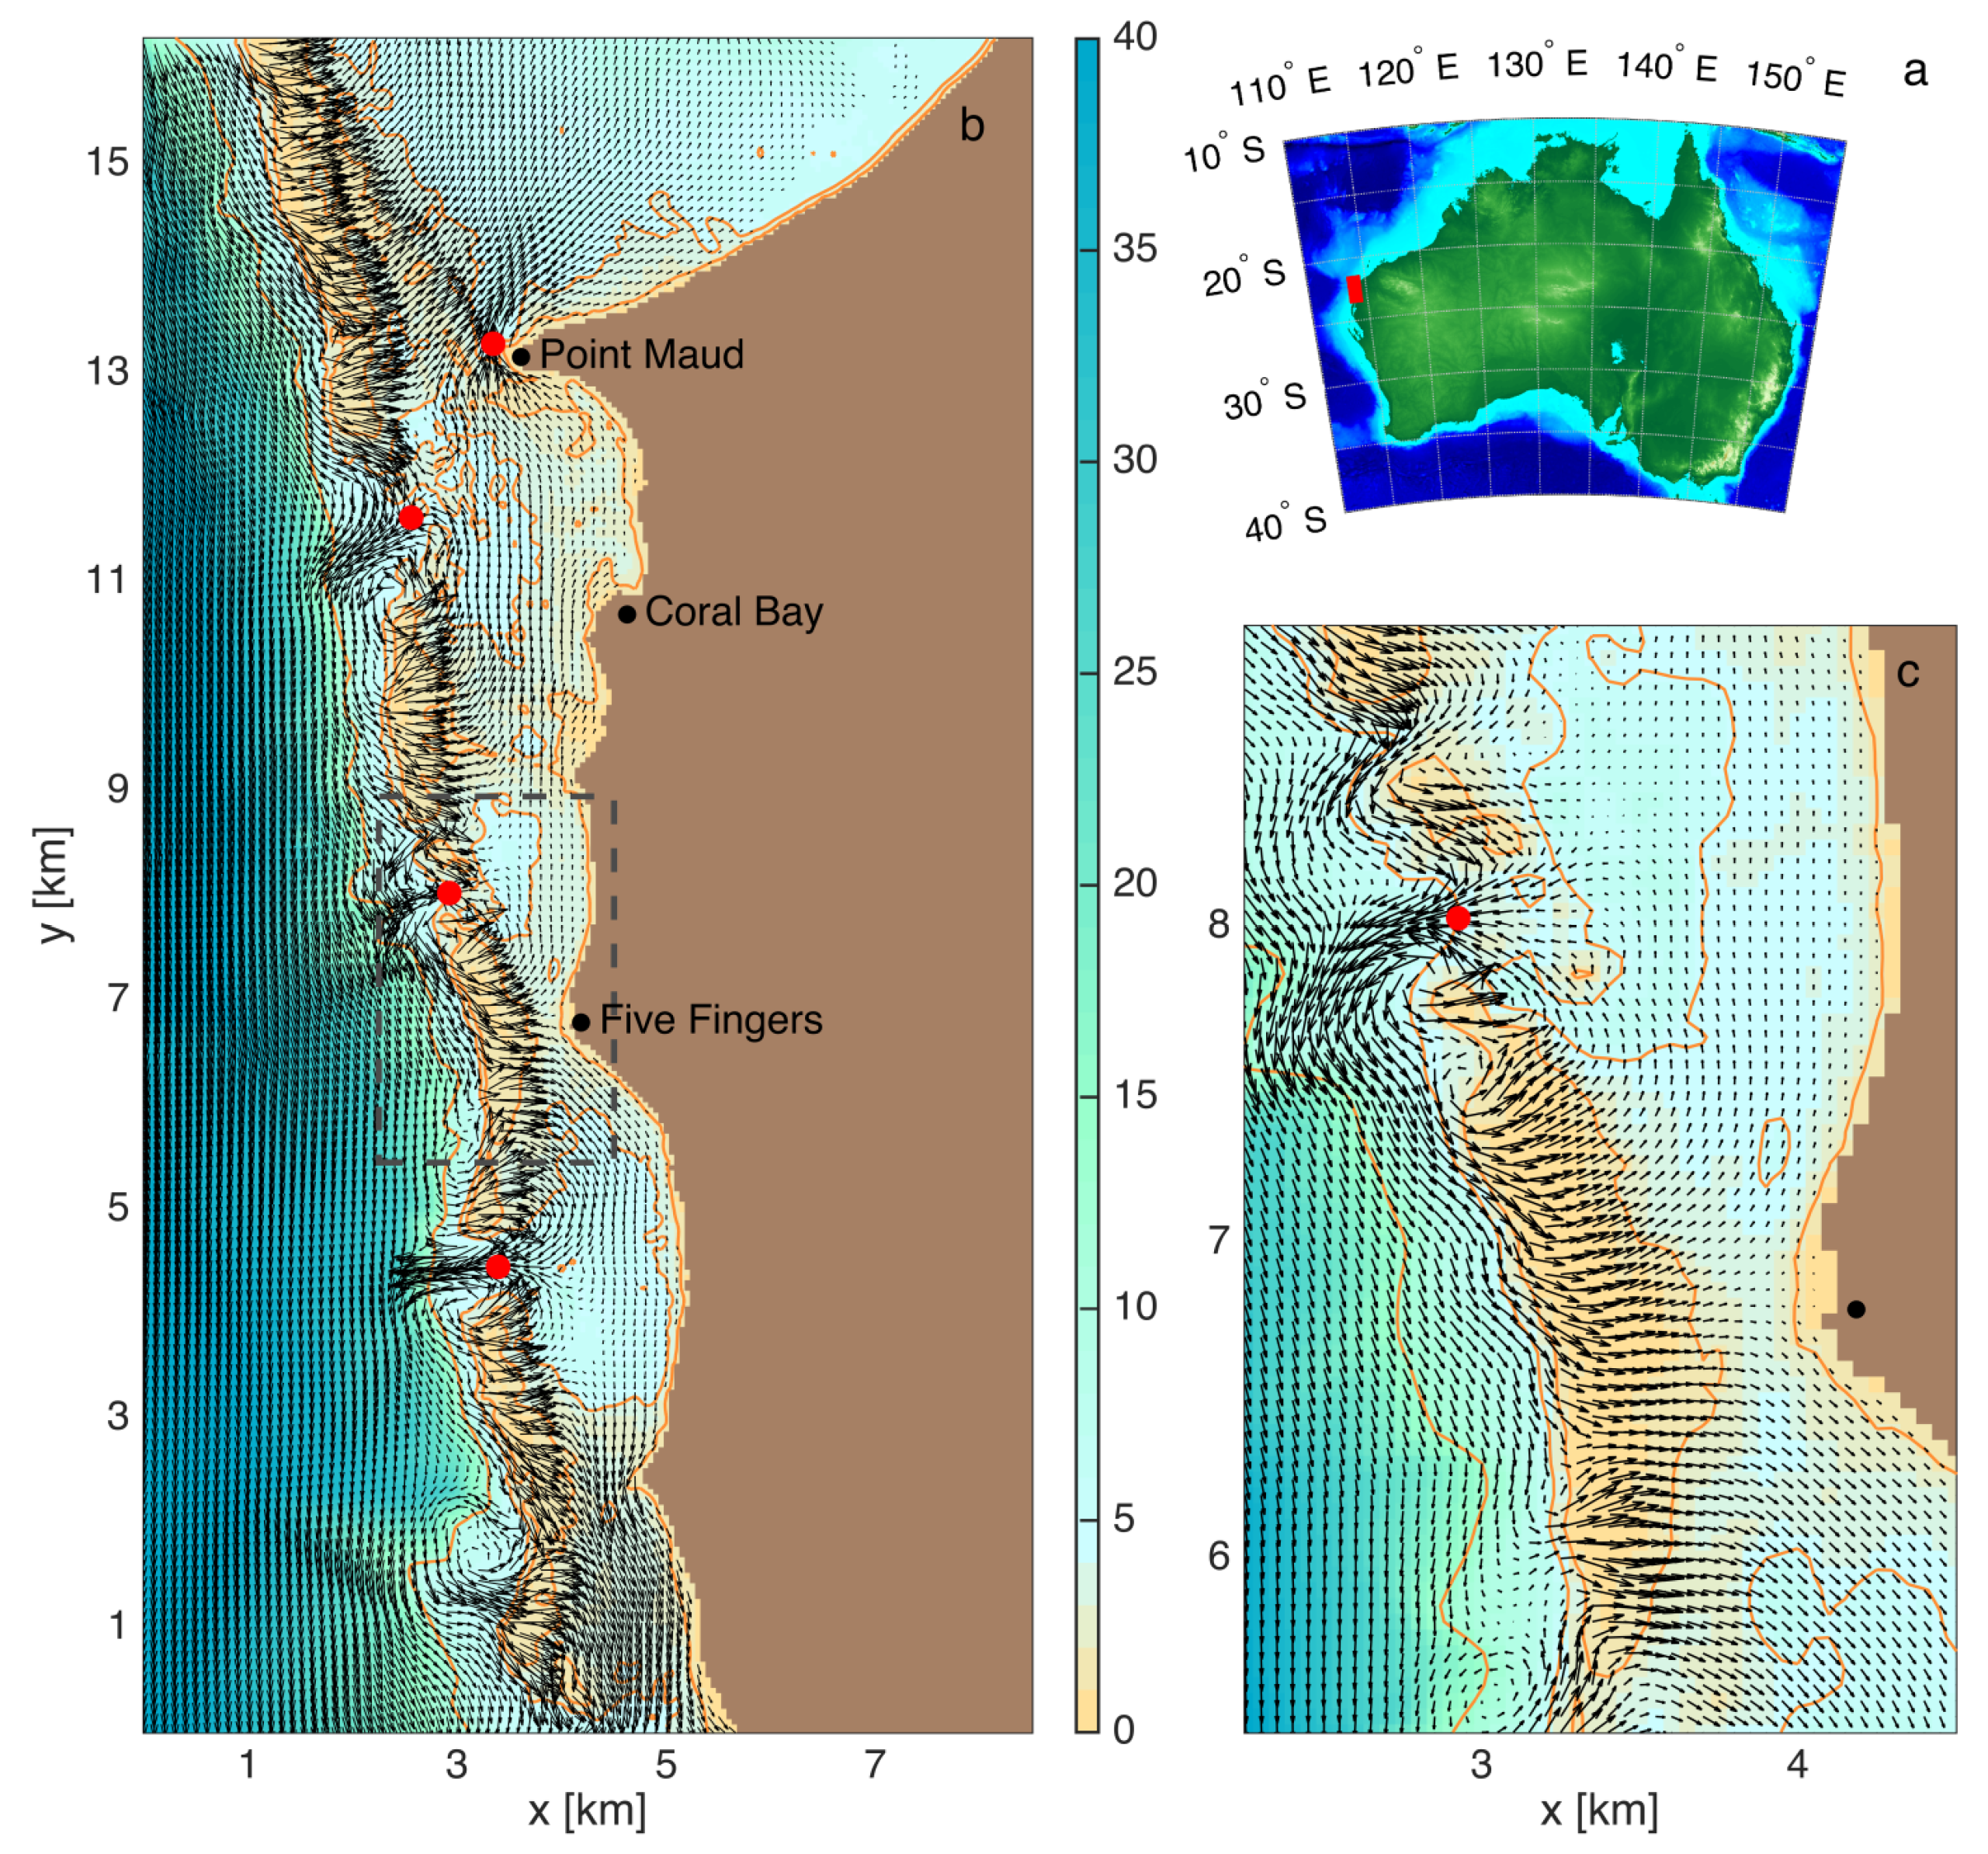
Validated Numerical Model: We investigate the flow patterns in the Coral Bay section of the ~300 km-long Ningaloo Reef, a United Nations World Heritage site and the largest fringing coral reef system in the world (
Figure 1). Like most wave-exposed reef systems [
2], the circulation is dominantly surface wave-driven [
9,
10]: wave breaking on the reef crest drives flow across the reef flat toward the shore and into the lagoon, and returns to the ocean via deeper channels in the reef [
11]. Although we focus specifically on this site as a case study, the LCS-based framework and tools adopted here are broadly applicable to any coral reef system and over differing spatial and temporal scales.
Our study uses data from a model that has previously been extensively validated with an array of moored instrumentation over a wide range of conditions [
10,
12,
13]. These simulations two-way couple the ocean circulation model ROMS (Regional Ocean Modeling System) with the spectral wave model SWAN (Spectral WAves Nearshore) and include atmospheric, tidal, and wave-forcing aspects. The model incorporates high-resolution bathymetry, as well as spatial variability in the bottom roughness (influencing bottom stresses) derived from benthic habitat maps (see [
10]). The horizontal grid resolution is 50 by 50 m and the hourly model outputs are analyzed. The tidal circulation in Coral Bay is relatively weak and is thus neglected here [
10]. Due to the shallow nature of the reef-lagoon system (<5m) relative to the horizontal scales of the reef (of order 100B s meters), the vertical velocities tend to be more than 1–2 orders of magnitude smaller than the horizontal velocities. In addition, as the density gradients (both horizontal and vertical) are typically weak, only the barotropic dynamics are considered. Therefore, our analysis below focuses on the flow features of the horizontal depth-averaged velocity fields.
As for most wave-dominated reef systems where the circulation is bathymetrically controlled, the dominant wave-driven flow patterns within Coral Bay were relatively insensitive to the offshore wave conditions (i.e., changing wave heights increased the strength of the flows but did not significantly change the flow directions). In addition, the dominant shelf circulation offshore of the reef tends to be southward, associated with the Leeuwin Current [
14]. In this study, by default we thus focus on a typical incident significant wave height (
Hs = 2 m) and southward alongshore current (0.1 m s
−1) at a 10 m depth on the reef slope. We also conducted additional sensitivity simulations (similar to those reported in [
10]) to assess the influence of the varying incident wave conditions and alongshore current on the inner shelf. Two simulations were performed with a default southward offshore current and with significant wave heights of
Hs = 1 and 3 m. Two additional simulations were performed using the default
Hs = 2 m, but with the offshore current being either turned off or northward.
Lagrangian Analysis Methods: The first step in determining the LCS for a time window
is the computation of the flow transport map
, which for any initial particle location
at time
ascertains its final location at time
after having been advected by the flow [
8]. From this, the transport map gradient
is calculated, which associates to any elementary particle located at
at time
its final deformation matrix at time
(in a linear approximation). The right Cauchy–Green strain tensor is then defined by
, where the prime indicates a transposed matrix. Being a symmetric tensor, it can then be decomposed into its eigenvalues
and corresponding eigenvectors
. The eigenvectors give the directions (normal to each other) in which the maximum contraction and the maximum stretching occur;
and
are the amplitude of this contraction and stretching, respectively. For an incompressible flow,
.
An accessible way of seeking candidates for LCS is to look at the so-called Finite Time Lyapunov Exponent (FTLE) field. In forward time, it is defined as and can be thought of as a rescaling of the stretching that elementary particles undergo. Ridges of high values of the forward FTLE field indicate locations at the initial time where neighboring trajectories tend to be repelled from each other. Repeating this exact same process but advecting the trajectories backwards in time from to by the reversed trajectory model yields the backward FTLE field ; these ridges indicate the locations at the final time towards which particles tend to be attracted.
More formally, there are three types of LCS: hyperbolic, elliptic, and parabolic [
8]. Hyperbolic LCS are material lines for which, at each point, the direction of maximum deformation (
) is normal to the ridge, so that these LCS follow the
vector field. They are either repelling, when derived from the forward time Cauchy–Green tensor, or attracting, when computed in backwards time. Elliptic LCS are the boundaries of the Lagrangian eddies [
15]. They are obtained by seeking closed loops following the vector field
, which have the property that the averaged tangential stretching of the loop shows no leading-order change across the neighboring material curves, with the parameter
representing the amount of stretching. Finally, parabolic LCS are the core of shearless jets [
16], but these are not present in our study.
In all cases, the Lagrangian structures were computed over a 12 h time window. This time window was chosen because it was over this time scale that the structures first became clearly apparent and achieved a well-defined state, indicating the relevant time scale for transport organization around Coral Bay. The velocity fields were based on the Lagrangian transport, including the cumulative effects of both the Eulerian velocity field plus the wave-induced mass flux (Stokes drift). Numerically, Cauchy–Green tensor fields were computed on a 2.5 m-resolution grid, resulting in 400 points per model grid cell and 29 million points in total. The flow map gradient was computed by advecting particles from
t0 to
t1 using the cluster method [
17]—i.e., 4 particles were initiated in the vicinity of each point and advected to assess the local deformation. A total of 116 million particles were thus used within the model domain.
3. Results
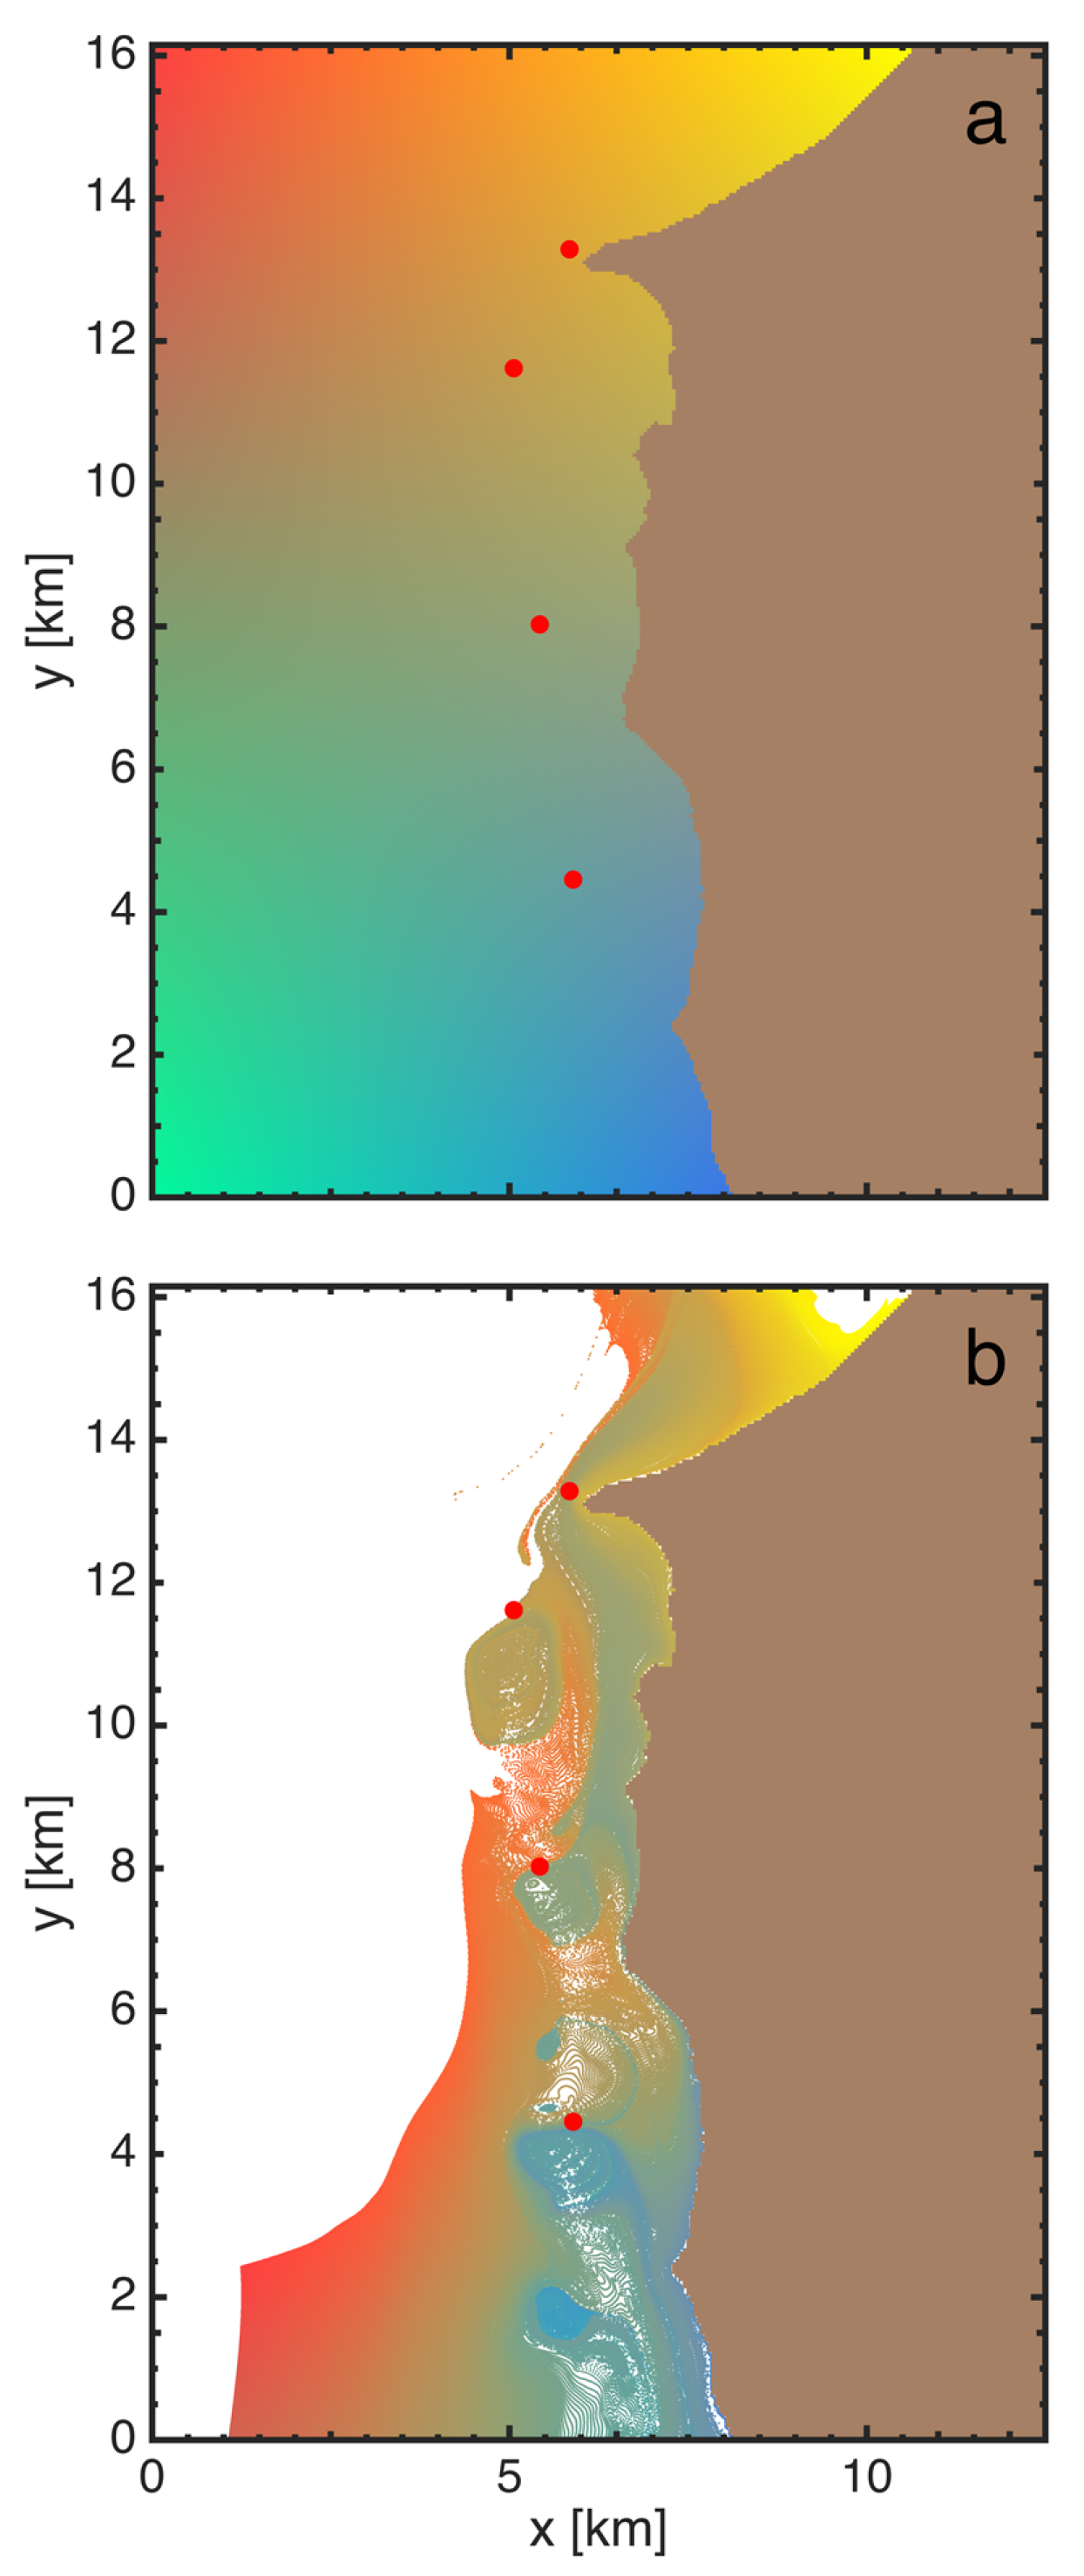
Figure 2a,b show the initial and final positions of a dense array of color-coded particles transported for half a day in the Coral Bay area. The final state of the particles visually suggests the presence of underlying organizing transport structures, with eddy-shaped features sitting along the outer edge of the reef system and some sharp delineations between regions of different color coding, identifying locations where particles have been attracted from very distinct regions of the domain.
Underlying the flow transport in
Figure 2a,b are the LCS, and in the background of
Figure 3a,b we show the forward-time (repelling) and backward-time (attracting) FTLE fields, respectively. Superimposed on top of these FTLE fields, we identify the repelling hyperbolic coherent structures (orange lines;
Figure 3a), the attracting hyperbolic coherent structures (orange lines;
Figure 3b), and the elliptic coherent structures (yellow lines;
Figure 3a,b). In all cases, these align with the FTLE ridges (although this alignment is not a strict requirement). The elliptic LCS enclose material that remains trapped within the Lagrangian eddies. These structures actually persist for much longer than 12 h and so could trap material for significant periods of time. Repelling hyperbolic structures separate the domain into regions that will experience qualitatively different transport behavior, while attracting hyperbolic structures separate the domain into regions that have experienced qualitatively different transport behavior (material on either side of a repelling structure will go to quite different physical locations, whereas material on either side of an attracting structure will have come from quite different physical locations). Hence, the portions of fluid initially delineated by repelling hyperbolic structures will remain coherent and, at the final time, will be delineated by attracting hyperbolic structures.
Using the domain partitioning revealed by the LCS in
Figure 3a,b, the initial (
Figure 3c) and final (
Figure 3d) locations of distinct coherent patches of particles delineated by the hyperbolic and elliptic LCS are presented (
Movie S1 in Supplementary Materials, included with this submission, presents an animation of the intermediate states). The color-coding theme was based on the inspection of the qualitative nature of the advection of the different patches, providing a simplified but insightful view of how the Lagrangian transport is organized within the domain. There are three qualitatively different regions of transport within the vicinity of Coral Bay. First are the counter-rotating Lagrangian eddies (elliptic LCS; yellow) located on each side of channels facing the ocean (red dots,
Figure 1); eddies on the southward side of each channel are substantially larger than those on the northward side, due to the presence of the southward shelf flow typical of the region [
10]. Note that, while eddy features are somewhat discernible in the (Eulerian) velocity field snapshots (
Figure 1), LCS processing is necessary to identify the boundaries of the true trapping regions for advected material [
15]. The second and third regions are the purple (northward-moving) and green (southward-moving) domains separated by a key hyperbolic repelling LCS connected to the shoreline at Five Fingers (
Figure 3a).
Further sub-domains within each of the three principal transport regions can be identified. Within the purple region, for example, there is a sub-region (light purple) that is transported out of the inner reef and around Point Maud, and much of the material that replaces this comes from a thin filament of the domain initially aligned along the outer reef edge that enters the reef by circulating around an eddy (see
Movie S1 in Supplementary Materials). This latter example is a clear demonstration of how LCS analysis can help us to understand coral reef transport: for this 12 h timescale, a reef on the northern side of the Point Maud peninsula can only be connected to the light purple shaded water mass within the inner part of Coral Bay.
Recall that, in
Figure 3, the timescale chosen for the Lagrangian analysis is 12 h. For time windows much less than 12 h, no coherent structures are evident because not enough time has elapsed for the organization of transport to occur; for time windows much longer than 12 h, with the exception of the material trapped in Lagrangian eddies, all material is advected out of Coral Bay and thus influenced by flow processes outside the domain. This is a key feature of the Lagrangian analysis: the systematic increase in the analysis time window until clear features become evident, and hence implicit determination of the characteristic timescale for the organization of transport within the region. Thus, in our study, 12 h is the inherent transport timescale for the system. Choosing any particular 12 h time window had little effect on the LCS structure for this reef system, as its flow patterns are strongly influenced by the bathymetry at all times.
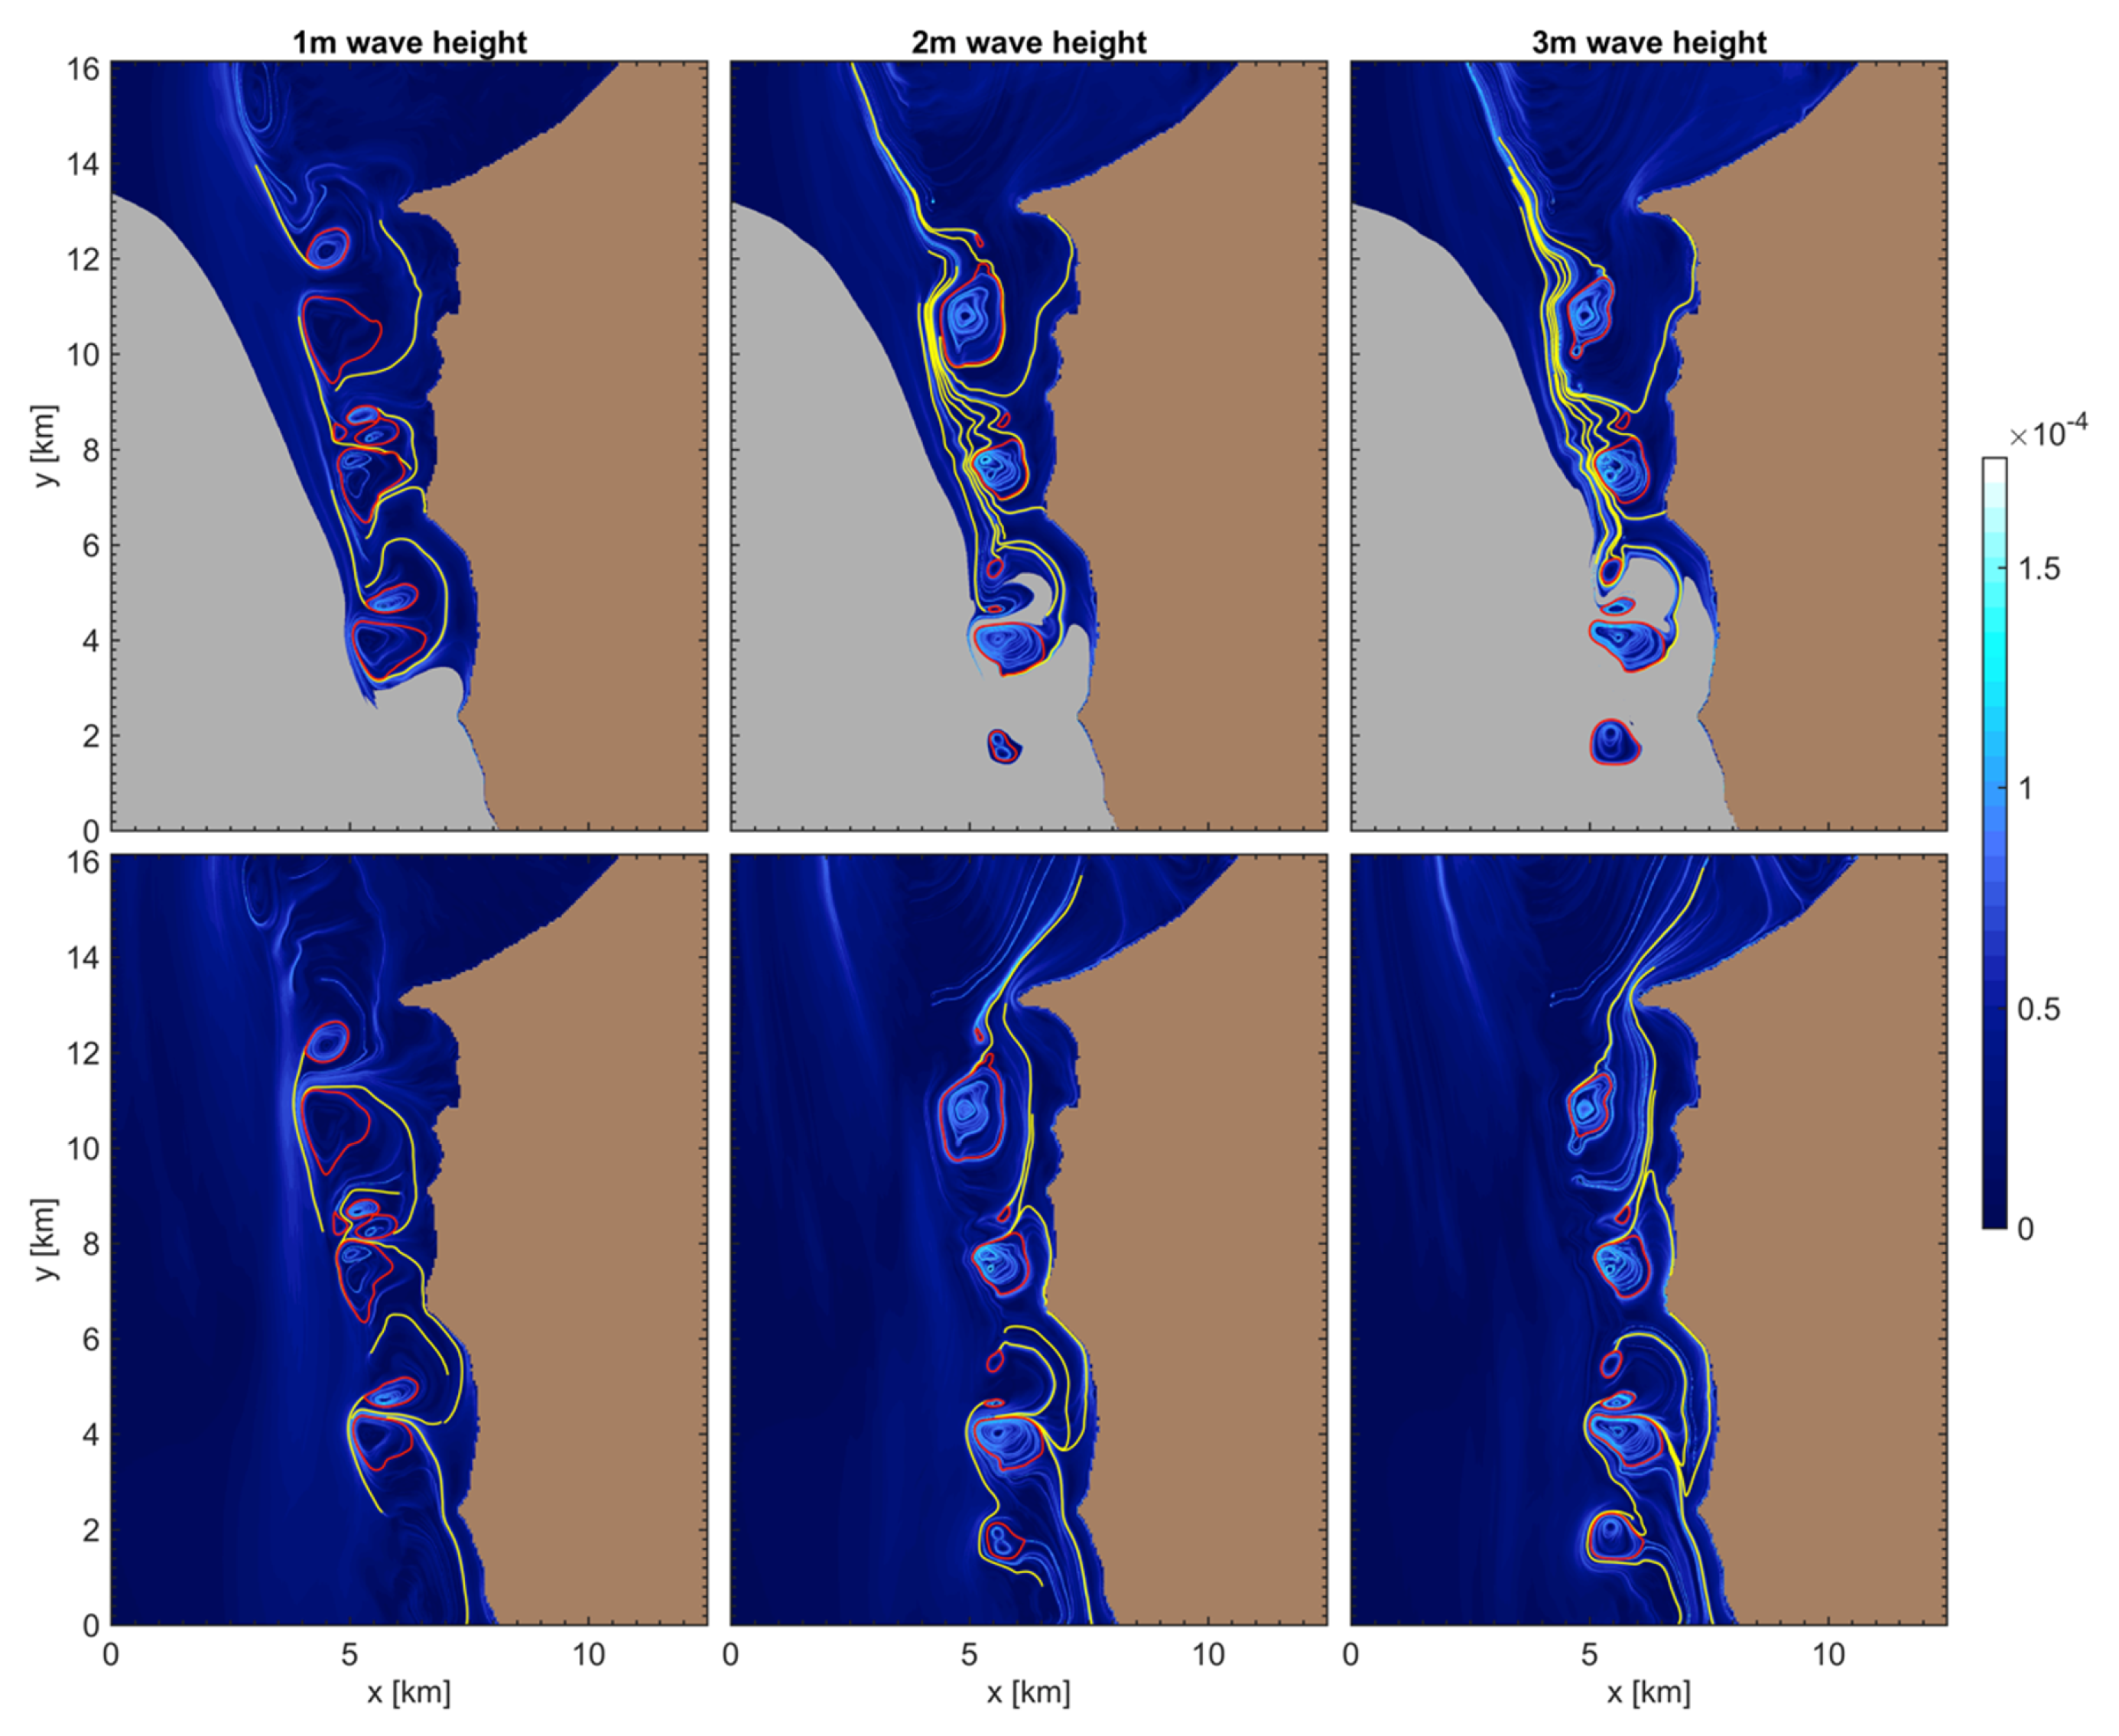
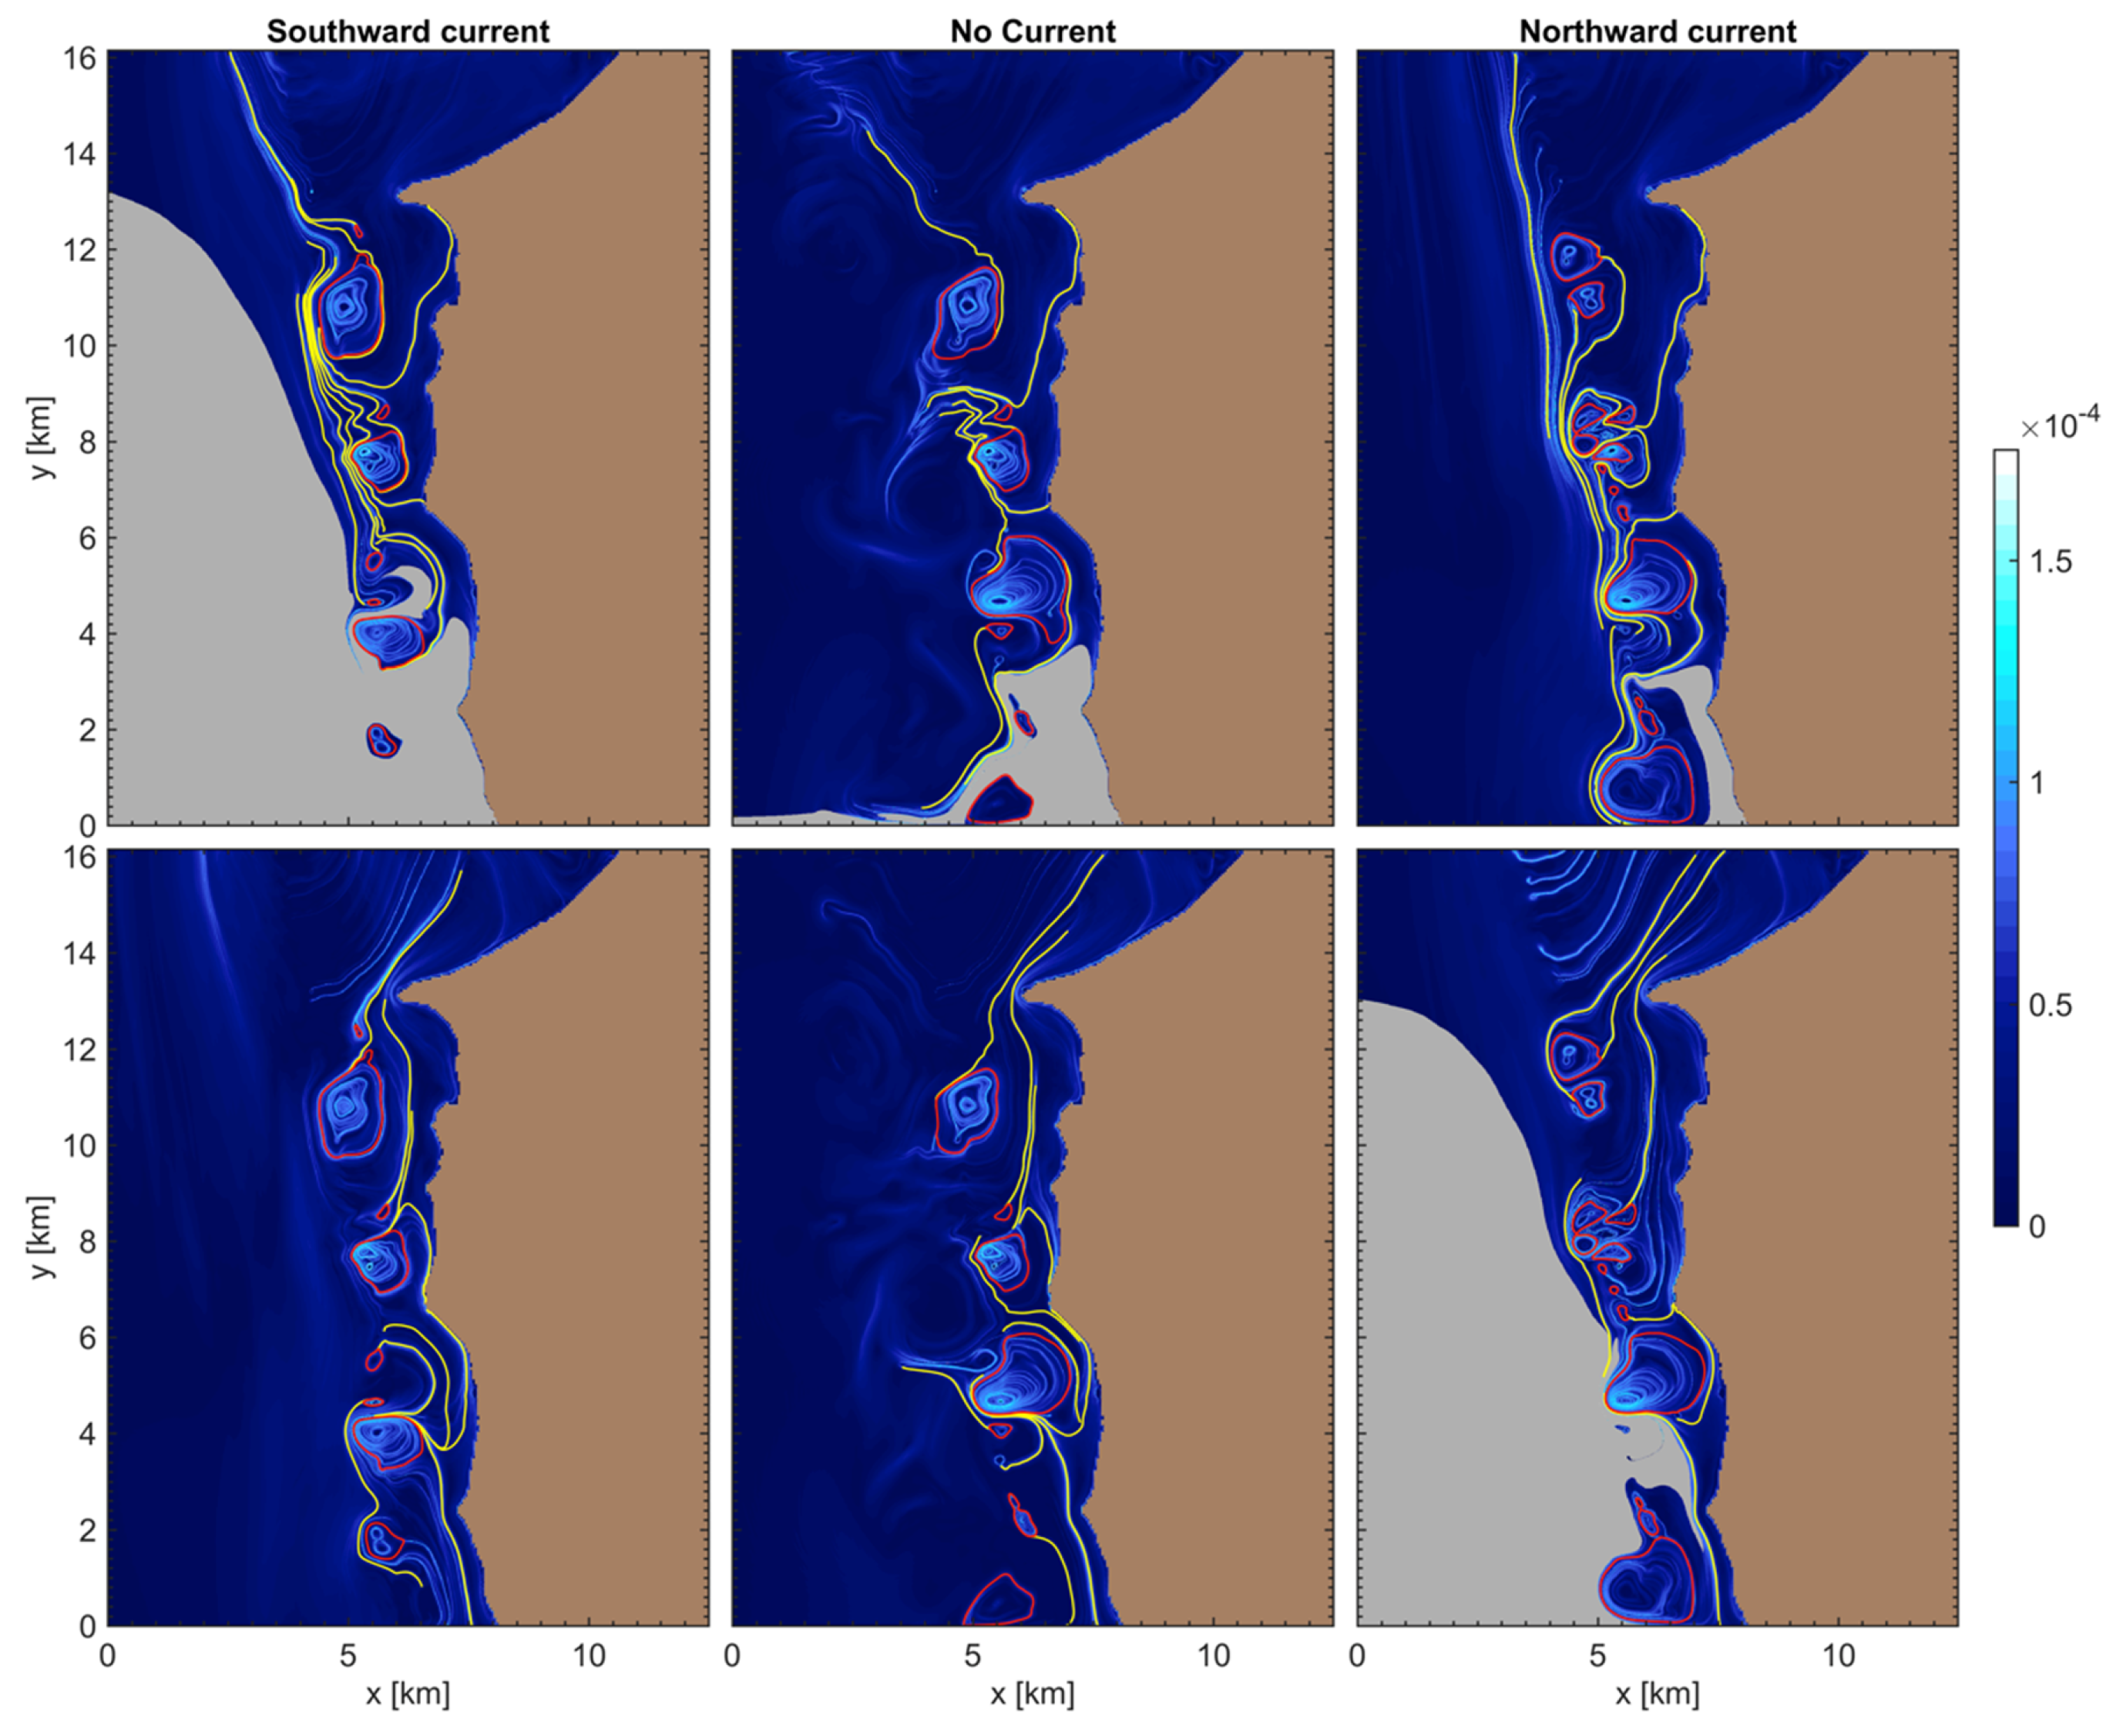
These Lagrangian features uncovered are robust features of this reef system; sensitivity tests under different forcing conditions (incident wave heights and the direction of offshore currents) resulted in only small differences in the dominant flow structures, the underlying reason being that the LCS are predominantly defined by the flows set by a combination of the geomorphology of the reef and the consistent form of the forcing mechanism in the form of wave-breaking at the edge of the fringing reef. Representing different seasonal conditions, we simulated scenarios in which the offshore current ran southward, northward, or was absent for the typical (default) offshore significant wave height of 2 m. For the most typical scenario of a southwards offshore current, we furthermore simulated the response to differing wave heights (1 and 3 m). As shown in
Appendix A Figure A1, the effect of increasing wave height is to primarily produce better-defined LCS, but the overall patterns remain qualitatively the same. For the small 1 m wave height forcing, the flows in the reef are relatively weak, and so in this scenario the fewest structures are visible. The primary LCS in and around the reef are also qualitatively similar for a northern or southern offshore current, or no offshore current, as shown in
Appendix A Figure A2. The primary effect of switching the direction of the offshore current is to influence the relative sizes of the pair of Lagrangian vortices that exist at each outflow location adjacent to the reef channels.
4. Discussion
The use of LCS analysis provides valuable new insight for studying transport within and surrounding coral reefs. The existence of LCS—sometimes called the hidden skeleton of transport [
18]—and their scale is not necessarily obvious when inspecting Eulerian flow fields, and requires sophisticated but accessible processing tools for their identification. Due to the fixed nature of reef bathymetry, LCS analysis at coral reefs seems to produce robust results even in the face of large-scale variations in the amplitude of forcing conditions that significantly influence the magnitude of the transport. This result is rather different from many near-shore environments (including sandy beaches) where the seafloor is mobile and dominant flow structures associated with rip currents, for example, are often highly transient [
19].
The identification of persistent flow structures that are responsible for repelling or trapping material can provide valuable insight into a range of environmental and ecological processes within reef environments. For example, the identification of persistent aggregation regions can help to identify areas within reefs where the accumulation of contaminants and debris (e.g., plastics) will likely occur. Similarly, identifying zones with persistent dispersing (repelling) features can provide insight into locations where released larvae have the highest probability of contacting remote populations (e.g., those sites that may be most efficient at rejuvenating distant reefs following disturbances). Overall, the application of such approaches should help aid reef management and conservation efforts—for example, helping to quantitatively justify the placement of Marine Protected Areas using knowledge of the persistent transport structures that often occur within and surrounding reefs.
While the focus of the present study was on assessing two-dimensional flow structures, the LCS approach can, in principle, be extended to three-dimensional (3D) studies with a vertical component, and LCS methods are increasingly becoming established for 3D applications [
20]. Of course, 3D studies will be geometrically more complex and thus can be more challenging to both calculate and visualize. We also note that such Lagrangian analysis is not restricted to passive particles. For example, a larval swimming or sediment transport model can be included, in which case the LCS uncovered would not be flow structures, per se, but aggregating, dispersing, and trapping structures for active-swimming larvae or sediment within the flows being considered. The equivalent has been performed in LCS analysis to account for deviations between the actual material transport and the flow—for example, to account for particle inertia [
21] and surface windage effects [
4]. For our case study, we considered the advection of passive particles, which is a reasonable representation of, say, coral larvae, given that they typically swim at speeds of mm s
−1 [
22], whereas the range of background flow speeds at Coral Bay is much larger, in the range of 0.1–1 m s
−1.


