1. Introduction
Since the turn of the century, a new coronavirus has emerged in the world for the third time, causing respiratory disease outbreak. The World Health Organization (WHO) named the disease caused by this coronavirus as COVID-19 [
1]. Although the previous two outbreaks (SARS and MERS) were well controlled around the world and the number of infected people was limited, COVID-19 has become widespread all over the world. The total number of the confirmed cases has already exceeded eight million so far [
2]. The ability to spread easily and rapidly [
3] through the respiratory system between individuals, as well as the long-term incubation period [
4], distinguish the virus from other viruses in its family [
5], thereby making it a global health issue.
Understanding on how infectious diseases are spread is a step for the implementation of countermeasures. Coronavirus can be transmitted indirectly and directly from one person to another person. However, there are some studies emphasizing that the main transmission occurs via respiratory droplets, which are generated through the respiratory tract during breathing, speaking, coughing, and sneezing [
6]. Moreover, very recent studies show that coronavirus can live for days on the exposed surface area under favorable atmospheric conditions [
7,
8]. In addition, two recent studies [
9,
10] reported that this virus could be transmitted through the air by small particle droplet nuclei known as aerosols, which are defined as a collection of solid or liquid particles suspended in a gas phase [
11]. Such expiratory particles have a diameter of around 1 micrometer, and they are invisible to the naked eye. Most people unfamiliar with aerosols do not have any knowledge of their existence. Nevertheless, such particles are big enough to hold viruses like COVID-19. Aerosols can be transmitted very easily by the air stream due to their small size. In addition, in the literature it was shown that the aerosols are causing pulmonary diseases [
12,
13]. In a very recent study about the transmission of COVD-19 droplets, it was proven that aerosols are involved in the spread of diseases [
14].
While different health organizations mostly presented similar guidelines for precautions, the WHO and the US Centers for Disease Control and Prevention (CDC) proposed different guidelines for COVID-19 [
15,
16]. Droplets settle quickly and therefore restrict the transmission of the virus to the people near the carrier. However, nuclei droplets can be typically suspended longer than droplets, leading to air-borne transfer in long-distance and to the increased number of infections. The studies revealed that aerosol transmission accounts for about half of all transmission cases [
17]. Even though it is still unclear which mechanism plays a key role in transmission of COVID-19, there is much evidence stating that aerosols play an important role in indirect infection [
18]. An experimental study by Van Doremalen et al. [
19] demonstrated that aerosolized SARS-CoV-2 remains viable in the air with a half-life of about 1 h. As a result, the estimation of the path length of large droplets before settling, characterization of the aerosols and droplet nuclei transportation in the air, and assessment of environmental parameters, such as airstream on the droplet’s path, mean that it is vital to take precautions.
Wells [
20], one of the pioneering studies on the effective range of droplets, revealed that air infection transmission occurs in two forms according to the droplet size: droplet contact and aerosols (air-bone). While droplet contact with droplets having a diameter larger than 100 μm (falling immediately by the gravitational force) causes infection, air-borne infection happens via droplets with a diameter smaller than 100 μm. It should be noted that the most significant droplets with size below 100 μm will completely evaporate until they fall along a distance of 2 m [
20,
21].
As an example of the experimental studies, Duguid [
22] conducted an experimental study on the size and air transmission of the droplets and droplet nuclei. In this study, 12,000 droplets and 21,000 droplet nuclei were considered using microscopic measurements to attempt to obtain the broad size distribution for the respiratory droplets. According to the results of that study, droplet sizes varied from 1 to 2000 μm, and most of the droplets (95%) had a diameter between 2 and 100 μm. These nuclei droplets needed 30 to 60 min to disappear in a room without any air stream. In addition, Chen et al. [
23] recently presented the first study on the dominant droplet path for infection by separately investigating the short-range air-borne and the extensive droplet path. The results showed that short-range air-borne transmission is dominant in infection. For this reason, a comprehensive assessment of how the droplets and aerosols are transported in the air is a crucial step to prevent infectious diseases such as COVID-19.
Coronaviruses are respiratory pathogens, and the new coronavirus (COVID-19) infects both upper and lower respiratory tract [
24]. Indeed, viable viruses can be emitted to the environment from an infected person by breathing, coughing or sneezing.
There are several numerical and experimental studies, which are conducted regarding the transmission via respiratory droplets. In this regard, Zhu et al. [
25] simulated the transport process of saliva (an extracellular fluid produced by salivary glands inside the mouth) droplets with different sizes under a calm indoor environment. Their results indicate that the droplet size has a significant effect on the droplet falling path, due to the effects of flow field, gravity, and inertia, which are related to the droplet size. Accordingly, while larger droplets were significantly affected by gravity and fell rapidly, the smaller ones traveled and stayed more in the air. They also showed that the aerosol droplets were affected by the indoor flow field rather than by the gravity. Gao et al. [
26] presented a numerical study on the transport of exhaled air by breathing, sneezing, and coughing. It was mentioned that cross-infection might occur when two people are face-to-face, due to the long-distance transfer of sneezed air, which is highly directional. Furthermore, Zhao et al. [
27] studied the effect of droplet generation on the transmission and distribution of droplets and found that the droplets generated by sneezing or coughing were transported for a longer time. On the other hand, the droplets generated by normal breathing fell sooner. He et al. [
28] investigated transportation of respiratory droplets between two seated persons inside a room with the use of three different ventilation strategies. They found that flow stream paths and airflow rate had significant effects on the transmission and concentration of exhaled droplets, which were generated by normal breathing inside the room. They presented the optimized strategy of ventilation for indoor places.
In this study, the effect of respiratory droplets on spreading COVID-19 is numerically investigated. Previous studies indicated that the droplet generation mode is the most critical parameter for estimating how far the infectious particles can travel. The various standard values issued by different organizations and governments pose a serious question about the optimum safe distance between people. In this regard, having an understanding of the parameters affected by this distance is vital, which constitutes the motivation for this study. In this study, the exhaled droplet generation sources (breathing, coughing, and sneezing) are modelled. According to the obtained paths, the optimum horizontal distance for each mode is presented. Based on the numerical results, more insights are presented to determine the safe horizontal distance between people in indoor places.
2. Materials and Methods
Micron size droplets generated by coughing, breathing, and sneezing are modeled using a computational fluid dynamics (CFD) model to study the droplet behavior containing the virus. The most popular CFD package, ANSYS FLUENT, which is based on the finite volume method, was used for this purpose. The initial conditions, such as initial velocity and different boundary conditions, including wall assumption and pressure at the boundaries, are imposed using the Eulerian approach. In the Eulerian approach, the physical domain is divided into grid cells. A portion of each cell’s volume is filled by the liquid phase, while the other portion is filled by the air. In this approach, the phases of airflow and droplet are considered as interpenetrating, and there is a continuous interaction. For each phase, the governing equations are comparable to the Navier–Stokes equations. Thus, the various phases are mathematically considered as an interpenetrating continuum in the Euler-Euler method. Since the volume of one phase is not capable of occupying the other phases, the phasic volume fraction principle is implemented. The gas containing the droplets is assumed to be incompressible to simplify the simulation.
The volume of fluid (VOF) method is used to simulate the two-phase flow consisting of fluid and air. The fluid-air interface is monitored by solving the continuity, momentum, and volume fraction equations. In this method, the properties and variables for each cell represent one or a mixture of phases, which directly depend on the volume fraction values. If the computational cell’s volume fraction of fluid is labeled as α, these three conditions are possible:
α = 0: The cell is empty.
α = 1: The cell is full of fluid.
0 < α < 1: The cell is the interface between fluid and air.
The characteristics of each cell are determined by the water and air volume fractions. The control of the interface(s) between the phases is performed via a continuity equation solution for the volume fraction of one or more phases. This equation has the following form for the
phase:
where
is the fluid volume fraction,
is the fluid density and
is the velocity vector. In the above equation,
is the mass transfer from phase
q to phase
p, and
is the mass transfer from phase
p to phase
q. The volume fraction of the primary phase is determined based on the following constraint:
For time discretization, the implicit scheme is used. The domain is solved with a single momentum equation, and the resulting velocity field is shared between phases. The momentum equation shown below depends on the volume fractions of all phases through density and viscosity properties:
where
is the density,
is the velocity vector,
P is the pressure, and
F is a volumetric force. The continuous surface stress (CSS), as opposed to the non-conservative formulation of the continuum surface force (CSF) method, is an alternative way of modeling surface tension conservatively. CSS prevents explicit curvature measurement and can represent an anisotropic simulation version of capillary forces based on surface stresses. The surface stress tensor due to surface tension is defined by the CSS method as:
where
is unit tensor,
is surface tension coefficient,
is the tensor product of the two vectors,
is volume fraction, and
is the volume fraction gradient. The surface stress tensor is obtained by substituting Equations (5) and (6) into Equation (4) as:
The surface tension force is represented as:
The volume of fluids (VOF) model also offers an option to define a wall adhesion angle in accordance with the surface tension model. The model is based on the study by Brackbill et al. [
29]. For CFD analysis, a two-dimensional geometry was considered. The geometry was generated with the ANSYS design modeler. The surface area of domain was selected as 2 × 7 m
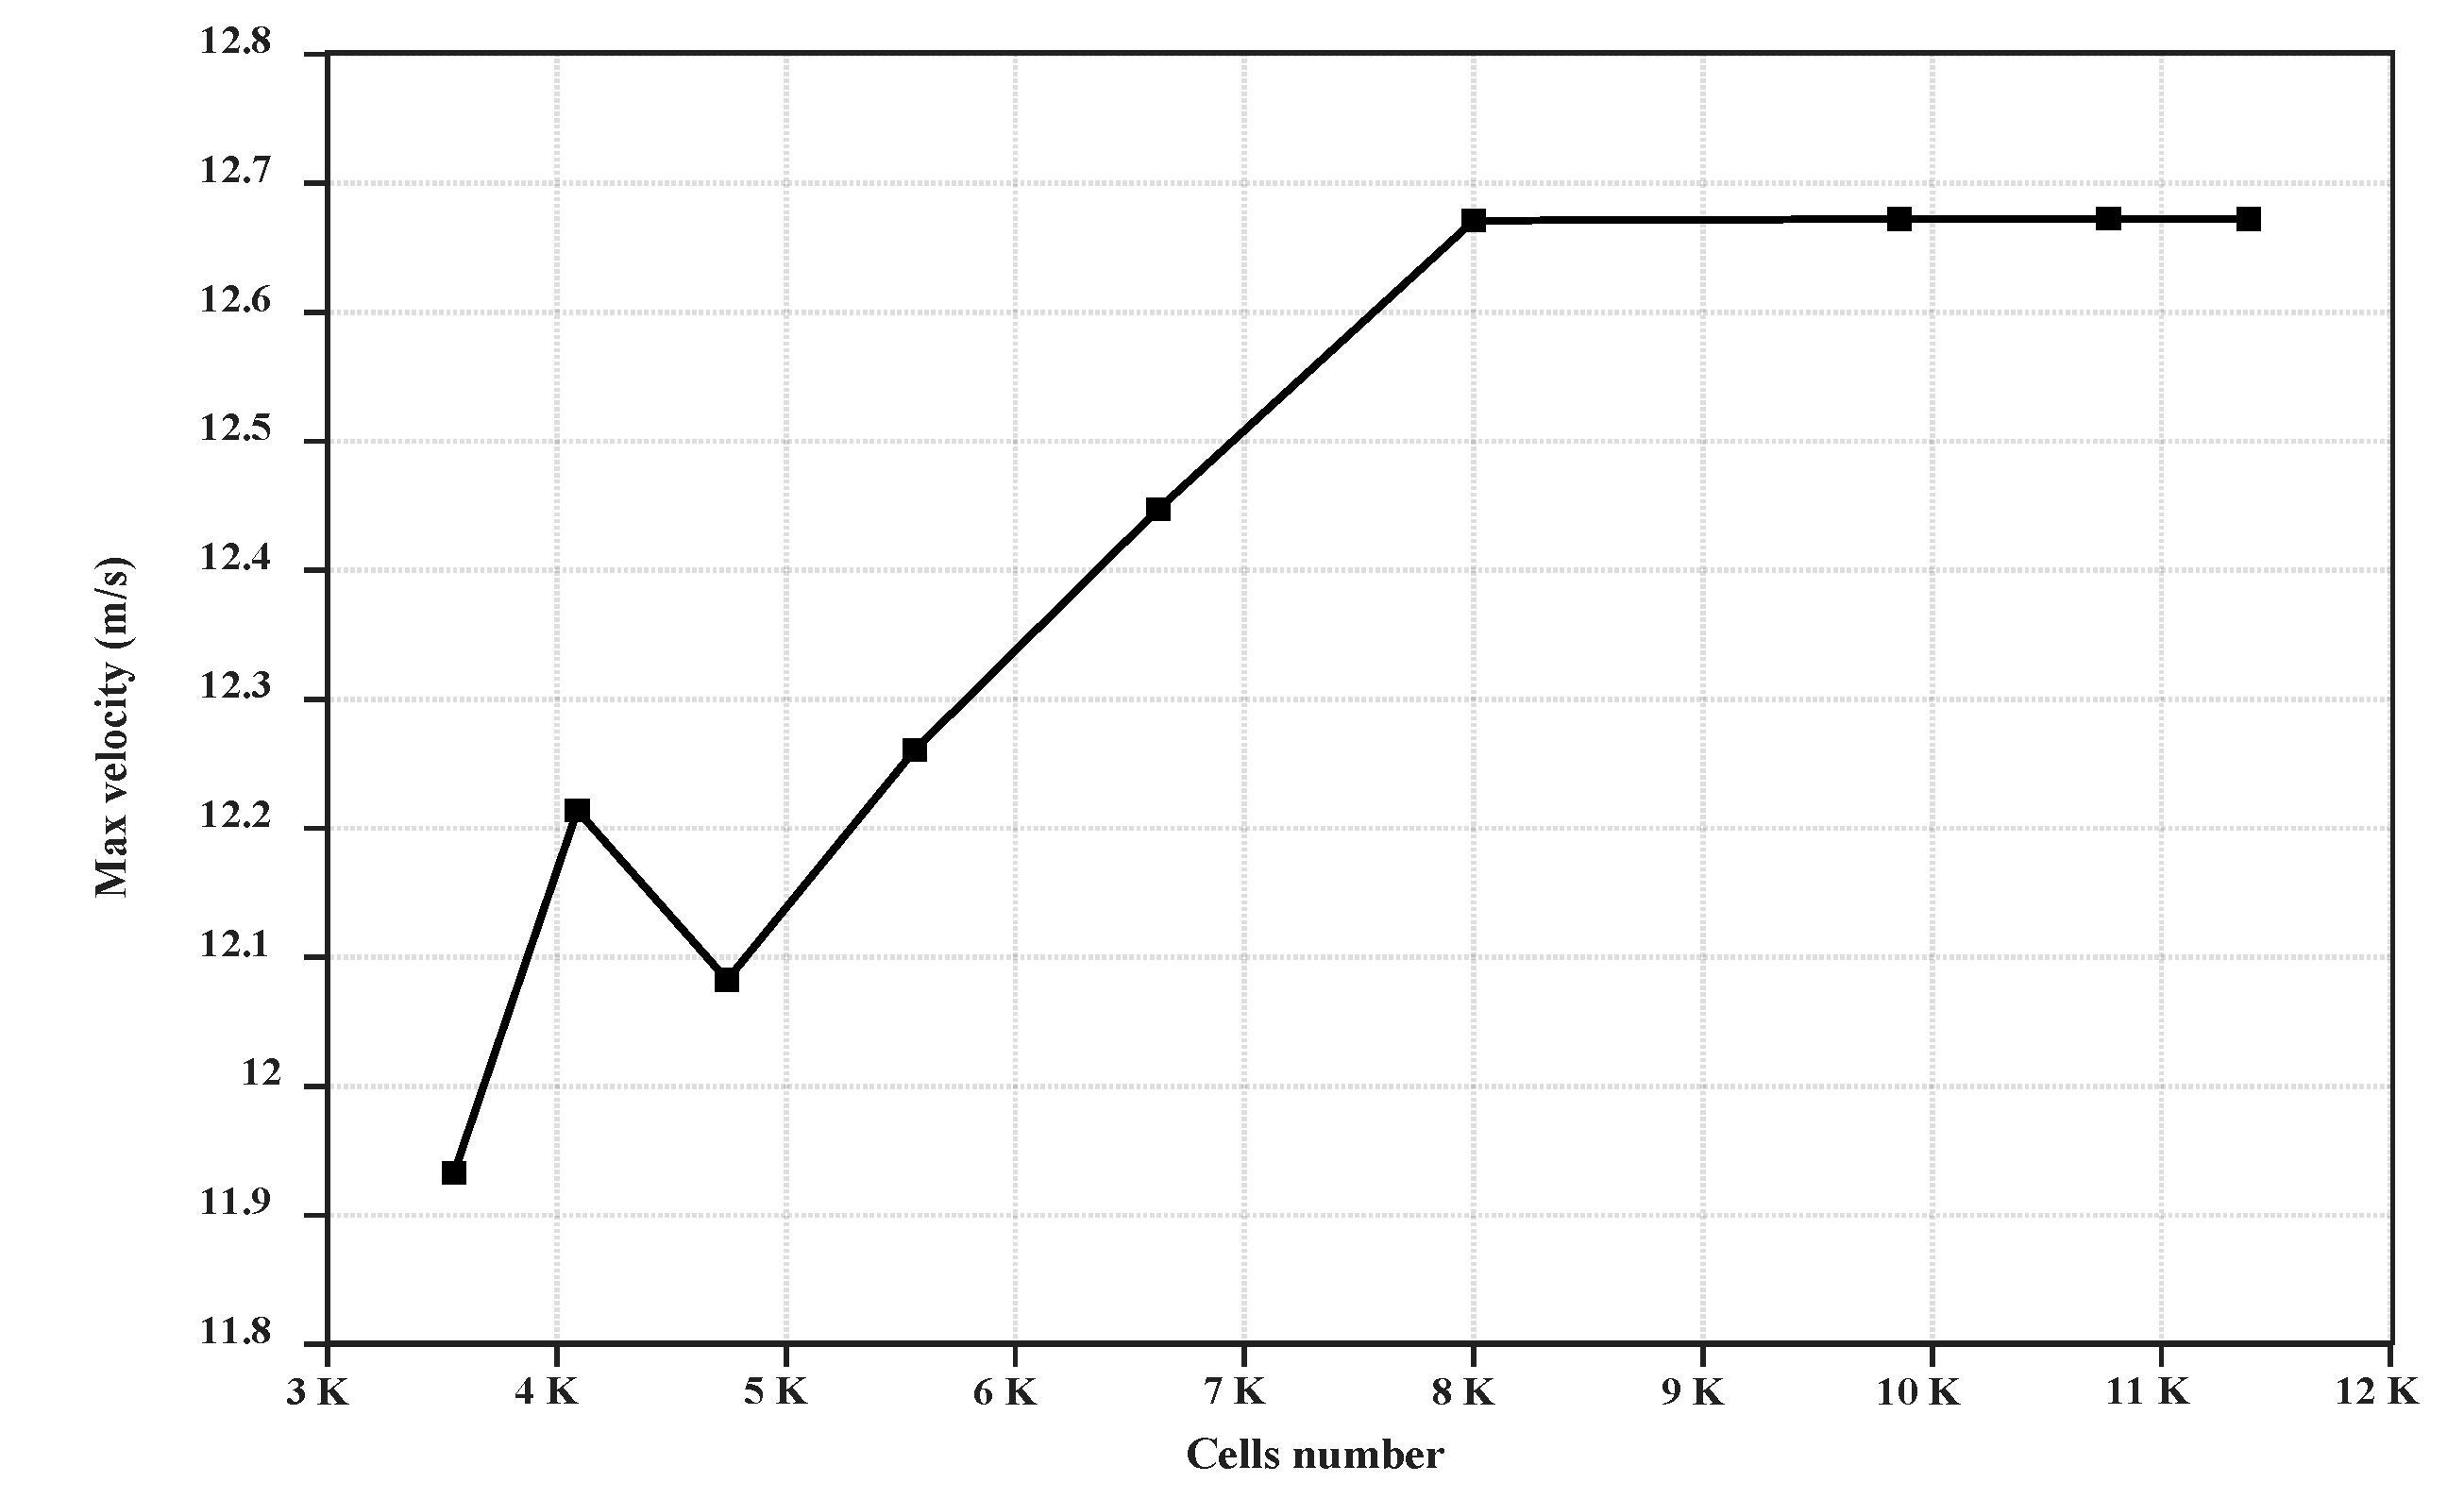
2, and the mapped mesh was chosen for meshing the domain. The final topology of the mesh was calculated by refining the mesh until the results were independent of the grid. A total of 80,000 cells were formed after a significant amount of meshing.
Figure 1 illustrates the maximum velocity in the facet average of the domain with respect to the cell numbers. As seen, for meshes above 80,000 cells, the diagram pattern is monotonous, and there is no significant change beyond this number of cells. For the continuous phase, an implicit formulation (due to much faster convergence) and pressure-based solver with absolute velocity formulation, which was used for incompressible flows, were selected. To set up the solver, the transient time mode was selected, and the gravity was activated. The wall boundary condition was imposed for the right and top sides, and the velocity inlet boundary condition was chosen for the left side of the domain. The wall boundary condition was imposed for the bottom side, and the contact angle between the two phases was taken as 90 °C for the wall adhesion.
To set the solution parameters, the scheme was selected as a fractional step for the pressure-velocity coupling. The QUICK discretization scheme was implemented to solve the momentum equation. For volume fraction discretization, a compressive scheme was used for sharper interface tracking and better accuracy. Before simulating the falling water drop, a single drop had to be generated. The specific region of the domain was taken as a circle droplet. The diameter of the droplets was picked up from the literature [
21]. The speeds of breathing, coughing jet, and sneezing jet were based on the literature [
21] and are included in
Table 1. The droplet of an infected person contains the Sars Cov-2, so assessing the droplets’ physics could reveal the behavior of the COVID-19 droplets. The solutions for transient flow field under steady-state condition or at each time step were expected to converge, when the dimensional mass and residual momentum ratios were smaller than 0.0001. Improving the convergence criteria to 0.00001 had a negligible effect on the simulation results.
3. Results
Since the emergence of Spanish influenza in 1918, which was one of the most lethal pandemics in the history, the following public health instructions remain unchanged to prevent respiratory diseases: holding a secure distance from the others, washing hands regularly with soap and water to remove any virus content, and covering the nose and mouth with a face mask. These instructions are based on the transmission of respiratory infections via viral droplets, which are released when an infected person coughs, sneezes, or breathes. The shape of these droplets, their sizes, and their transmissions are highly related to the fluid flow.
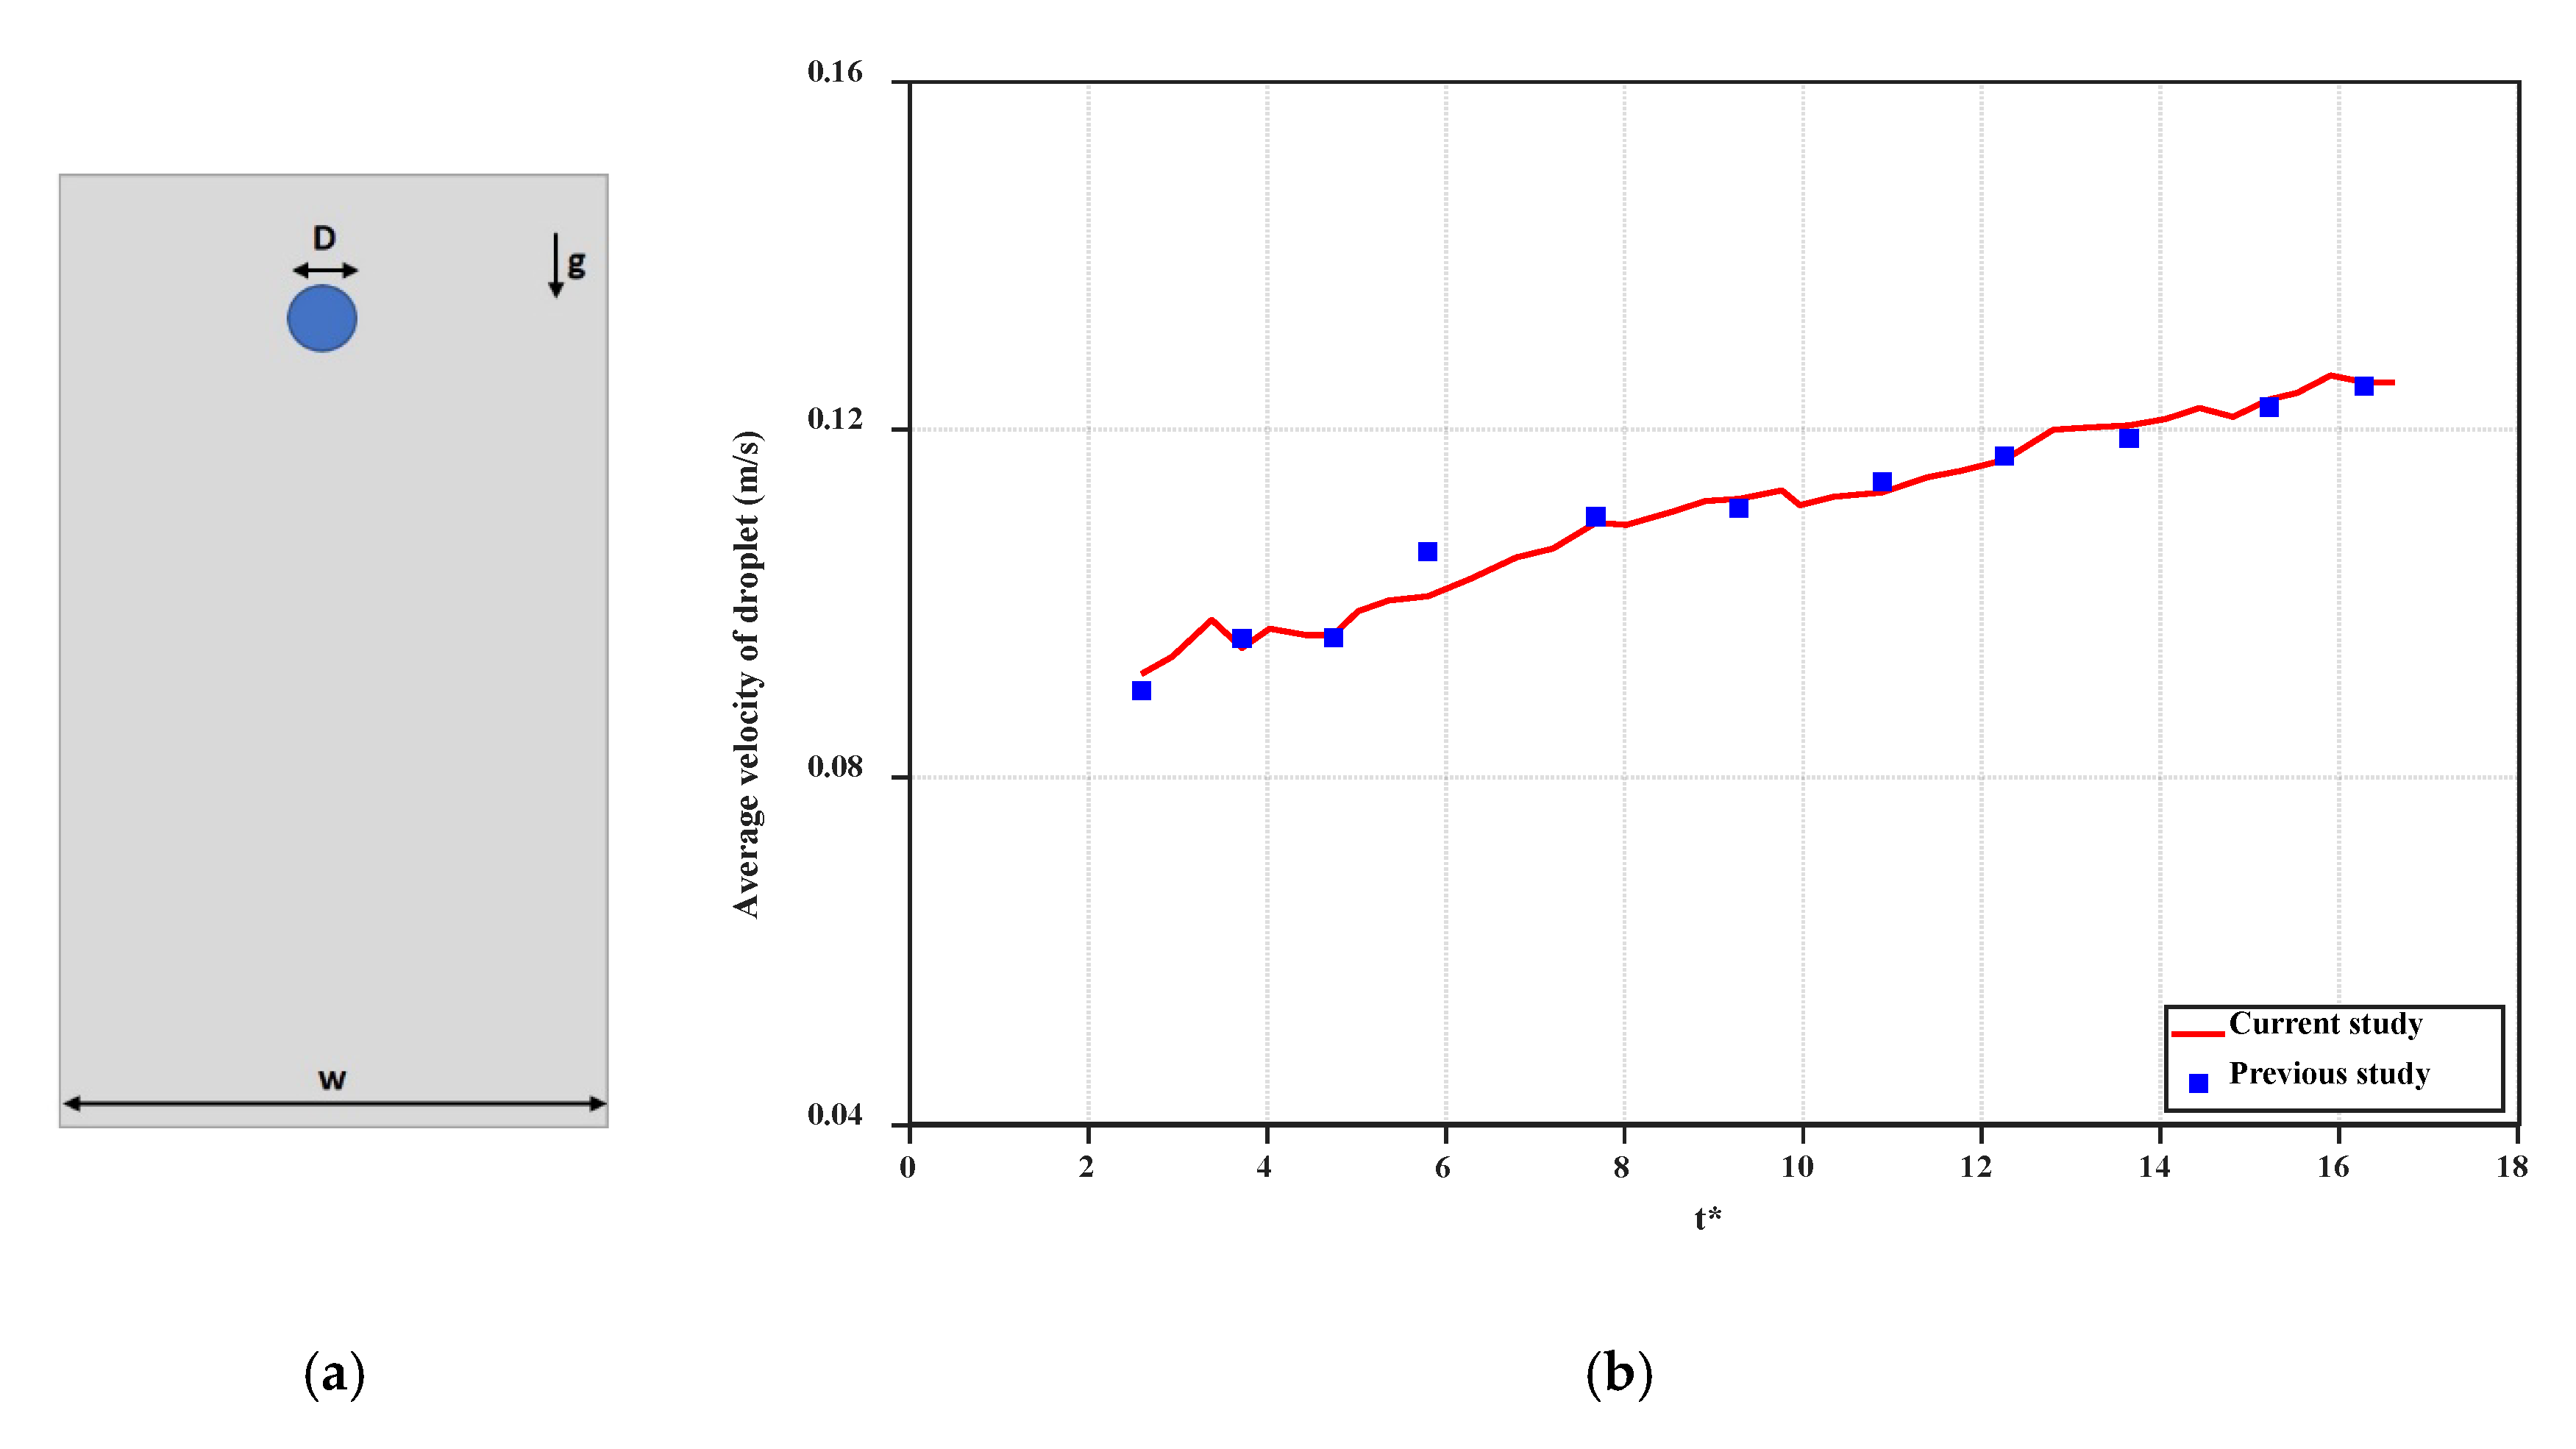
Infected people often expel these droplets by coughing or sneezing. This transmission relies on a great number of many parameters, such as the number, size, and velocity of the droplets through the expiratory tracts. Tiny droplets are suspended in the air, fly further away, and spread infection upon being inhaled. On the other hand, large droplets are more likely to pollute surfaces and transmit contamination by touching. Accordingly, we perform simulations of the dispersion of COVID-19 droplets (multi-dimensional) exhaled during sneezing, coughing, and breathing in a closed room with the use CFD. In
Figure 2, the comparison of the results of the present model with the results by Mousavi et al. [
31] is included for validation of the model. Accordingly, on the right side, the average velocity profile of droplets (when falling from a 2-m distance and with respect to the dimensionless time) is calculated and compared. The only force for both cases is the gravitational force, and there is no initial velocity for both cases. According to this reference, the channel width is 6 times larger than the diameter of the drop (
, the drop viscosity is 0.006 kg/ms, the ambient fluid viscosity is 0.006 kg/ms, the drop density is 1000 kg/m
3, and the ambient fluid density is 800 kg/m
3.
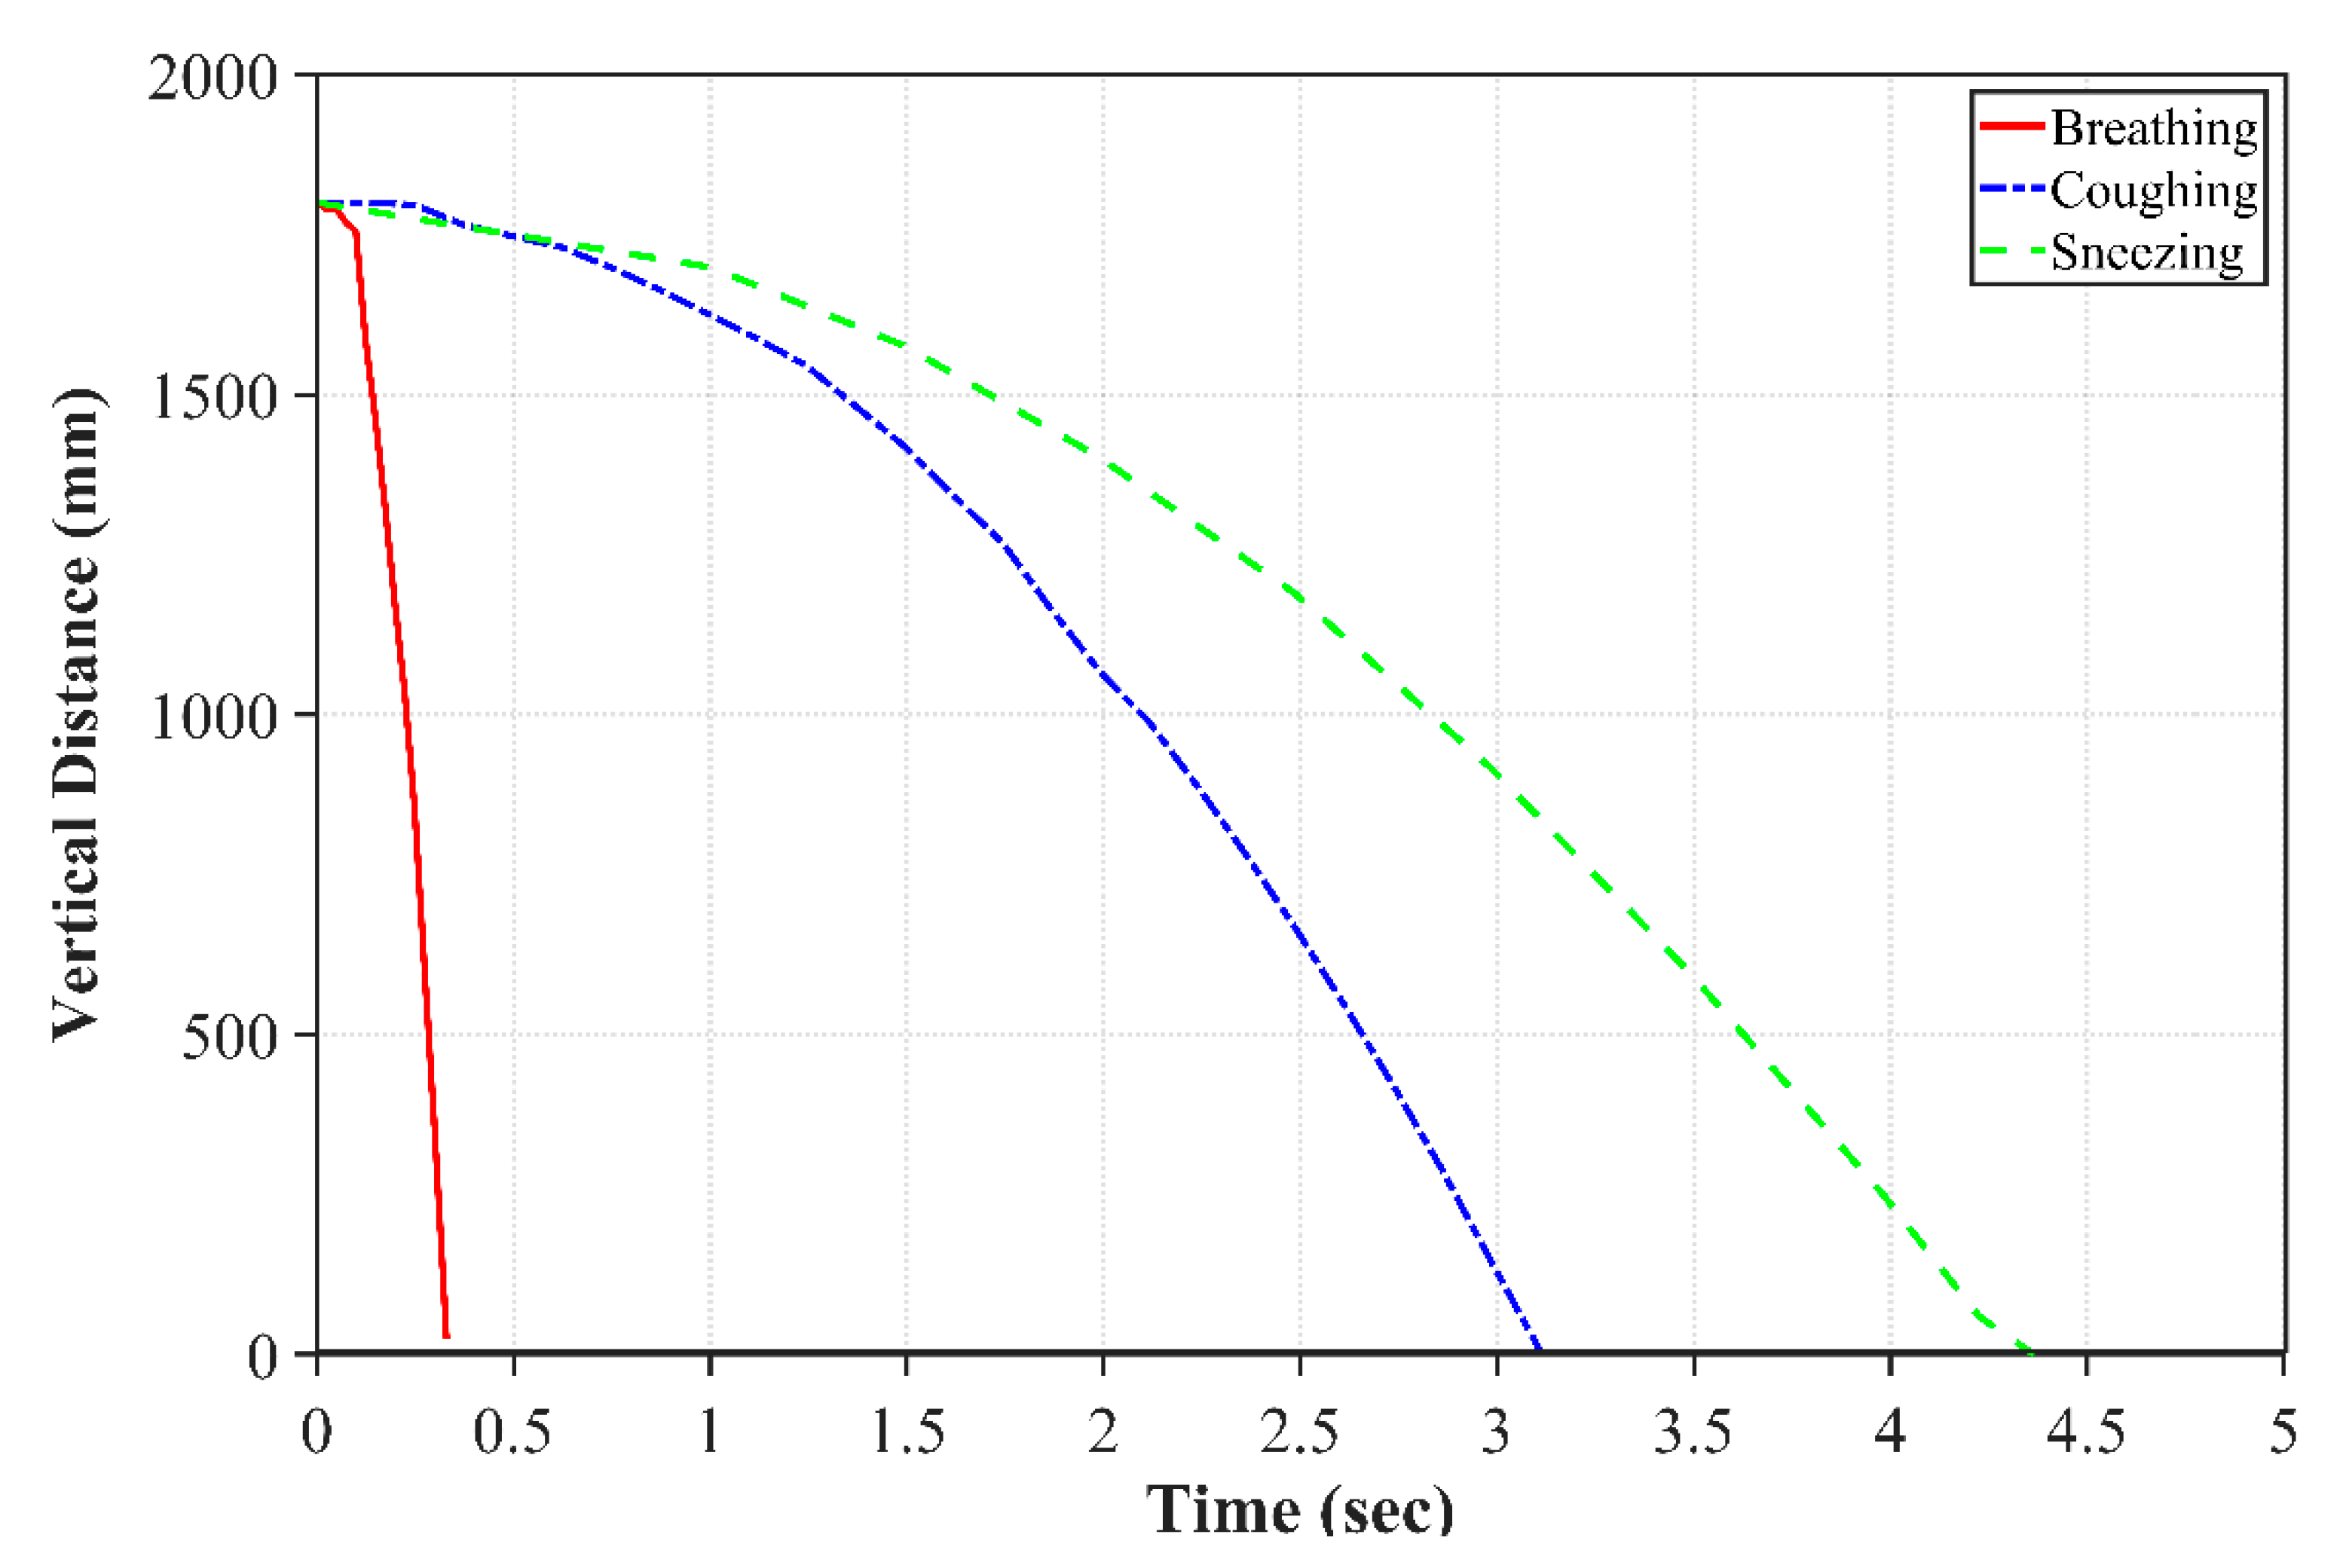
Figure 3 displays the motion of droplets in the y-direction as a function of the time for breathing, sneezing, and coughing droplets. As can be seen from this figure, the breathing droplet velocity is less than the sneezing and coughing velocities. For the same size droplets, it takes more time for a breathing droplet to fall to the ground. On the other hand, the droplets generated by sneezing are divided into some small portions with high speed due to the large drag force. The small portions called as aerosols spread in the air and, due to their very small size, they stay more in the air and can be dissipated more quickly because of their smaller inertia. However, these aerosols have the potential for infecting a person in close contact before the total dissipation.
As described earlier, Van Doremalen et al. [
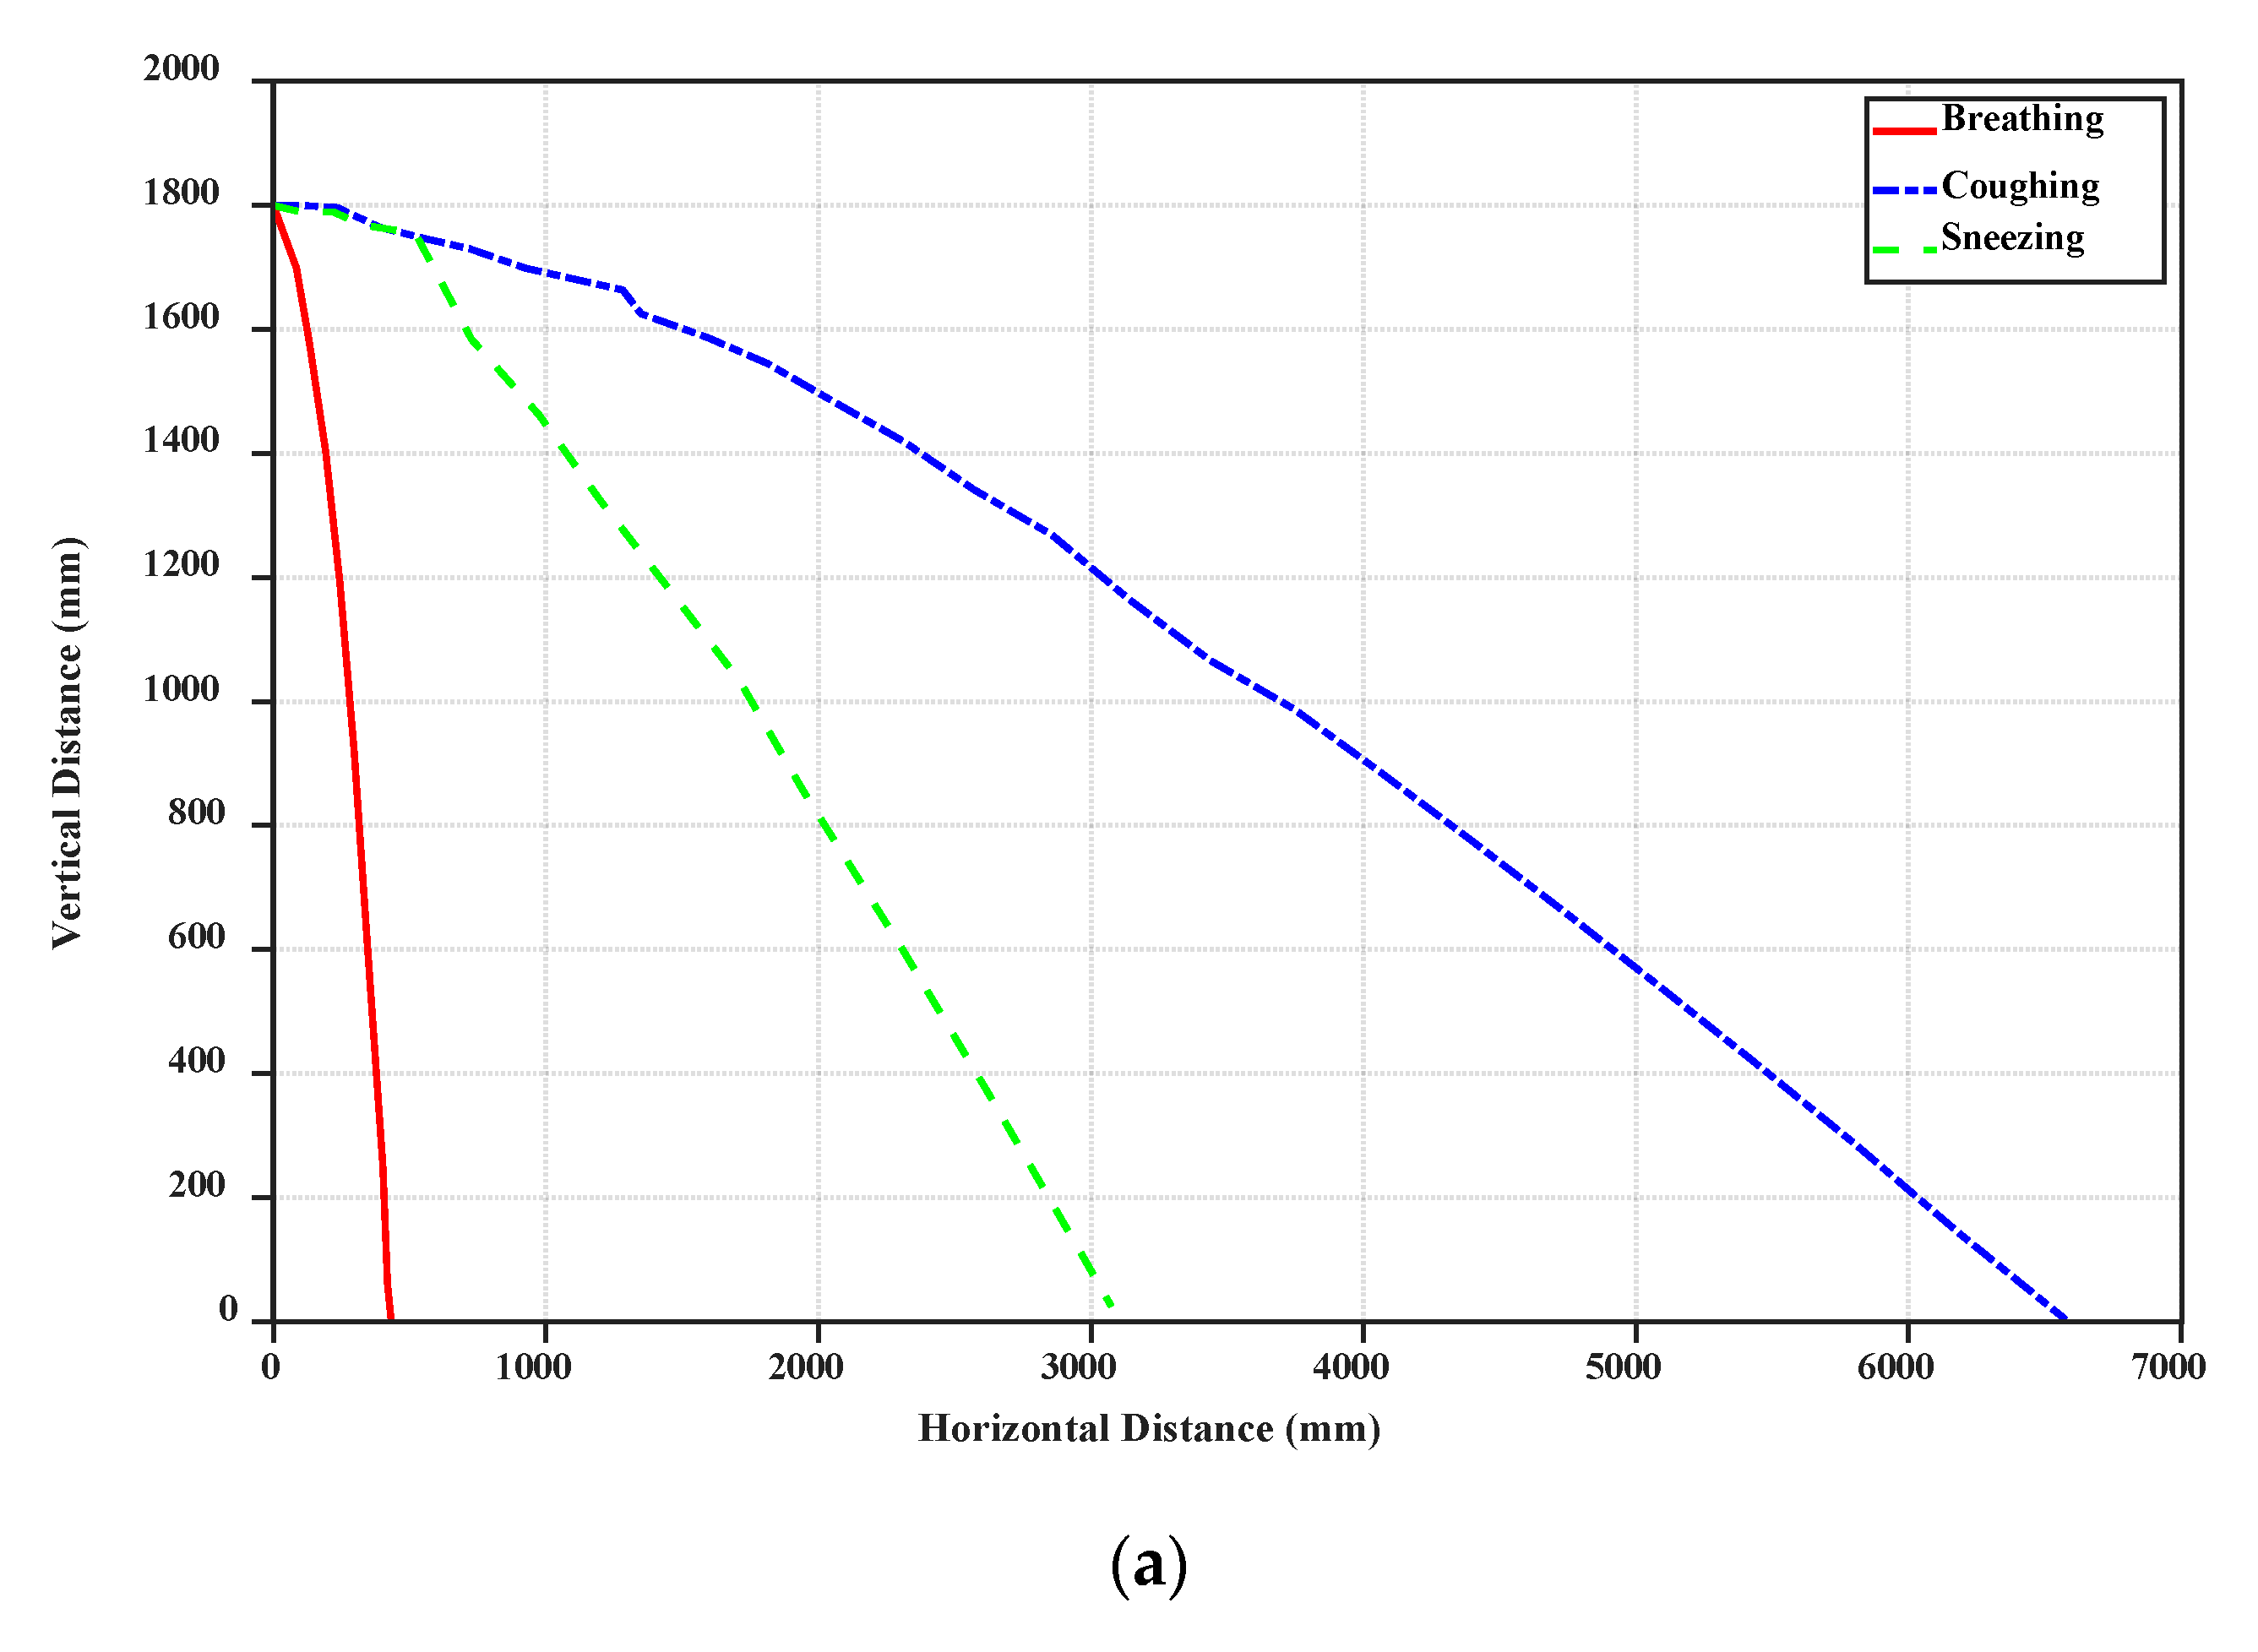
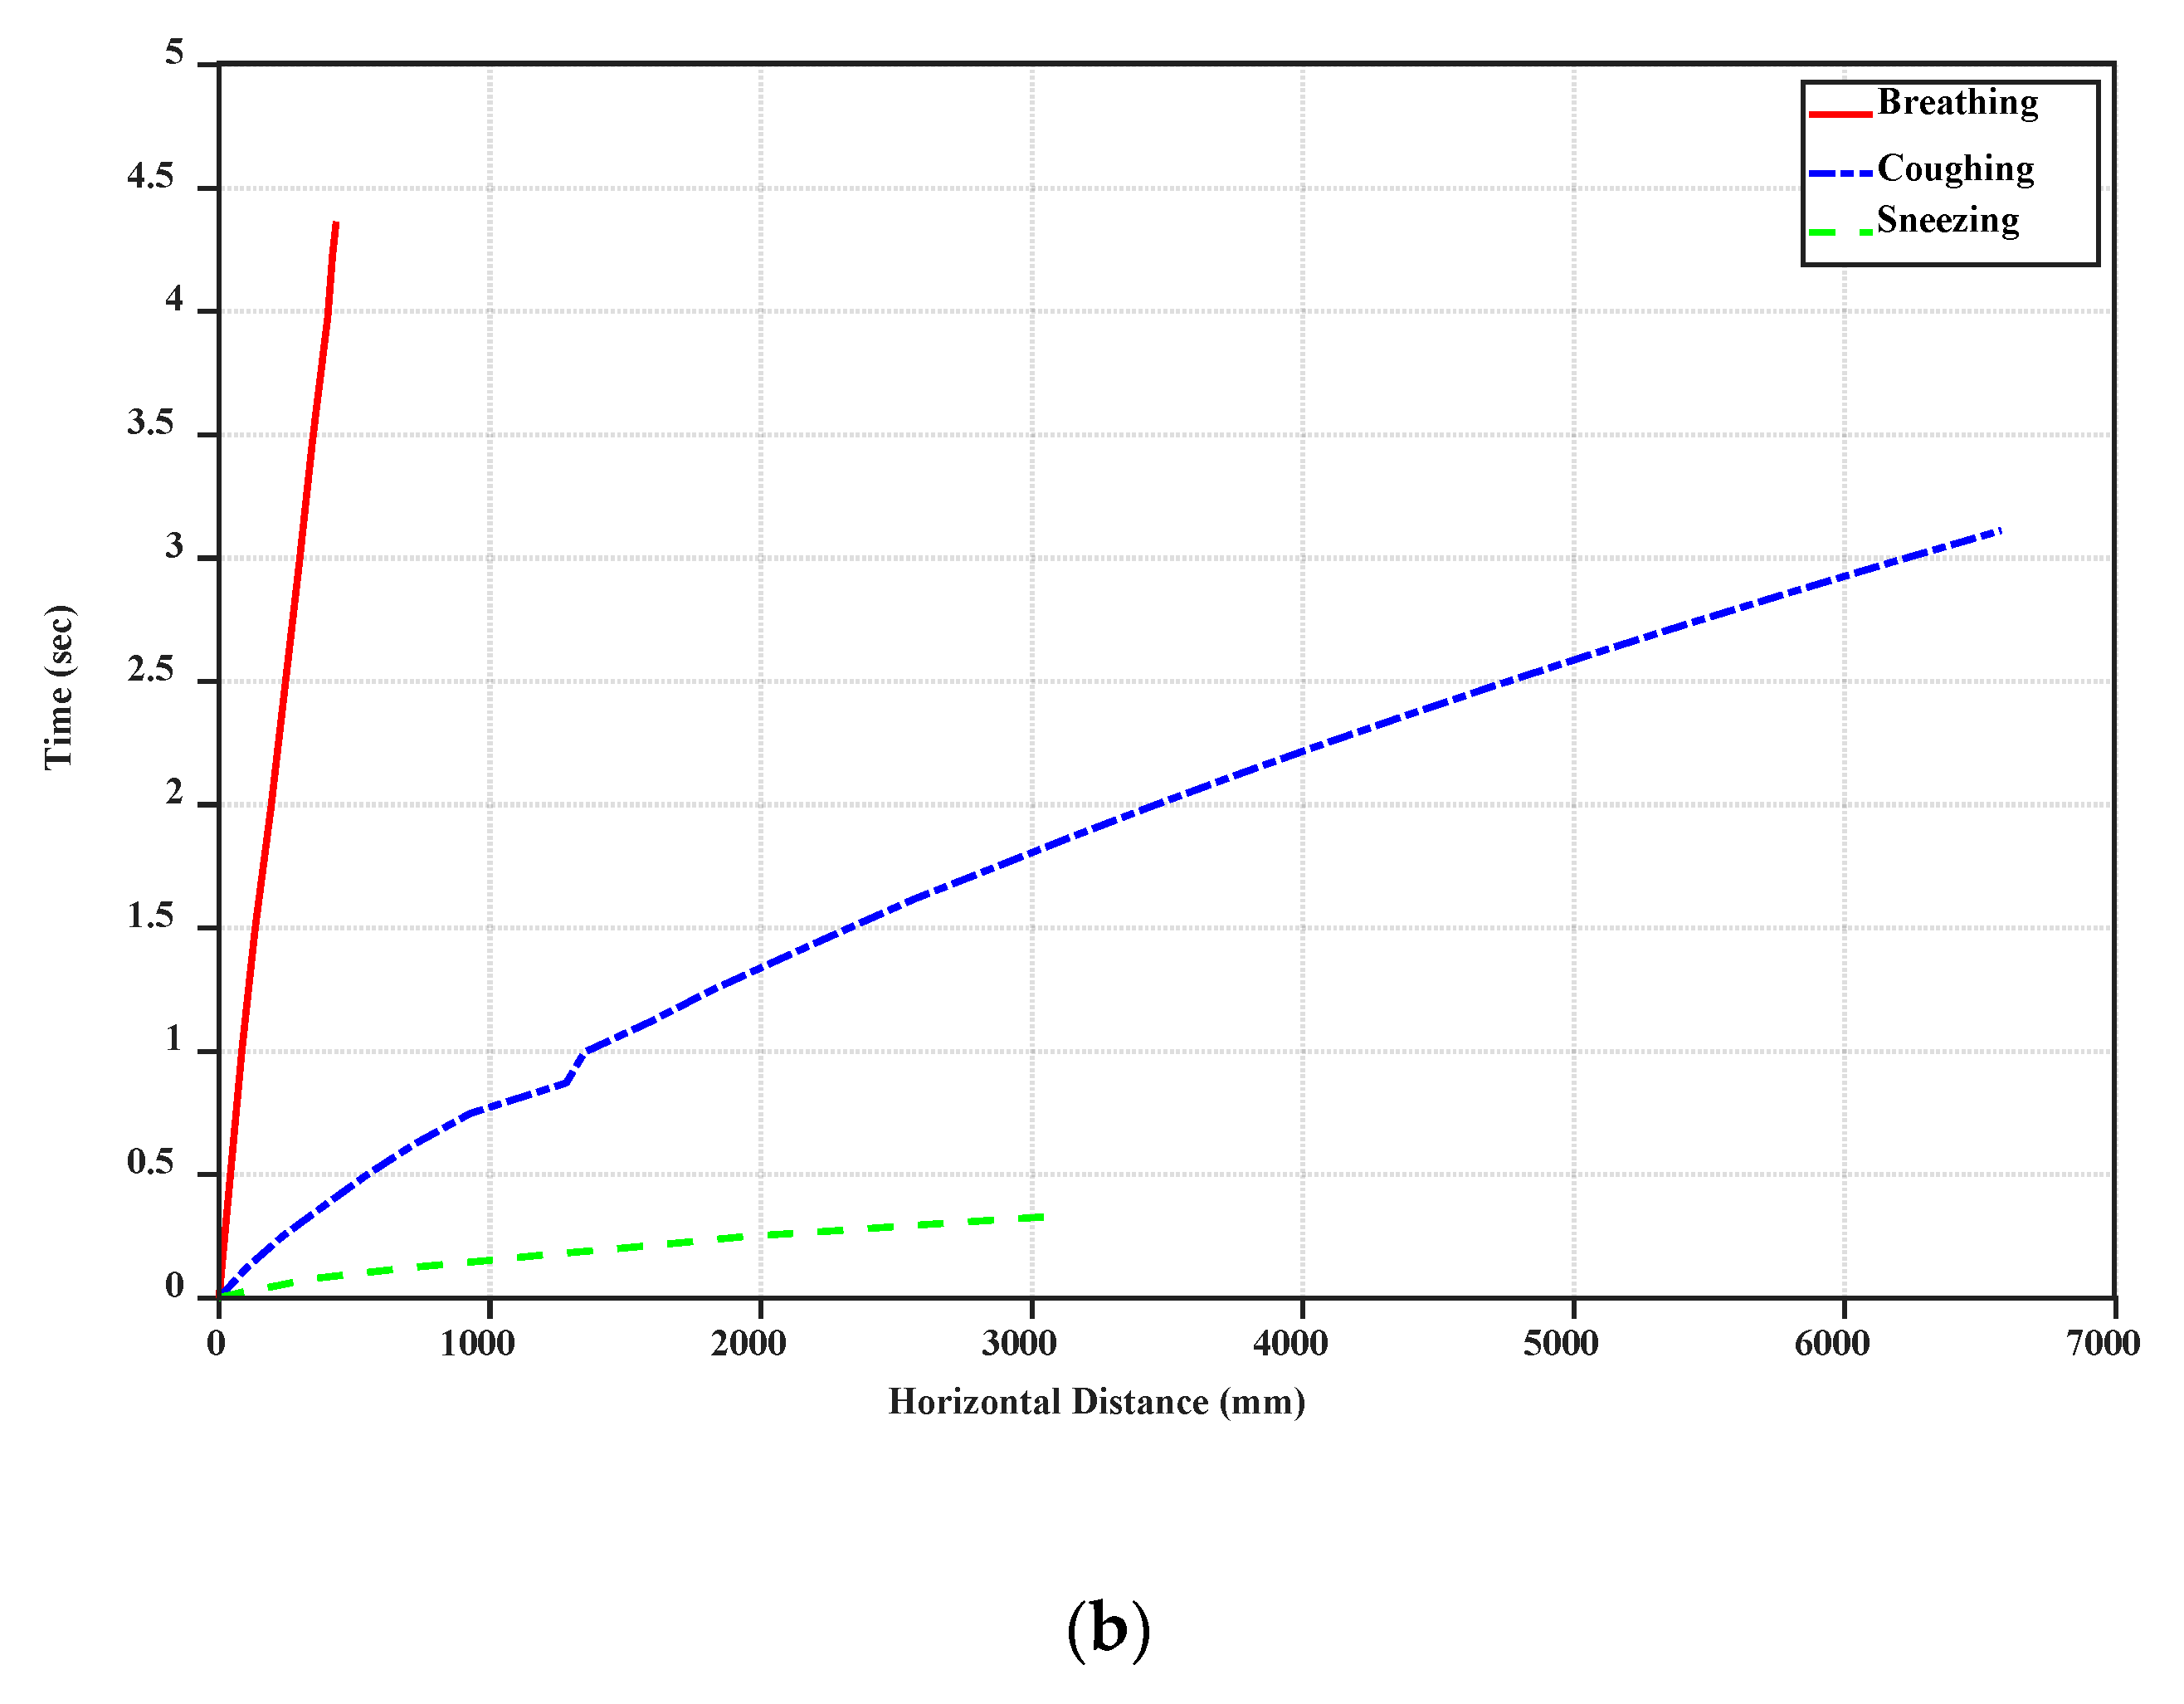
19] have prepared the SARS-COV-2 aerosols and have thoroughly analyzed them. They reported that the SARS-COV-2 virus can stay infectious for hours in aerosol droplets. This is why the COVID-19 droplets can stay long-lasting, when a person coughs or sneezes. Another crucial parameter in studying the behavior of COVID-19 droplets is the horizontal distance, along which a small droplet can travel. In
Figure 4, the horizontal distance for a single droplet is displayed for the cases of breathing, sneezing, and coughing. Based on our simulations, it can be seen that even though the velocity of breathing droplets is small (1 m/s), it takes longer time for these droplets to fall. However, they cannot be very widespread and fall to the ground within a shorter distance.
Furthermore, due to the high initial speed of sneezing and coughing droplets, they can travel along more considerable distances (near 6–7 m).
Figure 4 demonstrates that the big droplets generated by coughing can move horizontally more than the big droplets of breathing and sneezing at a specific time.
Table 2 shows the falling time and distance for each droplet. Accordingly, sneezing droplets move faster than the others. However, the big droplets generated by coughing stay in the air more than the others and travel along a large distance due to the initial speed of this case and if the small droplets generated from break up of big droplets in sneezing are ignored. Breathing droplets can travel along almost 0.4 m for a longer time than the others, which suggests that the virus and infection could be spread into the air via normal breathing.
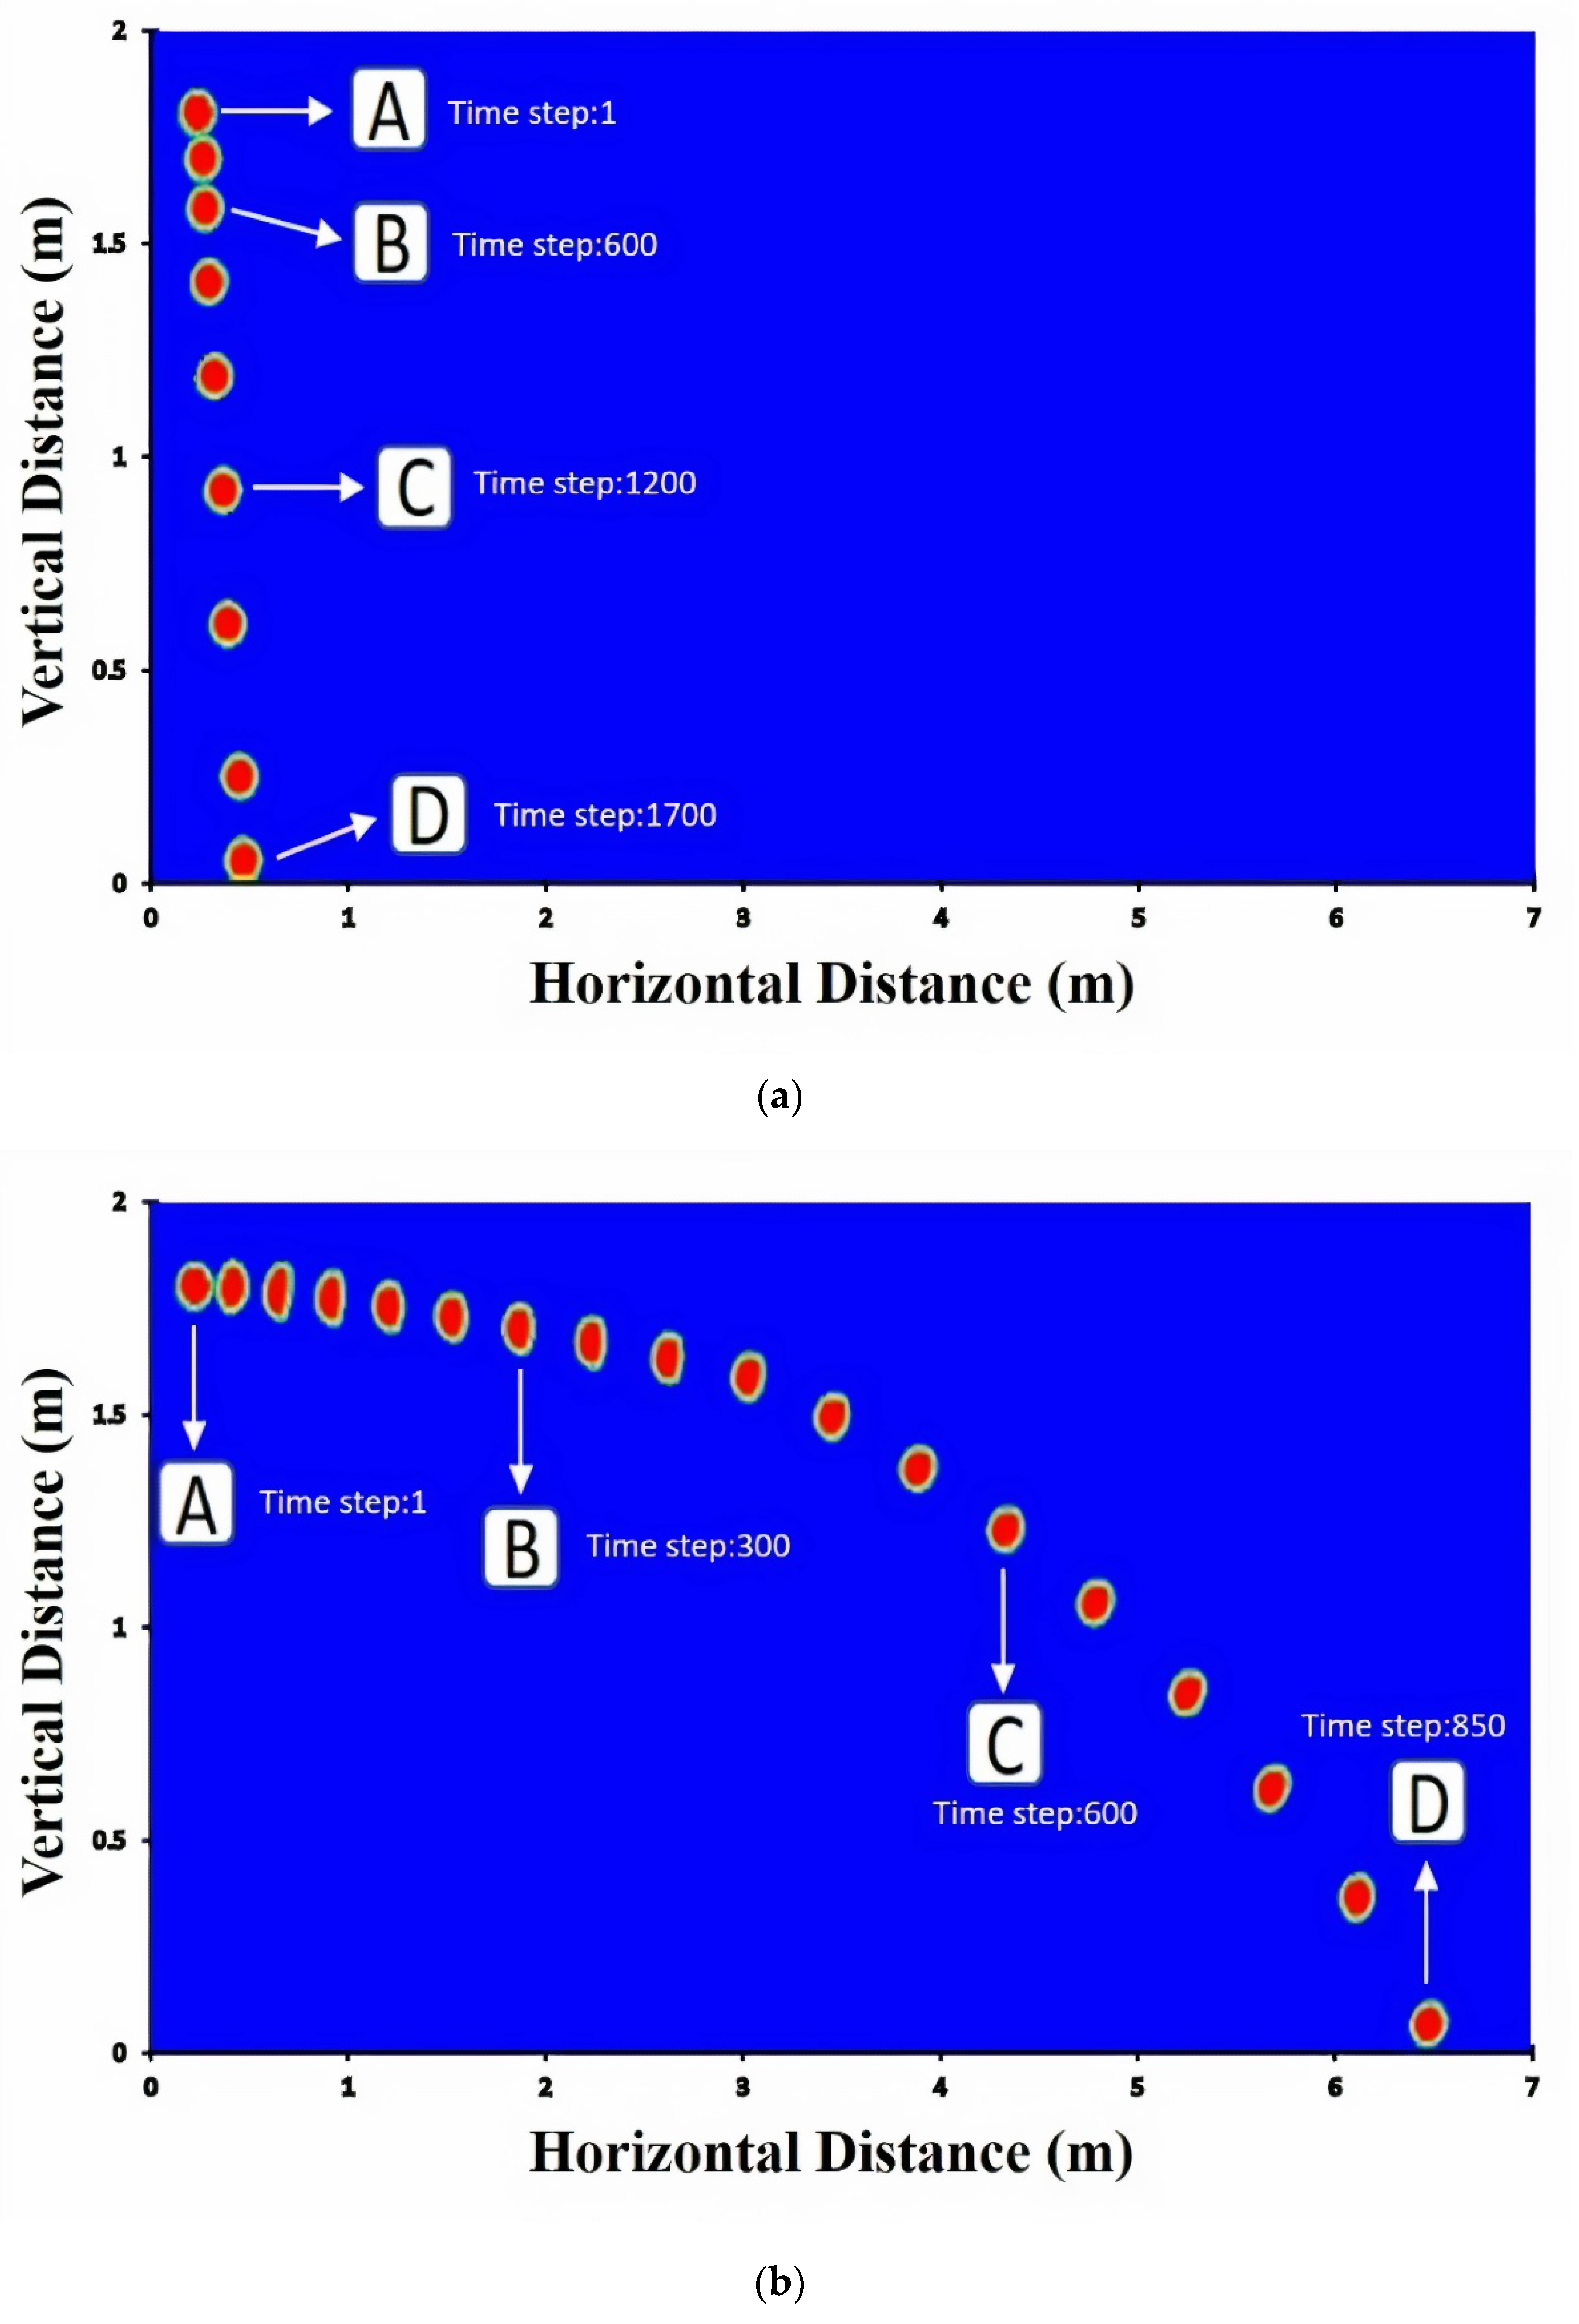
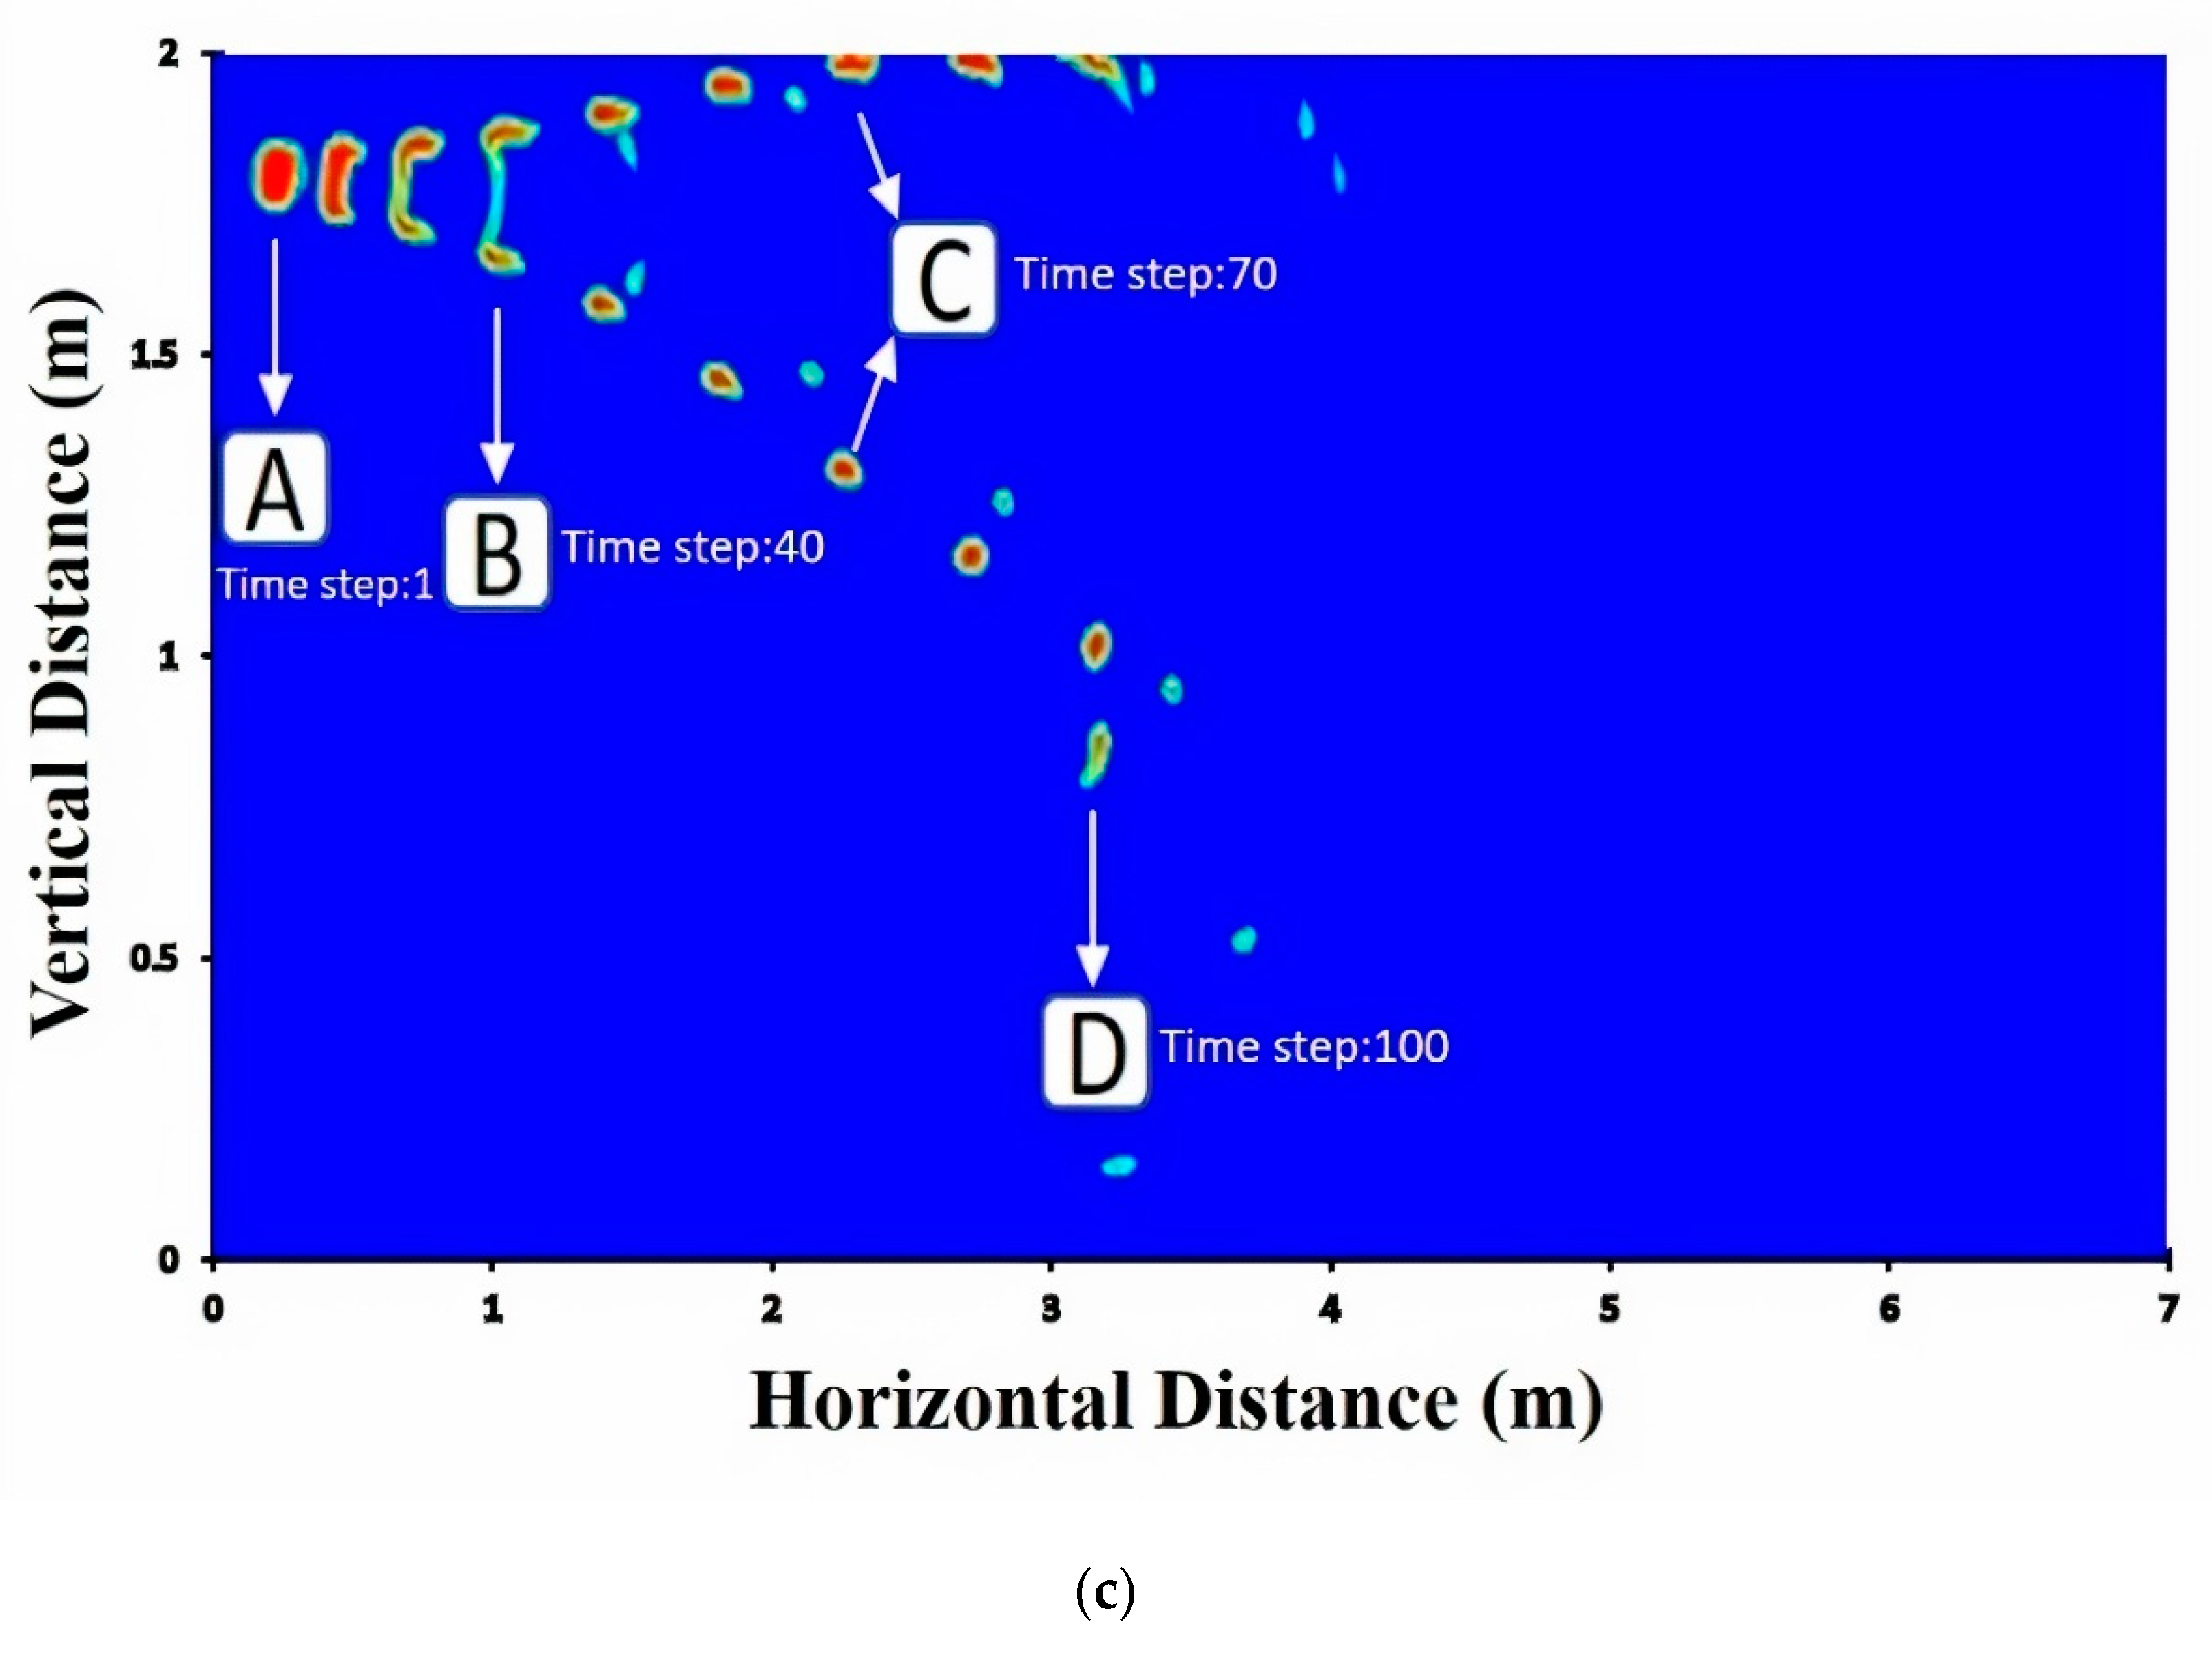
Figure 5a–c presents the droplet volume fraction profiles as a function of axial distance for the cases of breathing, coughing, and sneezing. No breakup occurs for droplets of breathing and smooth coughing (10 m/s speed), and the droplet moves forward without any change in their volume fraction. Breathing droplets travel along with a shorter distance than coughing and breathing droplets. Moreover, the diameter of droplets does not significantly change in falling. Even though droplets break up quickly and thoroughly to smaller droplets for sneezing, these small droplets of the virus, aerosols, can move along longer distances and can even elevate to higher heights, which indicates that the inertia and gravitational sedimentation are dominant for large droplets and do not have a substantial effect on smaller droplets. Thus, smaller droplets can stay more in the environment.
Social distancing for the protection against COVID-19 is not only for outdoor spaces but is also important for indoor spaces, where extremely complex flows form due to the presence of recirculatory flows driven by ventilation systems and anthropogenic thermally driven flow effects. While large droplets are mostly not affected by the cloud dynamics, small and medium-size droplets can be suspended in the turbulent cloud for a longer time by its circulatory flow, thereby significantly extending the travel distance. Therefore, droplet could travel in the air for a long time before falling into the ground. The social distancing in indoor environments could be complicated because of ventilation-system-induced air currents. The transport of droplet nuclei over more considerable distances is primarily driven by ambient flows, and indoor environments, such as homes, offices, malls, and public transport vehicles pose a particular challenge for disease transmission. The importance of ventilation in controlling air-borne transmission of infections is well known. However, indoor spaces can have extremely complex flows. In
Figure 5, four time-steps were selected and were denoted as A, B, C, and D to display the relevant streamlines in
Figure 6.
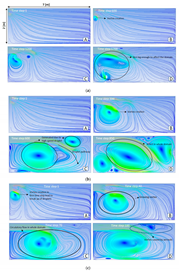
In
Figure 6, the results of velocity profiles for an indoor environment in a domain of 2 × 7 m
2 are plotted for the case of breathing, coughing, and sneezing at four time steps, namely A, B, C, and D, as marked in
Figure 5. In the case of breathing (
Figure 6a), the streamlines in front of the mouth do not change significantly, due to the very slow velocity of breathing. However, even in this case, the droplets containing coronavirus might come out of the mouth and be spread into the environment. The small vortices created by breathing droplets are shown in
Figure 6(aB–D). In
Figure 6b, the streamlines are shown for the coughing case. In comparison to breathing, the vortex is created at the second time step (B) and grows at the later time steps (C and D), which suggests that virus droplets can travel along a more considerable distance. When sneezing occurs (
Figure 6c), the small vortex forms at the first time step (A) and becomes larger at the next time steps. In this case, due to the high initial speed, the larger droplets divided into smaller droplets can stay in the air (D). As can be seen, the circulatory flow is obvious for the sneezing case, leading to the breakup of small particles, which are trapped in the vortex, are circulated in the room and stay longer in the air (C and D).
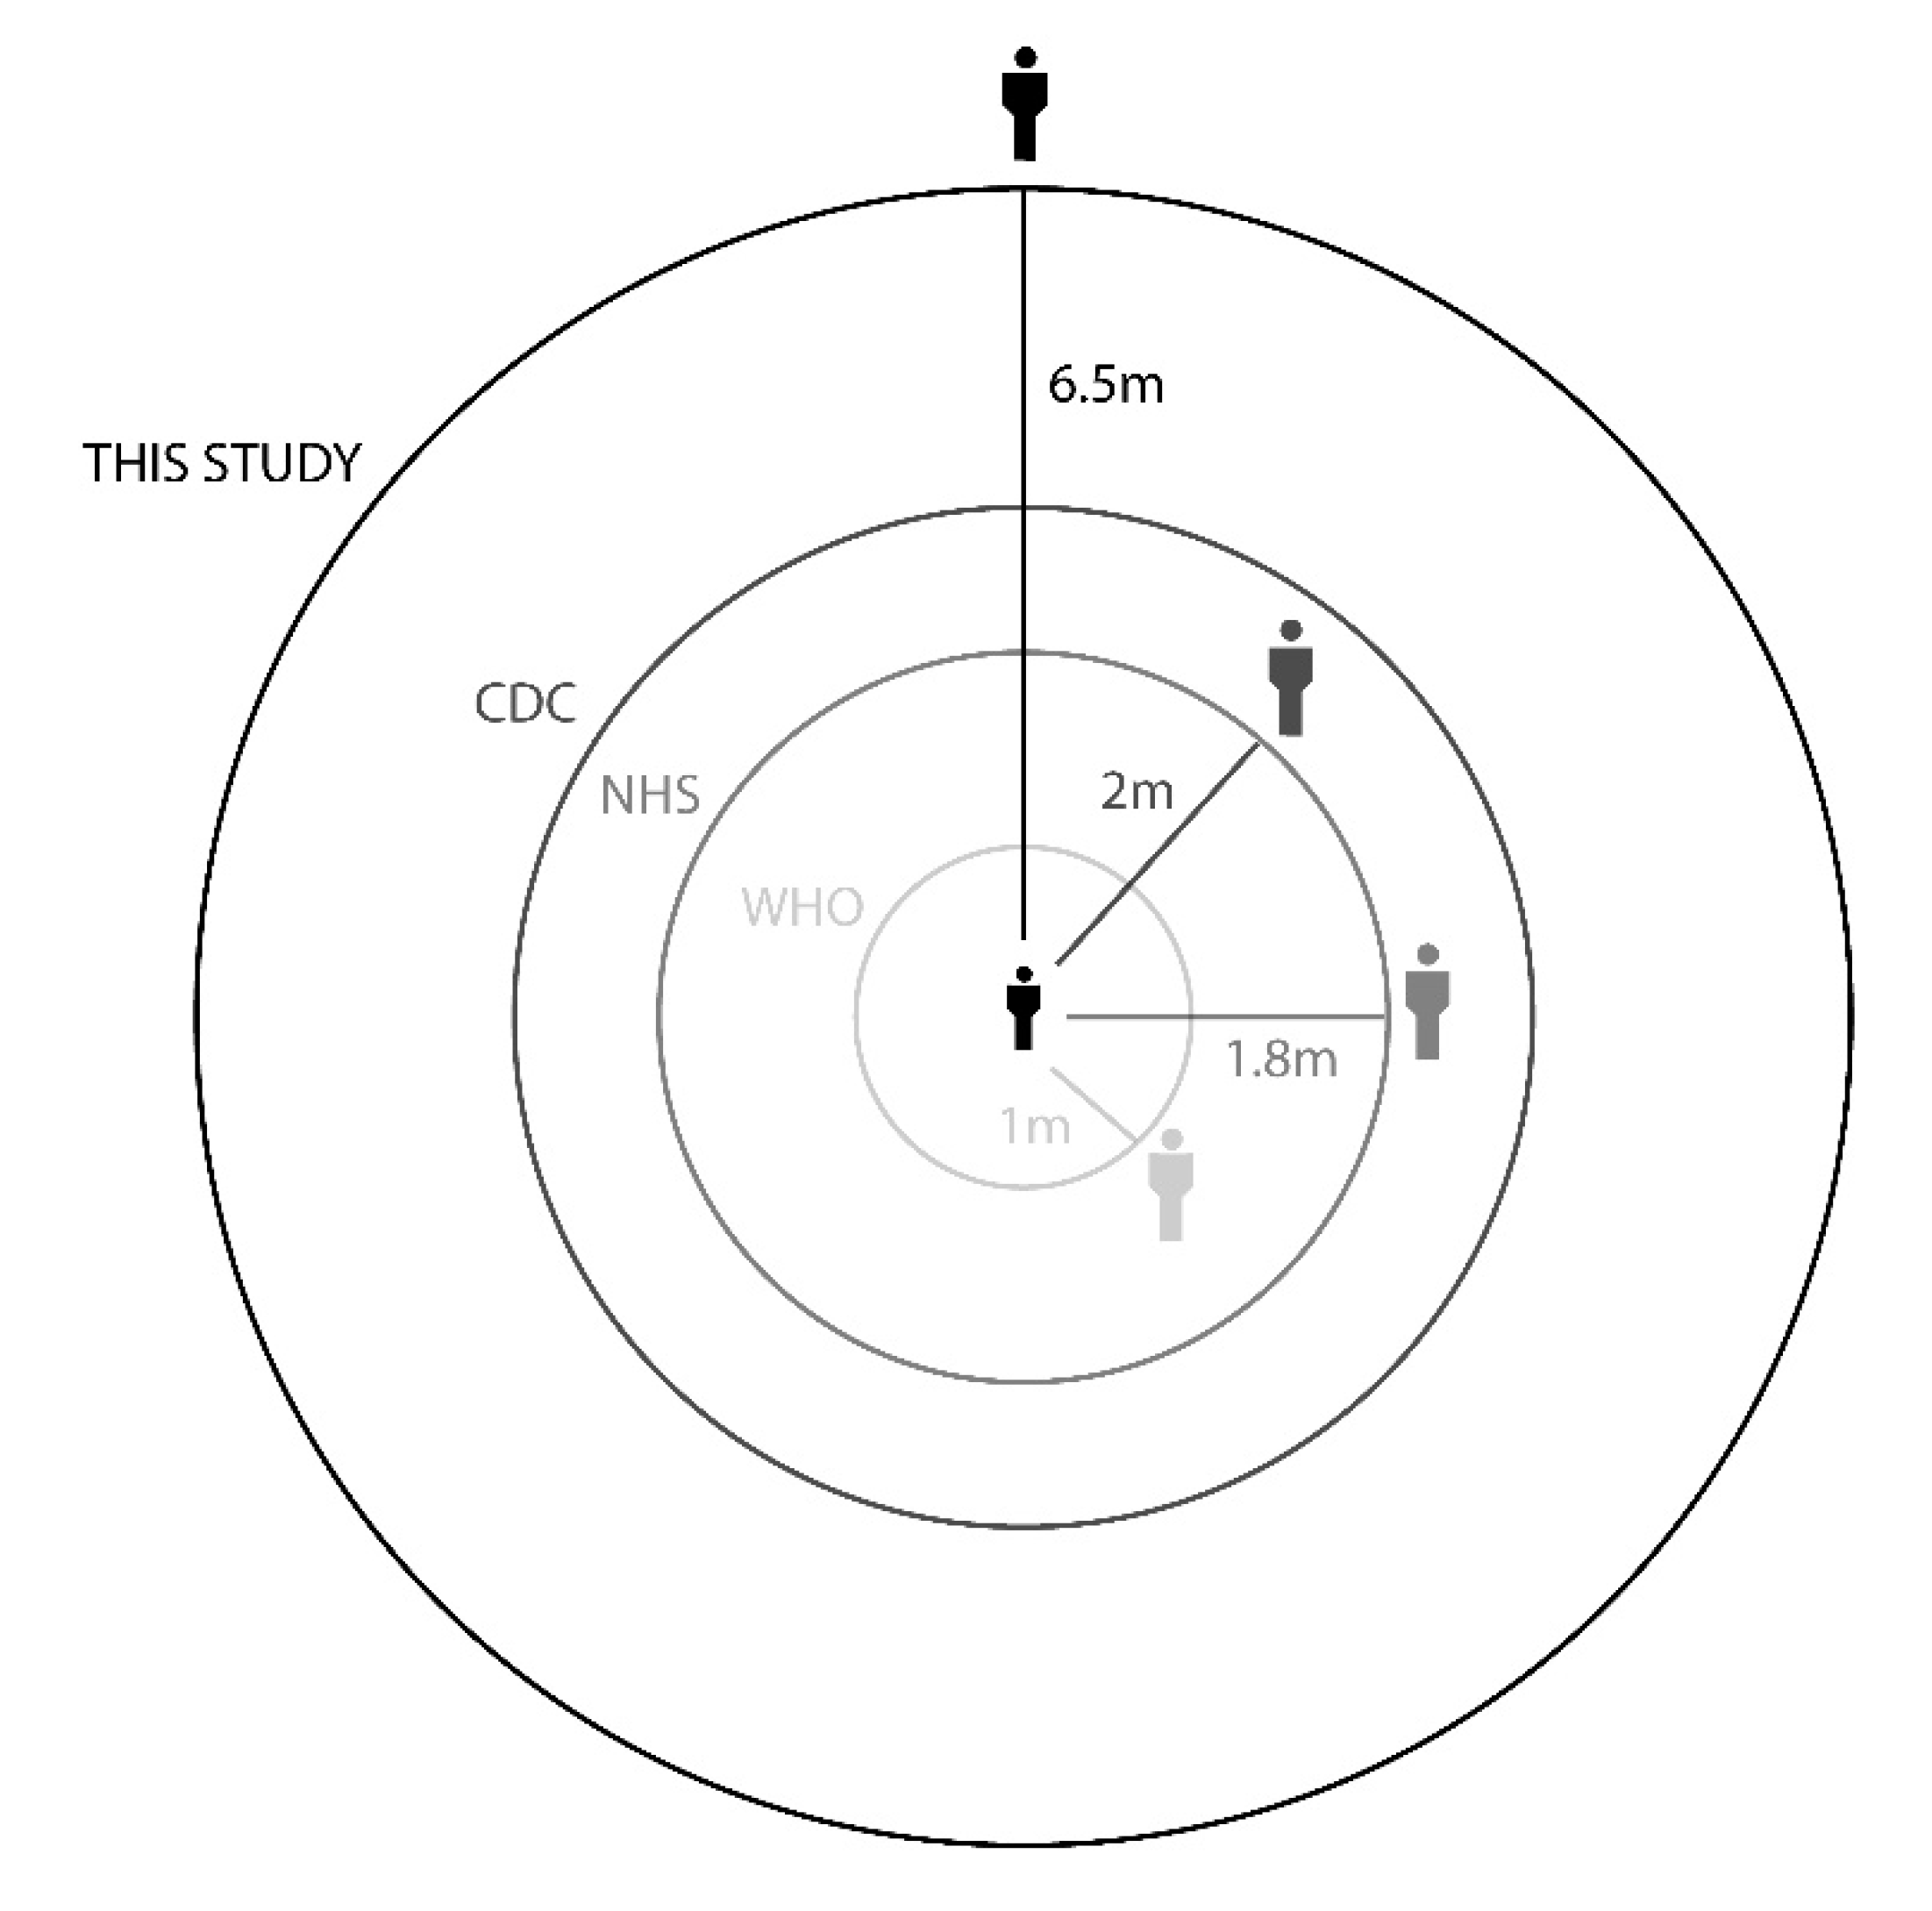
Our results show that the maximum droplet falling distance is 6.5 m for droplets generated by coughing, which implies that the exhaled droplet can move along 6.5 m before falling in an indoor environment without any flow stream. According to these results, the safe distance between persons should be more than 6.5 m to minimize the infection probability. This distance further increases when the infected person walks or runs. However, according to the guidelines issued by the WHO, this distance is reported as 1–2 m. As shown in
Figure 7, the recommended distances by different health organizations are far different from this study. From the obtained results, it is clear that the recommended distances should be revised according to major parameters, such as masks, location, source of droplets, and environmental conditions.
4. Conclusions
Within a short time, the COVID-19 virus has spread to many countries across the world. Sneezing, coughing, or even breathing make a person release tiny droplets containing the virus, often too tiny to see with the naked eye. The exposure happens by inhaling or by having the droplets on the hand and then contacting the mouth. Therefore, since the COVID-19 outbreak, many countries around the world have imposed "social distance" regulations between people. In this study, the behavior of droplets generated by an infected person, which contains coronavirus, was studied for the case of breathing, coughing, and sneezing. Based on our results, when an infected person breathes, the droplets move along a distance less than 1 m. However, when an infected person coughs or sneezes, the small droplets could be transported along 4 to 7 m. In addition, for sneezing, the drag force will make the droplets break down to the small droplets, which can move and stay in the environment for a long time. Moreover, in all cases, it takes around 4 seconds for large droplets to fall from a 1.8 m height. But aerosols, due to their very small size and weight, can stay longer in the environment. The aerodynamic effects caused by motion, such as walking fast, running, and cycling, will make this process more complicated. More experimental and numerical articles for different ventilation scenarios will further shed light on virus transmission. The distances reported in guidelines of health generations should carefully be revised, and the effect of the prevention method such as the use of a mask and the type of mask used on virus transmission via exhaled aerosols should be also considered in future studies.

 ,
, 


