Article

Influence of Oxidation Degree of Graphene Oxide on the Shear Rheology of Poly(ethylene glycol) Suspensions

by
Yago Chamoun F. Soares
1,
Elyff Cargnin
2,
Mônica Feijó Naccache
1,* and
Ricardo Jorge E. Andrade
2,*
1
Department of Mechanical Engineering, Pontificia Universidade Católica-RJ, Rua Marquês de São Vicente 225, Rio de Janeiro 22453-900, Brazil
2
Mackgraphe-Graphene and Nano-Material Research Center, Instituto Presbiteriano Mackenzie-SP, Rua da Consolação 896, São Paulo 01302-907, Brazil
*
Authors to whom correspondence should be addressed.
Fluids 2020, 5(2), 41; https://doi.org/10.3390/fluids5020041
Submission received: 28 February 2020 / Revised: 22 March 2020 / Accepted: 24 March 2020 / Published: 26 March 2020
(This article belongs to the Special Issue Advances in Experimental and Computational Rheology, Volume II)

Abstract

:
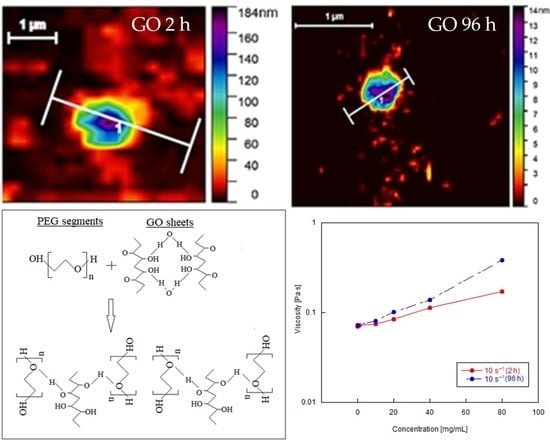
This work studies the influence of the concentration and oxidation degree on the rheological behavior of graphene oxide (GO) nanosheets dispersed on polyethylene glycol (PEG). The rheological characterization was fulfilled in shear flow through rotational rheometry measurements, in steady, transient and oscillatory regimes. Graphene oxide was prepared by chemical exfoliation of graphite using the modified Hummers method. The morphological and structural characteristics originating from the synthesis were analyzed by X-ray diffraction, Raman spectroscopy, thermogravimetric analysis, Fourier transform infrared spectroscopy, and atomic force microscopy. It is shown that higher oxidation times increase the functional groups, which leads to a higher dispersion and exfoliation of GO sheets in the PEG. Moreover, the addition of GO in a PEG solution results in significant growth of the suspension viscosity, and a change of the fluid behavior from Newtonian to pseudoplastic. This effect is related to the concentration and oxidation level of the obtained GO particles. The results obtained aim to contribute towards the understanding of the interactions between the GO and the polymeric liquid matrix, and their influence on the suspension rheological behavior.

Graphical Abstract

1. Introduction

Graphene was first obtained and characterized in 2004 by two Russian researchers that used the mechanical exfoliation technique to peel a graphite plate and obtain fine graphene flakes [1]. Later, the study of different syntheses of graphene was expanded [2]. Graphene is made up of a two-dimensional network of carbon atoms with sp2 hybridized, with a very high surface area, and the same hexagonal arrangement as graphite [3,4,5,6]. However, it consists of a single flat layer of carbon atoms, while graphite represents stacks of graphene sheets.
Due to its excellent electronic, mechanical, thermal, and optical properties, many studies about graphene have been developed, and its applicability has been increasing in several industrial sectors [7,8,9]. Although it has excellent properties and numerous applications, there are still some challenges to obtain large quantities of graphene with lower costs and higher structural quality (high purity). This fact has led to the necessity to study and analyze different processes of synthesis [10].
In this work, the synthesis was made by chemical exfoliation. This method is based on the oxidation of graphite, with the addition of oxygenated groups that increase the interplanar distance among the layers, which turns the sp2 carbons of the lamellae into sp3, forming the graphite oxide (GrO) [11]. These oxygenated portions introduce a hydrophilic character to the material, making it easier to disperse in water [12]. Using an ultrasound bath, GrO’s three-dimensional structure exfoliate into graphene oxide (GO) sheets. Figure 1 shows the schematic model of a graphene oxide sheet formation.
Graphene oxide has some advantages over graphene, such as better solubility, stability and better dispersion in water and other organic solvents, due to oxidation that turns hydrophobic particles into hydrophilic ones. On the other hand, its electrical conductivity is lower because the functional groups that are inserted contain oxygen, which deactivate double bonds and reduce the conductivity [13,14,15]. The oxidation process is very important in the exfoliation and dispersion of GO in polymeric matrices. The degree of oxidation is directly connected to the spacing between layers and to the presence of the functional groups developed on the GO sheets [16]. In turn, exfoliation depends on the level of attraction between layers and on the strength of the reaction that occurs between the layers and the solvent.
Since graphene oxide was first obtained, many researches on its thermal and electric properties have been conducted [17]. However, few studies have been carried out on the rheological properties of graphene oxide suspensions. The complete study of the mechanical behavior of these suspensions is necessary to determine their applications and to optimize industrial processes. The addition of nanoparticles to the base fluid, apart from increasing thermal conductivity, may change the rheological, tribological and mechanical properties of the fluid [18,19,20,21]. Rudyak (2013) showed that nanofluids may not follow the classical Einstein’s relation for viscosity. He observed that the viscosity changes with the particles size [22,23]. Thus, it was possible to conclude that the viscosity of nanofluids depends not only on the surface chemistry, shape or volume concentration of the nanoparticles, but also on their size and concentration [24]. These factors strongly affect the morphology of a suspension of nanoparticles changing the interaction between particles/aggregates due to attractive Van der Waals force [25]. The nanoparticles, as is the case of graphene oxide, can also form clusters with the polymeric chains, which can lead to further increase of the viscosity of the suspension [26].
Naficy et al. (2014) studied the viscoelastic behavior of GO dispersions in water, and concluded that at extremely low concentrations, GO sheets are randomly dispersed in the fluid. As concentration increases, some nematic orders begin to appear, and the storage modulus (G′) increases and exceeds the loss modulus (G″), while the loss modulus remains almost constant with frequency. This can be attributed to the increase in the volumetric fraction of colloidal particles that gives elasticity to the system. An additional increase in concentration results in greater packaging of the nematic phase [27]. Giudice and Shen (2017) also performed the shear rheological characterization of graphene oxide aqueous dispersions. They concluded that a critical concentration exists, below which GO sheets are dispersed, and above which they self-organize. To analyze the responses obtained, the Peclet number (Pe) was evaluated to determine whether the dominant mechanism is Brownian diffusion or convection. In steady-state tests above the critical concentration and at low Pe, GO sheets self-aggregate, while at high Pe, such aggregates dissociate. Moreover, the transient results showed that GO dispersions act as thixotropic fluids [28].
Shu et al. (2015) investigated the effects of graphene oxide and PEG concentrations in pure water on the shear rheological behavior of GO/PEG aqueous dispersion. They concluded that GO aqueous dispersions changed from Newtonian behavior to pseudoplastic as GO concentration increases, and that the critical concentration of isotropic-nematic phase transition was around 6 mg/mL. For the GO/PEG aqueous dispersions, they stated that for all concentrations tested, the viscosity of dispersions decreases with increasing shear rate, and as long as the PEG concentration increases, the viscosity value firstly decreases, and then increases again. This can be explained by the fact that the pure concentrated aqueous GO dispersion is in the liquid crystal phase and, when adding PEG, its chains are adsorbed into the GO sheets, decreasing the viscosity of the aqueous dispersions of GO/PEG. This phenomenon suggests that there is an attractive interaction in the GO/PEG dispersion. Increasing the concentration of PEG increases the strength of the attraction interaction, thereby increasing viscosity [29].
This work aims to study the rheological behavior of a suspension of graphene oxide nanoparticles in a polymeric matrix. Most studies in the literature present the rheological behavior of graphene/polymer nanocomposites focusing on graphene processed from graphene oxide (GO) dispersed in some common solvents such as water. However, there are few reports that aimed the study of obtaining graphene oxide dispersed directly in a liquid polymeric matrix, as will be the focus of this work. It is important to refer as well that some works have analyzed GO suspended in water and GO aqueous suspension in polyethylene glycol (PEG). However, to the best of authors knowledge, none of them addressed the rheological behavior of GO suspended with different degrees of oxidation. Taking that into account, this work intends to analyze the shear rheological behavior of GO suspended in PEG with different concentrations and levels of oxidation.

2. Materials and Methods

2.1. Materials

The products and reagents used for the graphene oxide production were: Graphite powder < 45 µm > 99.99%, Sulfuric Acid (H2SO4) 99%, Potassium Permanganate (KMnO4) and Polyethylene Glycol Mw 400 g/mol (all provided by Sigma-Aldrich); Ethanol (C2H5OH), hydrochloric Acid (HCl, ACS reagent 37%) and hydrogen peroxide (H2O2, 30% m/m) (provided by Synth). The deionized water was supplied by PUC-Rio.

2.2. Preparation of Graphene Oxide Suspensions

The graphene oxide used in this work was synthesized by the modified Hummers method [30]. Several samples with different concentrations of GO were prepared. In a 500 mL round bottom flask, 1.0 g of graphite (Gr) powder and 60mL of concentrated sulfuric acid were added. This reaction is performed under low temperature (emerged in an ice bath) and under stirring at a frequency of 500 Hz for 15 min by a medium goldfish magnetic stirrer. Then, 3.5 mg of potassium permanganate (KMnO4) was slowly added for 15 min, since this reaction is extremely exothermic with a very high kinetic velocity. The purpose of adding these reagents is to expand the structure and oxidize the surface of the graphite sheet due to the presence of oxygenated functional groups. In the end, the system was removed from the ice bath and stirred until the desired oxidation time. The oxidation times used in this work were equal to 2 h and 96 h.
After graphite oxidation, 200 mL of deionized water was slowly added, and the system returned to the ice bath. Then, to stop the reaction, aqueous hydrogen peroxide solution was gradually added until the reaction stopped bubbling so that the flask could be removed from the ice bath and allowed to stand for 12 h.
After decantation the supernatant was discarded and, using a vacuum pump to accelerate the filtration process, the product obtained was washed with deionized water to remove the salts that were still present; aqueous hydrochloric acid solution was used to remove the metal ions; and ethanol to remove the organic residues. To obtain the graphite oxide (GrO) with 2 h of oxidation, the washing process took on average one day, while for obtaining the GrO with 96 h of oxidation, this process took an average of 3 weeks.
Before the product was macerated, it was placed in the vacuum oven for a period of 12 h to remove any remaining humidity. With the intention of preparing the colloidal graphene oxide (GO) suspensions with concentrations ranging from 0.1 mg/mL to 80 mg/mL, as shown in Table 1, the macerated graphite oxide was first dispersed in polyethylene glycol and then exfoliated in ultrasonic bath for a period of 4 h, for both levels of oxidation.

2.3. Characterization of Graphite, Graphite Oxide (GrO) and Graphene Oxide (GO)

Several tests were performed to obtain the characterization of graphite, GrO, and GO. The Rigaku MiniFlex II diffractometer determined the material diffraction by the X-ray diffraction (XRD) technique, with the samples powdered at room temperature, using λCuKα and monochromator radiation, varying the scanning at angles of 5° to 50°, with a rate of 2° per minute and fixed slots with 30 kV, 15 mA.
The Alpha 300 R Raman spectrometer (Witec) was used to evaluate the hybridization state of carbon. It was calibrated with a silicon (Si) waffer, integration time of 0.25 s, 50× objective lens and 532 nm laser, and with a grating refraction index of 600 g/mm (grades per millimeters). The sample was obtained by diluting 1 mg of GO in 1 mL of deionized H2O dropping one drop of the solution onto the silicon oxide substrate.
The SDT-Q600 (TA Instrument) was used for the thermogravimetric analysis of graphite oxide powder. The loss of mass is measured as a function of temperature, while the sample is heated from 25 °C to 1000 °C, with a rate of 10 °C per minute under O2 atmosphere.
The Bruker Vertex 70 Fourier Transform Infrared Spectrometer was used to obtain the absorption spectrum (FTIR), recorded in the wavenumber range of 750–3500 cm−1. The sample was obtained from dilute solutions of graphene oxides prepared with a concentration of 1 mg/mL in deionized H2O, and pH > 5. The solution was dripped on a silicon oxide (SiO2) wafer and after dried the samples were analyzed.
The sheets dimensions and thickness of the GO were obtained by Atomic Force Microscopy, AFM, using the Bruker Model Icon Dimension Microscope with probe, with the tip covered with Si. A resolution of 512 lines with 512 points was captured with Scan Asyst mode in the areas of each image. The samples were prepared from the dilution of 1mg/mL to 0.005 mg/mL of deionized H2O and previously sonicated for 4 h. It was not possible to perform the AFM for the graphite, because its particles are in the order of 45 micrometers, which is above the upper limit of the microscope, equal to 3 micrometers.

2.4. Rheological Measurements

The rotational rheometer Physica MCR501 (Anton-Paar) with cone-plate geometry was used to analyze the rheological behavior of the suspensions with different GO concentrations. The cone-plate geometry consists of a conical shaped body and a planar circular plate (60 mm diameter and 0.057 mm gap). The angle of the conical body is equal to 6°. The double-gap geometry was also used to obtain comparative data, but in the Physica MCR301 rotational rheometer (Anton-Paar). MCR501 and MCR301 are stress-controlled rheometer. A protective cap is used above the geometry during the tests to avoid solvent evaporation. Each test was repeated at least three times to confirm its reproducibility.
For fluid homogenization, the suspensions were kept under stirring on a magnetic stirrer for 15 min with a constant frequency of 1000 Hz before starting any rheological measurement.
Prior to the measurement, the temperature equilibrium of the samples was set up at 20 °C for 5 min. The flow curves of the PEG suspensions were performed by ranging the shear rate from 1000 s−1 to 0.1 s−1. The flow curve was evaluated decreasing the shear rates from the highest to the lowest, since the time to reach the steady state is lower [31]. In order to verify the hysteresis of the curves, tests were also performed, starting from the lowest to the highest rates.
The stability of the suspensions was evaluated as follows: first the flow curve was obtained for all concentrations without shaking them, and then the samples were agitated, and new flow curves were generated and compared to the previous ones.
Dynamic strain sweeps were performed at a fixed frequency of 1 Hz ranging the strain from 10% to 10,000%, to determine the linear viscoelastic region (LVR) of the suspension and to verify the predominance of viscous or elastic effects. Moreover, dynamic frequency sweeps were conducted from 0.1 Hz to 100 Hz, to investigate the structure of the suspensions at a constant shear stress value obtained at LVR.

3. Results and Discussion

3.1. Structural Characterization of Graphene Oxide

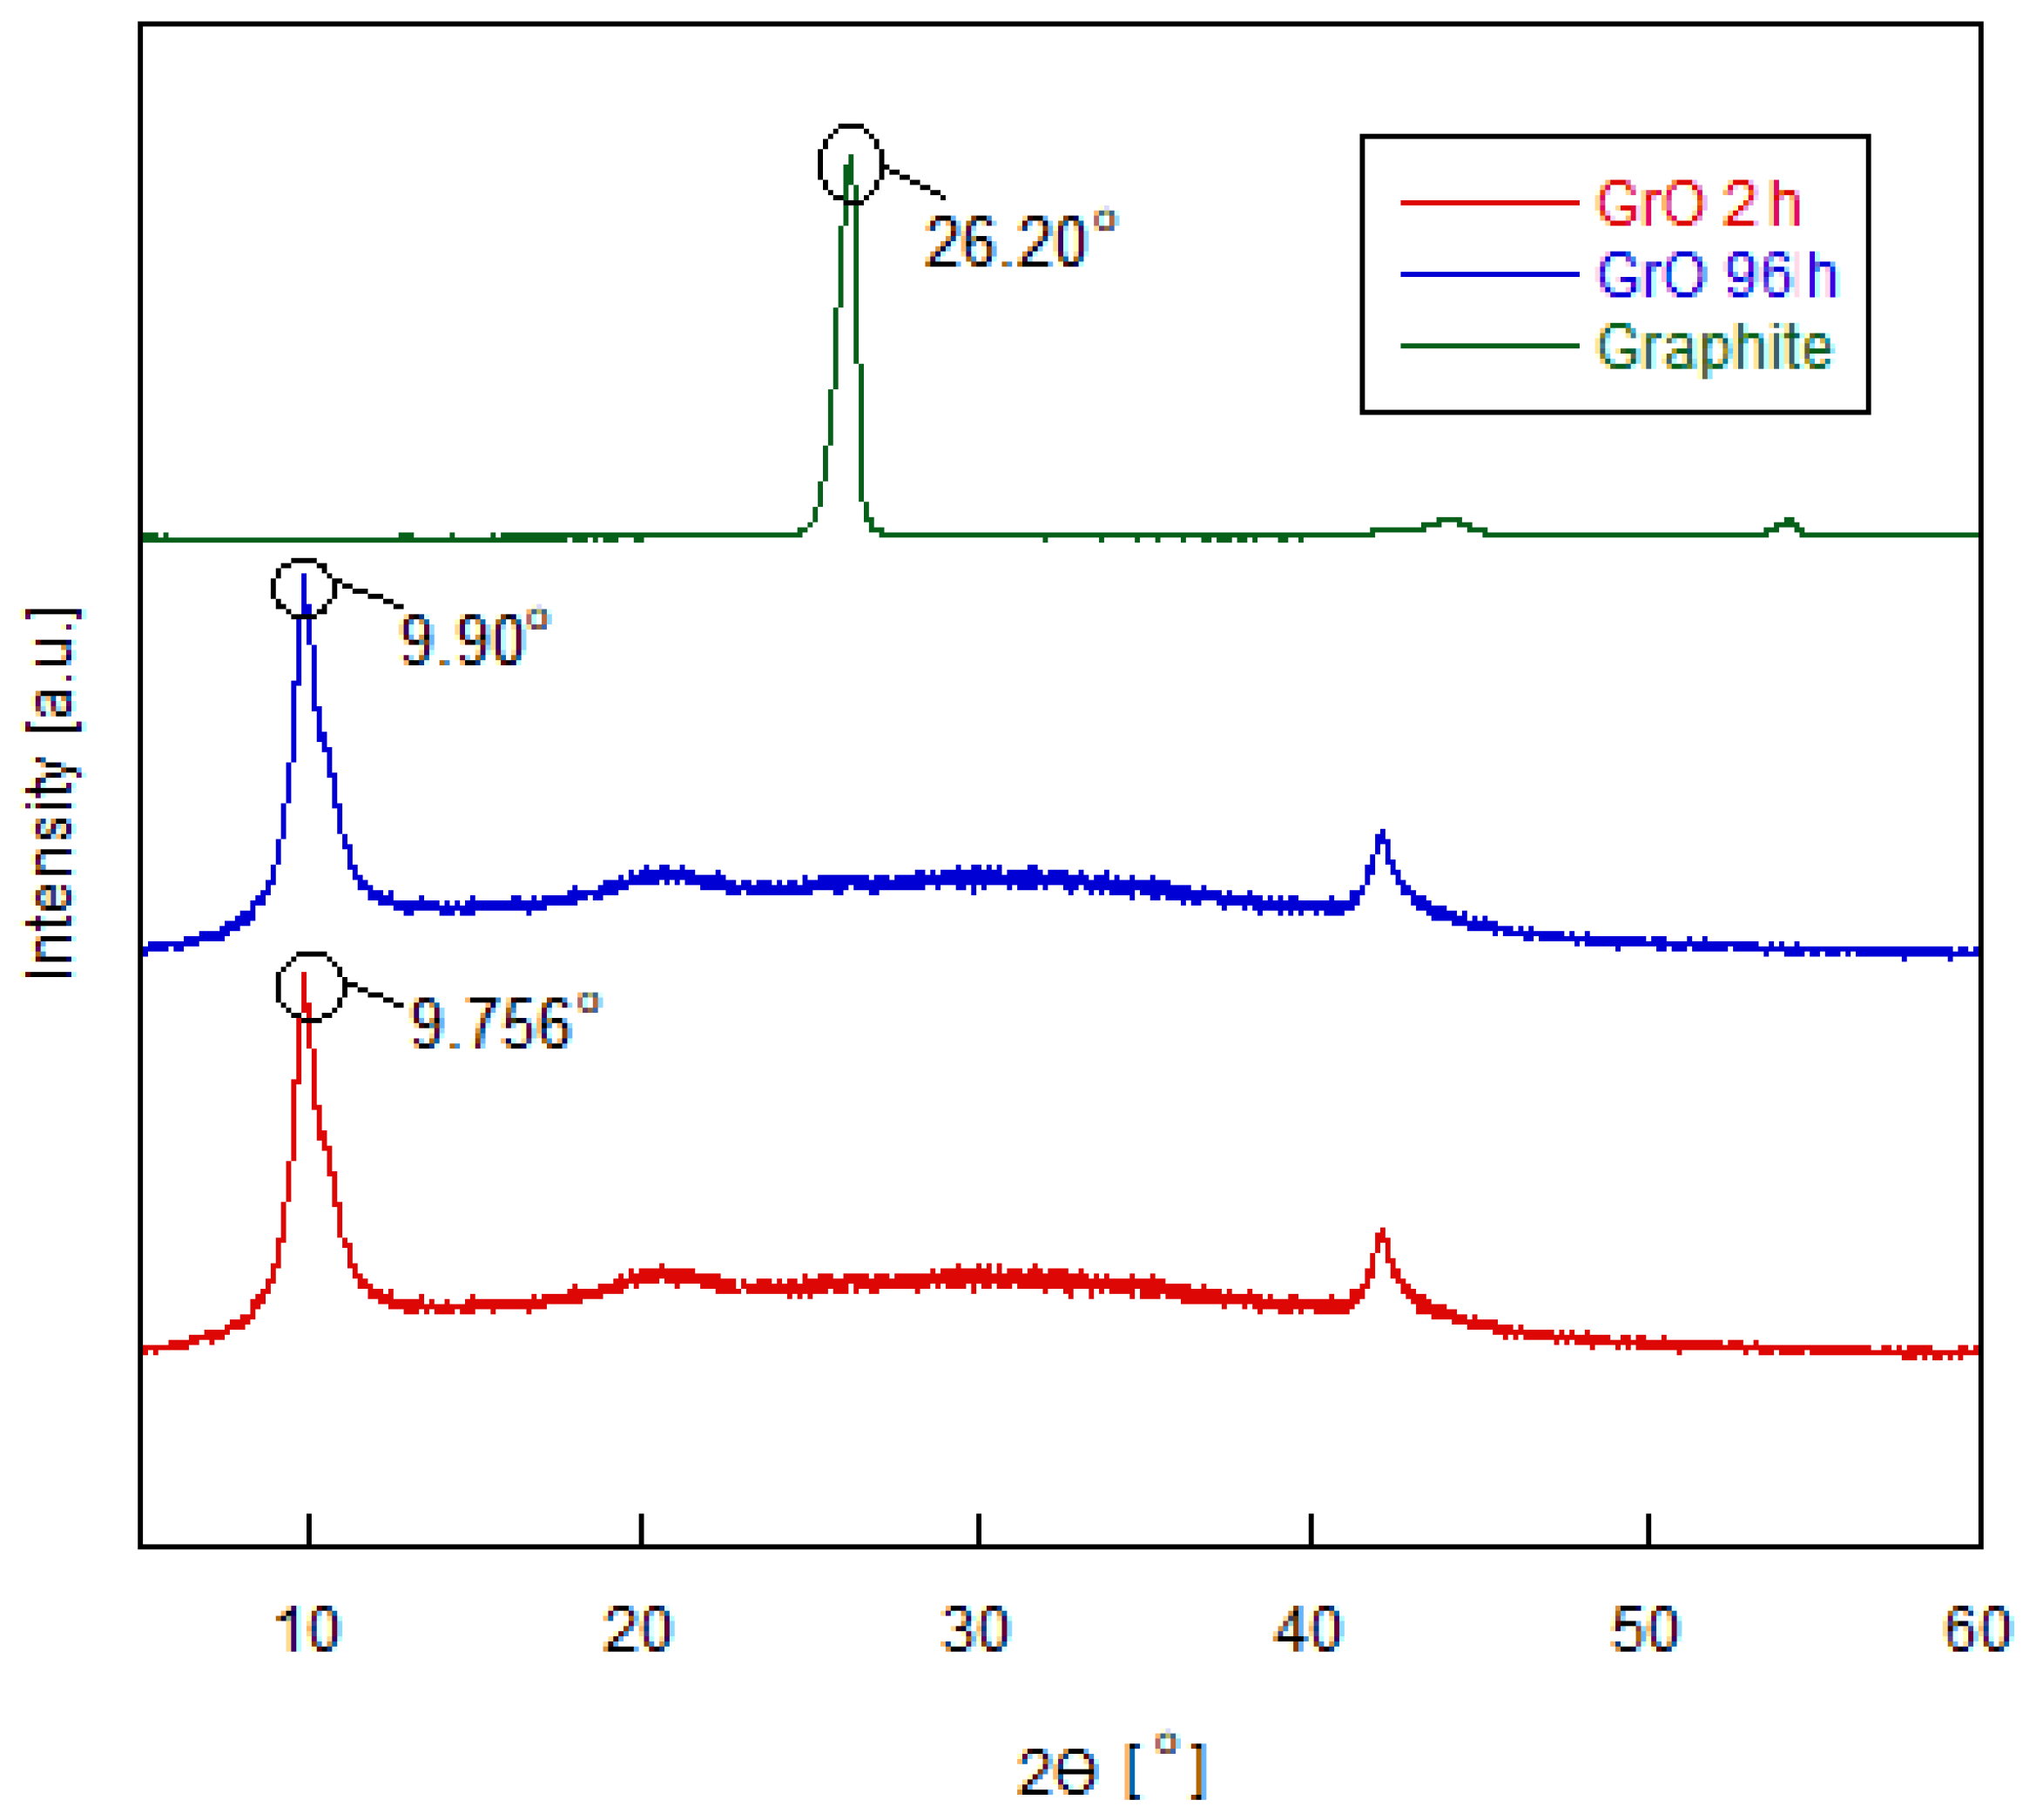
Figure 2 shows the XRD patterns of primitive graphite and graphite oxide (GrO) of 2 h and 96 h of oxidation. The pristine graphite presents characteristic peaks at the 2θ = 26.2° relative to the (002) plane. Upon its oxidation, the XRD pattern for GrO displays a new shifted peak at 2θ = 9.90° and 2θ = 9.756° for GrO 2 h and GrO 96 h, respectively, indicating an increase in the d-spacing. The values of 2θ and d-spacing for graphite and graphite oxide layers were achieved by fitting the curves according to Bragg’s Law [32]. It can be observed that the d-spacing increase from 0.312 nm (Gr) to 0.895 nm (GrO 2 h) and 0.907 nm (GrO 96 h) due to the presence of oxygen functional groups, such as −OH and −COOH, obtained from the oxidation process [33]. The higher d-spacing obtained for the GrO 96 h is due to the higher oxidation time, which led to an increase in functional groups developed in the material structure [34].
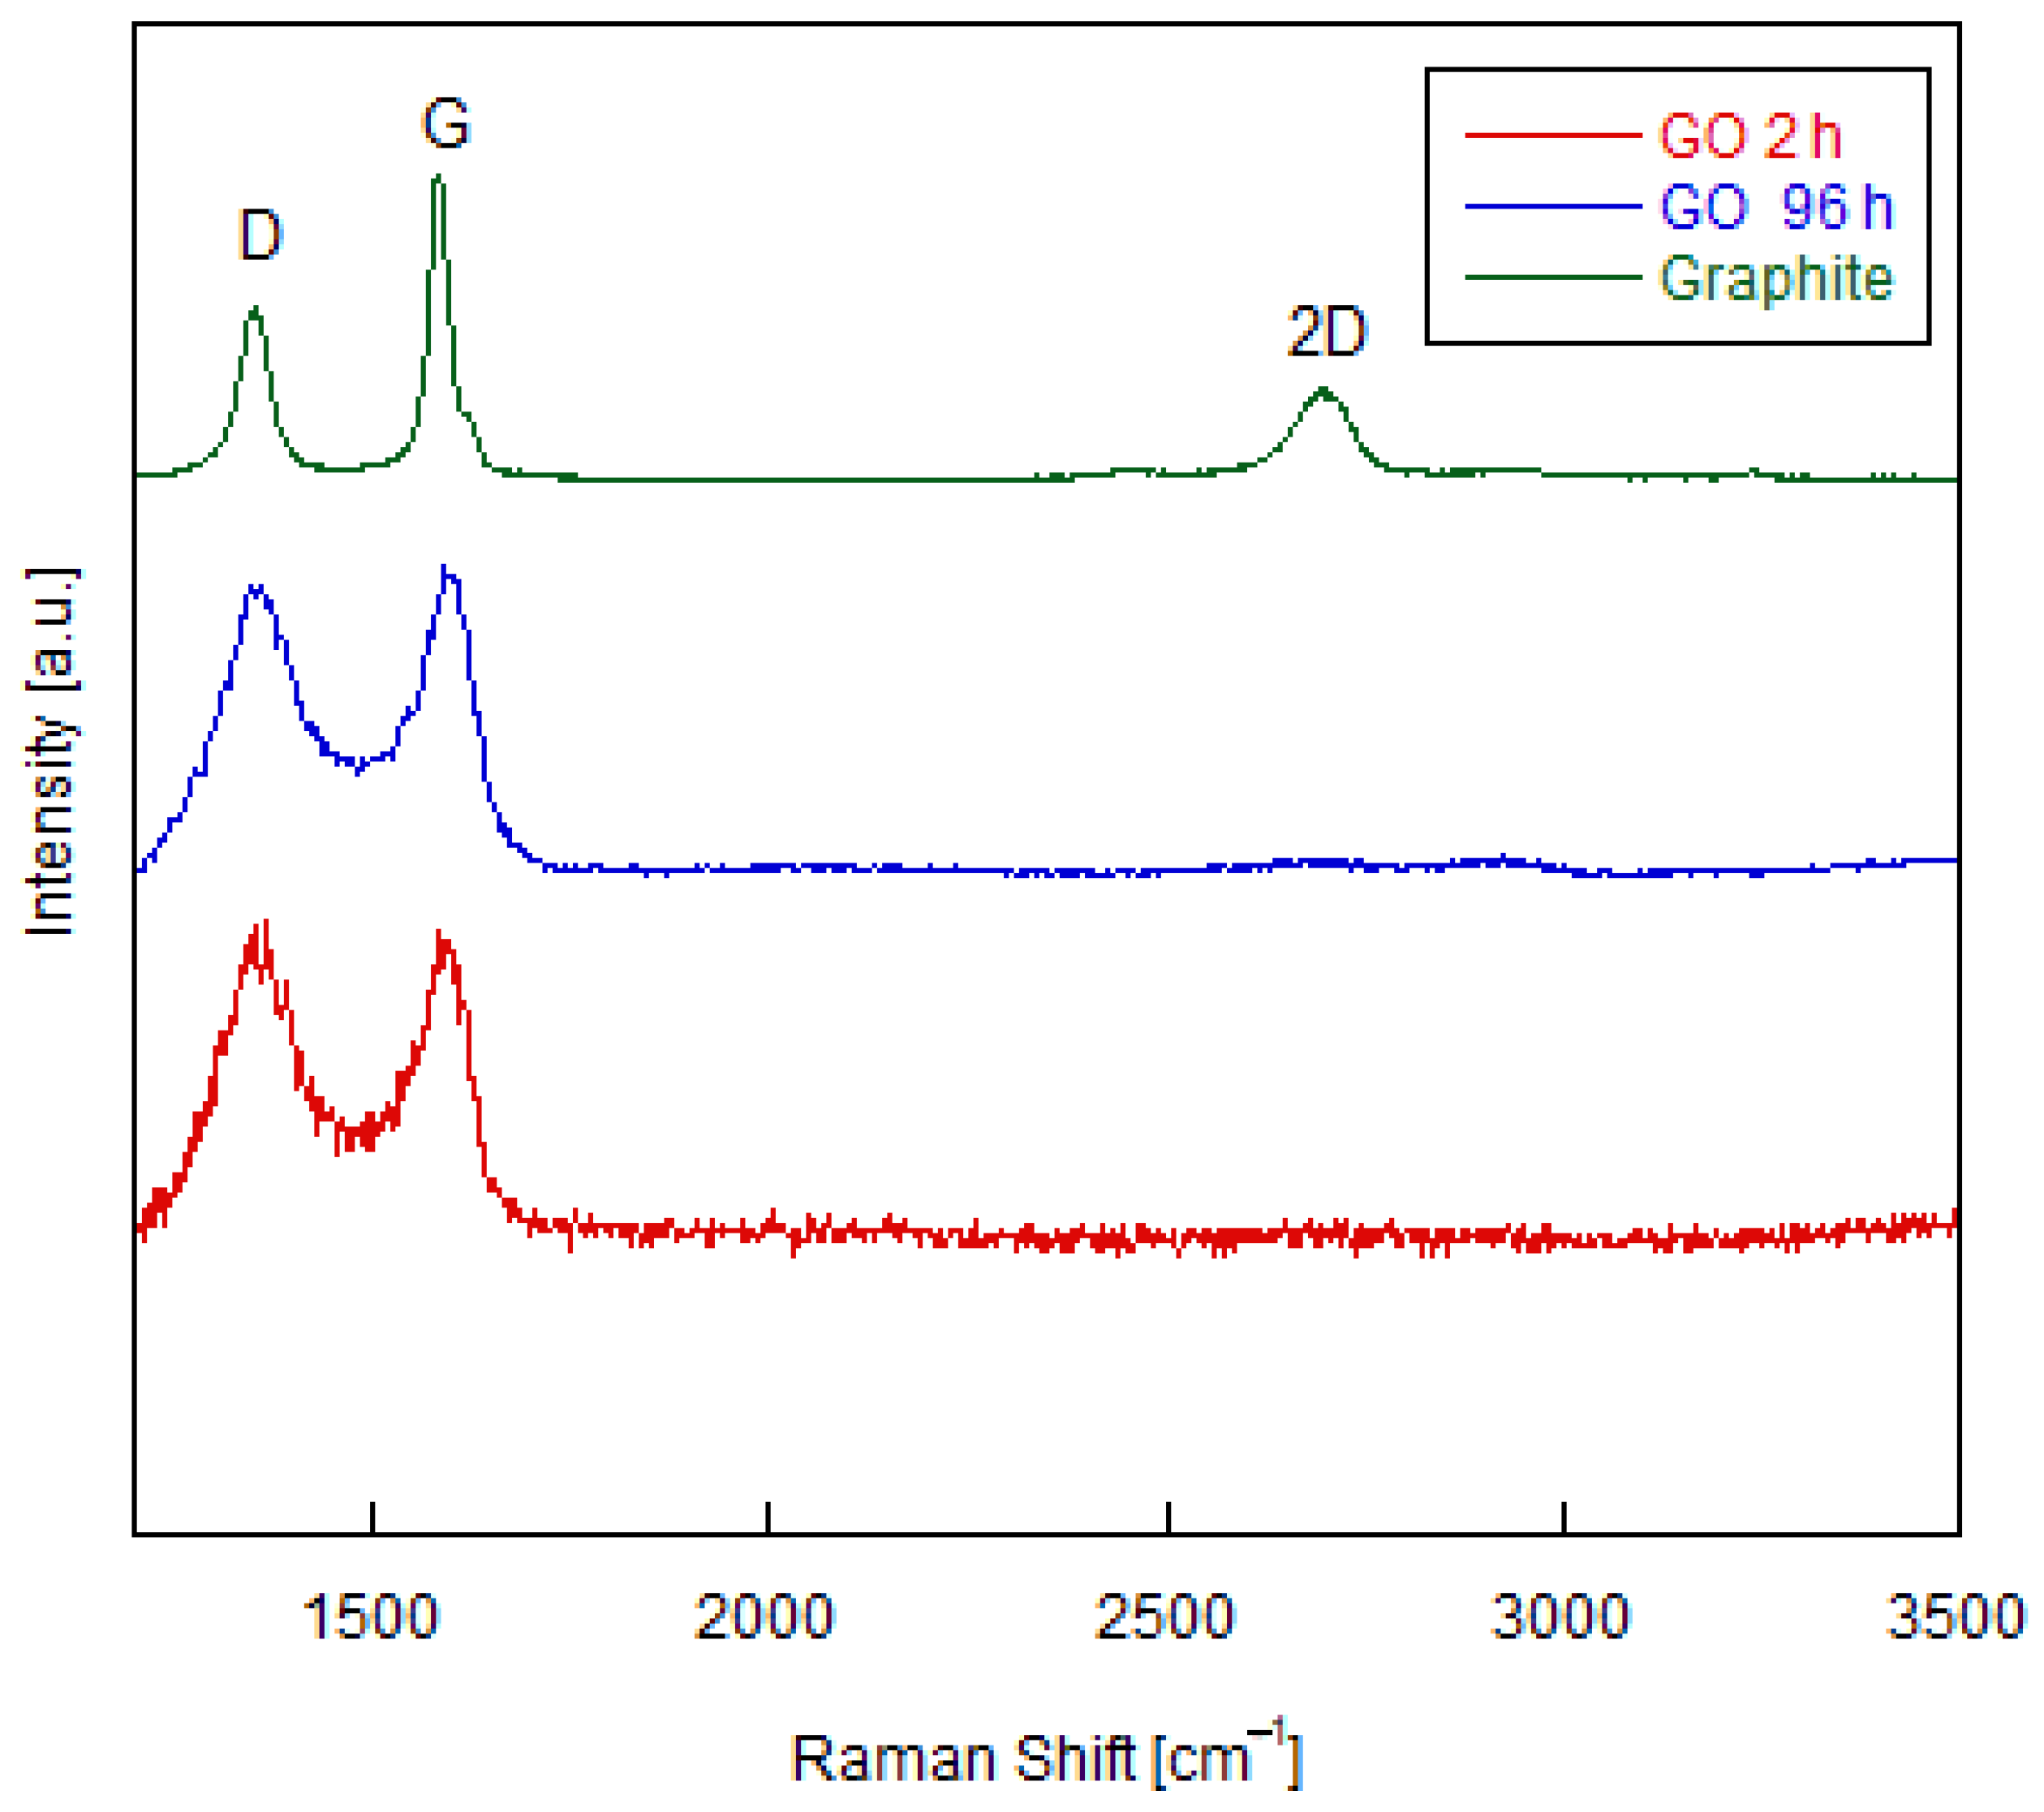
As shown in Figure 3, the Raman spectrum can provide several bands, but the most important ones for carrying out the study and characterization of the load are the D, G, and 2D bands. The 2D band can only be observed in the graphite spectrum between the range of 2500–2750 cm−1. It is related to the two-dimensional structure of the material, providing information about the existence of multilayers that form the graphite [35]. For GO 2 h and 96 h, the Raman spectrum shows no peaks in the 2D region, since it is a defective structure consisting of functional groups intercalated between the graphitic layers. With respect to the band D that is in the range between 1300 cm−1 and 1500 cm−1, it is possible to observe a growth in the band D relative to the oxidation process that led to the existence of incomplete bonds, heteroatoms attached to the plane structure and changing the sp2 to sp3 bond type on carbon atoms, thus with defects on the edges and layers of the graphite [36]. Comparing the spectra of the samples with respect to the G band, which is between 1500 and 1750 cm−1, there is a widening of the G band, indicating greater disorder in the graphitic structure and greater heterogeneity due to the oxidation process [37]. The ID/IG intensity ratio of the D and G bands allows a quantitively estimation of the proportion of defect concentration, depending on the GO oxidation. For the graphite, ID/IG = 0.573, the GO 2 h oxidation, ID/IG = 1.066 and GO 96 h, ID/IG = 1.109, indicating a shift to higher of the ration with the increase of oxidation time. This suggests the size reduction of the in-plane sp2 domains as the oxidation time increases, and consequently, there was an increase of the structural defects in the carbonaceous structure due to the oxygenated groups and edges on GO 96 h. This observation corroborates the previous XRD results.
Figure 4 shows the thermogravimetric curves of graphite, GrO 2 h and GrO 96 h under O2 atmosphere. For graphite it can be observed that there is thermal stability until 731 °C, when a typical thermal decomposition process of the graphitic material begins to occur and continues until 893 °C. GrO 2 h presents a small loss of mass up to the temperature around 100 °C, resulting from the loss of residual moisture absorbed by the material during the exfoliation process. Between 155 and 300 °C, a further sharp drop corresponding to a loss of 26.74% of the material mass is observed and can be related to the loss of groups that were introduced into the material during oxidation. Finally, the sample has a gradual loss of mass between 500 and 600 °C, related to the process of degradation of the graphite structure. Regarding the results for the GrO 96 h, first a loss of mass resulting from the loss of residual moisture absorbed by the material can be observed and then, between 155 and 300 °C there is 33.38% of mass loss, related to the loss of oxygenated groups that were introduced into the material during oxidation. The remainder shows the mass loss of the graphite material. These values indicate that the GrO’s are thermally unstable and the system with the highest oxidation time has the largest number of functional groups introduced in the graphite structure. It is worth mentioning that Jiang et al. (2000) showed that graphite, regardless of its size, is thermally stable because of its high structural stability [38].
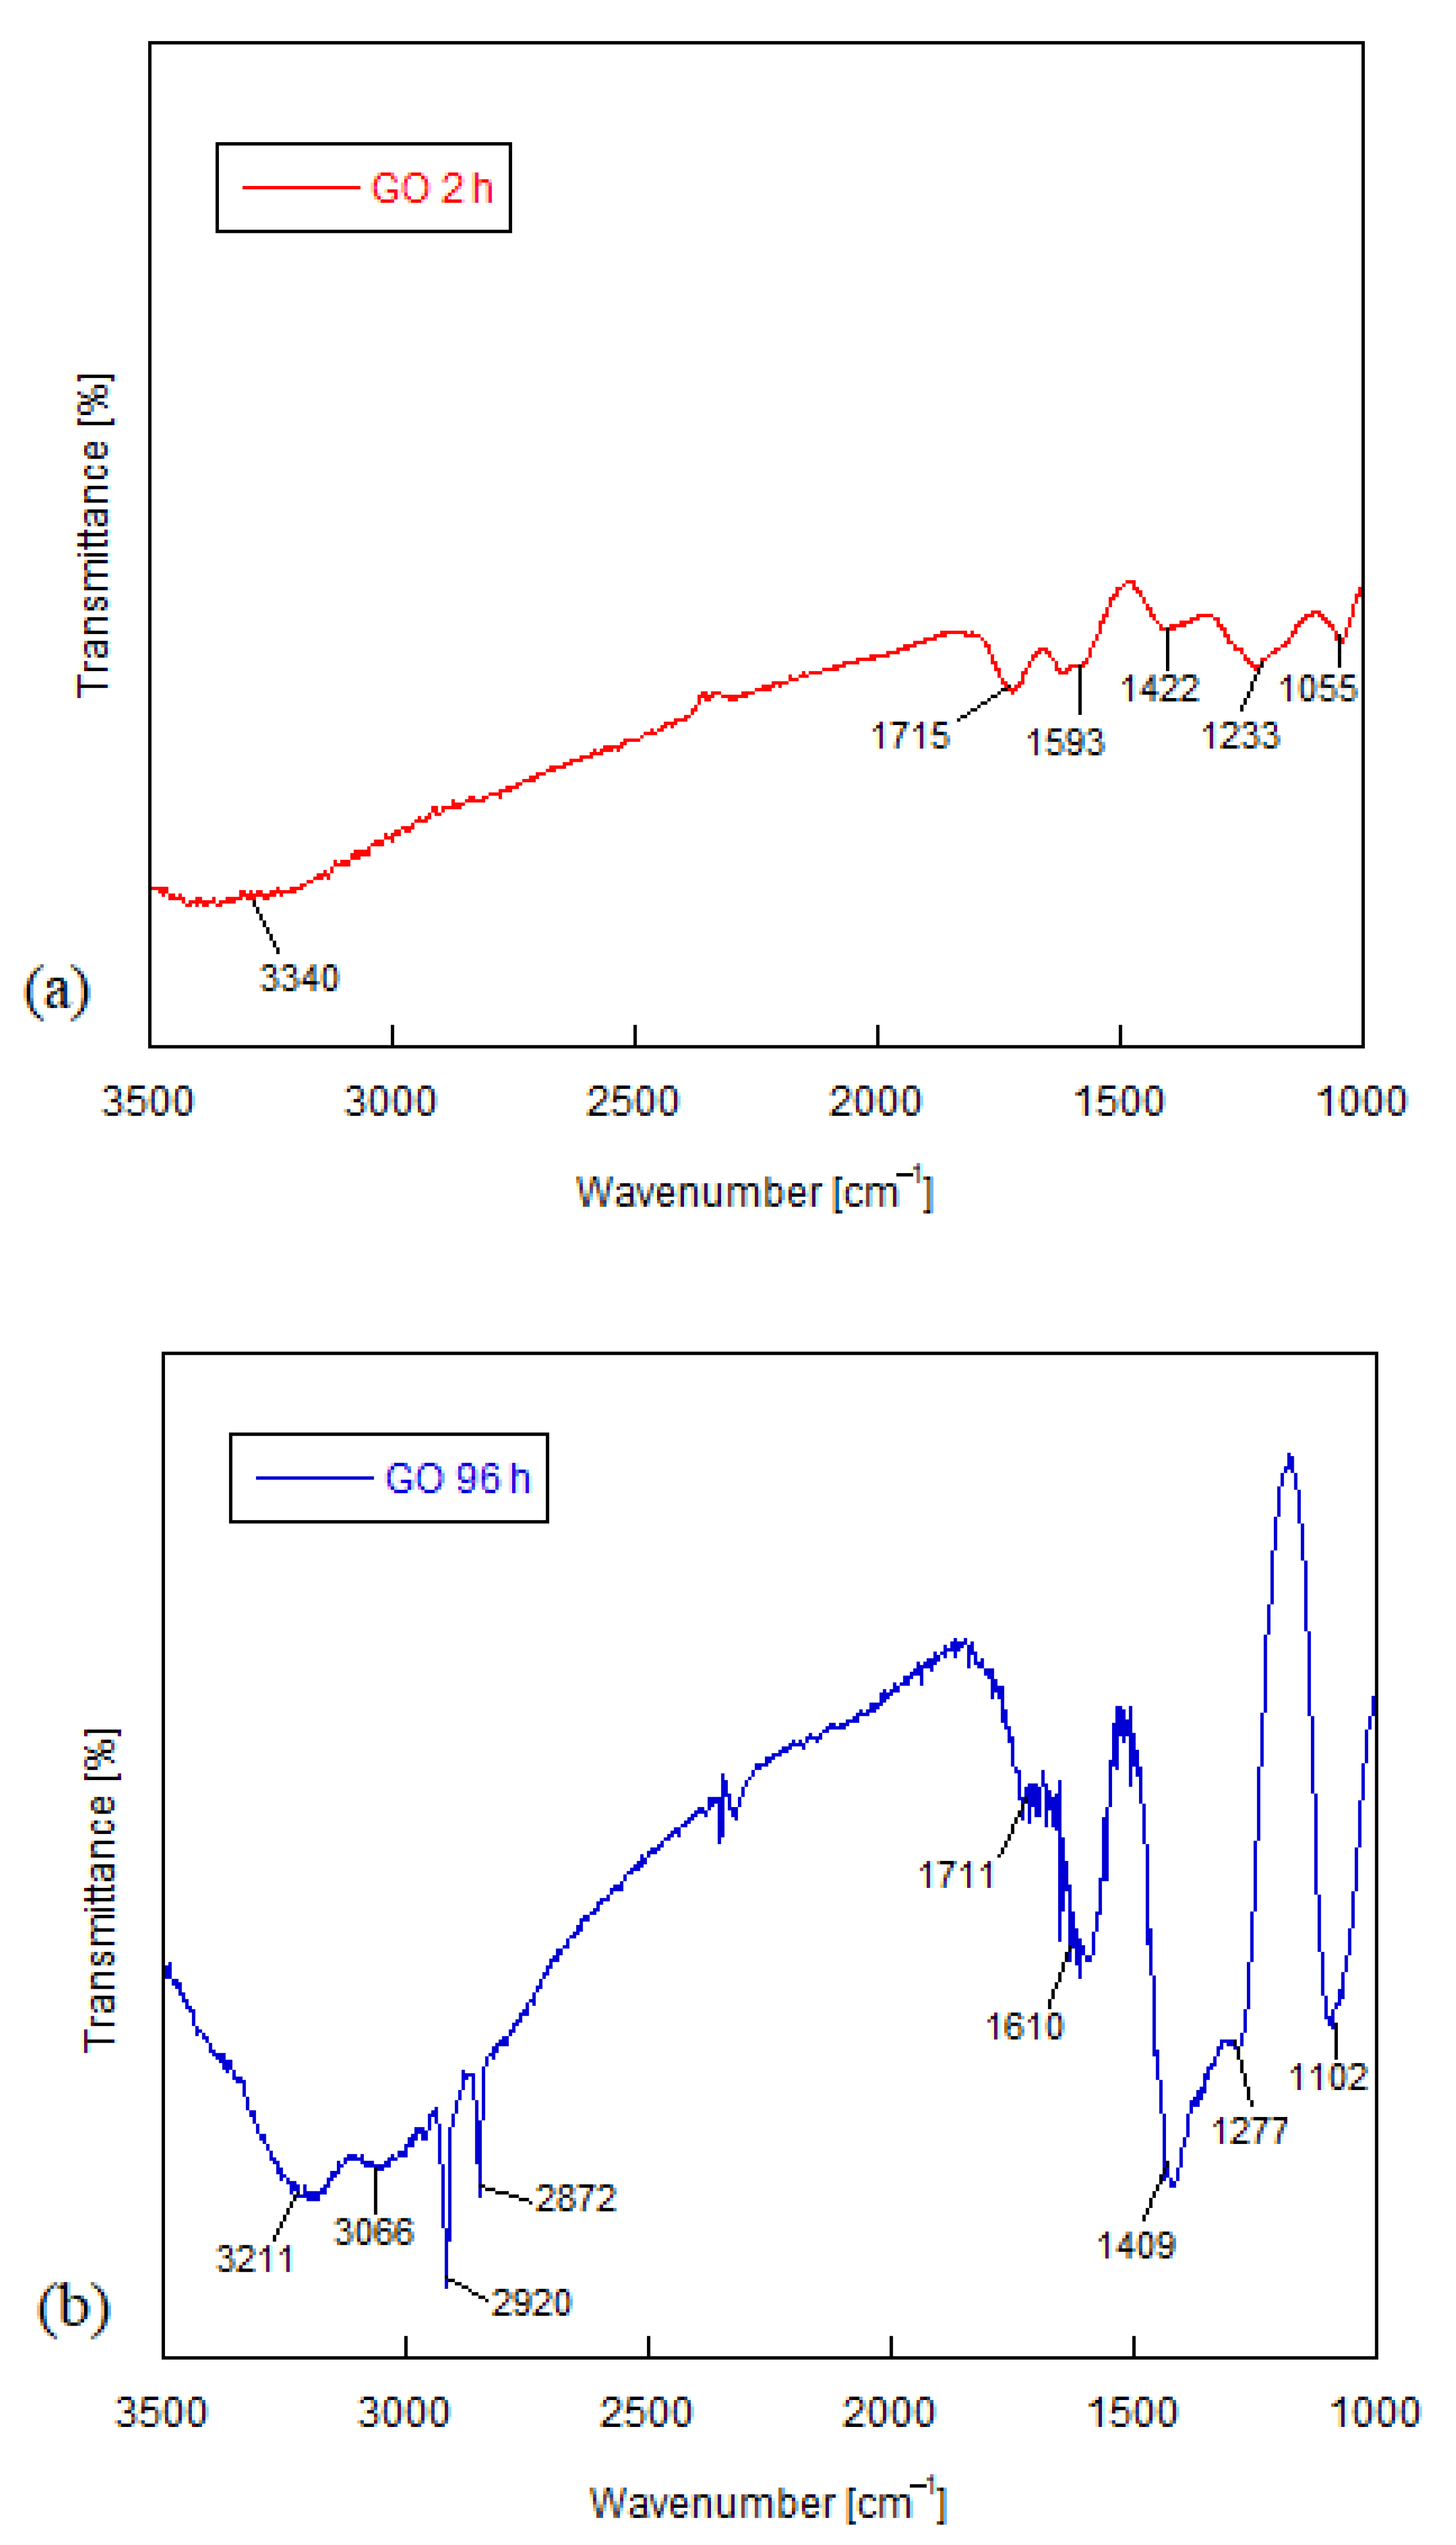
Figure 5a,b shows the FTIR spectra of the oxidized GO with 2 h and 96 h. Both results show vibrations regarding the oxygenated functional groups developed by oxidation of the GrO. The peaks at 1055 and 1102 cm−1 for the GO 2 h and GO 96 h spectra, respectively, establish the existence of C–O stretching, which can be related to alcohols. The peaks at 1233 and 1277 cm−1 also indicate the presence of stretching C–O bonds and can be related to carboxylic acids, esters and ethers (epoxy) [39,40]. The peaks that manifest at frequencies 1422 cm−1 for GO 2 h and 1409 cm−1 for GO 96 h establish the presence of O–H deformation vibrations. The peaks for the frequencies of 1593 and 1610 cm−1 are associated with the C=C stretch. The bands at 1715 and 1711 cm−1 determine the stretching of C=O bonds, which may be related to the presence of carboxylic acids and ketones. The broad bands present between the frequencies of 3500 and 2500 cm−1 in both spectra are associated with OH in the samples. The peaks at 3340 cm−1 for the GO 2 h spectrum and 3211 and 3066 cm−1 for the GO 96 h arise from the −OH stretch from carboxylic acids and hydrogen bonds derived from moisture in the samples. However, the peaks that appear at the frequencies of 2920 and 2872 cm−1 in the GO 96 h spectrum suggests symmetrical and asymmetric C–H stretching that can be related to the appearance of local defects in the GO nanosheets [41]. The appearance of peaks associated with C–H agree with the results of Raman spectroscopy, which presented a higher ID/IG ratio for GO 96 h.
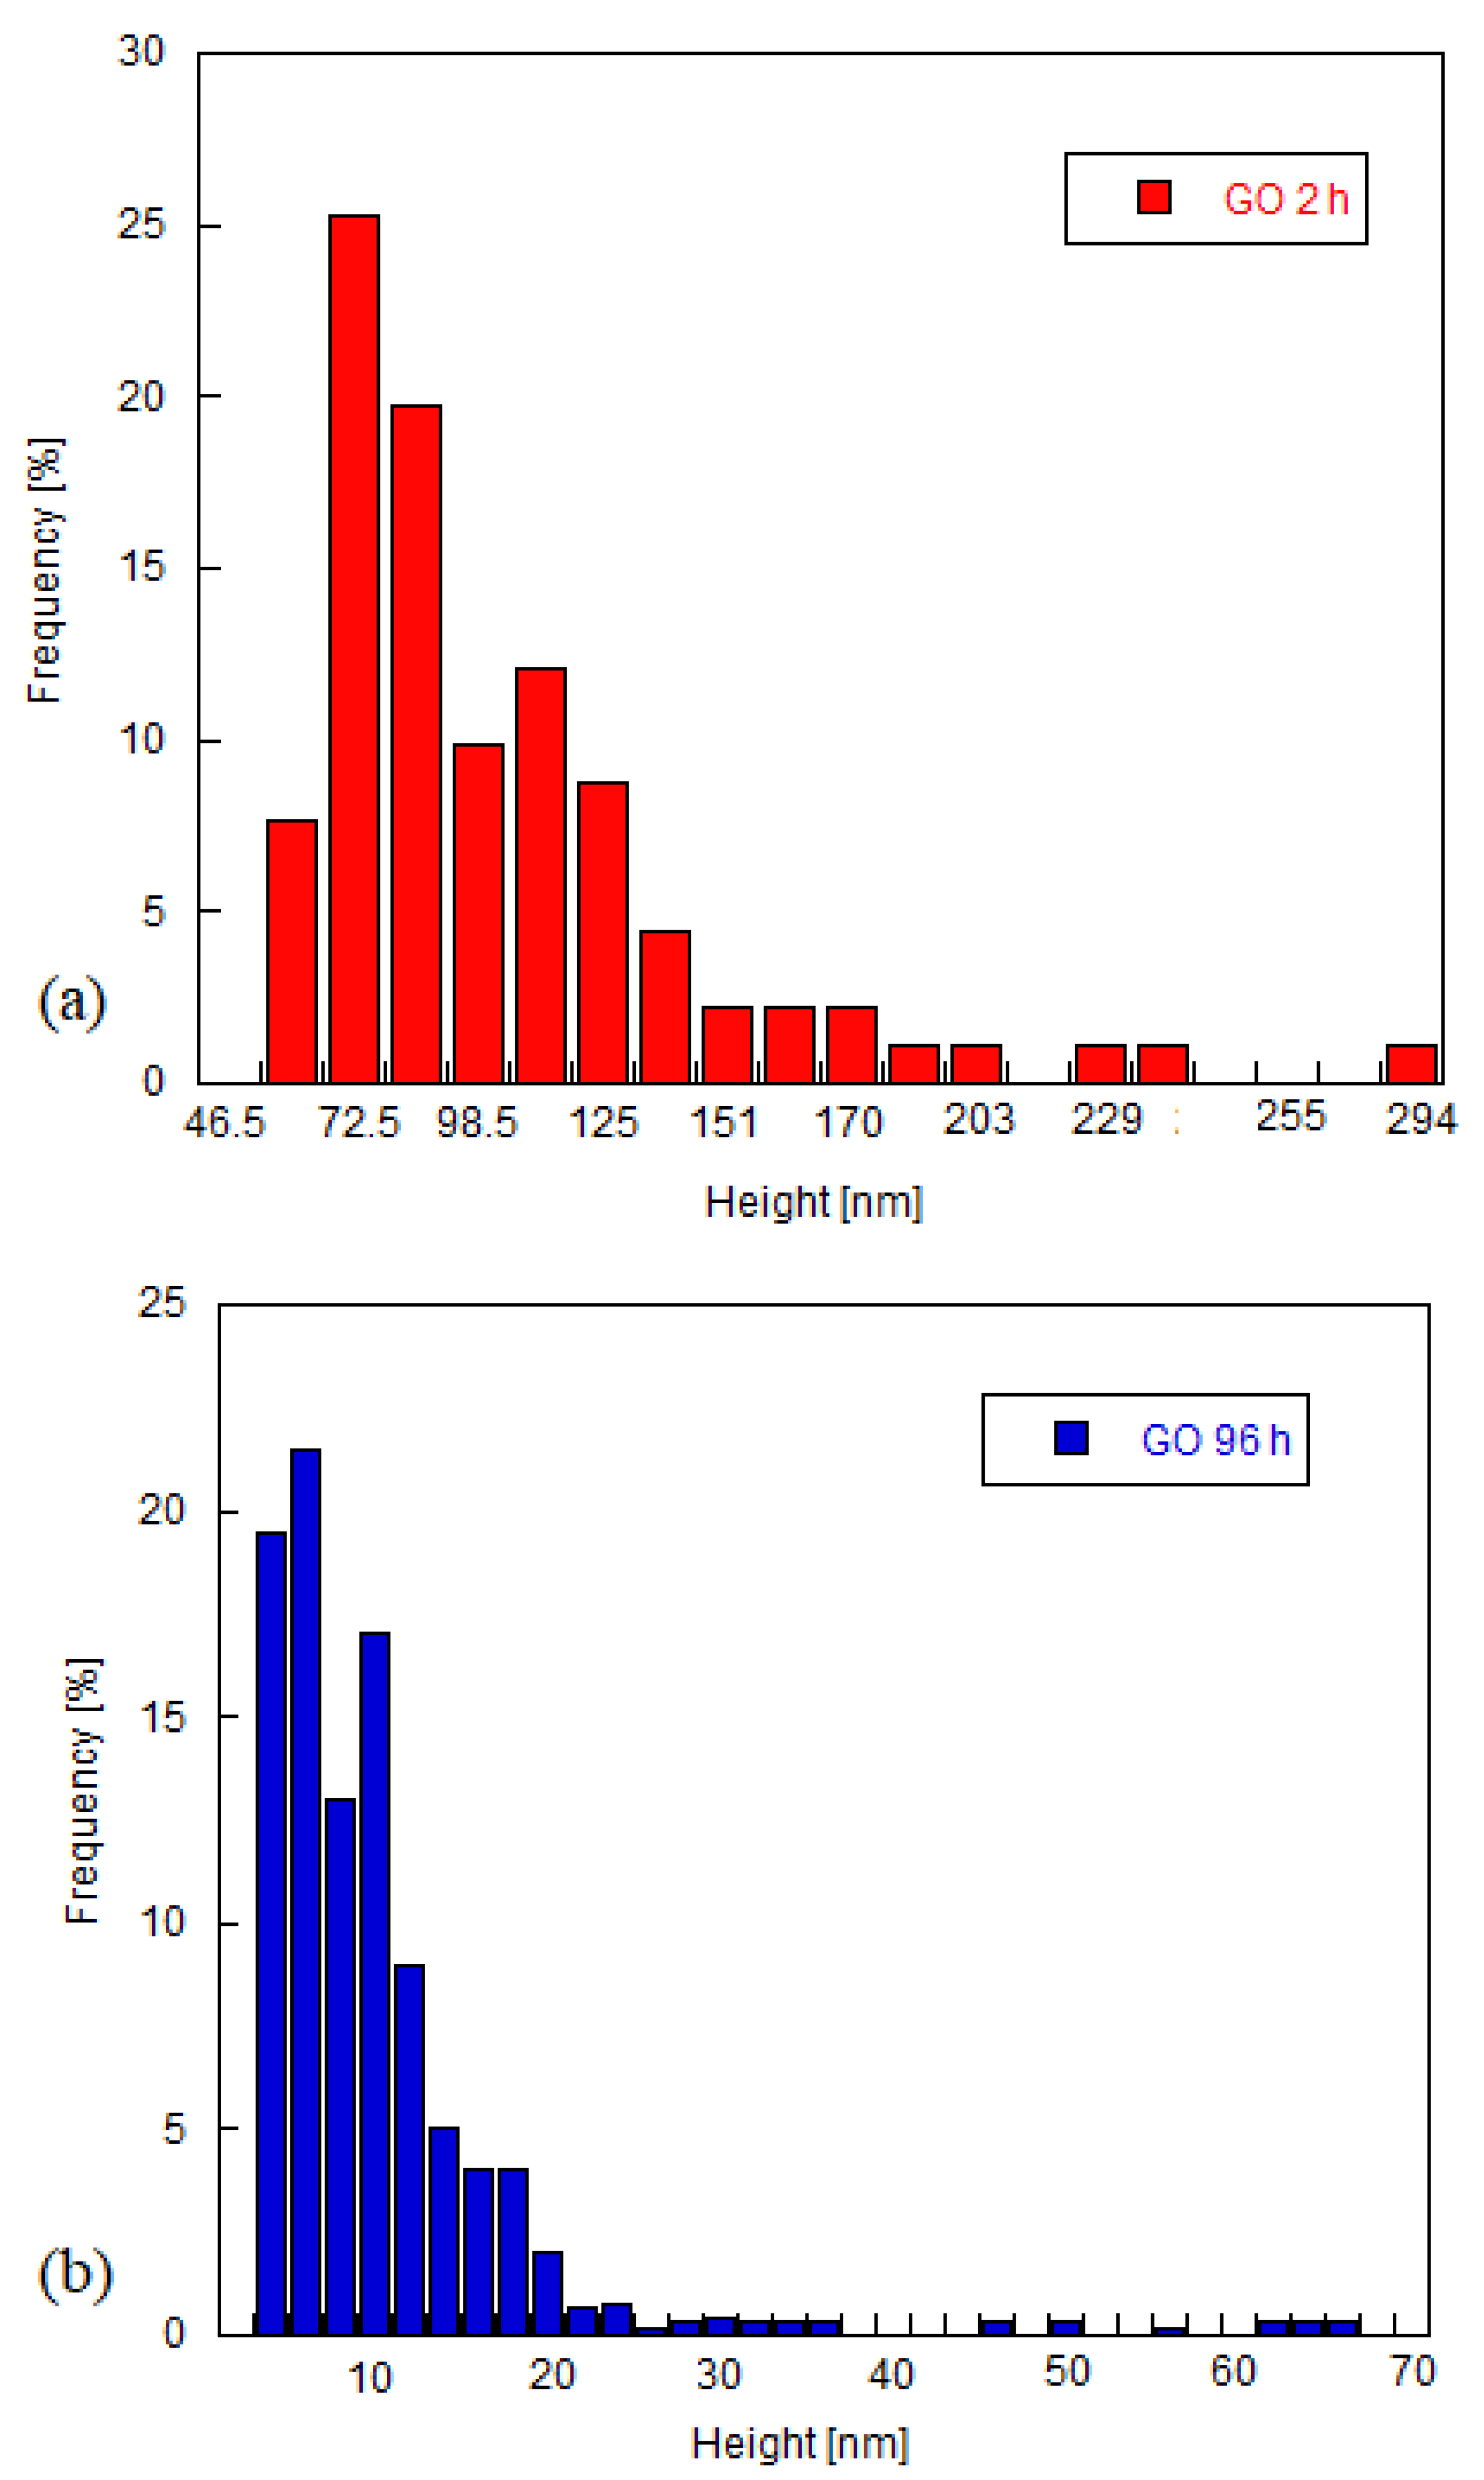
Atomic force microscopy (AFM) was used to analyze the morphology of the GO obtained, and results are depicted in Figure 6 and Figure 7. Figure 6a presents the results of GO 2 h, and it shows that the particles size range from 60 nm to 294 nm, with more than 50% concentrated between 60 nm and 100 nm, and with an average number of 104 layers, indicating that most of the particles are graphite oxide. Figure 6b shows instead that the GO 96 h has particles ranging from 0 nm to 60 nm, with more than 50% concentrated between 0 nm and 20 nm, and with an average number of 10 layers, in which the GO particles can be classified as multilayer-GO. Figure 7a,b shows a representative image of the GO 2 h and GO 96 h particles respectively, obtained by the AFM in Gwyddion of the exfoliated GO of the aqueous suspension. It is possible to observe, that GO particle 2 h has width between 0.5 µm and 2 µm and a maximum height of 0.11 µm, and for GO 96 h it is seen that the width is between 0.3 µm and 0.8 µm and maximum height of 13 nm. These values are within the results analyzed in Figure 6 and indicates that with the increase of the oxidation degree, it is possible to obtain lower number of layers. However, due to the increase number of defects on the basal plane of the GO 96 h, the layers tend to breakdown more during the sonication process, as indicated by the decrease of the lateral size. These observations are in line with the above characterizations, indicating that with higher oxidation time/degree it was possible to obtain more functional groups in the GO particles, which led to an increase of the exfoliation process.
The results obtained with these characterization techniques present similar properties to the GO as in other studies in the literature, showing that the graphene oxide obtained by the modified Hummers method was satisfactory [33]. It was also possible to notice that the GO obtained with the highest oxidation time (96 h) presented fewer layers due to a larger insertion of oxygenated groups between them. This may be justified by the fact that these functional groups further improve the interplanar distance between these sheets and facilitate their separation during the exfoliation process. These oxidized nanoparticles present a hydrophilic behavior, which allows to exfoliate in water.
To evaluate the effect of oxidation level and concentration on the suspension rheology, steady state and oscillatory measurements were performed using rotational rheometry.

3.2. Shear Rheology of Graphene Oxide Suspensions

The difficulty to achieve a stable suspension with no chemical changes such as pH change or surfactant addition, has been a major challenge [42]. To deal with this issue, homogenization of the suspension is carried out by stirring techniques, such as the ultrasonic bath, magnetic stirrer, and high-pressure homogenizer. Factors such as intensity and time of stirring can also influence the suspension behavior.
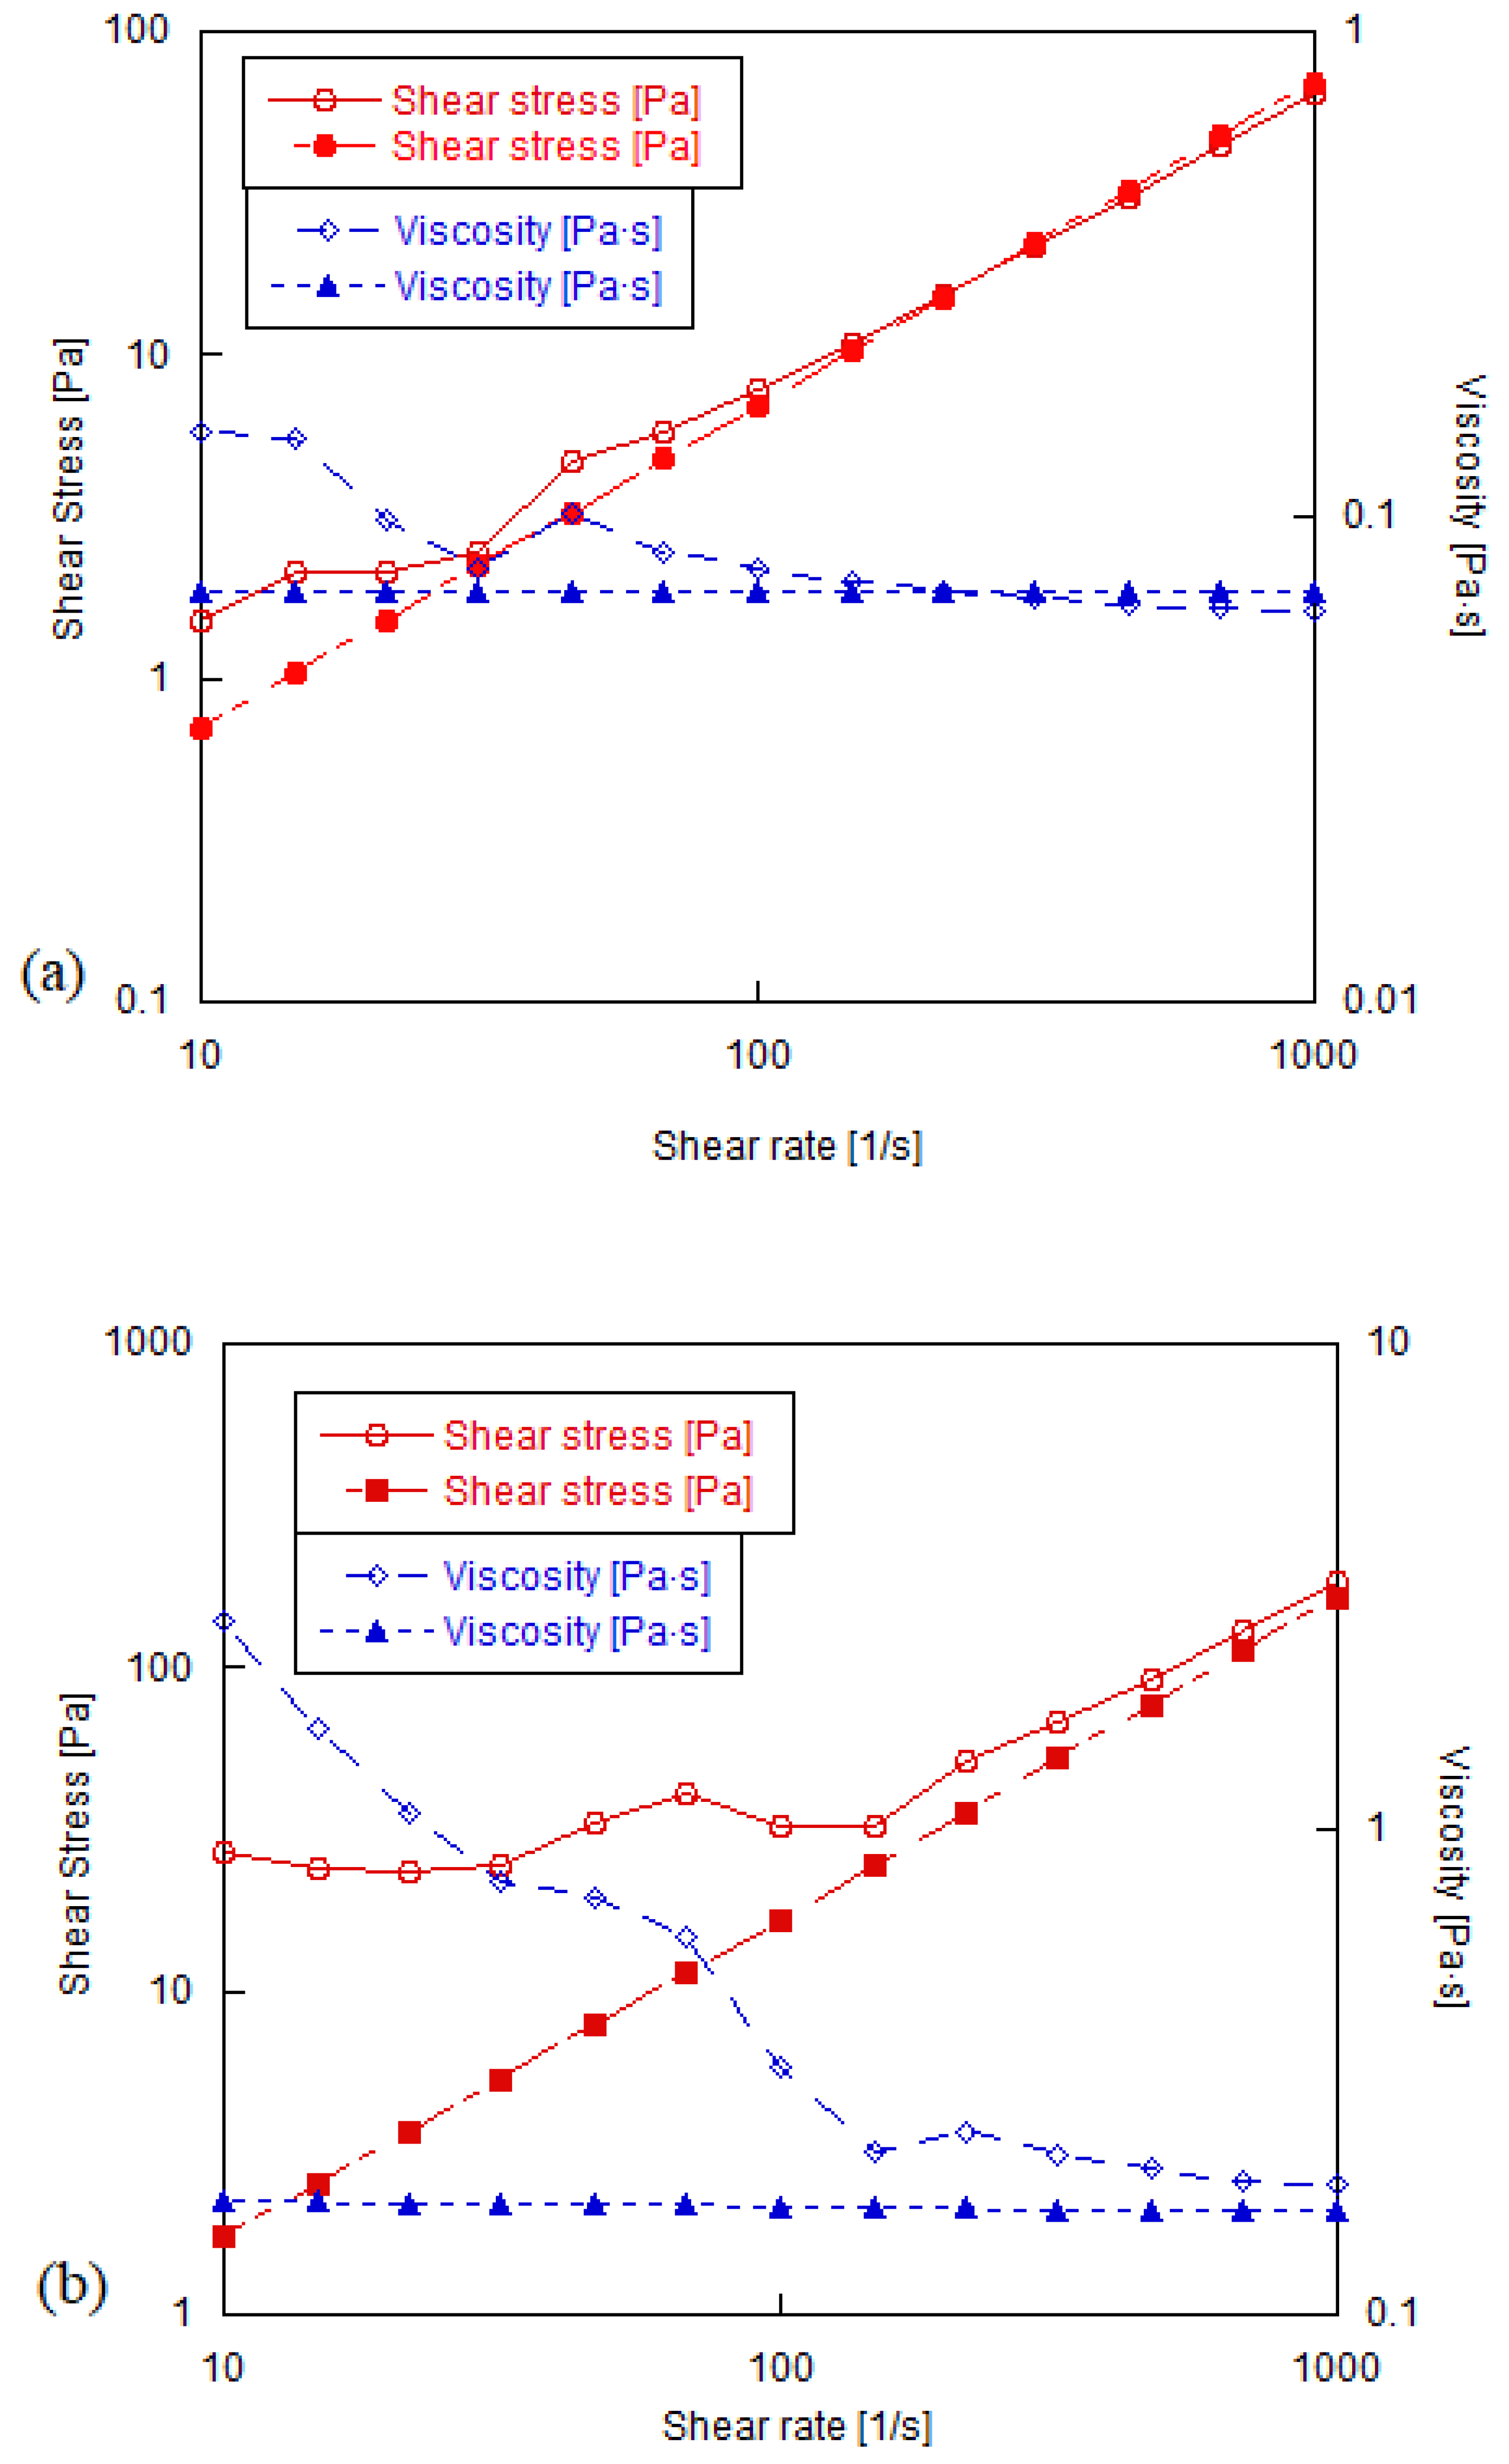
In order to analyze the stability of the suspensions and to evaluate if the samples have undergone any change due to sedimentation or agglomeration, steady state tests were performed with and without agitation. The stirring was done on a magnetic stirrer for 15 min with a constant frequency of 1000 Hz. Figure 8 shows the flow curves obtained for the graphene oxide suspensions of 2 h of oxidation in PEG with concentrations of 0.1 and 80 mg/mL. It was possible to observe that, at low shear rates, the samples did not demonstrate well-defined rheological behavior while at high rates, when the sample is being stirred more vigorously, the behavior of the suspensions is consistent, mostly due to the orientation/suspension of the GO layers. This demonstrates the fact that these samples need to be agitated before being placed on the rheometer in order to avoid sedimentation.
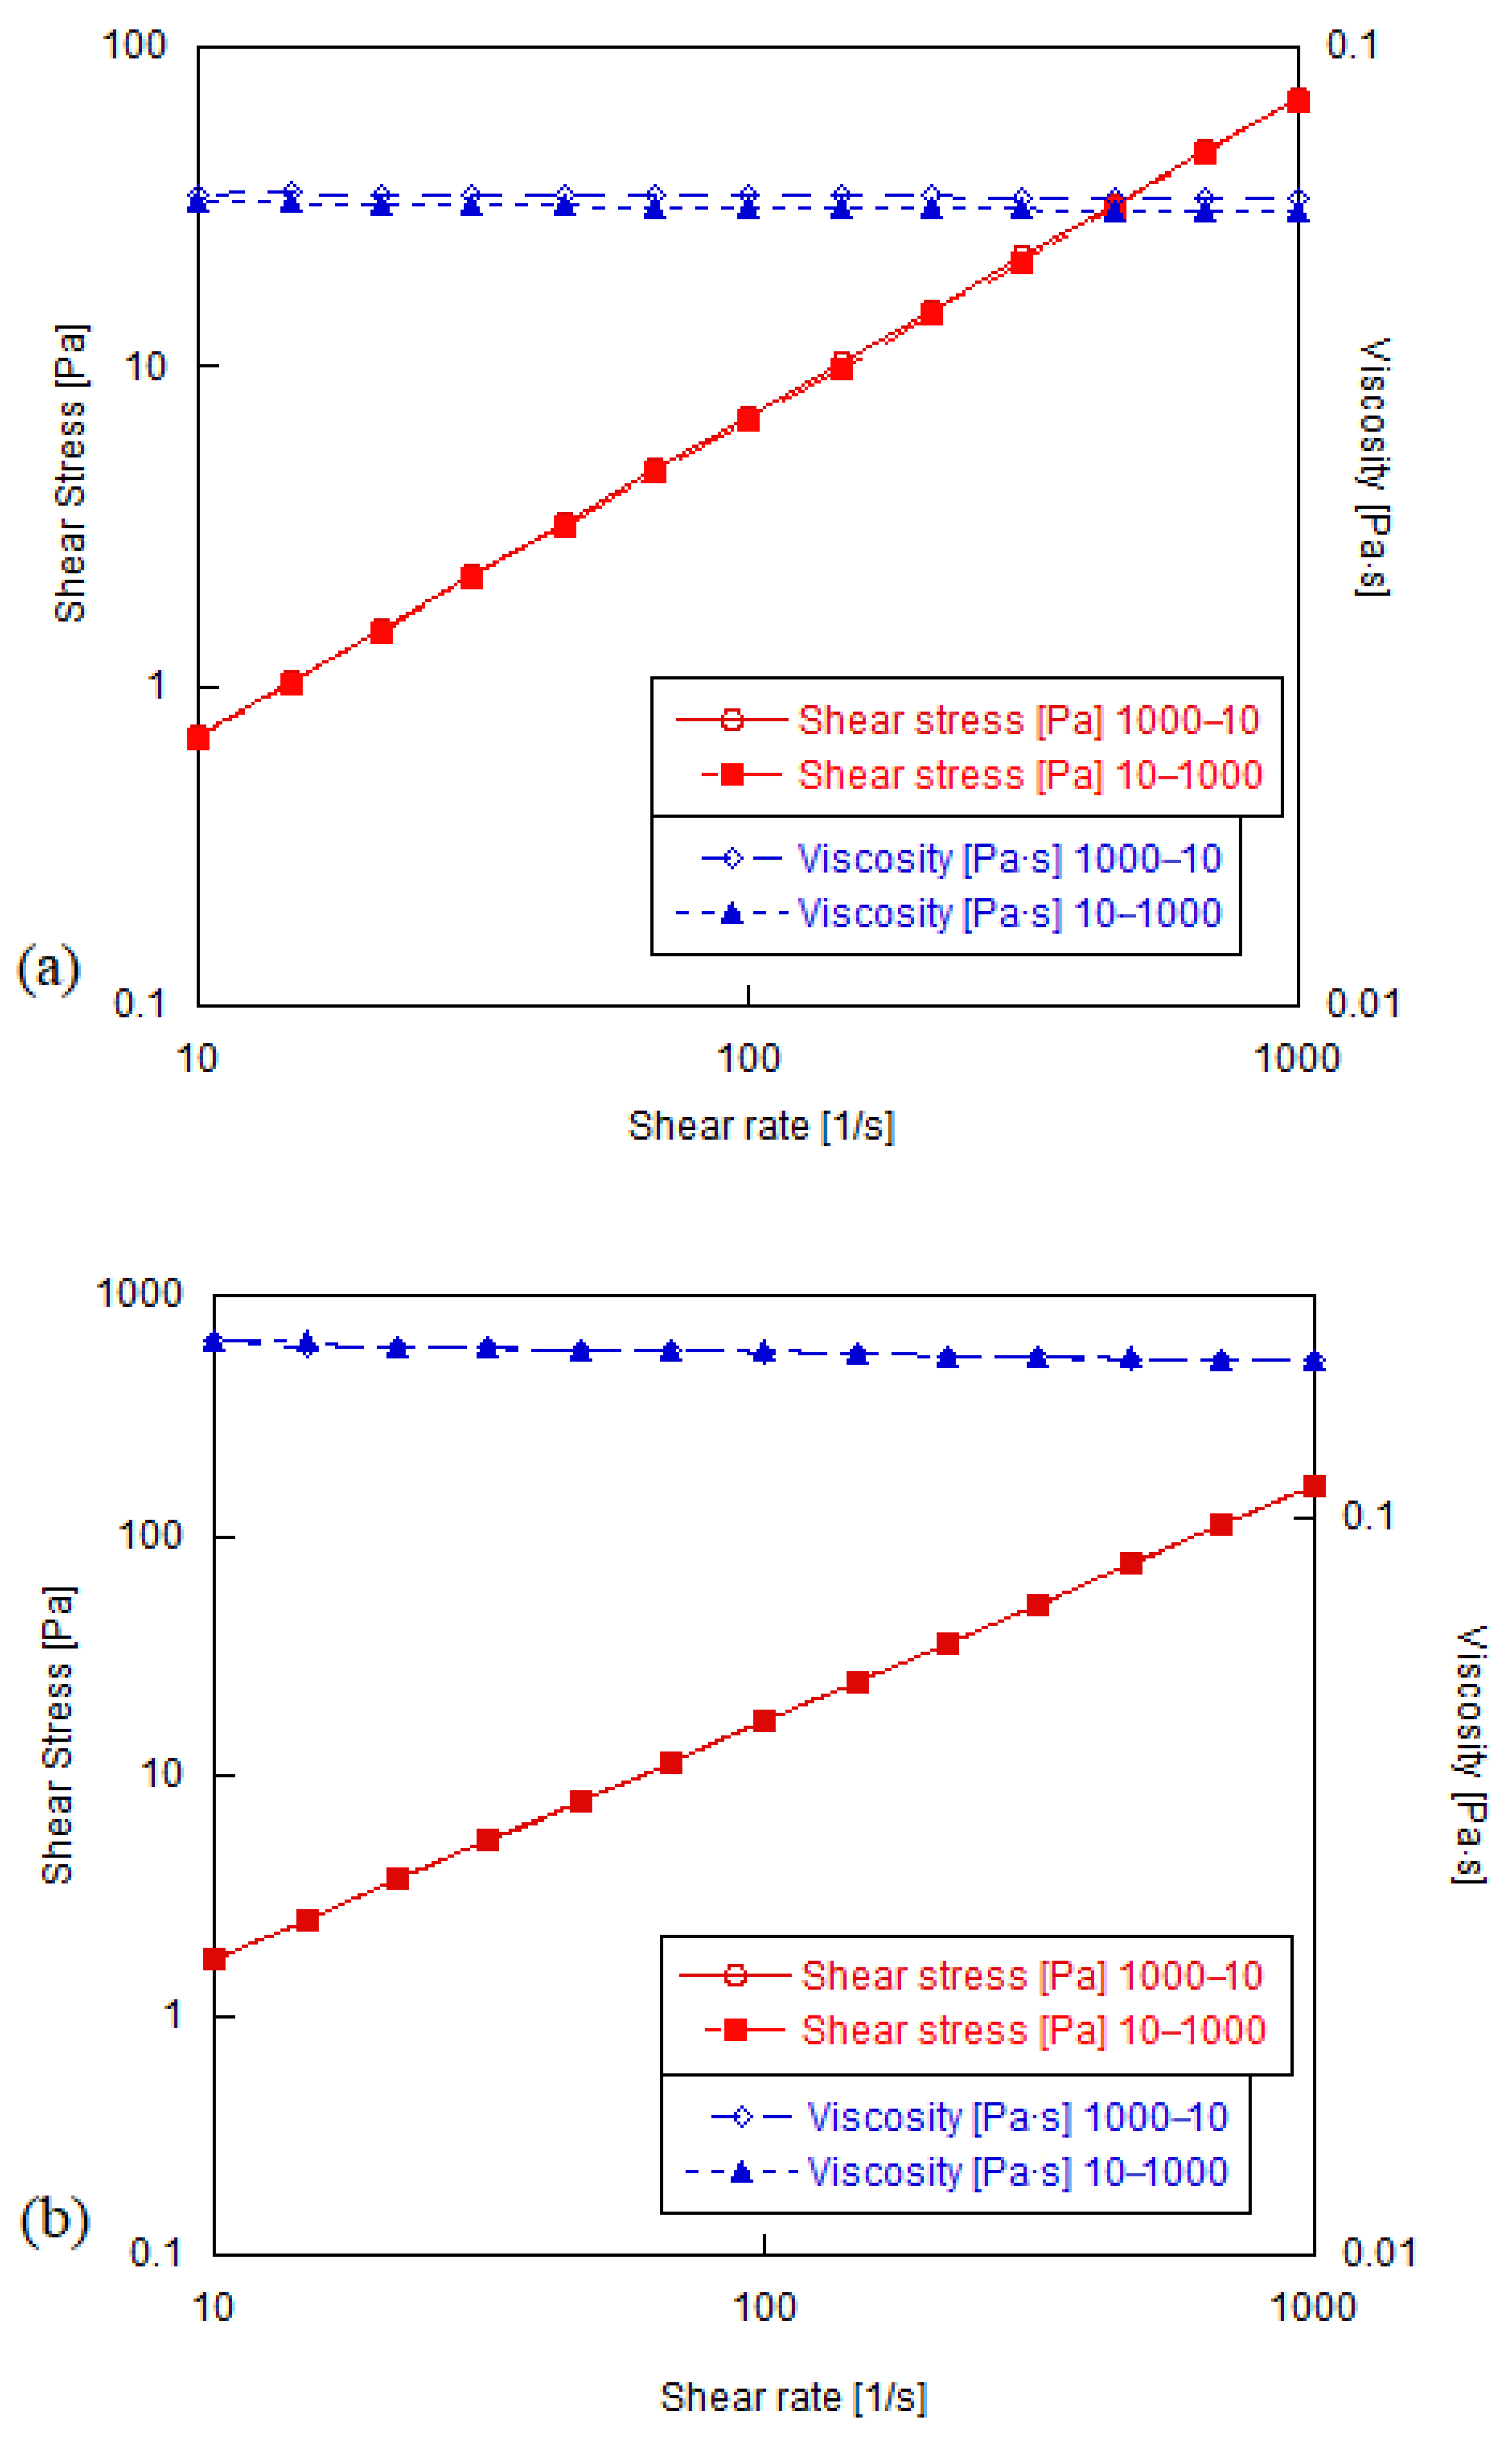
Steady state measurements were obtained for each sample applying a shear rate range from 10 s−1 to 1000 s−1 (without pre-shearing the sample) and then from 1000 s−1 to 10 s−1. Figure 9 shows that there was no hysteresis in the flow curves generated for 0.1 and 80 mg/mL concentrations made with the GO obtained with 2 h of oxidation. These tests also showed that the execution times of the curves obtained from the highest to the lowest shear rates were lower because the steady state for each point is obtained faster, as expected [31].
GO concentration and oxidation degree may influence the rheological properties of graphene oxide suspensions. These effects were investigated for shear rates ranging from 1000 s−1 to 0.1 s−1 to cover a large variety of possible applications. The steady state curves were obtained for concentrations of GO from 0.1 mg/mL to 80 mg/mL, for oxidation times of 2 h and 96 h. It is important to mention that the low shear rate limit in the flow curves was defined by the low torque limit of the rheometer.
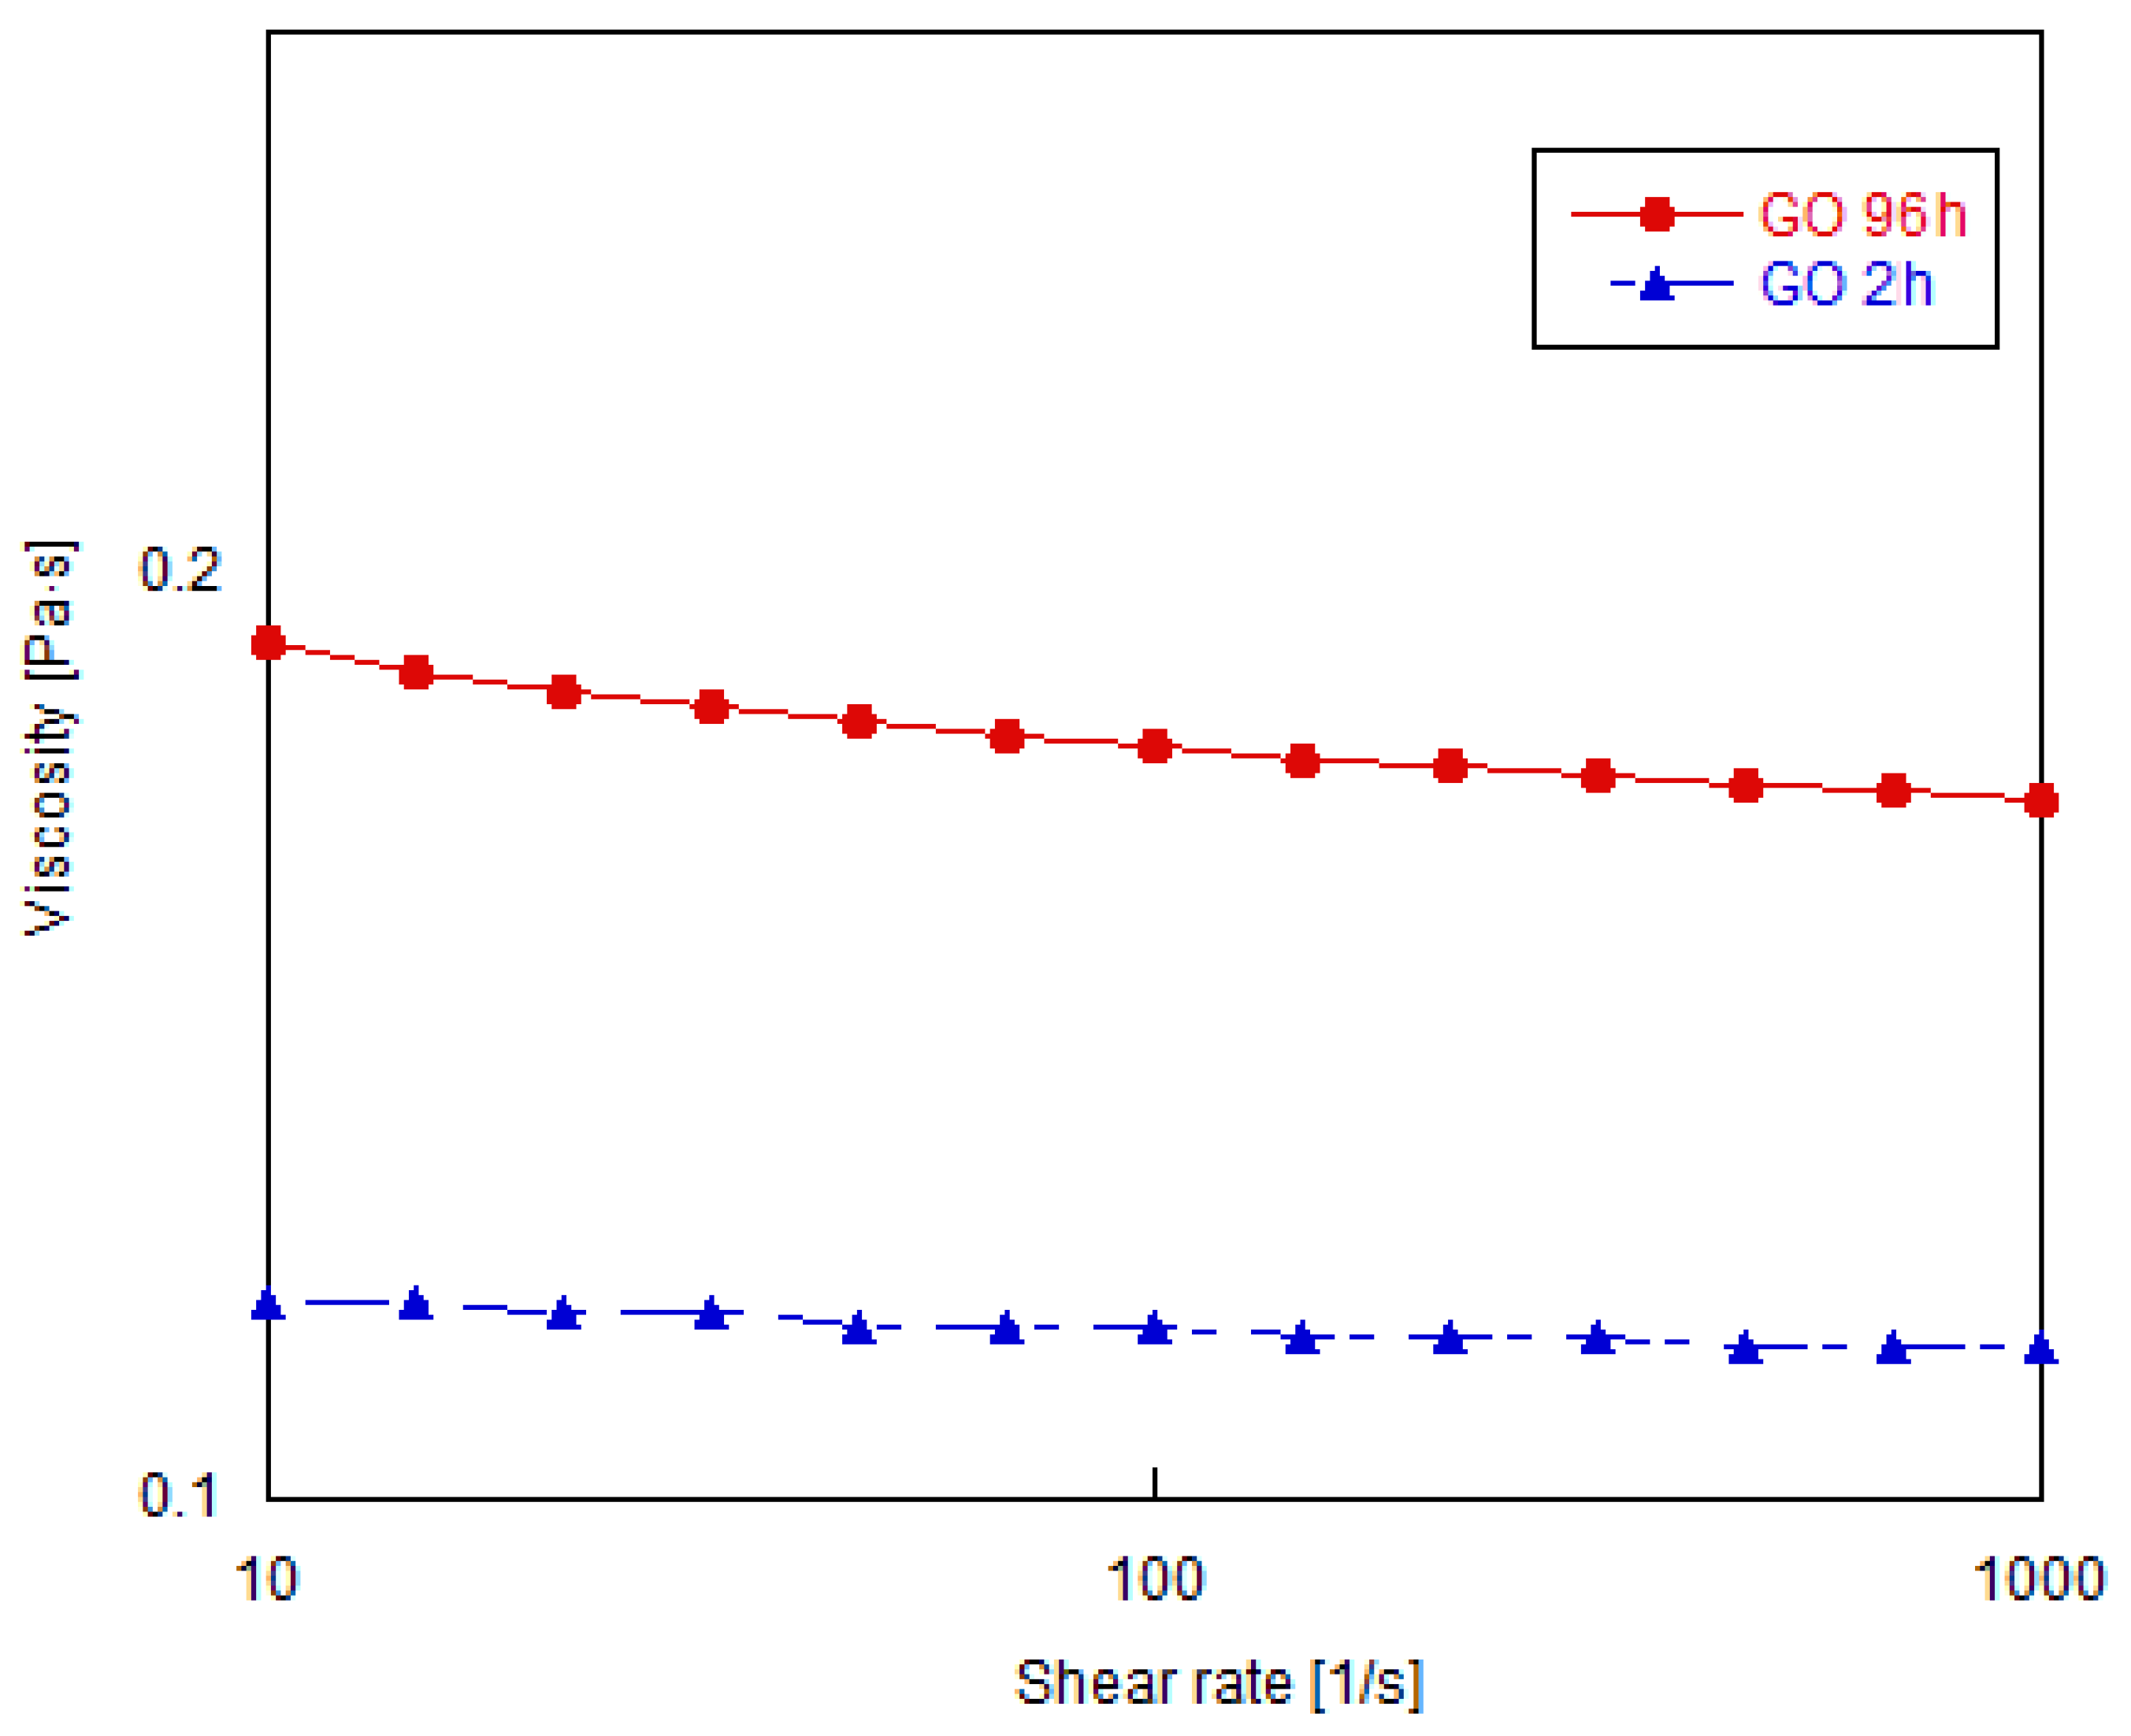
Figure 10 shows the flow curve for suspensions with GO concentration of 40 mg/mL, obtained with oxidation times of 2 h and 96 h. It can be observed that the viscosity of the GO 2 h has a Newtonian behavior, while the GO 96 h presents a slight shear thinning behavior. This suggests the influence of the oxidation level of GO, which also is responsible for the larger viscosity of GO 96 h.
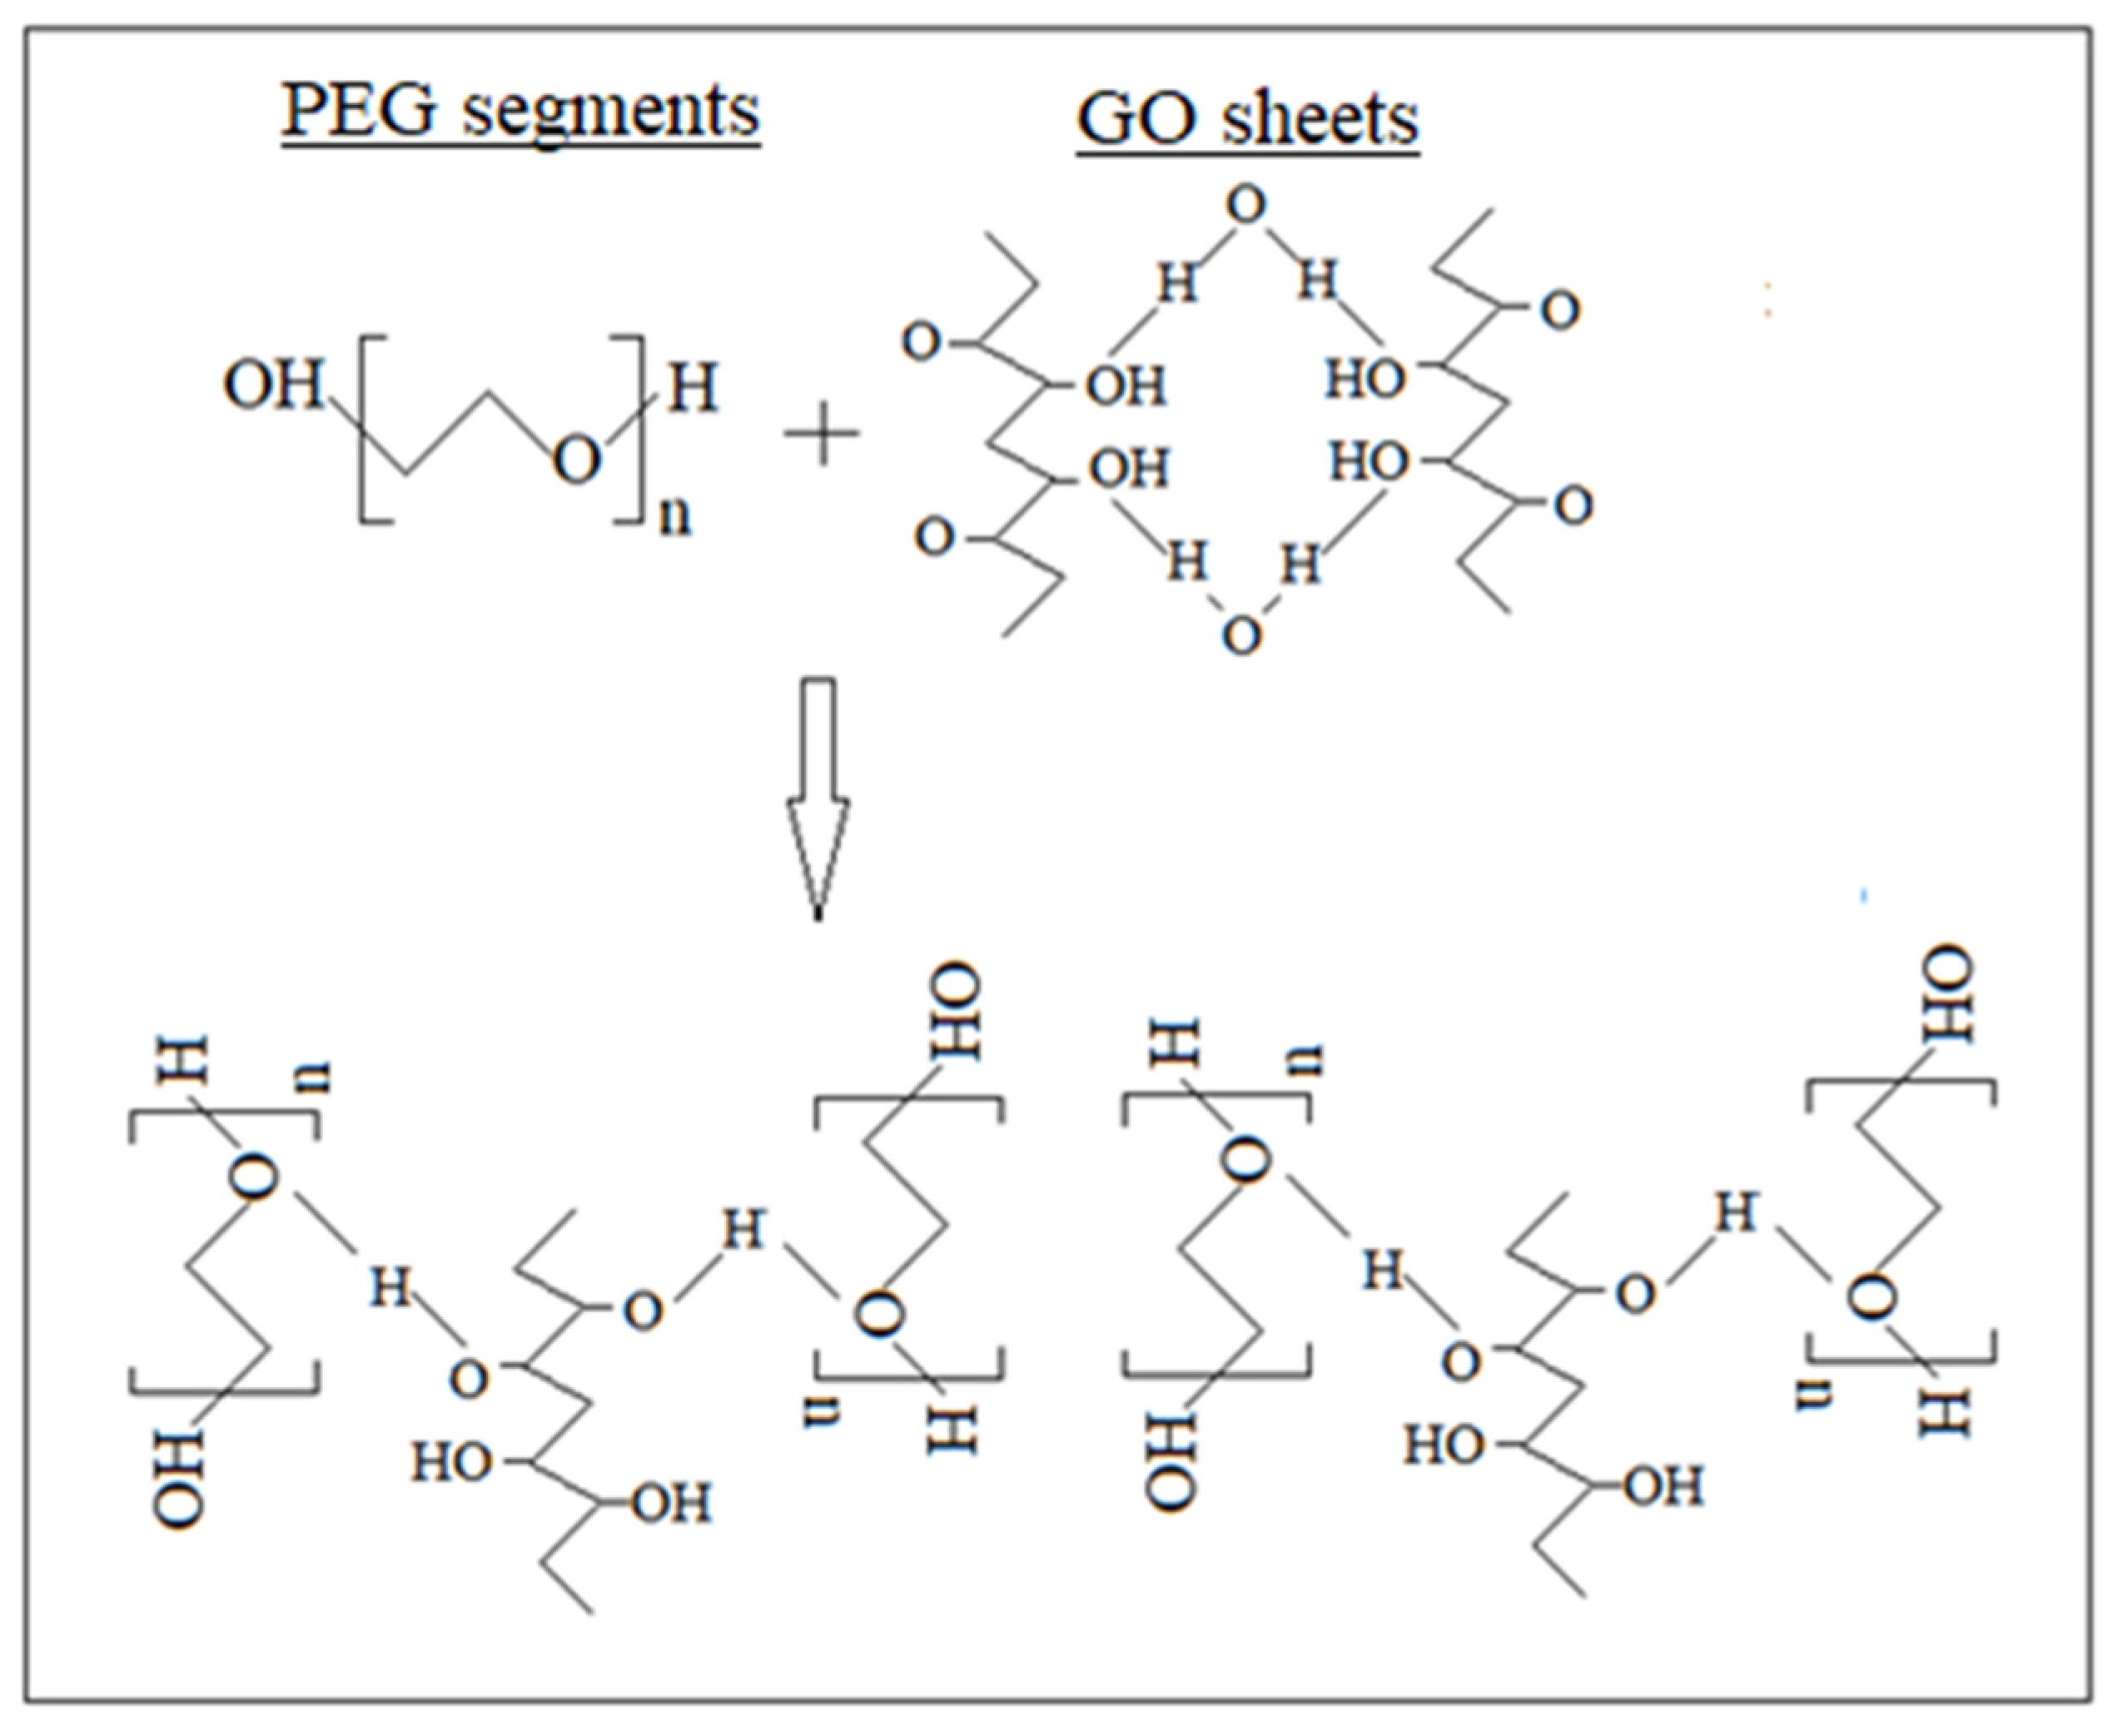
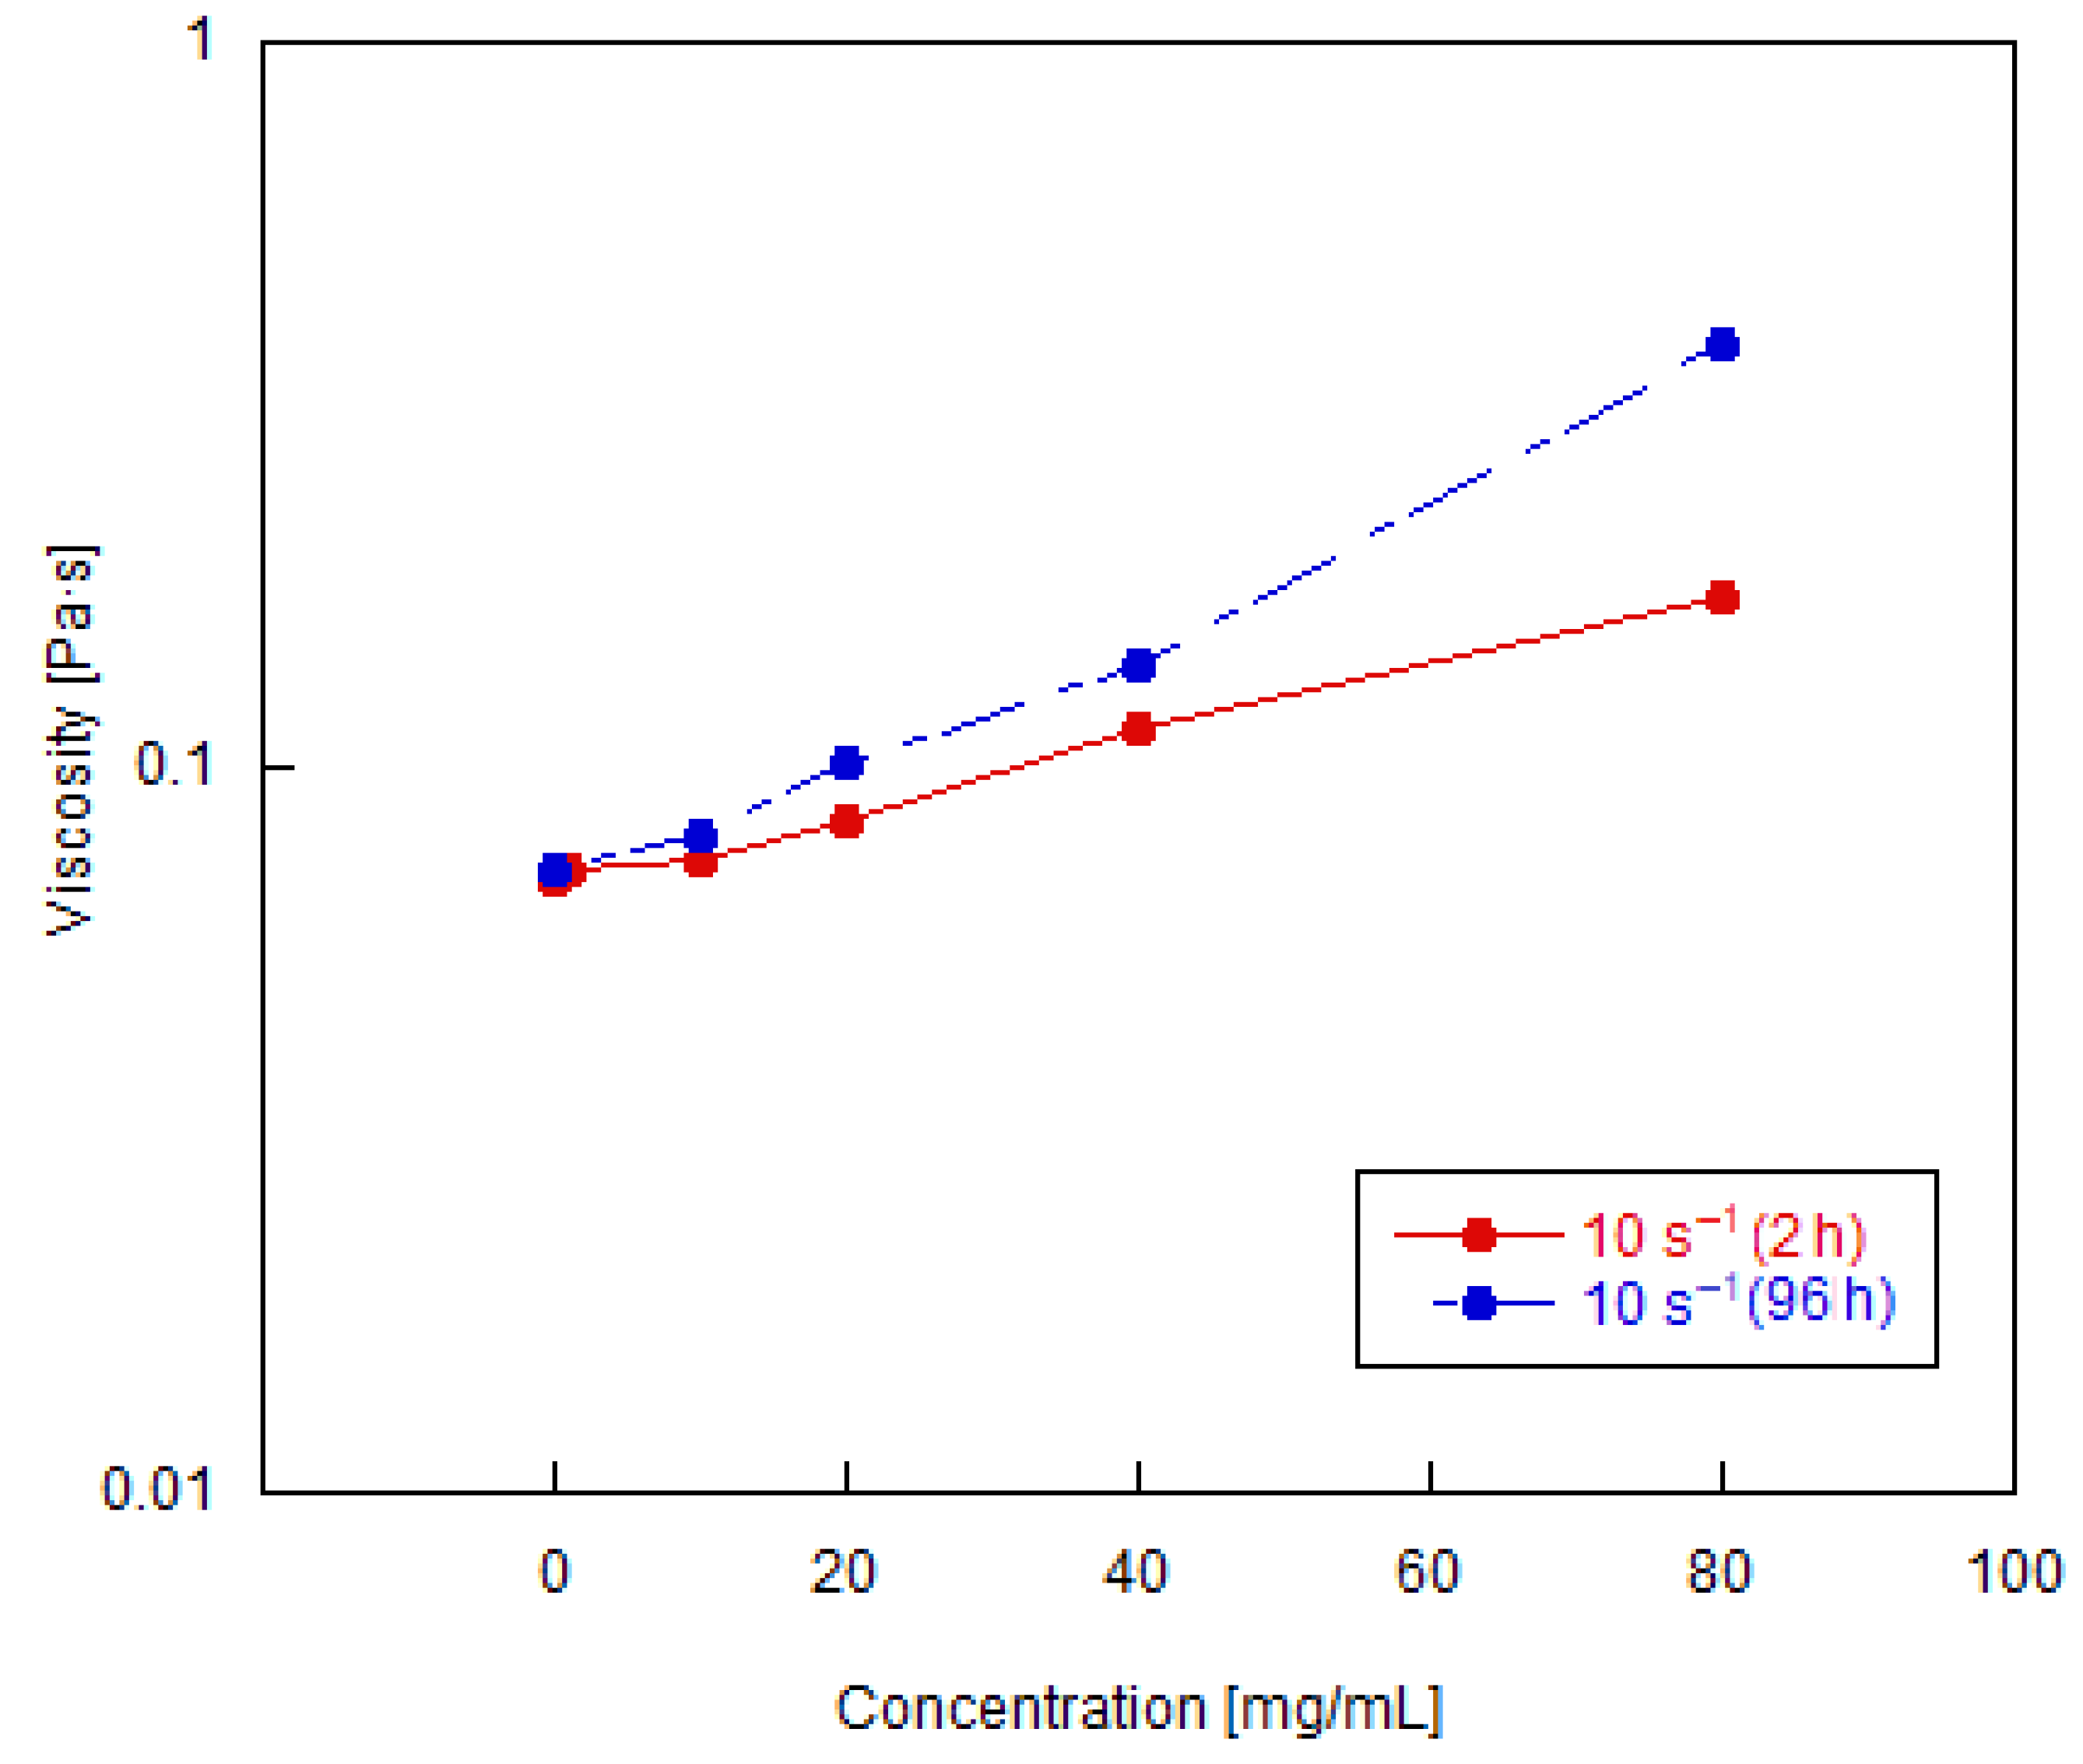
The GO particles have an extremely large specific surface and can interact with a large amount of polymer in suspension. Thangavel and Venugopal (2014) evaluated different levels of GO oxidation in aqueous solution and concluded that the more oxidized GO has higher interaction capacity than the less oxidized GO. They argued that the oxidation level of GO increases due to the increase of negatively charged molecules in hydrophilic functional groups [26]. Wang et al. (2004) used the tubeless siphon technique and silica nanoparticles to confirm that one factor that can lead to increasing shear viscosity of a polymer solution is the addition of nanoparticles to the solution, since the extension of polymer bridges between the particles increases the flow resistance [43]. The basic mechanism of this interesting rheological behavior is the Bridging effect [44], which implies that due to the size effect, multiple particles are connected by the intra-chain bridge of a polymer, as it is shown in Figure 11. Therefore, the larger viscosity observed with increasing oxidation time for GO, can be explained by the fact that the longer the oxidation time, higher percentage of oxygenated groups are inserted into the graphite structure, which helps the layers to exfoliated easier, as observed in the AFM and Raman results. This process presents a more dispersed morphology, developing a better interaction between the nanoparticles and the polymer (interaction made by hydrogen bonds), where the PEG chains are connected on the GO sheets forming larger aggregates in the shaped of a network that restricts the suspension mobility and leads to an increase in viscosity. Thus, since the GO obtained with 96h of oxidation was more oxidized as evidenced by the characterization techniques, the viscosity of the suspensions made with this GO is higher than that of the GO obtained with 2 h of oxidation.
Figure 12 shows that for both oxidation times there is an increase in viscosity as the concentration is increased. According to Kamibayashi et al. (2008), increasing particle concentration slowly generates an increase in the suspension viscosity [44]. Einstein’s theory of suspension rheology says that the distortion of the velocity field in the surroundings of each particle induces an increase in viscosity [45].
The rheological behavior of these observed suspensions can be discussed in terms of the networks formed between GO nanoparticles and the polymer. As it can be seen from Figure 13, at rest, these networks are kept structured. As a shear rate begins to apply, the network structure is broken, and the particles are oriented along the flow direction. This effect, together with the slip/orientation of the shear GO layers is responsible by the shear thinning behavior that is observed in the more concentrated suspensions [46]. In the lower concentration suspensions, the network is already less structured and therefore no shear thinning is observed. This behavior is shown in Figure 14, which also shows that in the flow curve of the GO 96 h the change of the Newtonian behavior to a pseudoplastic behavior begins to be observed at suspensions with concentration of 40 mg/mL, whereas in the tests made for concentrations of 0.1 to 80 mg/mL of GO 2 h all samples presented a Newtonian behavior in the shear rate range analyzed.
According to Shu et al. (2016), in suspensions with very low concentrations of GO, as the sheets of GO are individually dispersed in the polymer with weak interaction among them, the rheological behavior of the GO suspensions is Newtonian. When the GO concentration is above a critical concentration, the molecules have a certain orientational order, exhibiting a characteristic shear-thinning behavior under constant shear flow [29].
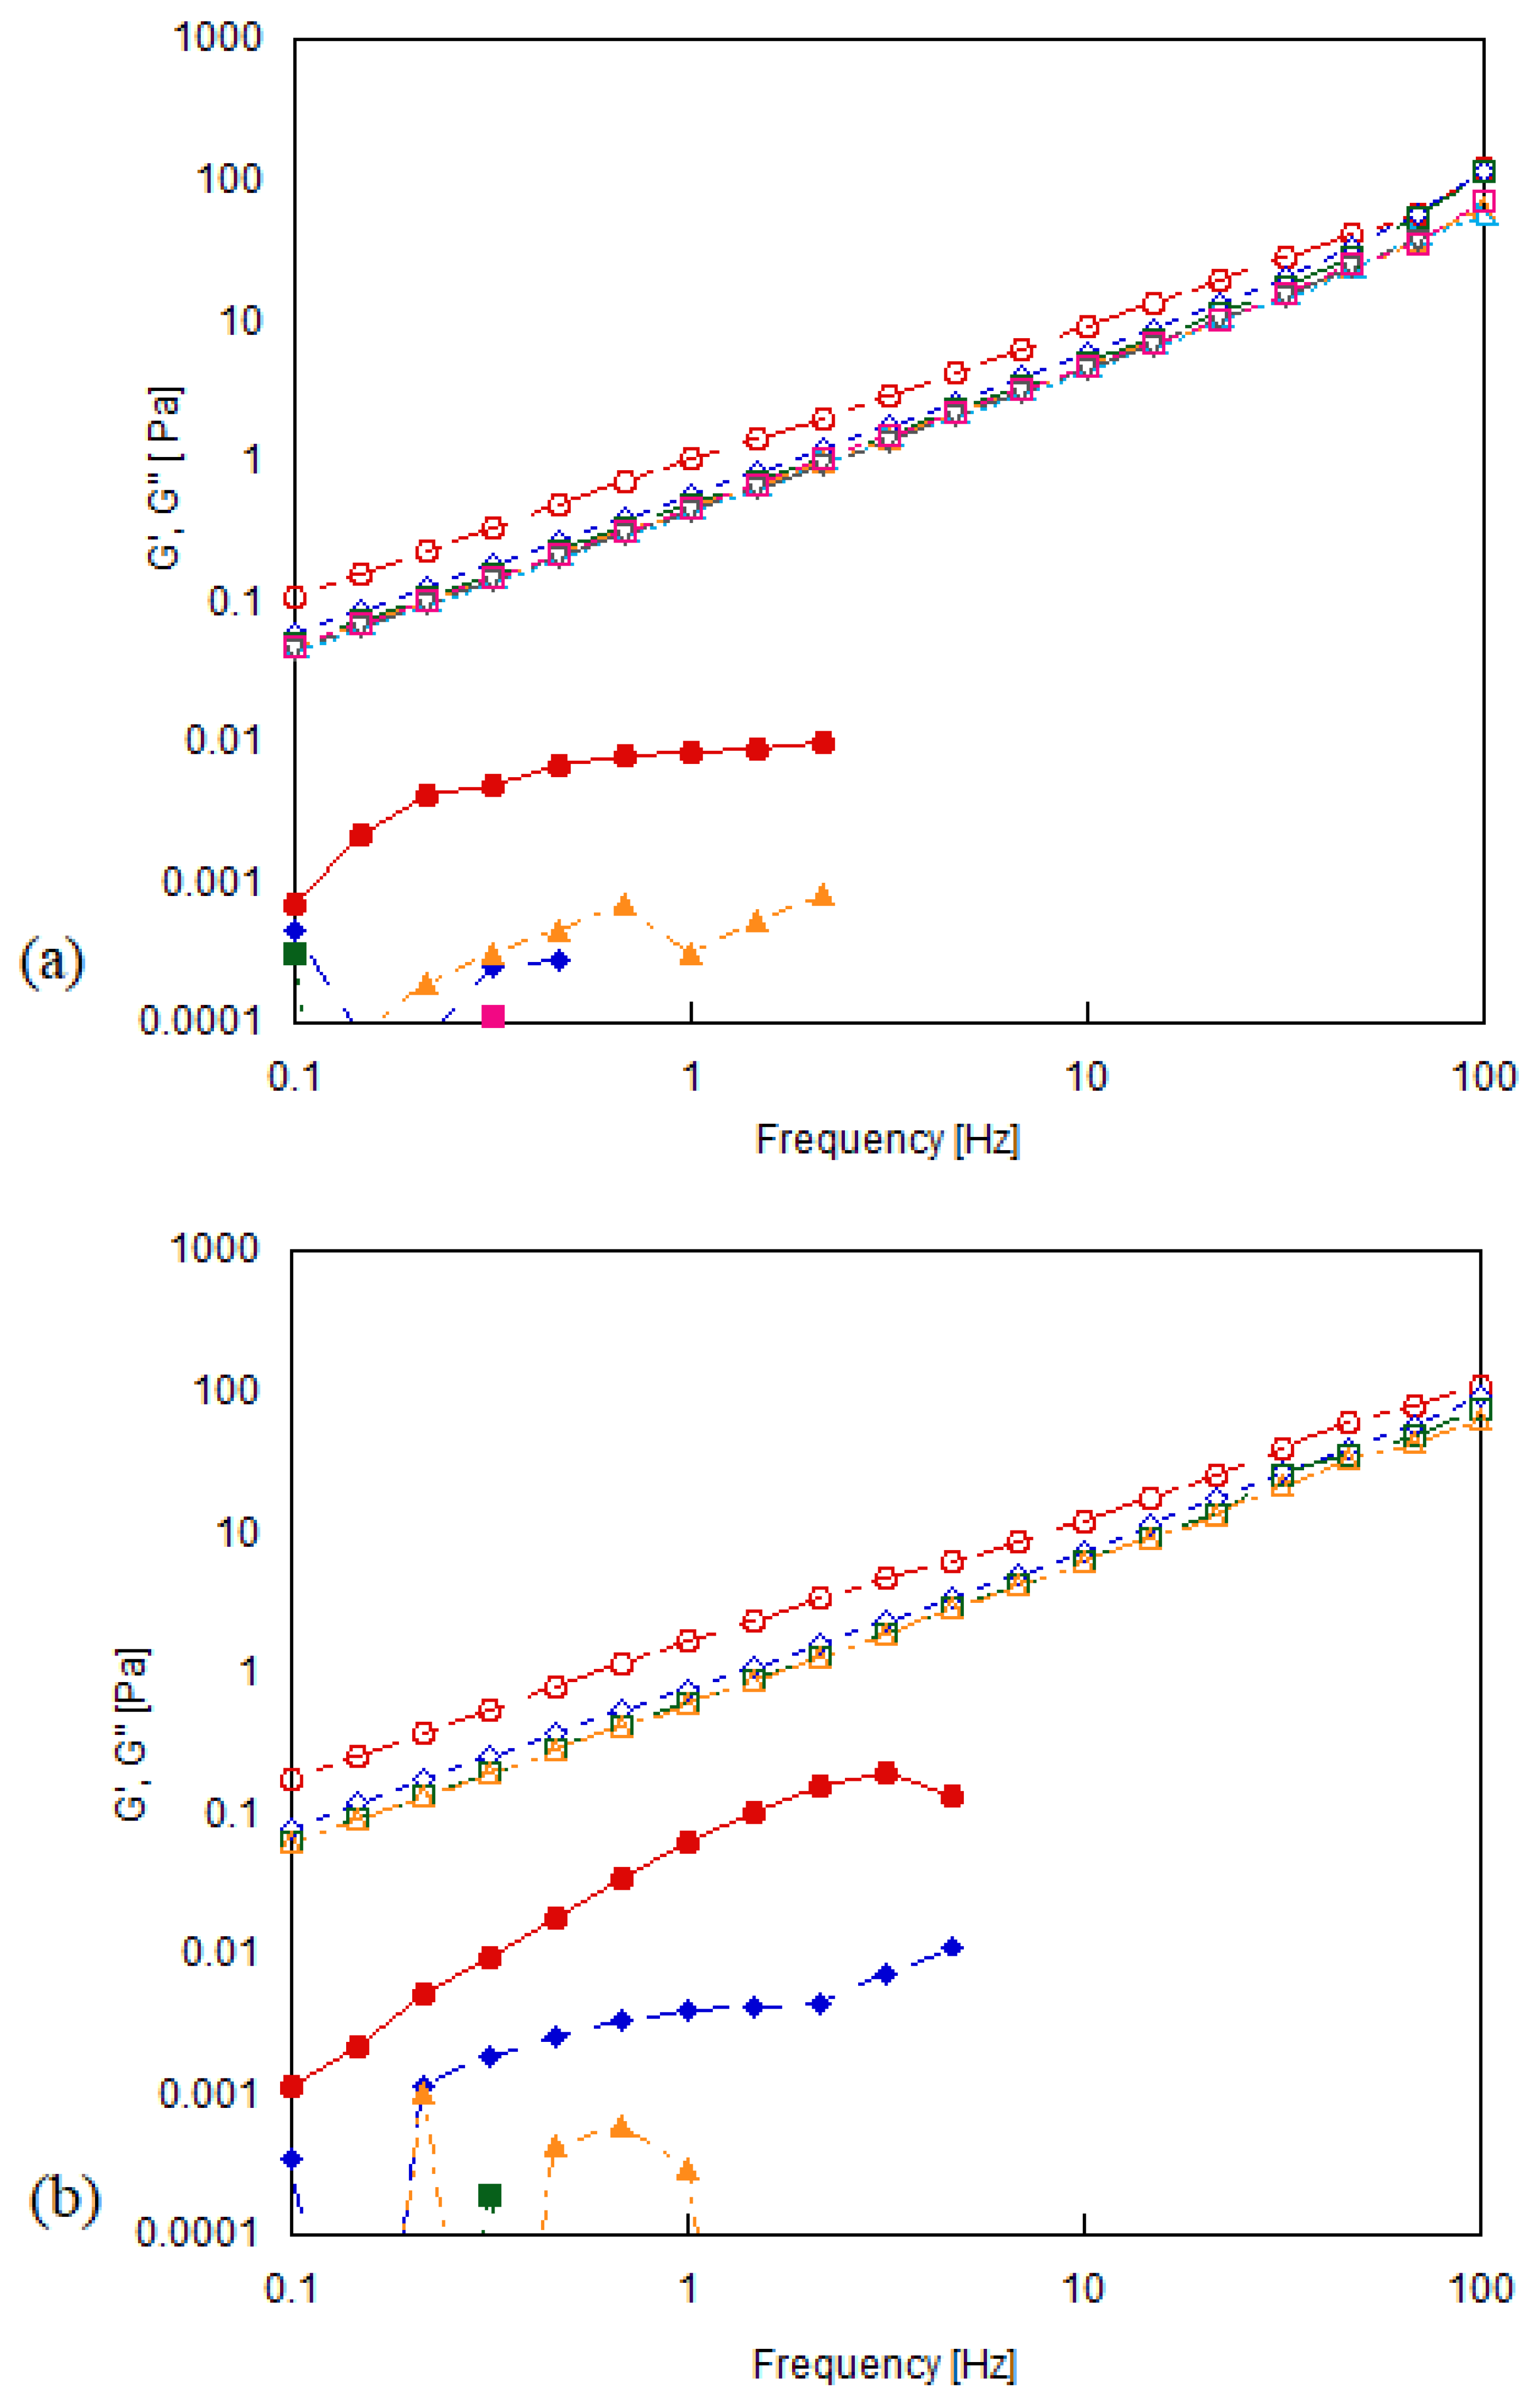
Small amplitude oscillatory shear (SAOS) can detect the dynamic mechanical response of complex fluids near equilibrium state. Typical curves of dynamic storage (G′) and loss modulus (G″) as a function of angular frequency (ω) for the GO suspensions with different concentrations were determined for the GO suspensions. Strain sweep tests were performed in order to obtain the linear viscoelastic region that serves as input data for the frequency sweep tests. The strain used was within the linear viscoelastic range for all tests and the frequency sweep measurement was performed in the range of 0.1–100 Hz for all samples. The low frequency module mainly provides information about the aggregate network and the high frequency response is dominated by the contributions of the polymer matrix [47]. Values below 0.1 Hz have been discarded since they presented a very low torque value, below the equipment limit, and values above 100 Hz are also discarded since the phase angle is not between 0° and 90°, and the material structure might be under irreversible elastic recovery [48].
Figure 15 shows the storage (G′) and loss (G″) moduli as a function of frequency. For GO 2 h tests, from pure polymer to 40 mg/mL suspension, the loss modulus does not differ significantly, presenting values very close to all concentrations. The storage modulus is practically negligible compared to the loss modulus values, meaning that the material does not present significant elasticity, suggesting poor interaction of GO with PEG. However, the 80 mg/mL suspension began to show slight signs of elasticity. This may be justified by the fact that at low concentrations, GO sheets are randomly dispersed in the polymer matrix and the increase in concentration was too small to cause significant effects on the loss modulus, as the dominant part was still the polymer. For the GO 96 h tests, it can be observed that the suspension with 80 mg/mL GO concentration started to show loss modulus values slightly higher than the suspensions with other concentrations, and the storage modulus started to increase significantly. This may lead to the conclusion that the suspension of GO 96 h with 80 mg/mL concentration is close to the critical concentration, for the present system. These results can suggest that the suspensions presented similar values of the loss modulus, however the higher oxidation time suspension shows a higher storage modulus response, or higher elastic behavior. This observation is another indication that the more oxidized GO, the more exfoliated the layers are, as it was shown above, and consequently a greater interaction with the PEG compared to the less oxidized GO.

4. Conclusions

This work presented a rheological characterization of suspensions of graphene oxide (GO) nanosheets in polyethylene glycol (PEG). The effect of oxidation time and concentration were investigated. The GO characterization techniques showed that the oxidation occurred and that the longer the oxidation time, the greater the number of functional groups introduced in the graphite structure, increasing interplanar distances. This improves the process of exfoliation, resulting in lower particles size and larger interaction with the polymer chains, due to the bridge effect, which restricts the mobility of the suspension and increases flow resistance. Therefore, larger oxidation times lead to higher suspension viscosity. Regarding the concentration, it was also possible to notice an increase in viscosity with the increase of nanoparticles concentration in the suspensions.
The rheological tests also allowed to investigate the dependence of the suspension viscosity with the shear rate, where it was possible to observe the change from Newtonian to pseudoplastic behavior as the concentration increases, for the GO suspensions prepared with 96 h of oxidation. Moreover, through the oscillatory tests, it was possible to verify that only the most concentrated 96 h GO suspensions showed elasticity.
The results obtained from steady state shear tests and SAOS frequency sweep measurements serve to understand the interaction between nanostructure and the mechanical response of GO/PEG and introduce information about GO/other polymers suspensions. These mechanisms and behavior can provide useful guidelines for nanofluids production.
Since we have demonstrated that the compatibility between PEG and GO has been improved with the degree of oxidation of graphene oxide, this system can be used as well as a model system for studies on electrorheological (ER) suspensions. Such suspensions are important on the field of smart materials, since ER fluids usually consist of semi-conducting or polarizable materials suspended, and their rheological properties can be tuned by electrical field stimuli. Therefore, the introduction of polar functional groups on the surface of the GO, combined with the compatibility with PEG, allow the system to be polarized by an external electric field and subsequently analyzed as a model ER suspension for fundamental studies.
As a suggestion for future work, with the aim to improve the knowledge regarding the properties of graphene oxide suspensions, studies on extensional rheological characterization should be further explored. This type of flow has great importance in industrial processes with large variations in areas, such as flows in extrusion, spray coating, ink jet, among others. In addition, measurements with PEG of other molecular weights in order to evaluate how the bridge effect may interfere with the viscosity of these suspensions are also important.

Author Contributions

Conceptualization, Y.C.F.S., M.F.N. and R.J.E.A.; Formal analysis, Y.C.F.S., E.C., M.F.N. and R.J.E.A.; Funding acquisition, M.F.N. and R.J.E.A.; Investigation, Y.C.F.S. and E.C.; Methodology, Y.C.F.S. and E.C.; Project administration, R.J.E.A.; Resources, M.F.N. and R.J.E.A.; Supervision, M.F.N. and R.J.E.A.; Writing—Original draft, Y.C.F.S., M.F.N. and R.J.E.A.; Writing—Review & editing, M.F.N. and R.J.E.A. All authors have read and agreed to the published version of the manuscript.

Funding

This research received no external funding.

Acknowledgments

The authors would like to acknowledge Fundo Mackenzie de Pesquisa (MackPesquisa, Project Number 181009), Conselho Nacional de Desenvolvimento Científico e Tecnológico (CNPq, Project Number: 409917/2018-4), Coordenação de Aperfeiçoamento de Pessoal de Nível Superior (CAPES), Fundação de Amparo à Pesquisa do Estado do Rio de Janeiro (FAPERJ), Fundação de Amparo à Pesquisa do Estado do São Paulo (FAPESP), and Petrobras. The authors would also to thank Lorena Rodrigues da Costa Moraes for the help provided and fruitful discussion during this study.

Conflicts of Interest

The authors declare no conflict of interest.

References

  1. Randviir, E.P.; Brownson, D.A.; Banks, C.E. A decade of graphene research: Production, applications and outlook. Mater. Today 2014, 17, 426–432. [Google Scholar] [CrossRef]
  2. Neuberger, N.; Adidharma, H.; Fan, M. Graphene: A review of applications in the petroleum industry. J. Pet. Sci. Eng. 2018, 167, 152–159. [Google Scholar] [CrossRef]
  3. Geim, A.K.; Novoselov, K.S. The rise of graphene. Nat. Mater. 2007, 6, 183–191. [Google Scholar] [CrossRef]
  4. Konios, D.; Stylianakis, M.M.; Stratakis, E.; Kymakis, E. Dispersion behaviour of graphene oxide and reduced graphene oxide. J. Colloid Interface Sci. 2014, 430, 108–112. [Google Scholar] [CrossRef] [PubMed]
  5. Ibrahim, A.; Ridha, S.; Amer, A.; Shahari, R.; Ganat, T. Influence of Degree of Dispersion of Noncovalent Functionalized Graphene Nanoplatelets on Rheological Behaviour of Aqueous Drilling Fluids. Int. J. Chem. Eng. 2019, 2019, 1–11. [Google Scholar] [CrossRef]
  6. Singh, V.; Joung, D.; Zhai, L.; Das, S.; Khondaker, S.I.; Seal, S. Graphene based materials: Past, present and future. Prog. Mater. Sci. 2011, 56, 1178–1271. [Google Scholar] [CrossRef]
  7. Zhong, Y.; Zhen, Z.; Zhu, H. Graphene: Fundamental research and potential applications. FlatChem 2017, 4, 20–32. [Google Scholar] [CrossRef]
  8. Yu, W.; Xie, H.; Bao, D. Enhanced thermal conductivities of nanofluids containing graphene oxide nanosheets. Nanotechnology 2009, 21, 055705. [Google Scholar] [CrossRef]
  9. Frank, I.W.; Tanenbaum, D.M.; Van Der Zande, A.M.; McEuen, P.L. Mechanical properties of suspended graphene sheets. J. Vac. Sci. Technol. B 2007, 25, 2558–2561. [Google Scholar] [CrossRef] [Green Version]
  10. Lowe, S.E.; Zhong, Y.L. Challenges of Industrial-Scale Graphene Oxide Production. In Graphene Oxide: Fundamentals and Applications; Dimiev, A.M., Eigler, S., Eds.; Wiley: Hoboken, NJ, USA, 2017; pp. 410–431. [Google Scholar]
  11. Hongjuan, S.; Tongjiang, P.; Bo, L.; Caifeng, M.; Liming, L.; Quanjun, W.; Xiaoyi, L. Study of oxidation process occurring in natural graphite deposits. RSC Adv. 2017, 7, 51411–51418. [Google Scholar] [CrossRef] [Green Version]
  12. Zhang, J.; Seyedin, S.; Gu, Z.; Salim, N.; Wang, X.; Razal, J.M. Liquid Crystals of Graphene Oxide: A Route Towards Solution-Based Processing and Applications; Wiley: Hoboken, NJ, USA, 2017; Volume 34. [Google Scholar]
  13. Wick, P.; Louw-Gaume, A.E.; Kucki, M.; Krug, H.F.; Kostarelos, K.; Fadeel, B.; Bianco, A. Classification Framework for Graphene-Based Materials. Angew. Chem. Int. Ed. 2014, 53, 7714–7718. [Google Scholar] [CrossRef] [Green Version]
  14. Imperiali, L.; Liao, K.H.; Clasen, C.; Fransaer, J.; Macosko, C.W.; Vermant, J. Interfacial rheology and structure of tiled graphene oxide sheets. Langmuir 2012, 28, 7990–8000. [Google Scholar] [CrossRef]
  15. Liu, H.; Zhang, L.; Guo, Y.; Cheng, C.; Yang, L.; Jiang, L.; Zhu, D. Reduction of graphene oxide to highly conductive graphene by Lawesson’s reagent and its electrical applications. J. Mater. Chem. C 2013, 1, 3104–3109. [Google Scholar] [CrossRef]
  16. Shao, G.; Lu, Y.; Wu, F.; Yang, C.; Zeng, F.; Wu, Q. Graphene oxide: The mechanisms of oxidation and exfoliation. J. Mater. Sci. 2012, 47, 4400–4409. [Google Scholar] [CrossRef]
  17. Hack, R.; Correia, C.H.G.; Zanon, R.A.D.S.; Pezzin, S.H. Characterization of graphene nanosheets obtained by a modified Hummer’s method. Matéria 2018, 23, e-11988. [Google Scholar] [CrossRef]
  18. Aladag, B.; Halelfadl, S.; Doner, N.; Maré, T.; Duret, S.; Estellé, P. Experimental investigations of the viscosity of nanofluids at low temperatures. Appl. Energy 2012, 97, 876–880. [Google Scholar] [CrossRef] [Green Version]
  19. Ding, Y.; Alias, H.; Wen, D.; Williams, R.A. Heat transfer of aqueous suspensions of carbon nanotubes (CNT nanofluids). Int. J. Heat Mass Transf. 2006, 49, 240–250. [Google Scholar] [CrossRef]
  20. Wu, Z.; Wang, L.; Sundén, B.; Wadsö, L. Aqueous carbon nanotube nanofluids and their thermal performance in a helical heat exchanger. Appl. Therm. Eng. 2016, 96, 364–371. [Google Scholar] [CrossRef]
  21. Jama, M.; Singh, T.; Gamaleldin, S.M.; Koc, M.; Samara, A.; Isaifan, R.J.; Atieh, M.A. Critical Review on Nanofluids: Preparation, Characterization, and Applications. J. Nanomater. 2016, 2016, 1–22. [Google Scholar] [CrossRef] [Green Version]
  22. Rudyak, V.Y. Viscosity of Nanofluids—Why It Is Not Described by the Classical Theories. Adv. Nanoparticles 2013, 2, 266–279. [Google Scholar] [CrossRef] [Green Version]
  23. Einstein, A. Eine Neue Bestimmung der Molekiildimensionen. Ann. Der. Phys. 1906, 19, 289–306. [Google Scholar] [CrossRef] [Green Version]
  24. Utomo, A.T.; Poth, H.; Robbins, P.T.; Pacek, A.W. Experimental and theoretical studies of thermal conductivity, viscosity and heat transfer coefficient of titania and alumina nanofluids. Int. J. Heat Mass Transf. 2012, 55, 7772–7781. [Google Scholar] [CrossRef]
  25. Zhou, Z.; Scales, P.J.; Boger, D.V. Chemical and physical control of the rheology of concentrated metal oxide suspensions. Chem. Eng. Sci. 2001, 56, 2901–2920. [Google Scholar] [CrossRef]
  26. Thangavel, S.; Venugopal, G. Understanding the adsorption property of graphene-oxide with different degrees of oxidation levels. Powder Technol. 2014, 257, 141–148. [Google Scholar] [CrossRef]
  27. Naficy, S.; Jalili, R.; Aboutalebi, S.H.; Gorkin, R.A., III; Konstantinov, K.; Innis, P.C.; Wallace, G.G. Graphene oxide dispersions: Tuning rheology to enable fabrication. Mater. Horiz. 2014, 1, 326–331. [Google Scholar] [CrossRef] [Green Version]
  28. Del Giudice, F.; Shen, A.Q. Shear rheology of graphene oxide dispersions. Curr. Opin. Chem. Eng. 2017, 16, 23–30. [Google Scholar] [CrossRef]
  29. Shu, R.; Yin, Q.; Xing, H.; Tan, D.; Gan, Y.; Xu, G. Colloidal and rheological behavior of aqueous graphene oxide dispersions in the presence of poly (ethylene glycol). Colloids Surf. A Physicochem. Eng. Asp. 2016, 488, 154–161. [Google Scholar] [CrossRef]
  30. Sadri, R.; Zangeneh Kamali, K.; Hosseini, M.; Zubir, N.; Kazi, S.N.; Ahmadi, G.; Golsheikh, A.M. Experimental study on thermo-physical and rheological properties of stable and green reduced graphene oxide nanofluids: Hydrothermal assisted technique. J. Dispers. Sci. Technol. 2017, 38, 1302–1310. [Google Scholar] [CrossRef]
  31. Varges, P.R.; Costa, C.M.; Fonseca, B.S.; Naccache, M.F.; de Souza Mendes, P.R. Rheological characterization of carbopol® dispersions in water and in water/glycerol solutions. Fluids 2019, 4, 3. [Google Scholar] [CrossRef] [Green Version]
  32. Lopes, C.W.; Penha, F.G.; Braga, R.M.; Melo, D.M.D.A.; Pergher, S.B.; Petkowicz, D.I. Síntese e caracterização de argilas organofílicas contendo diferentes teores do surfactante catiônico brometo de hexadeciltrimetilamônio. Química Nova 2011, 34, 1152–1156. [Google Scholar] [CrossRef]
  33. De Oliveira, Y.D.; Amurin, L.G.; Valim, F.C.; Fechine, G.J.; Andrade, R.J. The role of physical structure and morphology on the photodegradation behaviour of polypropylene-graphene oxide nanocomposites. Polymer 2019, 176, 146–158. [Google Scholar] [CrossRef]
  34. Ferreira, E.H.; Andrade, R.J.; Fechine, G.J. The “Superlubricity State” of Carbonaceous Fillers on Polyethylene-Based Composites in a Molten State. Macromolecules 2019, 52, 9620–9631. [Google Scholar] [CrossRef]
  35. Malard, L.M.; Pimenta, M.A.A.; Dresselhaus, G.; Dresselhaus, M.S. Raman spectroscopy in graphene. Phys. Rep. 2009, 473, 51–87. [Google Scholar] [CrossRef]
  36. Stankovich, S.; Dikin, D.A.; Piner, R.D.; Kohlhaas, K.A.; Kleinhammes, A.; Jia, Y.; Ruoff, R.S. Synthesis of graphene-based nanosheets via chemical reduction of exfoliated graphite oxide. Carbon 2007, 45, 1558–1565. [Google Scholar] [CrossRef]
  37. Kudin, K.N.; Ozbas, B.; Schniepp, H.C.; Prud’Homme, R.K.; Aksay, I.A.; Car, R. Raman spectra of graphite oxide and functionalized graphene sheets. Nano Lett. 2008, 8, 36–41. [Google Scholar] [CrossRef]
  38. Jiang, W.; Nadeau, G.; Zaghib, K.; Kinoshita, K. Thermal analysis of the oxidation of natural graphite—Effect of particle size. Thermochim. Acta 2000, 351, 85–93. [Google Scholar] [CrossRef]
  39. Socrates, G. Infrared and Raman Characteristic Group Frequencies: Tables and Charts; John Wiley Sons: Hoboken, NJ, USA, 2004. [Google Scholar]
  40. Smith, B.C. Infrared Spectral Interpretation: A Systematic Approach; CRC Press: Boca Raton, FL, USA, 1998. [Google Scholar]
  41. Luceño-Sánchez, J.A.; Maties, G.; Gonzalez-Arellano, C.; Diez-Pascual, A.M. Synthesis and characterization of graphene oxide derivatives via functionalization reaction with hexamethylene diisocyanate. Nanomaterials 2018, 8, 870. [Google Scholar] [CrossRef] [Green Version]
  42. Taha-Tijerina, J.J. Thermal Transport and Challenges on Nanofluids Performance. Microfluid. Nanofluidics 2018, 1, 215–256. [Google Scholar]
  43. Wang, J.; Bai, R.Y.; Joseph, D.D. Nanoparticle-laden tubeless and open siphons. J. Fluid Mech. 2004, 516, 335–348. [Google Scholar] [CrossRef] [Green Version]
  44. Kamibayashi, M.; Ogura, H.; Otsubo, Y. Shear-thickening flow of nanoparticle suspensions flocculated by polymer bridging. J. Colloid Interface Sci. 2008, 321, 294–301. [Google Scholar] [CrossRef]
  45. Mueller, S.; Llewellin, E.W.; Mader, H.M. The rheology of suspensions of solid particles. Proc. R. Soc. A Math. Phys. Eng. Sci. 2010, 466, 1201–1228. [Google Scholar] [CrossRef] [Green Version]
  46. Giannelis, E.P. Polymer-layered silicate nanocomposites: Synthesis, properties and applications. Appl. Organomet. Chem. 1998, 12, 675–680. [Google Scholar] [CrossRef]
  47. Thomas, S.; Muller, R.; Abraham, J. Rheology and Processing of Polymer Nanocomposites; John Wiley & Sons: Hoboken, NJ, USA, 2016. [Google Scholar]
  48. Mezger, T.G. The Rheology Handbook: For Users of Rotational and Oscillatory Rheometers; Vincentz Network GmbH & Co KG: Hannover, Germany, 2006. [Google Scholar]
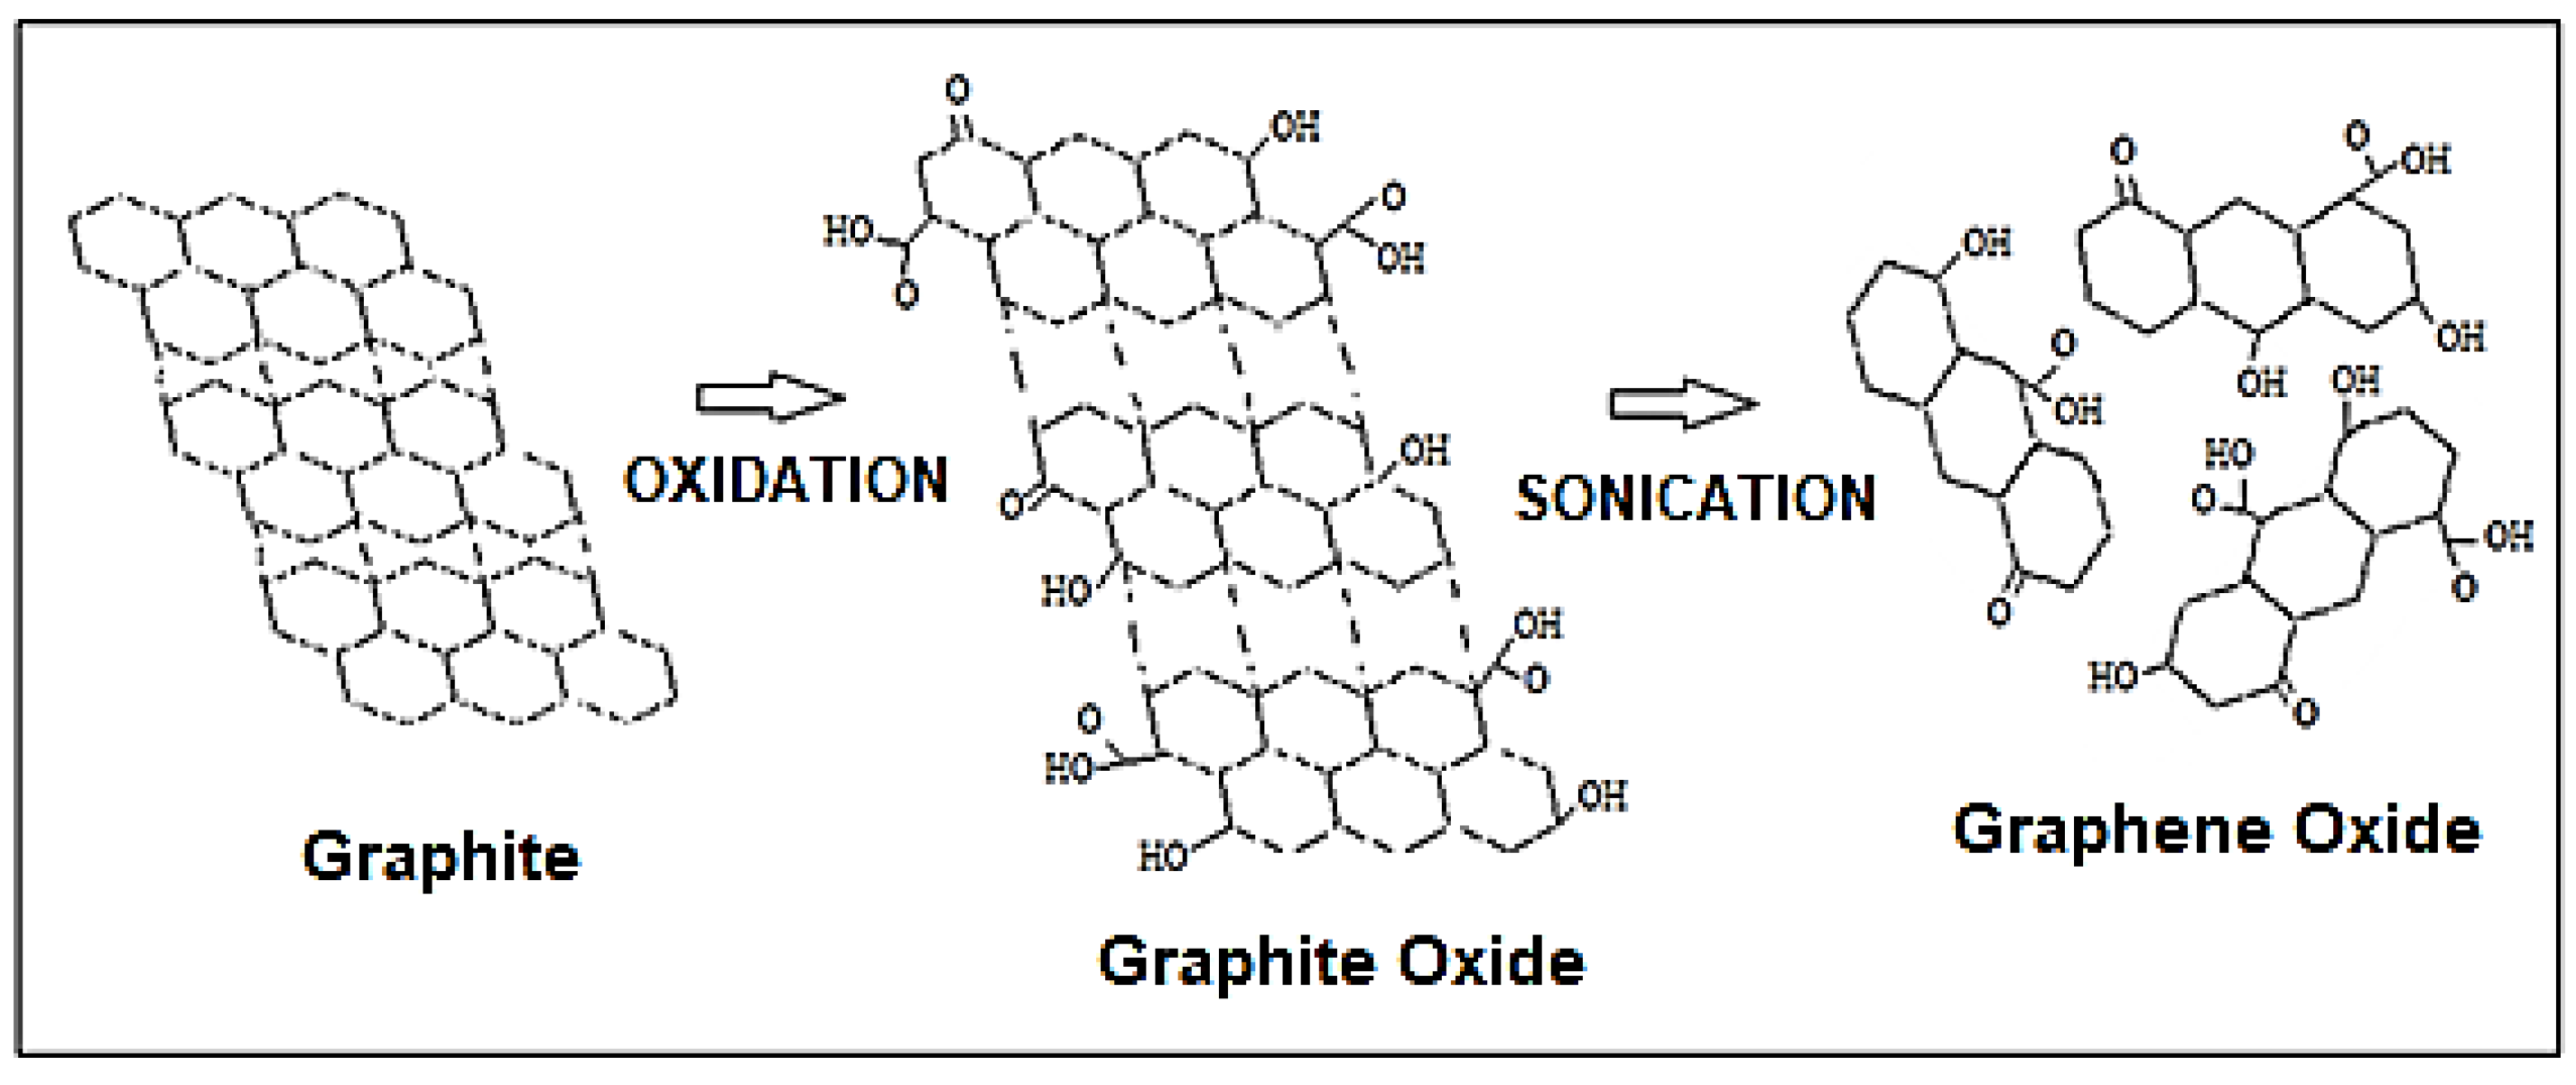
Figure 1. Schematic model of the synthesis to obtain GO by oxidation of graphite.
Fluids 05 00041 g001
Figure 2. XRD patterns for Graphite, GrO 2 h and GrO 96 h.
Fluids 05 00041 g002
Figure 3. Raman spectrum of Graphite, GO 2 h and GO 96 h.
Fluids 05 00041 g003
Figure 4. Thermogravimetric curves for Graphite, GrO 2 h and GrO.
Fluids 05 00041 g004
Figure 5. FTIR spectrum of GO with (a) 2 h (b) 96 h of oxidation.
Fluids 05 00041 g005
Figure 6. Histograms of frequency (%) as a function of their height (nm) of GO sheets of (a) 2 h of oxidation and (b) 96 h of oxidation.
Fluids 05 00041 g006
Figure 7. AFM topographic imagens of GO aqueous suspension and the height profile for a single GO sheet of: (a) 2 h and (b) 96 h of oxidation.
Fluids 05 00041 g007
Figure 8. Stability tests for suspensions with concentrations of (a) 0.1 and (b) 80 mg/mL of GO 2 h comparing suspensions with agitation (filled symbols) and without agitation (open symbols).
Fluids 05 00041 g008
Figure 9. Flow curve applying a shear rate of 10 to 1000 s−1 (filled symbols) and then 1000 to 10 s−1 (open symbols) for suspensions of GO 2 h with concentrations of (a) 0.1 and (b) 80 mg/mL.
Fluids 05 00041 g009
Figure 10. Flow curve comparing viscosity for suspensions with 40 mg/mL of GO with different oxidation times.
Fluids 05 00041 g010
Figure 11. Schematic representation of the Bridging effect.
Fluids 05 00041 g011
Figure 12. Shear viscosity of suspensions of GO as a function of different GO concentrations at shear rate 10 s−1.
Fluids 05 00041 g012
Figure 13. Schematic representation of the breakdown of the structure into flocs with increasing shear rates.
Fluids 05 00041 g013
Figure 14. Steady shear rate flow behavior of the (a) GO of 2 h (b) GO of 96 h of oxidation for concentrations of: ● red—80 mg/mL, ▲ orange—40 mg/mL, ♦ green—20 mg/mL, ■ blue—10 mg/mL, ► purple—1 mg/mL, ▼ grey—0.1 mg/mL and ● yellow—0 mg/mL.
Fluids 05 00041 g014
Figure 15. Frequency Sweep of the loss (open symbols) and storage (filled symbols) modulus for suspensions of (a) GO of 2 h (b) GO of 96 h of oxidation with different concentrations: ● red—80 mg/mL, ♦ dark blue—40 mg/mL, ■ green—20 mg/mL, ▲ orange—10 mg/mL, ► light blue—1 mg/mL, ▼ grey—0.1 mg/mL and ■ pink—0 mg/mL.
Fluids 05 00041 g015
Table 1. Concentration of the PEG-GO suspensions used for the rheological studies.
Concentration mg/mLConcentration wt.%
0.10.01
10.1
101
202
404
808