Article

Density, Viscosity and Free Energy of Activation for Viscous Flow of Monoethanol Amine (1) + H2O (2) + CO2 (3) Mixtures

Faculty of Technology, Natural Sciences and Maritime Studies, University of South-Eastern Norway, Kjølnes Ring 56, 3901 Porsgrunn, Norway
*
Author to whom correspondence should be addressed.
Fluids 2020, 5(1), 13; https://doi.org/10.3390/fluids5010013
Submission received: 4 December 2019 / Revised: 2 January 2020 / Accepted: 7 January 2020 / Published: 9 January 2020

Abstract

:
Densities and viscosities of aqueous monoethanol amine (MEA) and CO2-loaded aqueous MEA are highly relevant in engineering calculations to perform process design and simulations. Density and viscosity of the aqueous MEA were measured in the temperature range of 293.15 K to 363.15 K with MEA mass fractions ranging from 0.3 to 1.0. Densities of the aqueous MEA were fitted for a density correlation. Eyring’s viscosity model based on absolute rate theory was adopted to determine the excess free energy of activation for viscous flow of aqueous MEA mixtures and was correlated by a Redlich–Kister polynomial. Densities and viscosities of CO2-loaded MEA solutions were measured in the temperature range of 293.15 K to 353.15 K with MEA mass fractions of 0.3, 0.4 and 0.5. The density correlation used to correlate aqueous MEA was modified to fit CO2-loaded density data. The free energy of activation for viscous flow for CO2-loaded aqueous MEA solutions was determined by Eyring’s viscosity model and a correlation was proposed to represent free energy of activation for viscous flow and viscosity. This can be used to evaluate quantitative and qualitative properties in the MEA + H2O + CO2 mixture.

Graphical Abstract

1. Introduction

Post-combustion CO2 capture (PCC) using absorption and desorption has gained great attention in the last decades and several amines have been investigated for their absorption efficiency. In acid gas treatment, monoethanol amine (MEA, IUPAC name: 2-aminoethanol) has been used since 1930 [1]. It is the benchmark amine for the evaluation of other amines in CO2 capture performance considering absorption efficiency, reaction rates, energy demand and corrosion resistance. A blend of 30% MEA with 70% H2O by mass is a standard in PCC. Higher reaction rates of MEA with CO2 compared to secondary and tertiary amines enables optimization of the dimensions and operational parameters of the absorber column. MEA’s low-absorption capacity and high-energy demand for desorption and poor corrosion resistance are arguments against the use of MEA at the commercial scale [2,3].
Density and viscosity of pure, aqueous and CO2-loaded aqueous MEA have been studied and reported in the literature under different temperatures, MEA concentrations and CO2 loadings [1,4,5,6,7,8,9,10,11,12]. These data are vital for development of empirical correlations that are useful in various aspects of process equipment design and process simulations. Density is important to determine the physical solubility of CO2 in solvent, the solvent kinetics and mass transfer. Viscosity is frequently used in the modified Stoke–Einstein equation to estimate diffusivity that is necessary for calculating mass transfer and kinetic properties [13,14]. Many references are available for data of aqueous MEA solutions under different MEA concentrations and temperatures. There is a lack of measured data for physical properties of CO2-loaded solutions at different CO2 loadings under different MEA concentrations. In order to reduce the unmeasured regions and to check the validity of measured data, further experimental studies are necessary.
Amundsen, Øi and Eimer [6] have used the McAllister three-body model [15] to represent the kinematic viscosity. Weiland, Dingman, Cronin and Browning [9] and Hartono, Mba and Svendsen [10] measured both density and viscosity of CO2-loaded aqueous MEA solutions and proposed correlations to fit the data. The approach of using a Redlich-Kister [16] type polynomial to predict excess volume for the aqueous MEA solutions in the density correlations is widely used. A similar approach to correlate excess viscosity is adopted by Islam, et al. [17] for aqueous MEA.
In this work, density and viscosity of aqueous MEA and CO2-loaded aqueous MEA were measured. The density correlation proposed by Aronu, Hartono and Svendsen [14] for the aqueous amino acid salt and amine amino acid salt solutions was used to correlate the density data of aqueous MEA. The same correlation was modified to predict the density of CO2-loaded aqueous MEA solutions. The parameters of the correlations were found through a regression analysis. Eyring’s viscosity model [18] was used to calculate the free energy of activation for viscous flow of the aqueous MEA solutions and parameters of the Redlich-Kister type polynomial were estimated by regression. For the viscosity of CO2-loaded solutions, the difference of activation energy between CO2-loaded aqueous MEA and aqueous MEA solutions were calculated, and a correlation was proposed.

2. Materials and Methods

2.1. Sample Preparation and CO2 Loading Analysis

Descriptions of materials used in this study are given in Table 1. The Milli-Q water (resistivity 18.2 MΩ·cm) was degassed using a rotary evaporator connected to a vacuum pump to remove any dissolved gasses. The weights of liquids were measured through an electronic balance from Mettler Toledo (XS403S, Mettler Toledo, Greifensee, Switzerland) with a resolution of 1 mg. Aqueous MEA solutions with MEA to H2O mass ratio w 1 = 0.3, 0.4, and 0.5 were prepared and fully loaded by bubbling CO2 through the solution until the pH become steady over time. Then different CO2-loaded solutions were prepared by diluting them with corresponding aqueous MEA. The amount of CO2 loaded to the aqueous MEA was determined by a titration method in which CO2 was fixed as BaCO3 via adding 50 mL of each 0.1 M NaOH and 0.3 M BaCl2 to 0.1–0.2 g of CO2 loaded solution. All the samples were boiled for approximately 10 min to ensure the completion of chemical reactions and were cooled until the temperature reaches the room conditions. Eventually, BaCO3 was separated by filtering using a hydrophilic polypropylene membrane filter (47 mm, 0.45 µm). The filtered BaCO3 was put into 100 mL of distilled water and titrated with 0.1 M HCl until the solution reached pH of 2. Meanwhile, care needed to be taken to make sure all the BaCO3 was dissolved during the titration. Then, the sample was boiled and cooled again before it was titrated with 0.1 M NaOH. Finally, the MEA concentration of mixtures was determined by titrating 1 g of CO2-loaded solution with 1 M HCl.

2.2. Density Measurements

The density of aqueous MEA and CO2-loaded aqueous MEA was measured by a DMA 4500 density meter from Anton Paar (Graz, Austria). The standard calibration procedure for DMA 4500 was performed using degassed water and air at 293.15 K occasionally, while density checks were performed frequently to check the validity of the previous calibration at 293.15 K. Samples were inserted into the U-tube with care to prevent the presence of air bubbles in the tube. Measurements were performed using a separate sample at each temperature and composition. A cleaning and drying process of the U-tube was performed every time before a new sample was introduced. Density measurements were performed for the aqueous MEA of w 1 from 0.3 to 1 for the temperature range from 293.15 K to 363.15 K and CO2-loaded aqueous MEA of w 1 = 0.3, 0.4 and 0.5 under different CO2 loading for the temperature range from 293.15 K to 353.15 K. Final density data are presented as an average of three density measurements at each temperature and composition.

2.3. Viscosity Measurements

The dynamic viscosity was measured using a double-gap concentric rheometer Physica MCR 101 from Anton Paar (pressure cell XL DG35.12/PR; measuring cell serial number 80462200) (Graz, Austria). The standard viscosity solution S3S from Paragon Scientific Ltd. was used to calibrate the rheometer at different temperatures. The calibration and the measurement were done by using 7 mL of liquid volume under the shear rate (γ) of 1000 s−1. Having compared with the reference viscosity data, measured viscosities of standard viscosity solution were used to determine the viscosity deviations at different temperatures. For temperatures where the supplier did not specify any reference viscosities, expected viscosity deviations were obtained via interpolation. A temperature controlling system with standard temperature uncertainty of ±0.03 K is equipped with the rheometer. An external cooling system of Anton Paar Viscotherm VT2 (Graz, Austria) with standard temperature uncertainty of ±0.02 K is employed for better temperature control in the range from 293.15 K to 303.15 K. The solution in the rheometer was pressured by N2 gas (p = 4 bar) to minimize the possible release of MEA and CO2 into the gas phase. Viscosity measurements were performed for the aqueous MEA of w 1 from 0.3 to 1 in the temperature range from 293.15–363.15 K and CO2-loaded aqueous MEA with w1 = 0.3, 0.4 and 0.5 under different CO2 loadings for the temperature range from 293.15 K to 353.15 K. The viscosity data presented in this study are the averaged measurements for minimum of three different measurements.

3. Experimental Uncertainty

The Guide to the expression of Uncertainty in Measurement (GUM) [19,20] approach was adopted for the uncertainty evaluations using the mathematical models defined for the instruments for density and viscosity measurements. Several uncertainty sources including purity of MEA, weight measurements, repeatability, CO2 loading and temperature were considered in addition to the uncertainty sources in the model equations during the uncertainty evaluation. The temperature accuracy of DMA 4500 and Physica MCR 101 Anton Paar are both specified as ±0.03 K. Considered standard uncertainties u for the density measurements are u ( α ) = ±0.005 (CO2 loading mol CO2/mol MEA), u ( w ) = ±2 × 10⁻⁴ kg (weight measurement), u ( p ) = ±0.003 (MEA purity), u ( T ) = ±0.012 K (temperature) and u ( r e p ) = ±0.13 kg·m−3 (repeatability). The gradient ρ / T of density against temperature was found as 0.73 kg·m−3·K−1 and the corresponding uncertainty in ρ that is ( ρ / T )   u ( T ) was calculated as ±0.009 kg·m−3. The gradient of density against CO2 loading, ρ / α , was found as 334 kg m−3 and the corresponding uncertainty in ρ, ( ρ / α )   u ( α ) was found as ±1.67 kg·m−3. The standard combined uncertainty for density measurement u ( ρ ) was found as u ( ρ ) = ±3.90 kg·m−3. Accordingly the combined expanded uncertainty U c ( ρ ) for density of CO2-loaded aqueous MEA is U c ( ρ ) = ±7.80 kg·m−3 (level of confidence = 0.95, where k = 2).
The considered standard uncertainties u for the viscosity measurements are u ( α ) = ±0.005 (CO2 loading mol CO2/mol MEA), u ( w ) = ±2 × 10⁻⁴ kg (weight measurement), u ( p ) = ±0.003 (MEA purity), u ( T ) = ±0.012 K (temperature) and u ( r e p ) = ±0.008 mPa·s (repeatability). The standard combined uncertainty for viscosity measurement u ( η ) was found as u ( η ) = ±0.018 mPa·s. Accordingly the combined expanded uncertainty U c is U c ( η ) = ±0.036 mPa·s (level of confidence = 0.95, where k = 2).

4. Results and Discussion

This section discusses the density, viscosity and free energy of activation for viscous flow in aqueous and CO2-loaded aqueous MEA solutions. The correlations to represent density and viscosity data were evaluated using average absolute relative deviation and absolute maximum deviation (AARD and AMD) as given in Equations (1) and (2).
A A R D ( % ) =   100 % N i = 1 N | Y i E Y i C Y i E |
A M D = M A X | Y i E Y i C |
where N, Y i E and Y i C refer the number of data points, the measured property and calculated property respectively.

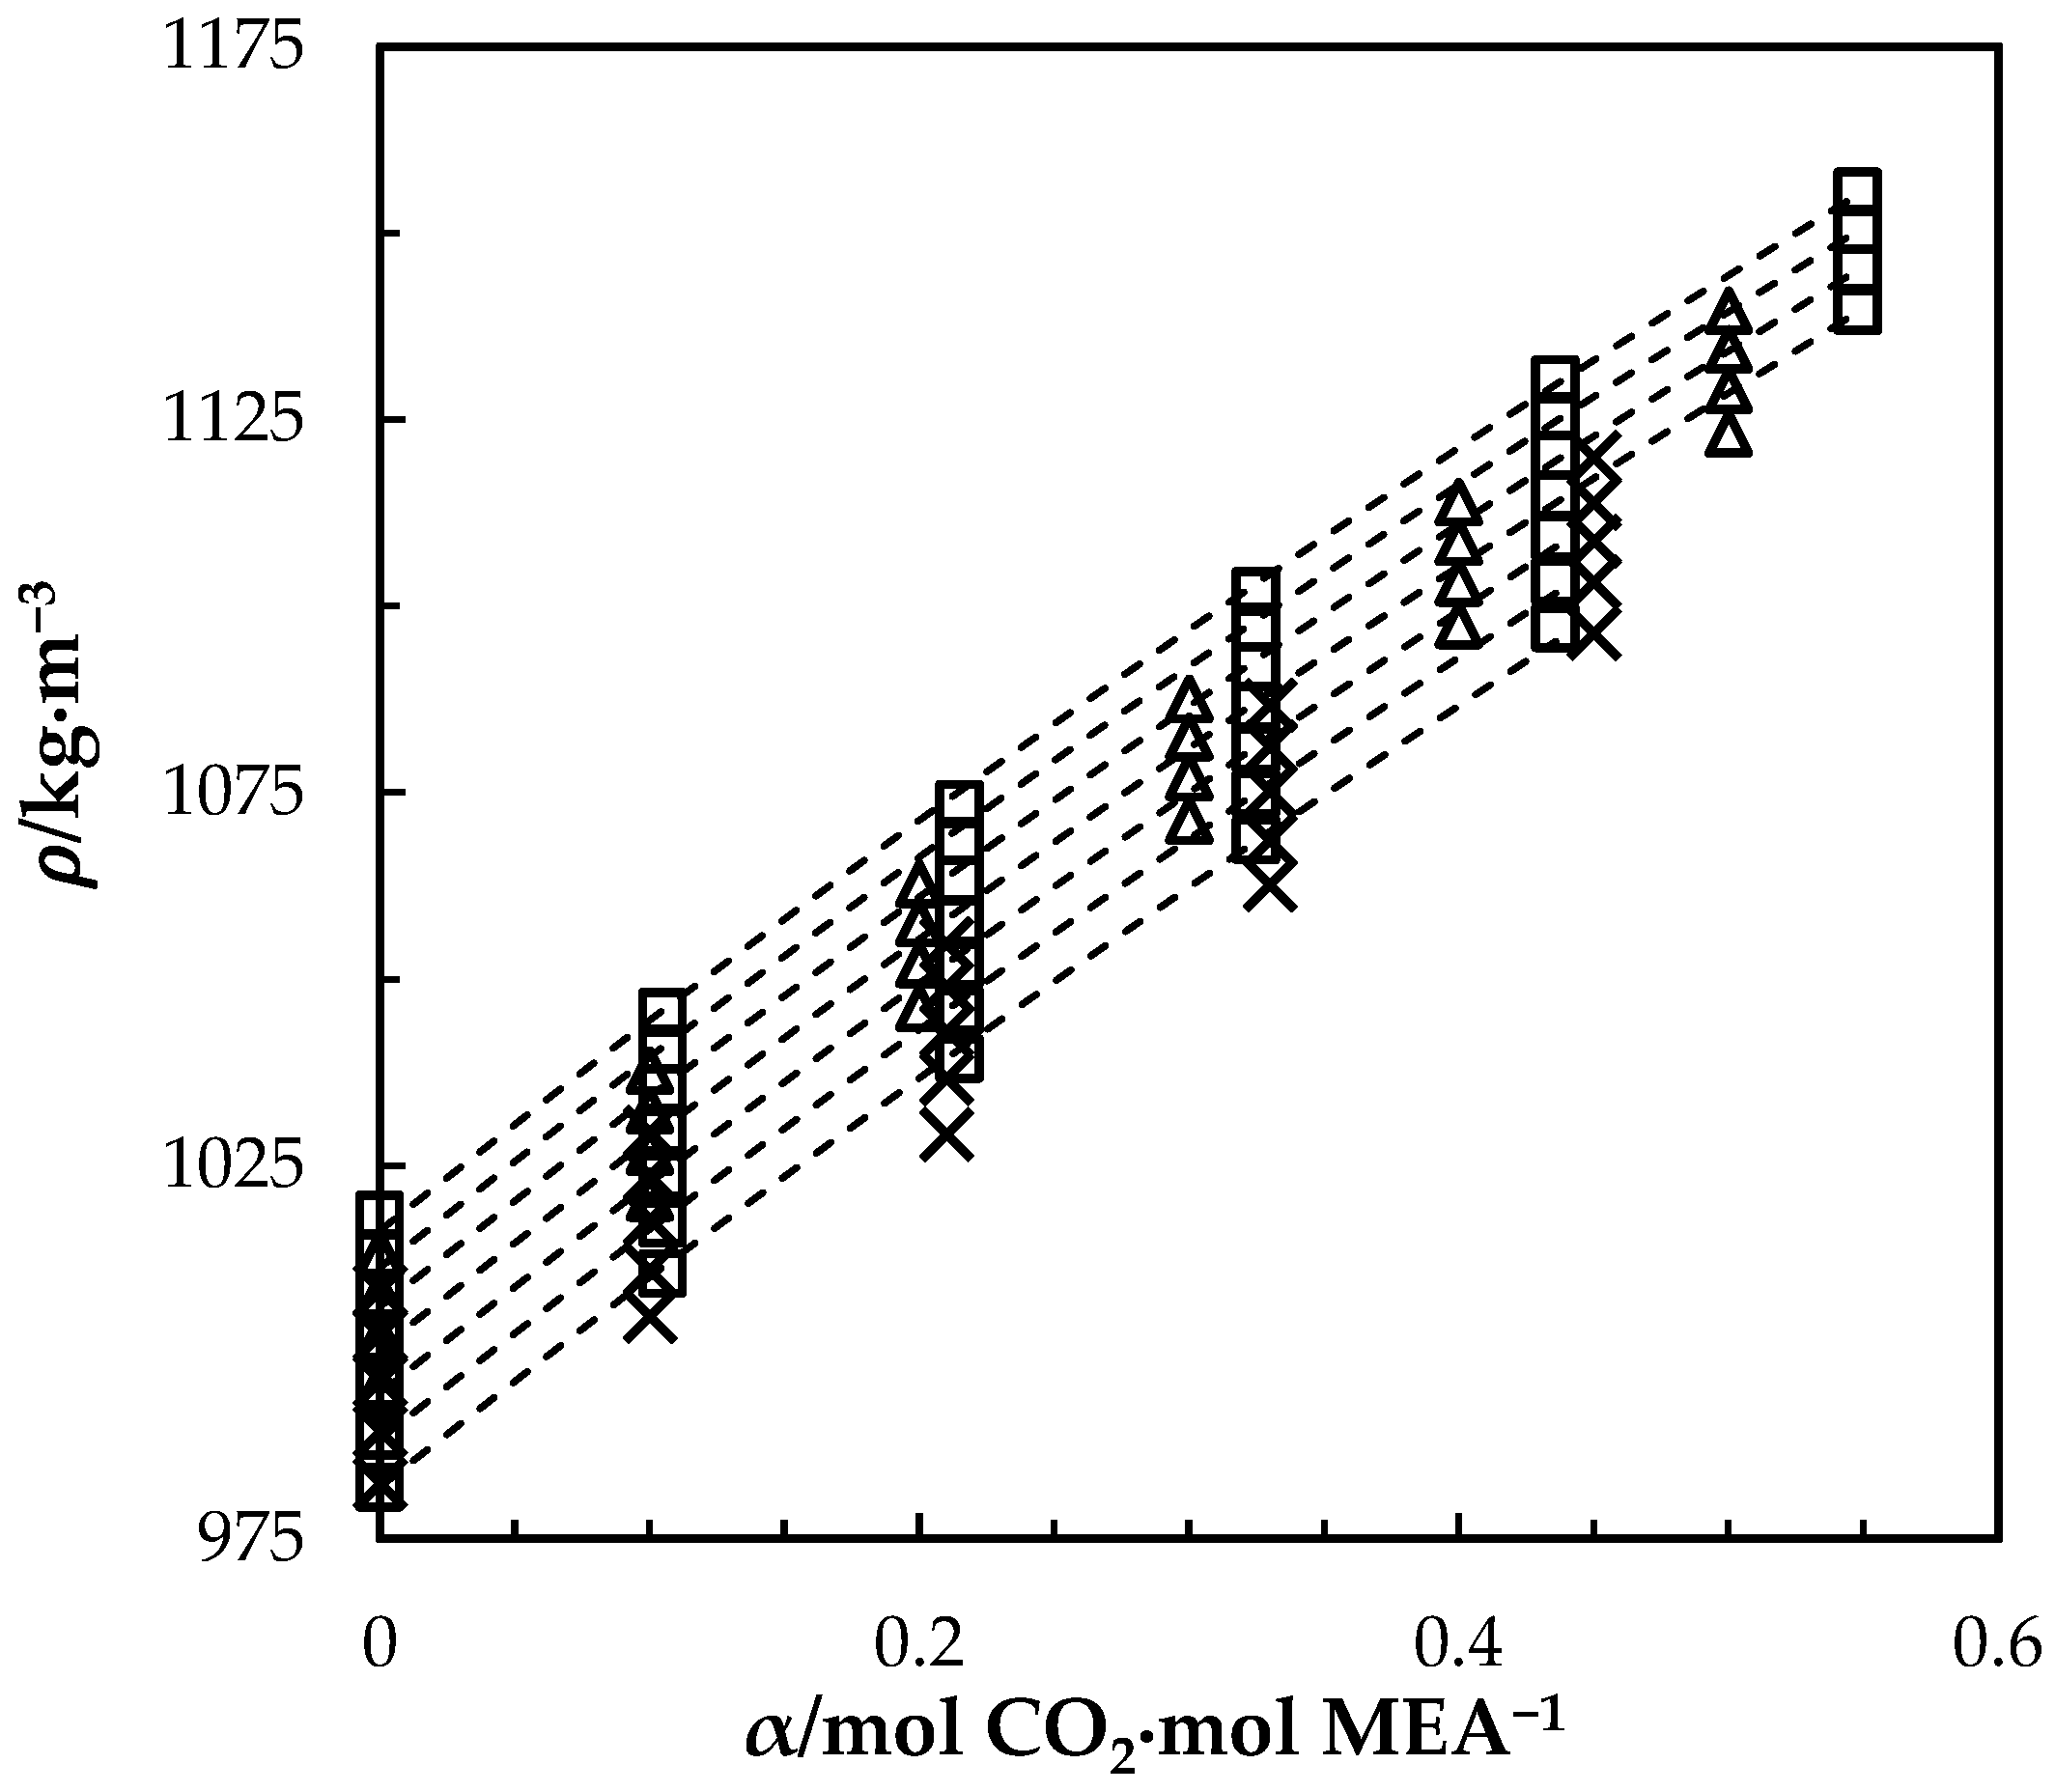
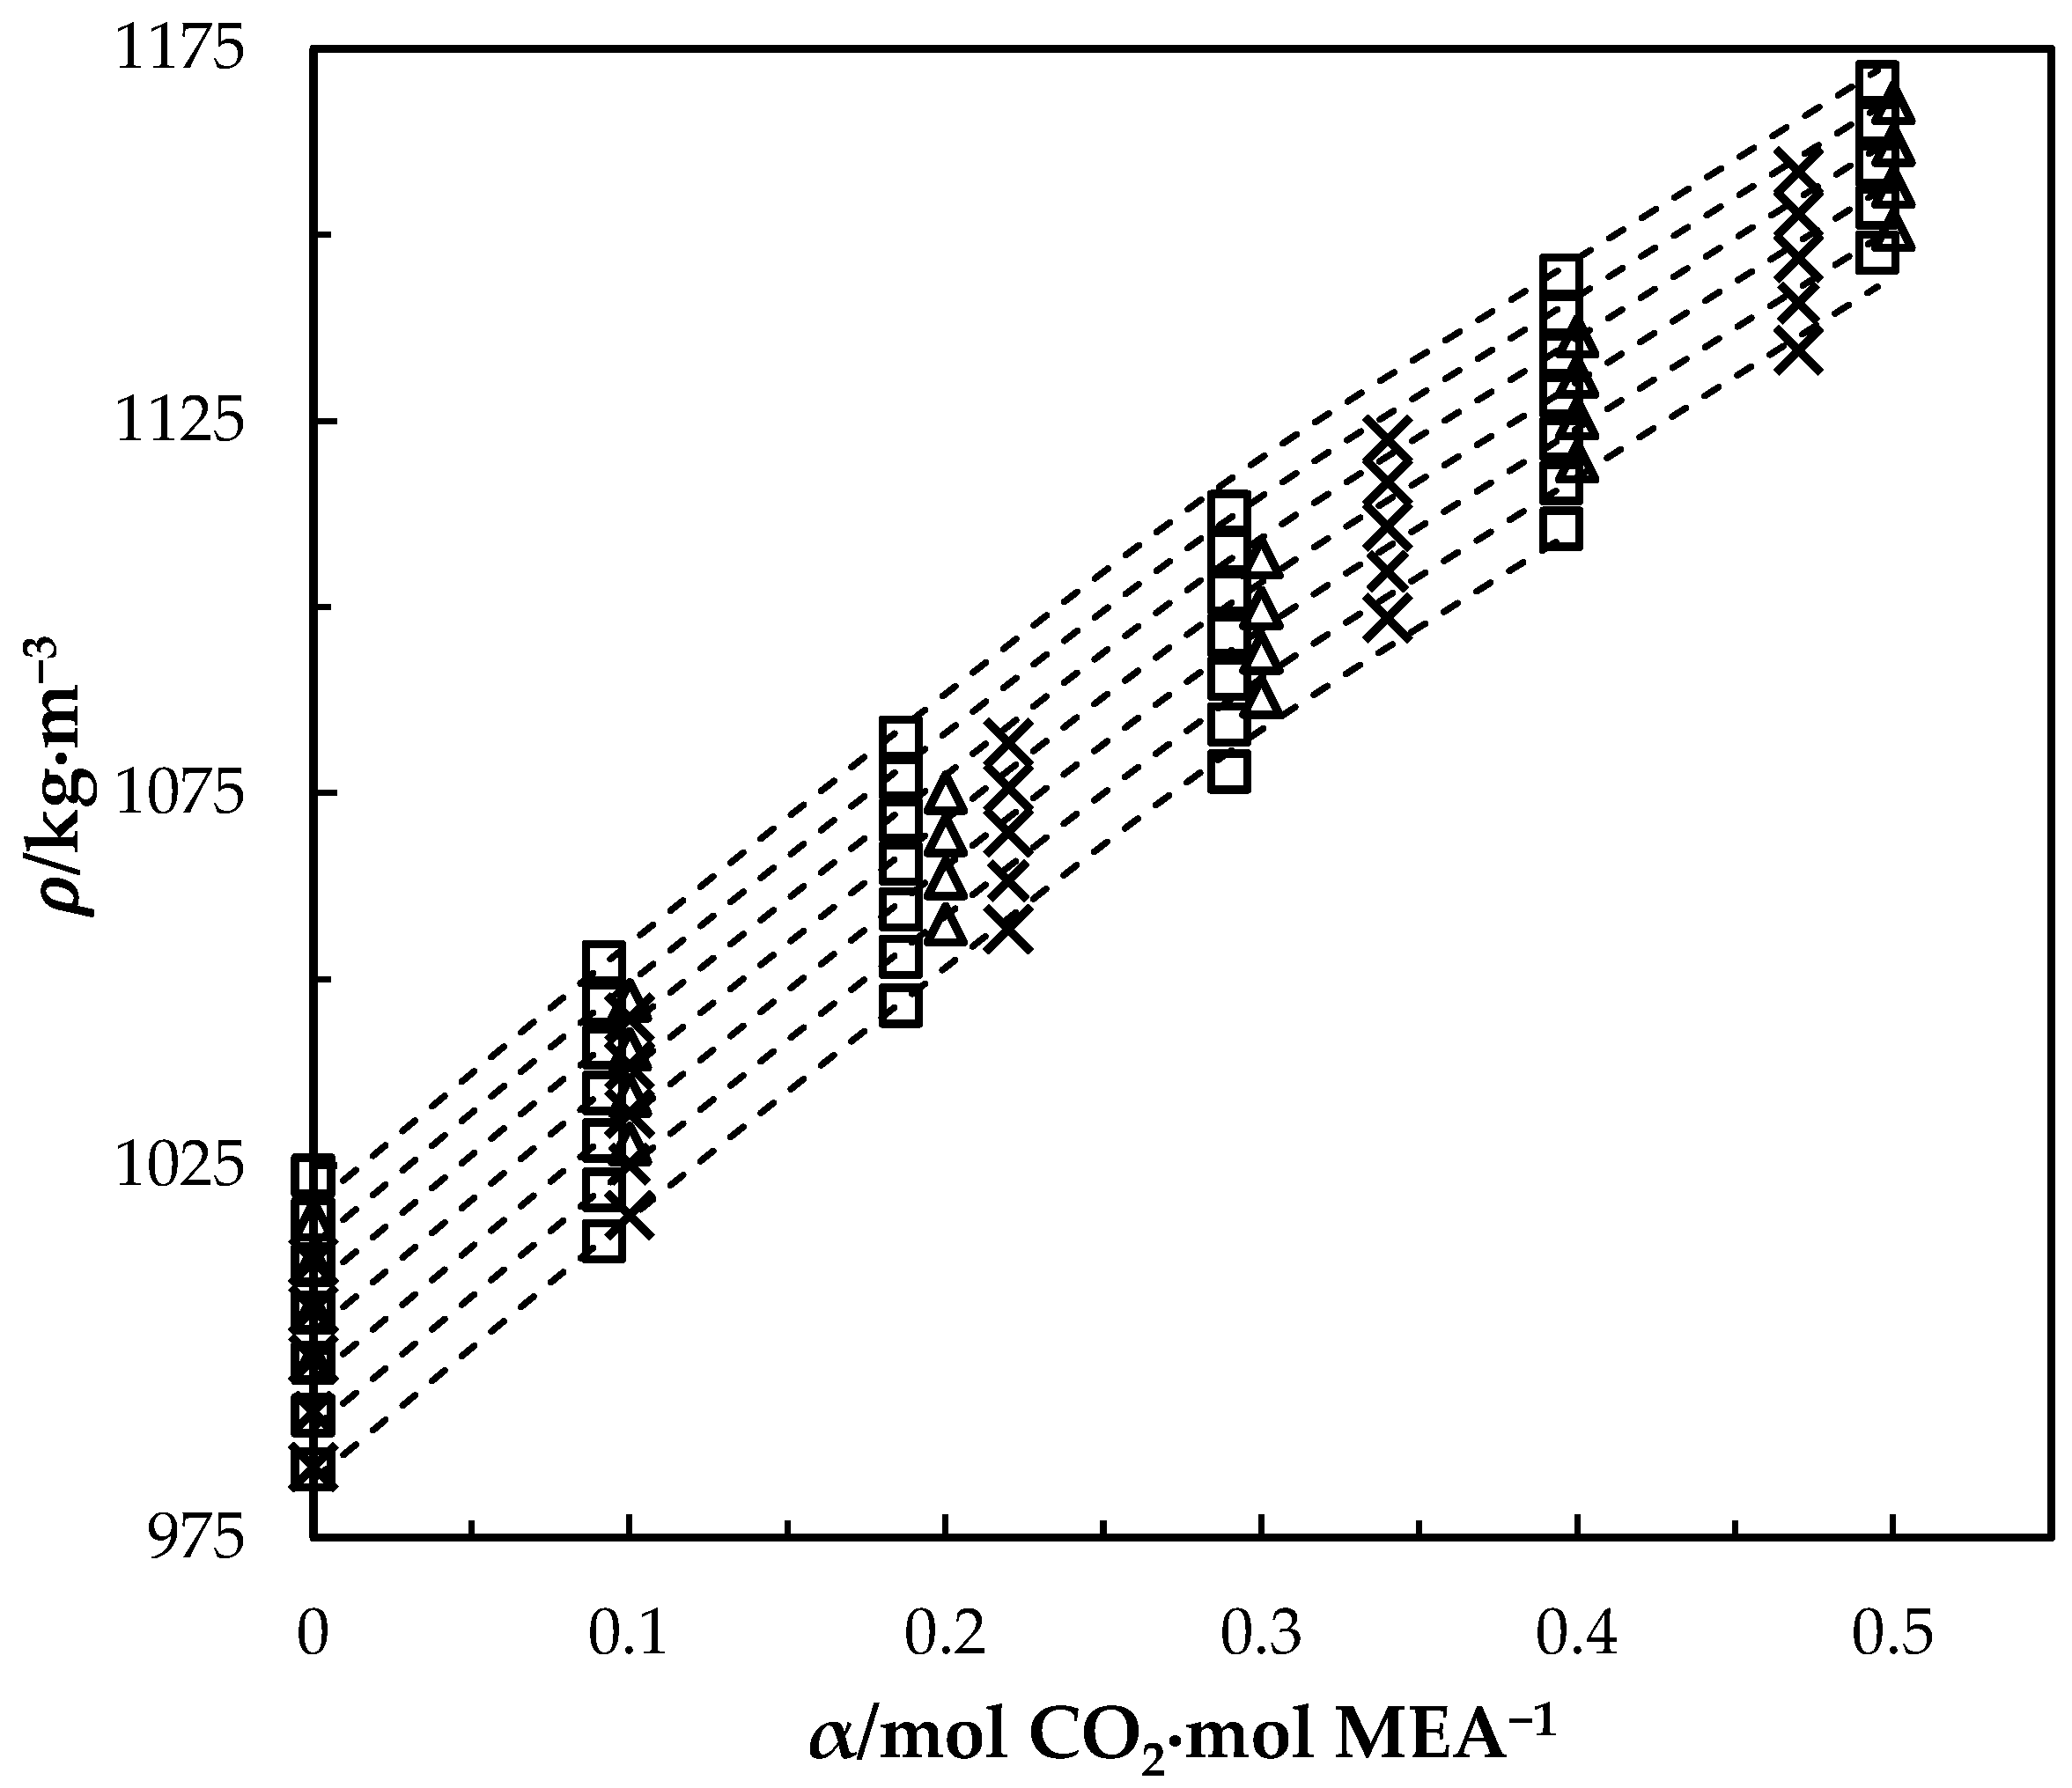
4.1. Density of MEA (1) + H2O (2) + CO2 (3) Mixtures

Many approaches in density correlations are based on suggesting a Redlich–Kister polynomial to fit the excess volume properties of the mixture. One of the drawbacks of the excess volume approach using a Redlich–Kister polynomial to calculate density is the complexity of the correlation due to a high number of parameters. The density correlation proposed by Aronu, Hartono and Svendsen [14] as given by Equation (3) was used to fit the measured aqueous density data. The estimated parameters are presented in Table 2. The correlation was in good agreement with measured data with AARD = 0.12% for the w 1 range from 0.3 to 0.9. The same parameters were used to fit the density of CO2-loaded solutions by introducing a function with new parameters for the temperature and CO2 mole fraction as illustrated in Equation (4).
Correlation for the density of aqueous MEA:
ρ = ( k 1 + k 2 x 2 T ) e x p ( k 3 T 2 + k 4 x 1 T + k 5 ( x 1 T ) 2 )
where ρ , T , x 1 , x 2 and k i are density, temperature, mole fractions of MEA, H2O of the aqueous mixture and estimated parameter vector.
The measured densities of aqueous MEA solutions are listed in Table 3. A comparison between correlations that are based on excess volume presented by Hartono, Mba and Svendsen [10] and Han, Jin, Eimer and Melaaen [1] with this work is shown in Figure 1. The accuracy of the correlation fit is acceptable compared to the literature [1,10]. The correlation deviates from measured density with AMD of 3.45 kg·m−3 at w 1 = 0.8 and T = 293.15 K. This deviation is less than the measurement uncertainty reported in this study for aqueous MEA.
Correlation for the density of CO2-loaded aqueous MEA:
ρ = ( a 1 + a 2 ( T ) + a 3 ( T ) 2 + a 4 x 3 ) ( k 1 + k 2 x 2 T ) e x p ( k 3 T 2 + k 4 x 1 T + k 5 ( x 1 T ) 2 )
The measured density of CO2-loaded aqueous MEA of w 1 = 0.3, 0.4 and 0.5 solutions are shown in Table 4 and the correlation described in Equation (4) used to fit the data. At higher CO2 loadings (α > 0.5), formation of air bubbles was noticed in the U-tube beyond temperatures of 323.15 K in DMA 4500. This increases the uncertainty of the density measurements. Accordingly, densities at temperatures up to 323.15 K are shown for the solutions with w 1 = 0.3 and 0.4. The same was observed for the solution of w1 = 0.5 with α = 0.495 at above T = 343.15 K. Figure 2 shows the comparison of correlations proposed by Hartono, Mba and Svendsen [10], Han, Jin, Eimer and Melaaen [1] with this work for MEA solution of w 1 = 0.3. Measured densities at w 1 = 0.4 and 0.5 are given in Figure 3 and Figure 4 with data from the literature. The correlation by Hartono, Mba and Svendsen [10] deviates positively from the measured data with AMD of 8.9 kg·m−3 while Han, Jin, Eimer and Melaaen [1] deviates negatively with AMD of 9.5 kg·m−3 at higher CO2 loadings. The required parameters of Equation (4) for the CO2-loaded solutions are listed in Table 5. The AMD from Equation (4) is lower than that from the other correlations.

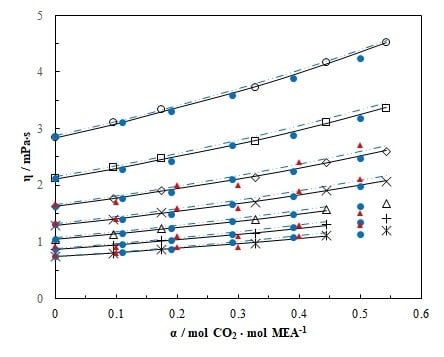
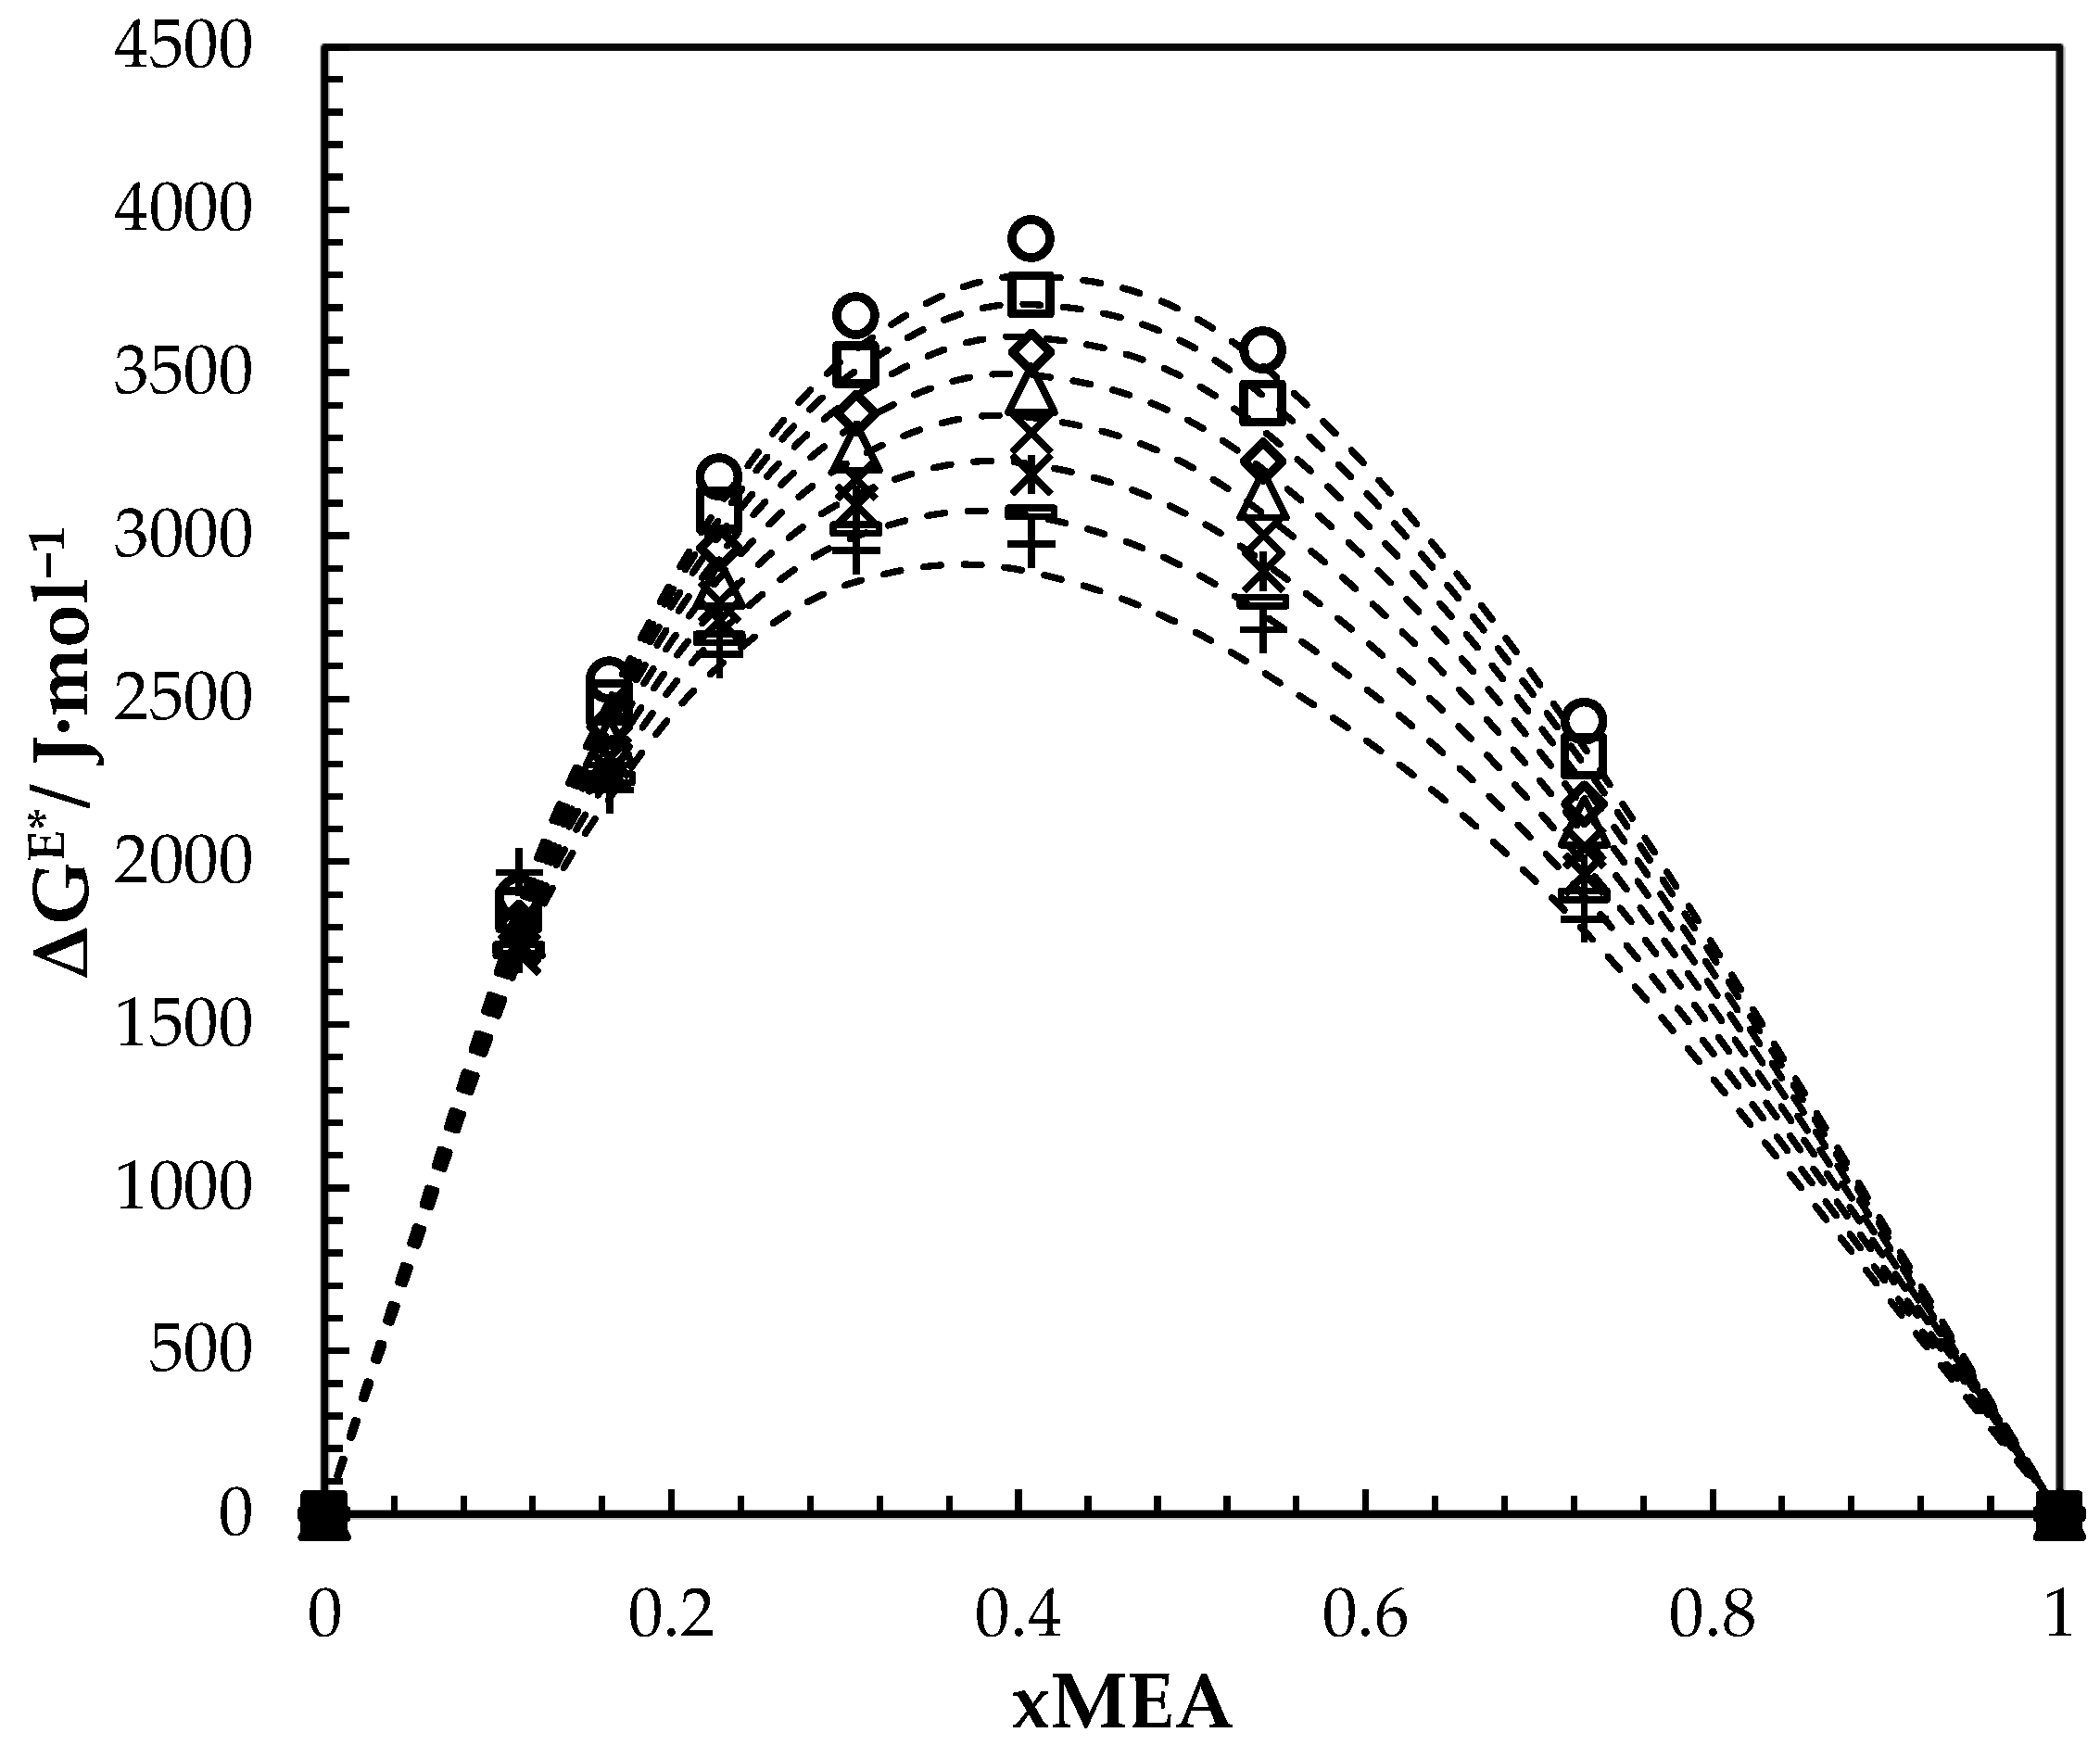
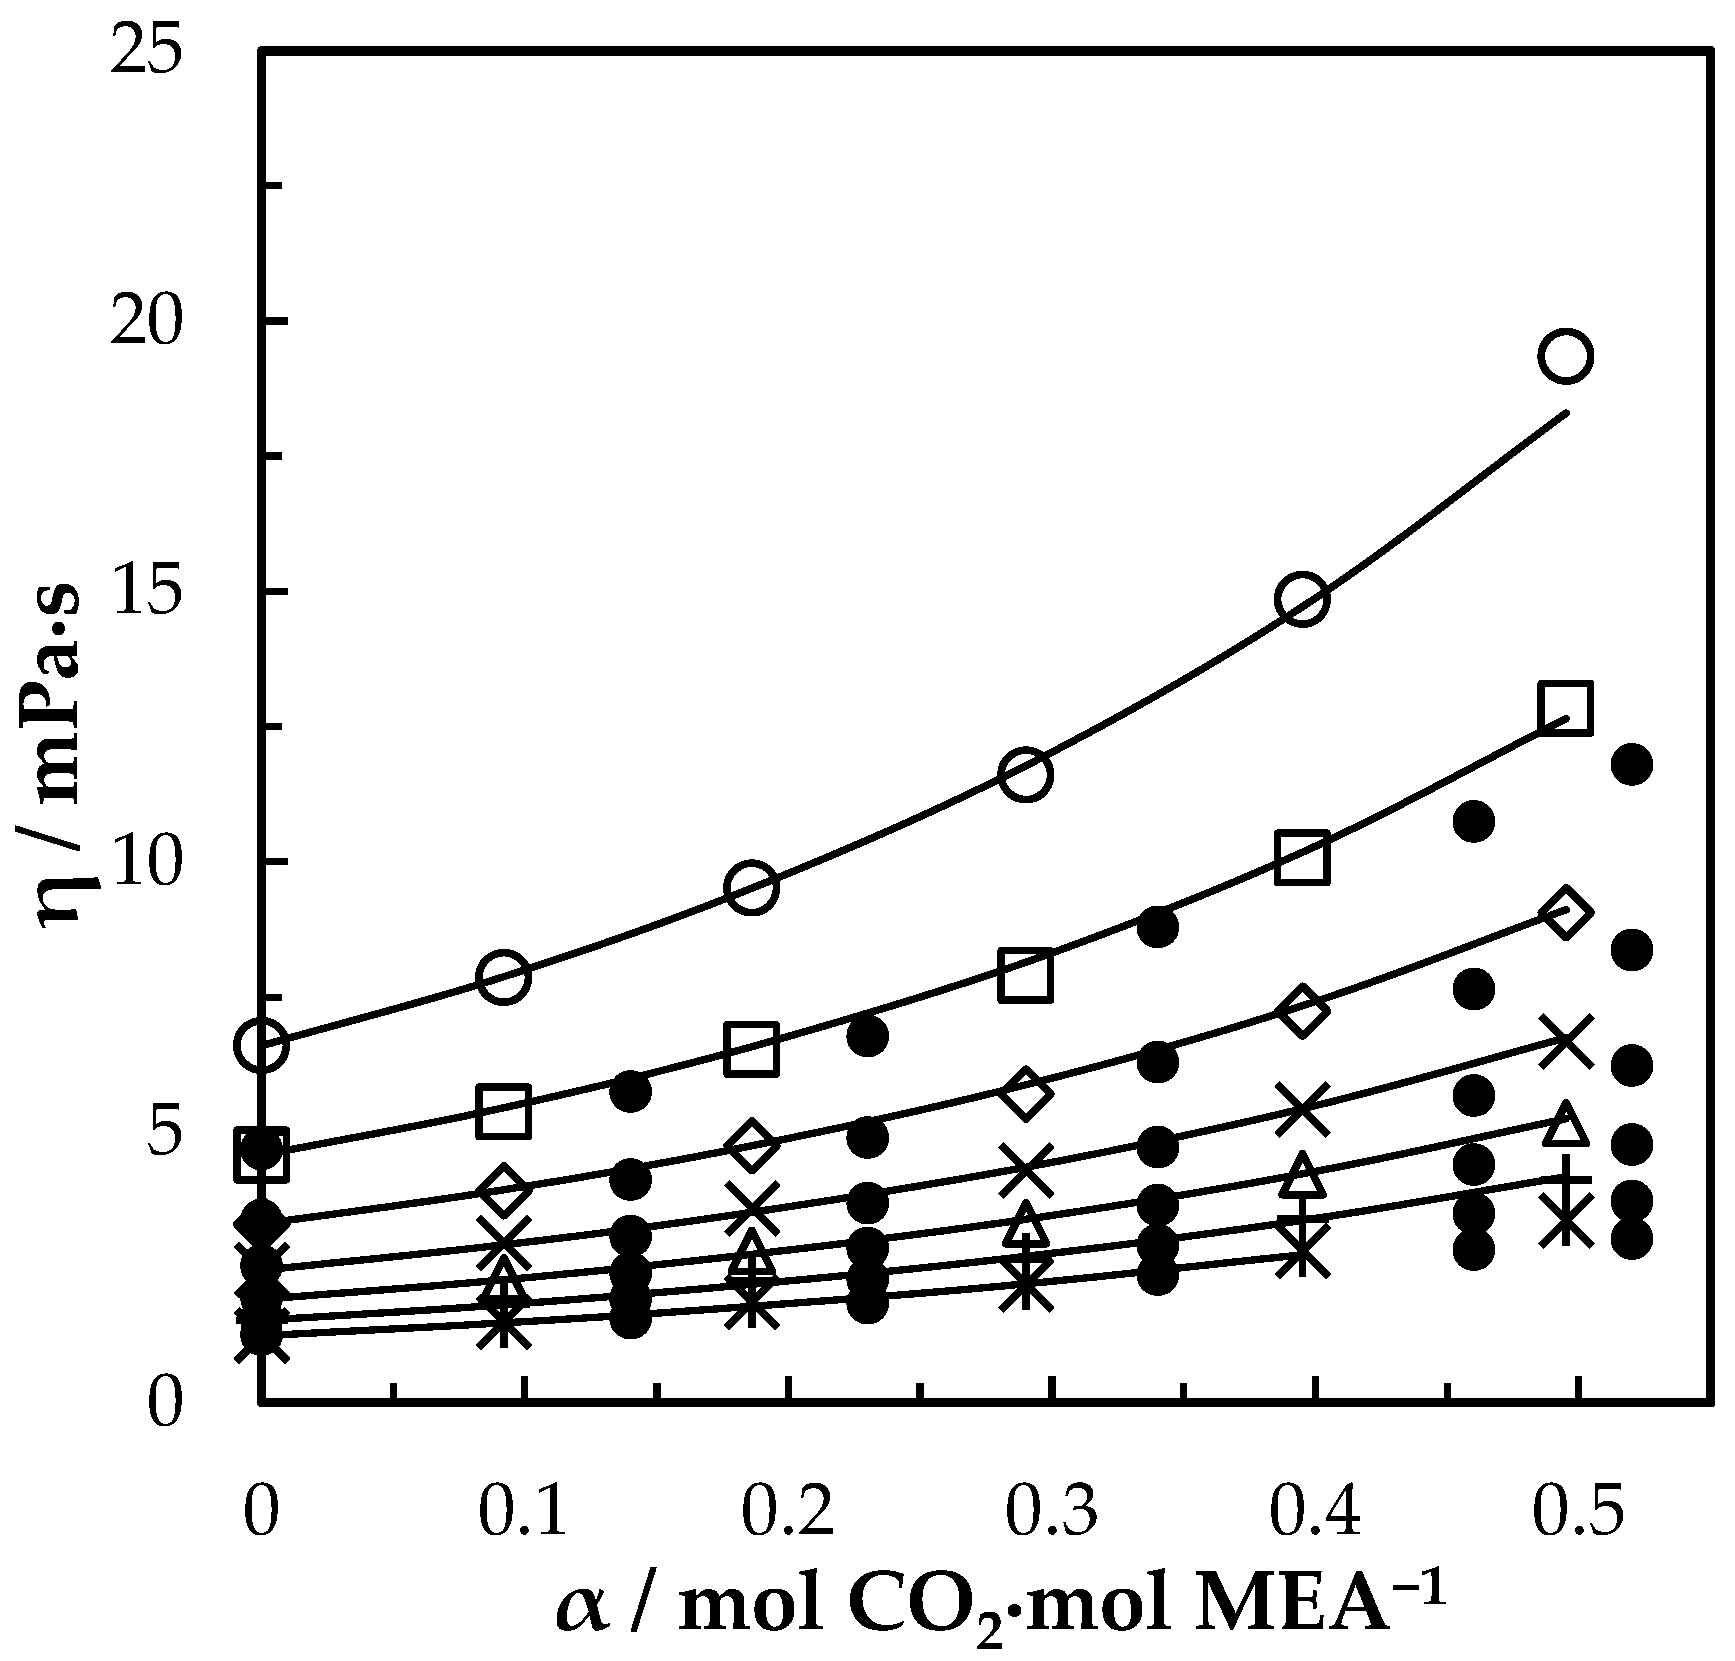
4.2. Viscosity of MEA (1) + H2O (2) + CO2 (3) Mixtures

The Eyring’s viscosity model based on absolute rate theory is shown in Equation (5). Here, viscous flow is treated as a chemical reaction considering the elementary process as the motion of a single molecule from one equilibrium position to another over a potential energy barrier [21,22].
η = h N A V e x p ( Δ G * R T )
where η ,   V ,   h ,   N A ,   Δ G * ,   R and T are dynamic viscosity, molar volume, Planck’s constant, Avogadro’s number, free energy of activation for viscous flow, universal gas constant and temperature respectively. For binary liquid mixtures, Equations (5) and (6) were adopted to derive Equation (7) to calculate excess free energy of activation for viscous flow Δ G E * .
η η i d e a l = V i d e a l   V e x p ( Δ G E * R T )
Δ G E * R T = l n ( η V ) i = 1 i = 2 x i l n ( η i V i 0 )
where x i ,   η i and V i 0 (i = 1 for MEA and i = 2 for H2O) are the mole fraction of components in the mixture, dynamic viscosity and molar volume of pure liquids.
The Δ G E * was evaluated via measured viscosity and density data of aqueous MEA for w 1 from 0.3 to 1 and MEA temperatures from 293.15 K to 363.15 K. Viscosity and density of pure water for this study were taken from Korson, et al. [23] and Kestin, et al. [24]. A Redlich–Kister type correlation was used to fit the derived term Δ G E * / R T and estimated parameters are given in Table 6. The measured viscosities of aqueous MEA are tabulated with literature data in Table 7. Our previous work has reported viscosities of aqueous MEA from w 1 = 0.3 to w 1 = 0.5 in Karunarathne, et al. [25]. Figure 5 shows the calculated and fitted Δ G E * and Figure 6 compares the measured with calculated viscosities using the proposed correlation in this work and correlations suggested in the literature.
Δ G E * R T = x 1 x 2 i = 0 i = 2 C i ( 1 2 x 2 ) i
C i = a i + b i ( T )
The viscosities from the correlation were in good agreement with measured data as shown in Figure 6. The proposed correlation was able to calculate viscosities with AARD 1.4% and with AMD 0.79 mPa·s. Table 8 summarizes the AARD and AMD of different suggested correlations.
Figure 5 illustrates the variation of Δ G E * over the whole range of concentrations at different temperatures. At a specific temperature, Δ G E * increases with the increase of MEA concentration until it reaches a maximum at x M E A about 0.41 and then gradually decreases. The Δ G E * decreases with the increase of temperature while composition for maximum ΔGE* is almost constant. A similar effect was observed for other aqueous amine mixtures [27,28].
The excess volume VE and excess viscosity η E of aqueous MEA was determined by Equations (10) and (11) to analyze the molecular interaction between MEA and H2O.
V E = V ( x 1 V 1 0 + x 2 V 2 0 )
η E = η ( x 1 η 1 + x 2 η 2 )
The Δ G E * > 0 and V E < 0 for the considered MEA concentrations while η E is negative ( < 0 ) for the water-rich region and gradually become positive ( > 0 ) with the increase of MEA concentration. The Δ G E * > 0 indicates that the viscosity of aqueous MEA solutions has greater viscosities than that of ideal mixtures [29]. The VE can be negative as a result of the chemical or specific interaction and the structural contribution due to the difference in shape and size [30]. According to Eyring’s viscosity model, it can be argued that more energy is required to make necessary holes for molecules to jump in when they are closely packed. The sign of η E emphasizes strong specific interactions such as hydrogen bonding, which causes complex formations in the amine-rich region and weak interactions in the water-rich region [31].
The viscosity of CO2-loaded aqueous MEA solutions is given by Table 9 for w1 = 0.3, 0,4 and 0.5 under different CO2 loading in the temperature range from 293.15–353.15 K. The measured viscosities at w 1 = 0.3, w 1 = 0.4 and 0.5 are shown in Figure 7, Figure 8 and Figure 9 respectively with data from the literature. It was observed that the viscosity of solution increases with the increase of CO2 dissolved in the mixture for all three different MEA concentrations and it decreases with the increase of temperature. The Δ G * was calculated for both CO2-loaded and CO2-unloaded solutions and the difference was considered to develop a correlation as shown in Equations (12) and (13) to predict the viscosity of CO2-loaded solutions.
The combined expanded uncertainty Uc is U c ( η ) = ±0.036 mPa·s (level of confidence = 0.95, where k = 2).
l n ( V η ) C O 2   l o a d e d = l n ( V η ) u n l o a d e d + f ( x 3 , T )
f ( x 3 , T ) = x 3 ( d 1 + d 2 T + d 3 x 3 )
The calculated AARD shows that the predicted and measured viscosities are in good agreement and parameters for the correlation are given in Table 10. The molar volume of CO2-loaded aqueous MEA solutions was calculated using the mole fraction of dissolved CO2 that was determined via CO2 loading analysis. In a real solution, CO2 reacts with MEA to form carbamate and bicarbonate ions and the solution becomes an electrolyte. Here it is assumed as unreacted and molar volumes were calculated using Equation (14) [32]. This approach was taken to represent dissolved CO2 in aqueous MEA [7,10,26] and used in the viscosity correlation by Hartono, Mba and Svendsen [10].
V l o a d e d = 1 3 x i M i ρ l o a d e d
The variations of Δ G * with CO2 loading and temperature are shown in Figure 10a–c. For CO2 loaded solutions, Δ G * increases with the increase of dissolved CO2 while it decreases with temperature. The amount of ions present in the solution due to the formation of carbamate and bicarbonate increases with the CO2 loading, which results in higher ionic strength as discussed by Matin, et al. [33]. At higher ionic strengths, ions can create an ionic field that attract water molecules to form clusters, which leads to higher viscosity. The increase of Δ G * implies the increase of potential barrier for the molecule transfer. The molecular interactions among the molecules in CO2-loaded solutions may enhance the strength of energy barrier more than that of unloaded solutions. The correlation given in Equation (15) was proposed to fit Δ G * for the CO2-loaded aqueous MEA of w1 = 0.3, 0,4 and 0.5. On the other hand, since the Eyring’s viscosity model is based on the motion of individual molecules from one equilibrium position to another; it does not explain the effect of hydrogen bond network on the bulk viscosity of the various CO2-loaded aqueous [34] MEA solutions. Further, the model has molar volume as a parameter that needs to be known to calculate the viscosity. This can be done by using calculated molar volume from density data measured under the same conditions or from a correlation.
Δ G C O 2   l o a d e d * =   Δ G   u n l o a d e d * + x 3 R T ( d 1 + d 2 T + d 3 x 3 )
The relationship between Rln(ηV/(hNA)) vs. 1 / T gives information about activation parameters in which enthalpy of activation for viscous flow Δ H * is given by the gradient and entropy of activation for viscous flow ΔS* is given by the intercept of the curve under different mole fractions of the components. The Δ G * , Δ H * and Δ S * are connected through the equation Δ G * = Δ H * T Δ S * . Accordingly, Eyring’s viscosity model is given as follows.
η = h N A V e x p ( Δ H * R T Δ S * R )
Table 11 and Table 12 list the calculated Δ G * directly from Eyring’s viscosity model, and Δ H * and Δ S * from the relation shown in Equation (16). It is observed that Δ G * , Δ H * and Δ S * are positive for all considered mixtures while Δ H * is greater than T Δ S * . This reveals that the influence of enthalpy of activation to the free energy of activation is greater than entropy of activation for viscous flow. Further, this work shows how Δ G * can be regarded as a parameter to regress and also can be regarded as a parameter with a physical meaning.

5. Conclusions

Densities and viscosities of MEA (1) + H2O (2) mixtures have been measured for the mass fraction w 1 from 0.3 to 1 and temperatures in the range 273.15 K to 363.15 K. The density data were correlated using the correlation proposed by Aronu, Hartono and Svendsen for w 1 from 0.3 to 0.9. The accuracy of the measured density with correlation predictions are acceptable as the AARD is 0.12% and AMD is 3.45 kg·m−3. The viscosity data were correlated using a Redlich–Kister type polynomial fitted to the excess free energy of activation for viscous flow Δ G E * obtained via the Eyring’s viscosity model for the w 1 from 0 to 1 and temperatures in a range from 273.15 K to 363.15 K. The developed correlation was able to represent the measured viscosities with AARD = 1.4% and AMD = 0.79 mPa·s, which is acceptable in engineering calculations.
The densities of CO2-loaded aqueous MEA solutions were measured at temperatures ranging from 293.15 K to 353.15 K for w 1 of 0.3, 0.4 and 0.5. Density of CO2-loaded solutions increases with the CO2 loading and decreases with temperature. The density correlation proposed by Aronu, Hartono and Svendsen was modified to correlate the density data. The AMD between correlated and experimental densities are 4.2 kg·m−3, 2 kg·m−3 and 4.5 kg·m−3 for CO2-loaded solutions with w 1 of 0.3, 0.4 and 0.5 respectively.
The viscosities of CO2-loaded aqueous MEA solutions were measured at temperatures ranging from 293.15 K to 353.15 K for w1 of 0.3, 0.4 and 0.5. As CO2 loading increased, the viscosity increased and the viscosity decreased with the increase of temperature. A correlation was proposed for the free energy of activation for viscous flow using CO2 mole fraction and temperature to correlate viscosity data. The AMD between correlated and experimental viscosities are 0.03 mPa·s, 0.22 mPa·s and 1.04 mPa·s for CO2-loaded solutions with w 1 of 0.3, 0.4 and 0.5 respectively. The proposed correlation is recommended to use in engineering calculations.

Author Contributions

Supervision, L.E.Ø. and D.A.E.; Writing-original draft, S.S.K. All authors have read and agreed to the published version of the manuscript.

Funding

This work was funded by the Ministry of Education and Research of the Norwegian Government.

Conflicts of Interest

The authors declare no conflict of interest.

References

  1. Han, J.; Jin, J.; Eimer, D.A.; Melaaen, M.C. Density of water (1) + Monoethanolamine (2) + CO2 (3) from (298.15 to 413.15) K and surface tension of water (1) + Monoethanolamine (2) from (303.15 to 333.15) K. J. Chem. Eng. Data 2012, 57, 1095–1103. [Google Scholar] [CrossRef]
  2. Nwaoha, C.; Saiwan, C.; Supap, T.; Idem, R.; Tontiwachwuthikul, P.; Rongwong, W.; Al-Marri, M.J.; Benamor, A. Carbon dioxide (CO2) capture performance of aqueoustri-solvent blends containing 2-amino-2-methyl-1-propanol (AMP) and methyldiethanolamine (MDEA) promoted by diethylenetriamine (DETA). Int. J. Greenh. Gas Control 2016, 53, 292–304. [Google Scholar] [CrossRef]
  3. Kidnay, A.J.; Parrish, W.R. Fundamentals of Natural Gas Processing; Taylor & Francis Group: Boca Raton, FL, USA, 2006. [Google Scholar]
  4. Maham, Y.; Teng, T.T.; Hepler, L.G.; Mather, A.E. Densities, excess molar volumes, and partial molar volumes for binary mixtures of Water with Monoethanolamine, Diethnolamine, and Triethanolamine from 25 to 80 °C. J. Solut. Chem. 1994, 23, 195–205. [Google Scholar] [CrossRef]
  5. Yang, F.; Wang, X.; Wang, W.; Liu, Z. Densities and excess properties of primary amines in alcoholic solutions. J. Chem. Eng. Data 2013, 58, 785–791. [Google Scholar] [CrossRef]
  6. Amundsen, T.G.; Øi, L.E.; Eimer, D.A. Density and viscosity of monoethanolamine + water + carbon dioxide from (25 to 80) °C. J. Chem. Eng. Data 2009, 54, 3096–3100. [Google Scholar] [CrossRef]
  7. Jayarathna, S.A.; Jayarathna, C.K.; Kottage, D.A.; Dayarathna, S.; Eimer, D.A.; Melaaen, M.C. Density and surface tension measurement of partially carbonated aqueous monoethanolamine solutions. J. Chem. Eng. Data 2013, 58, 343–348. [Google Scholar] [CrossRef]
  8. Jayarathna, S.; Weerasooriya, A.; Dayarathna, S.; Eimer, D.A.; Melaaen, M.C. Densities and surface tensions of CO2 loaded aqueous monoethanolamine solution with r = (0.2 to 0.7) at T = (303.15 to 333.15) K. J. Chem. Eng. Data 2013, 58, 986–992. [Google Scholar] [CrossRef]
  9. Weiland, R.H.; Dingman, J.C.; Cronin, D.B.; Browning, G.J. Density and viscosity of some partially carbonated aqueous alkanolamine solutions and their blends. J. Chem. Eng. Data 1998, 43, 378–382. [Google Scholar] [CrossRef]
  10. Hartono, A.; Mba, E.O.; Svendsen, H.F. Physical properties of partially CO2 loaded aqueous monoethanolamine (MEA). J. Chem. Eng. Data 2014, 59, 1808–1816. [Google Scholar] [CrossRef]
  11. Arachchige, U.S.P.R.; Aryal, N.; Eimer, D.A.; Melaaen, M.C. Viscosities of pure and aqueous solutions of Monoethanolamine (MEA), Diethanolamine (DEA), and N-Methyldiethanolamine (MDEA). In Proceedings of the Annual Transactions of the Nordic Rheology Society, Copenhagen, Demark, 12–14 June 2013. [Google Scholar]
  12. Hsu, C.-H.; Li, M.-H. Viscosities of Aqueous Blended Amines. J. Chem. Eng. Data 1997, 42, 714–720. [Google Scholar] [CrossRef]
  13. Versteeg, G.F.; Van Swaaij, W.P.M. Solubility and diffusivity of acid gases (carbon dioxide, nitrous oxide) in aqueous alkanolamine solutions. J. Chem. Eng. Data 1988, 33, 29–34. [Google Scholar] [CrossRef] [Green Version]
  14. Aronu, U.E.; Hartono, A.; Svendsen, H.F. Density, viscosity, and N2O solubility of aqueous amino acid salt and amine amino acid salt solutions. J. Chem. Thermodyn. 2012, 45, 90–99. [Google Scholar] [CrossRef]
  15. McAllister, R.A. The viscosity of liquid mixtures. AIChE. J. 1960, 6, 427–431. [Google Scholar] [CrossRef]
  16. Redlich, O.; Kister, A.T. Algebraic representation of thermodynamic properties and the classification of solutions. Ind. Eng. Chem. 1948, 40, 345–348. [Google Scholar] [CrossRef]
  17. Islam, M.N.; Islam, M.M.; Yeasmin, M.N. Viscosity of aqueous solution of 2-methoxyethanol, 2-ethoxyethanol, and ethanolamine. J. Chem. Thermodyn. 2004, 36, 889–893. [Google Scholar] [CrossRef]
  18. Eyring, H. Viscosity, Plasticity, and Diffusion as example of absolute reaction rates. J. Chem. Phys. 1936, 4, 283–291. [Google Scholar] [CrossRef]
  19. JCGM. Evaluation of measurement data—Supplement 1 to the Guide to the Expression of Uncertainty In Measurement—Propagation of Distributions Using a Monte Carlo Method. In JCGM 101: 2008; JCGM: Sevres, France, 2008. [Google Scholar]
  20. Ellison, S.L.R.; Williams, A. Eurachem/CITAC Guide: Quantifying Uncertainty in Analytical Measurement, 3rd ed.; 2012; Available online: http://www.eurachem.org (accessed on 15 November 2019).
  21. Nhaesi, A.H. A Study of the Predictive Models for the Viscosity of Multi-Component Liquid Regular Solutions. Ph.D. Thesis, University of Windsor, Windsor, UK, 1998. Available online: https://core.ac.uk/download/pdf/72774384.pdf (accessed on 15 November 2019).
  22. Macías-Salinas, R.; Aquino-Olivos, M.A.; García-Sánchez, F. Viscosity modelling of reservoir fluids over wide temperature and pressure ranges. Chem. Eng. Trans. 2013, 32, 1573–1578. [Google Scholar] [CrossRef]
  23. Korson, L.; Hansen, W.D.; Millero, F.J. Viscosity of water at various temperatures. J. Phys. Chem. 1969, 73, 34–39. [Google Scholar] [CrossRef]
  24. Kestin, J.; Sokolov, M.; Wakeham, W.A. Viscosity of liquid water in the range −8 °C to 150 °C. J. Phys. Chem. Ref. Data 1978, 7, 941–948. [Google Scholar] [CrossRef] [Green Version]
  25. Karunarathne, S.S.; Eimer, D.A.; Øi, L.E. Evaluation of systematic error and uncertainty of viscosity measurements of mixtures of monoethanol amine and water in coaxial cylinder rheometers. Int. J. Model. Optim. 2018, 8, 260–265. [Google Scholar] [CrossRef]
  26. Idris, Z.; Kummamuru, N.B.; Eimer, D.A. Viscosity measurement of unloaded and CO2-loaded aqueous monoethanolamine at higher concentrations. J. Mol. Liq. 2017, 243, 638–645. [Google Scholar] [CrossRef]
  27. Hartono, A.; Svendsen, H.F. Density, viscosity, and excess properties of aqueous solution of diethylenetriamine (DETA). J. Chem. Thermodyn. 2009, 41, 973–979. [Google Scholar] [CrossRef]
  28. Maham, Y.; Liew, C.N.; Mather, A.E. Viscosities and Excess Properties of Aqueous Solutions of Ethanolamines from 25 to 80 °C. J. Solut. Chem. 2002, 31, 743–756. [Google Scholar] [CrossRef]
  29. Heric, E.L.; Brewer, J.G. Viscosity of some binary liquid nonelectrolyte mixtures. J. Chem. Eng. Data 1967, 12, 574–583. [Google Scholar] [CrossRef]
  30. Mahajan, A.R.; Mirgane, S.R. Excess molar volumes and viscosities for the binary mixtures of n-Octane, n-Decane, n-Dodecane, and n-Tetradecane with Octan-2-ol at 298.15 K. J. Thermodyn. 2013, 2013, 1–11. [Google Scholar] [CrossRef] [Green Version]
  31. Idris, Z.; Kummamuru, N.B.; Eimer, D.A. Viscosity measurement and correlation of unloaded and CO2 loaded 3-Amino-1-propanol solution. J. Chem. Eng. Data 2018, 63, 1454–1459. [Google Scholar] [CrossRef]
  32. Stec, M.; Spietz, T.; Wieclaw-Solny, L.; Tatarczuk, A.; Wilk, A.; Sobolewski, A. Density of unloaded and CO2-loaded aqueous solutions of piperazine and 2-amino-2-methyl-1-propanol and their mixtures from 293.15 to 333.15 K. Phys. Chem. Liq. 2015, 54, 475–486. [Google Scholar] [CrossRef]
  33. Matin, N.S.; Remias, J.E.; Liu, K. Application of electrolyte-NRTL model for prediction of the viscosity of carbon dioxide loaded aqueous amine solutions Ind. Eng. Chem. Res 2013, 52, 16979–16984. [Google Scholar] [CrossRef]
  34. Perticaroli, S.; Mostofian, B.; Ehlers, G.; Neuefeind, J.C.; Diallo, S.O.; Stanley, C.B.; Daemen, L.; Egami, T.; Katsaras, J.; Cheng, X.; et al. Structural relaxation, viscosity, and network connectivity in a hydrogen bonding liquid. Phys. Chem. Chem. Phys. 2017, 19, 25859–25869. [Google Scholar] [CrossRef]
Figure 1. Density of aqueous MEA mixtures at different concentrations and temperatures (293.15, 303.15, 313.15, 323.15, 333.15, 343.15, 353.15 and 363.15) K. Data: from this work, ‘□’. Correlation predictions: from this work, ‘- - -’; Hartono, Mba and Svendsen [10], ‘₋ ⸳⸳ ₋’; Han, Jin, Eimer and Melaaen [1], ‘⸳⸳⸳’.
Fluids 05 00013 g001
Figure 2. Density of CO2-loaded MEA ( w 1 = 0.3 ) solution at different CO2 loadings and temperatures (293.15, 303.15, 313.15, 323.15, 333.15, 343.15 and 353.15) K. Data: from this work, ‘□’; Hartono, Mba and Svendsen [10], ‘O’; Han, Jin, Eimer and Melaaen [1], ‘x’; Jayarathna, Weerasooriya, Dayarathna, Eimer and Melaaen [8], ‘’. Correlation: from this work, ‘- - -’; Hartono, Mba and Svendsen [10], ‘₋ ⸳⸳ ₋’; Han, Jin, Eimer and Melaaen [1], ‘⸳⸳⸳’.
Fluids 05 00013 g002
Figure 3. Density of CO2-loaded MEA ( w 1 = 0.4 ) solution at different CO2 loadings and temperatures (293.15, 303.15, 313.15, 323.15, 333.15, 343.15 and 353.15) K. Data: from this work, ‘□’; Han, Jin, Eimer and Melaaen [1], ‘x’; Jayarathna, Weerasooriya, Dayarathna, Eimer and Melaaen [8], ‘△’. Correlation: from this work, ‘- - -’.
Fluids 05 00013 g003
Figure 4. Density of CO2-loaded MEA ( w 1 = 0.5 ) solution at different CO2 loadings and temperatures (293.15, 303.15, 313.15, 323.15, 333.15, 343.15 and 353.15) K. Data: from this work, ‘□’; Han, Jin, Eimer and Melaaen [1], ‘x’; Jayarathna, Weerasooriya, Dayarathna, Eimer and Melaaen [8], ‘△’. Correlation: from this work, ‘- - -’.
Fluids 05 00013 g004
Figure 5. Calculated and fitted ΔGE* for aqueous MEA solutions at different concentrations and temperatures. Calculated: 293.15 K, ‘○’; 303.15 K, ‘□’; 313.15 K, ‘◇’; 323.15 K, ‘△’; 333.15 K, ‘x’; 343.15 K, ‘ж’; 353.15 K, ‘-’; 363.15 K, ‘+’. Correlation: ‘---’.
Fluids 05 00013 g005
Figure 6. Viscosity of aqueous MEA solutions at different concentrations and temperatures (293.15, 303.15, 313.15, 323.15, 333.15, 343.15, 353.15, 363.15 K). Data: from this work, ‘₋ ⸳⸳ ₋’. Correlation: from this work, ‘□’; Hartono, Mba and Svendsen [10], ‘△’; Arachchige, Aryal, Eimer and Melaaen [11], ‘ж’; Islam, Islam and Yeasmin [17], ‘○’.
Fluids 05 00013 g006
Figure 7. Viscosity of CO2-loaded aqueous MEA (w1 = 0.3) solutions at different CO2 loadings and temperatures. Data: from this work, 293.15 K, ‘○’; 303.15 K, ‘□’; 313.15 K, ‘◇’; 323.15 K, ‘x’; 333.15 K, ‘△’; 343.14 K, ‘+’; 353.15 K, ‘ж’; Hartono, Mba and Svendsen [10], ‘●’; Amundsen, Øi and Eimer [6], ‘▲’. Correlation: from this work, ‘⸻’; Hartono, Mba and Svendsen [10], ‘₋ ⸳⸳ ₋’.
Fluids 05 00013 g007
Figure 8. Viscosity of CO2-loaded aqueous MEA ( w 1 = 0.4) solutions at different CO2 loadings and temperatures. Data: from this work, 293.15 K, ‘○’; 303.15 K, ‘□’; 313.15 K, ‘◇’; 323.15 K, ‘x’; 333.15 K, ‘△’; 343.14 K, ‘+’; 353.15 K, ‘ж’; Amundsen, Øi and Eimer [6], ‘▲’. Correlation: from this work, ‘⸻’.
Fluids 05 00013 g008
Figure 9. Viscosity of CO2-loaded aqueous MEA ( w 1 = 0.5) solutions at different CO2 loadings and temperatures 293.15 K, ‘○’; 303.15 K, ‘□’; 313.15 K, ‘◇’; 323.15 K, ‘x’; 333.15 K, ‘△’; 343.14 K, ‘+’; 353.15 K, ‘ж’; Idris, Kummamuru and Eimer [26], ‘●’. Correlation: from this work, ‘⸻’.
Fluids 05 00013 g009
Figure 10. Variation of free energy of activation for viscous flow of CO2-loaded aqueous MEA: (a) w 1 = 0.3, (b) w 1 = 0.4, (c) w1 = 0.5 solutions at different CO2 loadings and temperatures of T= 293.15 K, ‘■’; 303.15 K, ‘♦’; 313.15 K, ‘▲’; 323.15 K, ‘□’; 333.15 K, ‘○’; 343.15 K, ‘◇’; 353.15 K, ‘x’ from Eyring’s viscosity model. ‘⸻’ from correlation in Equation (15).
Fluids 05 00013 g010
Table 1. Materials used in this study a,b.
Chemical NameCAS Reg. No.Mole Fraction Purity aSourcePurification
monoethanol amine (MEA)141-43-5≥0.995 (GC b)Sigma–Aldrichno
carbon dioxide (CO2)124-38-90.99999AGA Norge ASno
nitrogen (N2)7727-37-90.99999AGA Norge ASno
sodium hydroxide (NaOH)1310-73-2-Merck KGaAno
hydrochloric acid (HCl)7647-01-0-Merck KGaAno
barium chloride dihydrate (BaCl2·2H2O)10326-27-9≥0.99Merck KGaAno
a As mentioned by the supplier. b Gas-liquid chromatography.
Table 2. Correlation parameters for density of aqueous MEA.
MEA / w 1 T/KNo. PointsParameters
0.3–0.9293.15–363.1556 k 1 = 683.5
k 2 = 1.344 × 10⁵
k 3 = −1.089 × 10⁴
k 4 = 145.2
k 5 = 567.9
AARD (%)0.12
AMD (kg·m−3)3.45
Table 3. Measured density ρ /kg·m−3 of aqueous MEA a,b,c,d,e.
w 1 x 1 Measured Density ρ/kg·m−3
293.15 K303.15 K313.15 K323.15 K333.15 K343.15 K353.15 K363.15 K
0.30.11221012.6
1012.68 d
1008.2
1008.4 b
1008.31 d
1008.2 e
1003.3
1003.3 b
1003.4 c
1003.45 d
1003.3 e
997.9
998.1 b
998.1 c
998.07 d
998.1 e
991.6
992.3 b
992.23 d
992.3 e
986.0
986.1 b
985.8 c
985.96 d
979.4
979.4 b
979.4 c
979.27 d
972.3
972.5 b
0.40.16431018.41013.3
1013.8 b
1013.3 e
1007.8
1008.3 b
1007.7 c
1007.8 e
1001.8
1002.3 b
1001.8 c
1002.1 e
995.5
996.1 b
995.7 e
988.9
989.4 b
988.9 c
981.9
982.4 b
981.9 c
974.6
975.0 b
0.50.22781023.61017.8
1018.2 b
1017.8 e
1011.6
1012.1 b
1011.7 c
1011.8 e
1005.2
1005.6 b
1005.3 c
1005.4 e
998.4
999.0 b
998.7 e
991.4
991.9 b
991.5 c
984.1
984.5 b
984.2 c
976.4
976.9 b
0.60.30671027.71021.2
1021.4 b
1021.3 e
1014.5
1014.7 b
1014.6 e
1007.6
1007.8 b
1007.8 e
1000.4
1000.7 b
1000.6 e
993.0
993.2 b
985.4
985.6 b
977.4
977.7 b
0.70.40771029.31022.4
1022.8 b
1022.6 e
1015.2
1015.7 b
1015.5 c
1015.5 e
1007.9
1008.3 b
1008.2 c
1008.2 e
1000.4
1000.8 b
1000.6 e
992.7
993.1 b
993.0 c
984.8
985.2 b
985.0 c
976.4
977.1 b
0.80.54121028.11020.8
1021.0 b
1013.3
1013.5 b
1005.7
1005.9 b
997.9
998.2 b
990.0
990.2 b
981.9
982.1 b
973.6
973.9 b
0.90.72641023.51015.8
1016.2 b
1008.1
1008.5 b
1008.4 c
1000.3
1000.6 b
1000.6 c
992.4
992.7 b
984.3
984.6 b
984.6 c
976.1
976.5 b
976.4 c
967.8
968.1 b
11.00001015.91008.1
1008.0 b
1000.1
1000.0 b
1000.3 c
992.1
992.0 b
992.3 c
984.0
983.9 b
975.9
975.8 b
976.0 c
967.6
967.5 b
967.8 c
959.3
959.2 b
a Standard uncertainties u are u ( w ) = ±2 × 10⁻⁴ kg, u ( p ) = ±0.003, u ( T ) = ±0.012 K, u ( r e p ) = ±0.13 kg·m−3. The combined expanded uncertainty U c is U c ( ρ ) = ±7.10 kg·m−3 (level of confidence = 0.95, where k = 2). b Han, Jin, Eimer and Melaaen [1], c Amundsen, Øi and Eimer [6], d Hartono, Mba and Svendsen [10], e Jayarathna, Weerasooriya, Dayarathna, Eimer and Melaaen [8].
Table 4. Measured density ρ /kg·m−3 of CO2-loaded (α/mol CO2·mol MEA−1) aqueous MEA a.
x 3 α Measured   Density   ρ / k g · m 3
293.15 K303.15 K313.15 K323.15 K333.15 K343.15 K353.15 K
w 1 = 0.3
0.00000.0001012.61008.21003.3997.9991.6986.0979.4
0.01050.0951032.01027.61022.81017.41011.61005.1995.5
0.01930.1751052.51048.11043.31038.11032.41026.41020.1
0.03550.3281077.81073.41068.61063.41057.91052.01044.1
0.04760.4451103.31097.71092.81087.61082.11075.71069.3
0.05740.5431123.11118.41113.41107.9
w 1 = 0.4
0.00000.0001018.41013.31007.81001.9995.5988.9981.9
0.01700.1051045.61040.71035.31029.61023.61017.31010.6
0.03410.2151073.41068.51063.31057.81051.91045.81039.4
0.05070.3251102.01097.21092.01086.51080.81074.91068.6
0.06690.4361130.31125.41120.21114.71109.21103.21097.0
0.08260.5481155.51150.41145.11139.5
w 1 = 0.5
0.00000.0001023.61017.81011.61005.2998.4991.4984.1
0.02050.0921052.31046.71040.91034.71028.31021.71014.8
0.04060.1861082.41077.01071.41065.51059.41053.01046.4
0.06200.2901112.71107.41101.91096.21090.31084.21077.9
0.08250.3951144.51139.21133.81128.31122.51116.61110.5
0.10130.4951175.71170.41165.01159.41153.61147.5
a Standard uncertainties u are u(α) = ±0.005, u ( w ) = ±2 × 10⁻⁴ kg, u(p) = ±0.003, u ( T ) = ±0.012 K, u ( r e p ) = ±0.13 kg·m−3. The combined expanded uncertainty U c is U c ( ρ ) = ±7.80 kg·m−3 (level of confidence = 0.95, where k = 2).
Table 5. Density correlation parameters for CO2-loaded aqueous MEA.
Parameters w 1 = 0.3 w 1 = 0.4 w 1 = 0.5
a 1 0.68020.77310.7506
a 2 0.0019510.0013540.001494
a 3 −2.97 × 10⁻⁶−2.015 × 10⁻⁶−2.237 × 10⁻⁶
a 4 2.3462.1642.015
AARD (%)0.150.080.15
AMD (kg·m−3)4.223.8
Table 6. Parameters of the excess free energy of activation for viscous flow correlation.
w 1 T/KParameters
0–1298.15–363.15 a 0 = 16.2
b 0 = −0.03473
a 1 = −4.853
b 1 = 0.008315
a 2 = −6.433
b 2 = 0.02065
R2 = 0.998
Table 7. Measured viscosity η of aqueous MEA a,b,c,d.
w 1 x 1 Measured   Viscosity   η /mPa·s
293.15 K303.15 K313.15 K323.15 K333.15 K343.15 K353.15 K363.15 K
0.30.11222.836
2.874 b
2.879 b
2.109
2.133 b
2.130 b
1.628
1.628 b
1.638 b
1.67 c
1.290
1.305 b
1.318 b
1.33 c
1.046
1.055 b
1.067 b
0.866
0.878 b
0.874 b
0.92 c
0.740
0.742 b
0.740 b
0.77 c
0.687
0.40.16434.2853.0802.305
2.28 c
1.782
1.75 c
1.4171.154
1.14 c
0.960
0.95 c
0.808
0.50.22786.6104.580
4.69 d
3.310
3.39 c
3.37 d
2.454
2.54 c
2.53 d
1.915
1.94 d
1.528
1.57 c
1.54 d
1.243
1.28 c
1.26 d
1.029
1.05 d
0.60.306710.2176.769
6.92 d
4.736
4.77 d
3.444
3.45 d
2.602
2.62 d
2.031
2.04 d
1.620
1.62 d
1.319
1.34 d
0.70.407715.3489.823
9.89 d
6.664
6.96 c
6.69 d
4.720
4.94 c
4.76 d
3.461
3.49 d
2.615
2.79 c
2.63 d
2.029
2.18 c
2.04 d
1.616
1.63 d
0.80.541220.52112.840
13.38 d
8.534
8.82 d
5.937
6.11 d
4.295
4.41 d
3.217
3.26 d
2.483
2.49 d
1.962
1.97 d
0.90.726424.02714.963
15.12 d
9.879
10.20 c
9.95 d
6.829
7.06 c
6.88 d
4.936
4.94 d
3.683
3.81 c
3.67 d
2.832
2.93 c
2.82 d
2.222
2.23 d
11.000023.37614.748
14.77 d
10.108
9.61 c
9.84 d
6.935
6.72 c
6.87 d
5.067
4.98 d
3.834
3.69 c
3.72 d
2.974
2.85 c
2.85 d
2.364
2.26 d
a The pressure was maintained by N2 gas (p = 4 bar) during the experiments. Standard uncertainties u are u ( w ) = ±2 × 10⁻⁴ kg, u ( p ) = ±0.003, u ( T ) = ±0.012 K, u ( r e p ) = ±0.008 mPa·s. The combined expanded uncertainty U c is Uc(η) = ±0.016 mPa·s (level of confidence = 0.95, where k = 2). b Hartono, Mba and Svendsen [10], c Amundsen, Øi and Eimer [6], d Idris, et al. [26].
Table 8. Average absolute relative deviations and absolute maximum deviation of different suggested correlations for viscosity of aqueous MEA solutions from w 1 = 0 to w 1 = 1 and 293.15–363.15 K.
Source (s)No. ParametersAARD (%)AMD (mPa·s)
This work61.40.79
Hartono, et al. [10]42.40.66
Arachchige, et al. [11]73.51.1
Islam, et al. [17]45.10.59
Table 9. Measured viscosity of CO2-loaded (α/mol CO2 mol·MEA−1) aqueous MEA a.
x 3 α Measured   Viscosity (η/mPa·s)
293.15 K303.15 K313.15 K323.15 K333.15 K343.15 K353.15 K
w 1 = 0.3
0.00000.0002.8362.1091.6281.2901.0460.8660.740
0.01050.0953.1032.3051.7681.3971.1280.9370.788
0.01930.1753.3382.4761.9101.5111.2281.0210.865
0.03550.3283.7302.7642.1381.6991.3841.1520.977
0.04760.4454.1643.1052.4031.9131.5621.3081.118
0.05740.5434.5153.3602.6022.0641.6801.4031.191
w 1 = 0.4
0.00000.0004.2853.0802.3051.7821.4171.1540.960
0.01700.1054.7933.4232.5671.9851.5901.3021.090
0.03410.2155.5243.9442.9682.3081.8511.5261.286
0.05070.3256.4964.6553.5022.7262.1981.8131.524
0.06690.4367.6395.4424.0843.1772.5562.1111.781
0.08260.5488.8206.2034.6143.5442.8212.3021.917
w 1 = 0.5
0.00000.0006.6104.5803.3102.4541.9151.5281.243
0.02050.0927.8595.3783.9262.9552.3031.8381.493
0.04060.1869.5186.5294.7563.5942.8132.2691.866
0.06200.29011.6117.9045.7104.2913.3282.6672.190
0.08250.39514.85410.0737.2475.4224.2273.4092.809
0.10130.49519.34812.8419.0686.6785.1694.1183.365
a The pressure was maintained by N2 gas (p = 4 bar) during the experiments. Standard uncertainties u are u ( α ) = ±0.005, u ( w ) = ±2 × 10⁻⁴ kg, u ( p ) = ±0.003, u(T) = ±0.012 K, u ( r e p ) = ±0.008 mPa·s.
Table 10. Parameters of viscosity correlation for CO2-loaded solutions.
T/KParameters w 1 = 0.3 w 1 = 0.4 w1 = 0.5
298.15–343.15d14.5362.5548.533
d 2 0.0067650.01205−0.0037
d 3 12.0819.4617.79
AARD (%)0.581.131.25
AMD (mPa·s)0.030.221.04
Table 11. Free energy of activation for viscous flow Δ G * /kJ·mol−1 for CO2-loaded aqueous MEA.
T/K293.15303.15313.15323.15333.15343.15353.15
w 1 x 3 Free   Energy   Δ G * / kJ · mol 1
0.30.000012.37512.06211.79811.56411.35811.17711.060
0.010512.57112.26211.98811.75311.53911.37611.222
0.019312.72112.41312.15911.93111.74011.58311.451
0.035512.97012.66712.42812.22012.04411.90011.783
0.047613.21012.93112.70212.50712.34712.22812.150
0.057413.38213.10512.88312.685
0.40.000013.59513.24012.93612.67412.44812.25512.094
0.017013.83513.47113.17912.92412.72612.55612.419
0.034114.14813.79313.52113.29113.10512.96512.860
0.050714.50914.17513.91413.69813.54013.41313.312
0.066914.87014.53414.27814.07213.91913.80713.725
0.082615.19414.83714.56814.337
0.50.000014.89114.48914.13713.80213.56013.34413.148
0.020515.27514.85314.53814.25514.02213.81913.631
0.040615.70115.29914.99214.73314.52614.36614.230
0.062016.14715.74115.42615.16514.94514.77914.648
0.082516.70716.30916.00215.74715.55915.42715.325
0.101317.31116.87916.54316.26216.06915.918
Table 12. Free energy of activation for viscous flow Δ G * /kJ·mol−1 for CO2-loaded aqueous MEA.
w 1 x 3 ΔH*/kJ·mol−1 Δ S * / J · ( mol · K ) 1
0.30.000018.83422.301
0.010519.15022.696
0.019318.90221.360
0.035518.71619.895
0.047618.40018.003
0.057420.17323.234
0.40.000020.89725.215
0.017020.68823.742
0.034120.37721.642
0.050720.26620.026
0.066920.37919.209
0.082623.54028.578
0.50.00002339129.339
0.02052314727.247
0.04062277324.566
0.06202338925.142
0.08252338123.248
0.10132544128.114

