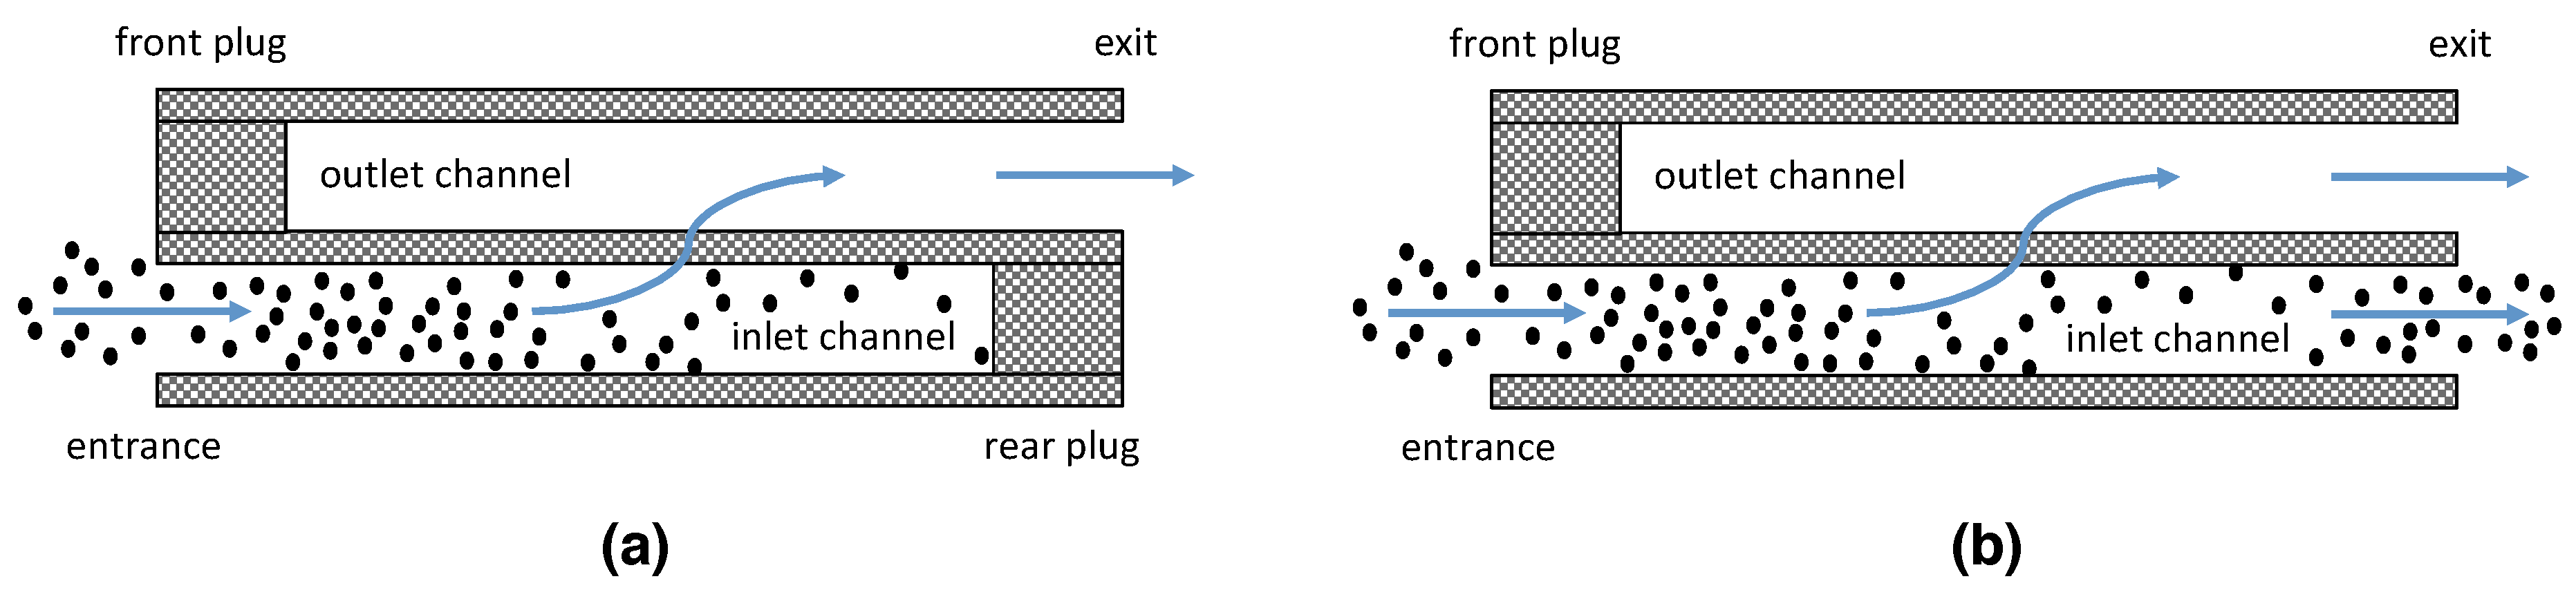
In this section, representative results are presented in order to highlight the main features of the fluid flow in filters with intact or damaged exit and their differences and assess their impact on the particle deposition process.
5.1. Fluid Velocity and Pressure Fields
Figure 7a shows the instantaneous
U velocity component of the carrier phase in
y-
z planes placed at different distances along the
x-direction for a representative case of intact filter at
. These planes are indicated in the insert above the figure by the dotted lines against the filter element. The fluid flow is almost uniform upstream of the channels (plane A). As the entrance of the inlet channels is approached, the flow is contracted (plane B), obtaining a velocity distribution that corresponds to a plug flow (plane C). The fluid flow is gradually developed into a parabolic profile (planes D and E). A symmetric velocity distribution is apparent, exhibiting a maximum value at the center of the inlet channels. It is found that the center-line
U velocity is increased up to 30% of the channel length (planes C–D) and it is then decreased with further increasing distance from the entrance (planes E, F and G). A back-flow can be seen, indicated by blue color, which becomes considerable and covers a significant portion of plane F. The spatial evolution of the
U velocity inside the outlet channels is nearly complementary to that described above for the inlet channels (planes C–G). For example, the velocity is adjusted to a laminar parabolic distribution as proceeding in the streamwise direction. In contrast to the inlet channels, the center-line
U velocity is now increased monotonously. As expected, the fluid flow leaves the outlet channels as strong jet-like events. The jets are accompanied by large recirculation areas located in the wake of the rear plugs (planes H–J). The red regions correspond to the jets and the blue regions indicate negative values of the
U velocity. A non-homogeneous turbulent field is obtained and maintained at a sufficient distance downstream of the intact filter element (plane K). However, it becomes weaker and relatively homogeneous farther away from it (plane L).
Figure 7b shows the development of the
U velocity in the
x-direction for the damaged filter without rear plugs at
. The flow evolution in front of the defective filter element, as well as in the first part of the channels resembles that of the intact filter (planes A, B, C, D and E). Most of the fluid flow escapes now from the unplugged inlet channels (planes F and G) and, thus, a smaller amount of fluid passes through the permeable walls into the outlet channels. Lower
U velocities are generally found at the exit of the damaged filter relative to the intact filter. In the region after the defective element, there are four fluid jets together with small recirculating regions having sizes of the order of the permeable wall thickness (planes H, I, J, and K). The jets arising out of the unplugged inlet channels are stronger than those exiting from the outlet channels, while they are both weaker as compared with the jets appearing in the intact filter element. Further away from the exit, an inhomogeneous, non-sustainable turbulence becomes visible (plane L). It is noted that the characteristics of the fluid turbulence are generally different between the two flow configurations.
The flow fields of the carrier phase in the intact and damaged filters at different Reynolds numbers are similar to those presented for
. However, there are some key differences that can be noticed in the inlet, exit and downstream of the elements at small
values. More specifically,
Figure 8a,b show the streamlines near the entrance of the intact filter at
and
, respectively. At low
values, a smooth flow contraction takes place, while a condition of
vena contracta is reached at the largest Reynolds number examined here. In the latter case, small recirculating bubbles are observed adjacent to the walls. The maximum contraction occurs slightly downstream of the entrance, where the fluid stream acquires also its maximum velocity. The size of each recirculating region is approximately
. It was confirmed that the removal of the rear plugs has a negligible effect on the flow evolution upstream of the filters and in the region close to the entrance of the inlet channels. Therefore, the results shown in
Figure 8 and the above discussion are valid for both the intact filter and the damaged filter with missing rear plugs.
The effect of the Reynolds number on the fluid velocity at the exit of the intact and damaged filters is illustrated in
Figure 9. Regarding the intact filter,
Figure 9a clearly demonstrates that a 3D steady and laminar flow is established at
. The fluid leaves the outlet channels as coherent jets, whereas a large recirculation may also be seen that covers the whole area of the rear plug. There is no evidence of back-flow at the end of the inlet channels when the Reynolds number is sufficiently small. For comparison purposes, the instantaneous and the time-averaged
U velocity at the exit in the case with
are also shown in
Figure 9c,e, respectively. The non-dimensional collection time for the calculation of the mean velocity is
. It can be seen that the jets have a larger extent in the streamwise direction at the higher Reynolds number, the area with negative values is somehow wider in the
y,
z-directions and it is located further away from the outer surface of the rear plug.
Figure 9c indicates that the jets exhibit oscillations as they are formed in the
x-direction. The flow instabilities result in the breakup of the jets downstream of the filter exit, enhancing mixing and fluid turbulence. The aforementioned main flow events at the exit of the intact filter element can be identified in both
Figure 9c,e. However, the jets and the recirculation bubble in the time-averaged flow field are smoother than those seen in the instantaneous flow field. It can be noticed that the results up to
in
Figure 9c,e are almost identical to each other, which points out an essentially steady flow inside the inlet and outlet channels of the intact filter.
The removal of the rear plugs has a profound effect on the velocity distribution at the exit of the damaged filter depending on the Reynolds number.
Figure 9b reveals that the maximum
U velocity (regions in red) associated with the fluid jet exiting from the defective inlet channel is reduced at
. There is no indication of any local recirculations. A 3D steady and laminar flow regime prevails at low
values.
Figure 9d shows that a turbulent flow is obtained at
, which can be attributed to the spatial growth of instabilities as the central fluid jet evolves downstream of the filter. The central fluid jet appears to be larger in the damaged filter. However, it has lower momentum and, thus, longer distances are required so that it can break up. The jet exiting from the outlet channel has even smaller momentum and flow oscillations are totally absent. The enlargement of the jets is accompanied by a considerable increase of the wake behind the permeable walls (regions in blue). This is an outcome of the fluid mass conservation. In particular, the areas of high
U velocity (in red) are accompanied by areas of low
U velocity so that the overall mass flow rate in each
X location remains constant. Small recirculating areas can also be seen next to the walls. It can be noticed that the characteristics of the time-averaged
U velocity are similar to those of the instantaneous velocity as shown in
Figure 9f,d, respectively.
The distribution of the
U velocity at both ends, upstream and downstream of the intact filter is consistent with the recent experimental observations of Cooper et al. [
18]. The variation of the fluid streamwise velocity inside the inlet and outlet channels is also in qualitative agreement with findings in previous numerical studies [
9,
10,
11]. Even though the flow in single square channels with impermeable walls has been extensively studied previously (see, for example, Reference [
49]), the channel flow changes significantly due to the porous wall boundary condition as discussed above. The present study points out that distinct geometrical imprints on the streamwise fluid velocity exist upstream and downstream of both filters. The imprints are visible at distances approximately up to
from the entrance and exit of the elements, respectively. Such property could possibly be used in the future for flow design and passive control purposes of intact and damaged wall-flow PFs.
The wall permeability may potentially influence the flow features observed in PFs. A weak effect of wall permeability is anticipated here, as indicated by the Reynolds number based on the square root of permeability
which is smaller than
, where
is the wall-friction velocity at the entrance of the inlet channels. Wall roughness can potentially trigger turbulent flow and its effect depends on the Reynolds number
which in our case is always
. According to Hinze’s classification [
50], the effect of roughness is negligible when
, while a fully rough wall occurs at
. This classification strictly holds for rough and impermeable walls but it also gives a clue in the case where the wall is rough but permeable. Wall roughness is not modeled or taken into account in this work but its effect would be rather insignificant in the cases examined, based on the above analysis. Nevertheless, under different flow conditions and parameters, for example high values of
and/or
, wall roughness effects should be expected.
The flow at the end of the filters seems to comparable to that around rectangular objects. As discussed in Breuer et al. [
51], the flow around a single square object is laminar at low
values and it becomes unsteady as the Reynolds number increases. Such transition from steady to unsteady flow takes place also in the problems under investigation. For example, the flow is laminar throughout the domain at
and 408, while a non-homogeneous decaying turbulence is obtained downstream of the intact filter exit at
and 1632. Similar observations can be made for the damaged filter without rear plugs. However, in this case, the features of turbulence are closer to those in the multi-channel flow of monolithic reactors studied in References [
52,
53]. It is noted that the flow configurations examined here are far more complex with respect to the flow around rectangular objects due to the permeable walls and the chessboard arrangement of the plugs. Moreover, the actual PF has thousands of channels and the flow at the exit may interact, favoring the development of instabilities and the transition to turbulence.
Figure 10a,b show the variation of pressure in the channels of the intact and damaged filters, respectively. For both geometries, the pressure is reduced more inside the outlet channels. The overall pressure drop is decreased as
is increased, which is more obvious in the intact filter. Abrupt pressure reduction occurs at the entrance of the inlet channels and at the front plugs. In the intact filter, a significant pressure reduction also occurs at the rear plugs. It can be seen that the pressure inside the inlet channels is increased as the rear plug is approached at
, 816 and 1632, which gives rise to the back-flow found in these cases.
Figure 10a,b also show the evolution of pressure along the
x-direction at the entrance and exit of the filters in the close-up views included in each diagram. At
, a local minimum pressure is observed after the entrance of both filters, as shown in the left zoom window of
Figure 10a, which is characteristic of the
vena contracta condition. It should be noted that this behavior is absent in all the other
cases. Downstream of the filters, pressure fluctuations can be seen as the Reynolds number is increased. For both PFs, it is found that the pressure drop at the entrance is
,
,
, and
at
, 408, 816, and 1632, respectively. The pressure losses at the exit of the intact filter are
,
,
, and
, while for the damaged filter it holds that
,
,
, and
for
, 408, 816, and 1632, respectively. It turns out that the pressure losses are larger at the entrance as compared with those predicted at the exit of the filters, whereas
is greater for the intact filter.
5.2. Flow Rates
The results in
Figure 7 and
Figure 9 point out that the fluid flow is progressively transferred from the inlet to the outlet channels through the porous walls. This also happens, although partially, even in the case without rear plugs. The above observations are confirmed in
Figure 11, which shows the variation of the fluid flow rate across the inlet
and the outlet
channels with the normalized distance
. Results are presented for both geometries at
, 408, 816, and 1632. It can be seen that the mass flow rate of the carrier phase is decreased along the
x-direction in the inlet channels, while it is increased in the outlet channels.
For the intact filter, the summation of and at every location is always constant and it equals to the flow rate at the entrance of the inlet channels and at the exit of the outlet channels, . At , an almost linear distribution of and can be noticed, and the same flow rate is achieved approximately at the half length of the channels. As the Reynolds number is raised, a weaker reduction (increase) of is revealed, while the condition is found at distances closer to the end of the inlet channel. Relatively high values of prevail for longer distances from the entrance, leading to a steeper reduction as the region in front of the rear plug is approached. For the damaged filter, is attenuated (augmented) slowly toward the exit, which is more noticeable as the Reynolds number is increased. At the same , the flow rate inside the defective inlet channels is greater relative to the intact inlet channels, while the opposite is true regarding the flow rate inside the outlet channels. The condition is not present when the rear plugs are removed and is always greater than for the range of parameters examined here.
Figure 12 shows the flow rate through the porous walls
along a pair of channels in the cases with
, 408, 816, and 1632. In the intact filter, the distribution of
varies non-uniformly in the
x-direction, exhibiting two peak values near the ends of the filter, as shown in
Figure 12a. The first
peak at the entrance is due to the high velocities of the plug flow profile near the wall. As the flow is steadily modified into an almost parabolic velocity distribution, the near-wall fluid velocities are attenuated and, consequently, the flow rate through the walls is reduced. The second
peak at the exit is attributed to the pressure increase that takes place as the plugged end of the inlet channel is approached, which produces a substantial enhancement of the flow through the walls. The present
profiles are consistent with previous results from 3D CFD simulations [
9,
10,
11,
12] and simpler 1D models [
26] in a different parameter space (
,
,
,
,
,
and
). The results in
Figure 12a suggest that the flow rate through the walls differs with varying
. For example, the magnitude of the
peak value close to
is greater than that near
for all the
cases examined here. Since a fixed fluid flow rate passes from the inlet to the outlet channels, the increase of
in the second half of the inlet channels observed with increasing
is accompanied by a reduction in the rest region. A local minimum value of
is seen around
of the filter length for
, which is shifted toward the entrance as the Reynolds number is increased, while its magnitude is reduced. The trends found in
may be explained by considering the differences of the pressure inside the inlet and outlet channels. It turns out that the extreme values of the pressure difference between the channels and of
are found at the same locations.
Figure 12b reveals absence of the
peak value at the exit due to the missing rear plugs. In the damaged filter, the pressure difference between the inlet and outlet channels is constantly decreased along the
x-direction, and the same pressure is obtained at the exit of the channels. Thus, there is no longer a driving force that creates the flow through the walls and
is diminished at the exit of the defective filter. The
dependence of the
peak near the entrance is similar to that described above for the intact filter. Nevertheless, its magnitude is damped and the overall
is attenuated as
is decreased. This behavior can be associated with the different spatial evolution of the fluid velocity and pressure in the defective inlet channels, as discussed in
Figure 7,
Figure 8,
Figure 9 and
Figure 10.
Figure 12b indicates that less fluid crosses the permeable walls relative to the intact filter, which explains the lower flow rates achieved along the outlet channels, as well as the weaker fluid jets coming out from the unplugged inlet channels. Similar
profiles have been obtained previously by utilizing 1D models [
24,
25,
26], while there are no results from 3D CFD studies. The present work provides further insight into the 3D features of the fluid flow in defective filter channels without rear plugs, which can potentially lead to non-uniform particle deposition.
5.3. Particle Transport and Deposition
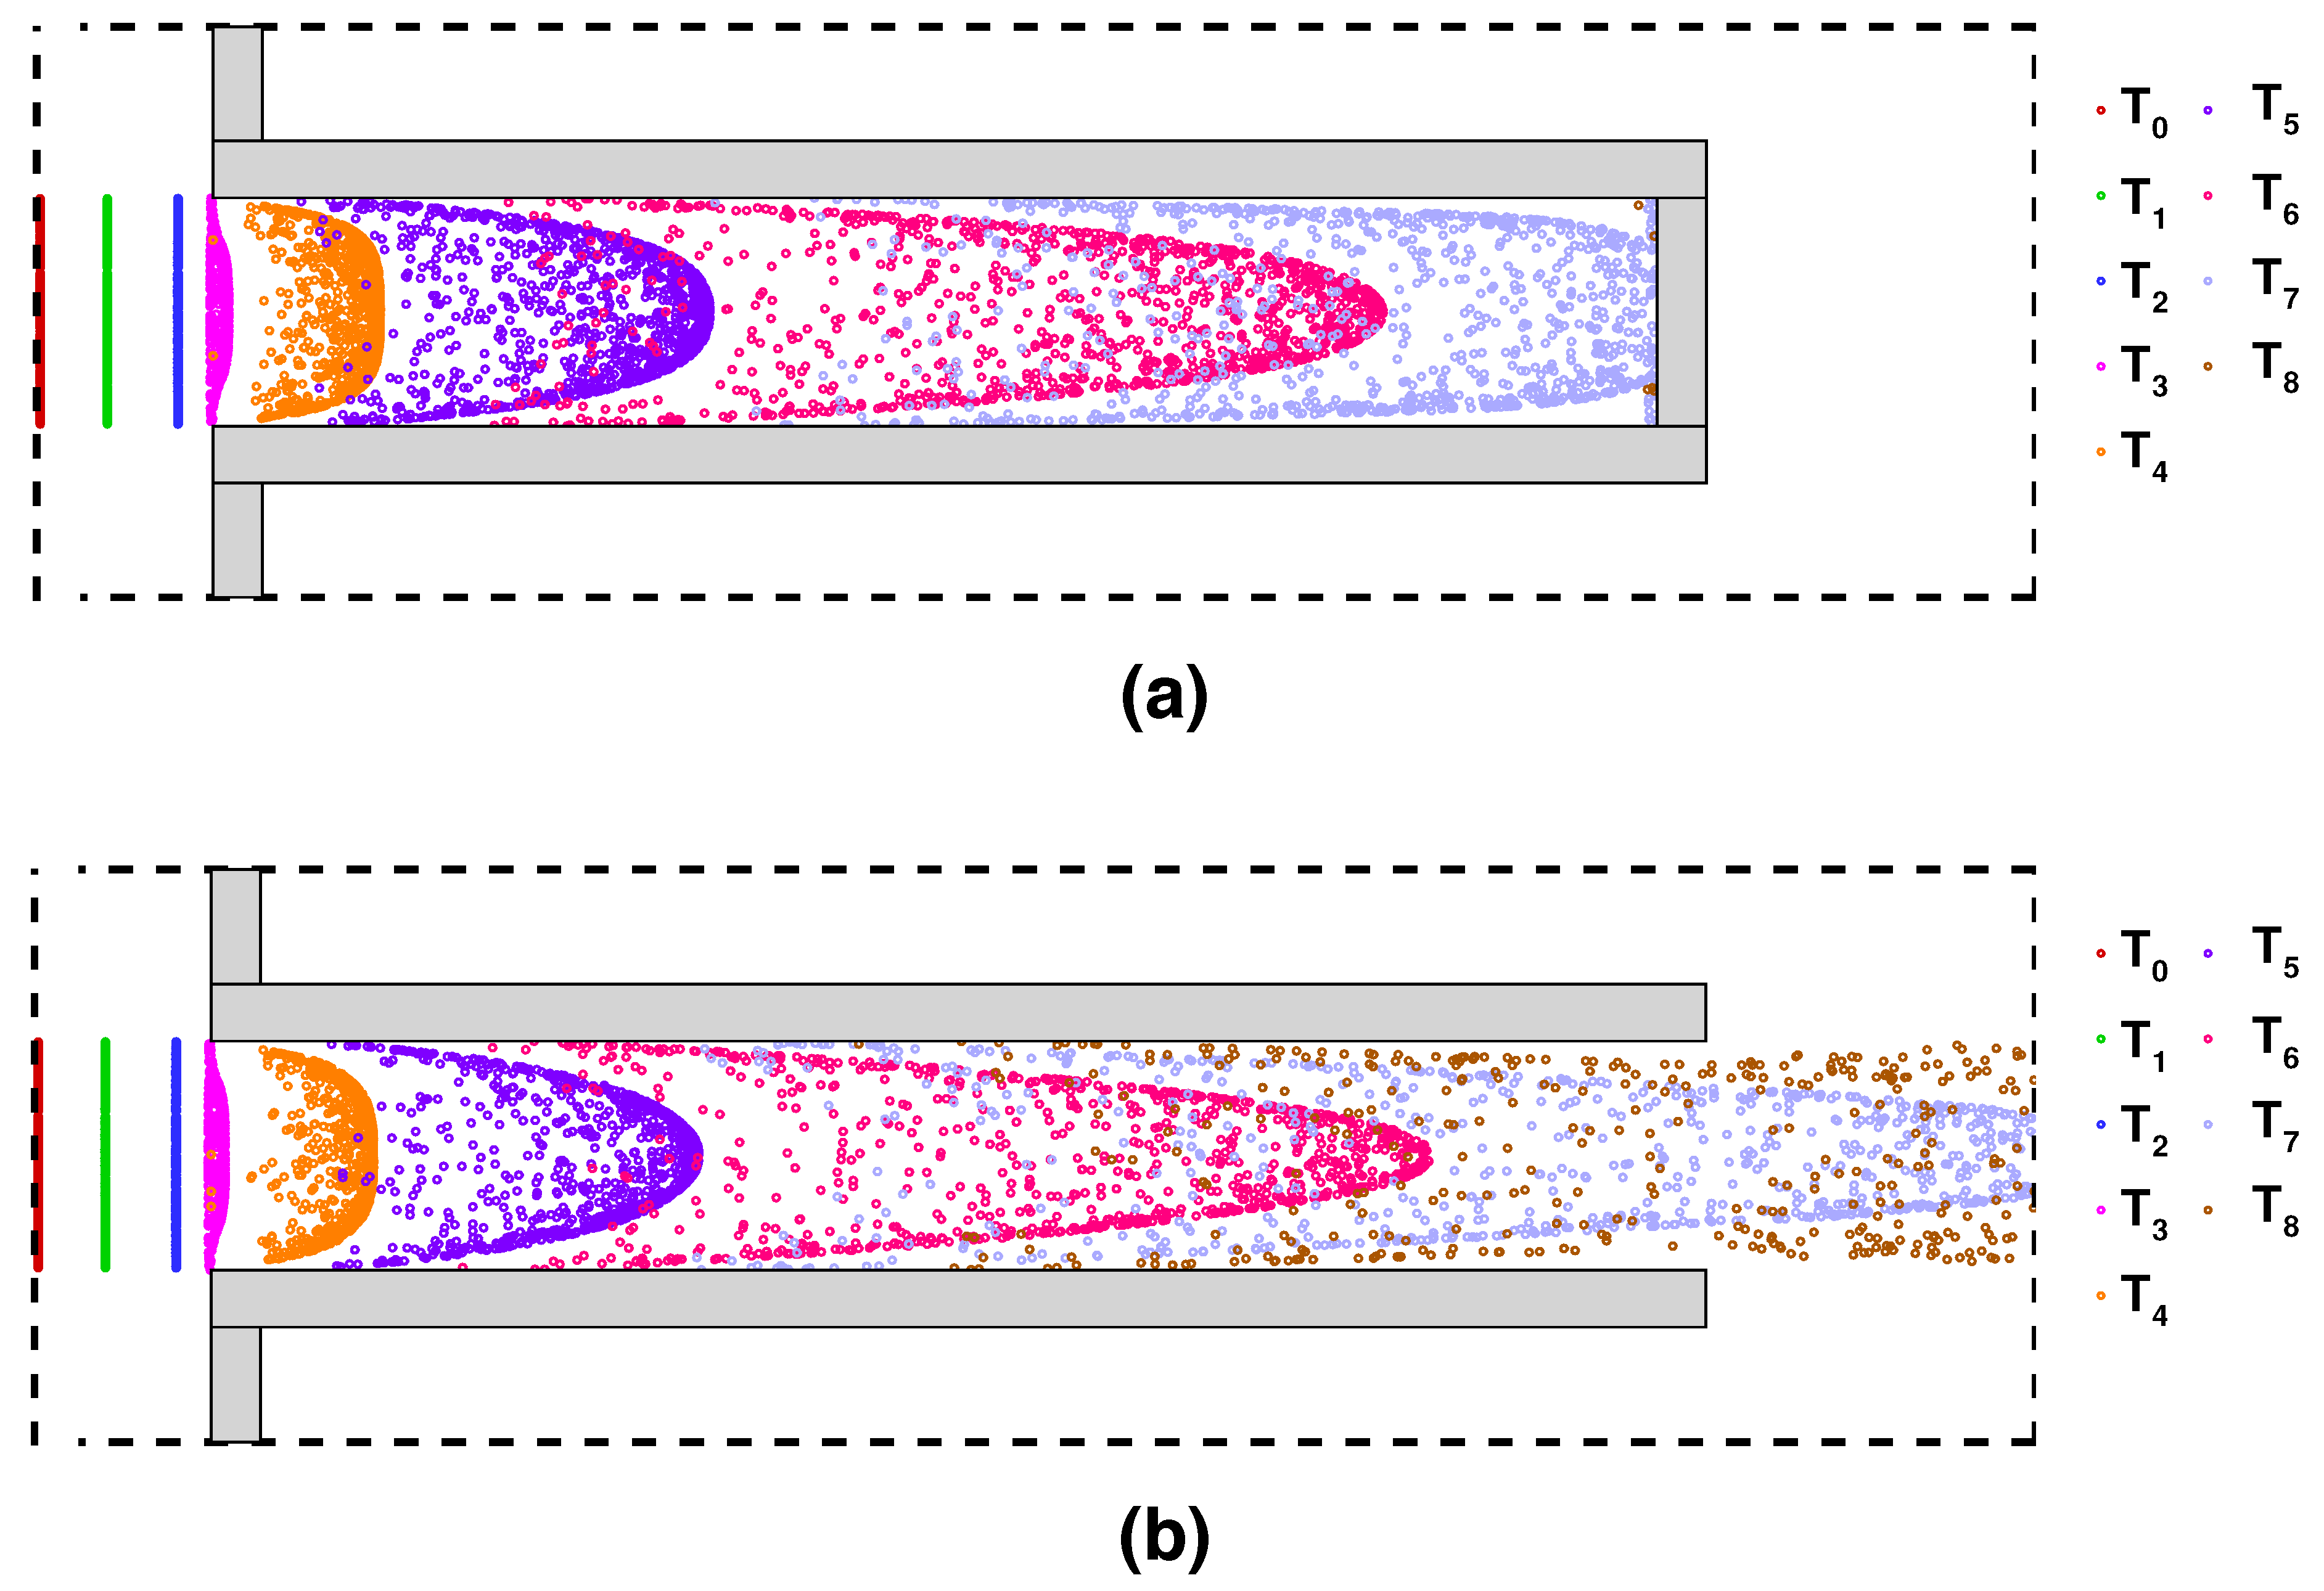
Figure 13 shows a visual impression of the instantaneous positions of particles having diameter
nm in the intact and damaged filters at representative time instances
. For the intact filter, the particles are uniformly introduced in the computational domain from the inflow boundary (
) as shown in
Figure 13a. They are transported by the fluid flow, maintaining an almost uniform distribution upstream of the filter (
), while part of the particles moves toward the central region of the entrance (
). The particles located initially in the innermost zone of the inlet channel move longer distances in the
x-direction, due to the greater fluid velocities there. In addition, the particles travel toward the permeable walls, because of the transverse fluid velocities that develop in the inlet channels. As an outcome of these combined fluid motions, the particles are concentrated in certain flow regions forming a paraboloid. The instantaneous particle positions look closely like the distributions of the streamwise fluid velocity, and their evolution at different times (
) is quite similar to the fluid flow evolution in the
x-direction from a plug into a laminar parabolic profile. The particle stream reaches the rear plug (
) and eventually the population of particles is reduced significantly owing to their deposition (
).
The same observations can also be made for the time evolution of the particle positions in the damaged filter, especially at the early stages of particle dispersion
, as shown in
Figure 13b. However, the removal of the rear plugs permits the particles to exit from the defective channels (
). After some time, all the particles that have not deposited leave the computational domain from the outflow boundary. As discussed above, the fluid velocity field obtained in the damaged filter differs from that in the intact filter, which is reflected on the different spatial distribution of the particles between the two cases (
).
To gain further insight into the particle transport by the carrier fluid flow,
Figure 14 shows characteristic trajectories of particles with
nm at
. In the flows examined here, high transverse fluid velocities are generated in the inlet channels and the fluid passes through the permeable walls. Consequently, the fluid streamlines are not parallel to the surface of the porous walls and plugs but they cross it. Small size particles are capable of responding quickly to all changes of the fluid flow. The response times of the particles used in the simulations are
,
, and
that correspond to Stokes numbers
in the range of
. It is clear that such low response time particles under the effect of drag force and inertia tend to follow closely the fluid streamlines. This behavior of particles is not considerably altered by the inclusion of the Brownian force terms, at least from a macroscopic viewpoint (see, for example, References [
9,
54]). The transverse fluid velocities become weaker in the defective inlet channels and only a part of the fluid flows through the walls into the outlet channels. The streamlines between the intact and damaged filters are dissimilar to each other, as a consequence of the different hydrodynamic flow fields in these cases. This unlikeness is expected to be reflected on the particle trajectories.
For the intact filter,
Figure 14a shows that initially the particle paths bend inward at the entrance of the inlet channel due to the flow contraction. This can be appreciated better in
Figure 14c, which reveals that the particle trajectories at the entrance are similar to the fluid streamlines there (see
Figure 8). Most of the particles are carried in the filter (
to
), whereas, under certain conditions, some of them may follow the fluid streamlines that go through the frontal face of the filter, where they are deposited (
). Inside the inlet channel, the particles are effectively transferred by the underlying fluid motions toward the porous walls. The locations at which the particles hit the walls vary in the
x-direction, as indicated in
Figure 14a. This can be attributed to the fact that the cross-flow fluid motions are relatively weak away from the walls and, thus, the particles that enter from the central region of the inlet channels are most likely to travel longer distances in the streamwise direction.
Figure 14d indicates that the back-flow observed at the end of the inlet channels at
(see
Figure 7 and
Figure 9) affects significantly the motion of the particles (
,
to
), and it can potentially control the number of particles that impact the rear plugs. Away from the channel end, the back-flow is not strong enough to produce a noticeable effect on the particle path-lines (
,
). The effect of the missing rear plugs on the particle transport is demonstrated in
Figure 14b. It is seen that the particle path-lines from the inflow boundary up to the entrance of the flawed inlet channel are identical to those described for the intact filter. On the other hand, the locations of the deposited particles inside the inlet channel are obviously different between the two cases (
to
). This is because of the discrepancies in the velocity and pressure fields between the two configurations at a certain Reynolds number.
Figure 14b also shows the trajectories of some particles that escape from the unplugged inlet channel (
,
, and
).
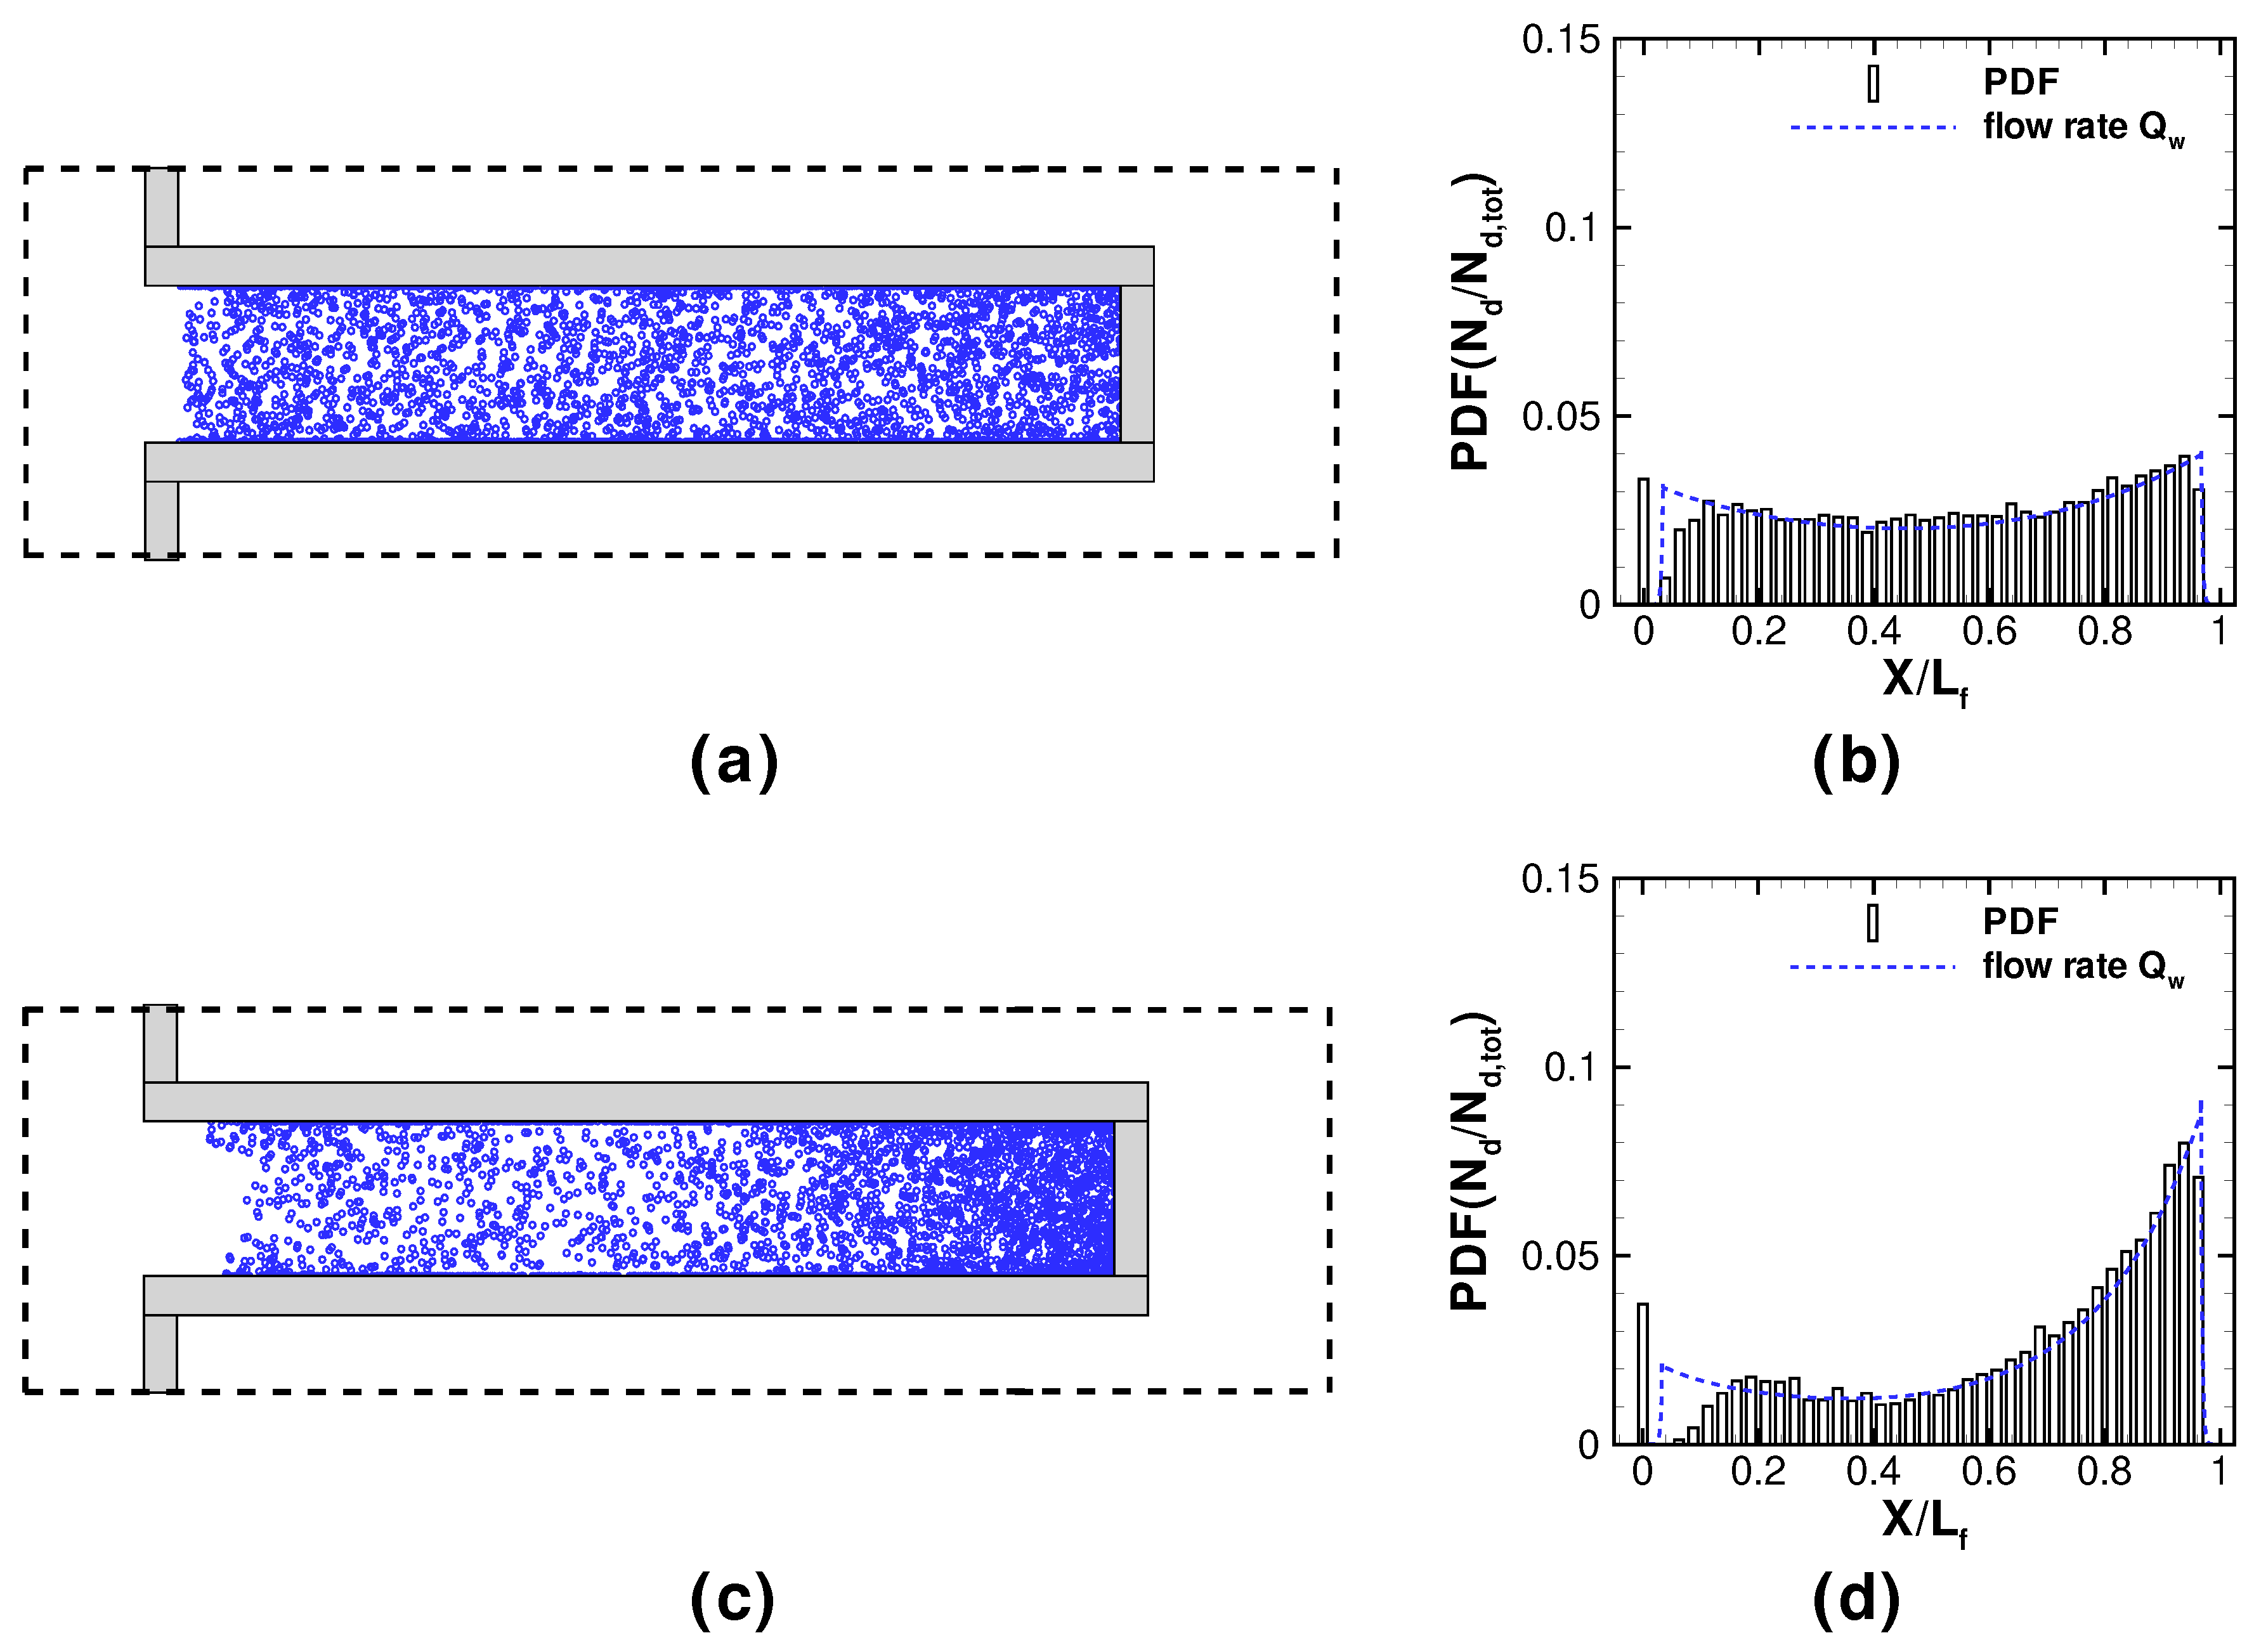
Next, we try to characterize and quantify the deposition of nanoparticles in the intact and damaged filters. The positions at which
nm particles deposit at the walls of the intact filter are shown in
Figure 15a,c, respectively. The data in these figures correspond to the positions where the particles hit the two
x-
y channel sides.
Figure 15b,d show the probability density function (
) of the deposited particles as a function of the
x-direction. The
has been computed by counting the number of particles
that impact each of the four channel walls within specified intervals in the streamwise direction, normalized by the total number of deposited particles
. This quantity may be considered a more quantitative way to describe the variation of particle deposition along the length of the inlet channel.
Figure 15b reveals that the particles are deposited almost uniformly over a large extent of the inlet channel at
. Two small peak values of the
appear near both ends of the channel. On the other hand, it is evident in
Figure 15d that the vast majority of the particles are deposited preferentially at the end of the inlet channel at
. A smaller peak value of the
also occurs near the entrance of the filter. The
x variation of
resembles closely the distribution of the through-wall flow rate
that is also shown in these figures. This similarity suggests that the convective fluid transport toward the permeable walls is the key mechanism that controls the particle deposition in the intact filter (see, for example, References [
9,
10]) At
, the locations of deposited particles are uniformly distributed at the walls in the spanwise direction, as shown in
Figure 15a. The 200 nm particles are capable of responding even to relatively weak transverse fluid motions that can transfer them toward the walls. At
, the Stokes number is increased, which points out that more momentum is required so that the particles can reach the walls.
Figure 15c indicates that the particles impact the walls on positions that are non-uniformly spread, exhibiting a somehow greater tendency to deposit at regions closer to the corners of the channel. The through-wall flow at the corners is an outcome of the contribution of both cross flow
y and
z velocity components, resulting in a higher flow rate through the permeable walls and, subsequently, an enhanced local particle deposition.
These observations are consistent with the findings of Sbrizzai et al. [
9], while the present study provides further results for the Reynolds number effect on the spatial distribution of deposited particles in the streamwise and spanwise directions. It turns out that the Stokes number for a specific particle set decreases with increasing Reynolds number, producing an overall effect on the particle deposition that is similar, at least from a statistical point of view, to that observed when the size of particles is decreased while the Reynolds number is kept constant.
Figure 16 shows the positions of deposited particles and the distribution of
in the case of damaged filter at
and 1632. The similarity between
and
distributions still holds, although to a lesser extent, irrespective of the missing rear plugs as shown in
Figure 16b,d. For all the
cases examined, the
obtains larger values in the initial portion of the inlet channel and zero close to the channel exit. It can be seen that the peak value of the
is shifted further away from the entrance with increasing Reynolds number. It is noted that this behavior is also observed in the intact filter in
Figure 15b,d but it is less pronounced. These findings point out that the through-wall flow plays an important role in the particle deposition in the damaged filter without rear plugs. However, this deposition mechanism is less effective as compared with the case of intact filter. Consequently, the population of deposited particles is significantly attenuated, as shown in
Figure 16a,c, especially at
.
Based on the results shown in
Figure 13,
Figure 14,
Figure 15 and
Figure 16, it can be inferred that the behavior of the particle-laden flow upstream of the PFs is not influenced by the presence of the rear plugs. The present study provides evidence that a significant amount of particles is deposited at the front area of the filters, as indicated by the non-zero value of the
for
(first bar in
Figure 15b,d and
Figure 16b,d). For both the intact and damaged filters, it is found that
and
of particles with
nm impact the frontal face at
and 1632, respectively. This denotes that particle deposition at the front area of the filters is enhanced as the Reynolds number is raised. It should be noted that the different values of the
for
between the intact and damaged filters at a fixed
are because
in the latter case generally differs with varying Reynolds number, whereas
is the same.
To obtain a clearer picture regarding the particle deposition on the frontal area of the PFs, we examine the locations of deposited particles at
and 1632, which are shown in
Figure 17a,b, respectively. Results are presented for the intact filter, but exactly the same analysis also holds for the damaged filter. A significant accumulation of particles is apparent at the edges of the entrance. This is because the particles are transferred by the carrier phase following streamlines that cross the permeable plugs and walls, as illustrated in
Figure 17c. The streamlines correspond to the
plane, at which the particle trajectories are projected. The small deviation observed between the particle trajectories and the streamlines close to the front porous wall is because the particles are actually deposited at a different
z plane, and in lower degree due to the random shift introduced to the impact location by the Brownian force terms. The deposition of nanoparticles, especially at the filter entrance, may lead to the formation of complicated dendrites. Their presence will certainly affect the fluid flow inside the channels, the pressure losses, and the particle collection efficiency. The local recirculating bubbles observed at the entrance of the intact and damaged filters at
are isolated from the rest of the flow. These are surpassed by the fluid streamlines entering the channels and, thus, they cannot interact with or capture the dispersed particles. The same also holds for the recirculations at the exit of the PFs. However, the presence of recirculations has a pronounced effect on the distributions of velocity and pressure and, thus, they affect indirectly particle deposition.
The numerical results on the particle deposition process in intact filters and damaged filters with missing plugs are consistent with recent experimental findings [
43]. For instance, the experiments indicate clearly that the deposit soot accumulates almost uniformly in the central region of the intact filter, whereas the deposit loading is gradually reduced from the entrance of the defective filter obtaining a zero value at its exit. The present work focuses on the investigation of particle transport and deposition at low filtration times in clean PFs. Under such conditions, it is reasonable to assume that the distribution of the particle mass flow rate toward the walls will look like the through-wall velocity profile [
10]. The majority of previous 3D numerical studies predict two peak values in the through-wall velocity profile at the ends of the intact filter (see, for example, References [
9,
10,
11,
12]). They also indicate that a non-homogeneous deposition of particles occurs along the filter length. However, enhanced particle deposition at the entrance and end of the inlet channel is found in some works [
10,
11,
12], while high soot concentration only at the end of the inlet channel is anticipated in other studies [
9]. The flow contraction that takes place at the filter entrance can potentially influence the location at which particle deposition begins. The size of the plugs and whether they are permeable or not can also affect the particle behavior in the entrance flow region of the filter. The present study provides for the first time numerical results of particle deposition at the frontal surface of the wall-flow filter, which are consistent with visual observations from experiments (see, for example, Reference [
43]).
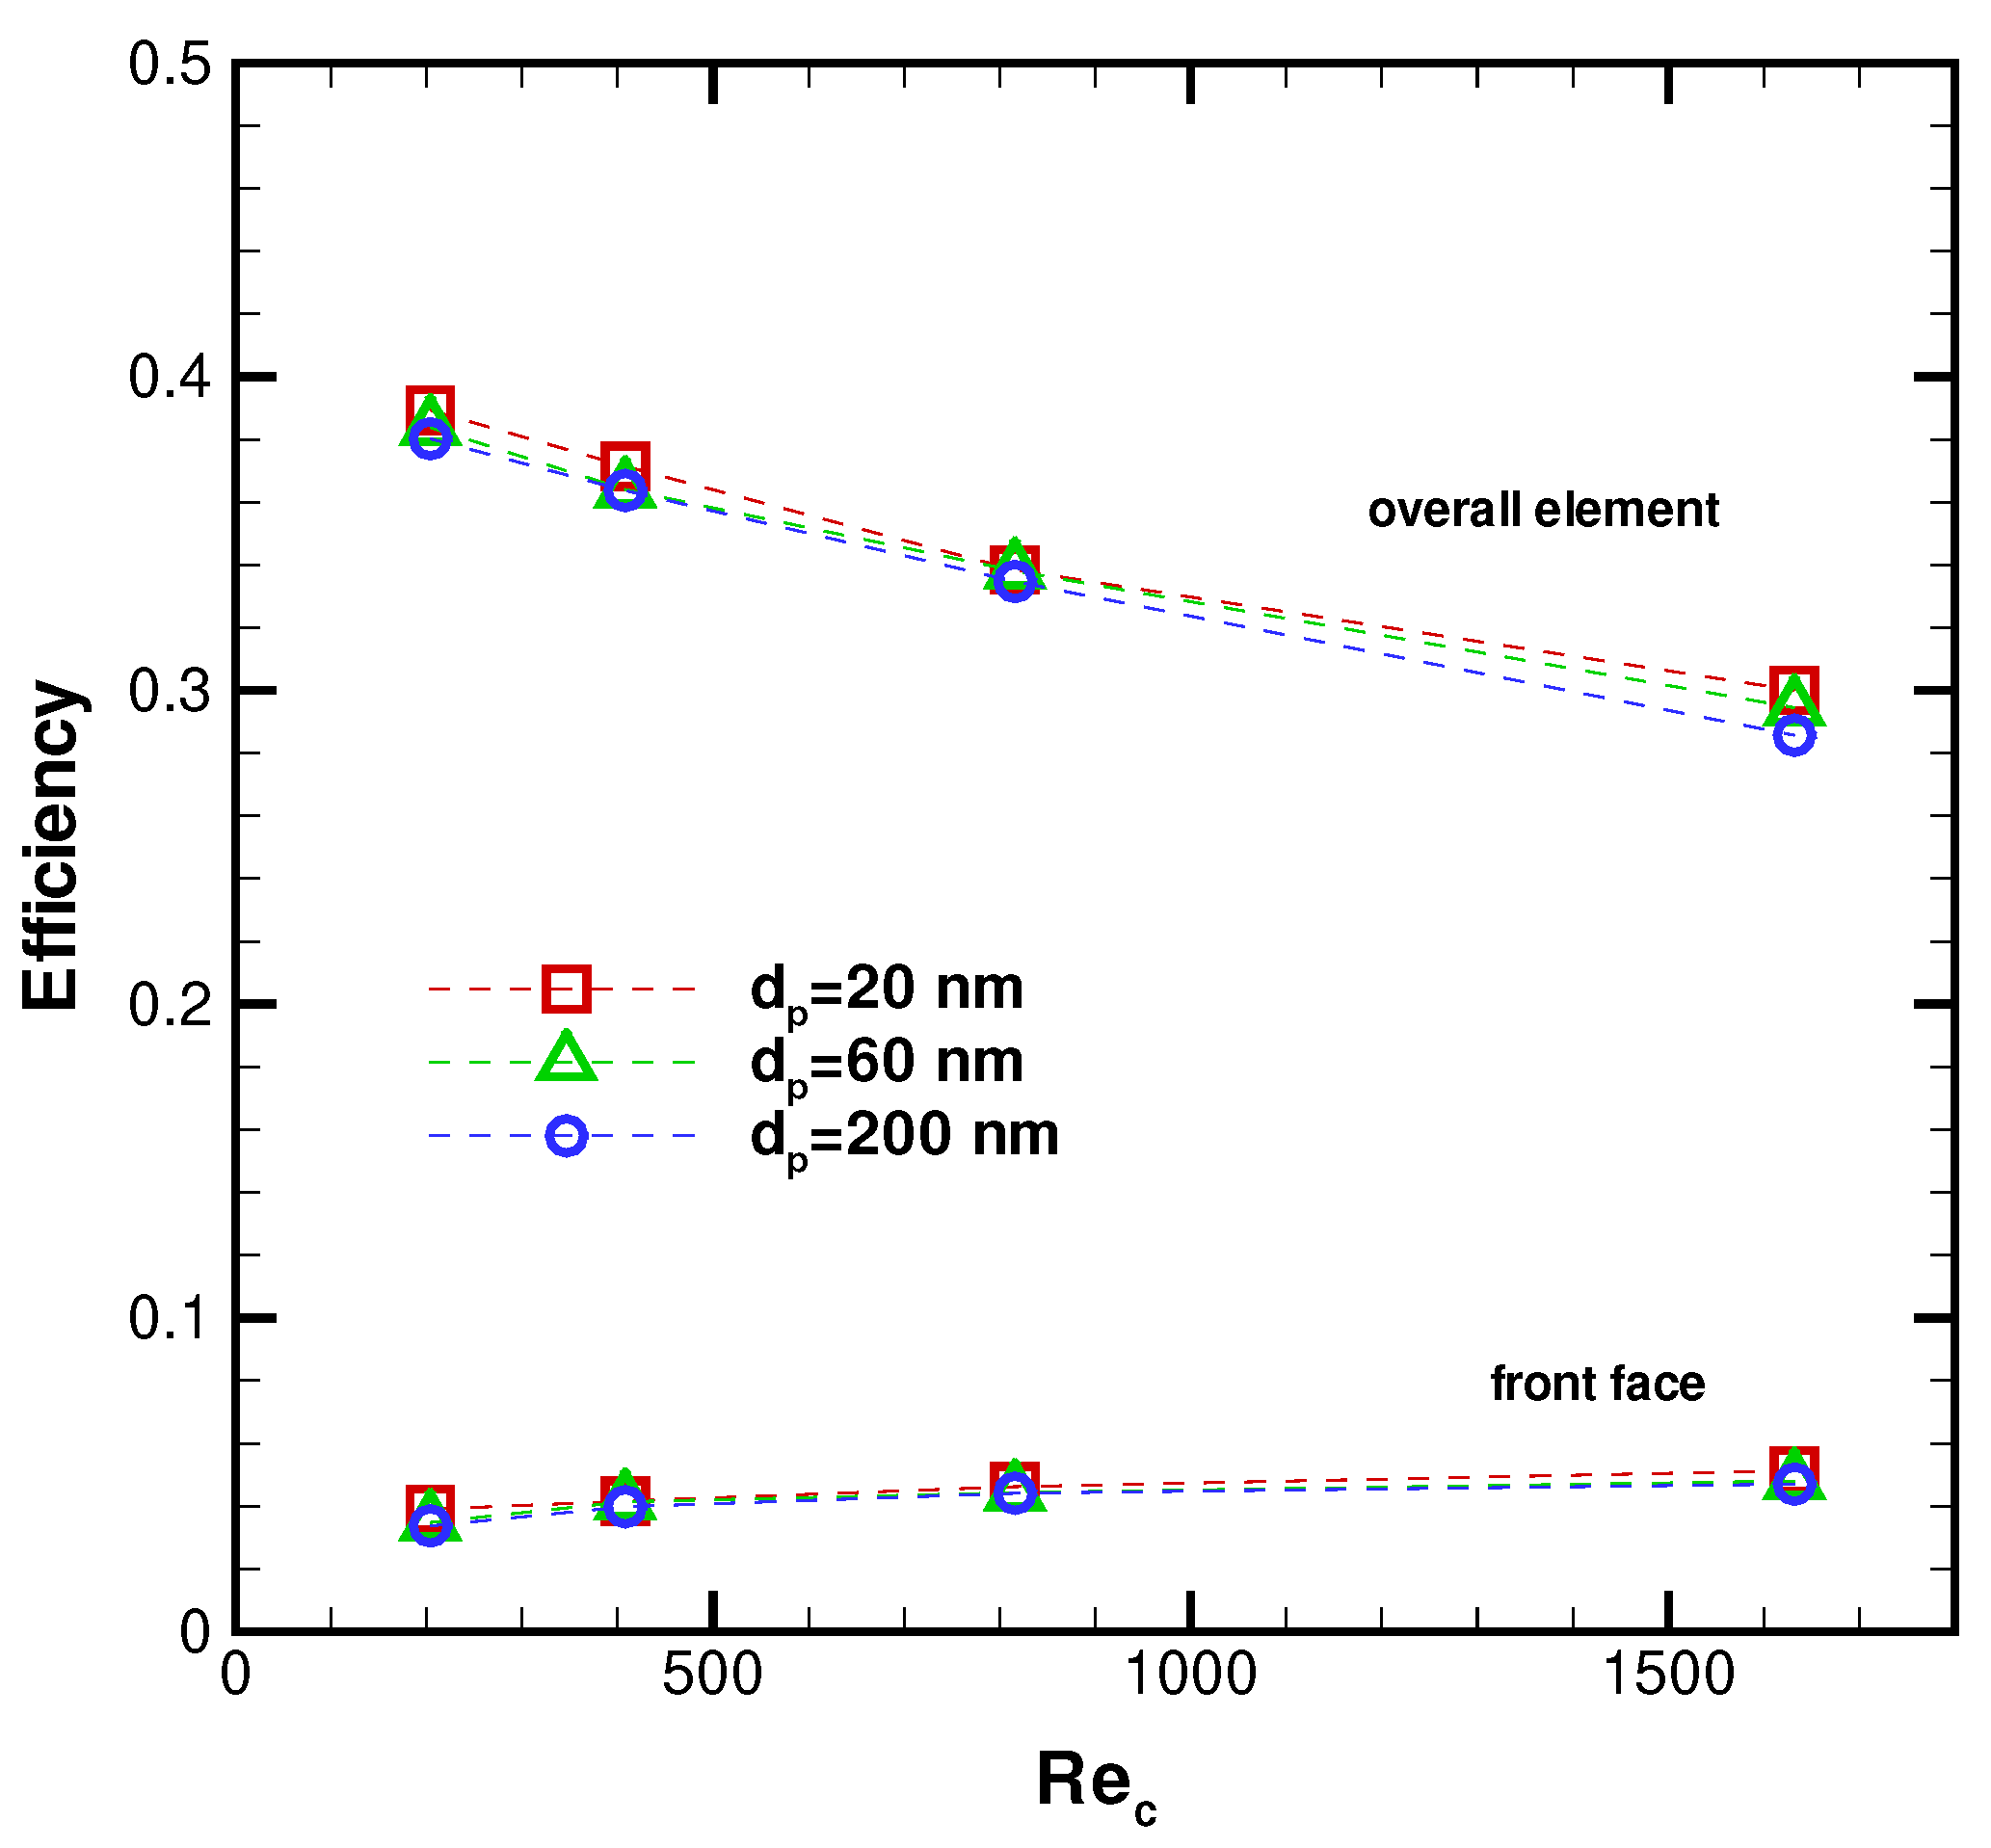
The removal of the rear plugs leads to a considerable particle leakage that has to be determined and quantified.
Figure 18 shows the efficiency of the damaged filter, the number of particles that are captured by the porous walls, as a function of the Reynolds number for the three particles sets with
, 60, and 200 nm. It is defined as
, where
is the number of deposited particles and
is the number of total particles tracked in the simulations. As
is increased, fewer particles are generally deposited, since the transverse fluid motions inside the unplugged inlet channels are moderate and, thus, they transfer less effectively the particles near to the walls. Moreover, the Stokes number is increased with increasing Reynolds number, and the particles become relatively unresponsive to the surrounding flow changes and follow less closely the local through-wall flow that controls their deposition. Similarly, the increase of particle size augments the Stokes number and, consequently, it increases particle leakage from the damaged filter.
The same scenario is also valid for the particle deposition in the front face of the filters. In particular, the flow rate corresponding to the fluid motions that cross the frontal surface is relatively small. Thus, smaller size particles are more capable of gaining sufficient momentum from the carrier phase in order to reach the front area as compared with the larger size particles. The particles with
nm have a very low response time so that their trajectory approximates the underlying fluid motions. However, the trajectory of such particles may intercept with the front surface in locations away from the edges of the channel entrance due their greater size, resulting in a non-uniform scatter of the impact positions. In contrast to what happens inside the channels, the fluid flow upstream of the filter elements acquires more momentum as the Reynolds number is raised. Thus, the fluid motions associated with the convective transfer toward the frontal face become stronger and, eventually, local particle deposition is enhanced for the whole spectrum of particle response times and sizes examined here. Consequently, a different
dependence of the efficiency is obtained regarding the particle deposition process in the frontal face of the filters, which is also shown in
Figure 18.


