Abstract
Knowledge of physiologic hemodynamics is a fundamental requirement to establish pathological findings. However, little is known about the normal flow fields in the pulmonary arteries, especially for children. The purpose of this study is to characterize flow patterns in the pulmonary artery bifurcation of healthy pediatric subjects using direct numerical simulations. A realistic geometry is obtained via statistical shape modeling, by averaging five subject-specific digital models extracted from cardiovascular magnetic resonance datasets of healthy volunteers. Boundary conditions are assigned to mimic physiological conditions at rest, corresponding to a peak Reynolds number equal to 3400 and a Womersley number equal to 15. Results show that the normal bifurcation is highly hemodynamically efficient, as measured by an energy dissipation index. The curvature of the pulmonary arteries is sufficiently small to prevent flow separation along the inner walls, and no signs of a turbulent-like state are found. In line with previous imaging studies, a helical structure protruding into the right pulmonary artery is detected, and its formation mechanism is elucidated in the paper. These findings might help to identify abnormal flow features in patients with altered anatomic and physiologic states, particularly those with repaired congenital heart disease.
1. Introduction
The pulmonary circulation (PC) is one of the two main circuits of the cardiovascular system, and is devoted to enabling gas exchange between air and blood in the lungs. As shown in Figure 1, the PC starts at the exit of the right ventricle (RV), where the cardiac output is conveyed into the main pulmonary artery (MPA) through the pulmonary valve. Shortly after, the MPA bifurcates into the right (RPA) and left pulmonary arteries (LPA), that in turn divide into several increasingly smaller branches, eventually leading to the alveolar capillaries, where oxygen and carbon dioxide exchange. The circuit closes with the pulmonary veins, which return the oxygenated blood to the left atrium.
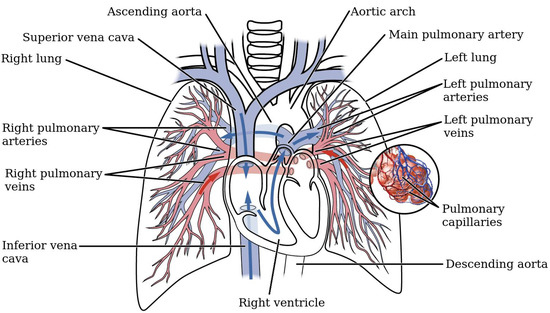
Figure 1.
Schematic of the pulmonary circuit (adapted from https://opentextbc.ca/).
The PC has a few unique biomechanical features: in normal conditions, it is a low-pressure (∼15 mmHg pressure difference), low-resistance, high-flow system. As a result, there is an important interplay between anatomic or physiologic perturbations and regional blood flow characteristics [1,2]. Several diseases can lead to such a perturbed state; this work is particularly motivated by congenital heart disease (CHD), a class of cardiovascular pathologies that affects 8/1000 of the population [3]. Newborns with CHD typically undergo life-saving surgery within a few days/months of life. Even after successful interventions, anatomic and/or physiologic changes can lead to mid- and long-term complications, which are often related to altered biomechanical forces and hemodynamic inefficiencies, especially in the initial tract of the PC. Understanding the biomechanical environment of the pulmonary bifurcation is thus crucial to optimize surgical procedures and improve therapy planning and lifelong care of CHD patients [4]. For instance, patients with repaired transposition of great arteries (TGA) can develop abnormal pulmonary artery morphology [5], with repercussions on haemodynamic efficiency. In recent studies, Capuano et al. used image-driven computational fluid dynamics (CFD) on patient-specific TGA models and found that the curvature of the MPA bifurcation is a shape biomarker of clinical significance [6,7]. Steeper curvatures were found to increase the pressure load of the RV, with potentially adverse clinical outcomes [8]. Similarly, other forms of CHD may have significant anomalies in the pulmonary architecture as a result of post-surgical changes, such as LPA distortion in repaired Tetralogy of Fallot (TOF) patients [9]. In the clinical practice, abnormal pulmonary artery size is a classic predictor for worse perioperative outcomes, for instance in the case of the Fontan operation or the Rastelli operation [10].
Knowledge of physiologic hemodynamics is clearly a basic requirement to establish pathological findings. However, surprisingly little is known about normal three-dimensional flow patterns within the pulmonary arterial system, especially in children. In the biomedical context, first in-vivo studies were mainly focused on analyzing basic hemodynamic features in healthy adults, such as flow profiles at the MPA or proximal LPA/RPA [11,12]. Progresses in advanced diagnostic techniques, e.g., time-resolved 3D quantitative flow magnetic resonance imaging (“4D flow”) or patient-specific computational modeling, have allowed more comprehensive flow visualizations. Using 4D flow, Reiter et al. detected a coherent vortical structure in the MPA in patients with pulmonary hypertension [13]. However, their study was limited to the right ventricular outflow tract and the MPA, without a full characterization of the pulmonary bifurcation and relatively few details about the healthy cases. Tang et al. used image-driven CFD to analyze the effect of exercise conditions in the pulmonary arteries of six healthy adults. Their study was mainly focused on wall shear stress (WSS), which was found to be higher under exercise [14]. Bächler et al. performed the first comprehensive 4D flow analysis of flow patterns in the MPA, LPA and RPA in a cohort of 18 healthy adults [15]. The main finding was a right-handed helical structure in the RPA of 15 individuals, and a left-handed one in the LPA in five cases. However, the formation mechanisms of these flow patterns were not discussed. A number of computational and imaging studies analyzed the three-dimensional hemodynamics in patients with repaired TGA compared to healthy controls (typically young adults) [16,17,18,19]. Of note, Geiger et al. found again right-handed helical flow in the RPA of 8 (out of 12) controls [17]. Other investigations focused on TOF and adverse haemodynamic consequences of post-operative morphology [20,21,22]. Recently, Boumpouli et al. analyzed computationally the effect of the branching angle on flow separation in the pulmonary bifurcation, in the context of TOF [23]. However, the geometries considered in their study were considerably simplified.
In the broader biomechanical and fluid mechanics literature, curved pipes and bifurcations have been intensively studied since the pioneering works of Dean [24] and Lyne [25]. Secondary motions due to curvature have been well characterized in a wide range of Reynolds and Dean numbers, also for pulsatile inflows, mostly in idealized geometries [26,27,28,29]. On the other hand, bifurcations have been relatively less investigated. A number of biomechanical studies have conducted in-vitro experiments on model bifurcating vessels, again with simplifying geometrical assumptions [30,31]. In most of the cases, the target arteries of the study were either the carotid or the coronary bifurcations, due to the importance of wall shear stress (WSS) in atherogenesis and plaque formation [32]. Previous studies have highlighted the importance of taking into account specific geometric features of the bifurcation, such as branching angle and curvature, since those are intimately related to the flow phenomenology.
The objective of this work is to analyze normal flow patterns in the MPA bifurcation, and in the proximal tracts of the RPA and LPA. To this aim, high-resolution CFD simulations are used. Computational modeling is the ideal tool to characterize local, unsteady blood flow characteristics, which are otherwise hardly detectable in-vivo even with the current most powerful imaging modalities. This work follows the classical pipeline of subject-specific CFD studies, wherein geometries and boundary conditions are extracted from clinical imaging data [6]. However, rather than performing simulations on a single subject-specific geometry or on several cases, statistical shape modeling (SSM) is employed to construct a characteristic template (i.e., mean) shape from five subject-specific models extracted from magnetic resonance imaging (MRI) datasets. While this approach is not intended to produce a statistically-converged characterization of the particular geometry, it is incorporating relevant features common in the sample we included.
2. Materials and Methods
2.1. Clinical Data
The population considered in this study consists of subjects, whose demographic information is reported in Table 1. The individuals are healthy volunteers in a pediatric range of age (4–18 years) with no relevant past medical history who underwent cardiovascular magnetic resonance (CMR) examinations. All images were performed on a 1.5 T MR scanner (Aera, Siemens Healthcare, Erlangen, Germany) with an 18-channel body matrix array anteriorly. CMR data included 3D steady-state free precession (SSFP) sequences for all subjects and phase-contrast acquisitions for three of them (subjects #1, #2 and #5). The 3D SSFP was a self-navigated, free-breathing sequence with TR/TE = 1.56/196.2 ms, FOV = 200 mm, isotropic voxel size = 1.1 mm, flip angle = 115°, matrix size = , acquisition time = 5 min (∼12,000 phase encoding steps). Retrospectively-gated, through plane phase-encoded velocity mapping was performed using standard sequences, reconstructed to 30 phases per cardiac cycle, from which the flow rate curve at the MPA was derived. Average flow rates for the other two subjects were derived from the RV stroke volume. All data were retrospectively collected as part of an Institutional Review Board approved study. (Pro00008714, Approved 8/2/2017).

Table 1.
Demographic and hemodynamic information of the subjects. BSA is the body surface area in m, A is the vessel area in mm, Q is the flow rate in L/min. The age is in years. A and Q are average values over the cardiac cycle.
2.2. Model Construction
The reference geometry for this study is constructed by averaging five subject-specific models of the pulmonary artery bifurcation via statistical shape modeling. The CMR datasets discussed in Section 2.1 were processed to obtain 3D digital surface representaitons for each subject via segmentation; an image-processing software was used for this purpose (Mimics, Materialise, Belgium). Both automatic thresholding and manual methods were adopted to identify the blood pool of the pulmonary artery in each slice of the 3D SSFP dataset. The 3D geometries were then exported using the stereolithography (STL) file format. The 5 models are shown in grey in Figure 2. These were further edited and smoothed with 3D editing software (3-matic, Materialise, Belgium). In particular, the MPA was truncated shortly above the pulmonary valve, to create the inlet face; the LPA and RPA were instead truncated before the start of branching vessels. In fact, secondary and higher-order branches introduce a significant amount of anatomic variability that proved to be difficult to be incorporated into a template model; also, this work is primarily concerned with the proximal tract of the pulmonary bifurcation. The final geometries, superimposed in red in Figure 2, include the MPA, its bifurcation and the proximal pulmonary arteries. A dedicated study was carried out to assess the impact of the domain size on the development of the flow fields. Numerical simulations were performed for Subject #2 both in an extended domain, including first-order branches and 8 outlets, and in the correspondingly cropped geometry. The results, reported in Appendix A.1, prove that the hemodynamics of the bifurcation is not affected by the above-mentioned choice of the computational domain.

Figure 2.
Front view of the five raw segmentations, including the right ventricle (RV) and tracts of the high-order branches. Superimposed in red are the cropped portions used for the derivation of the template. From left to right: subjects #1 to #5. Models are not to scale.
The smoothed 3D models are used to derive a mean shape (hereinafter also called template or atlas), i.e., an average surface representation of the population. For this purpose, a statistical shape modeling method based on a control-points instance of the large deformation diffeomorphic metric mapping [33] implemented into the open-source software Deformetrica [34] was employed. This framework is being increasingly exploited in cardiovascular research, for instance to correlate geometric features with functional indices, with the aim of identifying shape biomarkers of clinical significance [35]. A similar approach was used in the context of TOF to develop reduced-order models of patient-specific flow fields, using results from a template geometry of the pulmonary artery bifurcation [36].
The rationale for computing an atlas geometry from the population reported in Table 1 relies on previous results from Knobel et al. [37]. These authors investigated several parameters associated with morphology and size of the pulmonary bifurcation in an age range 2–20, and found that the shape parameters (e.g., branching angles) did not correlate with age or BSA. Instead, they found a strong scaling of several size parameters (e.g., diameters of MPA, LPA and RPA) with BSA. It is thus reasonable to assume that the pulmonary arteries are similar within the age range considered in this study, except for a scaling factor. The variance associated with size was preliminarily removed by rescaling the models to match the dimensions of Subject #5. Subsequently, the models were rigidly aligned to improve the outcome of the procedure. The Bayesian atlas method was used [38] with 108 control points to parametrize the deformations. The resulting template is shown in Figure 3 along with the original models. The atlas looks well-centered, and the narrow shape variability of the population is also evident from the figure.
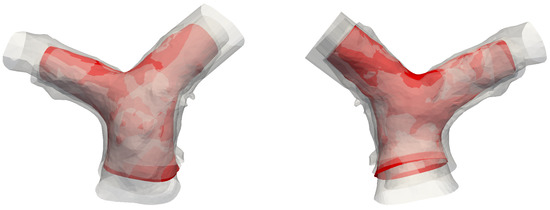
Figure 3.
Front and rear view of the template (in red), superimposed with the five original models.
The template is a complex, three-dimensional bifurcating vessel and thus it is difficult to formulate an exhaustive geometric characterization. A simpler, but efficient description can be given using centerlines, that were computed using the Vascular Modeling Toolkit (VMTK) [39,40]. Centerlines are defined as the curves that maximize the minimal distance from a boundary at a given section of the lumen. Of particular interest are two parameters that can be defined from the differential geometry of the centerlines, namely curvature and torsion, which are tightly related to the hemodynamic patterns within the arterial vessels [41]. Given a parametric description of the centerline curve , where s is the curvilinear abscissa, curvature and torsion can be computed as [40]
where the prime symbol denotes differentiation with respect to s. The curvature is related to the rate of change of the tangent vector . It is also the inverse of the radius of curvature R of the osculating circle lying in the plane locally defined by the tangent vector and the normal vector of the Frenet reference frame. The torsion is instead a measure of the non-planarity of the curve. While the curvature is a positive quantity, the sign of the torsion is related to the clock-wise or counter-clockwise rotation of the osculating circle. The areas of the sections at the various points along the centerlines were also computed. Results of this geometric analysis are reported in Figure 4.
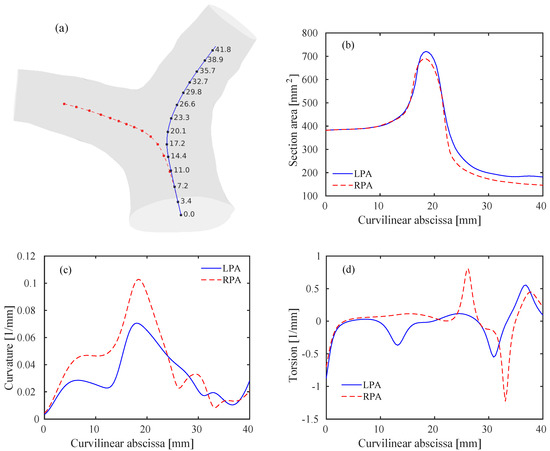
Figure 4.
Geometry of the pulmonary bifurcation model. (a) Template model including left pulmonary arteries (LPA) (blue) and right pulmonary arteries (RPA) (red) centerlines. Values of the curvilinear abscissa (in mm) are also reported for the LPA at several discrete points. Note that the values for the RPA are the same at the corresponding points. (b) Areas of the lumen sections along the curvilinear abscissa for the LPA and RPA. (c) Curvature of the LPA and RPA centerlines. (d) Torsion of the LPA and RPA centerlines.
The sections along the centerlines follow a rather smooth path, reaching a peak within the bifurcation and then approaching constant values within the RPA/LPA. The proximal RPA area is slightly lower than the LPA one, in accordance with previously published results [37]. Note that the inlet-to-outlet-area ratio, is slightly lower than one, thus an acceleration of the flow is expected. The first peak in the curvature graph, Figure 4c, is related to the curvature of the MPA, that occurs predominantly in a lateral plane. The second and higher peak occurs at the bifurcation () and characterizes the curvature of each branch, with potentially important hemodynamic repercussions. The curvature of the RPA is steeper than the LPA, as previously noticed [2]. Interestingly, much of the RPA bend is planar (approximately zero torsion, Figure 4d), while the LPA shifts counter-clockwise before entering the bifurcation. The proximal tracts of the RPA and LPA become eventually rather straight (i.e., low curvature).
2.3. Boundary Conditions
The final model comprises an inlet and two outlets, in addition to the arterial wall. At the inlet plane, a realistic flow rate curve was obtained by averaging the in-vivo measured flow rates, which were available for three subjects (cf. Section 2.1). The curve is reported in Figure 5. The volumetric data was then resampled as a truncated sum of 10 Fourier harmonics to ensure periodicity, and mapped onto the inlet face as a plug velocity profile. This choice is commonly made in modeling pulmonary arterial flow, due to the very short outflow tract of the right ventricle, which prevents the flow to develop [42]. Previous imaging studies have also confirmed a rather flat velocity profile at the MPA [11,12], and also the phase-contrast data of the current cohort suggest that this boundary condition is appropriate, as reported in Figure 6. A dedicated sensitivity analysis to the shape of the inflow boundary condition, and related discussion, is reported in Appendix A.2.
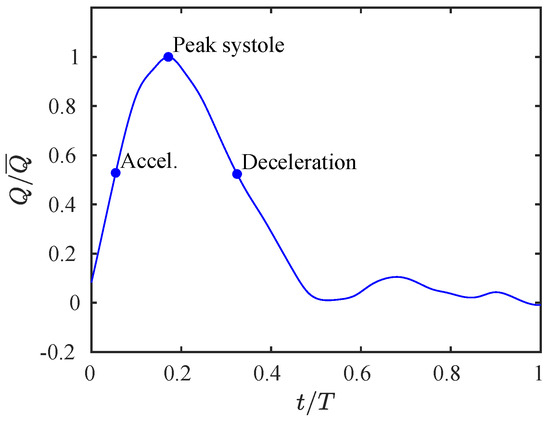
Figure 5.
Inlet flow rate profile. The curve is parametrized by the maximum flow rate and the cardiac cycle duration T. Three points of the cycle are also highlighted and will be used in Section 3.
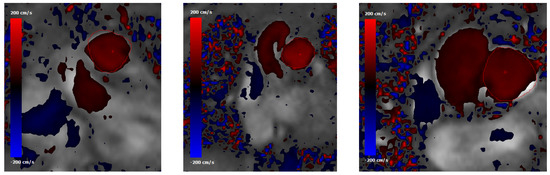
Figure 6.
Phase-contrast MRI data showing normal-to-plane velocity maps at the main pulmonary artery (MPA) cross section for (from left to right) subjects #1, #2 and #5. The MPA contour is highlighted with a red line. The red cross indicates the point where the peak velocity occurs.
At the outlets, a resistive boundary condition is employed. In this formulation, the pressure at the outflow plane is set to be linearly proportional to the flow rate through a constant parameter . Details can be found in, e.g., [43]. This model does not account for the compliance of the downstream arteries, and thus keeps pressure and flow constantly in phase with each other. On the other hand, it is a simple and numerically robust condition that allows to tune the flow split between the two branches (i.e., the relative blood perfusion of each branch) according to the clinical data. In fact, assigning a constant pressure condition would lead to a flow split entirely governed by the segmented (simulated) geometry [44], which is likely a non-physiologic result. In this case, the resistance parameters for the left and right branches are tuned to provide a normal flow split, i.e., of the flow to the right side [45], leading to and . The resistive boundary condition was compared to a three-element Windkessel outflow model, assuming distal resistance coefficients equal to the ones reported above, a proximal resistance equal to of the distal resistance, and a compliance coefficient equal to 10 , as suggested in [36]. Results were practically identical, with velocity fields differing by no more than 1% in the whole computational domain.
The walls of the vessels are assumed to be rigid and a no-slip condition is applied. Fluid-structure interaction models for the pulmonary circulation are remarkably challenging, particularly as they require knowledge of the vessel wall properties [42,46]. We should note that in the simulations reported in this study, where the inflow and outflow boundary conditions are driven by in-vivo imaging data which account for the compliance and downstream impedance, the effects of vessel compliance may be secondary. This agrees with the findings by Jin et al. [47], who compared compliant and rigid-wall computational models of aortic flow, and found minimal differences in the flow fields. It is likely that results from their paper can be extended also to the pulmonary arteries. The most significant effect of including wall compliance could be a higher/lower velocity magnitude, especially in the proximal pulmonary arteries, depending on whether the template geometry is intended as corresponding to a diastolic/systolic configuration, respectively. This will affect mostly the wall-related quantities, such as the wall shear stress, with a lesser impact on the overall flow patterns [48].
2.4. Setup of Numerical Simulations
All numerical simulations in the present work are conducted using the simVascular open-source package [49], where the Navier–Stokes equations for incompressible flow are considered, and blood is modeled as a Newtonian fluid with viscosity of Poise. The latter assumption is widely accepted for large vessels [1]. The flow solver employs a robust stabilized finite-element formulation [50] and has been previously applied in computational studies involving pulmonary arteries [6,14]. The overall solver has also been extensively validated for cardiovascular simulations [51,52].
The flow conditions for all cases considered are transitional: the incoming flow is laminar (as also observed in in-vivo data) and disturbances appear during parts of the pulsatile cycle in the two branches. To properly capture these phenomena we conducted direct numerical simulations (DNS), where all spatio-temporal scales are directly captured by the computational grid and no explicit turbulence modeling is needed. In particular, the computational mesh consists of 2,736,586 cells and is formed by an isotropic grid combined with 4 boundary layer elements stretched towards the wall. This mesh was selected after a careful grid refinement study that involved four grids of increasing resolution, namely coarse, medium, fine and very fine grids of 390,047, 867,090, 2,736,586 and 7,656,440 cells respectively. All the grids shared the same boundary layer elements, while the isotropic portion was progressively refined. Integral parameters (e.g., volume integral of kinetic energy) converged rather quickly; however, since this work is primarily concerned with vorticity dynamics and associated mechanisms, the selected diagnostic parameter was the shear layer forming along the inner wall of the MPA (see Section 3.3 for detailed description), as shown in Figure 7. The fine grid was able to provide a well-resolved representation of the shear layer detachment process and was thus selected. The time step used in the simulations is s, leading to a CFL number always below throughout the cardiac cycle.
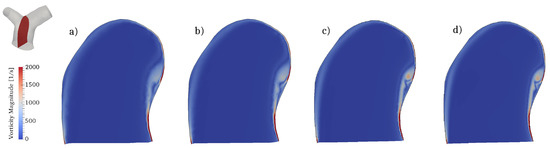
Figure 7.
Mesh refinement study. Contour of the vorticity magnitude in a slice located along a longitudinal section of the MPA (see top left corner). Results for (a) coarse; (b) medium; (c) fine and (d) very fine grids.
The parameters and T of the inlet flow curve (cf. Figure 5) are tuned to yield prescribed values of the Reynolds and Womersley numbers at peak systole
where is the hydraulic diameter of the inlet face. These values are selected on the basis of current available data, as well as previous literature and practical experience. They are well within the physiologic range at rest conditions [1,12].
The other nondimensional parameter of interest is the Dean number
where D and R are the characteristic diameter and the radius of curvature of the bend respectively. In the specific case under study, these definitions are somewhat ambiguous due to the complexity of the geometry. However, the flow in each branch turns a divider with a finite radius of curvature and has, locally, the characteristics of the flow in a curved vessel [53]. Therefore, with reference to Figure 4, it is assumed that R is the maximum radius of curvature occurring for the LPA/RPA at the bifurcation, while D is the hydraulic diameter of the RPA/LPA as the sections become approximately straight. The characteristic Reynolds number is retained as the one reported in Equation (3), scaled by the respective branch perfusion. This yields, at peak systole, and . Physiological values of the Dean number have been very rarely reported in literature for the pulmonary artery bifurcation, one exception being a recent work by the current authors group [7]. The values obtained here are in line with those reported in that paper.
3. Results and Discussion
3.1. Global Flow Features
Figure 8 shows an overall view of the velocity field at various locations of the domain. The plots on the left side of the figure show the normal velocity to each slice, projected along the direction of propagation of the flow (therefore, negative velocities indicate backward flow); the right side of the figure shows the velocity magnitude in a slice cutting the whole bifurcation along (approximately) the branches centerline. The flow in the RPA and LPA is characterized by a low-speed area close to the inner walls, and a higher-speed jet, separated by the shear layer forming as a result of the bend curvature. Overall, the velocity values fall well within the physiologic range expected for healthy pulmonary arteries [54]. The flow remains attached to the inner walls of both LPA and RPA at peak systole, while there is a small separation zone in the LPA during the deceleration phase, despite the more favorable curvature of the LPA bend (cf. Figure 4). On the other hand, the LPA has a larger area and a smaller flow rate, a combination that is known to increase the possibility of adverse pressure gradients and thus of flow separation [53,55]. Areas with significant in-plane rotation are clearly visible at the peak systole and deceleration phases, especially in the RPA. This vortical flow originates from a combination of curvature-induced vortices (Dean-like) as well as a helical structure that forms in the MPA and propagates along the branch, as explained in more detail in Section 3.3 and Section 3.4.
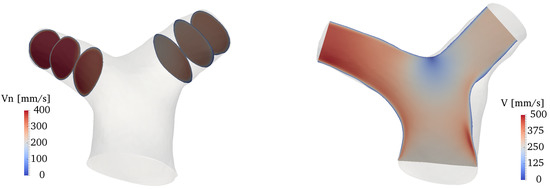
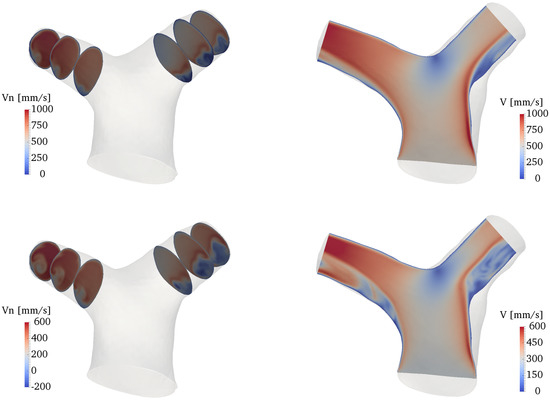
Figure 8.
Contour plots of the velocity field along several slices of the domain. From top to bottom: acceleration, peak systole and deceleration phases. Left: normal velocity at various locations of the LPA and RPA. Right: velocity magnitude in a slice cutting the whole bifurcation.
Following, e.g., [56], the overall hemodynamic efficiency of the system can be concisely estimated by performing a control-volume analysis of the global kinetic energy balance. In absence of gravational effects, the outlet-to-inlet kinetic energy ratio reads
where is the inlet MPA area, is the area of the i-th outlet, p is the pressure, is the velocity field and is the normal of the i-th outlet. Averaged results over the cardiac cycle yield , which is in the high-end range of energy efficiencies previously reported for the pulmonary arteries [14]. The parameter takes into account dissipation of kinetic energy due to pressure drops and viscous losses. Such a high value is due to the absence, in this case, of significant separation areas, as well as of turbulent-like states or area obstructions. The pressure drop itself, which is a parameter of clinical relevance, is rather low: at peak systole, averaged pressures over the inlet (MPA), the LPA and the RPA faces read 12, 11 and 8 mmHg respectively (relative values).
Deviations from this hemodynamically efficient configuration are common in post-surgical CHD geometries. Area obstructions (stenosis) of the proximal PAs, steeper branching angles and curvatures as well as other anatomic alterations can lead to a completely different flow morphology, as shown for instance in the case of TGA patients after the arterial switch operation [6,7]. Zhang et al. computationally analyzed the effect of the LPA branching angle (i.e., the angle formed between the MPA and LPA centerlines) and found a dramatic decrease of the energy efficiency with decreasing angles (i.e., sharper bends) [21]. Progresses in SSM methods, such as the one used in this work, are allowing a more quantitative analysis of the correlation between certain shape features and functional indices. For instance, using this framework Bruse et al. were able to correlate the curvature of the aortic arch after coarctation repair with the left ventricle ejection fraction [35], presumably as a consequence of increased pressure losses [57]. It is conjectured here that the natural pulmonary artery anatomy may have been similarly optimized by nature to minimize energy losses about the physiological conditions.
3.2. Phase-Averaged Statistics
The flow is found to be largely laminar at all phases of the cardiac cycle. Pockets of fluctuating flow were detected during the deceleration phase, as revealed by contours of the turbulent kinetic energy (TKE), shown in Figure 9. The TKE was computed by phase-averaging six cardiac cycles. The velocity fluctuations arise due to a combination of a slight recirculation area (in the LPA) and of vortical activity (especially in the RPA). However, the magnitude of these fluctuations is rather small, being (at most) of the order of 5% with respect to the characteristic velocity of the deceleration phase (defined as the average inflow velocity at that phase). The absence of a real turbulent-like state, despite the transitional value of the Reynolds number, is most likely due to the favorable curvature characteristics of the pulmonary bifurcation, that prevent the creation of large separation areas.
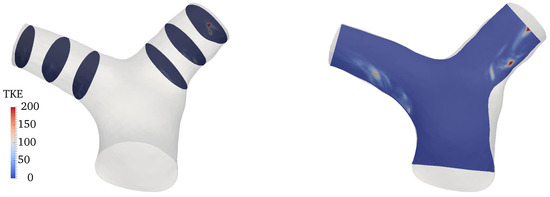
Figure 9.
Contour of turbulent kinetic energy at the deceleration phase along several slices of the computational domain.
The potential presence of turbulent flows within the pulmonary arteries is a somewhat debated, yet unexplored topic [1,2]. General knowledge and practical clinical experience assume that the flow in physiologic conditions should be indeed mostly laminar, as also reported by previous imaging studies [15]. The results reported in this work seem to confirm this argument. It is worth noting that the current simulations were performed in a computational domain that was cropped at the proximal pulmonary arteries, before generation of branching vessels. However, it should be observed that as the LPA and RPA start to bifurcate, the local Reynolds number decreases drastically due to a reduction of both the flow rate and the vessel diameter. It is thus unlikely that the flow can undergo turbulence transition further downstream the pulmonary bifurcation.
3.3. Vortex Dynamics
The Q-criterion [58] is used to detect vortical structures in the flow. Results are shown in Figure 10, where isosurfaces of Q are colored by the normalized helicity density,
where is the vorticity field. H describes the local value of the angle between the velocity and the vorticity vectors and varies between and 1 (left-handed and right-handed screw motion respectively). There is an isolated, coherent vortical structure forming in the MPA and particularly on its inner wall (with respect to the MPA curvature). This transient flow pattern forms shortly before peak systole and persists for the first tract of the deceleration phase. It is an elongated, pencil-like structure protruding predominantly into the RPA, while being quickly dissipated in the initial tract of the LPA. The helicity density shows that velocity and vorticity become rather strongly aligned in the LPA and the RPA, thus forming helical patterns; the sign of these patterns is however right-handed in the RPA and left-handed in the LPA.
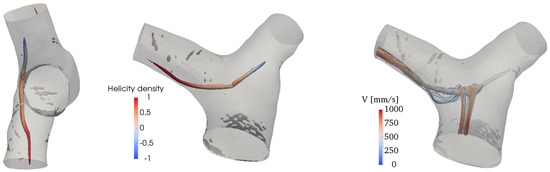
Figure 10.
Vortex structures visualized by isosurfaces of Q and colored by normalized helicity at peak systole (left) and deceleration phases.
The onset mechanism is more clearly revealed by looking at the vorticity contours in a lateral slice crossing the MPA, as shown in Figure 11. It can be deduced that the vortical structure displayed in Figure 11 is the result of the wall shear layer detachment, triggered by the MPA curvature. As the flow turns into the two branches, the velocity field advects and elongates the vortical structure, while aligning with vorticity. As a result, helical patterns are formed, as shown by the streamtraces in Figure 10.
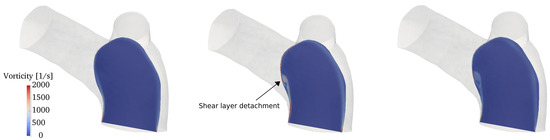
Figure 11.
Contour of the vorticity magnitude (from left to right) at acceleration, peak systole and deceleration phases on a slice crossing the MPA in a lateral plane.
The results reported in this section are in agreement with in-vivo studies in the literature [15,20]. The formation mechanism proposed here is closely linked to the curvature of the MPA in a lateral plane. From an anatomic standpoint, this curvature is intricately related to its accompanying aorta, a direct result of embryologic formation of the heart [59]. In its earliest form, the heart, as a cardiac tube, has one common outflow into the systemic and pulmonary circulation (truncus arteriosus). During through cardiac development, outflow “cushions” comprised of neural crest cells migrate and septate the outflow tracts in a helical fashion, resulting in a spiral formation between the aorta and pulmonary artery (separated by an aortopulmonary septum), see Figure 12. This arrangement is likely to contribute to the natural and hemodynamically efficient curvature noted in normal pulmonary vasculature.
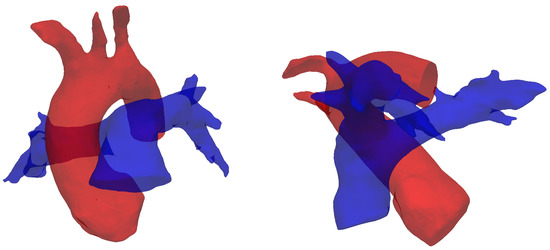
Figure 12.
Spiral arrangement of the pulmonary artery (blue) and the aorta (red), shown by segmented reconstructions of the vessels for subject #5 (see Table 1). This configuration supposedly determines the characteristic curvatures observed in this study.
The physiological (and pathological) significance of vortical and helical flow patterns in the cardiovascular system is currently a debated topic that is receiving considerable attention [60]. Previous works have demonstrated the existence of a tight ventricular-vascular coupling, i.e., an association between flow energy dissipation and vascular afterload. This potentially allows for the development of flow biomarkers that could measure the health in a variety of cardiac diseases, including pulmonary hypertension, Tetralogy of Fallot, Transposition of Great arteries, etc. One of the main challenges remains the detection of these flow patterns, which are often unsteady and highly localized, and thus hardly visible with current imaging techniques [61]. Computational fluid dynamics may be the key for understanding these subtle flow phenomena. We should note that the curvature of the MPA described above may vary across healthy individuals. This study did not investigate shape variability due to the small sample size available. Future studies are warranted to assess how shape variability is associated with changes of the flow fields. It is reasonable, however, to expect the helical structure described above to be found across a wide range of normal subjects.
3.4. Secondary Motions
The curvature of the pulmonary bifurcation is expected to create secondary motions [2]. Figure 13 shows contours of the vorticity component perpendicular to the slices, superimposed with in-plane velocity vectors. The characteristic Dean patterns are hardly visible, and the vorticity field is dominated by the vortical structure described in the previous section. The pulsatile flow component also plays a role in this regard, although previous studies noticed that the Dean flows establish quickly even under pulsatile conditions [62]. Furthermore, there is a remarkable amount of torsion (cf. Figure 4), which further contributes to distort the flow patterns.
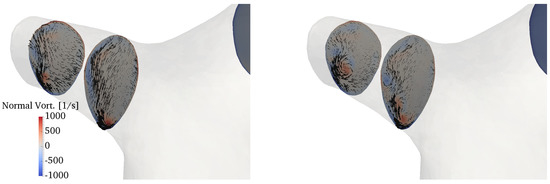
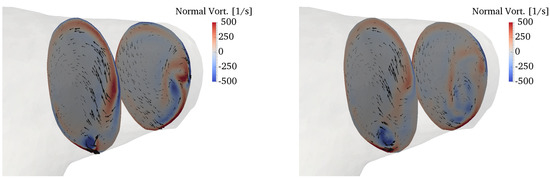
Figure 13.
Secondary motions visualized by in-plane velocity vectors and contours of normal vorticity in the RPA (top) and LPA (bottom). The left column refers to peak systole, while the right column to the deceleration phase.
Secondary flows in bifurcations and junctions have been incompletely characterized. Evegren et al. analyzed secondary motions in a 90° junction under pulsatile inflow conditions in a certain range of Reynolds, Womersley and Dean numbers [63]. Despite the idealized geometry, they also found rather complex flow patterns, especially in the deceleration phase. These motions may have an interesting physiological role, particularly as they are connected to wall shear stress oscillations, which are in turn related to mechanisms of atherogenesis. However, the biomechanical environment of the pulmonary circulation under normal conditions, with low pressures and streamlined flow, is such that atherogenesis is a rare condition for the pulmonary arteries [14].
4. Conclusions
This study analyzed the fluid mechanics of the normal pulmonary artery bifurcation using direct numerical simulations. Unlike other branching vessels of the arterial system, the pulmonary bifurcation has received very little attention in the biomechanical and fluid mechanics community. In an effort to take into account a realistic geometry of the pulmonary bifurcation, statistical shape modeling was used to derive an average shape from five subject-specific digital models in a pediatric range of age. This approach can be justified by the relatively low anatomic variability of healthy subjects and the similarity of pulmonary arteries in the age range considered [37], and proved to incorporate several fundamental anatomic details.
Results showed that the normal pulmonary bifurcation is highly hemodynamically efficient. A peculiar characteristic of the flow is the appearance of a transient and localized vortical structure, forming on the inner wall of the MPA and being elongated especially in the RPA. This pattern was already visualized in 4D flow imaging studies, but its formation mechanism has been elucidated here for the first time, and proved to be related to the peculiar curvature of the MPA in a lateral plane. The flow was otherwise shown to be streamlined and largely laminar at all phases of the cardiac cycle, with little or no separation at the bends thanks to an optimal curvature of the bifurcation divider.
Knowledge of normal flow patterns may be useful to establish pathological alterations, especially in patients with congenital heart disease, that often present with an altered anatomy due to post-surgical changes. A detailed study of the three-dimensional hemodynamics may allow to derive shape biomarkers that can eventually provide useful indications for the surgical planning and optimization of surgical procedures.
From a more fundamental perspective, it is interesting to notice how nature has provided an optimal biomechanical environment in the pulmonary arterial system. Much has been previously speculated in this regard, about, e.g., the mechanism of redirection of the flow in the left ventricle [64] or the optimal curvature of the aorta [57]. Apparently, similar considerations also hold for the pulmonary arteries. Deviations from the optimal physiological conditions may overload the right ventricle and lead to adverse clinical outcomes. Surgeons may consider the importance of “imitating nature” for a careful optimization of the surgical procedures related to the pulmonary arteries.
Future work should address the variability associated with the geometry and the boundary conditions, and the related repercussions on pulmonary hemodynamics.
Author Contributions
Conceptualization and planning of the work presented in the manuscript by all contributing authors. Y.-H.L. contributed all clinical data and performed image processing. F.C. contributed to image processing and conducted all CFD computations. Data analysis by all authors. Draft manuscript preparation by Y.-H.L. and F.C. E.B. supervised the work and edited the final draft of the manuscript.
Funding
This research received no external funding.
Acknowledgments
The authors gratefully acknowledge Laura Olivieri at Children’s National Health Institute, whose support contributed to the data collection process in this study. F.C. was supported by Università degli Studi di Napoli Federico II and Compagnia di San Paolo under the STAR Program 2016.
Conflicts of Interest
The authors declare no conflict of interest.
Abbreviations
The following abbreviations are used in this manuscript:
| CFD | Computational Fluid Dynamics |
| CHD | Congenital Heart Disease |
| LPA | Left Pulmonary Artery |
| MPA | Main Pulmonary Artery |
| PA | Pulmonary Artery |
| RPA | Right Pulmonary Artery |
| RV | Right Ventricle |
| TGA | Transposition of Great Arteries |
| TOF | Tetralogy of Fallot |
| WSS | Wall Shear Stress |
Appendix A. Effects of Domain Size and Inflow Profile
This appendix reports the results of a sensitivity study with respect to the domain size and the inlet flow profile. The analysis was conducted on Subject #2 (see Table 1) due to the availability of a larger geometry to be used for comparisons. Numerical simulations were performed using the settings outlined in Section 2.3, which constituted the baseline configuration. It is worth noting that a similar modeling approach has been previously validated against in-vivo data in [6].
Appendix A.1. Domain Size
This work was focused on the hemodynamics of the bifurcation and the proximal pulmonary arteries, which is clearly a small tract of the entire pulmonary circulation. Given the difficulties in reconstructing smaller branches, and their high anatomic variability, the models considered in Section 2.2 were properly cropped to retain only the portion of interest for the study. It is therefore important to establish whether this choice can compromise the fluid flow phenomena reported in Section 3. To this aim, numerical simulations were conducted for Subject #2 (see Table 1) both for an extended geometry, comprising 8 outlets and a distal tract of the LPA and RPA, and for the correspondingly cropped domain. The models are shown in Figure A1.

Figure A1.
Front and top views of full and cropped (in red) models for Subject #2.
Figure A1.
Front and top views of full and cropped (in red) models for Subject #2.

Simulations were performed with the same setting described in Section 2. For the full model, the outflow resistances were split according to the cross-sectional area of the branches [6], so that the relative flow perfusion was the same for the two models. For this patient, the split was available from phase-contrast data and was 55% to the RPA. All the other modeling parameters (mesh size, time step, inflow condition, etc.) were exactly the same for the two simulations. The inlet boundary condition was a plug flow based on the in-vivo flow rate curve.
Results were qualitatively and quantitatively very similar. A representative example is given in Figure A2, in terms of a contour of the ensemble-averaged velocity magnitude along a slice cutting the branches at the centerlines. The physical mechanisms related to the vorticity dynamics described in Section 3 were also the same, with the volume integral of the vorticity magnitude, shown in Figure A3, varying by no more than 1% between the two models throughout the cardiac cycle. This quantity was obtained by integrating vorticity in the cropped model and in the same corresponding portion of the full model.

Figure A2.
Comparison of ensemble-averaged velocity magnitude along a slice cutting the domain at the branches centerline. The full model is reported on the left, the cropped model on the right.
Figure A2.
Comparison of ensemble-averaged velocity magnitude along a slice cutting the domain at the branches centerline. The full model is reported on the left, the cropped model on the right.

These results demonstrate that the strategy employed in this work, i.e., to include only the bifurcation and the PAs into the computational domain, is not at all detrimental to the quality of the results. The flow phenomena reported in the paper can thus be considered as physiologically relevant, as long as the initial tract of the pulmonary circulation is concerned.

Figure A3.
Time evolution during the cardiac cycle of the vorticity magnitude integrated over the computational domain for the cropped model and the corresponding portion of the full model. T is the period of the cardiac cycle.
Figure A3.
Time evolution during the cardiac cycle of the vorticity magnitude integrated over the computational domain for the cropped model and the corresponding portion of the full model. T is the period of the cardiac cycle.

Appendix A.2. Inflow Boundary Conditions
One of the limitations/uncertainties in the computational modeling of the pulmonary circulation is associated with the inflow boundary condition. In this study, an idealized plug flow profile was selected, derived from a physiological flow rate curve. The in-vivo phase-contrast datasets available for the selected cohort showed indeed a distinct plug flow shape at the MPA, which is generally considered the best approximation for the MPA inflow boundary [42]. Nonetheless, a slight development of the flow along the right ventricular ouflow tract and/or a swirl component are additional factors that may affect the inlet flow profile. Far from being a rigorous sensitivity analysis, this section aims to assess the robustness of the identified flow structures to different inflow shape profiles.
Numerical simulations were carried out, on equal parameters and with the same setting of the previous section, for four different inflow boundary conditions:
- a plug flow profile, based on the in-vivo flow rate waveform;
- a plug profile with superposition of a swirl component of 10%;
- a plug profile with superposition of a swirl component of 30%;
- a parabolic, Poiseuille-like profile.
The rationale for analyzing a swirling inflow comes from the supposedly helical spin provided by the right ventricle contraction through the outflow tract, as reported in previous works [65]. The swirl component was modeled as a constant angular velocity, normal to the inflow plane, whose magnitude was a certain constant fraction of the plug flow component at each phase of the cardiac cycle. Results in terms of the Q-criterion at peak systole are shown in Figure A4. The vortical structure produced on the inner wall of the MPA and described in Section 3 is present in all cases, proving that this mechanism is relatively insensitive to the inflow profile and more closely linked to geometric factors. However, additional structures are formed in the case of a Poiseuille profile and for a strong swirl component, and the cases in Figure A4b,d. In the former case, vortical flow generates along the upper portion of the outer wall of the MPA, and propagates into the two branches; in the latter case, a distinct flow structure forms on the upper wall of the bifurcation.
These effects deserve further analysis and may benefit from a more comprehensive model comprising the right ventricle and its outflow tract, that will be the subject of future work.

Figure A4.
Comparison of Q-criterion, colored by velocity magnitude, at peak systole for different inflow conditions. (a) plug flow profile; (b) plug flow with swirl component of 10%; (c) plug flow with swirl component of 30%; (d) Poseuille-like profile.
Figure A4.
Comparison of Q-criterion, colored by velocity magnitude, at peak systole for different inflow conditions. (a) plug flow profile; (b) plug flow with swirl component of 10%; (c) plug flow with swirl component of 30%; (d) Poseuille-like profile.

References
- Caro, C.G.; Pedley, T.; Schroter, R.; Seed, W. The Mechanics of the Circulation; Cambridge University Press: Cambridge, UK, 2012. [Google Scholar]
- Hanna, B.D. Blood flow in normal and diseased pulmonary arteries. In Ventricular Function and Blood Flow in Congenital Heart Disease; Wiley-Blackwell: Hoboken, NJ, USA, 2005; pp. 275–285. [Google Scholar]
- Hoffman, J.I.; Kaplan, S. The incidence of congenital heart disease. J. Am. Coll. Cardiol. 2002, 39, 1890–1900. [Google Scholar] [CrossRef]
- Marsden, A.L. Simulation based planning of surgical interventions in pediatric cardiology. Phys. Fluids 2013, 25, 101303. [Google Scholar] [CrossRef] [PubMed]
- Ntsinjana, H.N.; Capelli, C.; Biglino, G.; Cook, A.C.; Tann, O.; Derrick, G.; Taylor, A.M.; Schievano, S. 3D morphometric analysis of the arterial switch operation using in vivo MRI data. Clin. Anat. 2014, 27, 1212–1222. [Google Scholar] [CrossRef] [PubMed]
- Capuano, F.; Loke, Y.H.; Cronin, I.; Olivieri, L.J.; Balaras, E. Computational Study of Pulmonary Flow Patterns after Repair of Transposition of Great Arteries. J. Biomech. Eng. 2019, 141, 051008. [Google Scholar] [CrossRef] [PubMed]
- Loke, Y.H.; Capuano, F.; Mandell, J.; Cross, R.R.; Cronin, I.; Mass, P.; Balaras, E.; Olivieri, L.J. Abnormal Pulmonary Artery Bending Correlates With Increased Right Ventricular Afterload Following the Arterial Switch Operation. World J. Pediatr. Congenit. Heart Surg. 2019, 10, 572–581. [Google Scholar] [CrossRef] [PubMed]
- Sanz, J.; Sánchez-Quintana, D.; Bossone, E.; Bogaard, H.J.; Naeije, R. Anatomy, function, and dysfunction of the right ventricle: JACC state-of-the-art review. J. Am. Coll. Cardiol. 2019, 73, 1463–1482. [Google Scholar] [CrossRef]
- Dohlen, G.; Chaturvedi, R.R.; Benson, L.N.; Ozawa, A.; Van Arsdell, G.S.; Fruitman, D.S.; Lee, K.J. Stenting of the right ventricular outflow tract in the symptomatic infant with tetralogy of Fallot. Heart 2009, 95, 142–147. [Google Scholar] [CrossRef]
- Nakata, S.; Imai, Y.; Takanashi, Y.; Kurosawa, H.; Tezuka, K.; Nakazawa, M.; Ando, M.; Takao, A. A new method for the quantitative standardization of cross-sectional areas of the pulmonary arteries in congenital heart diseases with decreased pulmonary blood flow. J. Thorac. Cardiovasc. Surg. 1984, 88, 610–619. [Google Scholar]
- Morgan, V.L.; Roselli, R.J.; Lorenz, C.H. Normal three-dimensional pulmonary artery flow determined by phase contrast magnetic resonance imaging. Ann. Biomed. Eng. 1998, 26, 557–566. [Google Scholar] [CrossRef]
- Sloth, E.; Houlind, K.C.; Oyre, S.; Kim, W.Y.; Pedersen, E.M.; Jørgensen, H.S.; Hasenkam, J.M. Three-dimensional visualization of velocity profiles in the human main pulmonary artery with magnetic resonance phase-velocity mapping. Am. Heart J. 1994, 128, 1130–1138. [Google Scholar] [CrossRef]
- Reiter, G.; Reiter, U.; Kovacs, G.; Kainz, B.; Schmidt, K.; Maier, R.; Olschewski, H.; Rienmueller, R. Magnetic resonance-derived 3-dimensional blood flow patterns in the main pulmonary artery as a marker of pulmonary hypertension and a measure of elevated mean pulmonary arterial pressure. Circ. Cardiovasc. Imaging 2008, 1, 23–30. [Google Scholar] [CrossRef] [PubMed]
- Tang, B.T.; Fonte, T.A.; Chan, F.P.; Tsao, P.S.; Feinstein, J.A.; Taylor, C.A. Three-dimensional hemodynamics in the human pulmonary arteries under resting and exercise conditions. Ann. Biomed. Eng. 2011, 39, 347–358. [Google Scholar] [CrossRef] [PubMed]
- Bächler, P.; Pinochet, N.; Sotelo, J.; Crelier, G.; Irarrazaval, P.; Tejos, C.; Uribe, S. Assessment of normal flow patterns in the pulmonary circulation by using 4D magnetic resonance velocity mapping. Magn. Reson. Imaging 2013, 31, 178–188. [Google Scholar] [CrossRef]
- Tang, T.; Chiu, S.; Chen, H.C.; Cheng, K.Y.; Chen, S.J. Comparison of pulmonary arterial flow phenomena in spiral and Lecompte models by computational fluid dynamics. J. Thorac. Cardiovasc. Surg. 2001, 122, 529–534. [Google Scholar] [CrossRef] [PubMed]
- Geiger, J.; Hirtler, D.; Bürk, J.; Stiller, B.; Arnold, R.; Jung, B.; Langer, M.; Markl, M. Postoperative pulmonary and aortic 3D haemodynamics in patients after repair of transposition of the great arteries. Eur. Radiol. 2014, 24, 200–208. [Google Scholar] [CrossRef] [PubMed]
- Riesenkampff, E.; Nordmeyer, S.; Al-Wakeel, N.; Kropf, S.; Kutty, S.; Berger, F.; Kuehne, T. Flow-sensitive four-dimensional velocity-encoded magnetic resonance imaging reveals abnormal blood flow patterns in the aorta and pulmonary trunk of patients with transposition. Cardiol. Young 2014, 24, 47–53. [Google Scholar] [CrossRef] [PubMed]
- Rickers, C.; Kheradvar, A.; Sievers, H.H.; Falahatpisheh, A.; Wegner, P.; Gabbert, D.; Jerosch-Herold, M.; Hart, C.; Voges, I.; Putman, L.M.; et al. Is the Lecompte technique the last word on transposition of the great arteries repair for all patients? A magnetic resonance imaging study including a spiral technique two decades postoperatively. Interact. Cardiovasc. Thorac. Surg. 2016, 22, 817–825. [Google Scholar] [CrossRef]
- Geiger, J.; Markl, M.; Jung, B.; Grohmann, J.; Stiller, B.; Langer, M.; Arnold, R. 4D-MR flow analysis in patients after repair for tetralogy of Fallot. Eur. Radiol. 2011, 21, 1651–1657. [Google Scholar] [CrossRef]
- Zhang, W.; Liu, J.; Yan, Q.; Liu, J.; Hong, H.; Mao, L. Computational haemodynamic analysis of left pulmonary artery angulation effects on pulmonary blood flow. Interact. Cardiovasc. Thorac. Surg. 2016, 23, 519–525. [Google Scholar] [CrossRef]
- Jeong, D.; Anagnostopoulos, P.V.; Roldan-Alzate, A.; Srinivasan, S.; Schiebler, M.L.; Wieben, O.; Francois, C.J. Ventricular kinetic energy may provide a novel noninvasive way to assess ventricular performance in patients with repaired tetralogy of Fallot. J. Thorac. Cardiovasc. Surg. 2015, 149, 1339–1347. [Google Scholar] [CrossRef]
- Boumpouli, M.; Danton, M.; Gourlay, T.; Kazakidi, A. Hemodynamics in the pulmonary bifurcation in relation to adults with congenital heart disease: Effect of branching angle and origin. In Proceedings of the 6th European Conference on Computational Mechanics and 7th European Conference on Computational Fluid Dynamics 2018, Glasgow, UK, 11–15 June 2018; pp. 1–12. [Google Scholar]
- Dean, W. The stream-line motion of fluid in a curved pipe. Lond. Edinb. Dublin Philos. Mag. J. Sci. 1928, 5, 673–695. [Google Scholar] [CrossRef]
- Lyne, W. Unsteady viscous flow in a curved pipe. J. Fluid Mech. 1971, 45, 13–31. [Google Scholar] [CrossRef]
- Berger, S.; Talbot, L.; Yao, L. Flow in curved pipes. Annu. Rev. Fluid Mech. 1983, 15, 461–512. [Google Scholar] [CrossRef]
- Plesniak, M.W.; Bulusu, K.V. Morphology of Secondary Flows in a Curved Pipe With Pulsatile Inflow. J. Fluids Eng. 2016, 138, 101203. [Google Scholar] [CrossRef]
- Canton, J.; Örlü, R.; Schlatter, P. Characterisation of the steady, laminar incompressible flow in toroidal pipes covering the entire curvature range. Int. J. Heat Fluid Flow 2017, 66, 95–107. [Google Scholar] [CrossRef]
- Najjari, M.R.; Plesniak, M.W. Secondary flow vortical structures in a 180° elastic curved vessel with torsion under steady and pulsatile inflow conditions. Phys. Rev. Fluids 2018, 3, 013101. [Google Scholar] [CrossRef]
- Fernandez, R.C.; De Witt, K.; Botwin, M. Pulsatile flow through a bifurcation with applications to arterial disease. J. Biomech. 1976, 9, 575–580. [Google Scholar] [CrossRef]
- Patil, M.K.; Subbaraj, K. Finite element analysis of two dimensional steady flow in model arterial bifurcation. J. Biomech. 1988, 21, 219–233. [Google Scholar] [CrossRef]
- Ku, D.N. Blood flow in arteries. Annu. Rev. Fluid Mech. 1997, 29, 399–434. [Google Scholar] [CrossRef]
- Durrleman, S.; Prastawa, M.; Charon, N.; Korenberg, J.R.; Joshi, S.; Gerig, G.; Trouvé, A. Morphometry of anatomical shape complexes with dense deformations and sparse parameters. NeuroImage 2014, 101, 35–49. [Google Scholar] [CrossRef]
- Durrleman, S. Deformetrica 4: An Open-Source Software for Statistical Shape Analysis. In Proceedings of the Shape in Medical Imaging: International Workshop, ShapeMI 2018, Held in Conjunction with MICCAI 2018, Granada, Spain, 20 September 2018; Springer: Berlin/Heidelberg, Germany, 2018; Volume 11167, p. 3. [Google Scholar]
- Bruse, J.L.; Khushnood, A.; McLeod, K.; Biglino, G.; Sermesant, M.; Pennec, X.; Taylor, A.M.; Hsia, T.Y.; Schievano, S.; Khambadkone, S.; et al. How successful is successful? Aortic arch shape after successful aortic coarctation repair correlates with left ventricular function. J. Thorac. Cardiovasc. Surg. 2017, 153, 418–427. [Google Scholar] [CrossRef] [PubMed]
- Guibert, R.; Mcleod, K.; Caiazzo, A.; Mansi, T.; Fernández, M.A.; Sermesant, M.; Pennec, X.; Vignon-Clementel, I.E.; Boudjemline, Y.; Gerbeau, J.F. Group-wise construction of reduced models for understanding and characterization of pulmonary blood flows from medical images. Med. Image Anal. 2014, 18, 63–82. [Google Scholar] [CrossRef] [PubMed]
- Knobel, Z.; Kellenberger, C.J.; Kaiser, T.; Albisetti, M.; Bergsträsser, E.; Buechel, E.R.V. Geometry and dimensions of the pulmonary artery bifurcation in children and adolescents: Assessment in vivo by contrast-enhanced MR-angiography. Int. J. Cardiovasc. Imaging 2011, 27, 385–396. [Google Scholar] [CrossRef] [PubMed]
- Gori, P.; Colliot, O.; Marrakchi-Kacem, L.; Worbe, Y.; Poupon, C.; Hartmann, A.; Ayache, N.; Durrleman, S. A Bayesian framework for joint morphometry of surface and curve meshes in multi-object complexes. Med. Image Anal. 2017, 35, 458–474. [Google Scholar] [CrossRef]
- Antiga, L.; Piccinelli, M.; Botti, L.; Ene-Iordache, B.; Remuzzi, A.; Steinman, D.A. An image-based modeling framework for patient-specific computational hemodynamics. Med. Biol. Eng. Comput. 2008, 46, 1097. [Google Scholar] [CrossRef]
- Piccinelli, M.; Veneziani, A.; Steinman, D.A.; Remuzzi, A.; Antiga, L. A framework for geometric analysis of vascular structures: application to cerebral aneurysms. IEEE Trans. Med. Imaging 2009, 28, 1141–1155. [Google Scholar] [CrossRef]
- Caro, C.G.; Doorly, D.J.; Tarnawski, M.; Scott, K.T.; Long, Q.; Dumoulin, C.L. Non-planar curvature and branching of arteries and non-planar-type flow. Proc. R. Soc. Lond. Ser. A Math. Phys. Eng. Sci. 1996, 452, 185–197. [Google Scholar]
- Kheyfets, V.; O’Dell, W.; Smith, T.; Reilly, J.; Finol, E. Considerations for numerical modeling of the pulmonary circulation—a review with a focus on pulmonary hypertension. J. Biomech. Eng. 2013, 135, 061011. [Google Scholar] [CrossRef]
- Grinberg, L.; Karniadakis, G.E. Outflow boundary conditions for arterial networks with multiple outlets. Ann. Biomed. Eng. 2008, 36, 1496–1514. [Google Scholar] [CrossRef]
- Vignon-Clementel, I.E.; Figueroa, C.A.; Jansen, K.E.; Taylor, C.A. Outflow boundary conditions for three-dimensional finite element modeling of blood flow and pressure in arteries. Comput. Methods Appl. Mech. Eng. 2006, 195, 3776–3796. [Google Scholar] [CrossRef]
- Cheng, C.P.; Taur, A.S.; Lee, G.S.; Goris, M.L.; Feinstein, J.A. Relative lung perfusion distribution in normal lung scans: observations and clinical implications. Congenit. Heart Dis. 2006, 1, 210–216. [Google Scholar] [CrossRef] [PubMed]
- Zambrano, B.A.; McLean, N.A.; Zhao, X.; Tan, J.L.; Zhong, L.; Figueroa, C.A.; Lee, L.C.; Baek, S. Image-based computational assessment of vascular wall mechanics and hemodynamics in pulmonary arterial hypertension patients. J. Biomech. 2018, 68, 84–92. [Google Scholar] [CrossRef] [PubMed]
- Jin, S.; Oshinski, J.; Giddens, D.P. Effects of wall motion and compliance on flow patterns in the ascending aorta. J. Biomech. Eng. 2003, 125, 347–354. [Google Scholar] [CrossRef] [PubMed]
- Perktold, K.; Rappitsch, G. Computer simulation of local blood flow and vessel mechanics in a compliant carotid artery bifurcation model. J. Biomech. 1995, 28, 845–856. [Google Scholar] [CrossRef]
- Updegrove, A.; Wilson, N.M.; Merkow, J.; Lan, H.; Marsden, A.L.; Shadden, S.C. Simvascular: An open source pipeline for cardiovascular simulation. Ann. Biomed. Eng. 2017, 45, 525–541. [Google Scholar] [CrossRef]
- Whiting, C.H.; Jansen, K.E. A stabilized finite element method for the incompressible Navier–Stokes equations using a hierarchical basis. Int. J. Numer. Methods Fluids 2001, 35, 93–116. [Google Scholar] [CrossRef]
- Kung, E.O.; Les, A.S.; Figueroa, C.A.; Medina, F.; Arcaute, K.; Wicker, R.B.; McConnell, M.V.; Taylor, C.A. In vitro validation of finite element analysis of blood flow in deformable models. Ann. Biomed. Eng. 2011, 39, 1947–1960. [Google Scholar] [CrossRef]
- Kung, E.; Kahn, A.M.; Burns, J.C.; Marsden, A. In vitro validation of patient-specific hemodynamic simulations in coronary aneurysms caused by Kawasaki disease. Cardiovasc. Eng. Technol. 2014, 5, 189–201. [Google Scholar] [CrossRef]
- Berger, S.; Jou, L.D. Flows in stenotic vessels. Annu. Rev. Fluid Mech. 2000, 32, 347–382. [Google Scholar] [CrossRef]
- Du, Z.; Roguin, N.; Barak, M.; Hershkowitz, S.; Milgram, E.; Brezins, M. Doppler echocardiographic study of the pulmonary artery and its branches in 114 normal neonates. Pediatr. Cardiol. 1997, 18, 38–42. [Google Scholar] [CrossRef]
- Giddens, D.P.; Tang, T.D.; Loth, F. Fluid mechanics of arterial bifurcations. In Biological Flows; Springer: Berlin/Heidelberg, Germany, 1995; pp. 51–68. [Google Scholar]
- Marsden, A.L.; Vignon-Clementel, I.E.; Chan, F.P.; Feinstein, J.A.; Taylor, C.A. Effects of exercise and respiration on hemodynamic efficiency in CFD simulations of the total cavopulmonary connection. Ann. Biomed. Eng. 2007, 35, 250–263. [Google Scholar] [CrossRef] [PubMed]
- Sievers, H.H.; Rickers, C. Nature is the best. J. Thorac. Cardiovasc. Surg. 2017, 154, 788–789. [Google Scholar] [CrossRef] [PubMed][Green Version]
- Hunt, J.; Wray, A.; Moin, P. Eddies, Streams, and Convergence Zones in Turbulent Flows; Technical Report CTR-S88; Center for Turbulence Research: Stanford, CA, USA, 1988. [Google Scholar]
- Anderson, R.H.; Mori, S.; Spicer, D.E.; Brown, N.A.; Mohun, T.J. Development and morphology of the ventricular outflow tracts. World J. Pediatr. Congenit. Heart Surg. 2016, 7, 561–577. [Google Scholar] [CrossRef] [PubMed]
- Liu, X.; Sun, A.; Fan, Y.; Deng, X. Physiological significance of helical flow in the arterial system and its potential clinical applications. Ann. Biomed. Eng. 2015, 43, 3–15. [Google Scholar] [CrossRef]
- Markl, M.; Kilner, P.J.; Ebbers, T. Comprehensive 4D velocity mapping of the heart and great vessels by cardiovascular magnetic resonance. J. Cardiovasc. Magn. Reson. 2011, 13, 7. [Google Scholar] [CrossRef]
- Bulusu, K.V.; Hussain, S.; Plesniak, M.W. Determination of secondary flow morphologies by wavelet analysis in a curved artery model with physiological inflow. Exp. Fluids 2014, 55, 1832. [Google Scholar] [CrossRef]
- Evegren, P.; Fuchs, L.; Revstedt, J. On the secondary flow through bifurcating pipes. Phys. Fluids 2010, 22, 103601. [Google Scholar] [CrossRef]
- Pedrizzetti, G.; Domenichini, F. Nature optimizes the swirling flow in the human left ventricle. Phys. Rev. Lett. 2005, 95, 108101. [Google Scholar] [CrossRef]
- Mangual, J.; Domenichini, F.; Pedrizzetti, G. Describing the highly three dimensional right ventricle flow. Ann. Biomed. Eng. 2012, 40, 1790–1801. [Google Scholar] [CrossRef]


© 2019 by the authors. Licensee MDPI, Basel, Switzerland. This article is an open access article distributed under the terms and conditions of the Creative Commons Attribution (CC BY) license (http://creativecommons.org/licenses/by/4.0/).