Modeling of Sedimentation and Creaming in Suspensions and Pickering Emulsions

Abstract
:1. Introduction
2. Theoretical Background
2.1. Settling of a Single Rigid Particle
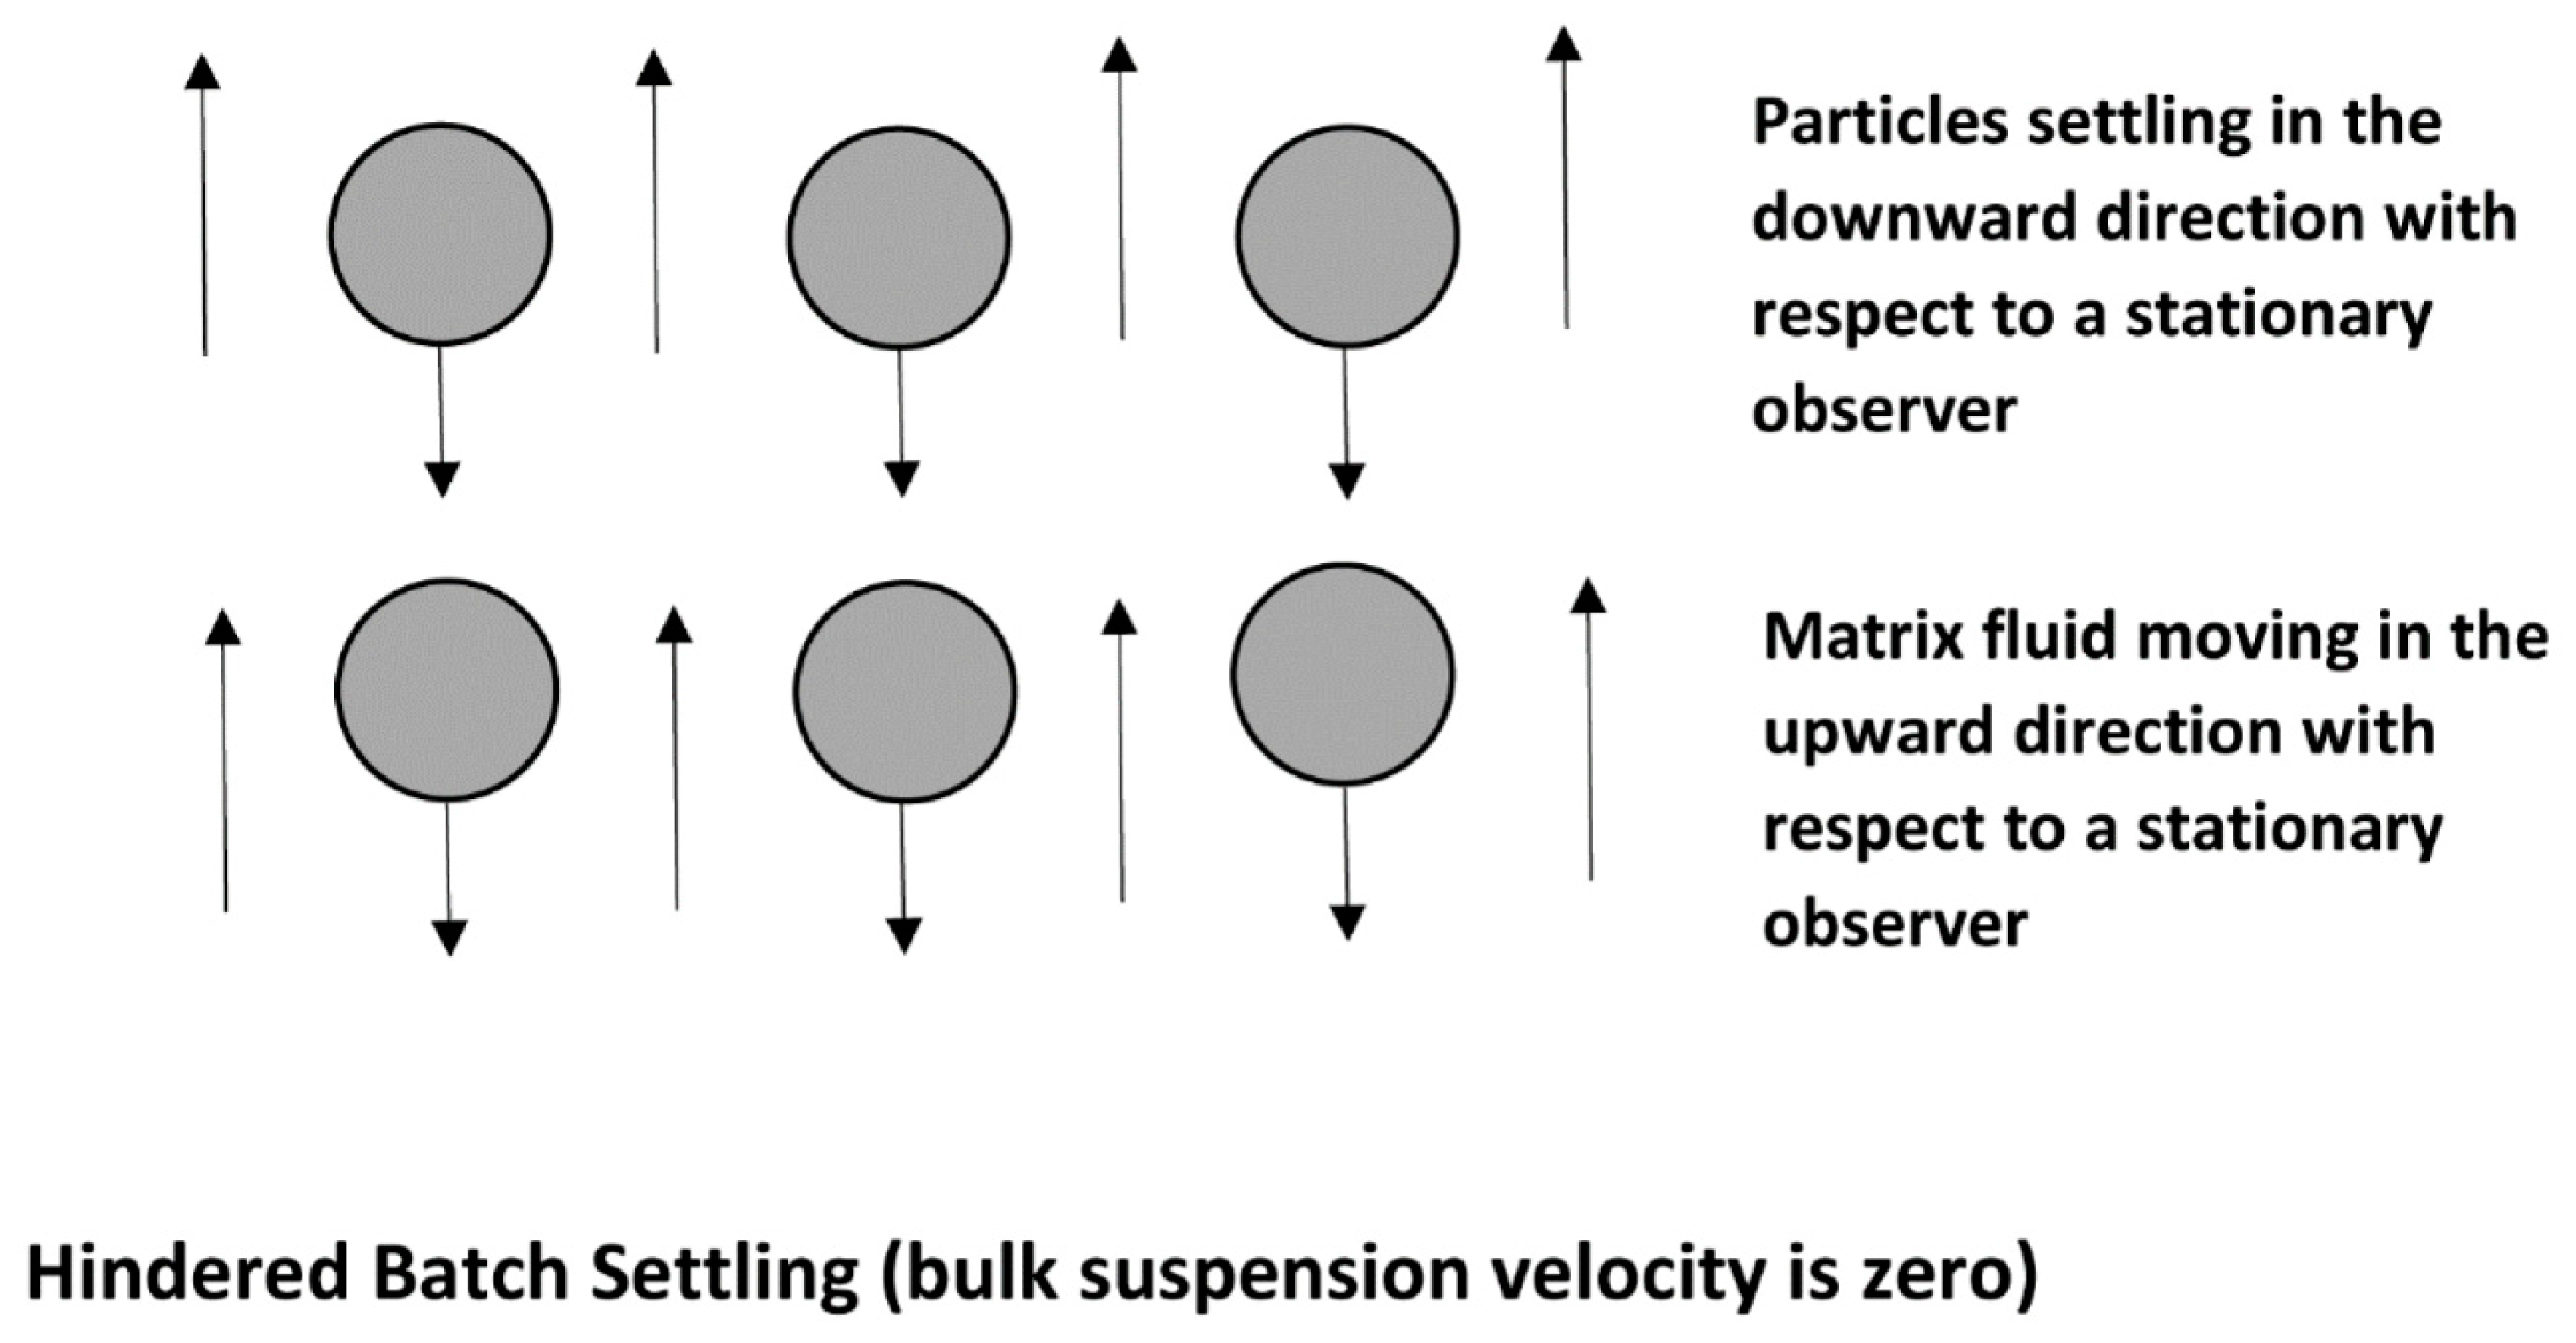
2.2. Settling of a Swarm of Particles (Hindered Settling)
3. Drift Flux Theory and Re-Interpretation of Existing Hindered Settling Data
3.1. Drift Flux Theory
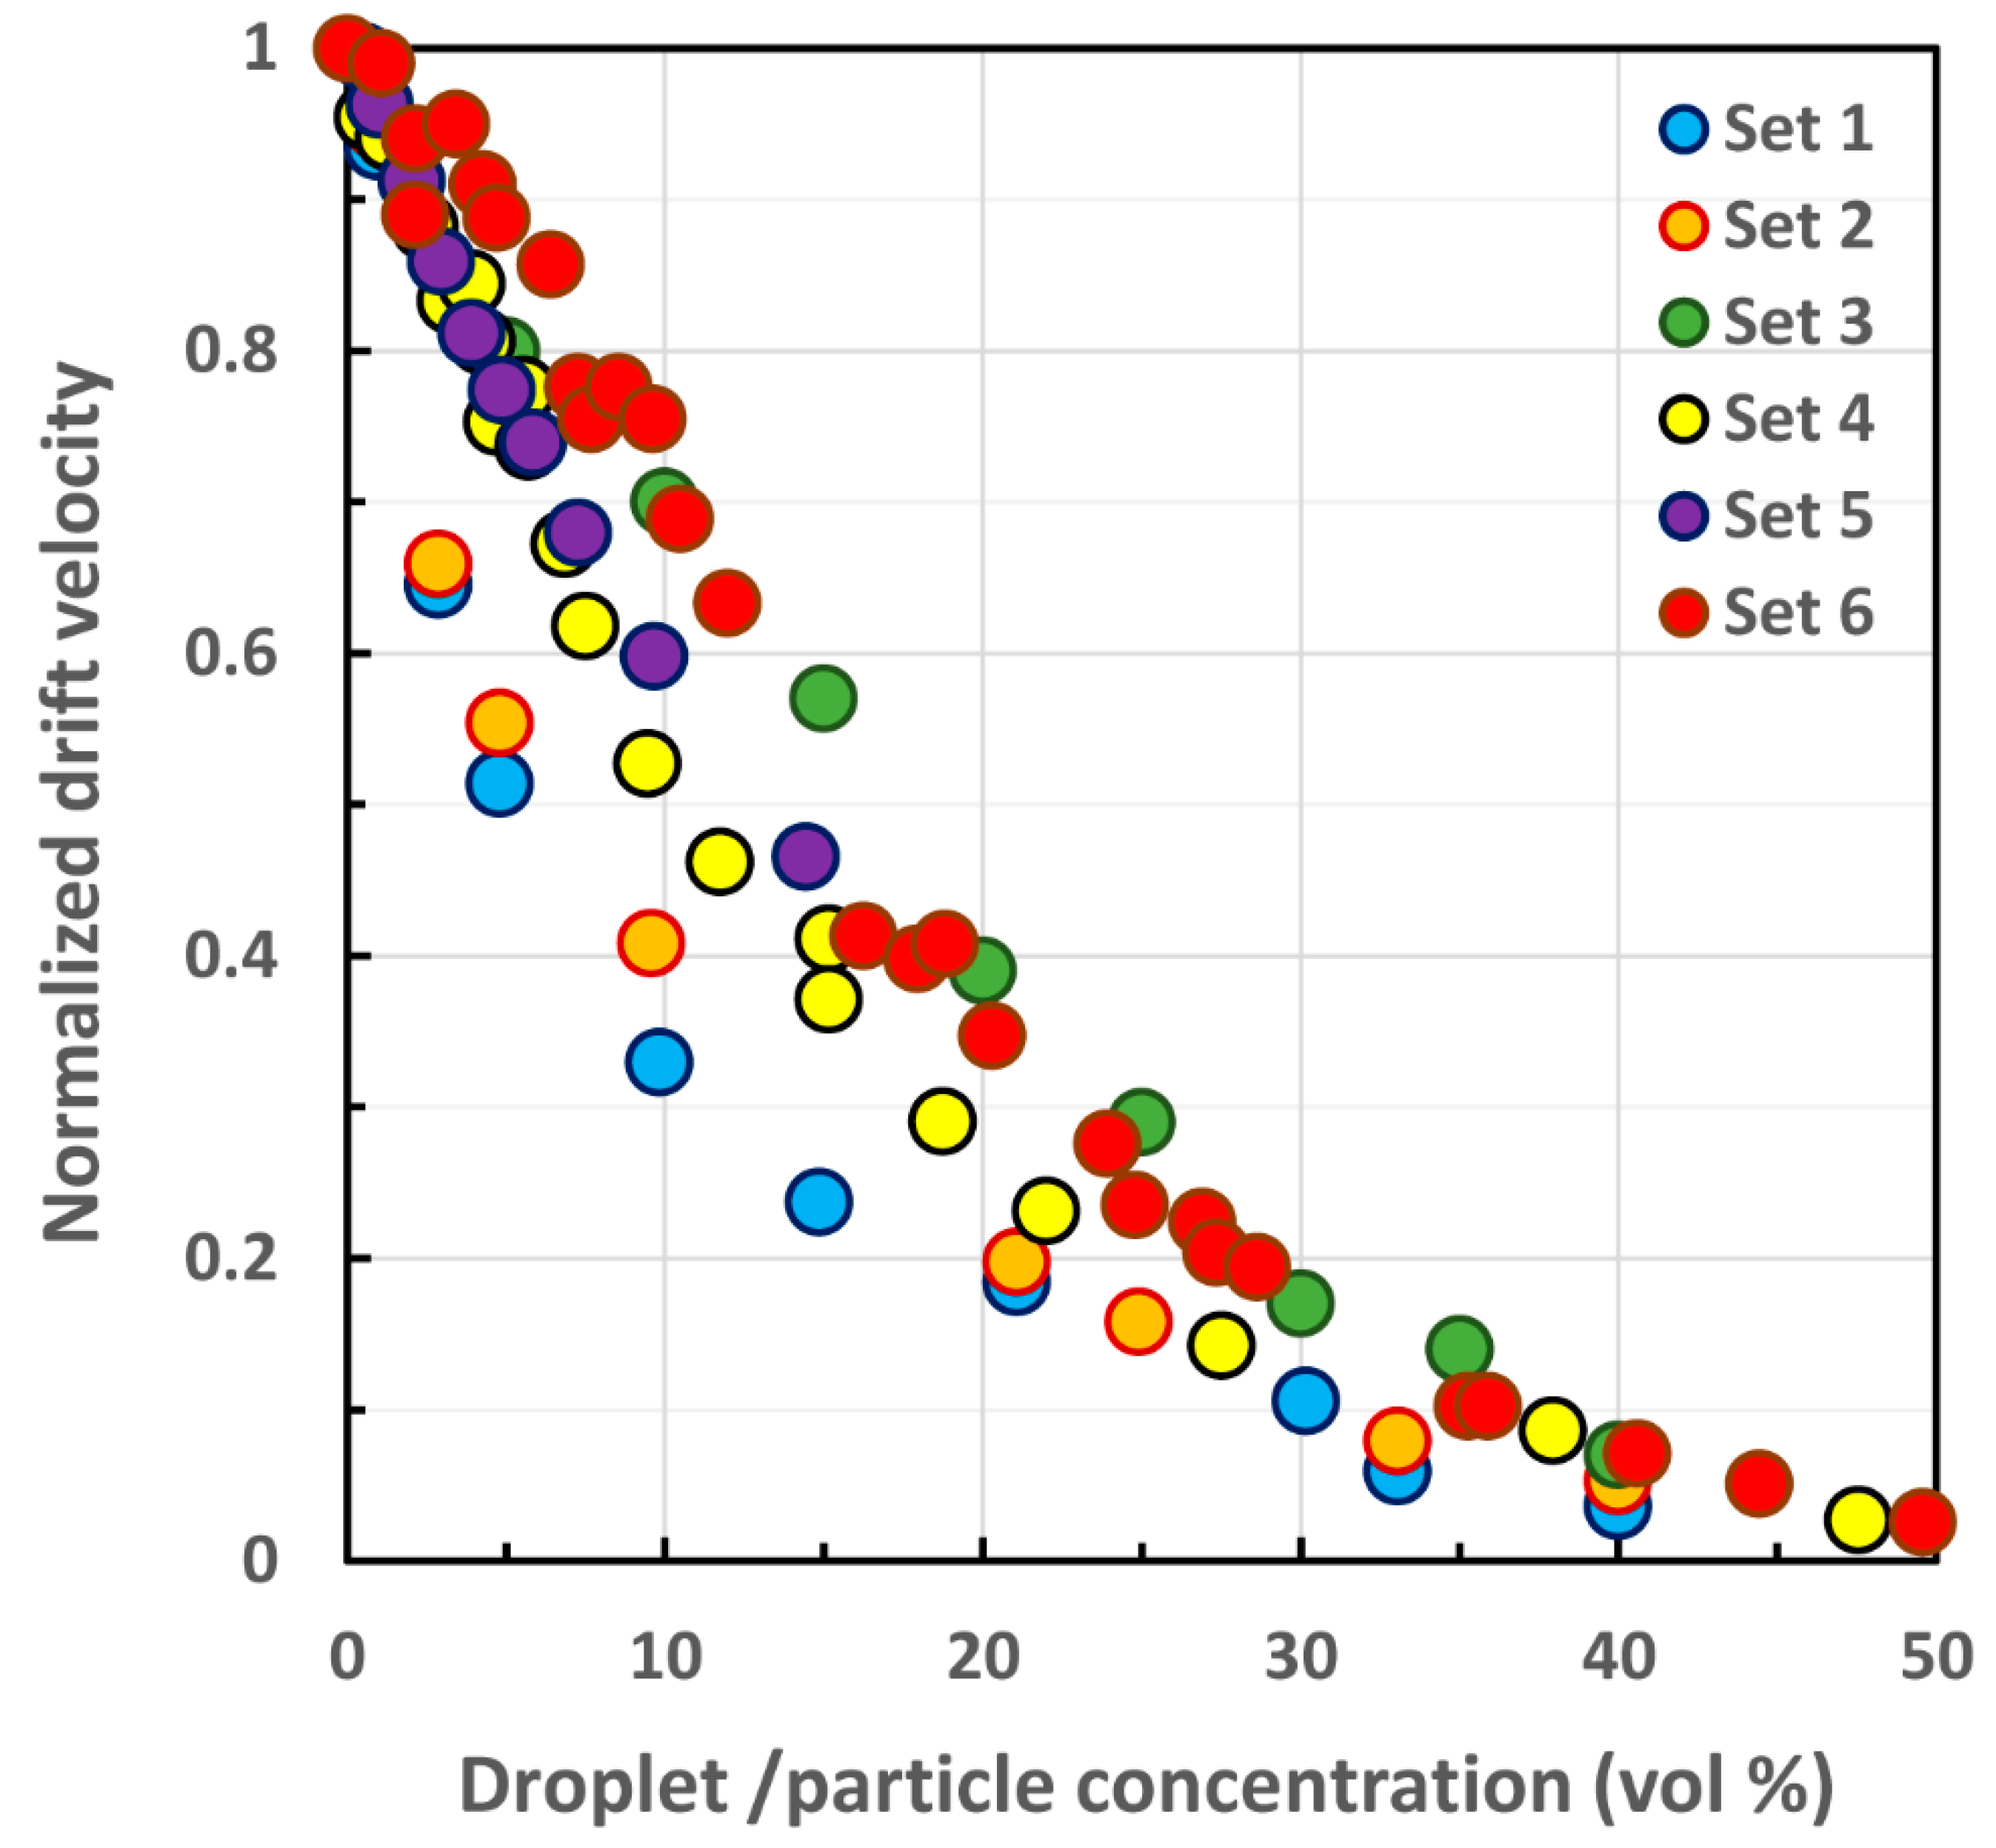
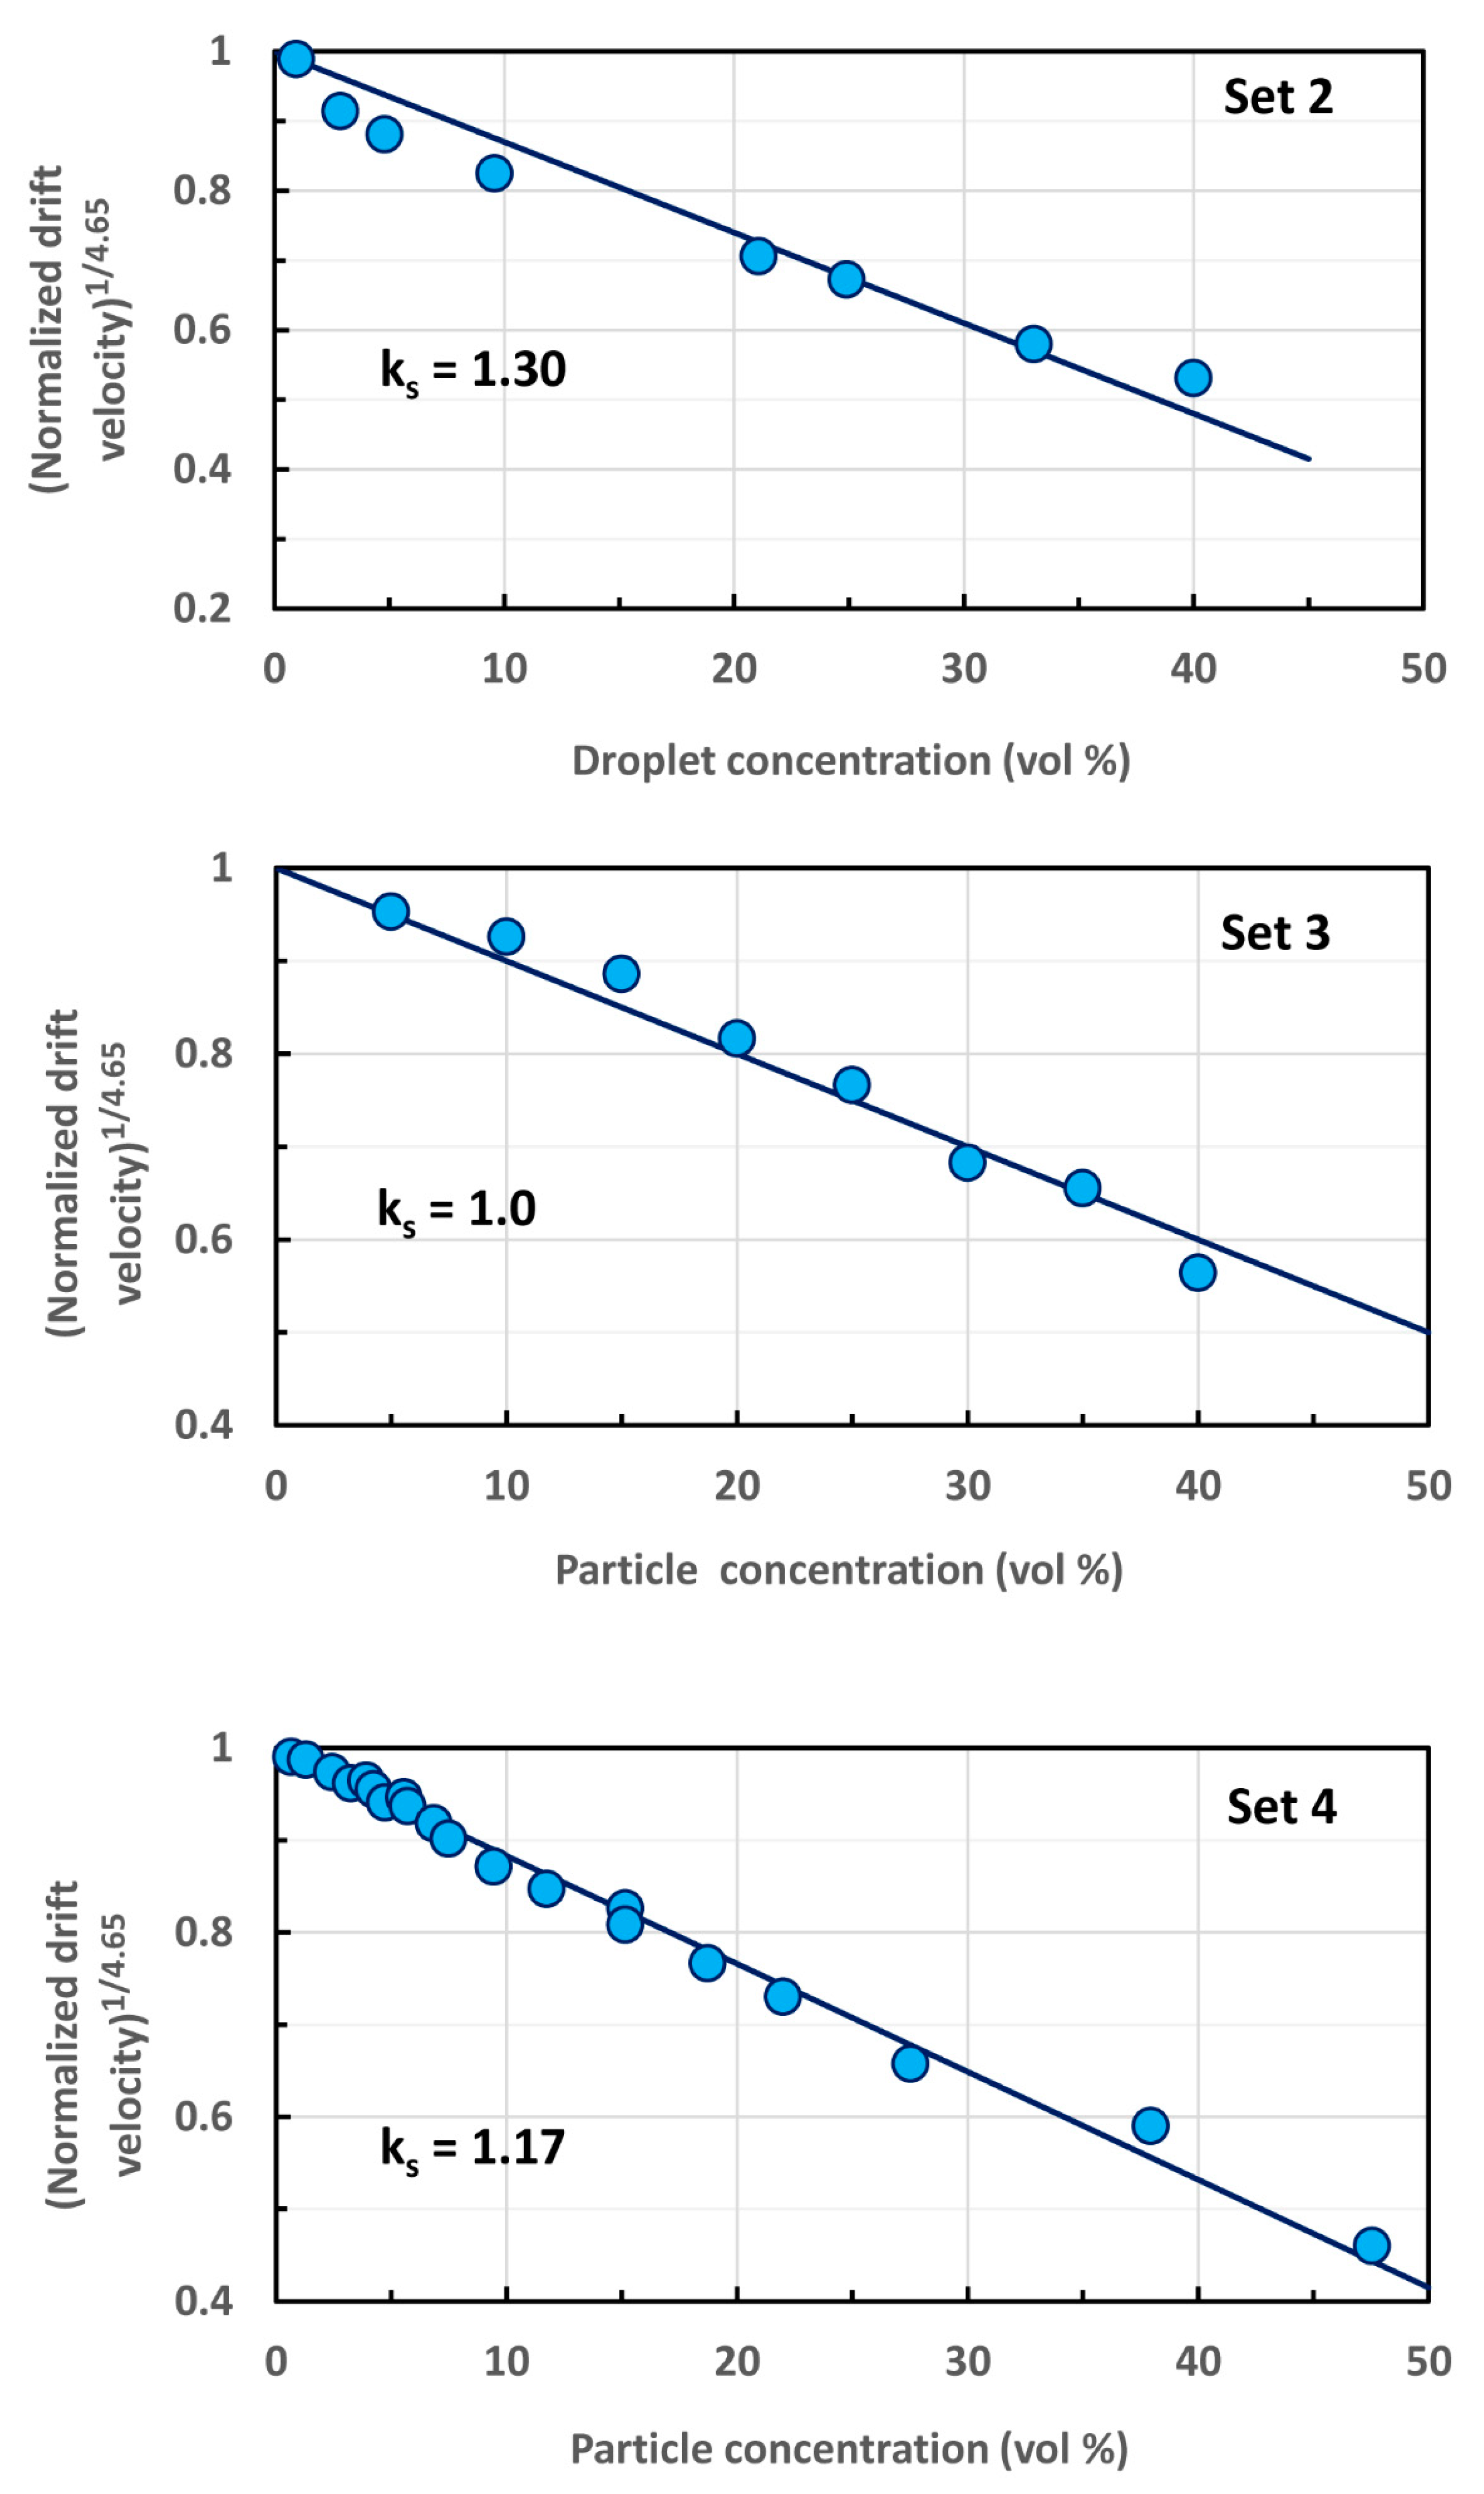
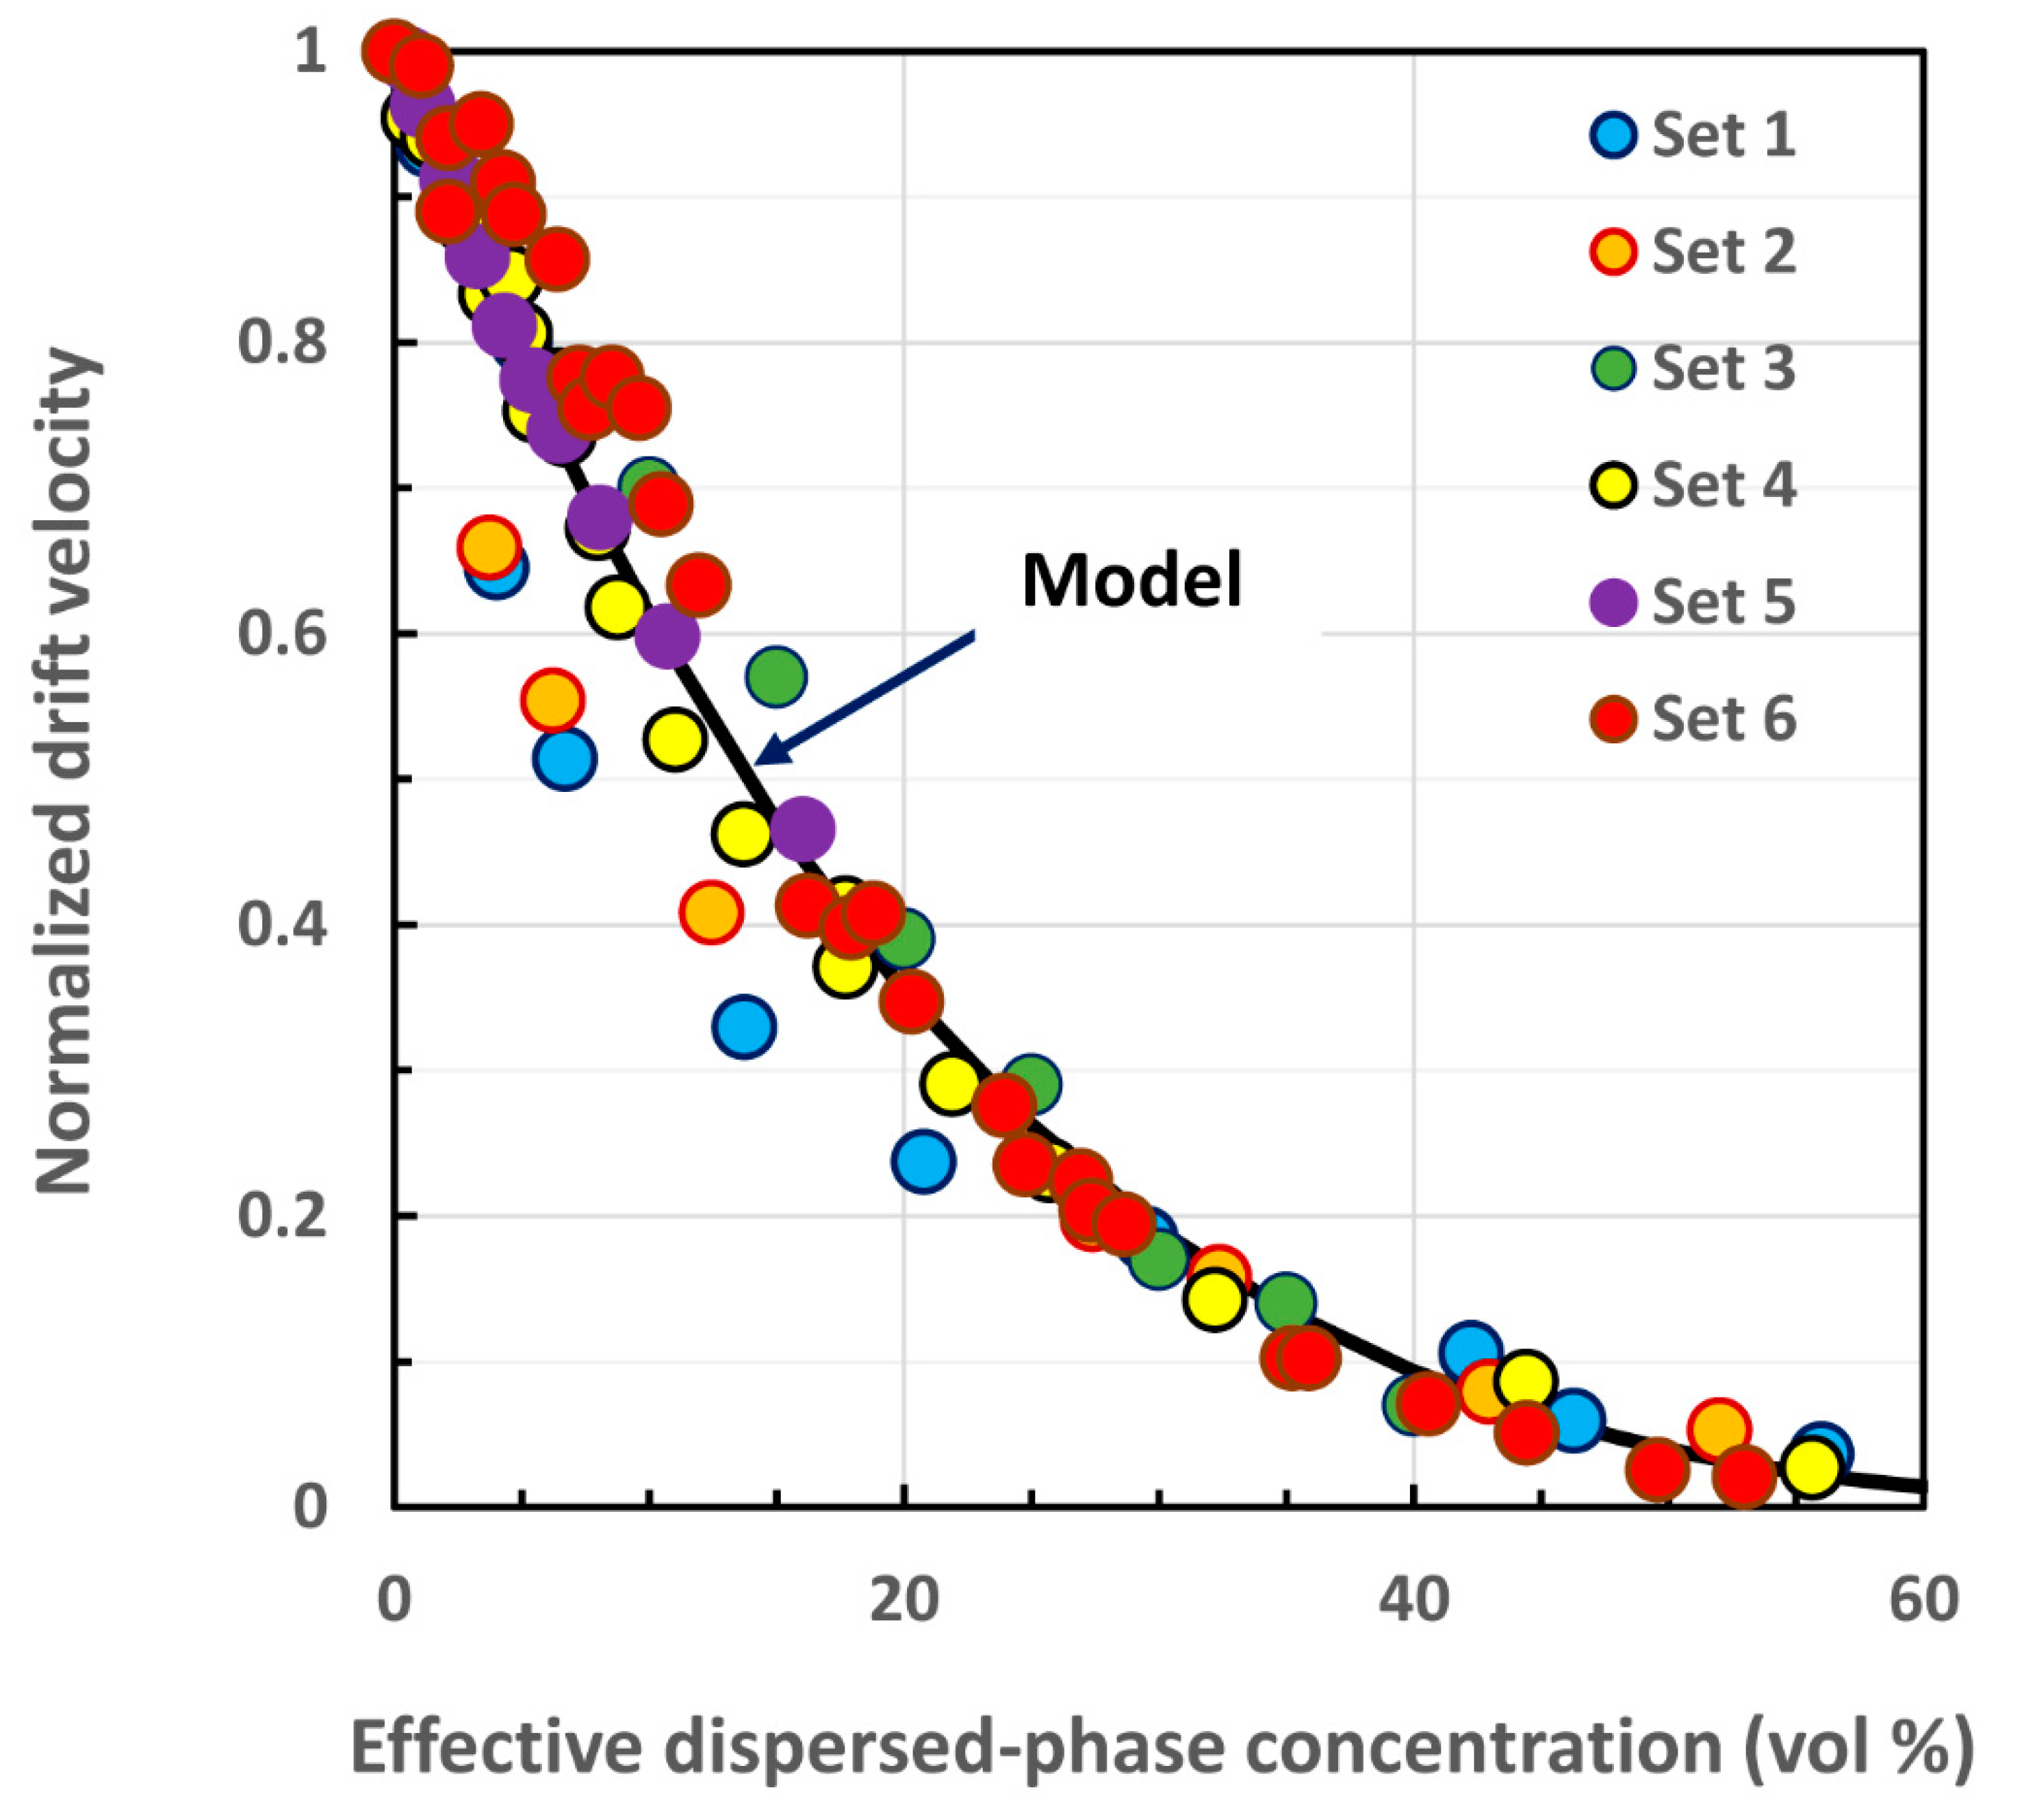
3.2. Re-interpretation of Existing Hindered Settling Data in Terms of Drift Flux Theory
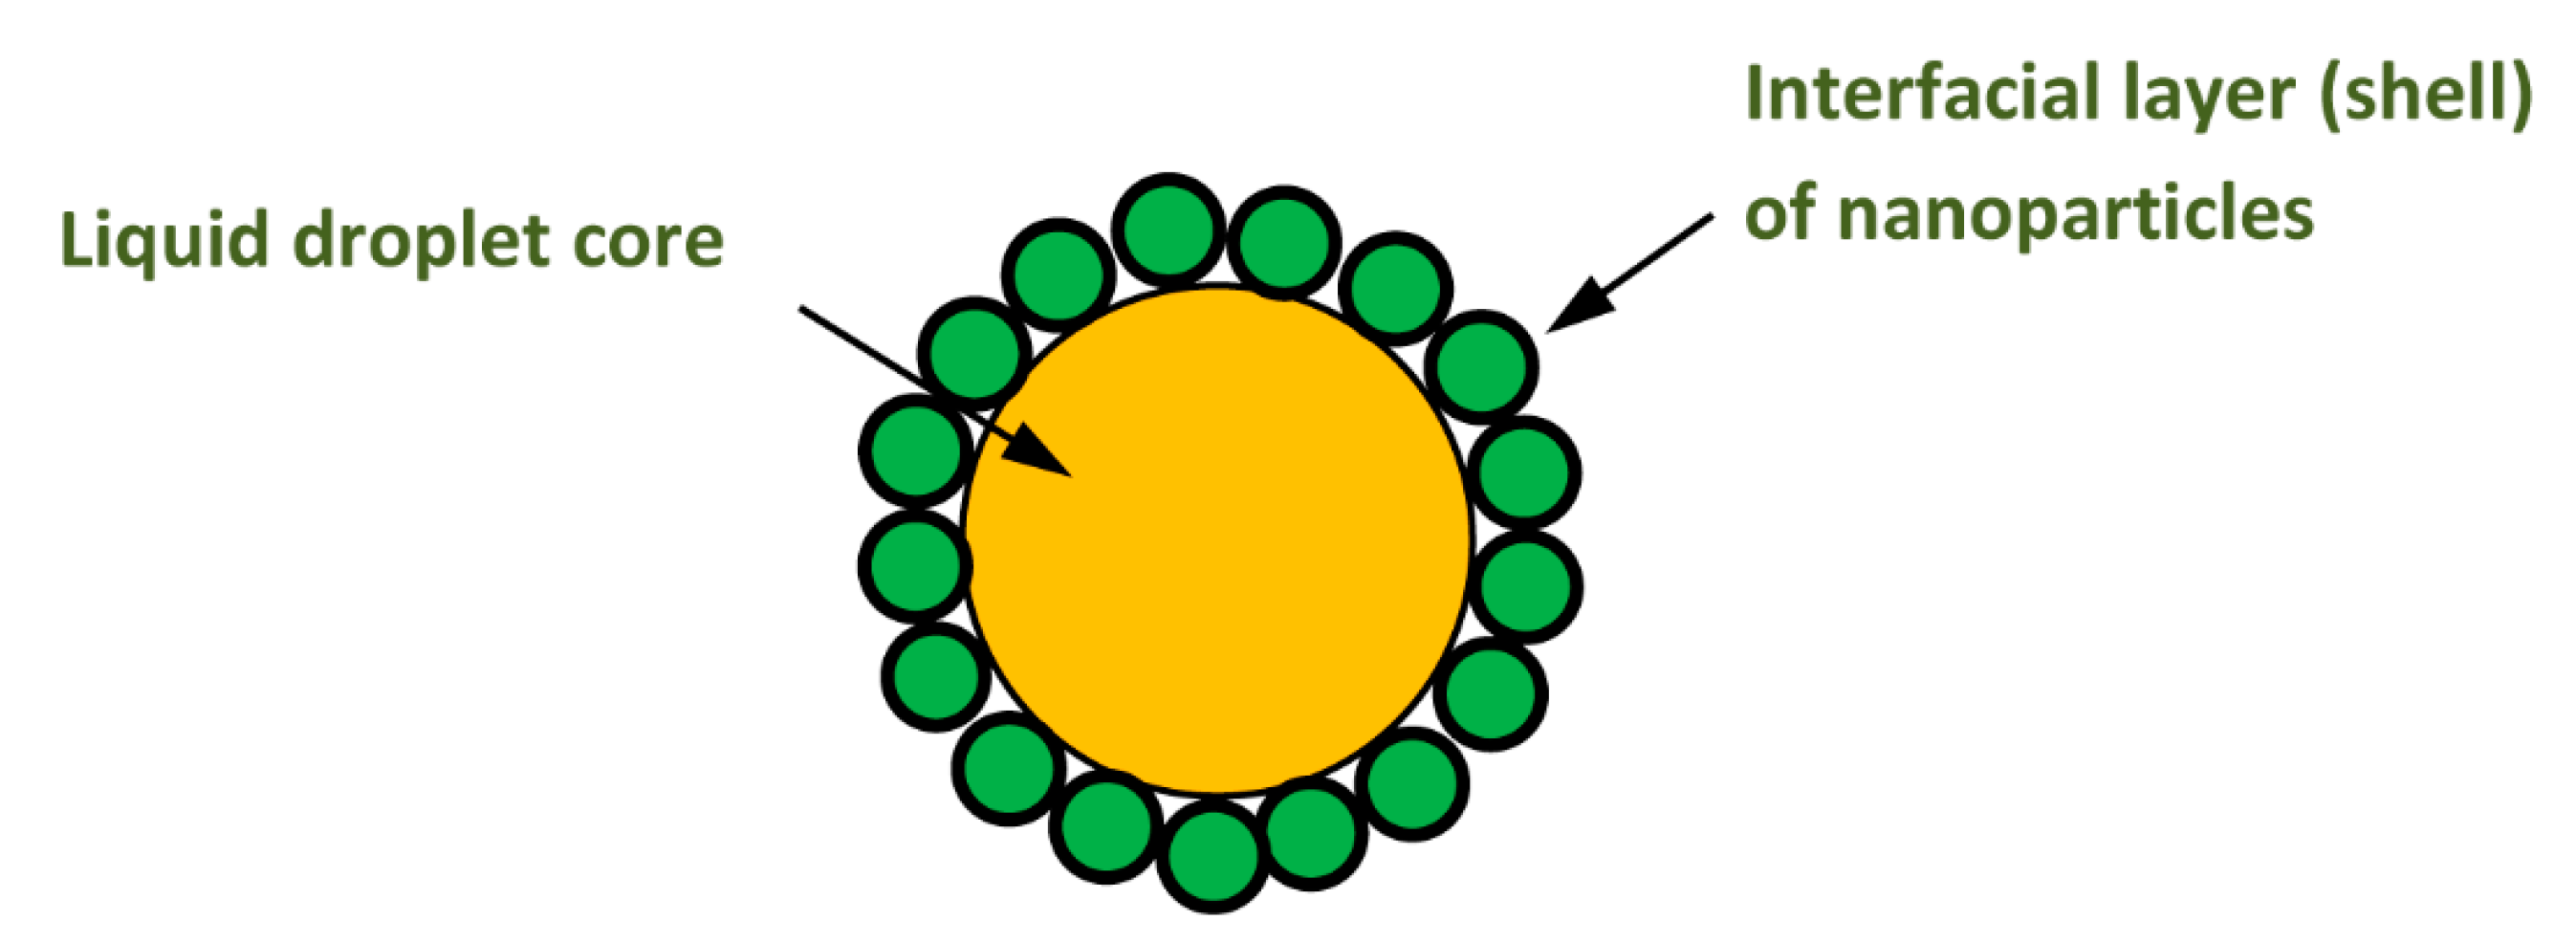
4. Modeling and Simulation of Creaming and Sedimentation of Pickering Emulsions
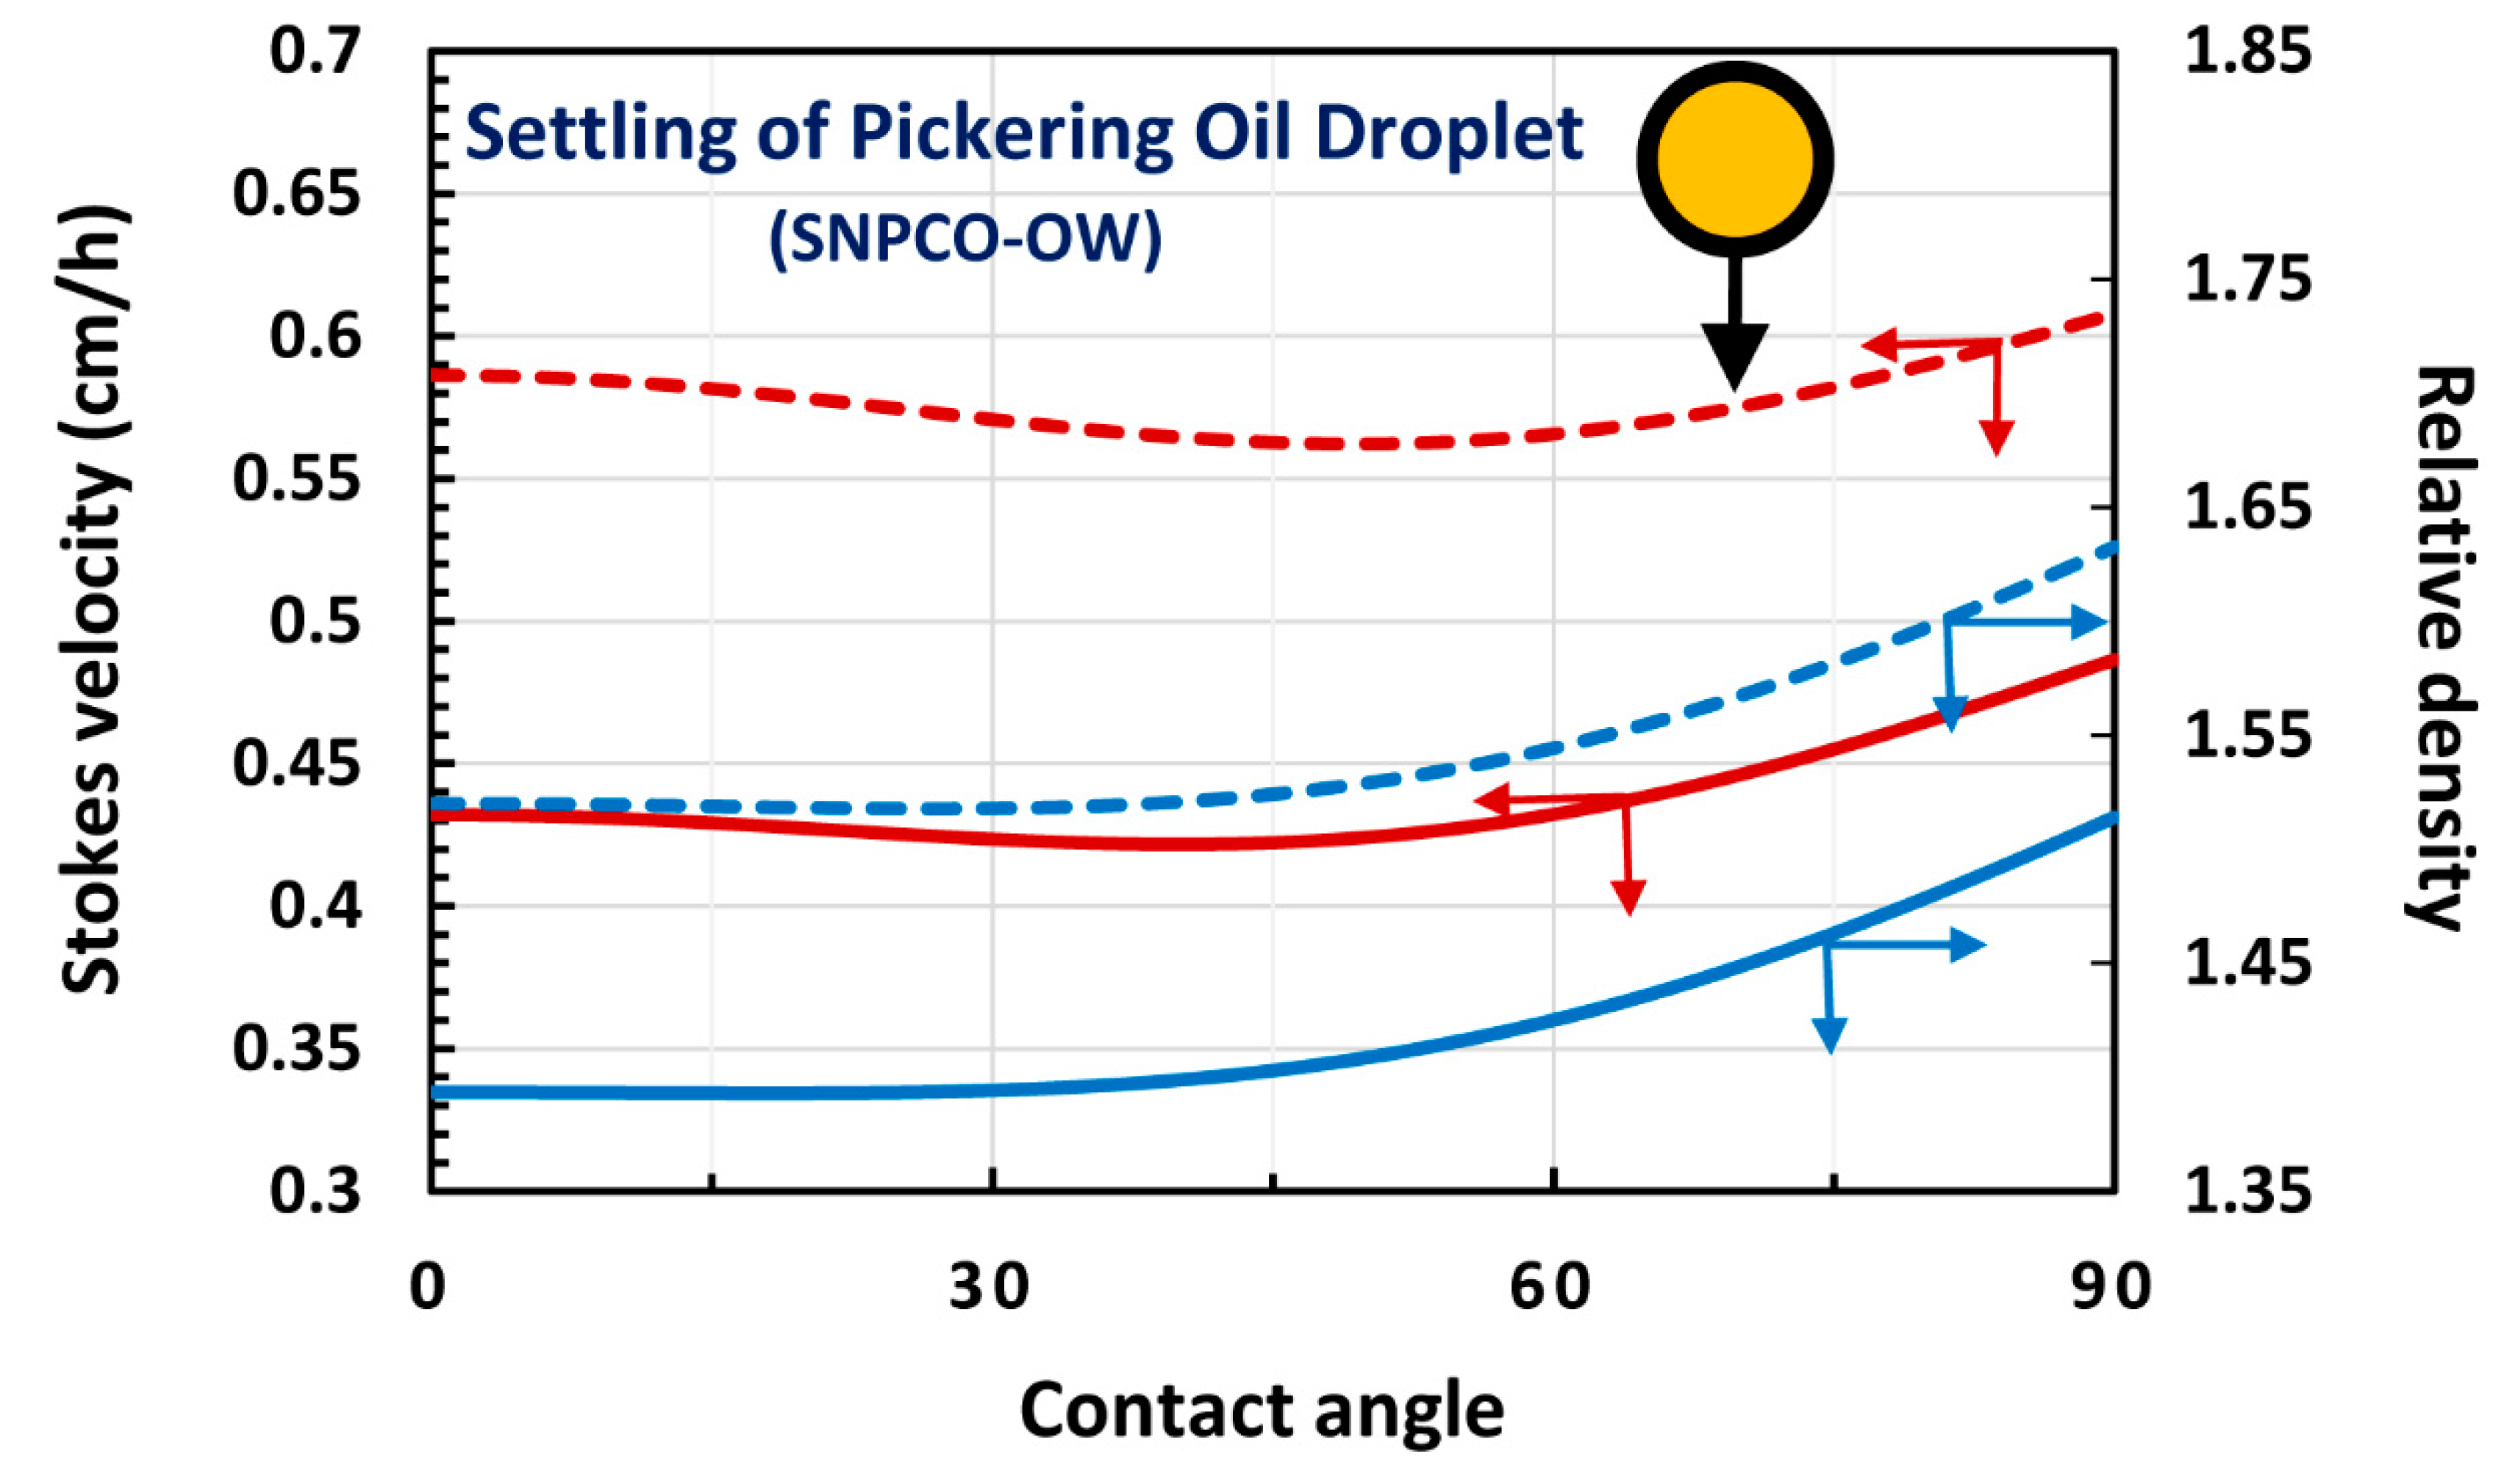
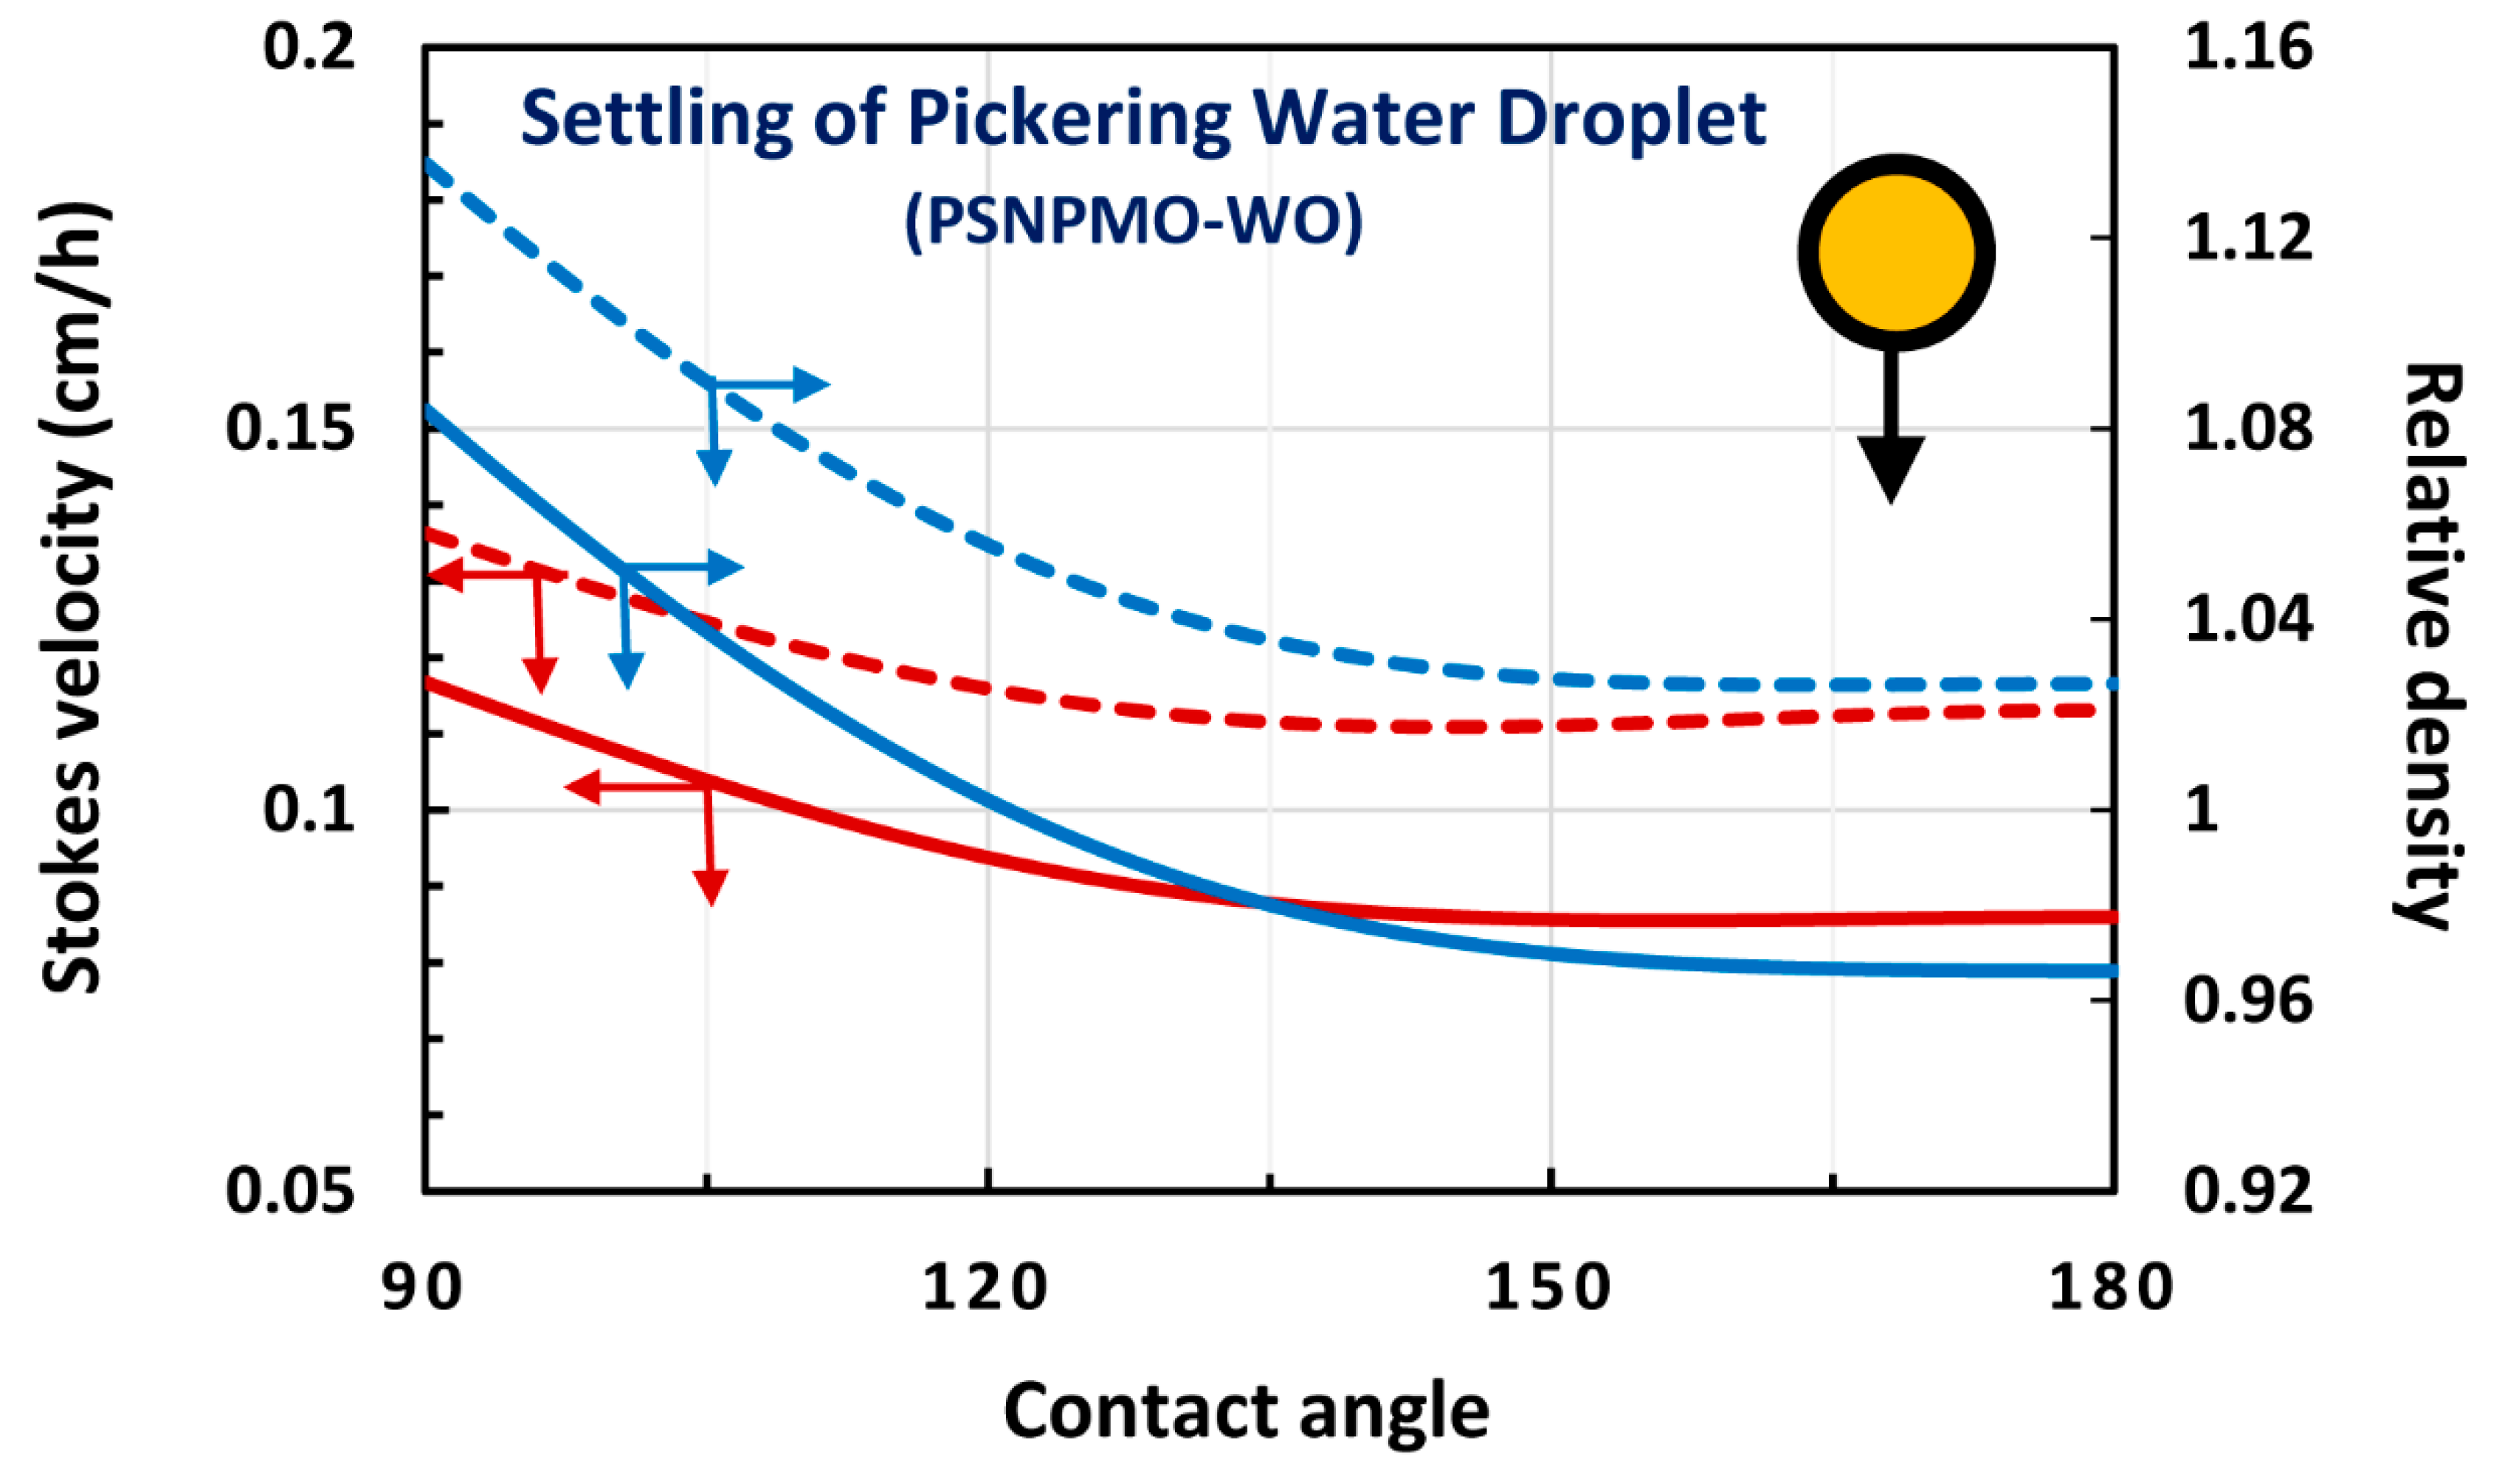
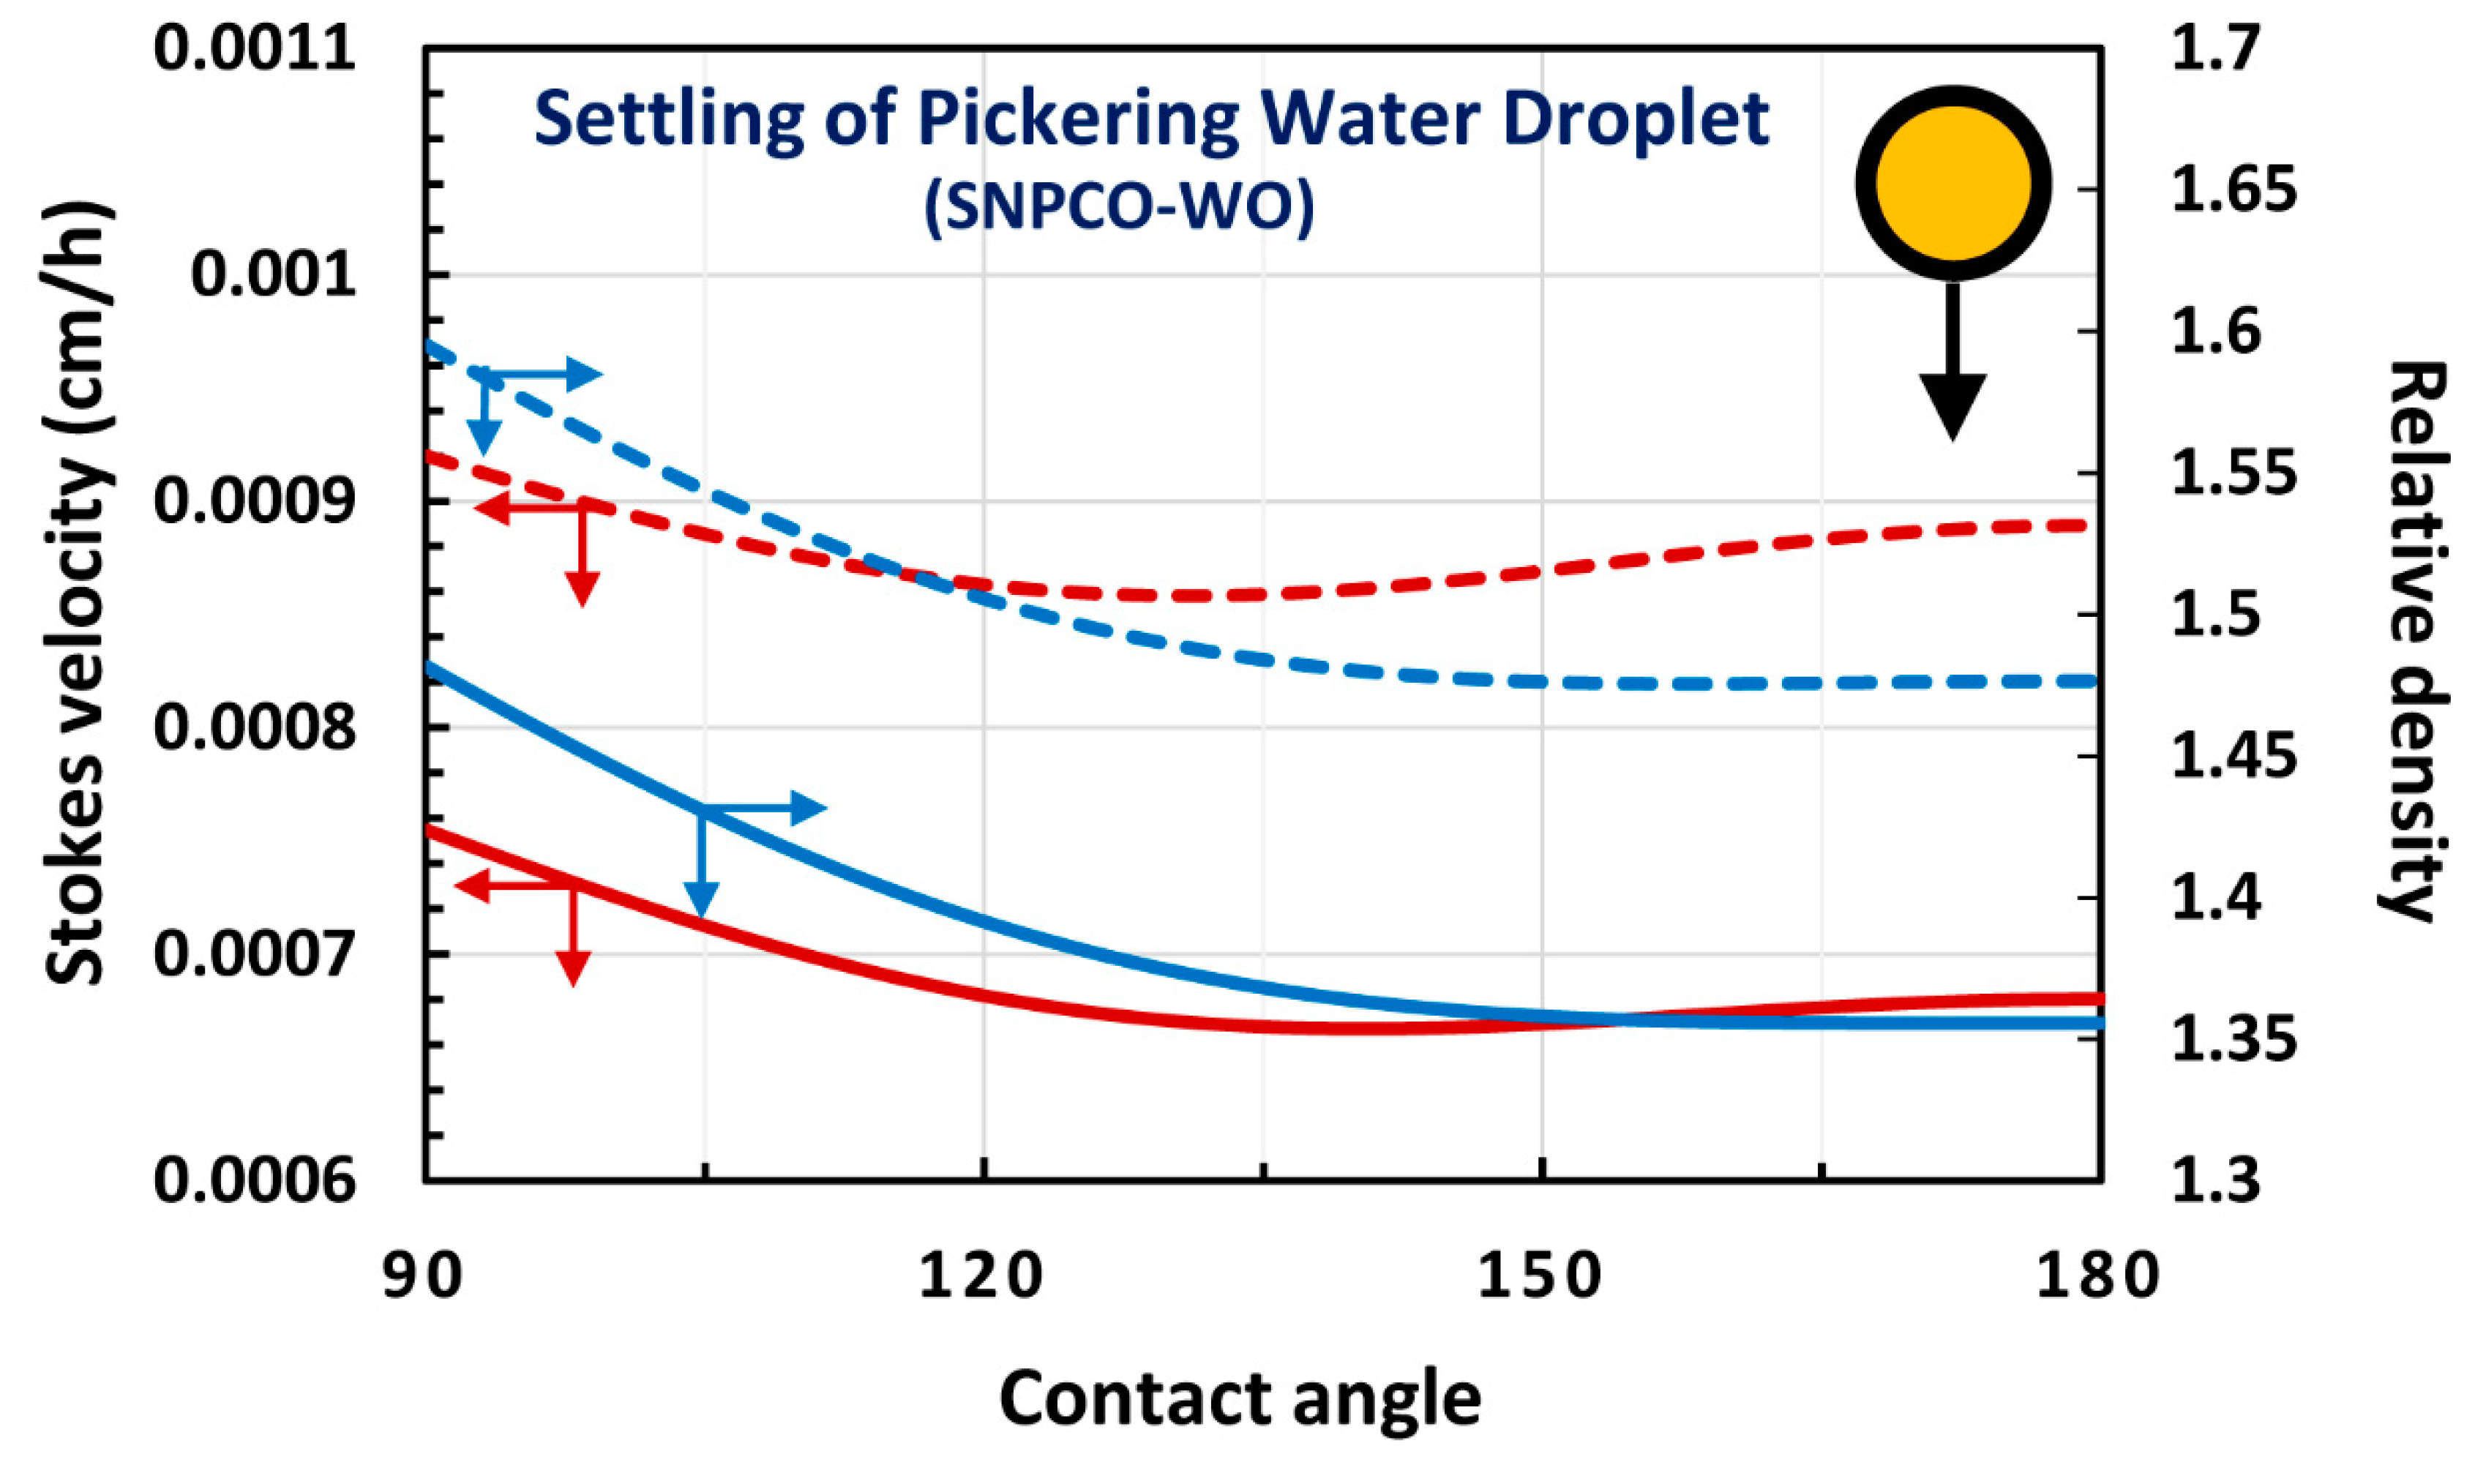
4.1. Upward Rise and Downward Settling of a Single Pickering Emulsion Droplet
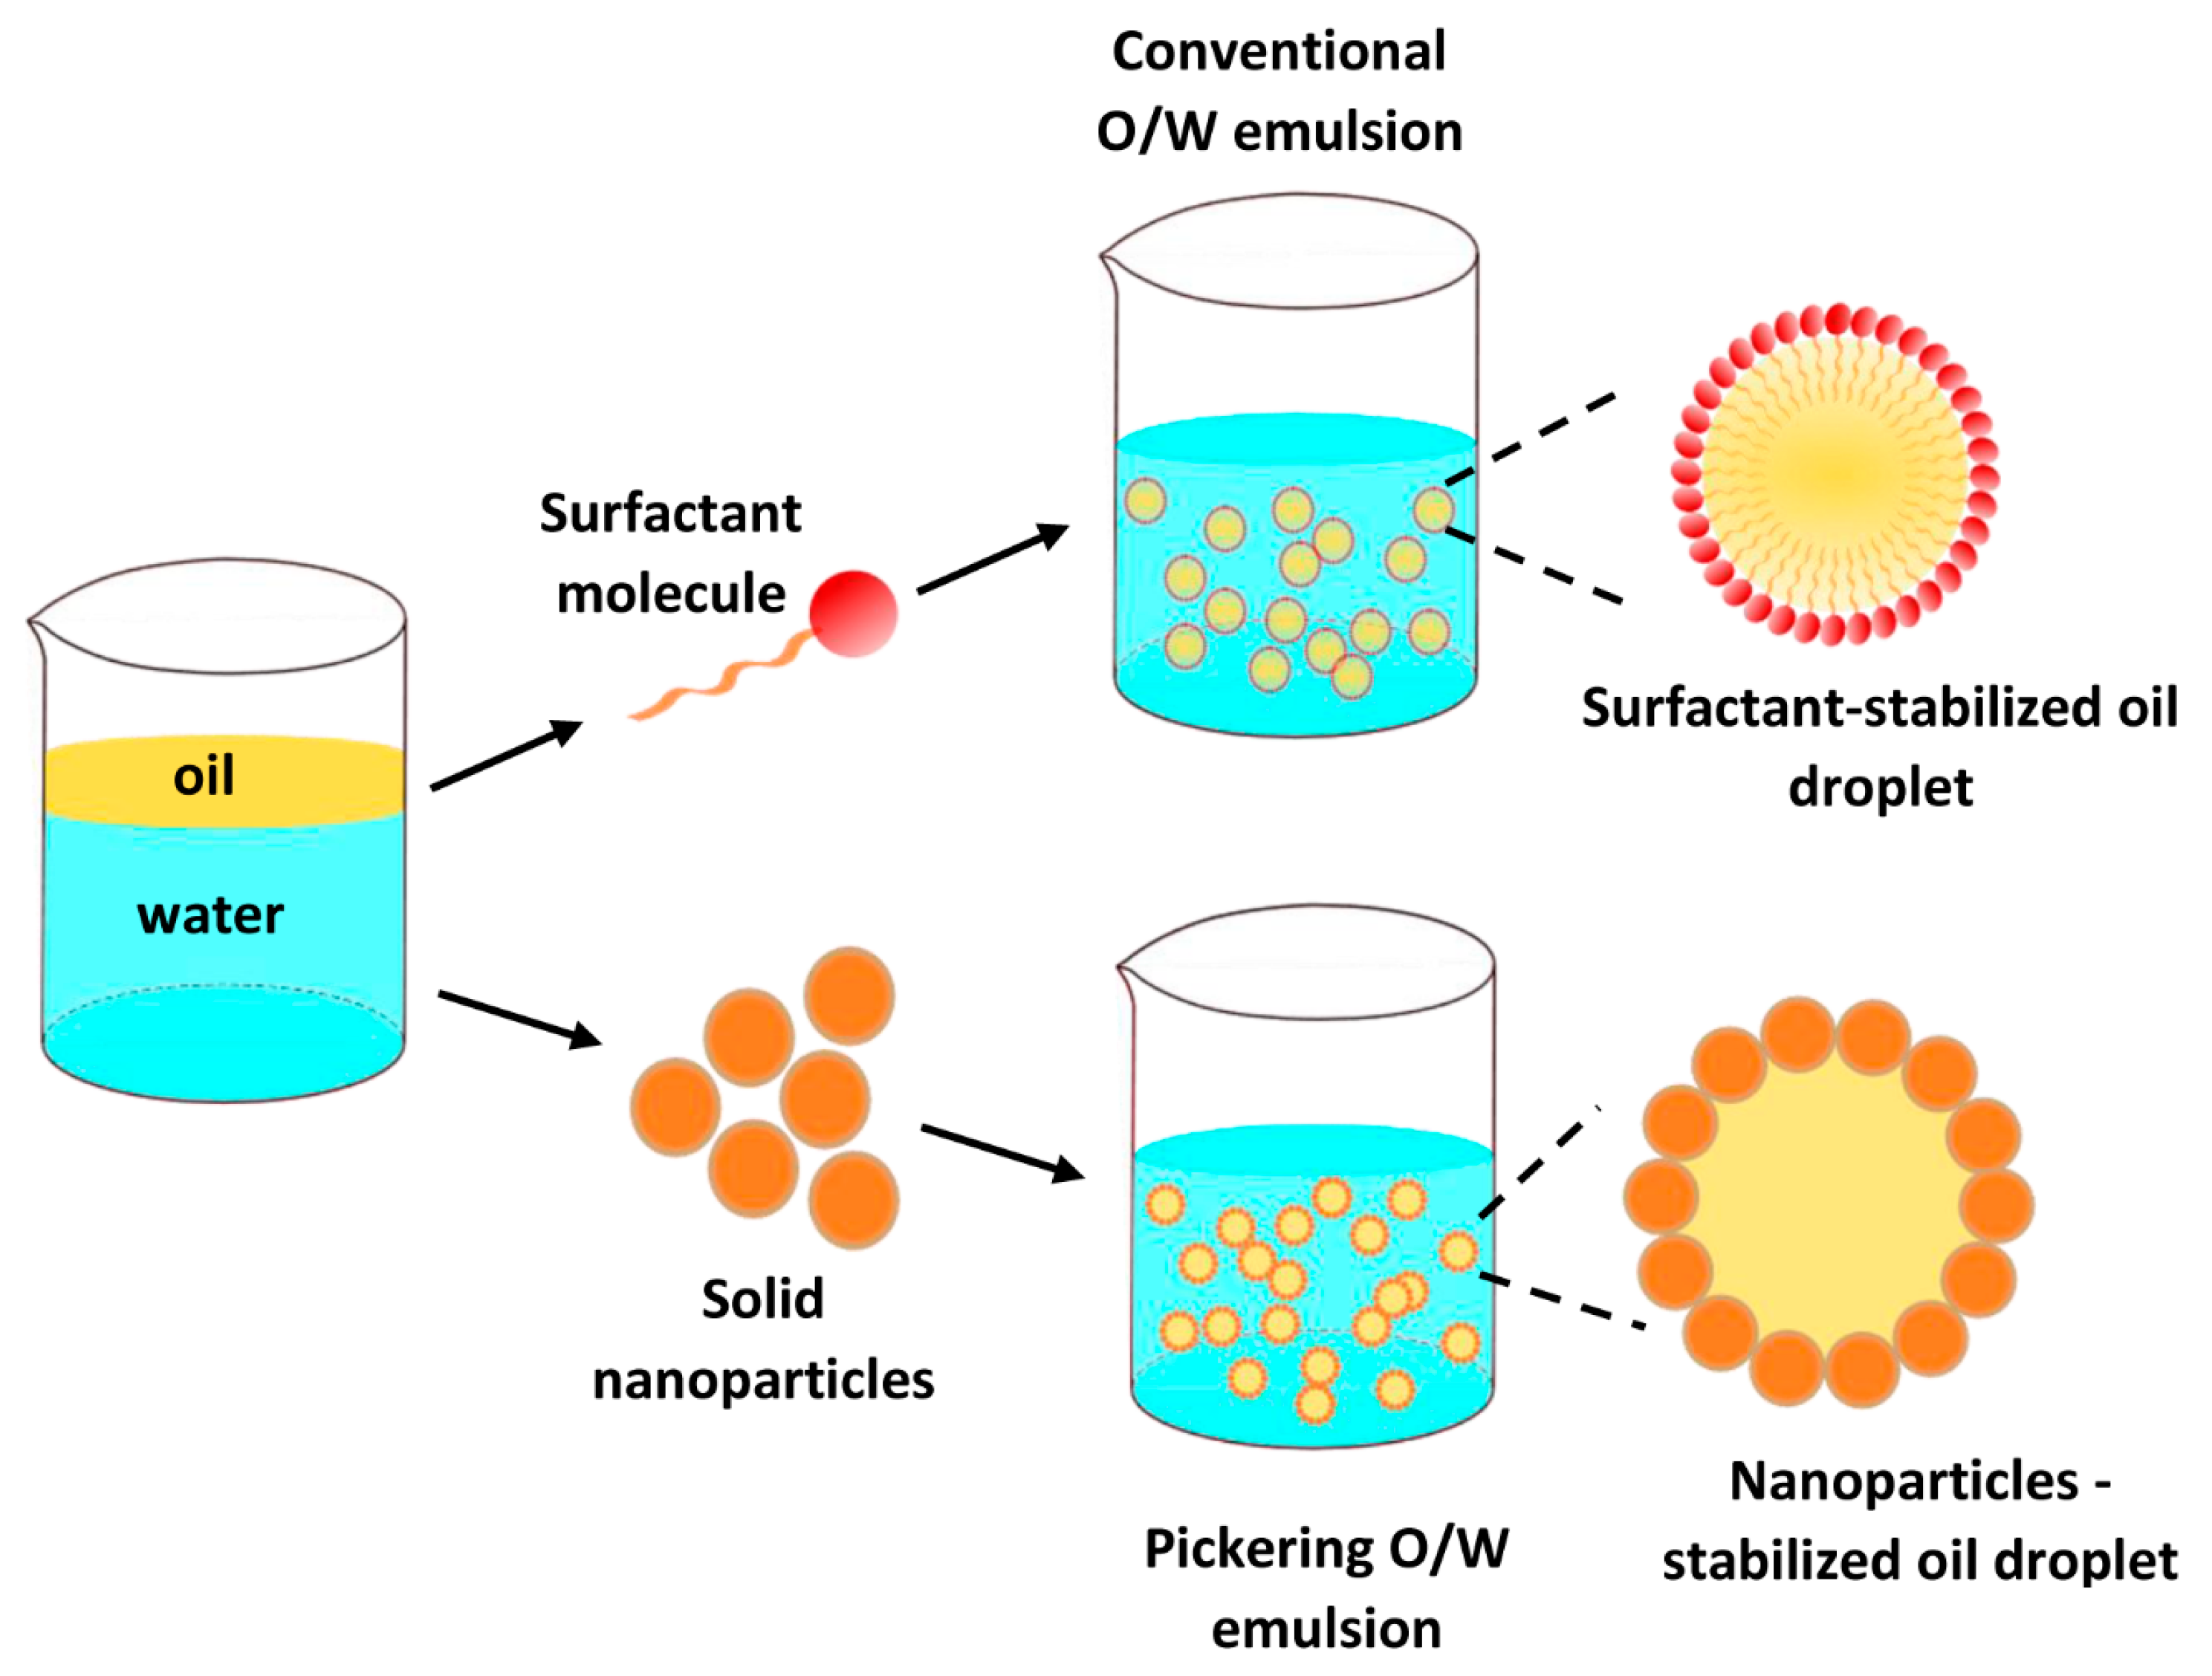
4.2. Oil-in-water (O/W) Emulsions
4.3. Water-in-oil (W/O) Emulsions
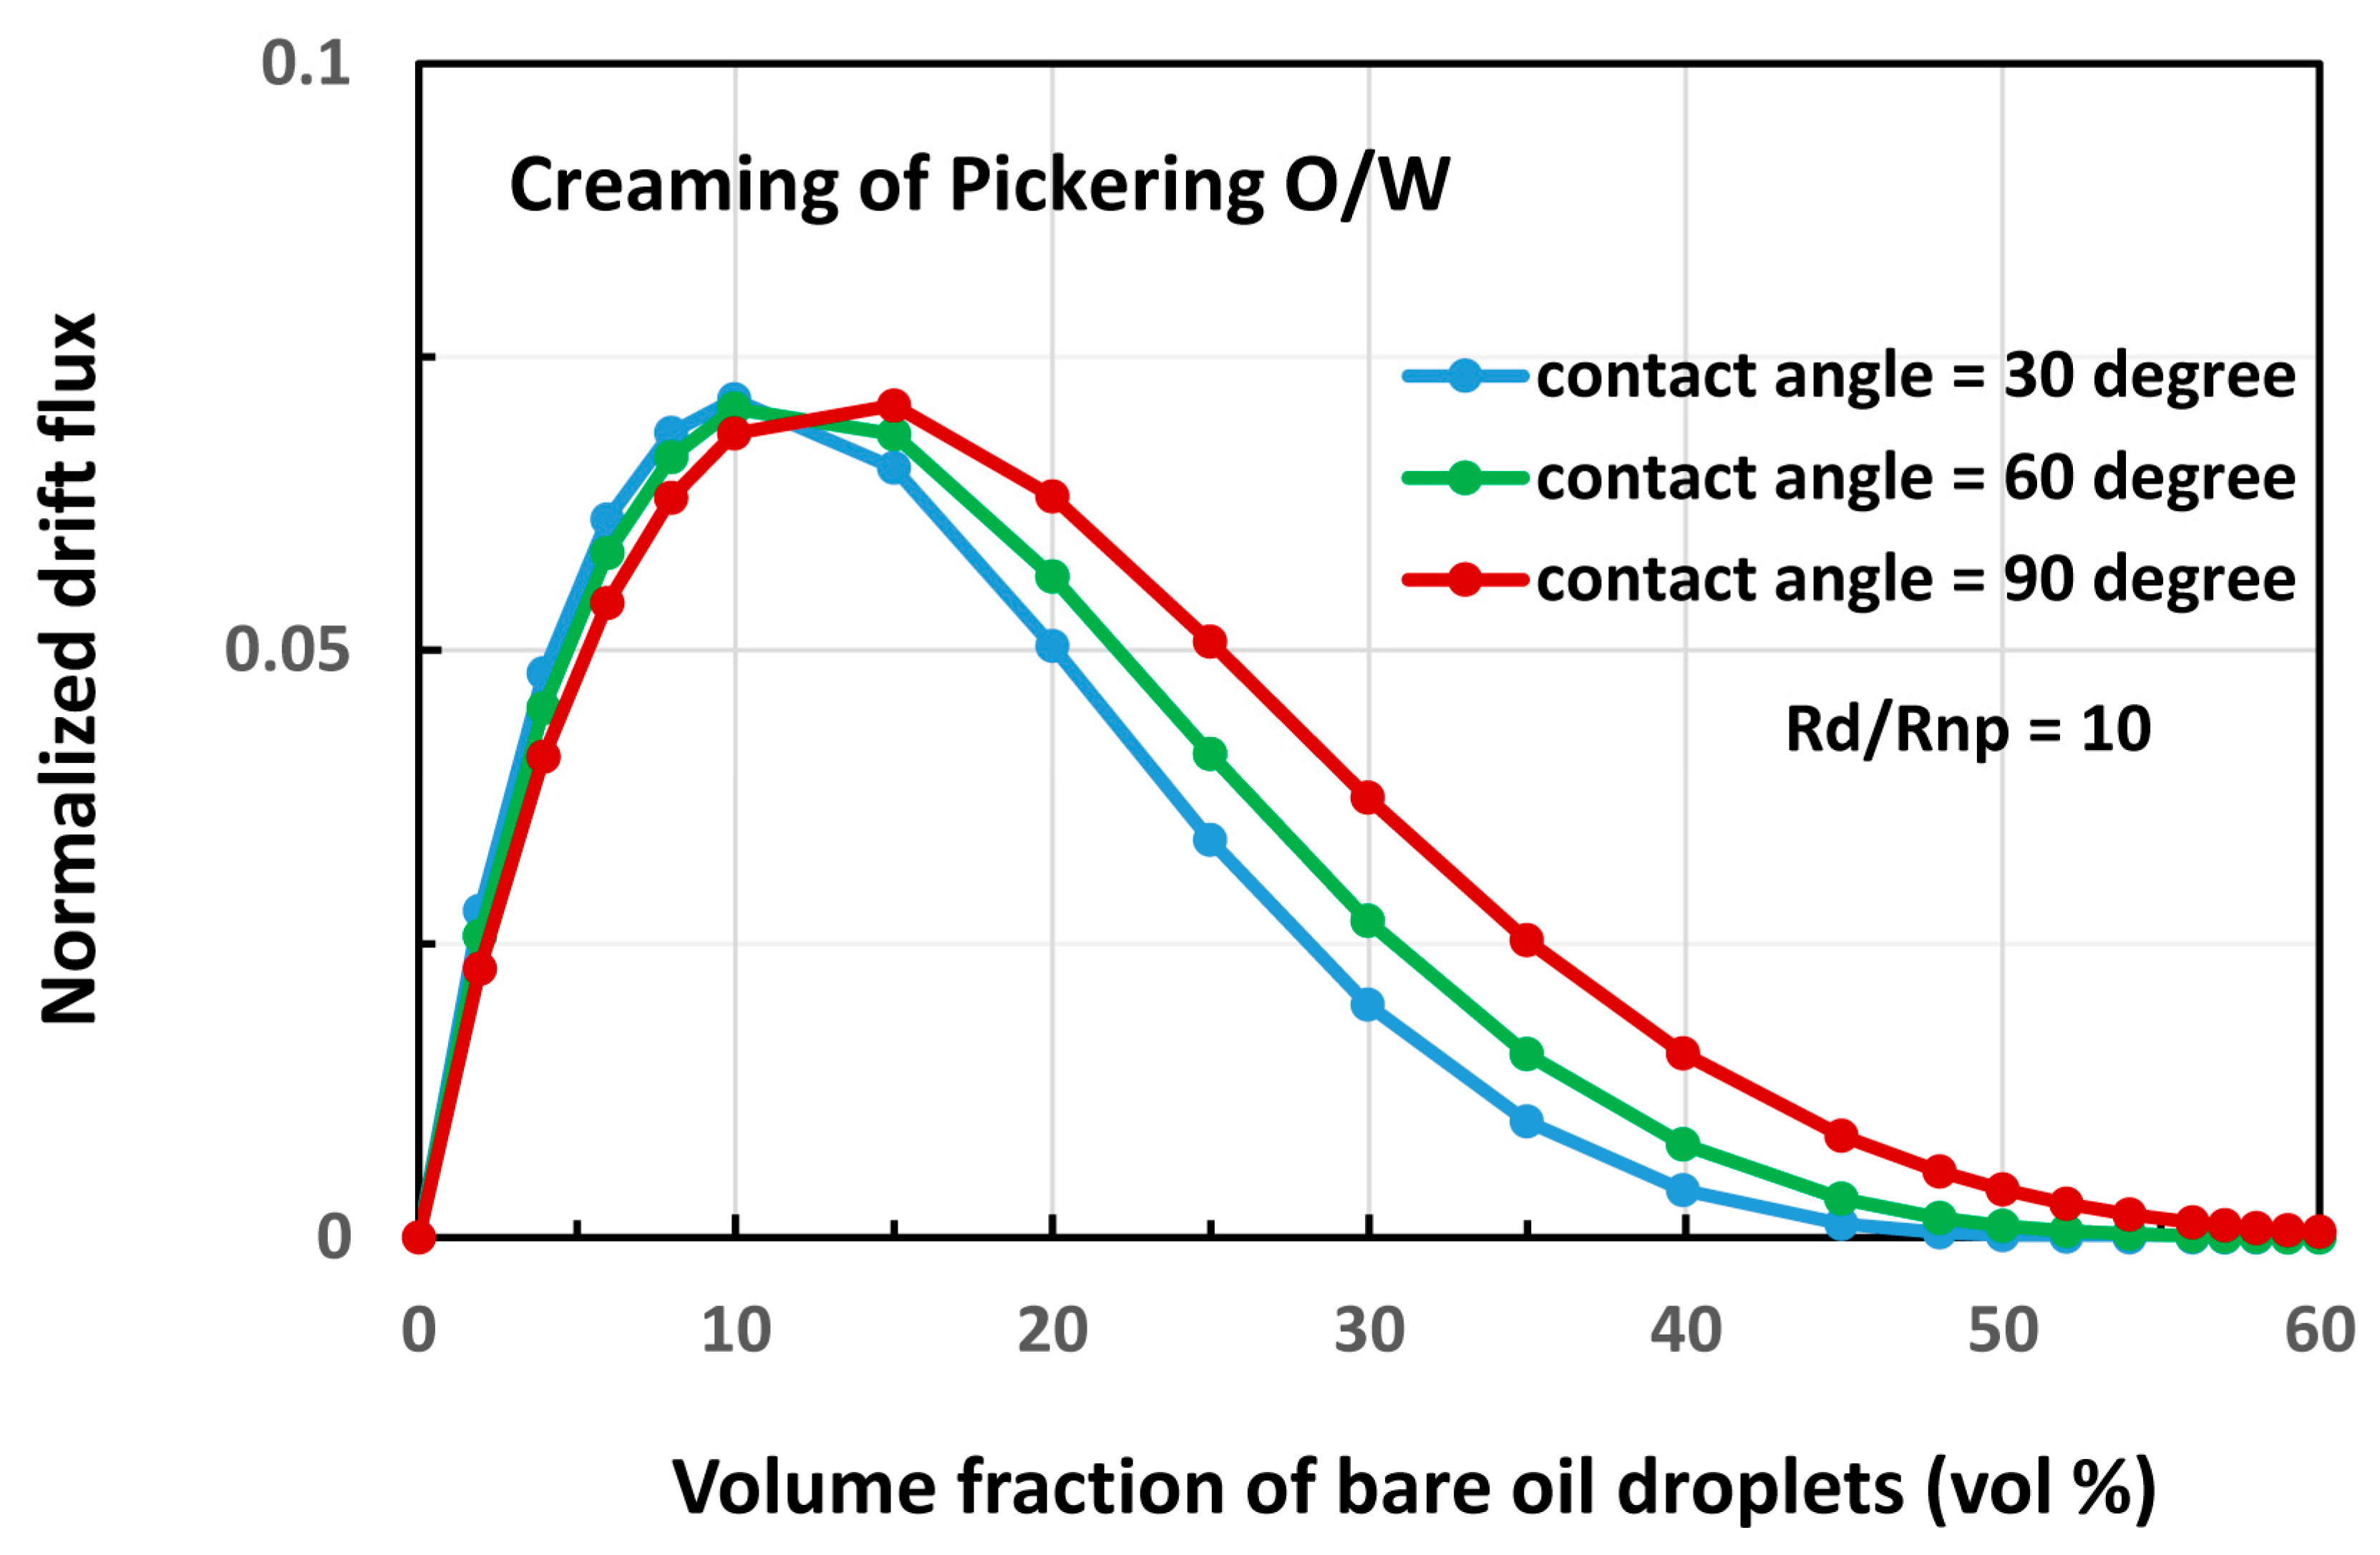
4.4. Drift Flux of Emulsions
5. Conclusions
Funding
Conflicts of Interest
Notation
| A | parameter in Equation (13) |
| projected area of particle | |
| B | parameter in Equation (13) |
| drag coefficient | |
| diameter of particle | |
| buoyance force on the particle | |
| drag force on the particle | |
| gravity force (weight) on the particle | |
| net force on the particle | |
| g | acceleration due to gravity |
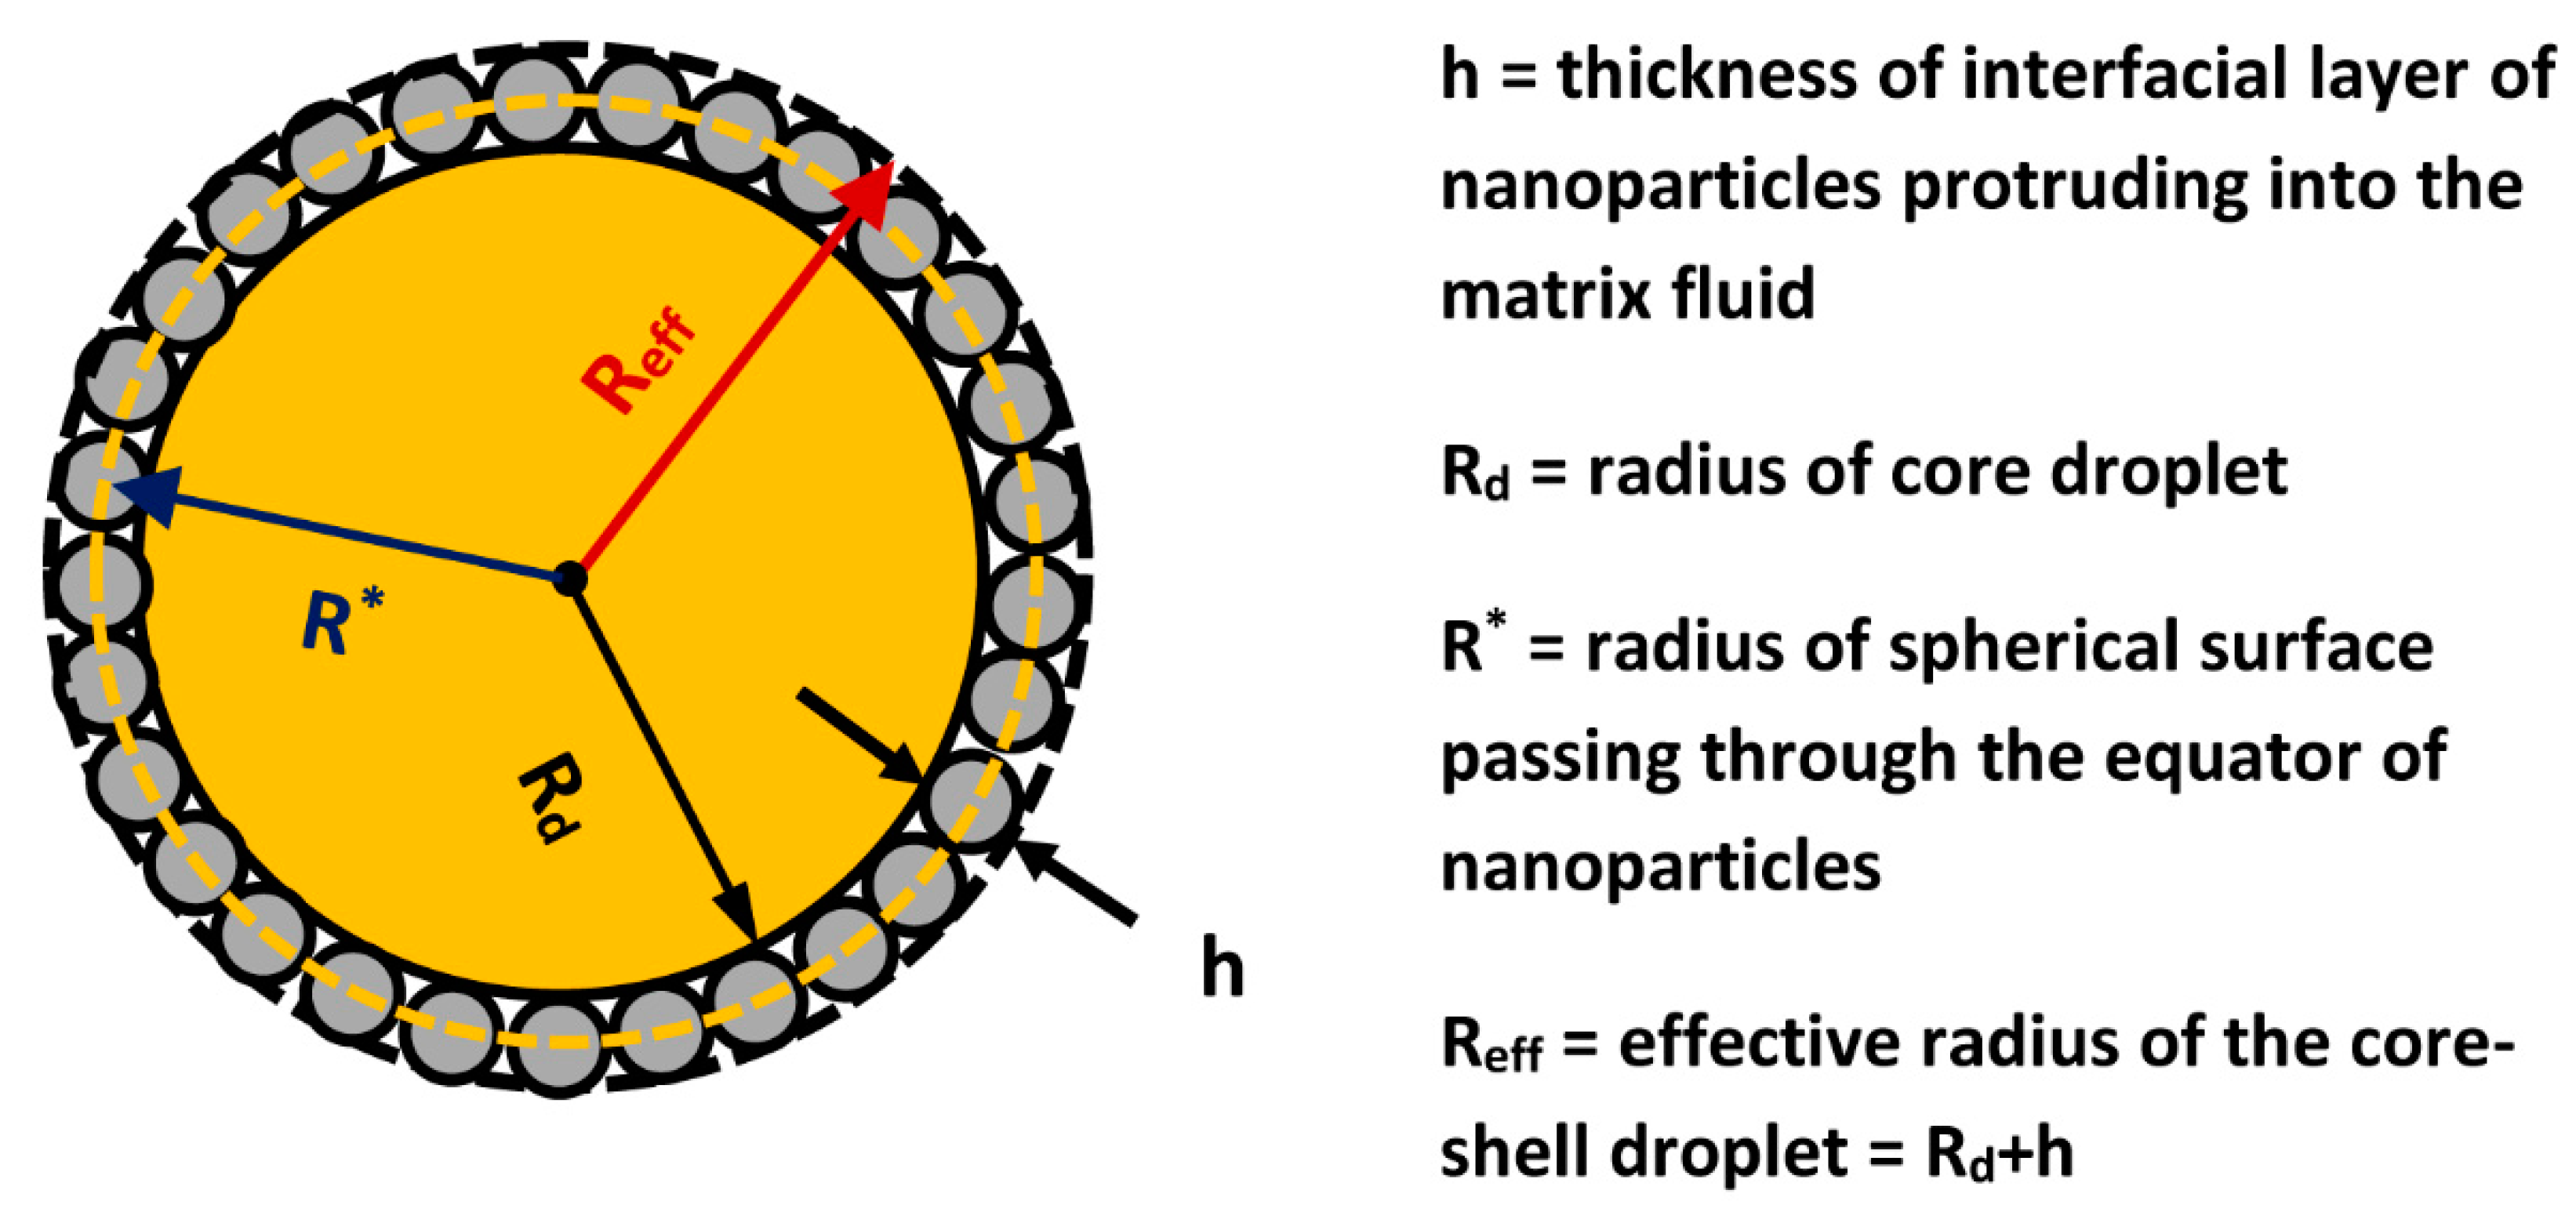
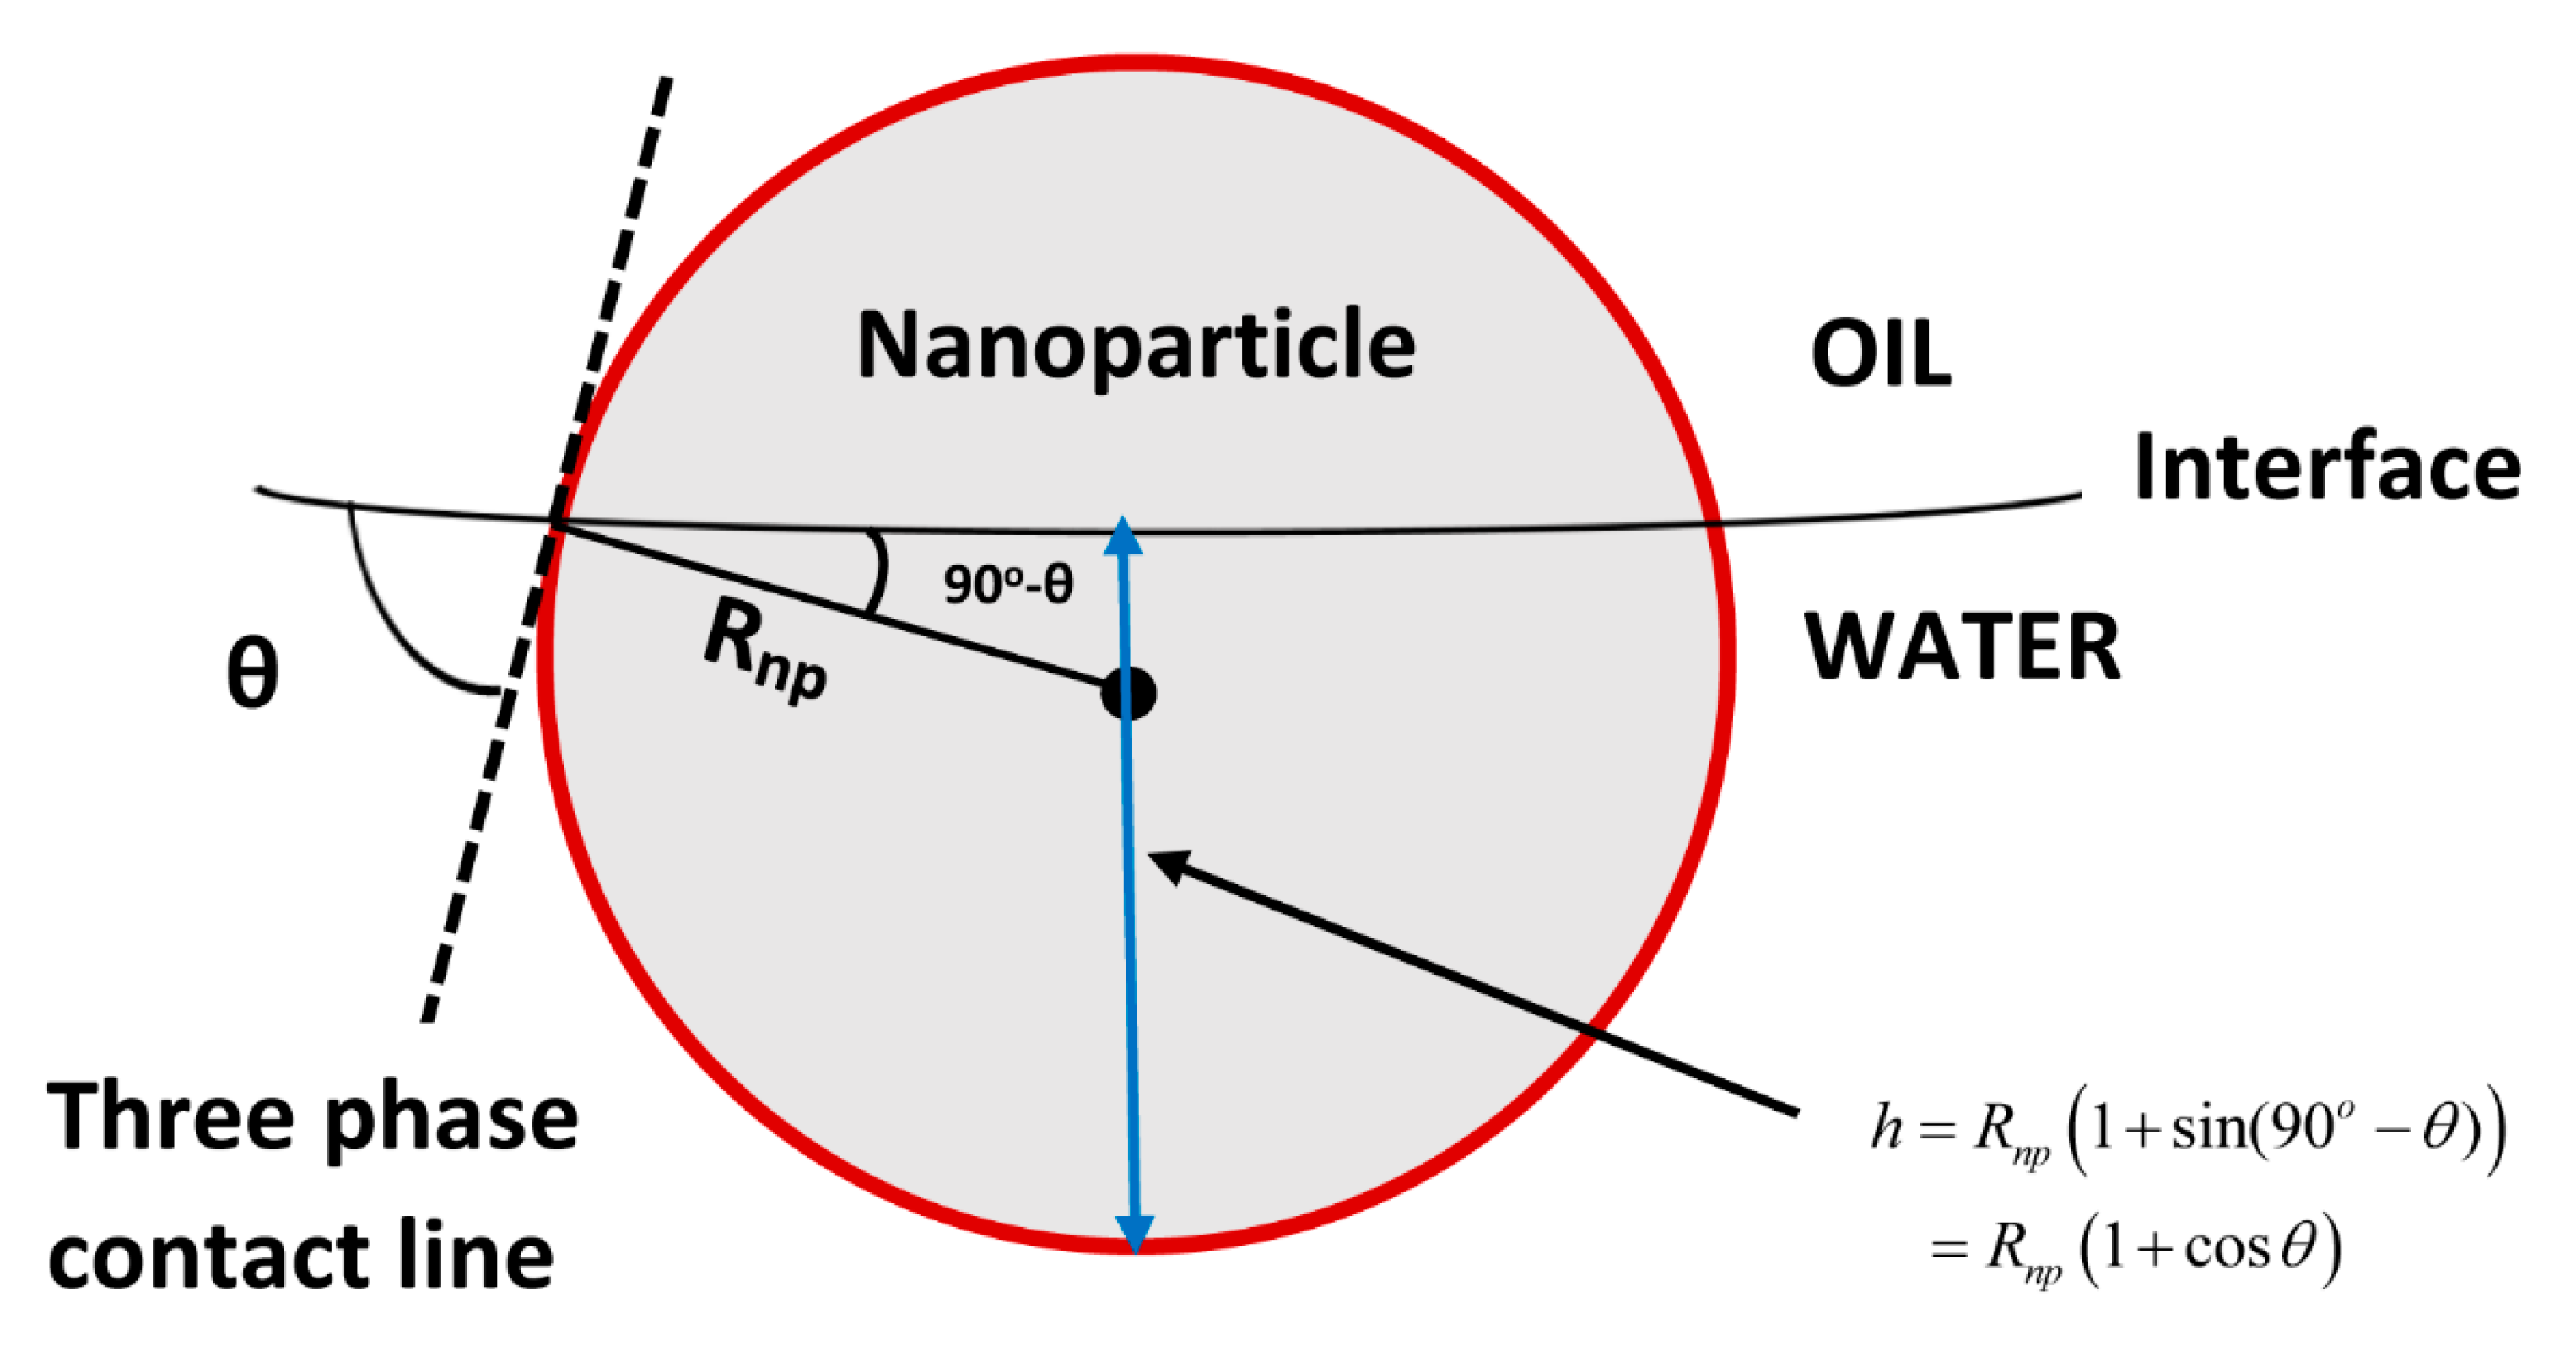
| h | thickness of interfacial layer of nanoparticles protruding into the matrix fluid |
| volumetric flux of liquid phase (units of velocity) | |
| volumetric flux of particles (units of velocity) | |
| drift flux of particles (units of velocity) | |
| normalized drift flux of particles | |
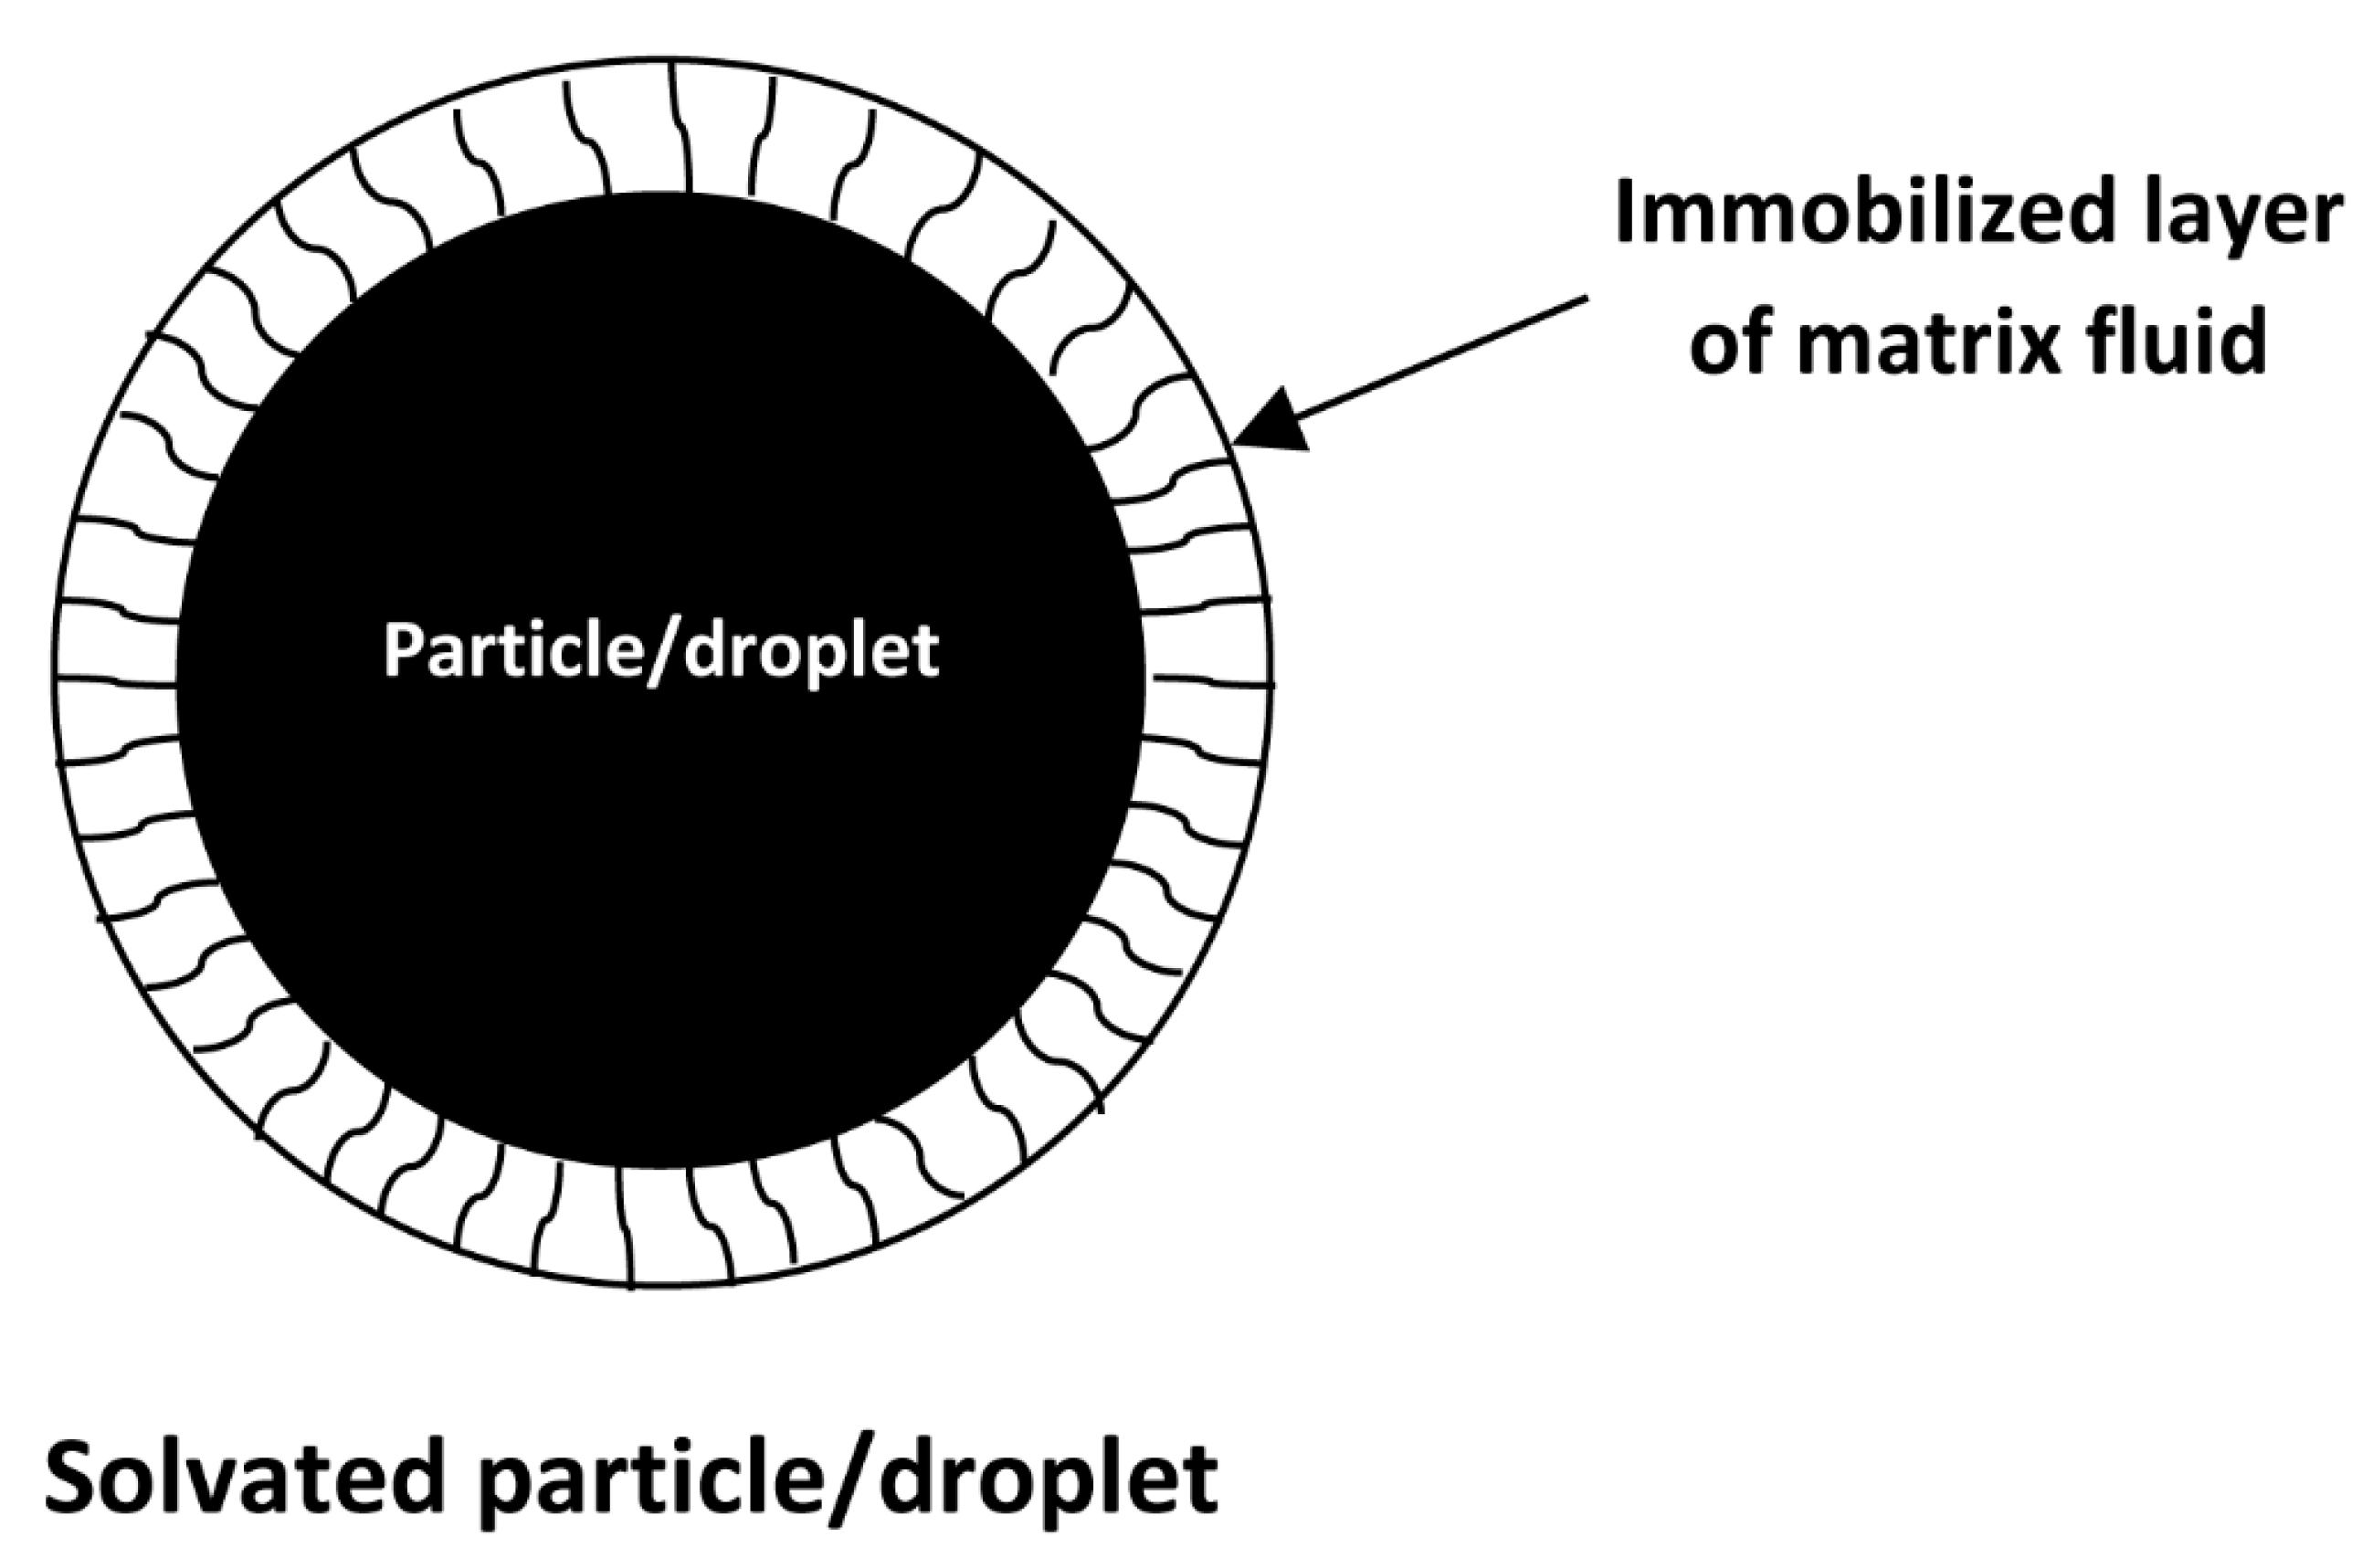
| solvation coefficient | |
| mass | |
| n | exponent in Richarson and Zaki correlation, Equation (12) |
| N | number of nanoparticles loaded on the Pickering droplet |
| O/W | oil-in-water |
| R | radius of particle |
| radius of core (bare) droplet | |
| effective radius of composite (Pickering) droplet | |
| radius of nanoparticles | |
| radius of spherical surface passing through the equator of nanoparticles (see Figure 10) | |
| particle Reynolds number | |
| t | time |
| U | velocity |
| normalized drift velocity of particle | |
| liquid phase velocity | |
| mixture (suspension) velocity | |
| unhindered terminal velocity of particle | |
| settling velocity of particle in suspension (hindered settling) | |
| drift velocity of particle | |
| dimensionless velocity defined in Equation (14) | |
| slip velocity between particle and matrix fluid | |
| W/O | water-in-oil |
| coefficient in Equation (11) | |
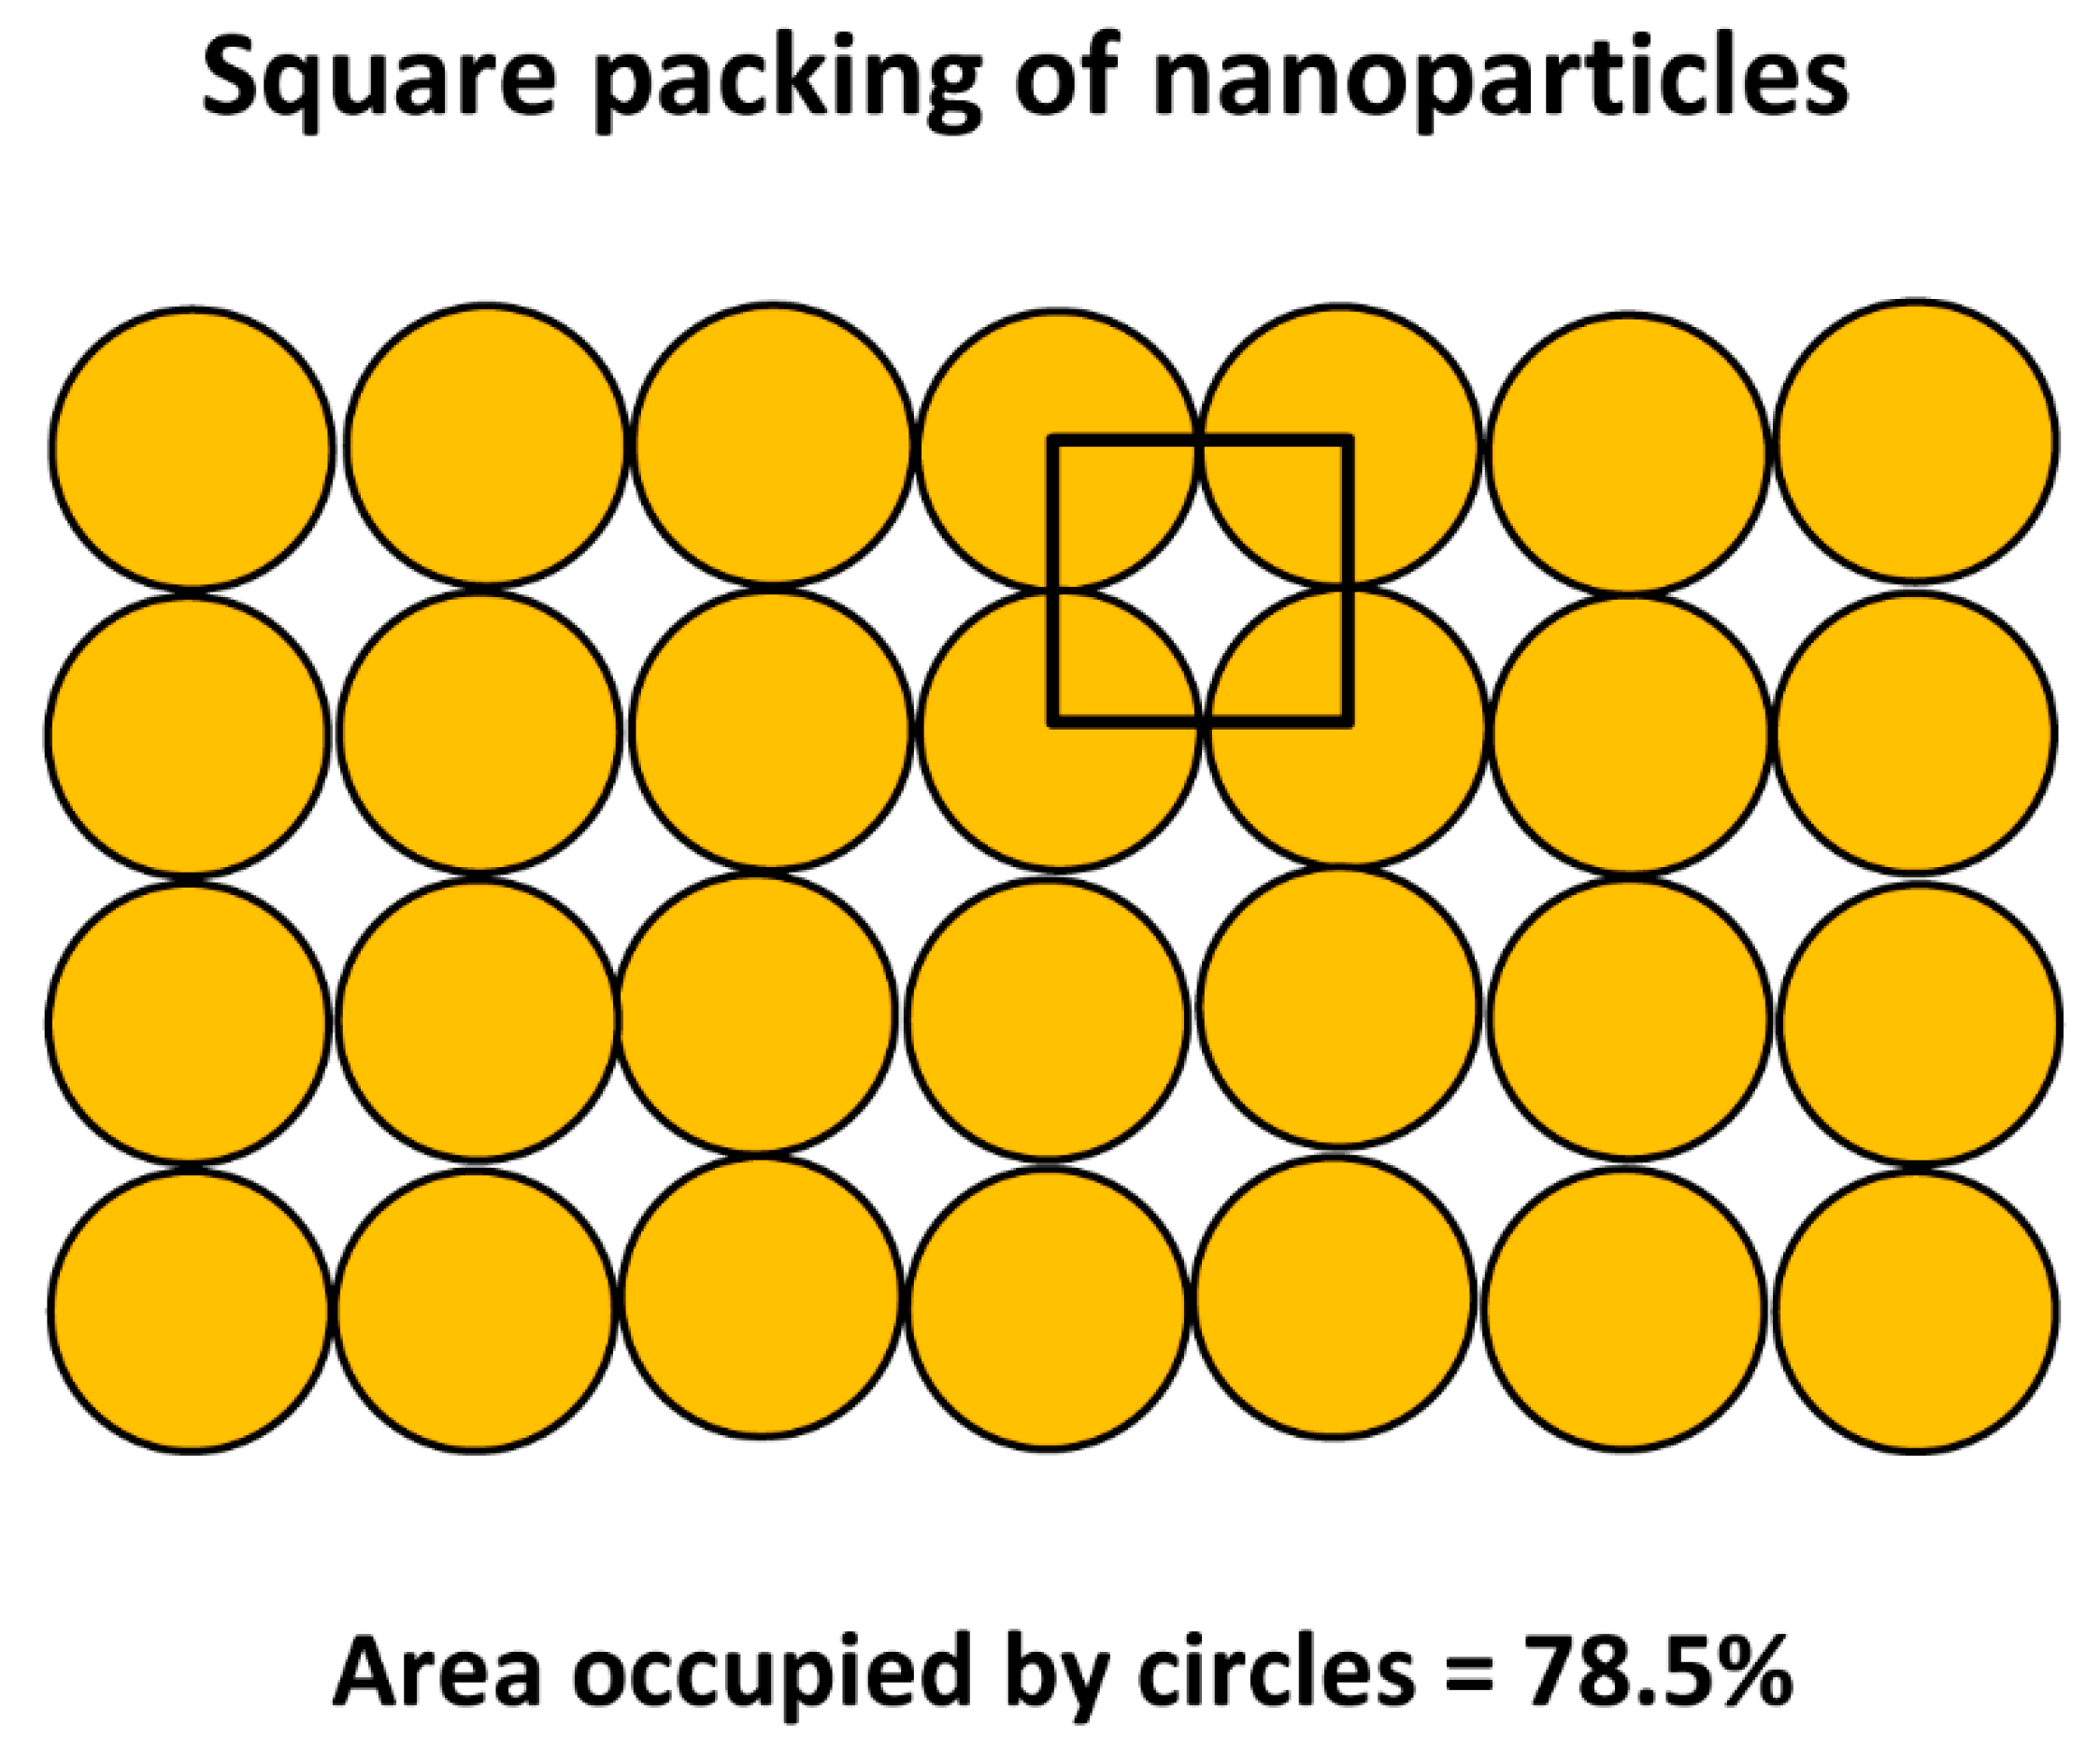
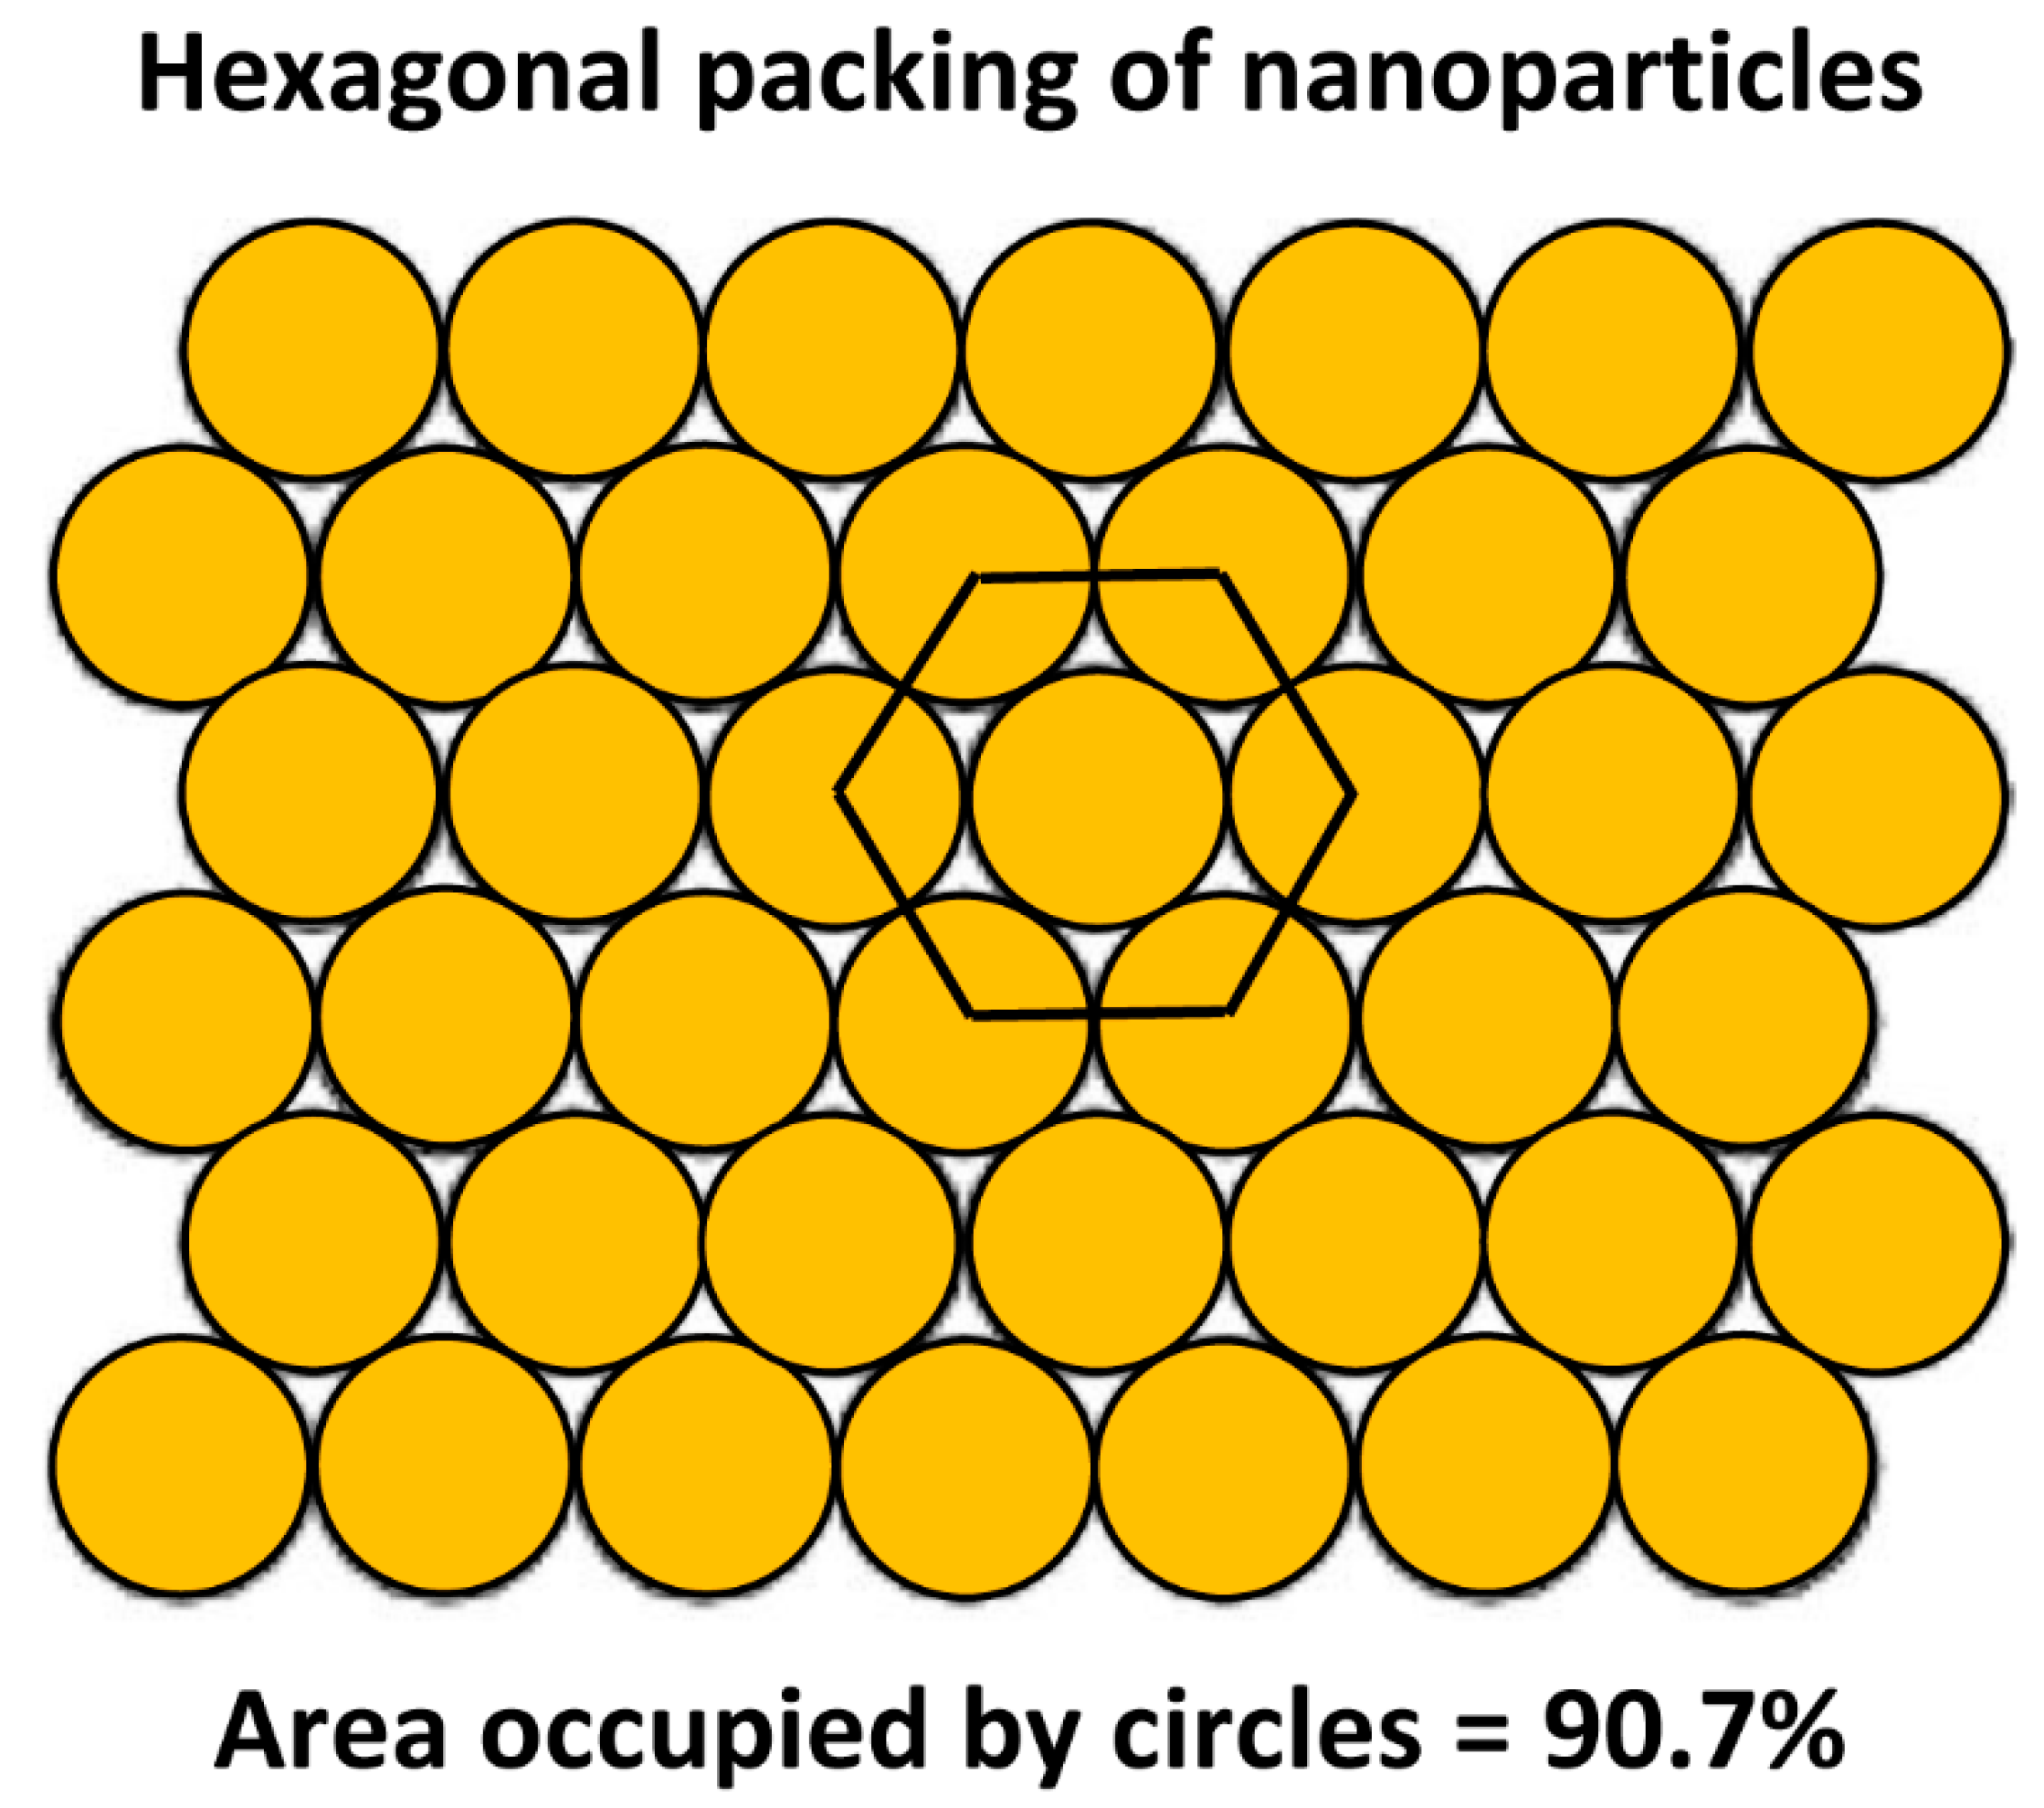
| packing density of nanoparticles at the oil-water interface | |
| thickness of solvation layer | |
| volume fraction of fluid in a suspension | |
| actual volume fraction of particles/droplets | |
| effective volume fraction of particles/droplets | |
| µ | viscosity of matrix fluid |
| density of matrix fluid | |
| effective density of composite (Pickering) droplet | |
| density of nanoparticle | |
| density of oil | |
| density of particle | |
| density of water | |
| contact angle |
References
- Pal, R. Rheology of Particulate Dispersions and Composites; CRC Press: Boca Raton, FL, USA, 2007. [Google Scholar]
- Wu, J.; Ma, G.H. Recent studies of Pickering emulsions: Particles make the difference. Small 2006, 12, 4633–4648. [Google Scholar] [CrossRef] [PubMed]
- Yang, Y.; Fang, Z.; Chen, X.; Zhang, W.; Xie, Y.; Chen, Y.; Liu, Z.; Yuan, W. An overview of Pickering emulsions: Solid-particle materials, classification, morphology, and applications. Front. Pharmacol. 2017, 3, 287. [Google Scholar] [CrossRef] [PubMed]
- Berton-Carabin, C.C.; Schroen, K. Pickering emulsions for food applications: Background, trends, and challenges. Ann. Rev. Food Sci. Technol. 2015, 6, 263–297. [Google Scholar] [CrossRef] [PubMed]
- Chevalier, Y.; Bolzinger, M.A. Emulsions stabilized with solid nanoparticles: Pickering emulsions. Colloids Surf. 2013, 439, 23–34. [Google Scholar] [CrossRef]
- Dickinson, E. Use of nanoparticles and microparticles in the formation and stabilization of food emulsions. Trends Food Sci. Technol. 2012, 24, 4–12. [Google Scholar] [CrossRef]
- Dickinson, E. Food emulsions and foams: Stabilization by particles. Curr. Opin. Colloid Interface Sci. 2010, 15, 40–49. [Google Scholar] [CrossRef]
- Binks, B.P. Colloidal particles at a range of fluid-fluid interfaces. Langmuir 2017, 33, 6947–6963. [Google Scholar] [CrossRef]
- Tarimala, S.; Wu, C.Y.; Dai, L.L. Pickering emulsions—A paradigm shift. In Proceedings of the AIChE Annual Meeting Conference Proceedings 2005, Cincinnati, OH, USA, 30 October–4 November 2005. [Google Scholar]
- Pal, R. A simple model for the viscosity of Pickering emulsions. Fluids 2018, 3, 2. [Google Scholar] [CrossRef]
- Bains, U.; Pal, R. In-situ continuous monitoring of the viscosity of surfactant-stabilized and nanoparticles-stabilized Pickering emulsions. Appl. Sci. 2019, 9, 4044. [Google Scholar] [CrossRef]
- Rozynek, Z.; Bielas, R.; Jozefczak, A. Efficient formation of oil-in-oil Pickering emulsions with narrow size distributions by using electric fields. Soft Matter 2018, 14, 5140–5149. [Google Scholar] [CrossRef]
- Timgren, A.; Rayner, M.; Dejmek, P.; Marku, D.; Sjoo, M. Emulsion stabilizing capacity of intact starch granules modified by heat treatment or octenyl succinic anhydride. Food Sci. Nutr. 2013, 1, 157–171. [Google Scholar] [CrossRef] [PubMed]
- Zoppe, J.O.; Venditti, R.A.; Rojas, O.J. Pickering emulsions stabilized by cellulose nanocrystals grafted with thermos-responsive polymer brushes. J. Colloid Interface Sci. 2012, 369, 202–209. [Google Scholar] [CrossRef] [PubMed]
- Chen, X.; Song, X.; Huang, J.; Wu, C.; Ma, D.; Tian, M.; Jiang, H.; Huang, P. Phase behavior of Pickering emulsions stabilized by graphene oxide sheets and resins. Energy Fuels 2017, 31, 13439–13447. [Google Scholar] [CrossRef]
- Binks, B.P.; Fletcher, P.D.I.; Holt, B.L.; Beaussoubre, P. Phase inversion of particle-stabilized perfume oil-water emulsions: Experiment and theory. Phys. Chem. Chem. Phys. 2010, 12, 11954–11966. [Google Scholar] [CrossRef] [PubMed]
- Fournier, C.O.; Fradette, L.; Tanguy, P.A. Effect of dispersed phase viscosity on solid-stabilized emulsions. Chem. Eng. Res. Des. 2009, 87, 499–506. [Google Scholar] [CrossRef]
- Tsabet, E.; Fradette, L. Effect of the properties of oil, particles, and water on the production of Pickering emulsions. Chem. Eng. Res. Des. 2015, 97, 9–17. [Google Scholar] [CrossRef]
- Simon, S.; Theiler, S.; Knudsen, A.; Oye, G.; Sjoblom, J. Rheological properties of particle-stabilized emulsions. J. Dispers. Sci. Technol. 2010, 31, 632–640. [Google Scholar] [CrossRef]
- Li, C.; Liu, Q.; Mei, Z.; Wang, J.; Xu, J.; Sun, D. Pickering emulsions stabilized by paraffin wax and laponite clay particles. J. Colloid Interface Sci. 2009, 336, 314–321. [Google Scholar] [CrossRef]
- Leclercq, L.; Nardello-Rataj, V. Pickering emulsions based on cyclodextrinx: A smart solution for antifungal azole derivatives topical delivery. Eup. J. Pharm. Sci. 2016, 82, 126–137. [Google Scholar] [CrossRef]
- Crossley, S.; Faria, J.; Shen, M.; Resasco, D.E. Solid nanoparticles that catalyze biofuel upgrade reactions at the water/oil interface. Science 2010, 327, 68–72. [Google Scholar] [CrossRef]
- Yang, B.; Leclercq, L.; Clacens, J.M.; Nardello-Rataj, V. Acidic/amphiphilic silica nanoparticles: New eco-friendly Pickering interfacial catalysis for biodiesel production. Green Chem. 2017, 19, 4552–4562. [Google Scholar] [CrossRef]
- Pera-Titus, M.; Leclercq, L.; Clacens, J.M.; De Campo, F.; Nardello-Rataj, V. Pickering interfacial catalysis for biphasic systems: From emulsion design to green reactions. Angew. Chem. Int. Ed. 2015, 54, 2006–2021. [Google Scholar] [CrossRef]
- Leclercq, L.; Company, R.; Muhlbauer, A.; Mouret, A.; Aubry, J.M.; Nardello-Rataj, V. Versatile eco-friendly Pickering emulsions based on substrate/native cyclodextrin complexes: A winning approach for solvent-free oxidations. ChemSusChem 2013, 6, 1533–1540. [Google Scholar] [CrossRef] [PubMed]
- Leclercq, L.; Mouret, A.; Proust, A.; Schmitt, V.; Bauduin, P.; Aubry, J.M.; Nardello-Rataj, V. Pickering emulsions stabilized by catalytic polyoxometalate nanoparticles: A new effective medium for oxidation reactions. Chem. Eur. J. 2012, 18, 14352–14358. [Google Scholar] [CrossRef] [PubMed]
- Kaptay, G. On the equation of the maximum capillary pressure induced by solid particles to stabilize emulsions and foams and on the emulsion stability diagrams. Colloids Surf. A 2006, 282/283, 387–401. [Google Scholar] [CrossRef]
- Katepalli, H.; John, V.T.; Tripathi, A.; Bose, A. Microstructure and rheology of particle stabilized emulsions: Effects of particle shape and inter-particle interactions. J. Colloid Interface Sci. 2017, 485, 11–17. [Google Scholar] [CrossRef]
- Braisch, B.; Kohler, K.; Schuchmann, H.P.; Wolf, B. Preparation and flow behavior of oil-in-water emulsions stabilized by hydrophilic silica particles. Chem. Eng. Technol. 2009, 32, 1107–1112. [Google Scholar] [CrossRef]
- Ganley, W.J.; Van Duijneveldt, J.S. Controlling the rheology of montmorillonite stabilized oil-in-water emulsions. Langmuir 2017, 33, 1679–1686. [Google Scholar] [CrossRef]
- Hermes, M.; Clegg, P.S. Yielding and flow of concentrated Pickering emulsions. Soft Matter 2013, 9, 7568–7575. [Google Scholar] [CrossRef]
- Ogunlaja, S.B.; Pal, R.; Sarikhani, K. Effects of starch nanoparticles on phase inversion of Pickering emulsions. Can. J. Chem. Eng. 2018, 96, 1089–1097. [Google Scholar] [CrossRef]
- Malhotra, V.; Pal, R.; Alhassan, S. Catastrophic phase inversion of emulsions stabilized by amphiphilic nanoparticles. J. Nanofluids 2018, 7, 30–36. [Google Scholar] [CrossRef]
- Pal, R.; Malhotra, V. Influence of hybrid nanoparticle-surfactant stabilizers on catastrophic phase inversion of emulsions. J. Nanofluids 2018, 7, 300–308. [Google Scholar] [CrossRef]
- Sihler, S.; Schrade, A.; Cao, Z.; Ziener, U. Inverse Pickering Emulsions with Droplet Sizes below 500 nm. Langmuir 2015, 31, 10392–10401. [Google Scholar] [CrossRef] [PubMed]
- Becher, P. Emulsions: Theory and Practice; Reinhold Publishing Corp: New York, NY, USA, 1957. [Google Scholar]
- Robins, M.M. Emulsions-creaming phenomena. Curr. Opin. Colloid Interface Sci. 2000, 5, 265–272. [Google Scholar] [CrossRef]
- Becher, P. (Ed.) Encyclopedia of Emulsion Technology: Basic Theory; Marcel Dekker: New York, NY, USA, 1983. [Google Scholar]
- Batchelor, G.K. Sedimentation in a dilute dispersion of spheres. J. Fluid Mech. 1972, 52, 245–268. [Google Scholar] [CrossRef] [Green Version]
- Richardson, J.F.; Zaki, W.N. Sedimentation and fluidization. Trans. Inst. Chem. Eng. 1954, 32, 35–53. [Google Scholar]
- Garside, J.; Al-Dibouni, M.R. Velocity-voidage relationships for fluidization and sedimentation in solid-liquid systems. Ind. Eng. Chem. Process Des. Dev. 1977, 16, 206–214. [Google Scholar] [CrossRef]
- Al-Naafa, M.A.; Sami Selim, M. Sedimentation of monodisperse and bidisperse hard-sphere colloidal suspensions. AIChE J. 1992, 38, 1618–1630. [Google Scholar] [CrossRef]
- Chanamai, R.; McClements, D.J. Dependence of creaming and rheology of monodisperse oil-in-water emulsions on droplet size and concentration. Coll. Surf. A Physicochem. Eng. Asp. 2000, 172, 79–86. [Google Scholar] [CrossRef]
- Nicolai, H.; Herzhaft, B.; Hinch, E.J.; Oger, L.; Guazzelli, E. Particle velocity fluctuations and hydrodynamic self-diffusion of sedimenting non-Brownian spheres. Phys. Fluids 1995, 7, 12–23. [Google Scholar] [CrossRef]
- Buscall, R.; Goodwin, J.W.; Ottewill, R.H.; Tadros, T.F. The settling of particles through Newtonian and non-Newtonian media. J. Colloid Interface Sci. 1982, 85, 78–86. [Google Scholar] [CrossRef]
- Davis, R.H.; Birdsell, K.H. Hindered settling of semidilute monodisperse and polydisperse suspensions. AIChE J. 1988, 34, 123–129. [Google Scholar] [CrossRef]
- Davis, K.E.; Russel, W.B.; Glantschnig, W.J. Settling suspensions of colloidal silica: Observations and x-ray measurements. J. Chem. Soc. Faraday Trans. 1991, 87, 411–424. [Google Scholar] [CrossRef]


| Set No. | Dispersion Type | Creaming or Sedimentation | Particle Volume Fraction | Particle Mean Diameter | Reference |
|---|---|---|---|---|---|
| 1 | emulsion | creaming | 0–0.40 | 1.72 µm | Chanamai & McClements [43] |
| 2 | emulsion | creaming | 0–0.40 | 0.86 µm | Chanamai & McClements [43] |
| 3 | suspension | sedimentation | 0–0.40 | 788 µm | Nicolai et al. [44] |
| 4 | suspension | sedimentation | 0–0.48 | 3.1 µm | Buscall et al. [45] |
| 5 | suspension | sedimentation | 0–0.15 | 136 µm | Davis & Birdsell [46] |
| 6 | suspension | sedimentation | 0–0.53 | 0.27–0.31 µm | Davis et al. [47] |
| Set No. | Dispersion Type | Creaming or Sedimentation | Solvation Coefficient, ks | Particle Mean Radius, R | Solvation Layer Thickness, δ |
|---|---|---|---|---|---|
| 1 | emulsion | creaming | 1.40 | 0.86 µm | 0.102 µm |
| 2 | emulsion | creaming | 1.30 | 0.43 µm | 0.039 µm |
| 3 | suspension | sedimentation | 1.0 | 394 µm | 0 µm |
| 4 | suspension | sedimentation | 1.14 | 1.55 µm | 0.069 µm |
| 5 | suspension | sedimentation | 1.11 | 68 µm | 2.41 µm |
| 6 | suspension | sedimentation | 1.0 | 0.13–0.155 µm | 0 µm |
© 2019 by the author. Licensee MDPI, Basel, Switzerland. This article is an open access article distributed under the terms and conditions of the Creative Commons Attribution (CC BY) license (http://creativecommons.org/licenses/by/4.0/).
Share and Cite
Pal, R. Modeling of Sedimentation and Creaming in Suspensions and Pickering Emulsions. Fluids 2019, 4, 186. https://doi.org/10.3390/fluids4040186
Pal R. Modeling of Sedimentation and Creaming in Suspensions and Pickering Emulsions. Fluids. 2019; 4(4):186. https://doi.org/10.3390/fluids4040186
Chicago/Turabian StylePal, Rajinder. 2019. "Modeling of Sedimentation and Creaming in Suspensions and Pickering Emulsions" Fluids 4, no. 4: 186. https://doi.org/10.3390/fluids4040186
APA StylePal, R. (2019). Modeling of Sedimentation and Creaming in Suspensions and Pickering Emulsions. Fluids, 4(4), 186. https://doi.org/10.3390/fluids4040186