Article

Wind Turbine Wake Modeling in Accelerating Wind Field: A Preliminary Study on a Two-Dimensional Hill

1
Interdisciplinary Graduate School of Engineering Sciences, Kyushu University, 6-1 Kasuga-koen, Kasuga, Fukuoka 816-8580, Japan
2
Research Institute for Applied Mechanics, Kyushu University, 6-1 Kasuga-koen, Kasuga, Fukuoka 816-8580, Japan
*
Author to whom correspondence should be addressed.
Fluids 2019, 4(3), 153; https://doi.org/10.3390/fluids4030153
Submission received: 12 June 2019 / Revised: 10 July 2019 / Accepted: 6 August 2019 / Published: 9 August 2019
(This article belongs to the Special Issue Turbomachinery Flow Analysis)

Abstract

:
Complex terrain can influence wind turbine wakes and wind speed profiles in a wind farm. Consequently, predicting the performance of wind turbines and energy production over complex terrain is more difficult than it is over flat terrain. In this preliminary study, an engineering wake model, that considers acceleration on a two-dimensional hill, was developed based on the momentum theory. The model consists of the wake width and wake wind speed. The equation to calculate the rotor thrust, which is calculated by the wake wind speed profiles, was also formulated. Then, a wind-tunnel test was performed in simple flow conditions in order to investigate wake development over a two-dimensional hill. After this the wake model was compared with the wind-tunnel test, and the results obtained by using the new wake model were close to the wind-tunnel test results. Using the new wake model, it was possible to estimate the wake shrinkage in an accelerating two-dimensional wind field.

Graphical Abstract

1. Introduction

Wind speed decreases as upstream wind turbines extract wind kinetic energy in a wind farm. As a consequence, the power output of downstream turbines drastically decreases [1,2]. This power output reduction of downstream turbines could be 10–40%, depending on the approaching wind flow on a wind farm and the wind direction [3,4,5].
Over the last decade, more onshore wind farms were constructed over or near to complex terrain, such as hills and mountains. Complex terrain can affect wind flow, wind turbine performance and power output. The performance of a wind turbine placed at several locations over a hill, where wind speed profiles change significantly, was affected by the terrain [6,7,8]. Uchida et al. [9] show that the pitch control of a wind turbine is incapable of reacting properly to the wind speed variation that resulted from the terrain upstream of the wind farm. Complex terrain can have a negative impact upon the wind turbine life time. For example, Li et al. [10] show that varying wind speeds resulting from complex terrain is the reason for the recurrent failure of a wind turbine yaw system.
Flow over complex terrain was investigated in many previous studies. A wind-tunnel test [11] that examines the flow over a Gaussian hill shows higher hub height mean velocity and lower turbulence intensity at the top of a hill, compared to that downstream of the hill. Webster et al. [12] studied flow over a two-dimensional bump, and the study indicates that the boundary layer over the two-dimensional bump is different from that over a flat terrain.
Helmis et al. [13] investigated flow over a complex terrain, and the study suggests that applying a simple logarithmic extrapolation formula to calculate hub height wind speed can lead to unreliable results.
The flow over a hill is influenced by the roughness and steepness of the hill, where rough hills with steeper slopes are more likely to cause a flow separation downstream of the hill [14]. A number of linear flow models [15,16,17,18] have been developed to predict the flow field over hills; however, the validity of these linear flow models decreases significantly when considering the flow over hills with steeper slopes, and therefore these linear flow models can only be used to predict flow over hills of modest slopes [14]. Cao and Tamura [19] performed wind-tunnel tests to investigate the surface roughness effects on the flow over a two-dimensional steep hill, and the study shows that the speed-up ratio at the top of a rough hill is greater than that of a smooth hill, and the flow separation region of a rough hill extends farther downstream than that of a smooth hill. Also, for a rough hill, the position of the maximum turbulence intensity is located farther downstream than that for a smooth hill. Allen [20] studied the flow over hills with variable roughness, and the study indicates that the roughness change can either cause or prevent flow separation, depending on the location and size of the roughness change. Cao and Tamura [21] performed wind-tunnel tests to examine the effects of roughness blocks on the flow over a two-dimensional hill, and the study suggests that the velocity deficit and turbulence structure downstream of the hill are significantly affected by the number and location of roughness blocks on the hill surface or the upstream of the hill.
The terrain effect upon wind turbine wakes is investigated in several studies. Politis et al. [22] studied the wake development of a wind turbine placed over a Gaussian hill, and the study shows that the velocity deficit over a hill exists at farther distances than over a flat terrain. Makridis and Chick [23] conducted Computational Fluid Dynamics (CFD) simulations for wind turbines in complex terrain, where the wind turbine rotor was modeled as an Actuator Disc (AD), then the results were validated with measurements. Hansen et al. [24] studied wind turbine wake properties over complex terrain by examining high frequency time series measurements, and the study shows that complex terrain can greatly influence wind turbine wake. The influence of a complex terrain on the wakes of a group of four wind turbines was studied through numerical and experimental data [25,26], and the study shows that the wake of the upstream turbine is distorted due to the terrain effect, and as a result, the upstream wake recovers faster than what would occur over flat terrain. Hyvärinen and Segalini [27,28] studied wind turbine wake development over sinusoidal hills through a wind-tunnel test and numerical simulations, and the results show a faster wake recovery over the hilly terrain. The Large Eddy Simulation (LES) model was used for wake modeling, where the wind turbine rotor was modeled as an AD [29] and an Actuator Line (AL) [30], then the simulation results were compared with the wind-tunnel tests, achieving a good agreement. The LES model was also used in [31,32] to simulate wind-turbine wakes over complex terrain. Literature reviews on wind turbine wake aerodynamics are reported by Vermeer et al. [33] and Sanderse [34]. The literature reviews include some experimental and numerical studies of wind turbine wakes over complex terrain.
Wind farm layout optimization using full scale experiments or numerical simulations, which include wind turbine rotors, is infeasible. Therefore, a simple engineering model, such as the Jensen wake model [35], is widely used for wind farm layout optimization. This Jensen wake model assumes that the wake expands linearly, and that the wake velocity is uniform. However, the Jensen wake model does not take into account the terrain effects. Feng and Shen [36] tried to adapt the Jensen wake model so that it can account for the terrain effects. The adapted Jensen wake model assumes that the wake expands linearly, and that the center of the wake follows the terrain shape along the streamwise direction. But the model includes a contradiction with the physics of fluid-dynamics, such as the conservation of momentum and of flow rate.
Considering the situation above, an engineering wake model which considers wind acceleration was developed based upon the momentum theory in Section 2. In Section 3, a wind-tunnel test was conducted in simple flow conditions, where a uniform approach-flow with a turbulence intensity less than 0.5% was used for this preliminary study, in order to investigate the effect of the hill on wake development. Then, the new wake model was compared with the wind-tunnel test in Section 4.

2. Formulation of the Wake Model

An engineering wake model, which considers acceleration on a two-dimensional hill, is formulated in this section based on the momentum theory. The model consists of the wake width and the wake wind speed. The equation to calculate the rotor thrust, which is calculated by the wake wind speed profiles, is also formulated.

2.1. Thrust Coefficient

In this subsection, the thrust and the thrust coefficient equations will be formulated to include the acceleration of the wind upstream of a steep two-dimensional hill. Figure 1a,b show the wind turbine wake over a flat terrain and a two-dimensional hill, respectively, where L is the hill half-length, and x is the streamwise direction. As the turbine extracts kinetic energy from the wind, the wind has to slow down and expand, and the mass flow rate has to be the same upstream and downstream of the turbine; therefore,
ρ S U =   ρ S R U R = ρ S W U W =   ρ S B U B
where ρ is the air density, S is the cross sectional area of the wind stream tube, and U is the wind velocity. The subscript is relevant to the circumstances upstream of the turbine, R is relevant to the circumstances at the rotor, W is relevant to the circumstances in the wake (between the rotor and x =L), and B is relevant to the circumstances between x =L and x = 0.
The momentum loss in the wake caused by the rotor ( m B ) is as follows:
m B = ρ U B 0 2 U B U B 0 ( 1 U B U B 0 ) d S B = ρ U B 0 2 S B ν B ( 1 ν B )
where, U B 0 is the wind velocity outside the wake at location B, and ν B = U B / U B 0 .
Since the terrain causes the wind velocity to change from U W to U B as shown in Figure 1b, therefore, the rate of change of momentum caused by the terrain ( m T ) is as follows:
m T = ρ S B U B 2 ρ S W U W 2 = ρ U B 2 S B ( 1 1 σ ) = ρ U B 0 2 S B ν B 2 ( 1 1 σ )
where, σ = U B / U W .
Therefore, the net force that acts upon the wind stream tube can be represented as follows:
T =     m B   +   m T   =   ρ U B 0 2 S B ν B ( 1 ν B σ )
Therefore, the thrust coefficient calculated by the wake wind speed profile over the two-dimensional hill ( C T   H i l l ) can be as follows:
C T   H i l l =   ρ U B 0 2 S B ν B ( 1 ν B σ ) 1 2 ρ U 2 S R = 2 σ 0 2 S ¯ ν B ( 1 ν B σ )
where, σ 0 = U B 0 / U , and S ¯ = S B / S R .
This wake model does not assume a certain terrain slope, however, Equation (3) represents the rate of change of momentum caused by the terrain ( m T ). So, if the slope of the terrain changes, the m T value will change.

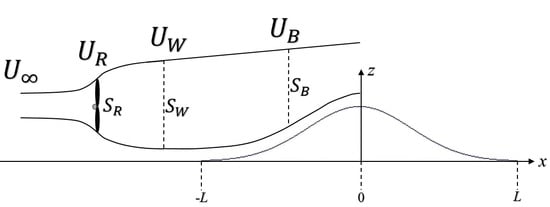
2.2. Wake Development over a Two-Dimensional Hill

The rotor thrust can be represented as follows:
T =   ρ U 2 S R µ R ( 1 µ W )
where µ R = U R / U , and µ W = U W / U .
Therefore, from Equations (4) and (6),
S ¯ = ν R ( 1 σ 0 σ ν B ) σ 0 2 ν B ( 1 ν B σ )
where, ν R = U R / U R 0 = U R / U .

3. Wind-Tunnel Testing

A wind-tunnel test was conducted to investigate the wake development over a two-dimensional hill in simple flow conditions, where a uniform approach-flow with turbulence intensity less than 0.5% was used. Conducting the wind-tunnel test in such simple flow conditions was necessary for this preliminary study in order to investigate the effect of the hill on wake development and evaluate the new wake model without the influence of the atmospheric boundary layer (ABL) or the ground roughness.

3.1. Test Facility

The test was conducted in the boundary layer wind tunnel (Figure 2) at the Research Institute of Applied Mechanics of Kyushu University [37]. The wind tunnel has a closed test section of 15 m length, 3.6 m width, and 2.0 m height. In this preliminary study, a uniform approach-flow with turbulence intensity less than 0.5% was used in the wind-tunnel test. Wind tunnel top walls were removed in Section 3, Section 4 and Section 5 (Figure 2) so as to minimize wind tunnel blockage effects [38,39].

3.2. Test Model

3.2.1. Wind Turbine Model

A three-bladed Horizontal Axis Wind Turbine (HAWT) was tested in the wind-tunnel facility as shown in Figure 3a. The turbine rotor diameter (D) was equal to 0.512 m, and the rotor was connected to an electric motor placed inside a nacelle. The blades of the wind turbine model were created using a 3D printer, and with the scale ratio of 1:175, the wind turbine test model would represent a wind turbine in a wind farm with a rotor diameter D which equals to about 89.6 m and a hub height that equals to about 89.6 m. The blade pitch angle of the wind turbine was fixed, and the wind turbine was maintained at a constant rotational speed. The rotational speed was set by the controller of the electric motor, and the rotor speed was measured by the built-in encoder. The nacelle was connected to a 6-component load cell to measure the forces and moments acting on and around the turbine in the x, y and z axes. Then, the load cell was connected to a steel pipe that is hung from the wind tunnel ceiling, and the steel pipe was streamlined using a streamline tube (Figure 3b) to minimize the wake of the pipe.

3.2.2. Terrain Model

Figure 4 shows a schematic diagram of the two-dimensional hill model. The hill surface was smooth, and it was made of ABS resin. The height of the hill was h = 512 mm (same as the hub height) and its half-length L = 1560 mm long. The hill is represented by Equation (8), where the slope of the hill a = 0.45. The two-dimensional hill model was created by using a wooden frame with a curve that is represented by Equation (8), then the wooden frame was covered with a sheet made of ABS resin. With the scale ratio of 1:175, the terrain test model would represent a hill with the hill height h equals to about 89.6 m. Several measurements were performed using a laser distance meter to measure the real height of the two-dimensional hill model tested in the wind tunnel. The maximum percentage difference between the real height (measured using the laser distance meter) and that calculated using Equation (8) was about 8%. The hill model was placed at about 0.12 m from wind tunnel floor, so as to impose a uniform flow condition avoiding the boundary layer on the floor of the wind tunnel.
z   =   h   e x p [ 1 2 ( x h / 2.3548 a ) 2 ]

3.3. Measurement

Wind speed profiles were measured using a standard straight hot wire anemometer. When the hot thin wire is placed perpendicular to the flow, the temperature of the thin wire changes. The change in temperature changes the wire resistance, and the flow velocity can be obtained by measuring the variation in resistance. The hot wire was mounted on a rod which was fixed to the traverse system of the wind tunnel, as shown in Figure 5. Measurements were made at several locations over the hill with an increment of L/4 along the streamwise direction (Table 1), vertically along the z-axis every 0.02 m, and horizontally along the y-axis at the hub height every 0.02 m. A sampling time of 30 s with a sampling frequency of 1 kHz was used to collect the flow velocity measurements. Forces and moments acting on and around the turbine in the x, y and z axes were measured using a 6-component load cell (Table 2) at several rotational speeds as shown in Table 3, in order to find the optimum tip speed ratio (λ). The tip speed ratio (λ) can be defined as in Equation (9), where ω is the rotor speed in rad/s, R is the wind turbine radius in meters, and U is the wind velocity in m/s. The wind turbine rotor speed was set by the controller of the electric motor, and the rotor speed was measured by the built-in encoder.
λ =   ω R U

3.4. Test Conditions

The wind-tunnel test was conducted in three configurations A, B and C, as shown in Figure 5a–c, respectively. The approach-flow velocity was constant at 7 m/s for the three configurations. Wind speed profiles over the hill with no wind turbine are measured in configuration A. The wind speed profiles at the wake of a turbine placed at location 1 were measured in configuration B, and the wind speed profiles at the wake of a turbine placed over a flat terrain were measured in configuration C.

3.5. Measurement Results

3.5.1. Wind Speed Profiles over the Two-Dimensional Hill

Figure 6 shows the vertical wind speed profiles over the hill at locations 1 to 6 without a wind turbine. In Figure 6, the horizontal axis is normalized by U h 1 = 6.21   m / s , where U h 1 is the hub height wind speed at x =L. The vertical axis is normalized by the hill height h, and z* indicates the height from the hill surface. Wind velocity is almost constant at x =L, and afterwards, the wind velocity starts to increase at x =L/2 until it reaches the maximum wind speed at the top of the hill (x = 0), then starts to decrease at the downstream of the hill at x = L/4.

3.5.2. Power and Thrust Coefficients over Flat Terrain

Figure 7 and Figure 8 show the power coefficient ( C P ) and the thrust coefficient ( C T ) calculated using a load cell for the wind turbine over a flat terrain. C P and C T were calculated in order to determine the optimum tip speed ratio that will be used for configurations B and C. The optimum tip speed ratio was λ = 4, where C P = 0.31 and C T = 0.69 .

3.5.3. Wake over the Two-Dimensional Hill

Figure 9 and Figure 10 show the horizontal wind speed profiles at several distances downstream of the turbine for the configuration B. Wind speed profiles were measured at −L/2, −L/4, 0, L/4, L/2 and L. The horizontal axis is normalized by wind turbine radius R = 0.256 m.
The wake width ( D w a k e ) was determined using an arbitrary threshold that the wind speed must be greater than or equal 0.9 U B 0 in order to be regarded as the wake edges.
Figure 9 shows the wind turbine wake development upstream of the hill. At 1.52 D (x =L/2), the wake width was about 0.52 m, and by the time the wake reaches 3.05 D at the top of the hill (x = 0), the wake width decreases to about 0.15 m. This implies that the hill causes the wake to accelerate and shrink upstream of the hill, because the mass flow rate has to be the same upstream and at the top of the hill.
However, as the wake reaches 3.81 D (x = L/4) it starts to expand and the wake width is about 0.50 m, as shown in Figure 10, and by the time the wake reaches 6.09 D (x = L), the wake width has increased to about 0.56 m. This implies that the hill causes the wake to decelerate and expand downstream of the hill, because the mass flow rate has to be the same at the top and downstream of the hill.

3.5.4. Wake Development over Hill Versus Flat Terrain

Figure 11 and Figure 12 compare between the wake development over hill (configuration B) and the wake development over flat terrain (configuration C) at 3.05 D (location 5) and 6.09 D (location 9), respectively. The hill has an effect on both the velocity deficit and the wake width at the top and downstream of the hill. At 3.05 D, the velocity deficit over hill is about 0.5 the velocity deficit over flat terrain, and the D w a k e over hill is about 0.27 the D w a k e over flat terrain. At 6.09 D, the velocity deficit over the hill was about 0.67 of the velocity deficit over flat terrain, and the D w a k e over the hill was almost the same as the D w a k e over flat terrain.

4. Comparison between Wake Model and Wind-Tunnel Test

4.1. Thrust Coefficient

C T   H i l l was calculated at locations 3 to 5 (x/L = −1/2, x/L = −1/4 and x/L = 0) using Equation (5). All of the parameters used for the calculations are shown in Table 4, where U B is the value at 0.9 of the wake depth, as shown in Figure 13. Figure 14 shows C T   H i l l / C T over flat terrain at locations 3 to 5. C T   H i l l was very close to C T over flat terrain at x/L = −1/2 and x/L = −1/4, however, at x/L = 0, C T   H i l l was less than C T over flat terrain, this could be because the wake center at x/L = 0 was moved downwards due to the hill effect.

4.2. Wake Development

Figure 15 shows a comparison between the wake width measured in the wind-tunnel test and that estimated using the wake model (Equation (7)) for configuration B at locations 3 to 5 (x/L = −1/2, x/L = −1/4 and x/L = 0). The estimated wake width is close to that measured in the wind-tunnel test, and the percentage differences between the measured and the estimated wake width at x/L = −1/2, x/L = −1/4 and x/L = 0 are 13.3%, 23.6% and 48.9%, respectively. The measured wake width at the top of the hill (x/L = 0) drops more quickly than the estimated value; this could be because the wake center at x/L = 0 was moved downwards due to the hill effect. Further numerical studies of wake development over the hill are required to confirm wake center movement due to the hill effect.

5. Conclusions

An engineering wake model that considers acceleration on a two-dimensional hill was developed based on the momentum theory. The model consists of the wake width and wake wind speed. The equation to calculate the rotor thrust, which is calculated by the wake wind speed profiles, was also formulated.
In this preliminary study, a wind-tunnel test was conducted to investigate wake development over a two-dimensional hill in simple flow conditions, where a uniform approach-flow with turbulence intensity less than 0.5% was used. Conducting the wind-tunnel test in such simple flow conditions was necessary for this preliminary study, in order to investigate the effect of the hill on wake development and to evaluate the new wake model without the influence of the ABL, ground roughness, or turbulence.
Wake width was about 0.29 D at the top of the hill (location 5), and about 1.09 D at location 9 downstream of the hill. This means that the hill has caused the wake to accelerate and shrink upstream of the hill, and to decelerate and expand downstream of the hill.
The wake model was compared with the wind-tunnel test, and the results obtained by using the wake model were close to the wind-tunnel test results. The wake model was able to estimate the wake shrinkage in an accelerating two-dimensional wind field, and the percentage difference between the measured and estimated wake width at locations 3, 4 and 5 was 13.3%, 23.6% and 48.9%, respectively. The measured wake width at the top of the hill was lower than the estimated value (by the wake model); this could be because the wake center at the top of the hill was moved downwards due to the hill effect; this wake center movement must be confirmed with further studies.
Further numerical studies will be important to evaluate the new wake model at distances farther than 3 D away from the rotor, as it was difficult to do so in the wind-tunnel due to the size limitation of the test section.
In this study, an engineering wake model, which considers acceleration on a two-dimensional hill, was formulated based upon the momentum theory. However, wake development over three-dimensional terrain can be different than that over two-dimensional terrain, therefore, further studies that investigate wake development over three-dimensional terrain will be important to modify and evaluate the engineering wake model.
In the wind-tunnel test, the hill surface was smooth, as it was made of ABS resin, however, the surface roughness may affect wind speed profiles, the speed-up ratio and turbulence intensity over the hill. Consequently, the effect of the surface roughness on wake development must be considered in the future studies.
Further experimental and numerical studies where the approach-flow represents real atmospheric conditions (where the ABL is reproduced) are required to investigate wake development over the hill in conditions that wind turbines experience in the field.
In this preliminary study, a two-dimensional hill was tested in the wind tunnel in order to evaluate the wake model as a first step. In future studies, further modifications to the wake model are necessary to include the effect of turbulence and ground roughness on wake development over the hill, and to extend the wake model to a decelerating wind field (downstream of the hill), then, the modified wake model should be compared with field measurements over more complex terrains with varying steepness and roughness.

Author Contributions

O.M.A.M.I. developed the model and wrote the manuscript. S.Y. contributed to the formulation of the model. M.H., A.T., and O.M.A.M.I. performed the experiments.

Funding

This research received no external funding.

Conflicts of Interest

The authors declare no conflict of interest.

Nomenclature

aSlope of the hill
C T Thrust coefficient
C T   H i l l Thrust coefficient calculated by the wake wind speed profiles over the two-dimensional hill
C P Power coefficient
DWind turbine rotor diameter
D w a k e Wake Width
hHeight of the two-dimensional hill (same as the hub height)
LTwo-dimensional hill half-length
m B Momentum loss in the wake caused by the rotor
m T Rate of change of momentum caused by the terrain
RWind turbine rotor radius
SCross sectional area of the wind stream tube
T Thrust
U Wind velocity
U B 0 Wind velocity outside the wake at location B
λTip speed ratio
ρDensity
ω Rotor speed in rad/s
Subscript
RRelevant to circumstances at the rotor
WRelevant to circumstances in the wake (between the rotor and x =L)
BRelevant to circumstances between x = −L and x = 0
Relevant to circumstances upstream of the turbine
Acronyms
ABLAtmospheric Boundary Layer
ADActuator Disc
ALActuator Line
CFDComputational Fluid Dynamics
HAWTHorizontal Axis Wind Turbine
LESLarge Eddy Simulation

References

  1. Cleijne, J.W. Results of Sexbierum Wind Farm: Single Wake Measurements; TNO-Report 93-082; TNO Institute of Environmental and Energy Technology: Apeldoorn, The Netherlands, 1993. [Google Scholar]
  2. Lissaman, P.B.S. Energy Effectiveness of Arbitrary Arrays of Wind Turbines. J. Energy 1979, 3, 323–328. [Google Scholar] [CrossRef]
  3. Neustadter, H.E.; Spera, D.A. Method for Evaluating Wind Turbine Wake Effects on Wind Farm Performance. J. Sol. Energy Eng. 1985, 107, 240–243. [Google Scholar] [CrossRef]
  4. Barthelmie, R.J.; Frandsen, S.T.; Hansen, K.; Schepers, J.G.; Rados, K.; Schlez, W.; Neubert, A.; Jensen, L.E.; Neckelmann, S. Modelling the impact of wakes on power output at Nysted and Horns Rev. In Proceedings of the European Wind Energy Conference and Exhibition, Marseilles, France, 16–19 March 2009. [Google Scholar]
  5. Barthelmie, R.J.; Frandsen, S.T.; Rathmann, O.; Politis, E.S.; Prospathopoulos, J.; Rados, K.; Hansen, K.; Cabezon, D.; Schlez, W.; Phillips, J.; et al. Flow and wakes in large wind farms in complex terrain and offshore. In Proceedings of the American Wind Energy Association Conference, Houston, TX, USA, 1–4 June 2008. [Google Scholar]
  6. Ibrahim, O.M.A.M.; Yoshida, S. Experimental and Numerical Studies of a Horizontal Axis Wind Turbine Performance over a Steep 2D Hill. Evergreen 2018, 5, 12–21. [Google Scholar] [CrossRef]
  7. Yoshida, S. Performance of Downwind Turbines in Complex Terrains. Wind Eng. 2006, 30, 487–501. [Google Scholar] [CrossRef]
  8. Ibrahim, O.M.A.M.; Yoshida, S.; Hamasaki, M.; Takada, A. Decay Factor of Wind Turbine Wake in Accelerated Wind Field. In Proceedings of the JWEA Wind Energy Symposium, Tokyo, Japan, 4–5 December 2018. [Google Scholar]
  9. Uchida, T.; Maruyama, T.; Ishikawa, H.; Zako, M.; Deguchi, A. Investigation of the Causes of Wind Turbine Blade Damage at Shiratakiyama Wind Farm in Japan: A Computer Simulation Based Approach; Reports; Research Institute for Applied Mechanics, Kyushu University: Fukuoka, Japan, 2011; pp. 13–25. [Google Scholar]
  10. Li, G.; Takakuwa, S.; Uchida, T. Application of CFD for Turbulence Related Operational Risks Assessment of Wind Turbines in Complex Terrain. In Proceedings of the EWEA2013 Conference Proceedings, Vienna, Austria, 4–7 February 2013. [Google Scholar]
  11. Tian, W.; Ozbay, A.; Yuan, W.; Sarakar, P.; Hu, H. An Experimental Study on the Performances of Wind Turbines Over Complex Terrain. In Proceedings of the 51st AIAA Aerospace Sciences Meeting including the New Horizons Forum and Aerospace Exposition, Grapevine, TX, USA, 7–10 January 2013. [Google Scholar] [CrossRef]
  12. Webster, D.R.; DeGraaff, D.B.; Eaton, J.K. Turbulence Characteristics of a Boundary Layer Over a Two-Dimensional Bump. J. Fluid Mech. 1996, 320, 53–69. [Google Scholar] [CrossRef]
  13. Helmis, C.G.; Papadopoulos, K.H.; Asimakopoulos, D.N.; Papageorgas, P.G.; Soilemes, A.T. An Experimental Study of the Near-Wake Structure of a Wind Turbine Operating Over Complex Terrain. Sol. Energy 1995, 54, 413–428. [Google Scholar] [CrossRef]
  14. Ayotte, K.W.; Hughes, D.E. Observations of Boundary-Layer Wind-Tunnel Flow Over Isolated Ridges of Varying Steepness and Roughness. Bound. Layer Meteorol. 2004, 112, 525–556. [Google Scholar] [CrossRef]
  15. Walmsley, J.L.; Taylor, P.A.; Keith, T. A simple model of neutrally stratified boundary-layer flow over complex terrain with surface roughness modulations (MS3DJH/3R). Bound. Layer Meteorol. 1986, 36, 157–186. [Google Scholar] [CrossRef]
  16. Beljaars, A.C.M.; Walmsley, J.L.; Taylor, P.A. A mixed spectral finite-difference model for neutrally stratified boundary-layer flow over roughness changes and topography. Bound. Layer Meteorol. 1987, 38, 273–303. [Google Scholar] [CrossRef]
  17. Troen, I.; Petersen, E.L. European Wind Atlas; Risø National Laboratory: Roskilde, Denmark, 1989; p. 656. [Google Scholar]
  18. Ayotte, K.W.; Taylor, P.A. A Mixed Spectral Finite-Difference 3D Model of Neutral Planetary Boundary-Layer Flow over Topography. J. Atmos. Sci. 1995, 52, 3523–3538. [Google Scholar] [CrossRef] [Green Version]
  19. Cao, S.; Tamura, T. Experimental study on roughness effects on turbulent boundary layer flow over a two-dimensional steep hill. J. Wind Eng. Ind. Aerodyn. 2006, 94, 1–19. [Google Scholar] [CrossRef]
  20. Allen, T. Flow over Hills with Variable Roughness. Bound. Layer Meteorol. 2006, 121, 475–490. [Google Scholar] [CrossRef]
  21. Cao, S.; Tamura, T. Effects of roughness blocks on atmospheric boundary layer flow over a two-dimensional low hill with/without sudden roughness change. J. Wind Eng. Ind. Aerodyn. 2007, 95, 679–695. [Google Scholar] [CrossRef]
  22. Politis, E.S.; Prospathopoulos, J.; Cabezon, D.; Hansen, K.S.; Chaviaropoulos, P.K.; Barthelmie, R.J. Modeling wake effects in large wind farms in complex terrain: The problem, the methods and the issues. Wind Energy 2012, 15, 161–182. [Google Scholar] [CrossRef]
  23. Makridis, A.; Chick, J. Validation of a CFD model of wind turbine wakes with terrain effects. J. Wind Eng. Ind. Aerodyn. 2013, 123, 12–29. [Google Scholar] [CrossRef]
  24. Hansen, K.S.; Larsen, G.C.; Menke, R.; Vasiljevic, N.; Angelou, N.; Feng, J.; Zhu, W.J.; Vignaroli, A.; Xu, C.; Shen, W.Z. Wind turbine wake measurement in complex terrain. J. Phys. Conf. Ser. 2016, 753, 032013. [Google Scholar] [CrossRef] [Green Version]
  25. Castellani, F.; Astolfi, D.; Mana, M.; Piccioni, E.; Becchetti, M.; Terzi, L. Investigation of terrain and wake effects on the performance of wind farms in complex terrain using numerical and experimental data. Wind Energy 2017, 20, 1277–1289. [Google Scholar]
  26. Astolfi, D.; Castellani, F.; Terzi, L. A study of wind turbine wakes in complex terrain through RANS simulation and SCADA data. J. Sol. Energy Eng. 2018, 140, 031001. [Google Scholar] [CrossRef]
  27. Hyvärinen, A.; Segalini, A. Qualitative analysis of wind-turbine wakes over hilly terrain. J. Phys. Conf. Ser. 2017, 854, 012023. [Google Scholar] [CrossRef] [Green Version]
  28. Hyvärinen, A.; Segalini, A. Effects from complex terrain on wind-turbine performance. J. Energy Resour. Technol. 2017, 139, 051205. [Google Scholar] [CrossRef]
  29. Porté-Agel, F.; Wu, Y.T.; Lu, H.; Conzemius, R.J. Large-Eddy Simulation of Atmospheric Boundary Layer Flow through Wind Turbines and Wind Farms. J. Wind Eng. Ind. Aerodyn. 2011, 99, 154–168. [Google Scholar] [CrossRef]
  30. Zhong, H.; Du, P.; Tang, F.; Wang, L. Lagrangian Dynamic Large-Eddy Simulation of Wind Turbine near Wakes Combined with an Actuator Line Method. Appl. Energy 2015, 144, 224–233. [Google Scholar] [CrossRef]
  31. Berg, J.; Troldborg, N.; Sørensen, N.N.; Patton, E.G.; Sullivan, P.P. Large-Eddy Simulation of Turbine Wake in Complex Terrain. J. Phys. Conf. Ser. 2017, 854, 012003. [Google Scholar] [CrossRef]
  32. Tabib, M.; Rasheed, A.; Fuchs, F. Analyzing complex wake-terrain interactions and its implications on wind-farm performance. J. Phys. Conf. Ser. 2016, 753, 032063. [Google Scholar] [CrossRef]
  33. Vermeer, L.J.; Sørensen, J.N.; Crespo, A. Wind Turbine Wake Aerodynamics. Prog. Aerosp. Sci. 2003, 39, 467–510. [Google Scholar] [CrossRef]
  34. Sanderse, B. Aerodynamics of Wind Turbine Wakes—Literature Review; Report ECN-E–09-016; Energy research Centre of the Netherlands: Petten, The Netherlands, 2009. [Google Scholar]
  35. Katic, I.; Højstrup, J.; Jensen, N.O. A simple model for cluster efficiency. In Proceedings of the European Wind Energy Association Conference and Exhibition, Rome, Italy, 7–9 October 1986. [Google Scholar]
  36. Feng, J.; Shen, W.Z. Wind farm layout optimization in complex terrain: A preliminary study on a Gaussian hill. J. Phys. Conf. Ser. 2014, 524, 012146. [Google Scholar] [CrossRef]
  37. Research Institute for Applied Mechanics (RIAM), Kyushu University. Wind Engineering Section. Available online: http://www.riam.kyushu-u.ac.jp/windeng/en_index.html (accessed on 6 June 2019).
  38. Ohya, Y.; Karasudani, T. A shrouded wind turbine generating high output power with wind-lens technology. Energies 2010, 3, 634–649. [Google Scholar] [CrossRef]
  39. Goltenbott, U.; Ohya, Y.; Yoshida, S.; Jamieson, P. Aerodynamic interaction of diffuser augmented wind turbines in multi-rotor systems. Renew. Energy 2017, 112, 25–34. [Google Scholar] [CrossRef]
  40. Nissho Electric Works Co., Ltd. Available online: http://www.nissho-ew.co.jp/_userdata/LMC-6566A.pdf (accessed on 7 June 2019).
Figure 1. (a) Wind turbine wake over a flat terrain; (b) the combined effect of the turbine and hill on the wake.
Fluids 04 00153 g001
Figure 2. Boundary layer wind tunnel [37,39].
Fluids 04 00153 g002
Figure 3. (a) Wind turbine model; (b) Streamline tube cross section.
Fluids 04 00153 g003
Figure 4. Schematic diagram of the two-dimensional hill model.
Fluids 04 00153 g004
Figure 5. A schematic diagram of the measurement setup. (a) Configuration A: No wind turbine over the hill; (b) Configuration B: Wind turbine at −L over the hill; (c) Configuration C: Wind turbine at −L over a flat terrain.
Fluids 04 00153 g005
Figure 6. Configuration A: Vertical wind speed profiles at locations 1 to 6.
Fluids 04 00153 g006
Figure 7. Wind turbine power coefficient over a flat terrain.
Fluids 04 00153 g007
Figure 8. Wind turbine thrust coefficient over a flat terrain.
Fluids 04 00153 g008
Figure 9. Configuration B: Horizontal wind speed profiles upstream of the hill.
Fluids 04 00153 g009
Figure 10. Configuration B: Horizontal wind speed profiles downstream of the hill.
Fluids 04 00153 g010
Figure 11. Comparison between configurations B and C at 3.05 D (wind turbine at x =L, measurement at x = 0).
Fluids 04 00153 g011
Figure 12. Comparison between configurations B and C at 6.09 D (wind turbine at x =L, measurement at x = L).
Fluids 04 00153 g012
Figure 13. Wake over flat terrain at 6.09 D (Wind turbine at x =L, measurement at x = L).
Fluids 04 00153 g013
Figure 14. C T   H i l l / C T over flat terrain at locations 3 to 5.
Fluids 04 00153 g014
Figure 15. Comparison between the wake width measured in the wind-tunnel test and that estimated using the wake model.
Fluids 04 00153 g015
Table 1. Measurement locations of wind speed profiles along the x-axis.
Location Numberx [mm]x/LDistance from Location 1
1−1560−10
2−1170−3/40.76 D
3−780−1/21.52 D
4−390−1/42.29 D
5003.05 D
63901/43.81 D
77801/24.57 D
811703/45.33 D
9156016.09 D
Table 2. Model number and capacity of the load cell [40].
Model NumberLMC-6566A-50N
Capacity F x   ± 50 N M x   ± 5 N m
F y   ± 50 N M y   ± 5 N m
F z   ± 100 N M z   ± 5 N m
Table 3. Wind turbine rotor speed.
rpmTip Speed Ratio (λ)
2611.0
3921.5
5222.0
6532.5
7833.0
9143.5
10444.0
11754.5
13065.0
14365.5
15676.0
Table 4. Parameters used for the calculations.
ParametersFlat Terrainx/L = −1/2x/L = −1/4x/L = 0
D w a k e / R 2.202.021.730.59
U B 0 / U h 1 1.071.151.301.39
U B / U h 1 0.640.850.991.19

