Article

Numerical Optimization of a Stall Margin Enhancing Recirculation Channel for an Axial Compressor

1
Japanese Acquisition Technology & Logistics Agency, Ministry of Defense, Tokyo 190-8533, Japan
2
Department of Engineering, University of Leicester, Leicester LE1 7RH, UK
*
Author to whom correspondence should be addressed.
Fluids 2019, 4(2), 88; https://doi.org/10.3390/fluids4020088
Submission received: 13 February 2019 / Revised: 22 March 2019 / Accepted: 26 April 2019 / Published: 11 May 2019
(This article belongs to the Special Issue Turbomachinery Flow Analysis)

Abstract

:
A proof of concept is provided by computational fluid dynamic simulations of a new recirculating type casing treatment. This treatment aims at extending the stable operating range of highly loaded axial compressors, so to improve the safety of sorties of high-speed, high-performance aircraft powered by high specific thrust engines. This casing treatment, featuring an axisymmetric recirculation channel, is evaluated on the NASA rotor 37 test case by steady and unsteady Reynolds Averaged Navier Stokes (RANS) simulations, using the realizable k-ε model. Flow blockage at the recirculation channel outlet was mitigated by chamfering the exit of the recirculation channel inner wall. The channel axial location from the rotor blade tip leading edge was optimized parametrically over the range −4.6% to 47.6% of the rotor tip axial chord c z . Locating the channel at 18.2% c z provided the best stall margin gain of approximately 5.5% compared to the untreated rotor. No rotor adiabatic efficiency was lost by the application of this casing treatment. The investigation into the flow structure with the recirculating channel gave a good insight into how the new casing treatment generates this benefit. The combination of stall margin gain at no rotor adiabatic efficiency loss makes this design attractive for applications to high-speed gas turbine engines.

1. Introduction

Stable engine operations are essential to ensure a safe aircraft sortie. In recent years, the stable operation of high-speed jet engines for military aircraft has become more challenging to achieve, where engines are used in combination with advanced stealth inlet ducts, which may cause a severe flow distortion through the inlet.
Three-dimensional design for compressor blades has been used to overcome this challenge. Gallimore et al. [1,2] applied sweep and dihedral to multistage axial flow compressor blading of the Trent 500, testing its effectiveness by computational simulations and experiments.
A casing treatment is an alternative or complementary approach to increase the axial compressor stall margin. Whilst investigated since at least 1971 [3,4,5], this approach is less widespread than three-dimensional blading. The growth of high-performance computing has enabled more casing treatment studies by numerical means. Houghton and Day [6,7] made a parametric design study of a circumferential groove type casing treatment for a subsonic single-stage axial compressor. They varied the groove axial position, the groove depth, and the number of the grooves. Their experiments showed that a deep groove with a depth of 0.27 axial chords gives a better stall margin than a shallower groove with a depth of 0.14 axial chords. Sakuma et al. [8] applied a single circumferential groove to the casing wall of the National Aeronautics and Space Administration (NASA) axial compressor rotor 37. They varied the groove axial position and depth. They calculated the stall margin (SM) from the peak efficiency (PE) and the near-stall (NS) conditions by
SM = [ 1 m ˙ N S · ( P = 04 / P = 01 ) P E m ˙ P E · ( P = 04 / P = 01 ) N S ] × 100 .
The adiabatic efficiency η was determined by
η = [ ( P = 04 / P = 01 ) ( γ 1 ) / γ 1 T = 04 / T = 01 1 ]   × 100 .
They found that a deep groove with a depth of 0.21 axial chord lengths placed at 0.2 axial chords from the blade tip leading edge performed best. Cevik et al. [9] applied tangential grooves of various cross-sectional shapes to a transonic axial compressor. Their sawtooth type tangential groove decreased the compressor performance sensitivity to the rotor tip clearance height.
Osborn et al. [3] showed that non-axisymmetric slots give a larger improvement in the stall margin than circumferential grooves but they penalize the compressor efficiency. Lu et al. [10] investigated the effect of the axial location of bend-skewed axial slots on an axial compressor performance. Their non-axisymmetric slot design improved the stall margin by 21%.
A further type of casing treatment is by a recirculating channel. Koff et al. [11] tested airfoils in a casing wall channel to reduce the tangential velocity component of the flow through it. Hathaway [12] modeled a recirculating type casing treatment for an axial compressor by solving the one-dimensional mass balance between the channel inlet and the channel outlet. Tested on a NASA axial rotor, this treatment extended the rotor operating range without producing an adiabatic efficiency drop. Khaleghi [13] studied numerically narrow recirculation passageways on a NASA transonic rotor. He found that the mismatch between the passageway shape and flow direction around the inlet of the passageway may cause a large separation inside the passageways. More recently, Dinh et al. [14] conducted a parametric study on the design of a recirculating type casing treatment. They numerically investigated the effect of the injection positions, the bleed position, and the width of the channel on the compressor performance. They managed to identify a useful range of parameters for which the rotor is able to operate at lower mass flow rate conditions.
These studies collectively suggest that a recirculation channel may increase the stability of an axial compressor. Following this lead, this paper investigates by numerical modelling the influence of the recirculation type flow channel shown in Figure 1 on the flow field. This study uses the NASA rotor 37 shown in Figure 2 as an established test case of a transonic axial compressor rotor. The numerical modeling is first validated in Section 3.1 and it is then used in Section 3.2 to test the concept of the recirculation channel. Section 3.3 presents and discusses the results from modeling numerically the recirculation channel shown in Figure 5. First, the influence of the shape of the inner wall on the flow structure is investigated. Then, the effect of different positions of the recirculation channel on performance is evaluated parametrically. Finally, the flow structure changes underpinning these performance changes are investigated. Section 4 concludes by some insights into the new recirculating type casing treatment design applicable to future high-speed jet engines.

2. Materials and Methods

2.1. Axisymmetric Recirculation Channel for Axial Compressor Rotor

The spike type stall inception in an axial compressor initiates with a short length-scale disturbance rotating in the opposite direction to the rotor rotation [15]. Vo et al. [16] concluded that reversed flow from the tip clearance reaching at the adjacent rotor blade is the main driver of rotor tip stall inception in axial compressors. Rotor tip leakage from the blade pressure side to its suction side is caused by the pressure difference across the rotor blade thickness. Mitigating the rotor tip leakage is expected to delay the spike type stall inception. Figure 1 illustrates the authors’ own take of the axisymmetric recirculation channel (RC) concept applied to an axial compressor rotor. This concept broadly draws from a detail of a one-way valve by Tesla [17]. The RC is placed over the rotor shroud wall at approximately 0.2 blade axial chords downstream from the leading edge (LE) of the blade. A recirculating flow is induced in this recirculation channel (RC) by the pressure difference between the suction side and the pressure side of a rotor blade. This pressure difference is enhanced by the axial pressure gradient through the rotor passage. The induced flow is intended to seal the tip leakage flow near the casing wall. The channel outlet is of a subsonic nozzle shape to obtain a high momentum from a small recirculation mass flow rate.

2.2. NASA Rotor 37 Test Case

The rotor passage geometry of the NASA rotor 37 [18] is used in this study. Table 1 summarizes the main design parameters of the NASA rotor 37. NASA designed this axial compressor rotor as the first stage of a core engine compressor and tested it experimentally at the NASA Glenn Research Center (formerly known as the NASA Lewis Research Center). The stage design total pressure ratio is 2.1, which is relatively high compared to contemporary axial compressors. This compressor geometry is representative of highly loaded compressors, such as the ones used in high specific thrust engines of high-speed aircraft.

2.3. Numerical Modelling

2.3.1. Computational Domain and Mesh

Figure 2 shows a schematic of the computational domain and mesh, which has been coarsened by a factor of two in the direction of each coordinate for graphical rendering purposes. ANSYS ICEM CFD (ANSYS, Inc., Canonsburg, PA, USA) is used for generating the structured mesh. Only one blade-to-blade passage is modeled to reduce the computational cost. This configuration corresponds to 1/36th of the compressor full annulus. The structured mesh for the recirculation channel is first generated as a separate mesh and then it is appended to the main passage mesh by defining the interface between the two. A constant height for the first cell height normal to the solid boundary wall is set to 5 × 10⁻⁶ m throughout the computational domain. This achieved an average near-wall resolution of y+ ≈ 1.5.
The error related to the spatial discretization on the flow predictions is evaluated by a mesh convergence study on the basis of Richardson’s extrapolation that is generalized by Roache [19]. In this work, three progressively refined meshes are used. The refinement ratio of each progressive mesh pair is r m = 2.0. The coarse mesh has 0.7 M nodes (mesh A), the mesh of intermediate spatial refinement has 1.5 M nodes (mesh B), and the fine mesh has 3.1 M nodes (mesh C). To assess the mesh dependence, two grid convergence indexes (GCI) are calculated. The first GCI is calculated based on the adiabatic efficiency of the rotor blade row and the second GCI is calculated based on the local value of the static pressure near the rotor pressure side tip at the near-stall operating condition. The location of the local static pressure monitor is shown as Position A in Figure 2. The Position A is located directly under the recirculation channel inlet of Figure 1 and it is where the breakdown of the tip leakage vortex occurs as the result of interaction with the passage shockwave. As discussed in previous works [8,20], the vortex breakdown is identified as the main cause of the reversed flow that drives stall inception in this rotor blade row. The rotor blade row adiabatic efficiency computed with each of the three meshes is 85.675%, 85.895%, and 85.997%. The GCI computed from the adiabatic efficiency predicted with the coarse mesh (mesh A) and that with the intermediate mesh (mesh B) is 0.273%. This is higher than the GCI computed from the adiabatic efficiency predicted with the intermediate mesh (mesh B) and that with the fine mesh (mesh C), which is 0.126%. From this, the intermediate mesh (mesh B) is selected for this study. The difference between the adiabatic efficiency η n predicted using the nth mesh and the one obtained from Richardson’s extrapolation η R is used to define the relative error as e = η n   η R 1 1 . Based on this, the magnitude of adiabatic efficiency error for the mesh B is estimated to be 0.218%. The GCI computed from the local static pressure at Position A on meshes A and B is 0.117%, which is higher than the corresponding GCI computed on meshes B and C which is 0.011%. The estimated magnitude of the local static pressure error for the mesh B is 0.094%. This study uses computational fluid dynamics to estimate the performance changes from variances of the compressor passage geometry as opposed to absolute performance values. By this, the computed GCI errors on mesh B can be deemed acceptable.

2.3.2. Numerical Method

The calculations are run both as steady and as time-dependent Reynolds Averaged Navier Stokes (RANS) simulation with the realizable k ε turbulence closure model [21]. The Roe flux difference splitting method is used, in combination with the Roe approximate Riemann solver, to estimate the convective fluxes at the finite-volume unit cell boundaries throughout the computational domain [22]. The flow state inside unit cells is reconstructed using a third-order Monotone Upwind Scheme for Conservation Laws (MUSCL) from Van Leer [23]. For steady RANS, the implicit integration method by Weiss et al. [24] iterates the numerical solution to a converged steady state. For time-dependent RANS, the implicit time-marching method by Pandya et al. [25] and Turkel and Vatsa [26] is used. One blade pitch rotation is produced by integrating over 20 time steps. Pseudo-time advancement is performed by local time stepping with the Courant number limited to 5. An under-relaxation factor of 0.8 is used for the specific turbulent kinetic energy k and for the specific dissipation rate of specific turbulent kinetic energy ε to improve the numerical stability of the computation. At the computational domain inlet, an axially uniform inflow is imposed based on the inflow stagnation pressure and on the inflow stagnation temperature reported in Table 2.
The inflow is turbulent and uniform inflow k and ε fields are prescribed based on the turbulence intensity and on the turbulent length scale values of Table 2. The static pressure at the computational domain outlet of Figure 2 is specified as the outflow boundary condition. For steady RANS simulations, the static pressure is imposed under the condition of radial equilibrium. For time-dependent RANS, a macroscopic pressure resistance model defined in Equation (3) is applied at the outlet boundary in order to model the pressure drop during the stall inception process [27,28].
P o u t = 101.325 + 1 2 c t ρ = u a = 2 1000 ,
where c t is the pressure resistance coefficient of the downstream throttle valve which is used in the experiment to set the operating condition of the compressor rotor, ρ = is the mass-averaged fluid density at the computational outlet, and u a = is the mass-averaged axial velocity at the computational outlet. All other variables are extrapolated from the computational domain interior.
At all solid boundaries, no-slip adiabatic conditions are used. At the pitchwise boundaries, pitchwise periodic conditions are imposed based on the one pitch rotational periodicity of the blade row.
The procedure to identify the operating range is identical to the one used in the past work [16]. Convergence is deemed to be achieved when the change in the mass flow rate is about 0.001% of the inflow.

3. Results and Discussion

3.1. Validation of the Numerical Model

Figure 3 compares the radial profiles of circumferentially mass-averaged total pressure at Station 1 and at Station 4, tangential velocity at Station 4, and flow angle at Station 4, between CFD and experiment. The radial profiles calculated by the steady RANS are drawn in Figure 3 by black solid lines. The radial profiles predicted by the time-dependent RANS are shown by gray dashed lines in the same figure. For time-dependent RANS, the radial profiles are calculated by the average of four equispaced time points during one pitch blade rotation at increments Δ t = 2 π ( 36 × 5 ω 3 ) . Figure 3 indicates that both steady and time-dependent RANS models with the realizable k-ε turbulence closure model are capable of modeling the performance of the NASA rotor 37 for the purpose of evaluating different casing treatments.

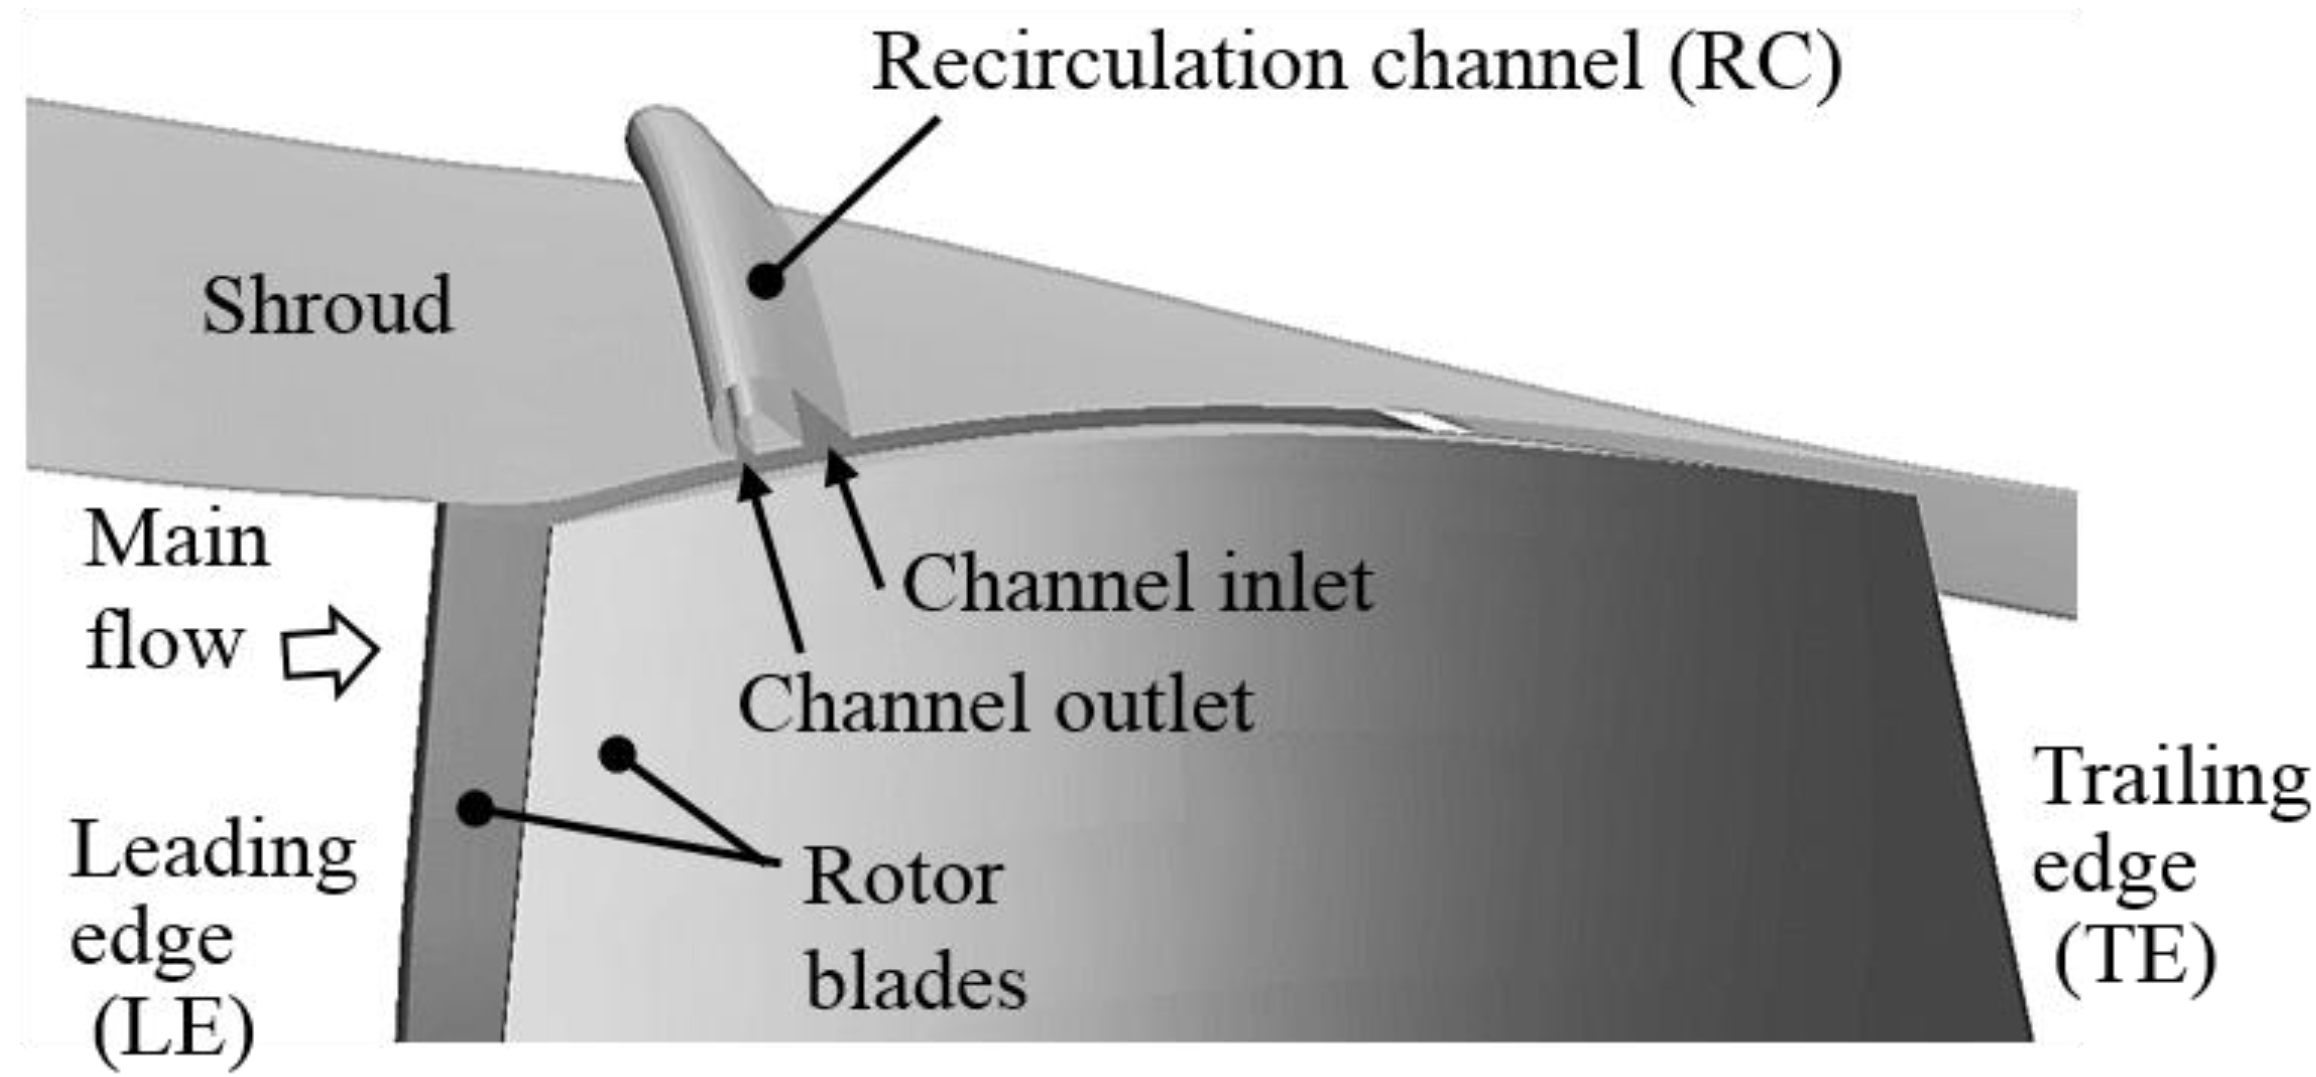
3.2. Improving the Inner Wall Shape of the Recirculation Channel

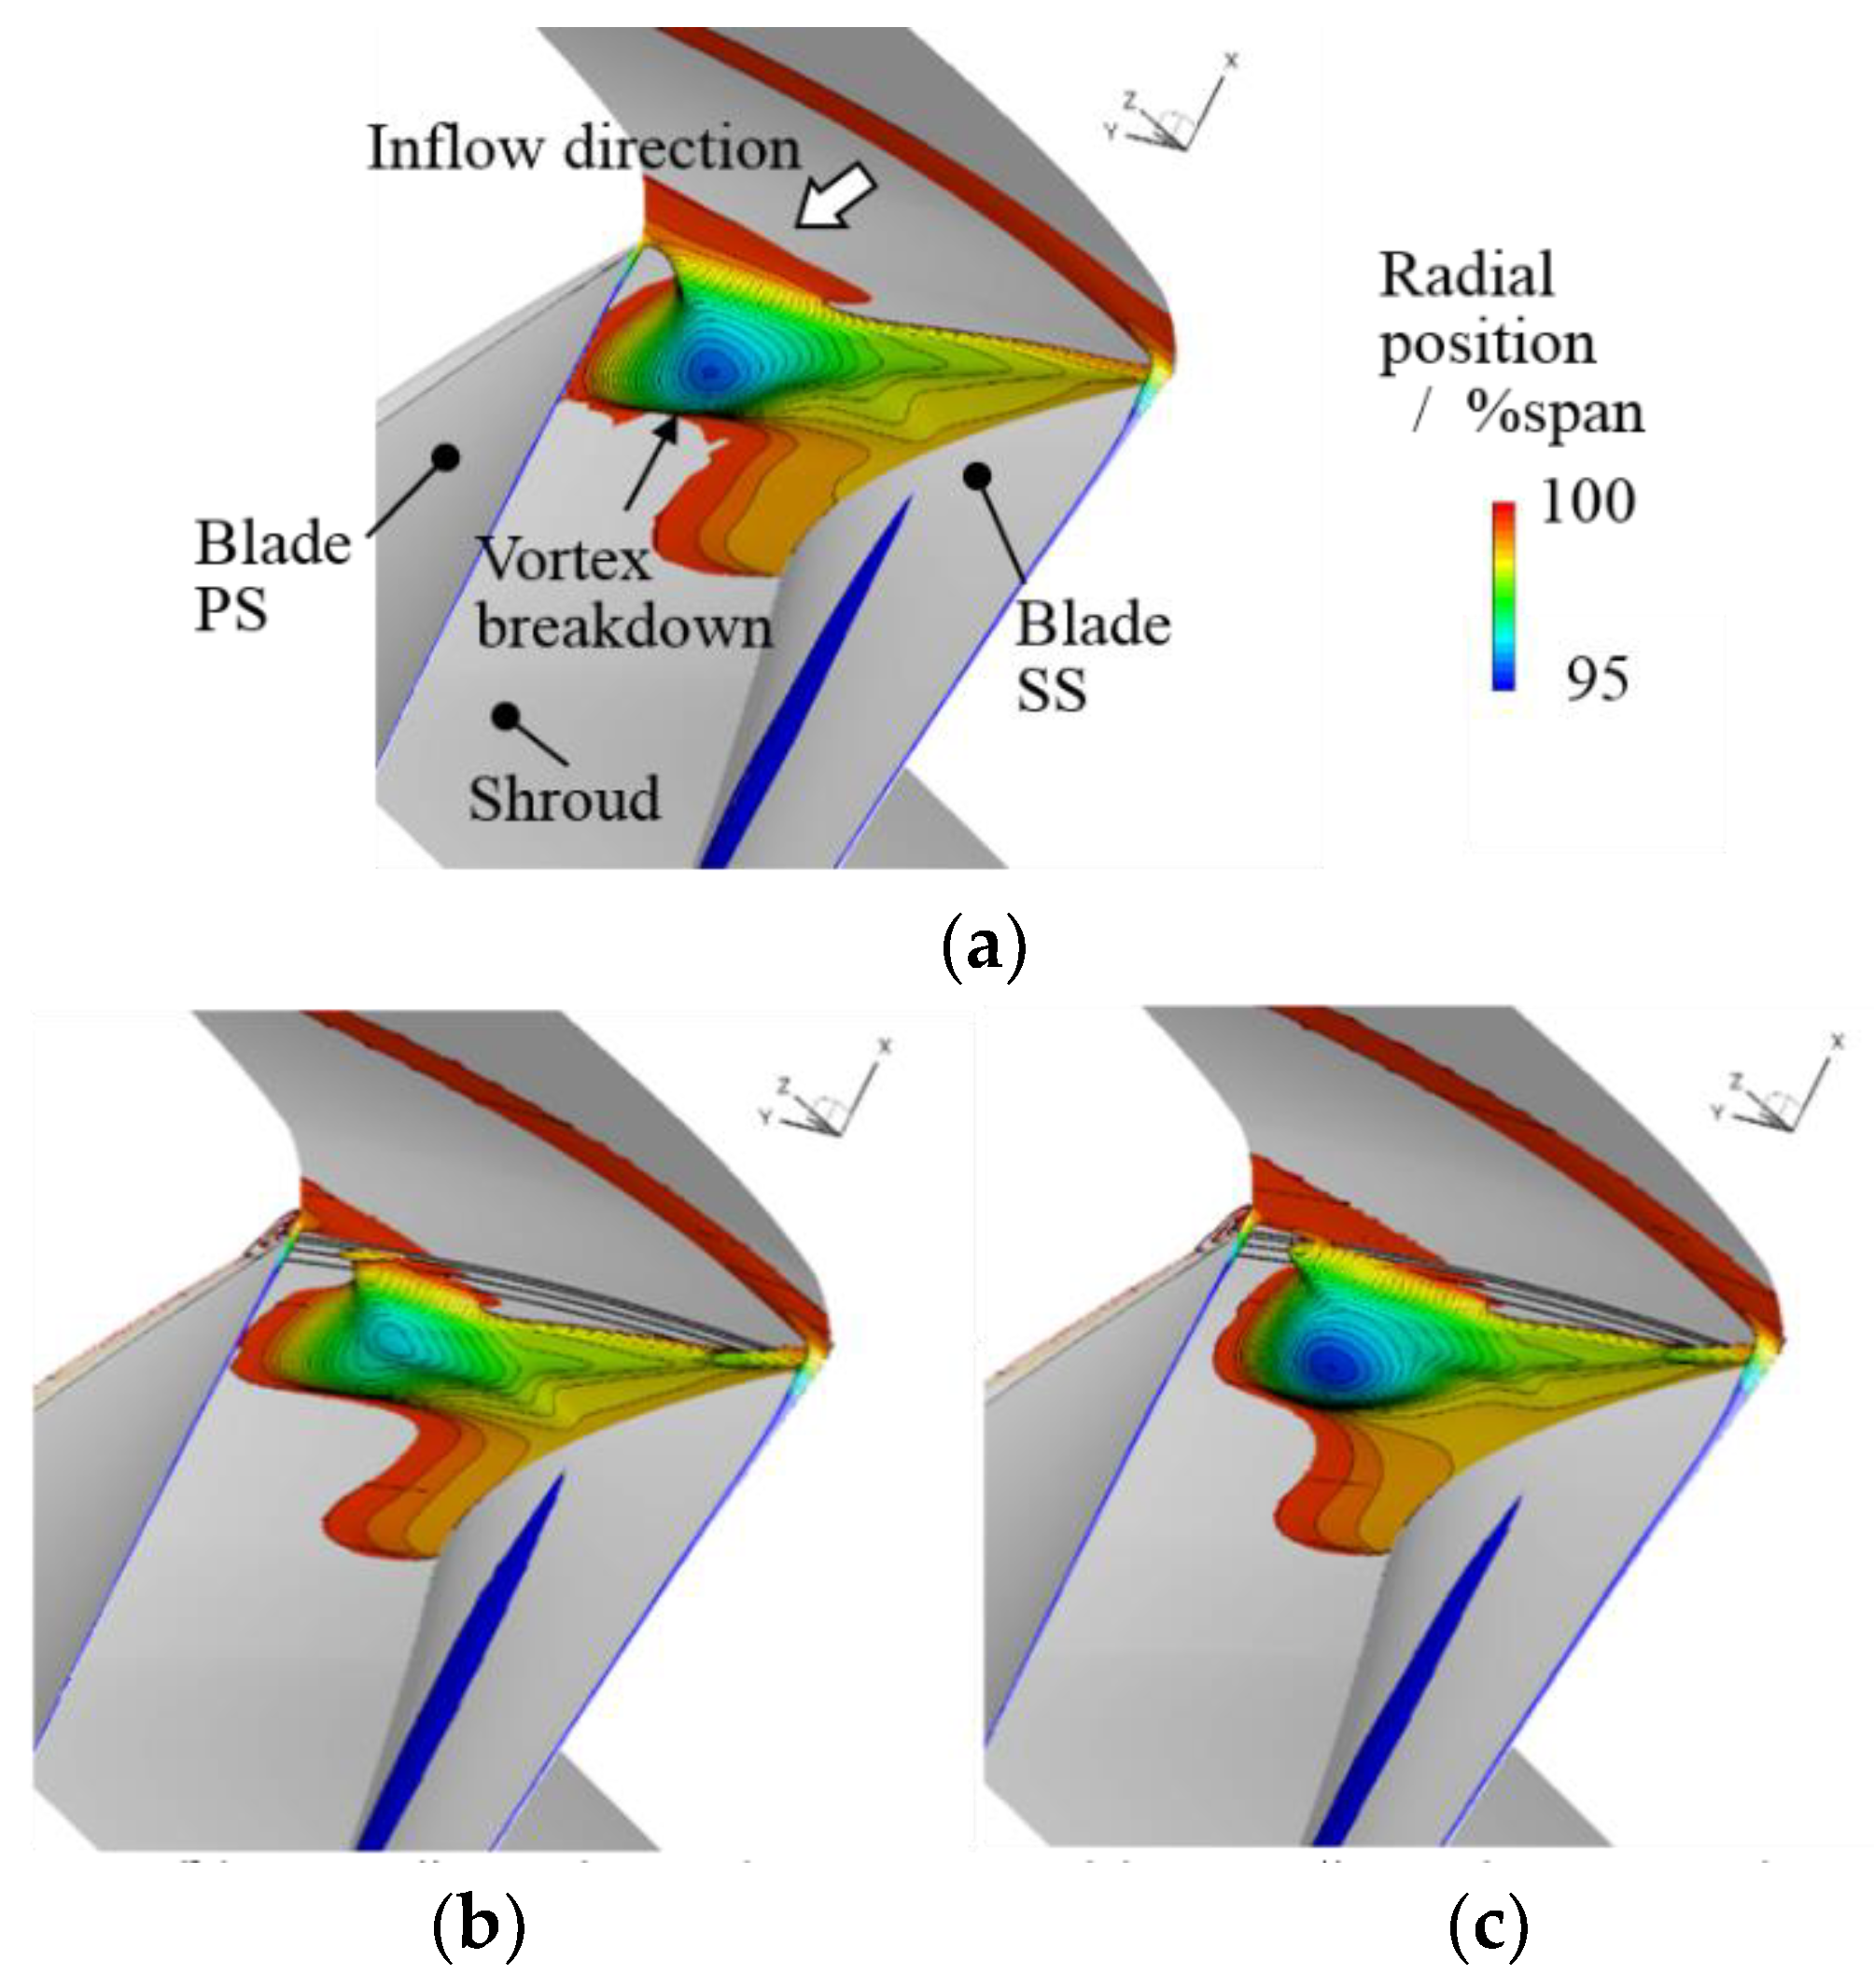
The overview of the recirculation channel flow structure is shown in Figure 4a by Mach number grayscale iso-levels, captured by two-dimensional (2D) simulations. The flow conditions of this 2D calculation are specified by the results of corresponding 3D calculations on the computational domain of Figure 2. In the absence of any casing treatment, the pressure difference across the blade thickness, which is modeled by imposing different pressures along the left and right boundaries of the computational domain of Figure 4a, generates a leakage flow over the tip clearance. In the simulation shown in Figure 4a, the right-hand side boundary is set at a higher pressure than the left boundary, so that the elevated pressure to the right of the modeled blade thickness creates a leakage jet over it that runs from right to left, as indicated by the white arrow. By applying the recirculation channel over the rotor blade, the fluid is sucked at the channel inlet and it is injected into the main passage at the channel outlet. The leakage flow from the rotor tip is diverted downwards, which indicates a significant interaction from the confluence of the two flows. As a result of the channel activation, the tip flow over the tip clearance directed towards the left computational domain boundary is substantially obstructed.
Figure 4b shows an attempt to improve the inner wall shape by two-dimensional numerical simulations. Figure 4b compares the two-dimensional streamlines and Mach number distributions in the gray dashed square inset of Figure 4a between the original inner wall shape and a chamfered inner wall. With the original inner wall shape, the recirculating flow separates at the RC outlet at the confluence of the leakage flow at Position B in Figure 4b. This interaction causes a blockage of the recirculating flow at the channel outlet, which undesirably weakens the effect of this casing treatment design. In the chamfered inner wall case, a larger flow separation occurs at the Position C in Figure 4b. Nevertheless, as the separation bubble is accommodated into the chamfer of the channel inner wall, the saddle point between the recirculating flow and the tip leakage flow shifts upward.
Figure 4c shows the change of the y velocity profiles across the channel outlet plane by applying the chamfered inner wall. The y velocity corresponds to the radial velocity in the three-dimensional configuration shown in Figure 2. The negative value of the y velocity in Figure 4c indicates injection into the main flow passage. With the original inner wall shape, the y velocity is positive in the vicinity of the Position B and this denotes and unwanted recirculation bubble. This bubble causes a blockage of y velocity at the channel outlet. By applying the chamfered inner wall, a mitigation of the blockage at the channel outlet is obtained so that the recirculated flow from the channel is injected into the main flow passage through a wider effective outflow area.
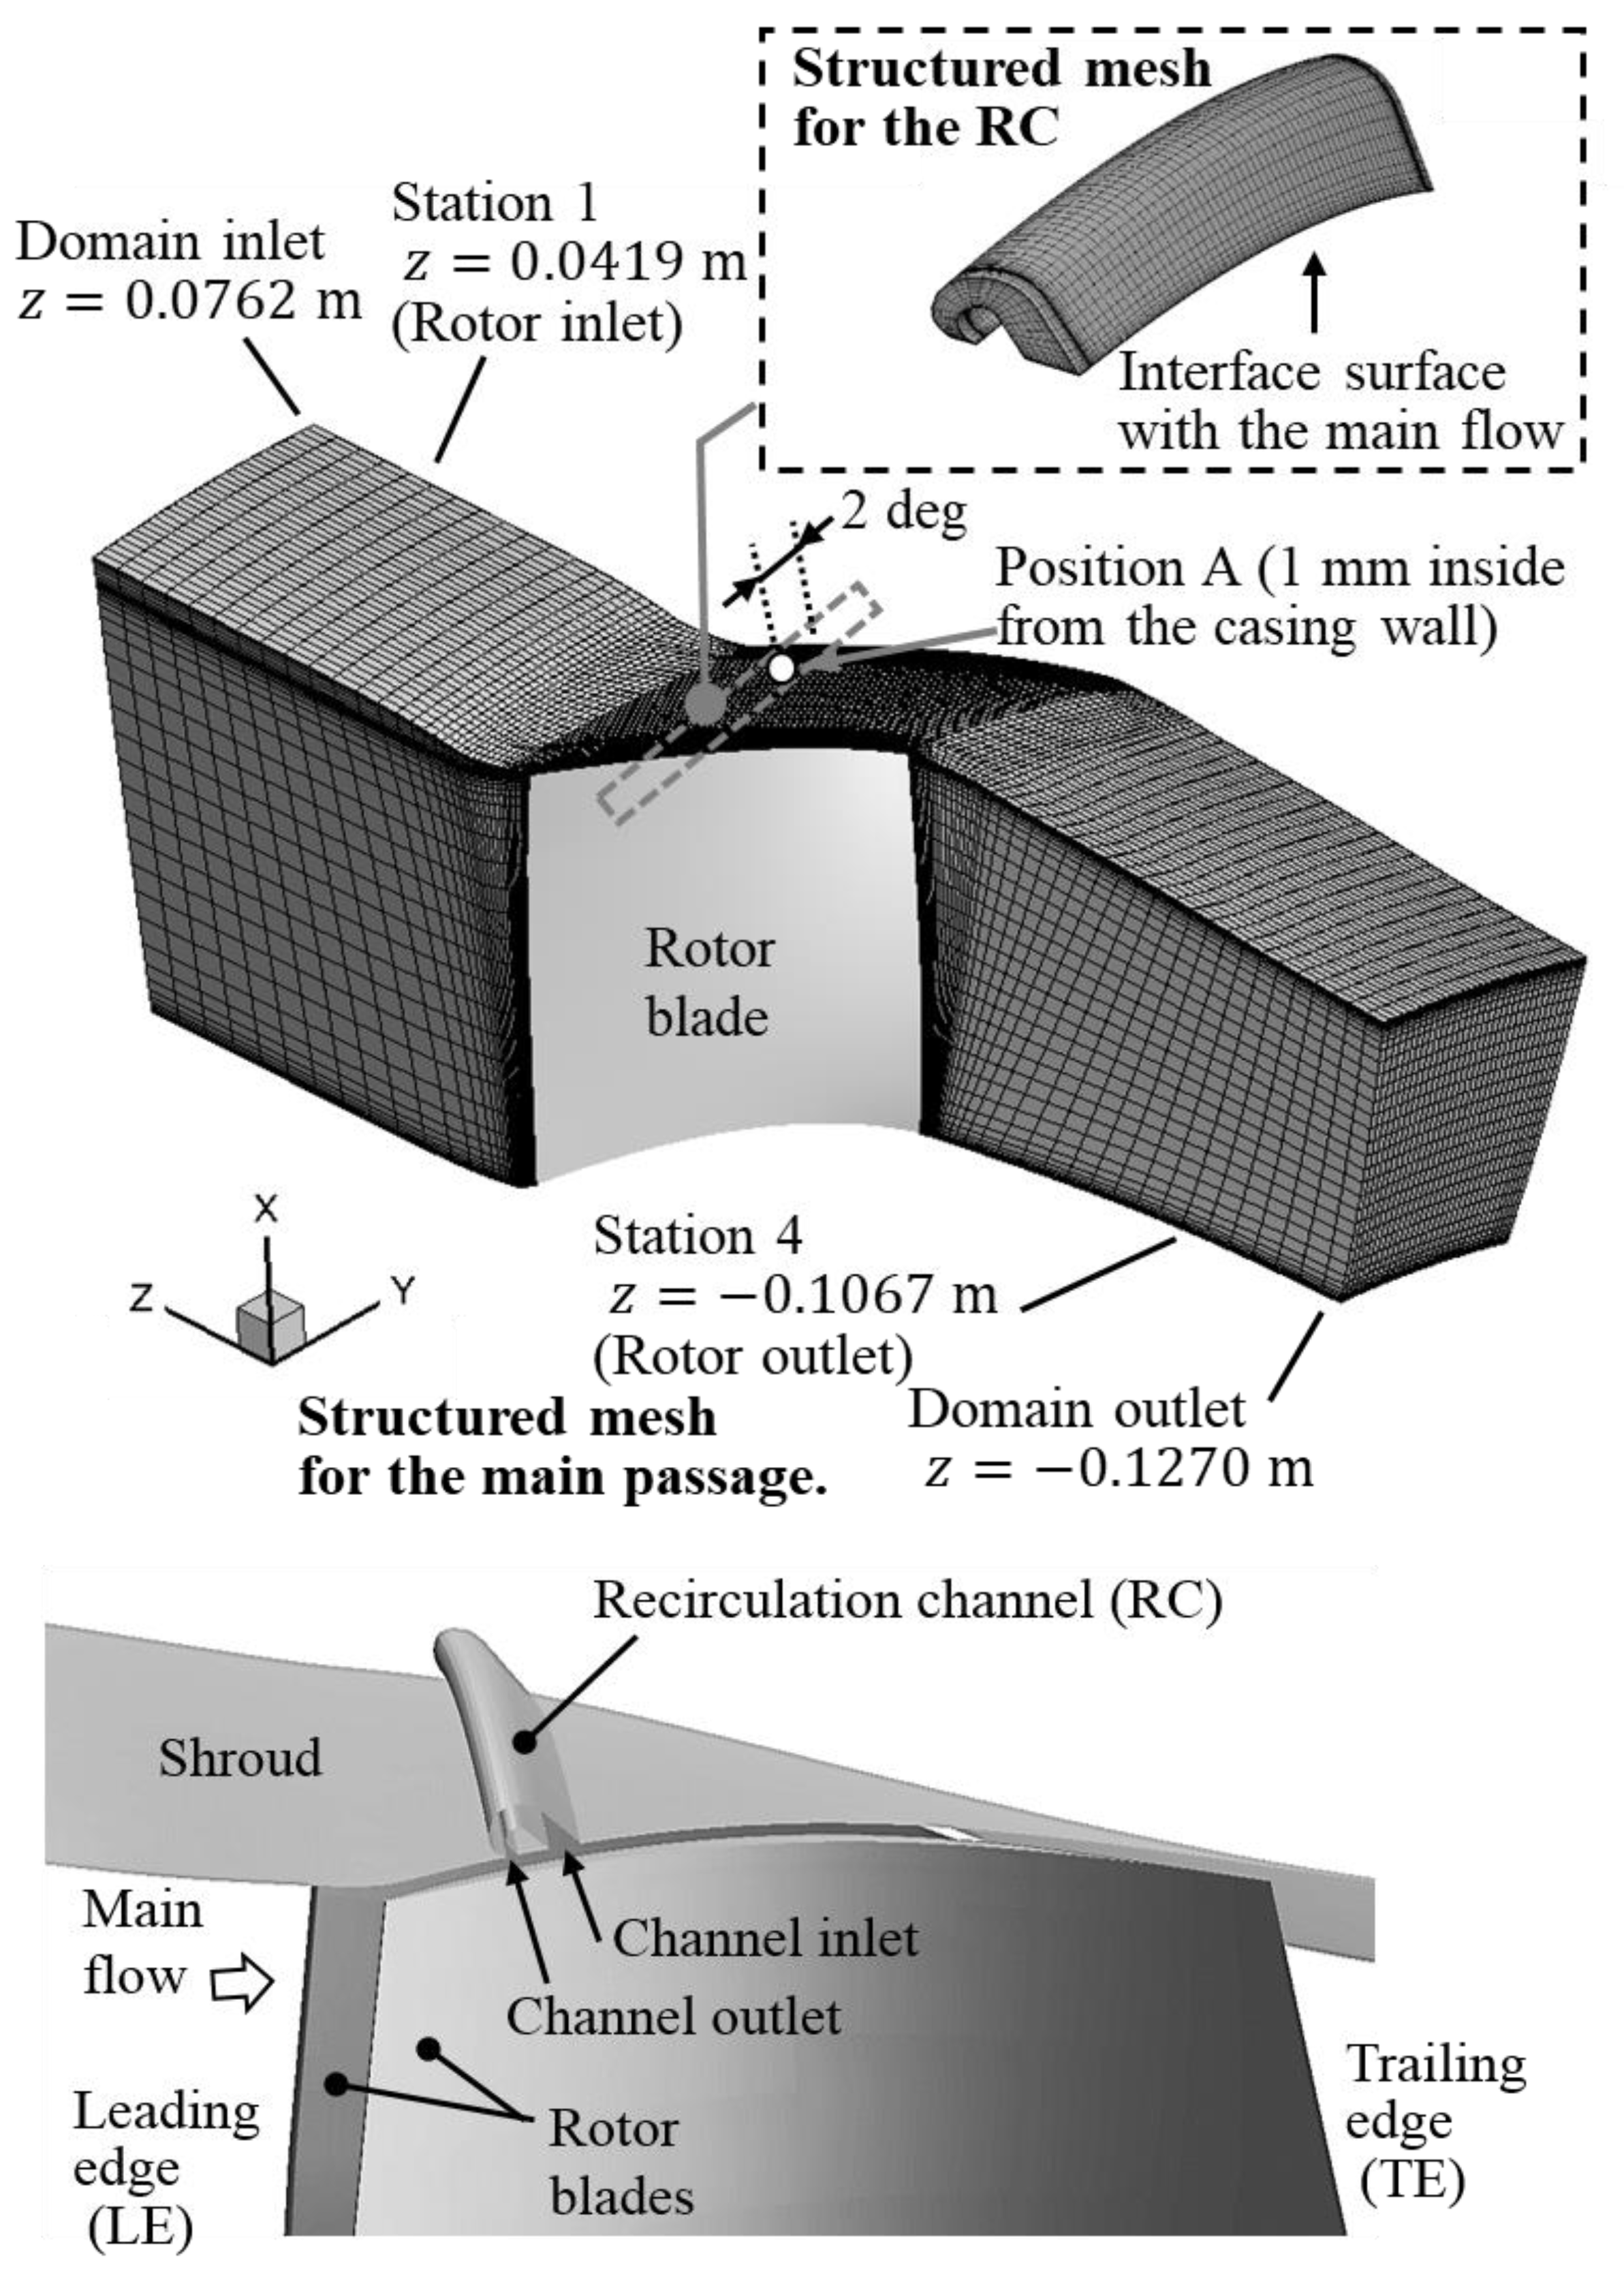
Following this two-dimensional analysis on the potential benefit of the inner wall chamfer, the influence on the compressor SM defined by Equation (1) is evaluated on the three-dimensional passage geometry of Figure 2. The three-dimensional steady RANS predicted the improvement of the compressor SM by 0.35% without adiabatic efficiency penalty by applying the chamfered inner wall. Thus, the chamfered inner wall was shown to be a more beneficial feature for the compressor tip flow than the original sharp inner wall. All subsequent evaluations of the recirculation channel design shown in this paper were conducted with the chamfered inner wall.

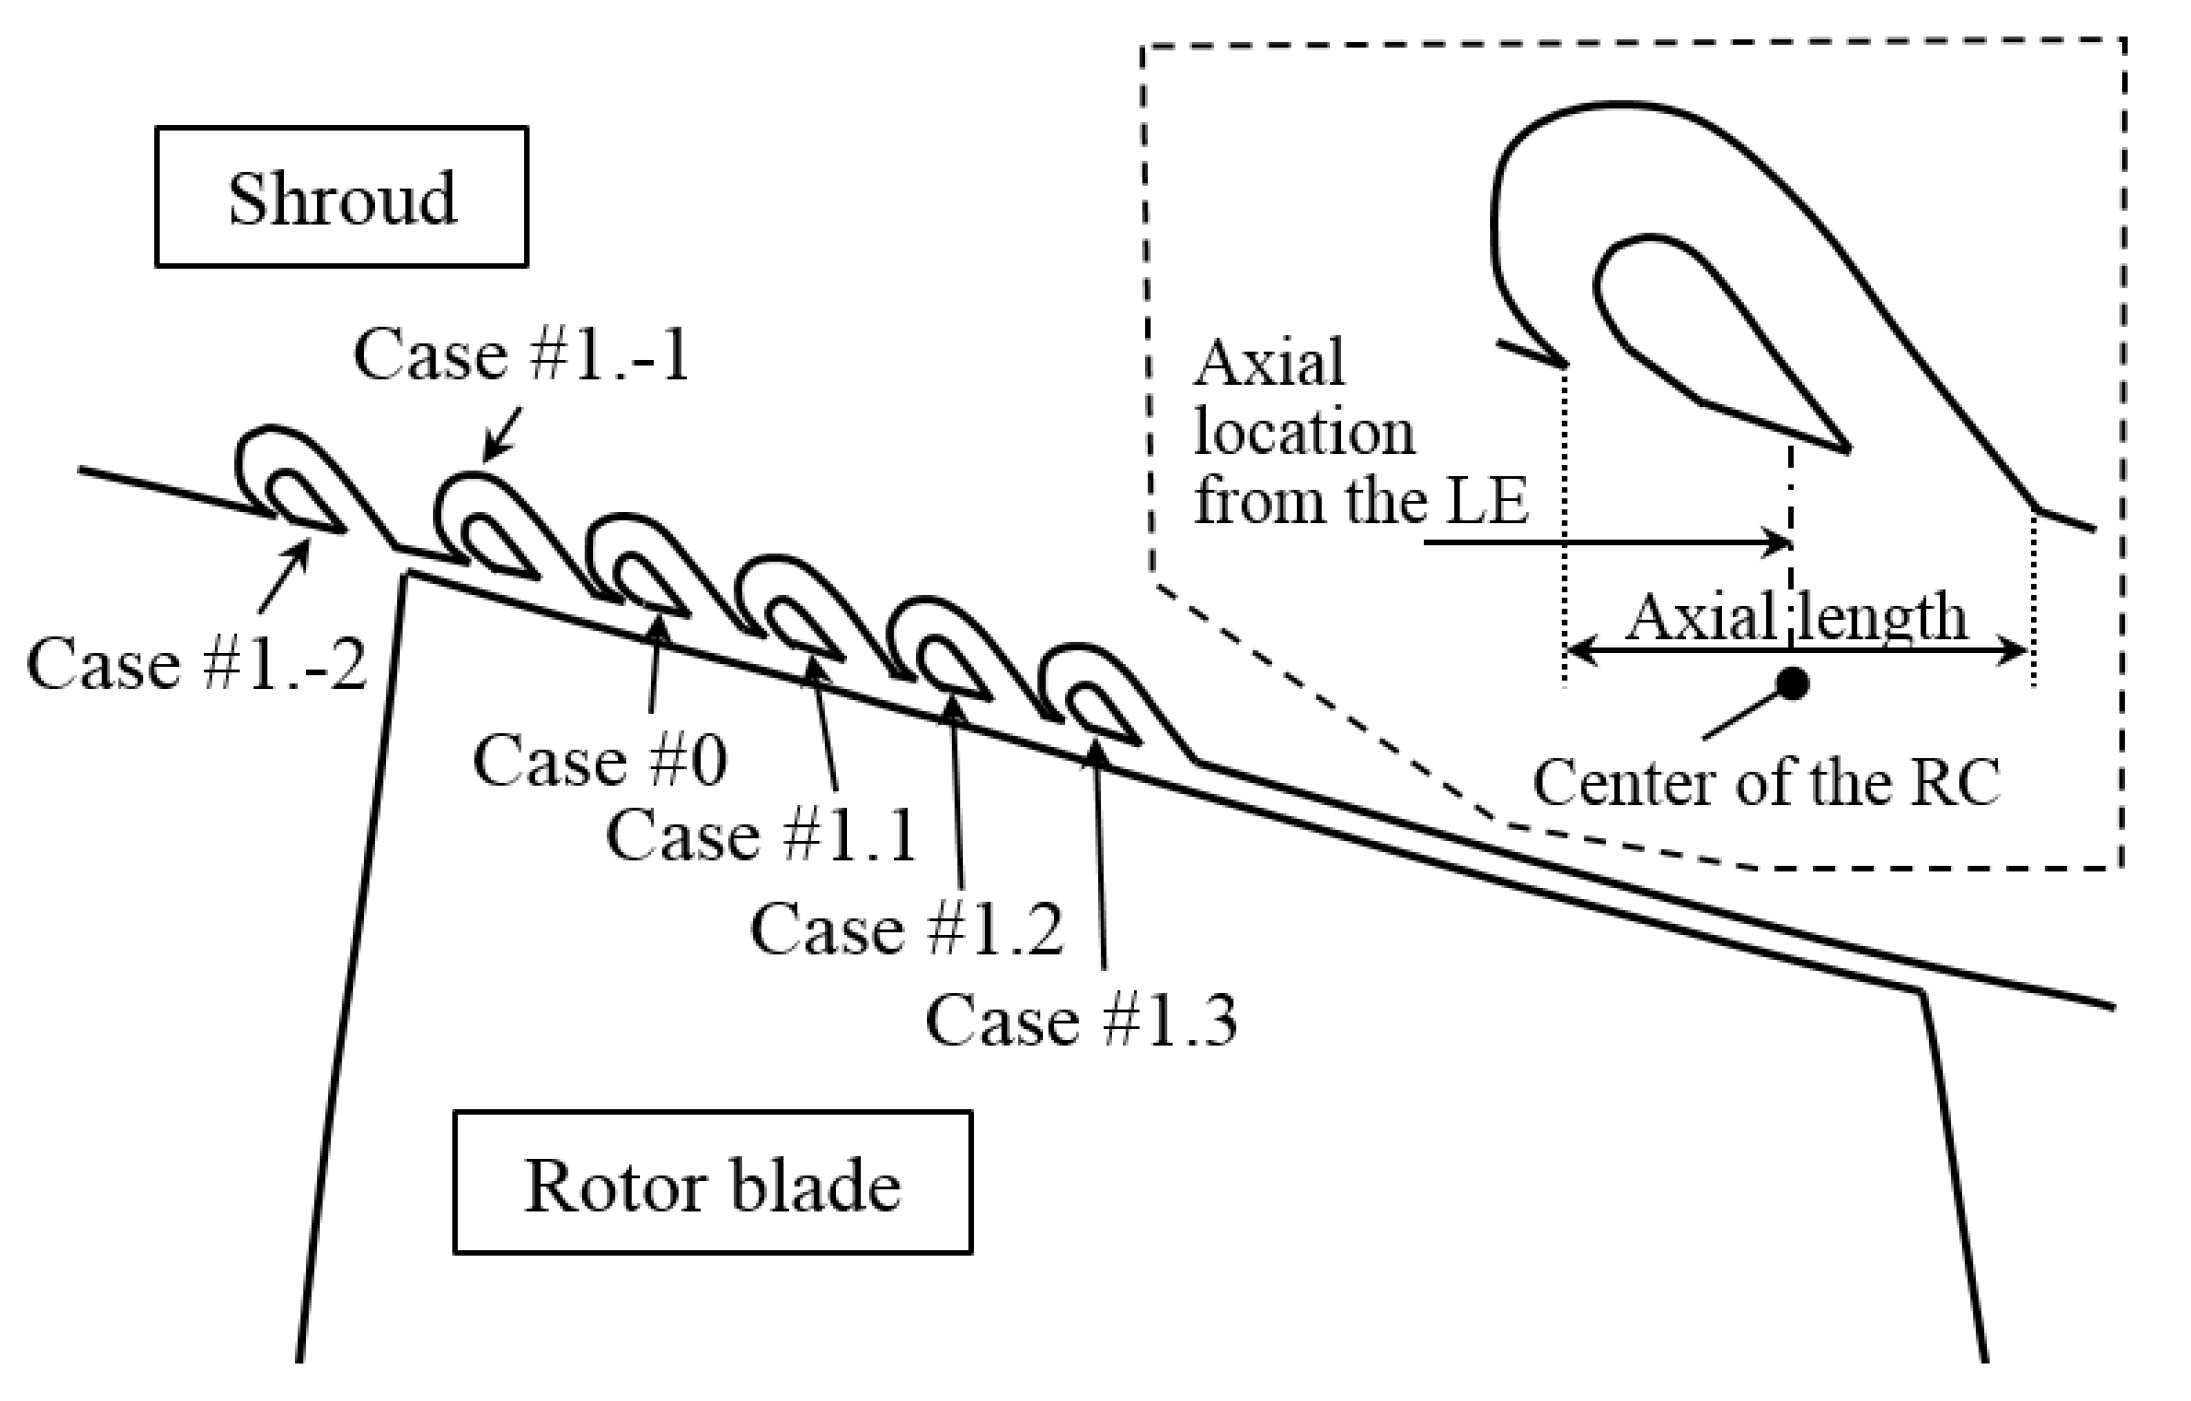
3.3. Parametric Study on the Channel Position: Half-Stage Performance

As stated in Section 2, the RC is designed to activate recirculating flow by the pressure difference between the channel inlet and the channel outlet. The static pressure at the channel inlet and at the channel outlet depends on the axial location of the RC. Hence, the axial position of the RC is likely to be an important factor in determining the RC performance. Therefore, a parametric study on the RC axial position is carried out to evaluate its effect on the compressor performance. Six different RC axial positions are tested, as shown by the meridional plane schematic of Figure 5. Table 3 lists the axial location and the axial length of each of them. The Case #0 RC in Figure 5 is located as in Figure 1. This datum recirculation channel is applied at about 0.2 axial chord lengths axially downstream from the blade leading edge, which is where the circumferential groove design gave the best stall margin in [8]. The stall inception is determined numerically for all six cases by progressively increasing the exit pressure boundary condition.
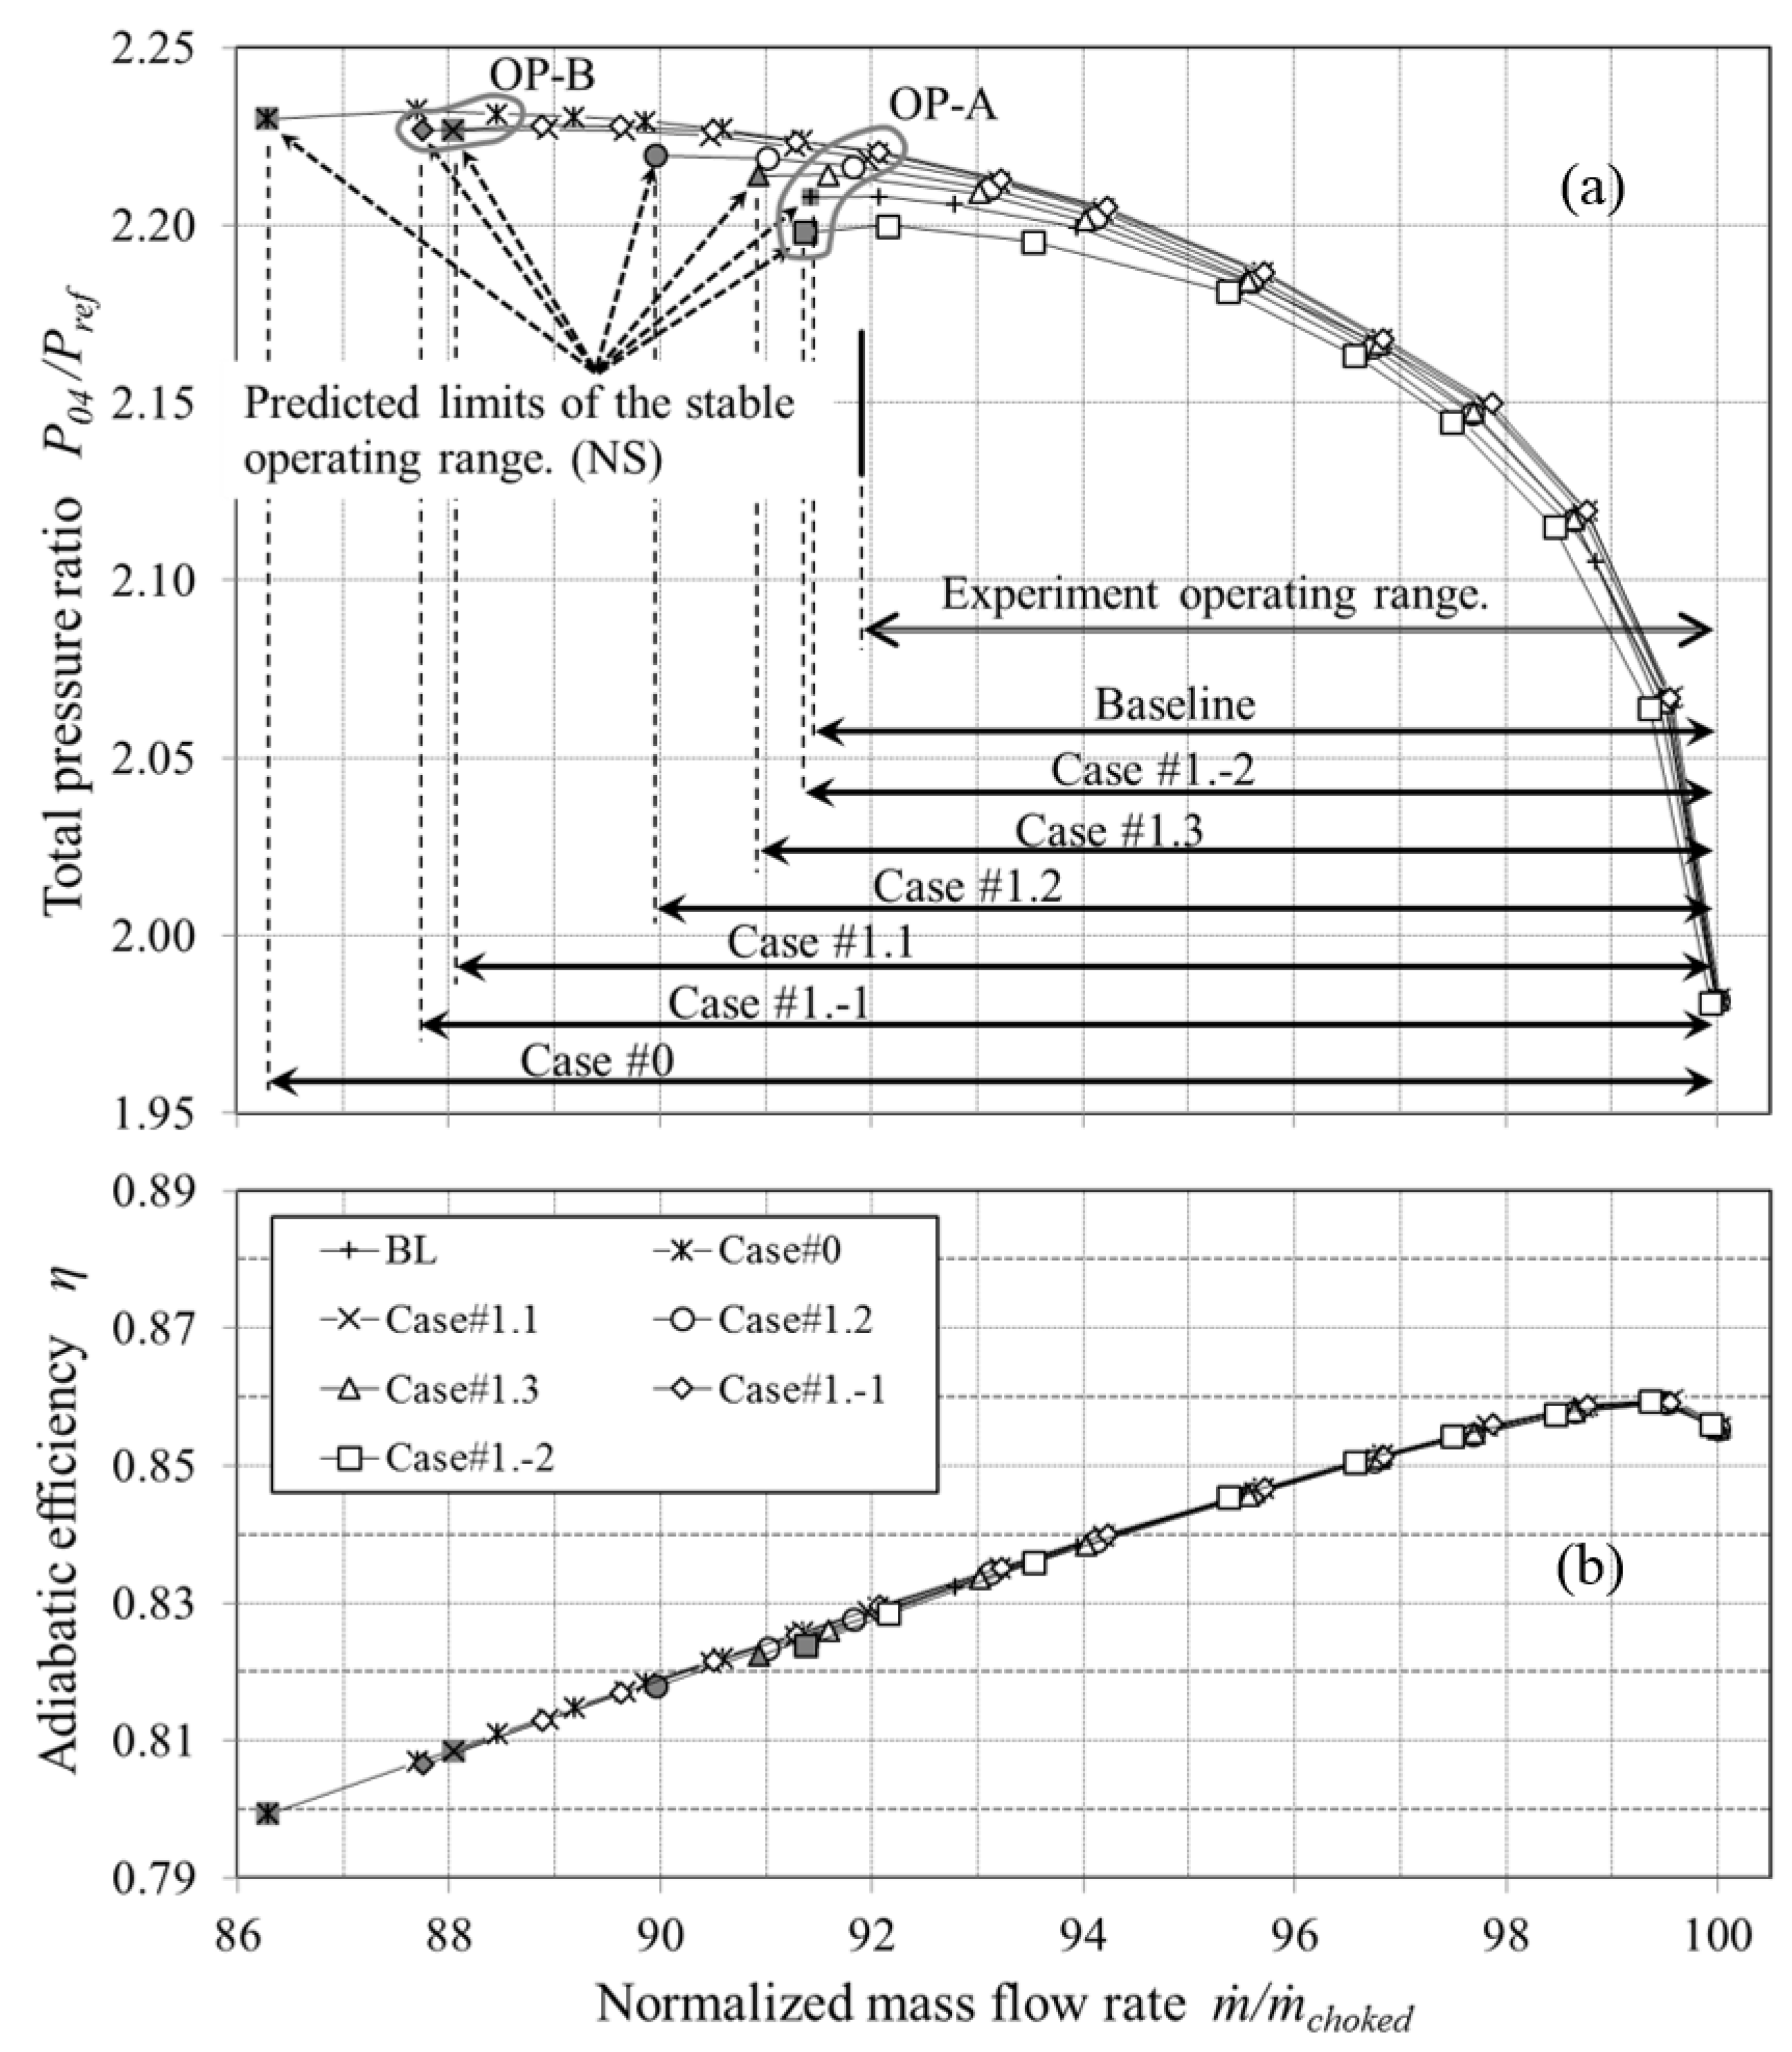
Figure 6 shows the comparison of the compressor performance characteristics among the six test cases. Figure 6a uses the same legend and abscissa as Figure 6b. The total pressure ratio in Figure 6a is calculated by the ratio of the total pressure predicted at the Station 4 to the reference upstream total pressure given in [18]. The adiabatic efficiency is calculated by Equation (2). The choked mass flow rate m ˙ c h o k e d predicted in the CFD of the baseline (BL) case is used to normalize the mass flow rate values of the abscissa. The final increment of the back pressure to detect the stall inception is 0.3% of the atmospheric pressure in all the calculations. The predicted limit of the stable operating range for each case is marked by the gray-filled symbol. The stable operating range in mass flow rate is highlighted by the arrow for each case at the bottom of Figure 6a. Among these test cases, Case #0 is predicted to have the widest operating range. The predicted stable operating range of the compressor rotor decreases as the RC is moved axially either way from the Case #0 position. Figure 6b shows that the rotor adiabatic efficiency is substantially unaffected by the presence of the RC, unlike with the casing treatments [6,7].
Figure 7a summarizes the variation of the compressor performance among the test cases. All values of the ordinate are calculated as the difference from the value of the BL case. The SM is calculated by Equation (1). Figure 7b shows the variation in the injected axial momentum over the compressor operating range. The normalized axial momentum M is calculated by M = ρ u r u a / ρ r e f ( U m i d ) 2 . A positive momentum means flow injection from the RC toward the main flow passage. All the cases except Case #1.-2 provides a better SM than the BL case. As shown in Figure 7b, the injected momentum in Case #1.-2 is much smaller than in the other cases, which indicates that Case #1.-2 RC does not work as intended in Figure 4. Both the Case #0 outlet pressure at the NS operating condition and the Case #0 adiabatic efficiency at the PE condition are the highest among the test cases. In Figure 7b, the intensity of the injected momentum in Case #0 increases almost monotonically up to the stall inception. This feature shows an interesting and welcome self-regulating property of the recirculation channel. Similarly, in Cases #1.1 to1.3, the intensity of the injected momentum tends to rise with compressor loading. At the same back pressure setting, the intensity of the injected momentum tends to decrease monotonically as the RC is placed axially more downstream than in Case #0. Placing the RC upstream than in Case #0 generates a different trend. In Case #1.-1, significant axial momentum injection occurs at low loading conditions. M increases with the outlet static pressure up to the outlet static pressure value 122 kPa. Above 122 kPa, the axial momentum injection intensity starts to decrease. At the NS condition of Case #1.-1, the intensity of the injected momentum is almost same as that of Case #0. This may explain why the operating range of Case #1.-1 is not wider than that of Case #0, although intense injection occurs in Case #1.-1 at low loading conditions. This difference is investigated further by the analysis of the corresponding flow structures presented in the next chapter.

3.4. Flow Structures over the Casing Wall with Recirculation Channel

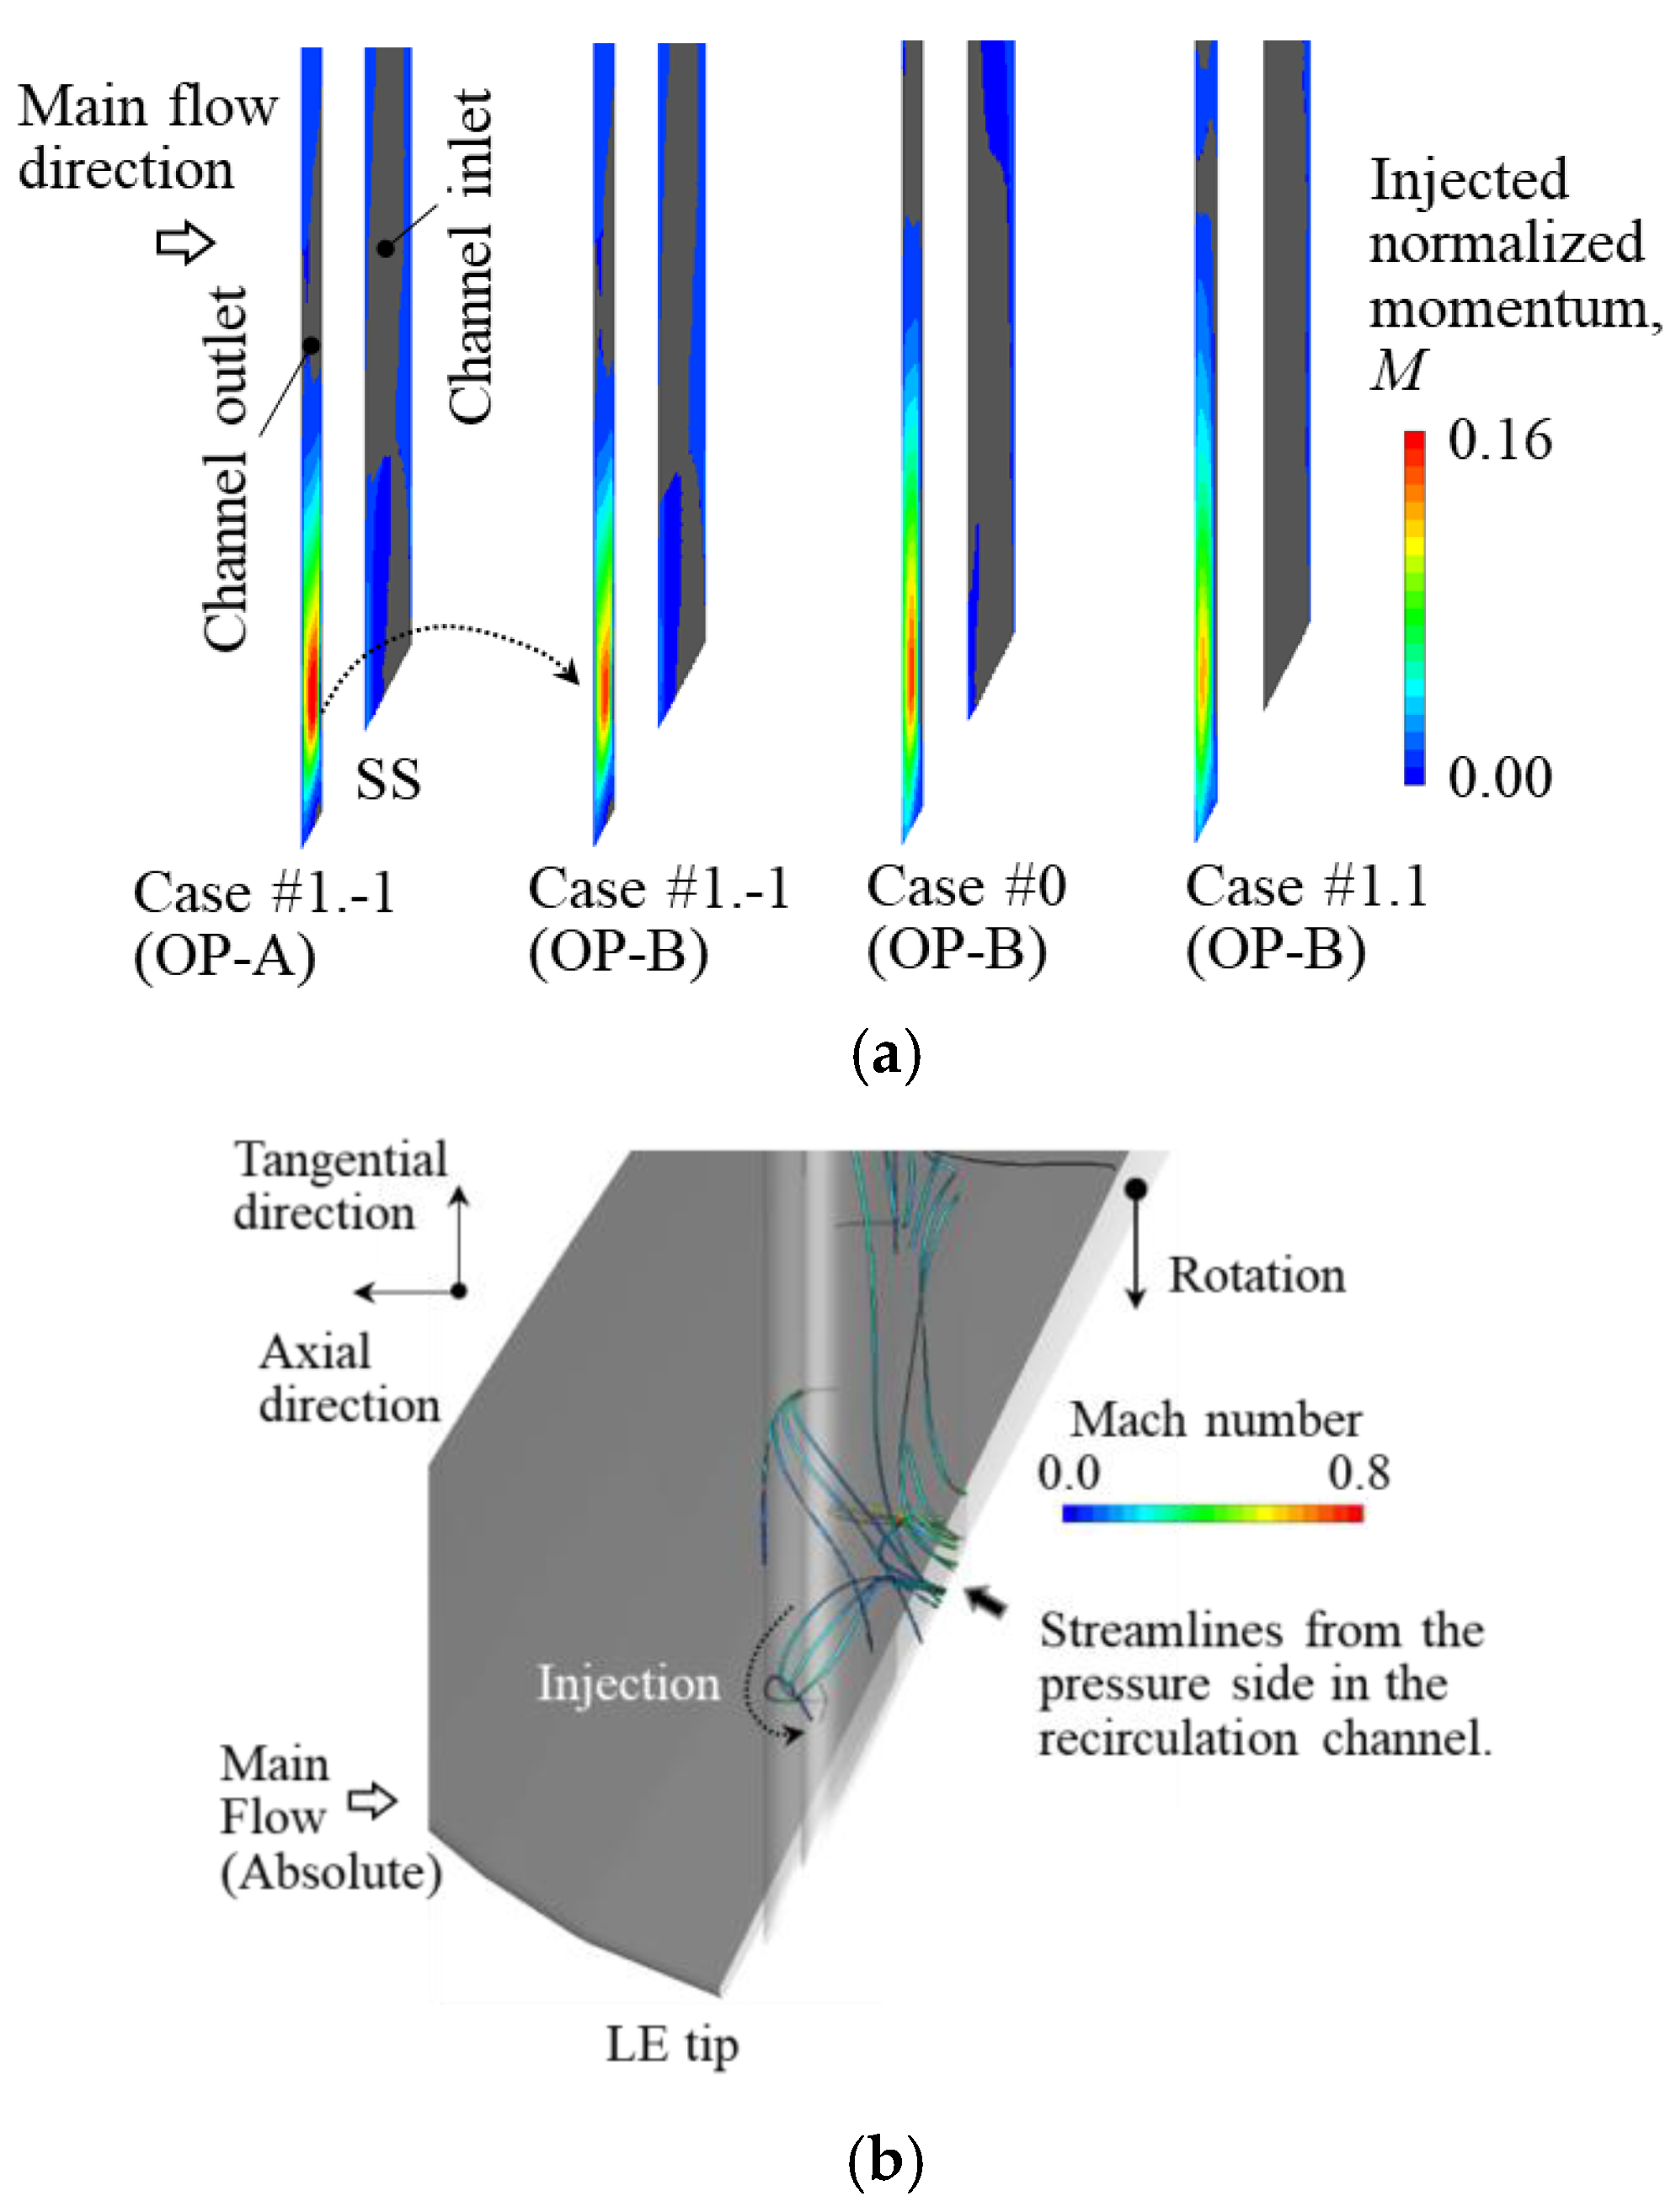
Figure 8a shows the distribution of the normalized momentum injected in the axial direction at the RC inlet and at the RC outlet. In all the cases shown in Figure 8a, the peak of the injected momentum in the axial direction is predicted at the channel outlet near the blade suction surface. The most intense flow injection is predicted at this point in Case #1.-1 at the operating condition OP-A. This reduces by increasing the compressor loading to the condition OP-B. Figure 8b visualizes the streamlines inside the RC, which are drawn from the absolute velocity field of Case #1.-1 at OP-A. In Figure 8b, the inner and outer walls of the casing channel are displayed transparent to show the trajectory of the streamlines. The streamlines related to the intense flow injection of Figure 8a come from the PS of the rotor blade. This indicates the recirculation flow inside the casing channel is driven by the pressure difference between the blade SS and the blade PS. 
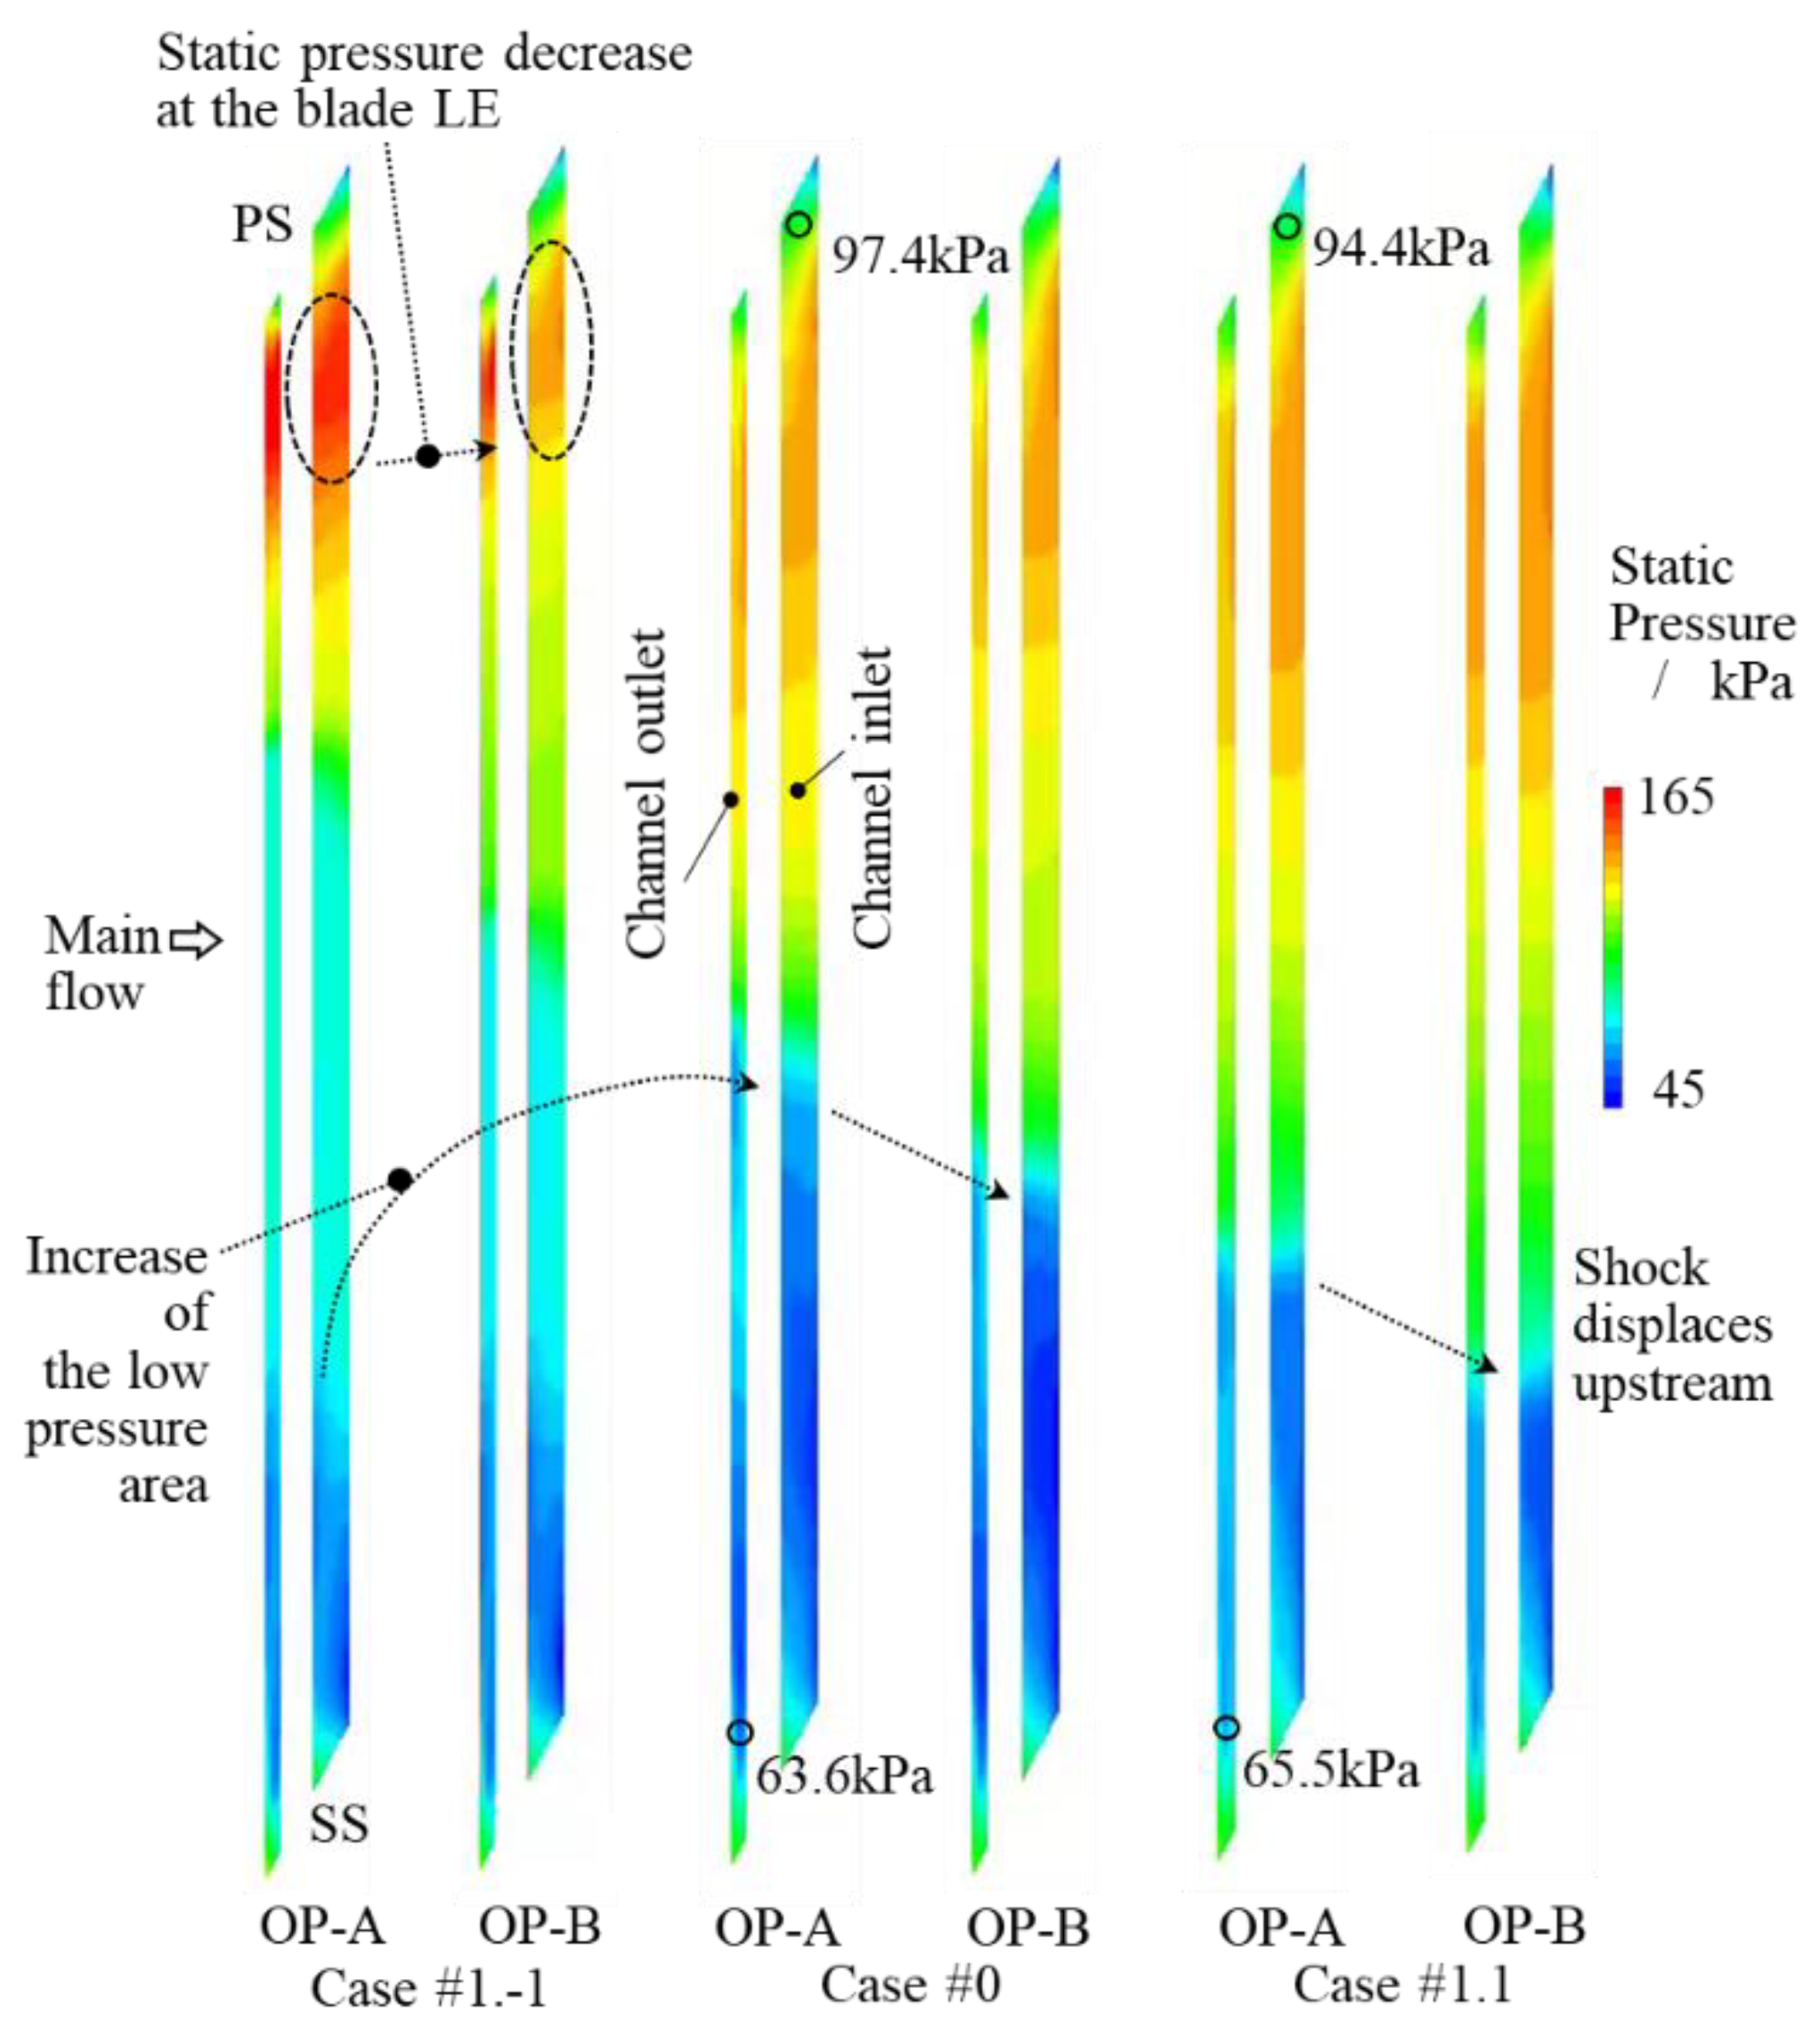
Figure 9 shows the static pressure distribution at the RC inlet and outlet. This is mainly determined by the positioning of the main passage flow structures, such as the passage shock front. In Case #1.-1, high static pressure sits in at the channel inlet at the operating condition OP-A because of the RC inlet being just behind the leading edge shock. This high pressure promotes the recirculating flow inside the casing channel. By increasing the compressor loading to the operating condition OP-B, the location of the passage shock front shifts upstream of the compressor rotor leading edge, pulling the high static pressure behind the shock with it, away from the channel inlet. This causes the static pressure at the channel inlet to decrease, as shown in Figure 9. This is likely to be the main reason for the decrease in axial momentum injection at the high loading condition in Case #1.-1 shown in Figure 8a. The predicted static pressure distribution at the channel outlet across one blade pitch is shown for Case#0 and Case #1.1 in Figure 9. A region of high pressure, encircled by a dashed line ellipse for Case #1.-1 in Figure 9, is located close to the blade pressure side. This location is pitchwise just ahead of the advancing blade that pressurizes air by a scooping action. The pressure difference between the channel inlet and the channel outlet across the blade thickness created by this action is lower with a casing treatment located more downstream, as shown by Case #0 and Case #1.1 in Figure 9. This is likely to be the reason why the momentum injection in Figure 7 is lower in Case #1.1, Case #1.2, and the Case #1.3 than in Case #0 at the same operating condition.
Figure 8 and Figure 9 highlighted how the flow through the recirculation channel inlet and outlet responds to changes in the main passage flow structures. 
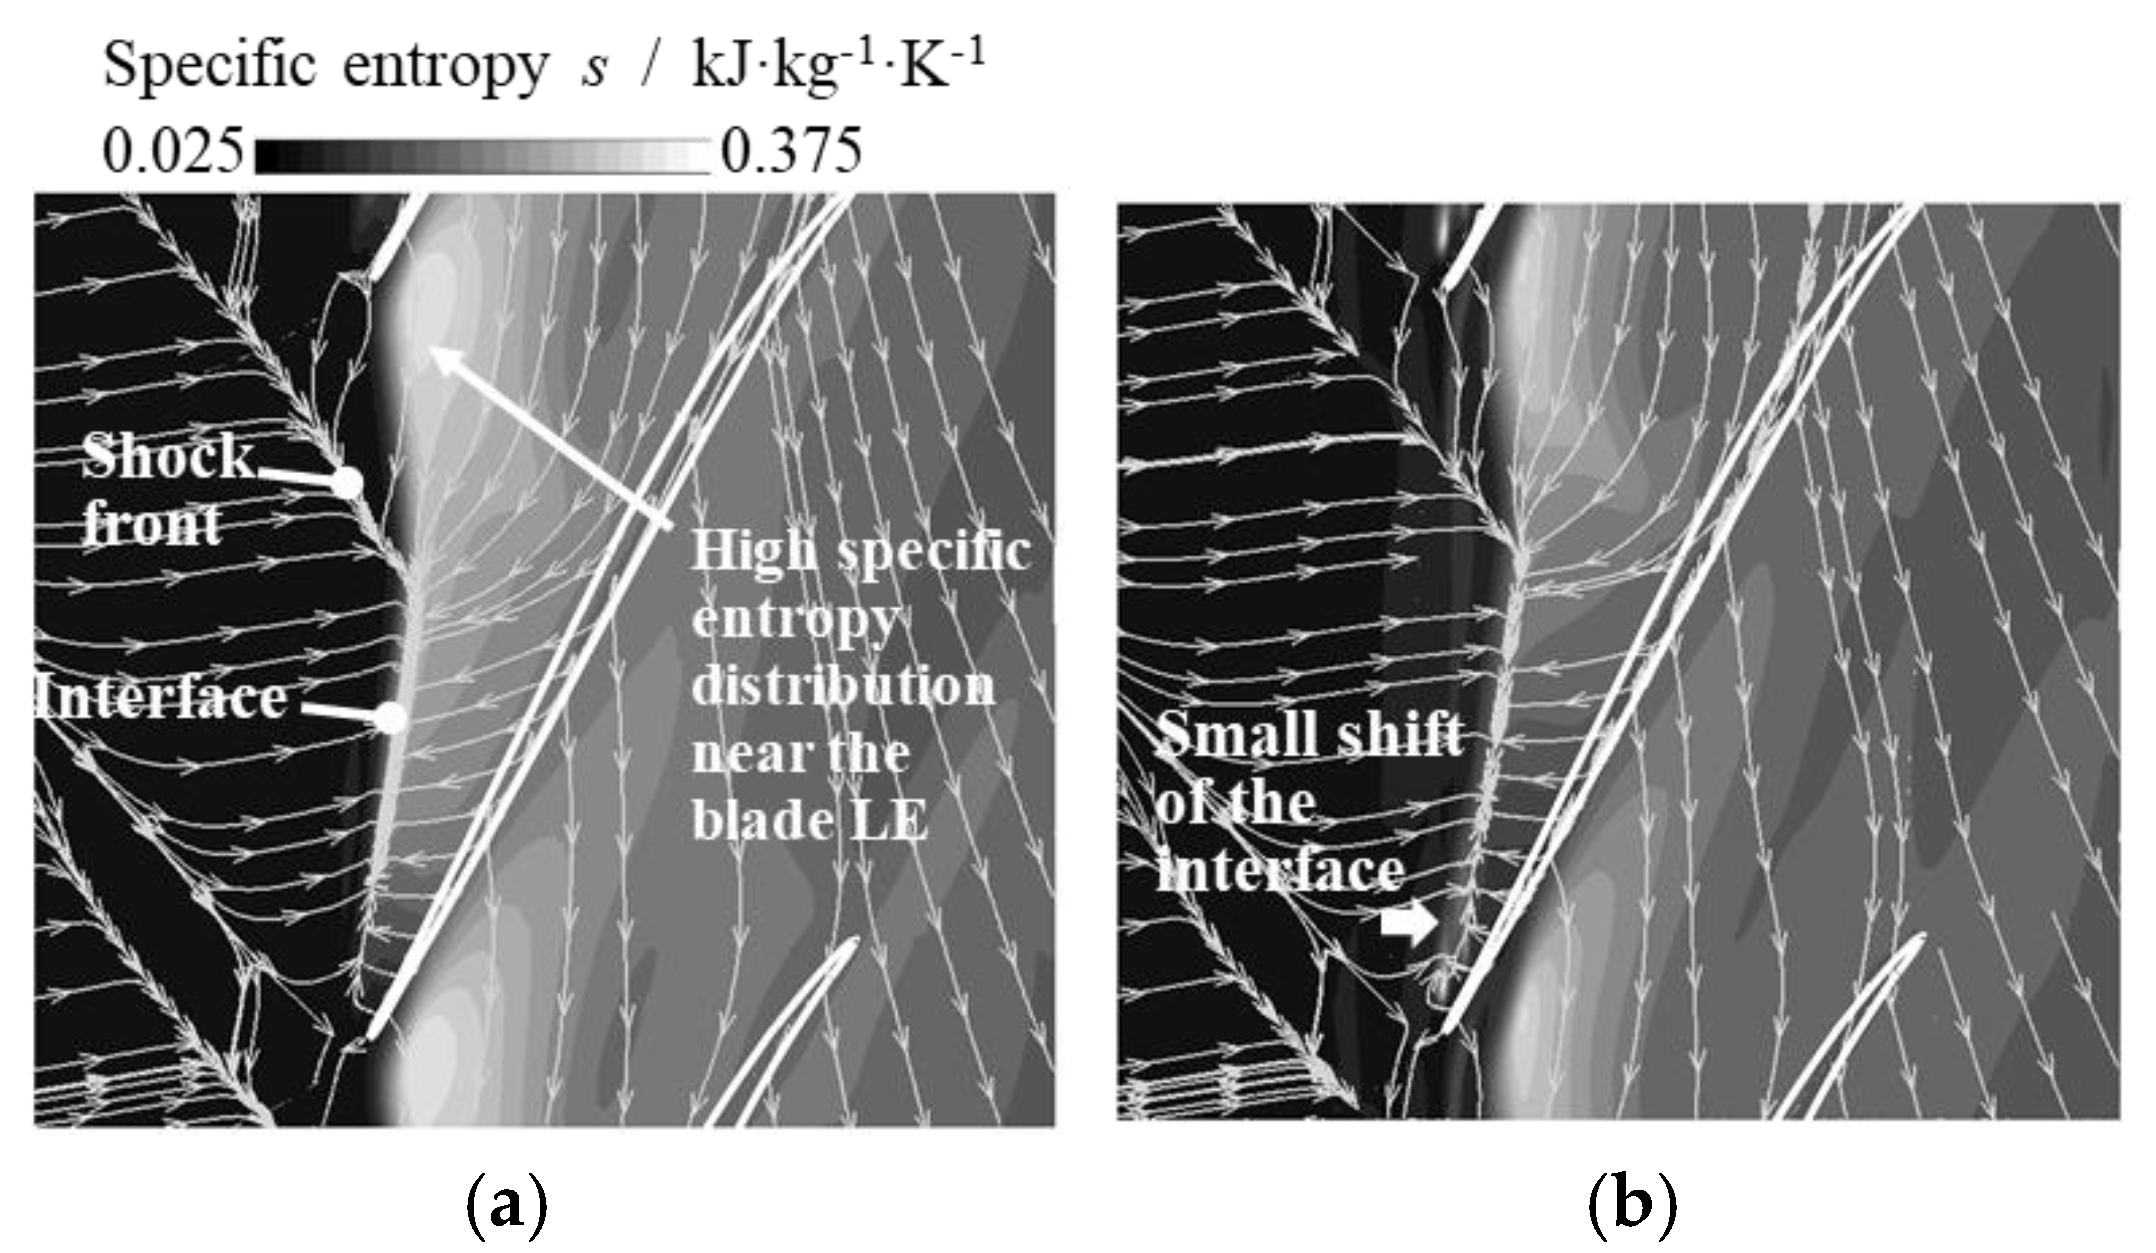
Figure 10 shows how the near-casing flow structure changes more in detail, by surface streamlines and specific entropy color iso-levels near the casing wall. The surface streamlines are drawn by the absolute velocity field. The specific entropy s is calculated as:
s = C p ln ( T 0 T 0 i n ) R ln ( P 0 P 0 i n ) ,
where T 0 is the total temperature, P 0 is the total pressure, C p is the specific heat capacity at constant pressure, R is the specific gas constant, and subscript i n denotes the computational domain inlet condition.
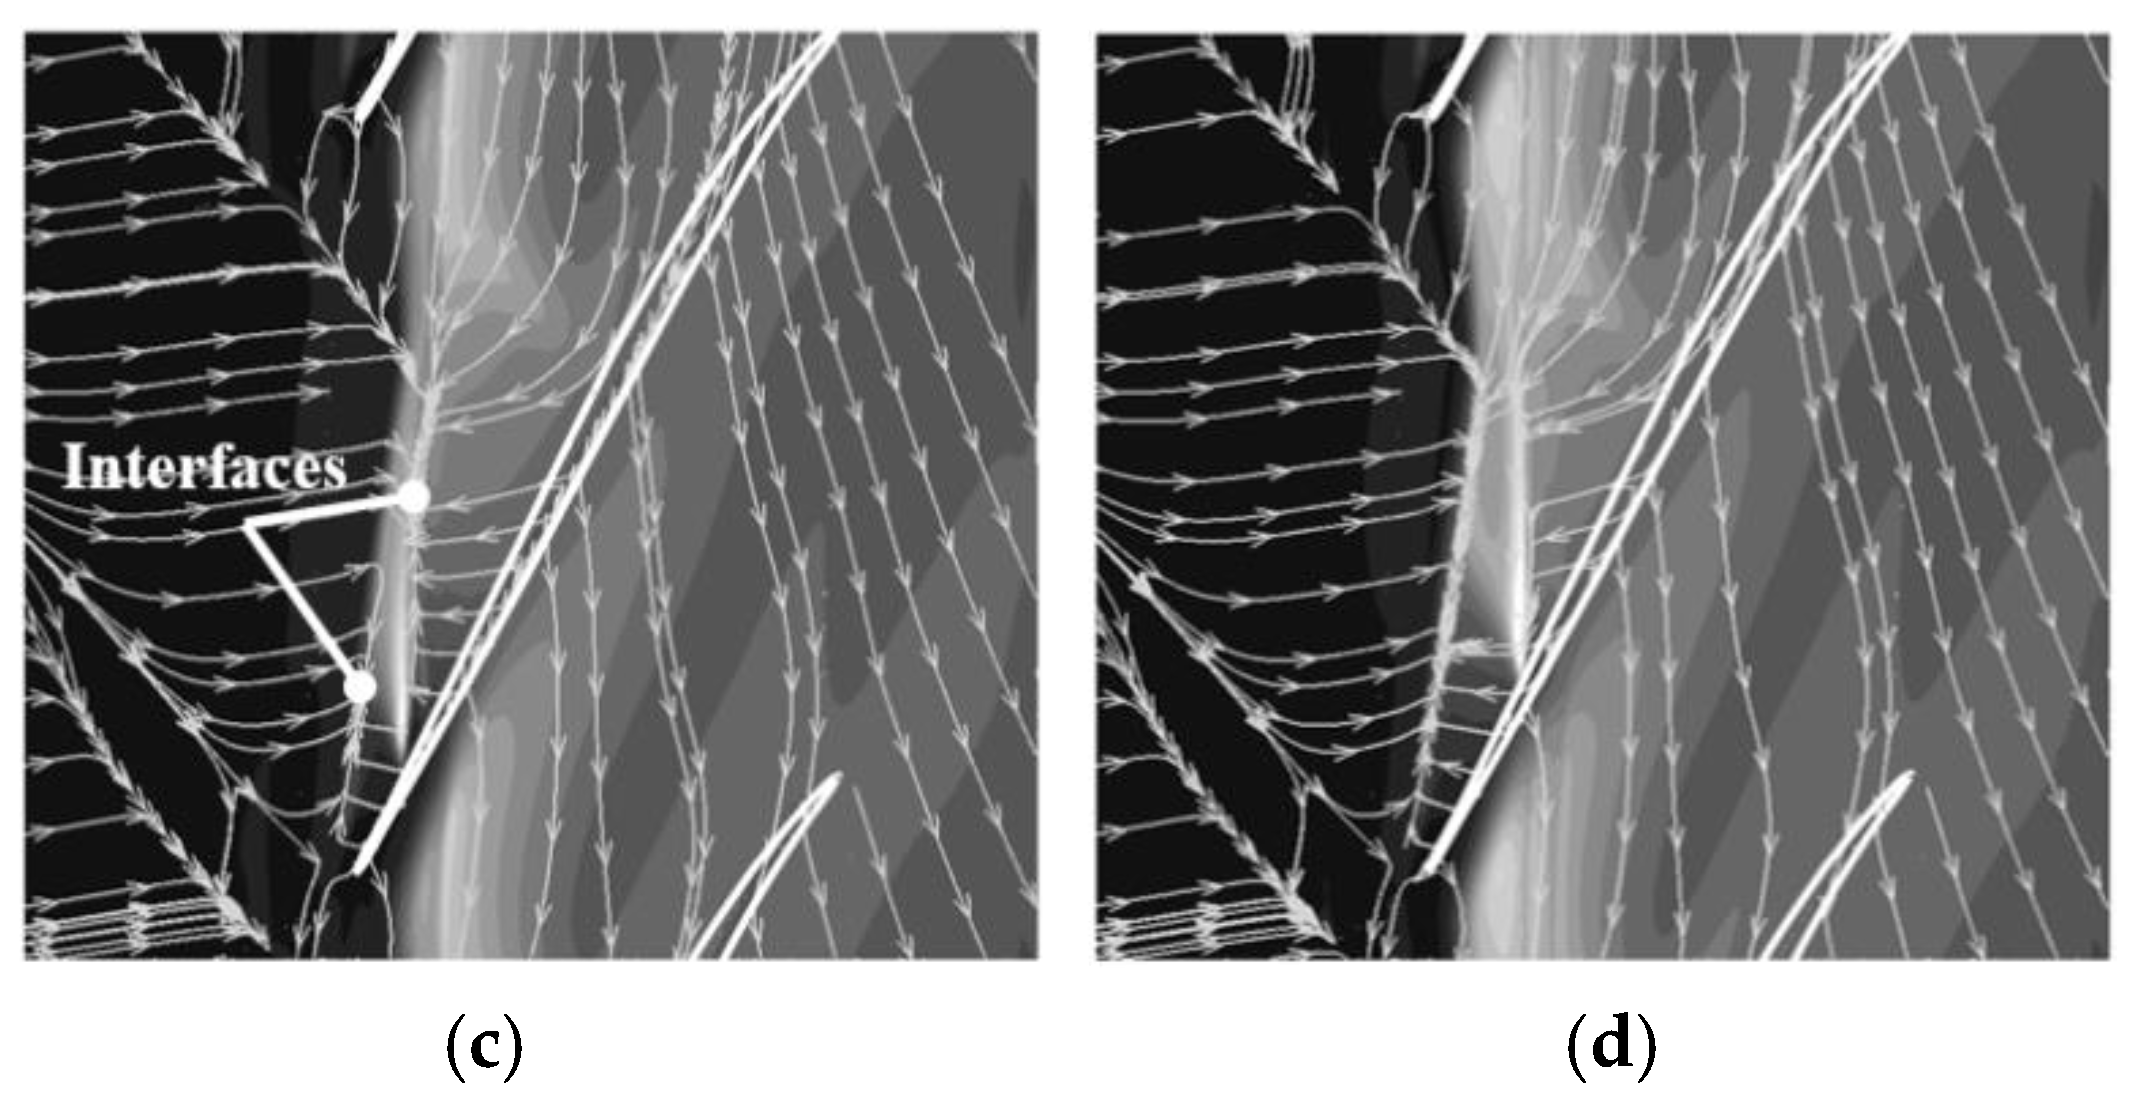
The surface streamlines and the specific entropy color iso-levels near the casing wall of the BL case, Case #1.-1, Case #0, and Case #1.1 are compared at the same operating condition (OP-A). In the BL case of Figure 10a, an interface, or confluence, forms between the inflow and the reversed tip leakage flow from the rotor tip clearance, which is labelled “Interface” in Figure 10. Over the casing wall, a substantial area is wetted by reversed flow from the blade PS, which causes the near-casing specific entropy between the blades to be high. In the BL case, this high specific entropy region extends to the immediate vicinity of the blade LE, as shown by the arrow in Figure 10a. In Case #1.-1 of Figure 10b, the interface displaces slightly downstream. By this, the reversed flow area reduces in Case #1.-1 compared to the BL case. The high specific entropy distribution near the blade PS LE is also mitigated in Case #1.-1 compared to the BL case. As the operating condition OP-A for Case #1.-1 is still away from the operating-range left limit of Figure 6a, the passage shock front sits closer to the blade LE than in the BL case. Figure 10c shows that the interface of Figure 10a is split into two separate interfaces in Case #0. The second interface is created further downstream than in Figure 10a, at a greater axial distance from the rotor blade LE axial plane. The location of the second interface corresponds to the position of the channel outlet. The predicted specific entropy is high around the channel outlet, due to the interaction between the main passage flow and the injected flow from the casing channel. However, the specific entropy near the blade LE in Case #0 reduces compared to the BL case of Figure 10a. A flow structure with two interfaces is also predicted in Case #1.1. Compared to Case #0, the first interface of Case #1.1 in Figure 10d is longer and the specific entropy level near the blade LE is higher. This indicates the RC in Case #1.1 provides a less beneficial change to the flow structure over the casing wall compared to Case #0.

3.5. Effect on the Passage Flow Structures

Figure 11 shows how the flow blockage created in the main passage changes with the axial location of the RC. The boundary surfaces of the flow blockage are identified by iso-surfaces of zero axial velocity. These boundary surfaces are colored by the radial distance from the casing wall of the BL geometry normalized by the radial height of the main flow passage. The rotor tip clearance is about 0.8% of the passage radial height. The blockage created by the rotor tip leakage is visualized at two different operating points: OP-A and OP-B of Figure 6a. Figure 11a visualizes the flow blockage in the BL case at its near-stall condition (OP-A). This blockage is caused by the volume between the zero-velocity iso-surface of Figure 11a and the casing becoming filled by low-velocity fluid from the breakdown of the tip leakage vortex. This is an unwanted feature. In the cases with the RC (Case #1.-1, Case #0, and Case #1.1), the predicted blockage volume at the same operating condition (OP-A) is visibly smaller than in the BL case. Furthermore, at this operating condition, the blockage volume of Case #1.-1 looks smaller than that of Case #0 and of Case #1.1. This clarifies the effect of the RC injection described in Figure 7 and Figure 8 on the main passage flow. Case #1.-1 provides the most intense injection of axial momentum that adds to the main passage flow. This transfers axial momentum to the main passage flow, so that a greater portion of the main passage fluid moves in the positive axial direction, toward the passage exit. This reduces the reverse flow volume close to the casing, as shown in Figure 11b. In Case #0, the flow blockage is partly suppressed at the middle pitch of the RC outlet, while it is bulged at the channel outlet near the blade LE. This is probably caused by the radial velocity component of the injected flow from the casing channel, which locally deflects the flow in the negative radial direction just below the RC outlet in the two-dimensional numerical prediction of Figure 4a. At the higher loading condition (OP-B), the volume of separated flow near the casing is larger than that at OP-A for the three cases (Case #1.-1, Case #0, and Case #1.1). This most likely causes a higher blockage. The size of the volume of separated flow in Case #1.1 is larger than that of Case #0 and a larger blockage appears to be generated around the blade LE on the blade pressure side in Case #1.1. This is consistent with the earlier stall inception predicted in Case #1.1 in Figure 6a than in Case #0.
Figure 12 shows how the blade loading near the casing is changed by the action of the RC. Specifically, Figure 12 shows the normalized static pressure distribution at 0.98 span from the rotor blade root. 
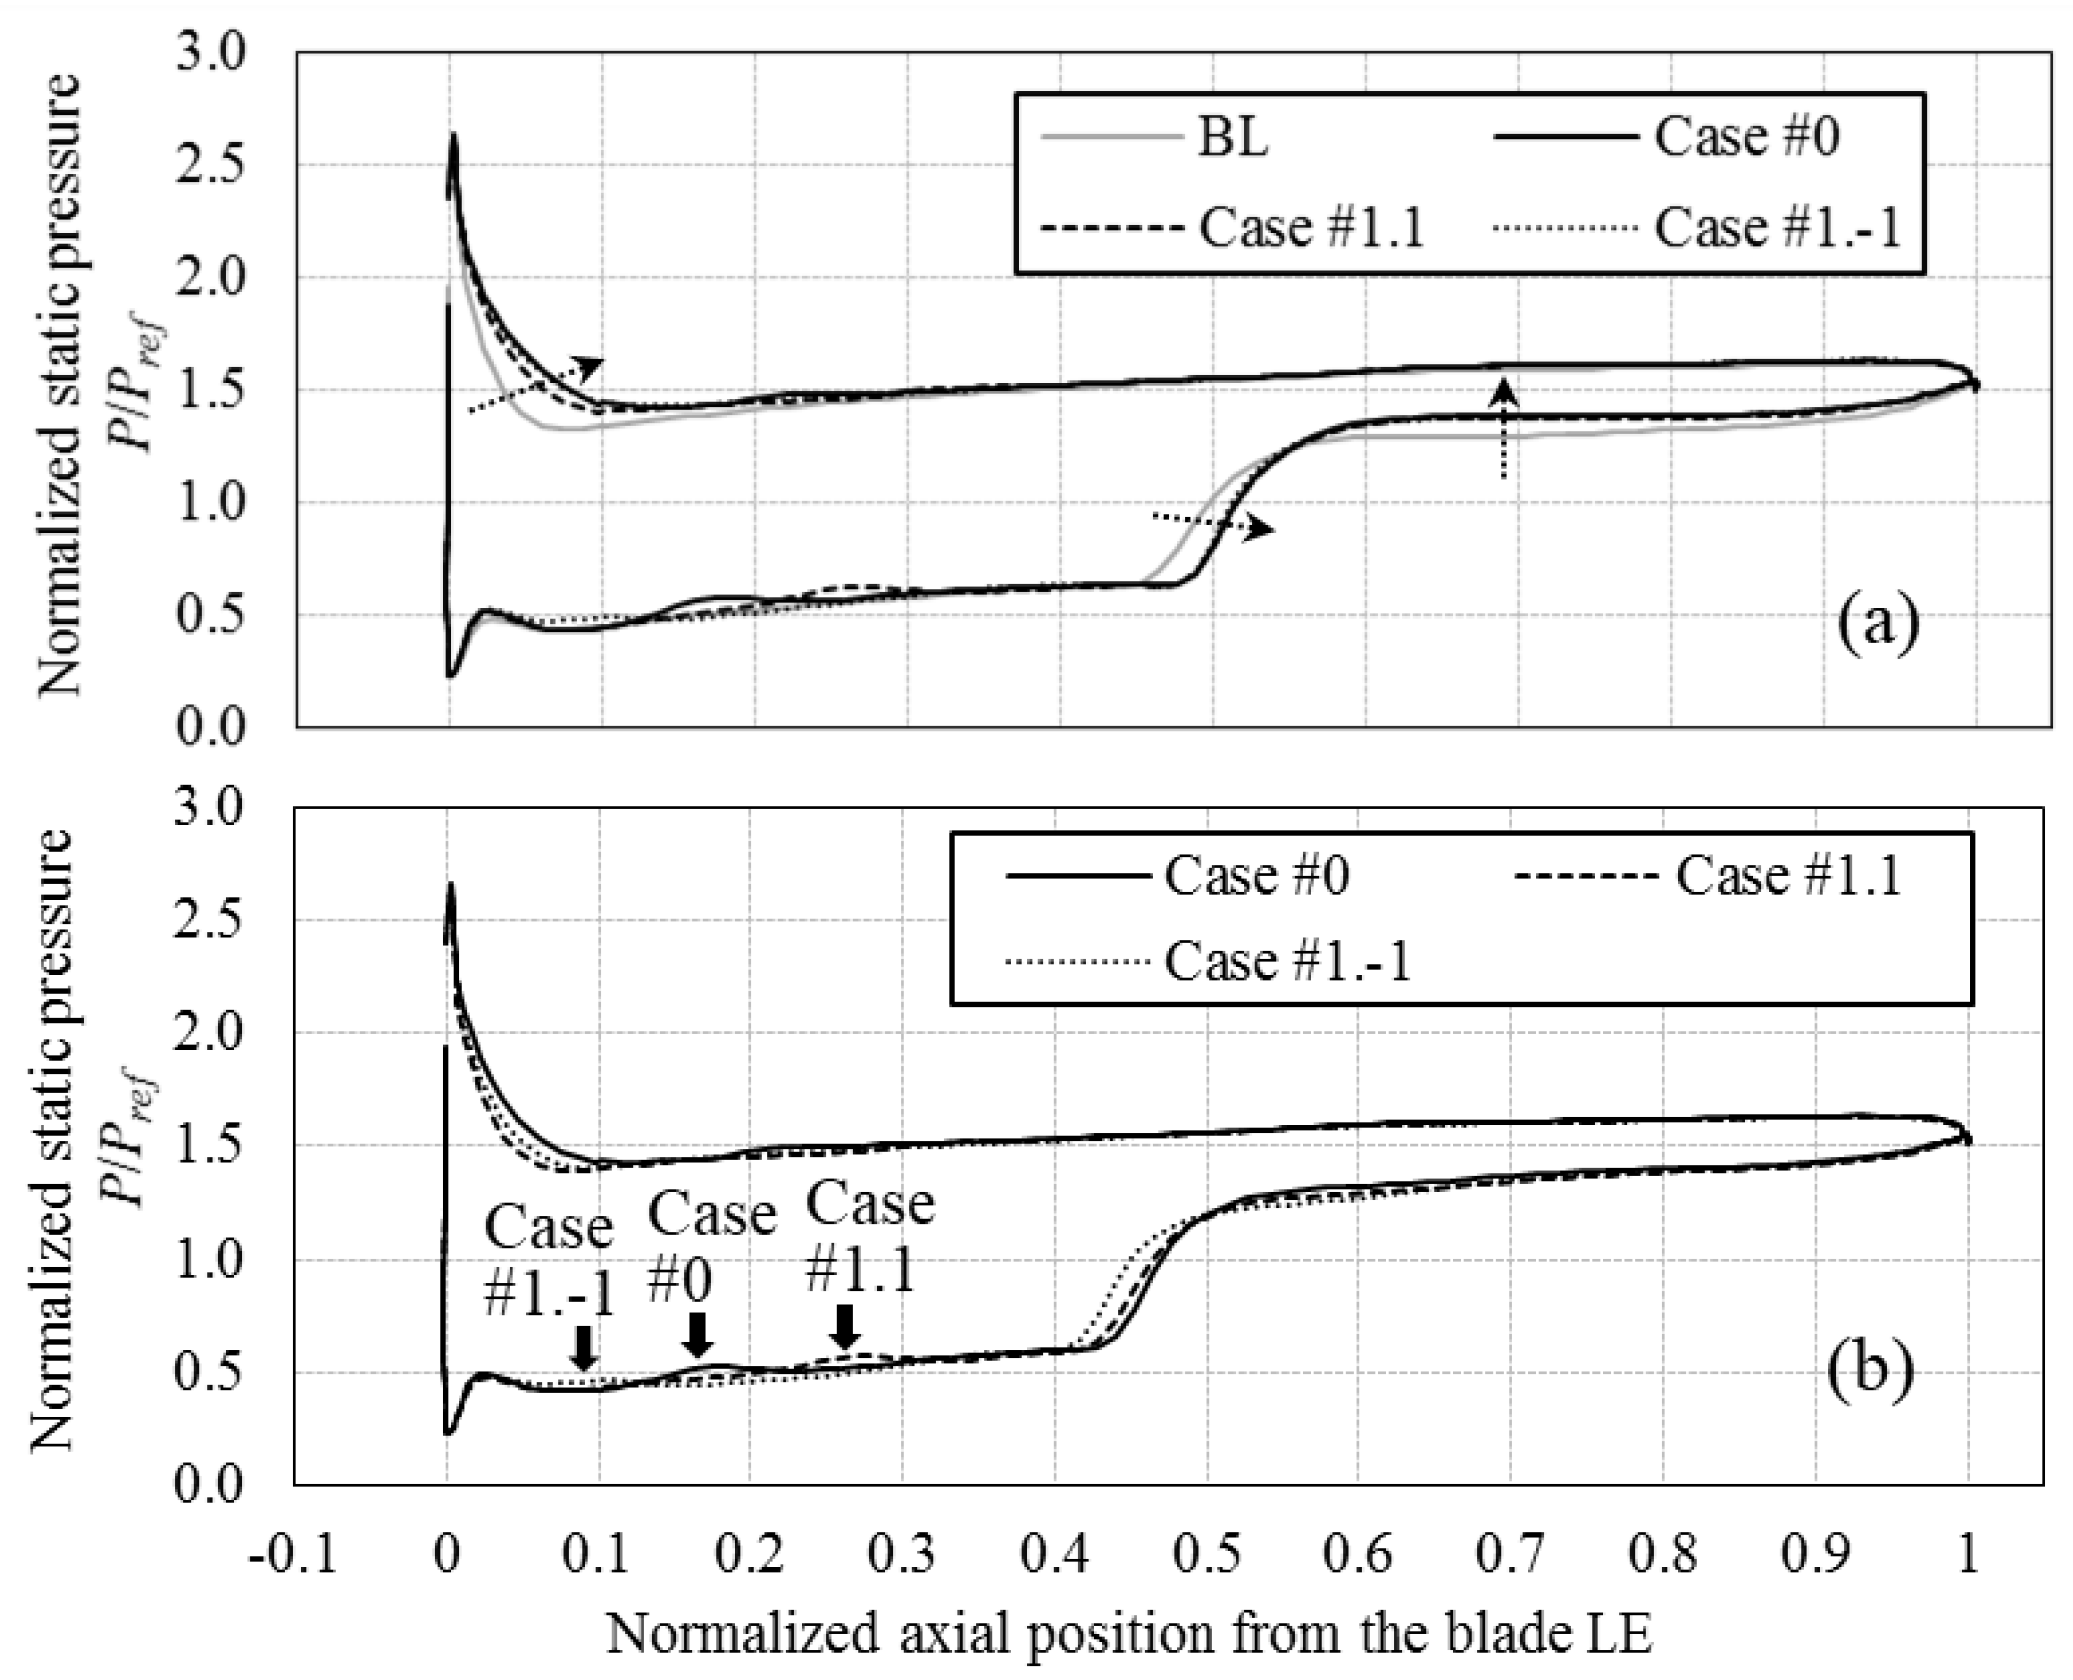
Figure 12a compares the blade loadings among four cases at the operating condition OP-A, which corresponds to the stable operating range limit of the BL case. Figure 12a shows that adding the RC reduces the sharpness of the normalized static pressure peak on the PS leading edge. The flow induced through the channel requires a positive pressure difference between the channel inlet and outlet. The broadening of the pressure peak towards the blade trailing edge provides pressure at the channel inlet and therefore benefits the production of the controlling flow through the RC. Over the blade suction side, Figure 12a shows that adding the RC moves the axial location where the passage shock impinges on the blade surface from about 0.46 axial chords to about 0.49 axial chords. The pressure rise across the shock, as indicated by the vertical arrow in Figure 12a, slightly increases. Figure 12b shows corresponding results of blade loading at the operating condition OP-B. This figure does not include the result of the BL case, as the BL case stalls at a lower pressure ratio and therefore never reaches this operating condition. Figure 12b shows that changing the RC axial position affects the location where the passage shock impinges on the blade suction side (SS). This is displayed in Figure 12b by the sharp rise in static pressure that takes place between 0.4 and 0.5 axial chords. Specifically, Case #0 gives the most downstream shock impingement location, whereas both Case#1.-1 and Case #1.1 locate the passage shock wave upstream.
In all three RC cases, the static pressure on the blade SS increases at the RC, where indicated by the filled arrow for each case in Figure 12b. This shows a local reduction in the blade loading by flow injection between 0.1 and 0.3 axial chords. In spite of this localized reduction in blade loading, Figure 12 shows that introducing the RC maintains and possibly increases the rotor tip blade loading. This effect is quite different with respect to more conventional rotor tip treatments that off-load the rotor tip to reduce secondary flow losses and increase the stall margin, such as circumferential lean, sweep, or taper. This sets the RC treatment described in this work apart from three-dimensional blade treatment reported in the literature, as it enables to gain stall margin without compromising on performance, by retaining good blade loading in the rotor tip region. Figure 12 indicates that the largest area endorsed by the normalized pressure distribution, hence the highest loading, is achieved at both OP-A and OP-B with the RC positioned as in Case #0.

3.6. Time-Dependent Analysis of the Recirculation Channel

The parametric study on the axial position of the recirculation channel has shown that the RC placed 0.18 axial chords length downstream from the blade tip leading edge provides the best compressor stall margin improvement among the test cases. Since the stall inception of axial compressors is an inherently unsteady process [30], it is of interest to confirm the effectiveness of the RC treatment by performing time-dependent RANS simulations using the time-resolved numerical approach and boundary conditions described in Section 2.3. Due to their computational cost, time-dependent RANS simulations were performed only for the BL case and Case #0. Figure 13 compares the overall compressor performance characteristics predicted by steady RANS simulations and by time-dependent RANS simulations. Both in the BL case and in Case #0, the total pressure ratio and the adiabatic efficiency obtained by the time-dependent RANS simulations closely follow the trends obtained by the steady RANS simulations. For both the BL case and Case #0, the incipient stall operating condition is obtained by unsteady RANS simulations at a slightly lower normalized mass flow rate than by steady RANS simulations. The stall margin improvement from the BL case to Case #0 predicted by time-dependent RANS simulations is 5.80%, which is close to 5.60% predicted by the steady RANS simulations. This provides confidence that the performance improvements provided by the RC treatment as predicted by steady RANS are retained in the time-resolved flow. It provides additional numerical validation of the RC concept and of the projected performance for stall margin and adiabatic efficiency.

4. Conclusions

This numerical study provided the proof of concept for a new recirculating type casing treatment that extends the stable operating range of a highly loaded axial compressor. Reynolds Averaged Navier Stokes (RANS) simulations explored and provided evidence of the treatment effectiveness in mitigating the blade tip leakage jet of a modeled blade row of the NASA rotor 37. This mitigation was obtained by adding a channel in the casing wall. The RANS simulations showed the presence of a recirculation flow through this channel, which is activated by the pressure difference between the blade pressure side and the blade suction side. It is shown numerically that such flow recirculation significantly interferes with the blade tip leakage jet, obstructing the pitchwise penetration of the jet.
It is further shown numerically that a chamfer applied to the inner wall of the recirculation channel (RC) is a viable method for enhancing the effectiveness of the recirculation channel. Specifically, a two-dimensional numerical simulation showed that the saddle point between the recirculating flow and the tip leakage flow shifts inside the chamfer. By this, flow blockage at the recirculation channel outlet is mitigated. Three-dimensional steady RANS simulations of the NASA rotor 37 provided further evidence of the effectiveness of the chamfer in a higher fidelity geometry model. In this test, the recirculation type casing treatment achieved a compressor stall margin increase of 0.35%.
The recirculation flow inside the RC is strongly affected by the pressure distribution at the channel inlet and at the channel outlet. The pressure profiles at the channel openings determine the intensity of the injected flow momentum, which was found to have a significant influence on the stall margin of the compressor. The RC placed 0.18 axial chords downstream from the blade leading edge provided the best stall margin improvement (ΔSM) among the test cases; specifically, ΔSM was approximately 5.5% above the stall margin of the baseline configuration with no casing treatment. The numerical simulations showed that the RC lost its attractive function of self-adjusting its controlling flow delivery with the rotor loading as the RC was placed axially more upstream, closer to the blade leading ledge.
Further computer-driven optimization of the groove parameters, aided by surrogate modeling, such as Kriging techniques, may deliver a computationally practical and versatile casing treatment design method, to obtain gains in stall margin for applications of axial compressors to high-speed jet engines.

5. Patents

The work presented in this manuscript is included in the International (PCT) Patent Application No. PCT/GB2018/053426 “A self-adjusting passive control technique for the leakage of axial turbomachines.”

Author Contributions

M.K. performed the simulations and analyzed the results, under the supervision of A.R. M.K. and A.R. jointly wrote the paper.

Funding

Kawase’s Ph.D. was supported by the Japanese Acquisition Technology & Logistic Agency, Government of Japan. This research used the ALICE high-performance computing facility at the University of Leicester. Graphical rendering software licenses were originally acquired with EPSRC support on Grant GR/N23745/01.

Acknowledgments

The authors wish to acknowledge the insightful guidance on end-wall contouring design and axial compressor numerical modeling by Tie Chen, Christos Georgakis, Nadir Z Ince, and Peter Millington, GE Power, Rugby, UK.

Conflicts of Interest

The authors declare no conflict of interest.

Abbreviations

The following symbols and abbreviations are used in this manuscript:
Nomenclature
c t Pressure resistance coefficient
c x Axial chord length
m ˙ Mass flow rate, kg·s−1
P Pressure, Pa
P r e f Reference pressure, 101325 Pa
T Temperature, K
U m i d Rotor speed at the mid-span, 393.4 m·s−1
u Velocity, m·s−1
y + Wall-normal distance in wall units
γ Specific heat ratio, 1.4
η Adiabatic efficiency
ρ r e f Inlet air density, 1.225 kg·m−3
Subscripts
aAxial component
chokedChoked condition
inComputational domain inlet boundary
midMid-span of the rotor blade
NSNear-stall condition
outComputational domain outflow boundary
PEPeak efficiency condition
rRadial component
refReference condition
0Stagnation condition
1Station 1
4Station 4
Superscripts
=mass-averaged value
Abbreviations
MCAMultiple-circular-arc
NSNear stall condition
OPOperating point
PEPeak efficiency condition

References

  1. Gallimore, S.J.; Bolger, J.J.; Cumpsty, N.A.; Taylor, M.J.; Wright, P.I.; Place, J.M.M. The use of sweep and dihedral in multistage axial flow compressor blading: Part 1—University research and methods development. J. Turbomach. 2002, 124, 521–532. [Google Scholar] [CrossRef]
  2. Gallimore, S.J.; Bolger, J.J.; Cumpsty, N.A.; Taylor, M.J.; Wright, P.I.; Place, J.M.M. The use of sweep and dihedral in multistage axial flow compressor blading – Part II: Low and high-speed designs and test verification. J. Turbomach. 2002, 124, 533–541. [Google Scholar] [CrossRef]
  3. Osborn, M.W.; Lewis, W.G.J.; Heidelberg, J.L. Effect of Several Porous Casing Treatments on Stall Limit and on Overall Performance of An Axial-Flow Compressor Rotor; NASA Technical Note NASA TN D-6537; NASA: Washington, DC, USA, 1971.
  4. Fujita, H.; Tanaka, H. A study on configuration of casing treatment for axial flow compressors. Bull. JSME 1984, 27, 1675–1681. [Google Scholar] [CrossRef]
  5. Greitzer, E.M.; Nikkanen, J.P.; Haddad, D.E.; Mazzawy, R.S.; Joslyn, H.D. A fundamental criterion for the application of rotor casing treatment. J. Fluids Eng. 1979, 101, 237–243. [Google Scholar] [CrossRef]
  6. Houghton, T.; Day, I. Enhancing the stability of subsonic compressors using casing grooves. J. Turbomach. 2010, 133, 021007. [Google Scholar] [CrossRef]
  7. Houghton, T.; Day, I. Stability enhancement by casing grooves: The importance of stall inception mechanism and solidity. J. Turbomach. 2011, 134, 021003. [Google Scholar] [CrossRef]
  8. Sakuma, Y.; Watanabe, T.; Himeno, T.; Kato, D.; Murooka, T.; Shuto, Y. Numerical analysis of flow in a transonic compressor with a single circumferential casing groove: Influence of groove location and depth on flow instability. J. Turbomach. 2013, 136, 031017. [Google Scholar] [CrossRef]
  9. Cevik, M.; Vo, H.D.; Yu, H. Casing treatment for desensitization of compressor performance and stability to tip clearance. J. Turbomach. 2016, 138, 121008. [Google Scholar] [CrossRef]
  10. Lu, X.; Chu, W.; Zhang, Y.; Zhu, J. Experimental and numerical investigation of a subsonic compressor with bend skewed slot casing treatment. Proc. IMechE Part C J. Power Energy 2006, 220, 1785–1796. [Google Scholar] [CrossRef]
  11. Koff, S.G.; Mazzawy, R.S.; Nikkanen, J.P.; Nolcheff, N.A. Case Treatment for Compressor. U.S. Patent 5,282,718, 1 February 1992. [Google Scholar]
  12. Hathaway, M.D. Self-Recirculating Casing Treatment Concept for Enhanced Compressor Performance; TM-2002-211569; NASA Technical Memorandum: Hanover, MD, USA, 2002.
  13. Khaleghi, H. Effect of discrete endwall recirculation on the stability of a high-speed compressor rotor. Aerosp. Sci. Technol. 2014, 37, 130–137. [Google Scholar] [CrossRef]
  14. Dinh, C.T.; Ma, S.B.; Kim, K.Y. Effect of a circumferential feed-back channel on aerodynamic performance of a single-stage transonic axial compressor. In Proceedings of the ASME Turbo Expo 2017, Charlotte, NC, USA, 26–30 June 2017. ASME Paper No. GT2017-63536. [Google Scholar]
  15. Camp, T.R.; Day, I.J. A study of spike and modal stall phenomena in a low-speed axial compressor. J. Turbomach. 1997, 120, 393–401. [Google Scholar] [CrossRef]
  16. Vo, H.D.; Tan, C.S.; Greitzer, D.M. Criteria for spike initiated rotating stall. J. Turbomach. 2008, 130, 011023. [Google Scholar] [CrossRef]
  17. Tesla, N. Valvular Conduit. U.S. Patent 1,329,559, 3 February 1920. [Google Scholar]
  18. Dunham, J. CFD Validation for Propulsion System Components; AGARD-AR-355; Advisory Group for Aerospace Research and Development: Neuilly sur Seine, France, 1998. [Google Scholar]
  19. Roache, P.J. Perspective: A method for uniform reporting of grid refinement studies. J. Fluids Eng. 1994, 116, 405–413. [Google Scholar] [CrossRef]
  20. Cameron, J.D.; Morris, S.C.; Barrows, S.T.; Chen, J.-P. On the interpretation of casing measurements in axial compressors. In Proceedings of the ASME Turbo Expo 2008, Berlin, Germany, 9–13 June 2008. ASME Paper No. GT2008-51371. [Google Scholar]
  21. Shih, T.-H.; Liou, W.W.; Shabbir, A.; Yang, Z.; Zhu, J. A new k-ε eddy-viscosity model for high Reynolds number turbulent flows—Model development and validation. Comput. Fluids 1995, 24, 227–238. [Google Scholar] [CrossRef]
  22. Roe, P.L. Approximate Riemann solvers, parameter vectors, and difference schemes. J. Comput. Phys. 1981, 43, 357–372. [Google Scholar] [CrossRef] [Green Version]
  23. Van Leer, B.; Thomas, J.L.; Roe, P.L.; Newsome, R.W. A comparison of numerical flux formulas for the Euler and Navier-Stokes equations. In Proceedings of the 8th AIAA, Computational Fluid Dynamics Conference, Honolulu, HI, USA, 9–11 June 1987. Technical Report AIAA-87-1104. [Google Scholar] [CrossRef]
  24. Weiss, J.M.; Maruszewski, J.P.; Smith, W.A. Implicit solution of the Navier-Stokes equations on unstructured meshes. In Proceedings of the 13th AIAA, Computational Fluid Dynamics Conference, Snowmass village, DC, USA, 29 June–2 July 1997. Technical Report AIAA-97-2103. [Google Scholar] [CrossRef]
  25. Pandya, S.A.; Venkateswaran, S.; Pulliam, T.H. Implementation of dual-time procedures in OVERFLOW. In Proceedings of the 41st Aerospace Science Meeting and Exhibit, Aerospace Science Meeting, Reno, NV, USA, 6–9 January 2003. Technical Report AIAA-2003-0072. [Google Scholar] [CrossRef]
  26. Turkel, E.; Vatsa, V.N. Choice of variables and preconditioning for time dependent problems. In Proceedings of the 16th AIAA, Computational Fluid Dynamics Conference, Orlando, FL, USA, 23–26 June 2003. Technical Report AIAA-2003-3692. [Google Scholar] [CrossRef]
  27. Outa, E.; Kato, D.; Chiba, K. An N-S simulation of stall cell behavior in a 2-D compressor rotor-stator system at various loads. In Proceedings of the ASME International Gas Turbine and Aeroengine Congress and Exposition, Hague, The Netherlands, 13–16 June 1994. ASME Paper No. 94-GT-257. [Google Scholar] [CrossRef]
  28. Zhu, X.; Liu, B.; Hu, J.; Shen, X. Numerical study of stall inception in a transonic axial compressor rotor based on the throttle model. J. Theor. Appl. Mech. 2015, 53, 307–316. [Google Scholar] [CrossRef]
  29. Arima, T.; Sonoda, T.; Shirotori, M.; Tamura, A.; Kikuchi, K. A numerical investigation of transonic axial compressor rotor flow using a low-Reynolds-number k-ε turbulence model. J. Turbomach. 1999, 121, 44–58. [Google Scholar] [CrossRef]
  30. Cumpsty, N.A. Compressor Aerodynamics; Krieger Publishing Company: Malabar, FL, USA, 2004; ISBN 1-57524-247-8. [Google Scholar]
Figure 1. The concept of the recirculating type casing treatment over the rotor blade tip clearance.
Fluids 04 00088 g001
Figure 2. Three-dimensional computational domain and mesh with the recirculation channel (RC) over the rotor blades. The computational mesh is coarsened by a factor of two in the direction of each coordinate, for graphical rendering purpose.
Fluids 04 00088 g002
Figure 3. Circumferentially mass-averaged radial profiles at Station 1 and Station 4 showing the comparison between computational fluid dynamics (CFD) and experimental data. Experimental data from [18,29].
Fluids 04 00088 g003
Figure 4. Application of a chamfer on the RC inner wall edge showing the mitigation of the blockage at the channel outlet. (a) Overview of the recirculation channel flow structure. (b) Improving the inner float shape. (c) Comparison of the y velocity distribution at the recirculation channel outlet.
Fluids 04 00088 g004aFluids 04 00088 g004b
Figure 5. Schematic of locating the RC at different axial positions on the meridional plane.
Fluids 04 00088 g005
Figure 6. Overall compressor performance characteristics showing the influence of the RC location. (a) Influence of the RC location on the total pressure ratio across the rotor at different normalized mass flor rates. (b) Influence of the RC location on the rotor adiabatic efficiency ad different normalized mass flow rates.
Fluids 04 00088 g006
Figure 7. Changes in the compressor performance and in the intensity of the injected momentum over the compressor operating range. (a) Comparison of the axial compressor rotor overall characteristics: stall margin (ΔSM), outlet static pressure change at the near-stall (NS) condition (ΔP4), and rotor adiabatic half-stage efficiency at peak efficiency (PE) condition (Δη). (b) Variation in the injected flow momentum M with outflow pressure and RC axial position.
Fluids 04 00088 g007
Figure 8. Distributions of the normalized momentum injected in the axial direction. View from above the casing, approximately in the cascade plane. (a) Distribution of the injected normalized momentum in the axial direction at the inlet and at the outlet of the RC. (b) Absolute velocity streamlines inside the recirculation channel (Case #1.-1, OP-A, top view).
Fluids 04 00088 g008
Figure 9. Distributions of the static pressure across the RC openings. View from above the casing, approximately in the cascade plane.
Fluids 04 00088 g009
Figure 10. Surface streamlines and specific entropy color iso-levels near the casing wall showing how the confluence line (interface) around the rotor leading edge (LE) changes with a RC. View of the cascade plane close to the casing. (a) BL (OP-A, NS). (b) Case #1.-1 (OP-A). (c) Case #0 (OP-A). (d) Case #1.1 (OP-A).
Fluids 04 00088 g010aFluids 04 00088 g010b
Figure 11. Visualization of the flow blockage mitigation on the shroud surface by the RC for different RC axial locations. Passage viewed from the hub towards the casing approximately in the radial direction. (a) BL (OP-A, NS). (b) Case #1.-1 (OP-A). (c) Case #1.-1 (OP-B, NS). (d) Case #0 (OP-A). (e) Case #0 (OP-B). (f) Case #1.1 (OP-A). (g) Case #1.1 (OP-B, NS).
Fluids 04 00088 g011aFluids 04 00088 g011b
Figure 12. Normalized static pressure distribution at 0.98 span showing a decrease in the blade tip loading with the RC. (a) OP-A and (b) OP-B.
Fluids 04 00088 g012
Figure 13. Comparison of overall compressor performance characteristics between steady Reynolds Averaged Navier Stokes (RANS) simulations and time-dependent RANS simulations.
Fluids 04 00088 g013
Table 1. Overall parameters of NASA rotor 37.
ItemUnitsDesign Point Value
Rotor total pressure ratio-2.106
Rotor polytropic efficiency%88.9
Number of the rotor blades N -36
Rotational speed ω 3 rad·s−11800
Rotor inlet hub-to-tip diameter ratio-0.7
Blade aspect ratio-1.19
Tip relative inlet Mach number-1.4
Aerofoil profile-MCA
Tip clearancemm0.356
Table 2. Flow conditions used for the numerical modeling.
InletUnitsValue
Total pressure P 0 i n kPa101.325
Total temperature T 0 i n K288.15
Turbulence intensity I %3
Turbulence length scale l m0.0114
OutletUnitsValue
Static pressure P o u t kPaVaried from 101.3 to stall inception.
Table 3. Parametric study of the recirculation channel location on the rotor shroud wall.
Axial Location % of czAxial Length % of cz
Case #1.-2−4.68.1
Case #1.-18.38.2
Case #018.28.5
Case #1.128.08.7
Case #1.237.88.9
Case #1.347.79.1

