Article

On the Asymmetric Spectral Broadening of a Hydrodynamic Modulated Wave Train in the Optical Regime

1
Graduate School of Frontier Sciences, The University of Tokyo, Kashiwa, Chiba 277-8563, Japan
2
Corporate Planning Department, MS&AD InterRisk Research & Consulting, Inc., Tokyo 101-0063, Japan
3
School of Civil Engineering, The University of Sydney, Sydney NSW 2006, Australia
*
Author to whom correspondence should be addressed.
Fluids 2019, 4(2), 84; https://doi.org/10.3390/fluids4020084
Submission received: 8 February 2019 / Revised: 1 April 2019 / Accepted: 16 April 2019 / Published: 2 May 2019
(This article belongs to the Special Issue Nonlinear Wave Hydrodynamics)

Abstract

:
Amplitude modulation of a propagating wave train has been observed in various media including hydrodynamics and optical fibers. The notable difference of the propagating wave trains in these media is the magnitude of the nonlinearity and the associated spectral bandwidth. The nonlinearity and dispersion parameters of optical fibers are two orders of magnitude smaller than the hydrodynamic counterparts, and therefore, considered to better assure the slowly varying envelope approximation (SVEA) of the nonlinear Schrödinger equations (NLSE). While most optics experiment demonstrate an NLSE-like symmetric solutions, experimental studies by Dudley et al. (Optics Express, 2009, 17, 21497–21508) show an asymmetric spectral evolution in the dynamics of unstable electromagnetic waves with high intensities. Motivated by this result, the hydrodynamic Euler equation is numerically solved to study the long-term evolution of a water-wave modulated wave train in the optical regime, i.e., at small steepness and spectral bandwidth. As the initial steepness is increased, retaining the initial spectral bandwidth thereby increasing the Benjamin–Feir Index, the modulation localizes, and the asymmetric and broad spectrum appears. While the deviation of the evolution from the NLSE solution is a result of broadband dynamics of free wave interaction, the resulting asymmetry of the spectrum is a consequence of the violation of the SVEA.

1. Introduction

Freak waves or rogue waves in the ocean have been a subject of research for physicists, oceanographers, and engineers for several decades. Marine accidents may have been related to encounters of ships with freak waves [1,2,3] and several freak wave incidents were reported from offshore platforms [4,5]. Whether to take the freak waves into consideration in the design criterion of ships and offshore platforms relates to the occurrence probability of freak/rogue waves. Recent studies of freak/rogue waves in realistic sea-states show that the probability is well explained by a second order theory [6,7,8] because the modulational instability (MI) is suppressed due to the broadness of the directional spectrum [9,10,11,12]. However, even in directional seas, coherent nonlinear wave groups exist and persist for a prolonged lifetime [13,14]. The dynamics governing the evolution of such wave groups is a narrow-banded process represented by the nonlinear Schrödinger equation (NLSE) [15,16]. The details of the dynamics and kinematics of the modulated wave train have been studied extensively since the first experimental discovery of the disintegration of the Stokes wave by Benjamin and Feir [17]. It has been demonstrated in wave tank experiments that a hydrodynamic counterpart to the analytical solution of the NLSE [18] does exist [19,20,21], yet deviates due to broadband process [22,23,24].
On the contrary, experimental evidence of the NLSE-like wave evolution was reported following the first discovery of optical rogue waves by Solli et al. [25]. The variations of the Akhmediev breathers (AB) [18] were reproduced in high-intensity lasers in optical fiber [26,27,28,29]. These studies revealed that a moderate perturbation to the continuous wave train evolves in space such that an intense wave pulse is generated due to MI. Concurrently, symmetric broadening of the spectrum results and hence a super-continuum is generated [30]. The experimental measurements of Akhmediev breathers in photonic crystal fiber using nanosecond pulses by Dudley et al. [31] showed that as the intensity increased, asymmetric spectrum evolved and a state of a “fully-developed” super-continuum was attained at 98 W. The spectrum is no longer triangular, and the spectrum somewhat resembles the Peregrine breather solution [32,33] and is even broader than that, despite the fact that the initial perturbation is periodic in time.
The study of Dudley et al. [31] motivated us to investigate hydrodynamic MI in the optical regime, i.e., small steepness and spectral bandwidth. The asymmetric evolution of the hydrodynamic MI is often attributed to the additional terms of the extended NLSE first derived by Dysthe [34], which is equivalent to the generalized NLSE used in optics [35]. Since the nonlinearity of water waves is two orders of magnitude larger than the optical waves, the dynamical similarity implies that spectral bandwidth is extremely small in the optical regime. In other words, slowly varying envelope approximation is appropriate [36]. Then, why was the NLSE dynamics insufficient to reproduce the optical breathers? To answer this question, we used the hydrodynamic equation without any restriction on the spectral bandwidth to study the MI in the optical regime. We hope to shed light on the underlying physical process of the waves propagating in optical fiber beyond the slowly varying envelope approximation (SVEA) but not utilizing the unidirectional pulse propagation equation [37]. The main finding of this study is that the modulated wave train evolves in such a way that the formed wave group is highly localized in space and therefore the slowly varying envelope approximation fails. As a result, a highly asymmetric super-continuum is realized.
The hydrodynamics and optics NLSE will be introduced, and the relevant parameters will be defined in Section 2. The experimental conditions of the existing studies will be summarized using the same parameters. In Section 3, the high-order spectral method (HOSM) and the initial condition of the modulated wave train will be introduced. The computational domain is set equivalent to the initial modulation length. The numerical experiment results will be presented in Section 4 for the cases containing 64 waves and 256 waves in a group with different steepness. The discussion will be made comparing the HOSM results with the analytical solutions of the modulated wave train in Section 5. The conclusion follows.

2. Hydrodynamic and Optical Rogue Waves

The evolution of the modulated wave train in both media were compared and relevant parameters were quantified for the existing experiments in literature.

2.1. Nonlinear Schrödinger Equation (NLSE)

The time NLSE in a frame of reference moving at the group velocity can be expressed in a general form as:
i A x β 2 2 2 A T 2 + γ | A | 2 A = 0 .
The dispersion parameter β 2 and the nonlinear parameter γ for the optical fiber and deep-water waves are introduced in a comprehensible review by Chabchoub et al. [38] and is presented in Appendix A, Table A1. In deep water, the NLSE derives when the spectral bandwidth δ = δ ω ω 0 is sufficiently small and is of the same order as the steepness ϵ W W = | A | k 0 . These are the key parameters in determining the initial exponential growth rate of the sideband perturbation to the Stokes wave [17], as well as determining the long-term evolution of the modulated wave train [39,40]. The ratio of these two parameters representing the relative significance of nonlinearity and dispersion is coined the Benjamin–Feir Index, B F I w w = | A | k 0 δ [41]. Following the work of Chabchoub et al. [38], the steepness of the laser in an optical fiber can be expressed as   ϵ = | A | 2 2 γ β 2 ω 0 2 , where the nonlinear parameter γ relates to the Kerr effect and dispersion parameter β 2 is a function of the wavelength λ ; see Table A2 for definitions. The corresponding BFI for the optical wave is therefore B F I = | A | 2 2 γ β 2 ω 0 2 δ [38].
By retaining terms up to the O ( ϵ 4 ) while assuming   O ( δ ) ~ O ( ϵ ) and third order in nonlinearity, Dysthe’s equation, also known as the modified NLSE, was derived [42], whose optical counterpart is the generalized NLSE [35]. The additional dispersion term and the nonlinear terms are considered imperative to the development of the asymmetric spectrum [43]. A further extension was made for broader bandwidth equating O ( ε 1 / 2 ) ~ O ( δ ) and retaining terms up to O ( ε 3.5 ) [44]. Therefore, the exponent p of O ( ε p ) ~ O ( δ ) determines the dynamical regime of the modulated wave train.

2.2. Hydrodynamic and Optic Rogue Wave Experiments in Literature

By using the “steepness” ϵ and the “spectral bandwidth” δ , the existing hydrodynamic and optical experiments on MI can be classified; Figure 1 presents a map of the experimental parameters in the ϵ δ space. The hydrodynamic MI experiments were conducted in the range of ϵ = O ( 0.01 ) ~ O ( 0.1 ) for initial conditions that trigger Akhmediev breather structures [45]. Since the initial conditions were given by the NLSE solutions, the δ in the map was chosen to be the same as ϵ for convenience, although they are indeterminate. The steepness of the optical experiments are one to two orders of magnitude smaller than the hydrodynamic experiments; the figure is enlarged for small ϵ < 0.01 (Figure 1b). For those experiments with a short pulse, the spectral bandwidth is kept constant [31], while the power or the steepness is increased—see Appendix A Table A2 for the details of the experimental conditions. For visual guidance, in Figure 1, the relationship ε 1 / 2 = δ is indicated by the black dashed line, ε = δ by the solid black line, and ε 2 = δ by the red dashed line. The experiments by Dudley et al. [31] fall under the parameter space ε > δ > ε 2 . In other words, the initial spectral bandwidth δ , as indicated by blue dots in Figure 1b, is much smaller than the expected maximum growth condition of the MI for a given steepness ε indicated by the red solid line. The resulting spectrum of the modulated wave trains indicates that as the power is increased, the spectrum broadens, and the high-frequency tail is enhanced (Figure 2). If the MI is of the Akhmediev breather type, then the maximum growth condition is expected to be when the modulation frequency δ is about the same as the steepness ε . Therefore, the growth rate of Dudley’s seeded experimental conditions is not the maximum.

3. Broadband Hydrodynamic Numerical Simulation

This section outlines the hydrodynamic model used for the numerical study and the initial condition used for the modulated wave train. Note that the wave field is spatially periodic and evolves in time. Thereby conveniently switching time and space of the physical condition of the electromagnetic wave propagation in optical fiber.

3.1. Higher-Order Spectral Model

The higher-order spectral method (HOSM) [46] is gaining popularity in studies of freak/rogue waves in a realistic broadband directional ocean spectrum [6,7,8,13,47]. The governing equation describes the motion of a horizontally unbounded body of irrotational and inviscid fluid with a flat bottom. The velocity potential satisfies Laplace’s equation 2 ϕ = 0 , and the free surface boundary conditions [15]:
η t + H Φ · H η = ( 1 + ( H η ) 2 ) W Φ t + 1 2   ( H Φ ) 2 + g η = 1 2 ( 1 + ( H η ) 2 ) W 2
where Φ ( x , y , t ) = ϕ ( x , y , η , t ) is the velocity potential evaluated at the free surface η ( x , y , t ) , and W ( x , y , t ) is the vertical velocity at the free surface. The velocity potential is expanded in a series ϕ ( x , y , z , t ) = m = 1 M ϕ m ( x , y , z , t ) , where O ( ϕ m ) = O ( ( a k ) m ) , and ϕ m ( x , y , η , t ) is Taylor expanded around z = 0 :
ϕ m ( x , y , η , t ) = k = 1 m 1 η k k ! ϕ m k ( x , y , 0 , t ) .
The W is expanded in a series in ascending order of wave steepness:
W ( x , y , t ) = m = 1 M W ( m ) ,     W ( m ) = k = 0 m 1 η k k ! k + 1 z k + 1 ϕ m k ( x , y , 0 , t ) .
Equation (2) is solved by a pseudo-spectral method, where the horizontal gradient is evaluated efficiently in wavenumber space using the fast Fourier transform (FFT). The fourth-order Runge–Kutta method is used for temporal integration. For a given initial surface elevation, the initial velocity potential is given as Φ ^ 0 ( k ) = i g ω ( k ) η ^ ( k ) , where Φ ^ 0 ( k ) and η ^ ( k ) are the Fourier coefficients of the surface velocity potential and surface elevation. The weighting of the nonlinear terms was increased from 0 to 1 in 10 wave periods in all the runs [48].
The attraction of HOSM is the ease of controlling the degree of nonlinearity. Typically, M = 3 is used to include four-wave resonance, and that is equivalent to the Zakharov’s equation to the third order [49,50]. In principle, the scheme does not impose any restriction on the spectral bandwidth, except for the choice of computational domain and the de-aliasing filter [46]. In this study, HOSM implemented in MATLAB was used for a one-dimensional problem, i.e., Φ ( x , t ) = ϕ ( x , η , t ) , η ( x , t ) , and W ( x , t ) .

3.2. Modulated Wave Train

The modulated wave train was initialized by perturbing a carrier wave by a set of two sideband waves in a classical setting of satisfying the maximum growth condition [17,40]
η ( x , 0 ) = a c sin ( k c x ) + b + sin ( k + x π 4 ) + b sin ( k x π 4 ) ,
where the sideband wavenumbers are,
{ k + = k c + δ k k = k c δ k ,
and b + / a c = b / a c = 0.01 , that is the sideband wave energy is O ( 10 4 ) of the carrier wave. Note that this initial condition triggers the Akhmediev Breather (AB) dynamics in the context of MI and that the wave packets evolve in time [51]. Moreover, recent study clarified the role of sideband perturbation in the context of high-order NLSE [52]. The HOSM model domain was set to contain N = k c / δ k waves, therefore, the model domain matches the initial modulation length scale. The initial steepness was determined by the choice of the B F I for the fixed frequency bandwidth δ k / k c :
a c k c = ( B F I / 2 ) × ( δ k / k c ) .
Therefore, the control parameters of the numerical experiments are, N and B F I . The test cases are summarized in Table 1. For Cases 1 to 4, the spectral bandwidth is one order of magnitude smaller than the typical water wave, δ k / k c = 0.0156 or N = 64 , and the selected cases of B F I = 1 ,   3 ,   5   and   10 cases will be presented. For Cases 5 to 7, δ k / k c = 0.0039 or N = 256 , is two orders of magnitude smaller, and the B F I = 5 ,   10 ,   and   15 will be presented. The number of model discretization m is chosen such that each wave has 16 grid points. With the anti-aliasing filter [46], the effective spectral bandwidth is m / ( M + 1 ) × δ k = ( m / N ) / ( M + 1 ) × k c and therefore the model frequency domain is limited to the fourth harmonics of the carrier wave, i.e., 4 × k c .

4. Results

The HOSM simulations were conducted for spectral bandwidths δ k k c = 0.0156 and 0.0039, that were one to two orders of magnitude smaller than the typical water waves. For each spectral bandwidth, the B F I or the steepness a c k c were increased in steps. The evolution of the waves was recurrent when the B F I was small, but as the B F I increased, became rather complicated. The evolution of the envelope of the wave train for Case 7 is shown in Figure A1. In the following, we analyze in detail the first modulation peak. The interesting evolutions following that will be left for future study.

4.1. Cases 1–4; δ k k c = 0.0156 ( N = 64 )

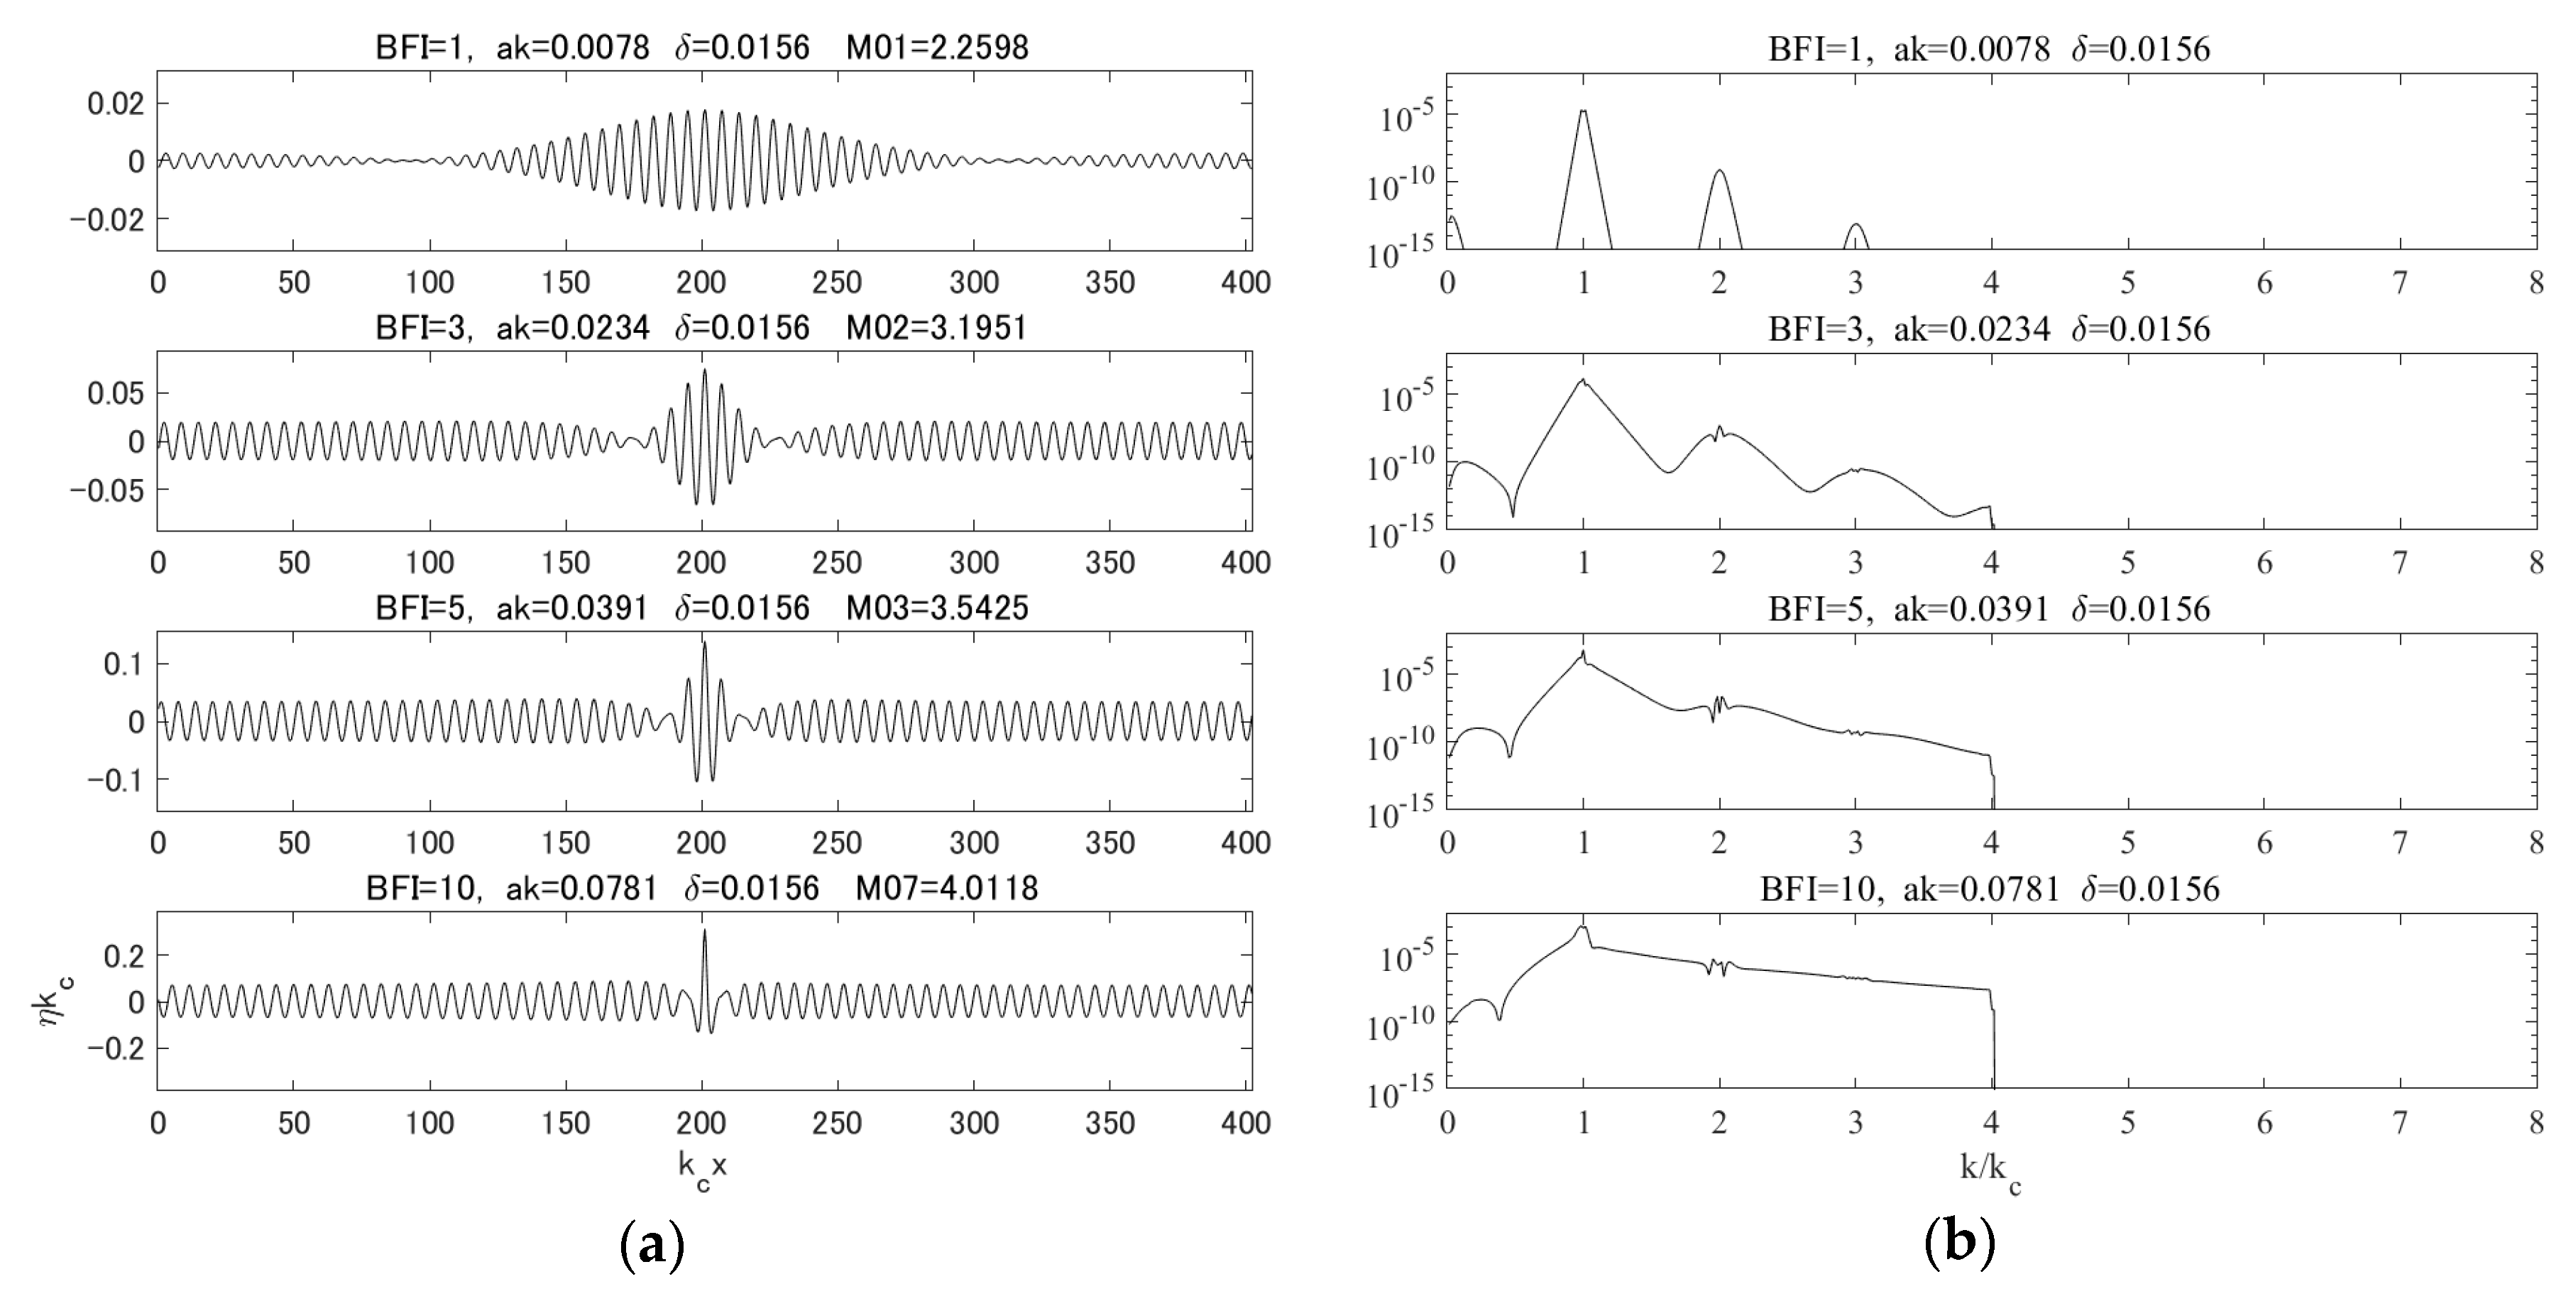
At B F I = 1 , the initial modulation grew in time, and at the peak of the modulation, a group containing about 32 wave lengths formed (Figure 3a top). This meant that the size of the group halved from the initial modulation. The associated frequency spectrum showed a characteristic triangular broadening that has been reported from the NLSE simulations and physical experiments in both hydrodynamics and optics MI studies (e.g., [45]). Note that the noise floor was around 10 30 of the peak and is not apparent in the figure. As the B F I was increased, the group size, i.e., the number of waves per group, reduced (Figure 3a); at B F I = 3 , a group contained about 8 waves, at B F I = 5 , about 4 waves, and at B F I = 10 , it appeared as if only a single wave had blown up. Consequently, the spectrum broadened, and gradually became asymmetric with respect to the first harmonics (Figure 3b). For B F I = 10 , the energy had spread substantially to the higher frequencies such that the second and third harmonics were no longer visible.
For a small steepness, the growth rate of the sideband wave is given as [17]:
β = ( δ k / k c ) 2 ( 2 B F I 2 1 ) 1 / 2 .
Therefore, for a given δ k / k c , the growth rate monotonically increased with B F I > 1 / 2 . The time it took to reach the maximum modulation was 27602, 4497, 2364, and 1071 wave periods for B F I = 1 ,   3 ,   5 ,   10 respectively.
For Case 1, B F I = 1 , the initial sideband wavenumber satisfied the maximum growth condition. The modulated wave envelope dynamics resembled the analytical breather solution of Akhmediev [18]. As the B F I increased (Cases 2, 3 and 4), the sideband no longer satisfied the maximum growth condition and the modulated state gradually deviated from the Akhmediev breather dynamics. At higher B F I s , the modulated wave became isolated and started to resemble the non-periodic and doubly-localized Peregrine breather as expected [32]. Accordingly, the amplification ratio increased from 2.26 to 4.01 as the B F I is increased. Here the amplification ratio is defined as the maximum crest height relative to the initial amplitude of the unmodulated wave train and does not remove the second order asymmetric distortion of the wave shape.

4.2. Cases 5–7; δ k k c = 0.0039 ( N = 256 )

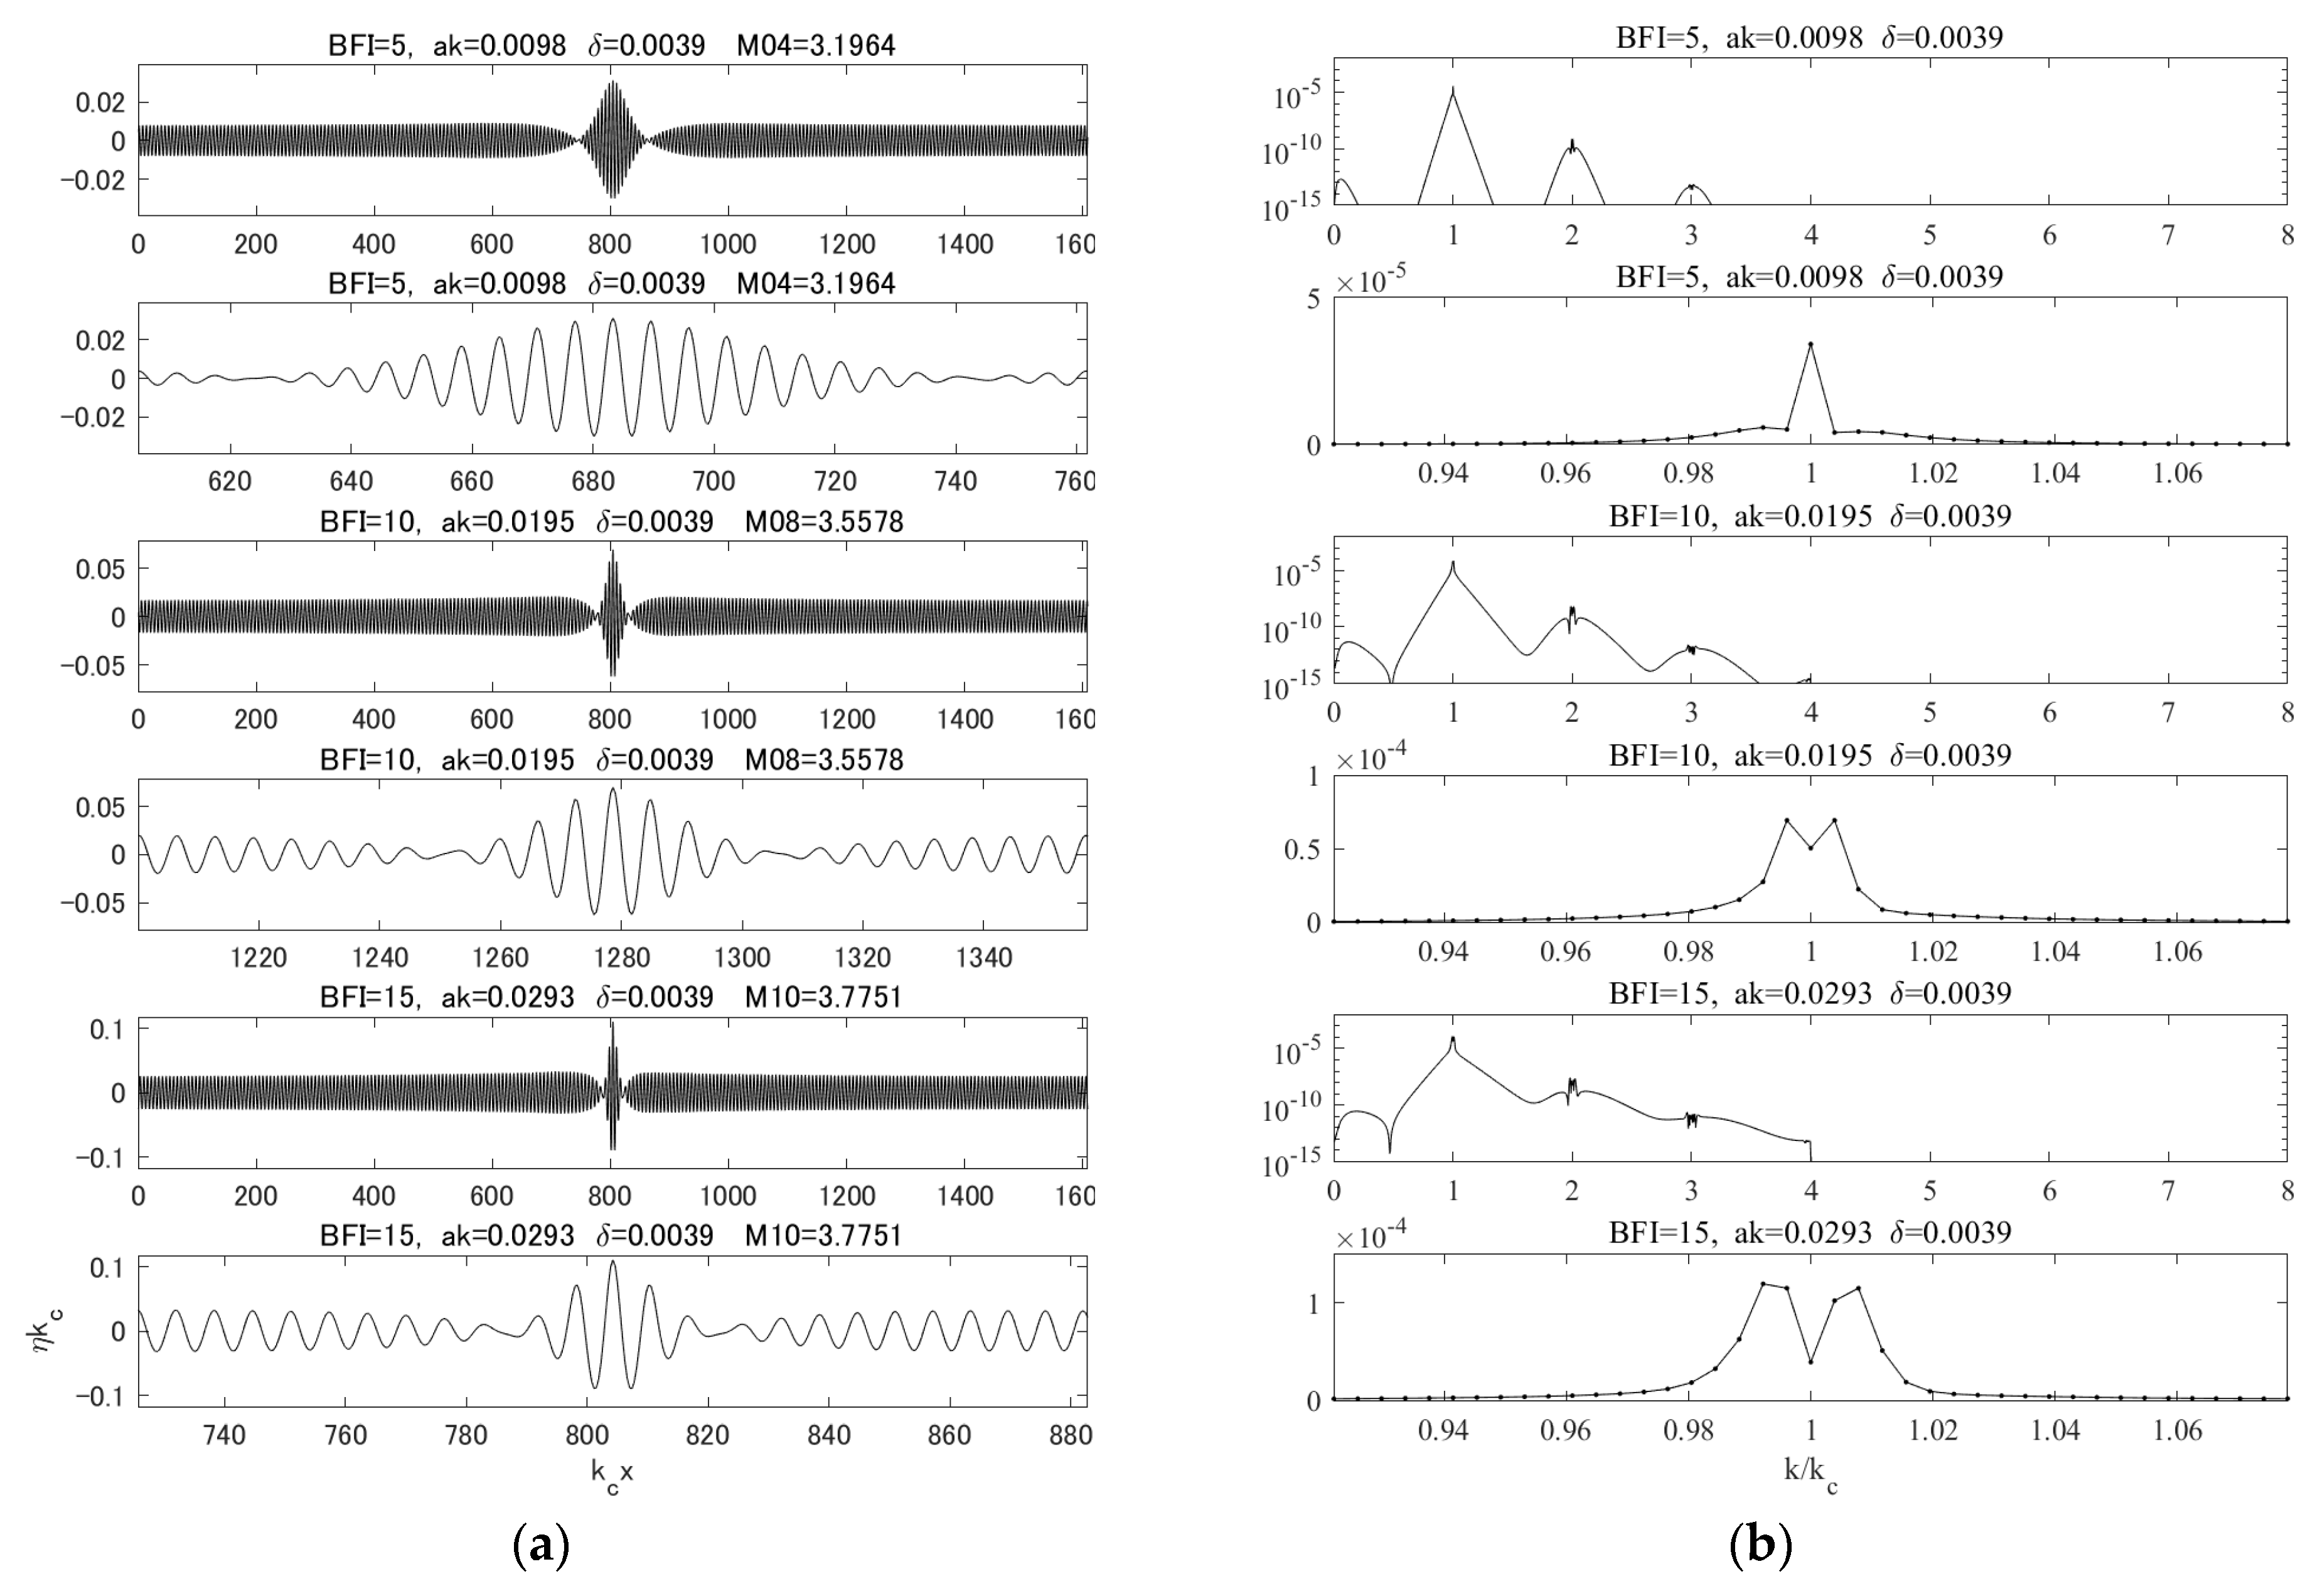
As the initial spectral bandwidth was reduced, the solution was expected to become NLSE-like and symmetric. Indeed, for a case where B F I = 5 , a symmetric triangular spectrum developed (Figure 4b top). However, as the B F I was further increased, the spectrum gradually broadened and became asymmetric. The wave group tended to be more localized. The enlarged time series (Figure 4a) showed that the number of waves per group gradually reduced from around 16 to 4. This is consistent with the N = 64 cases, and in fact, the B F I = 10 case of N = 256 resembles the B F I = 5 case of N = 64 , as both wave groups contain about four waves. Consequently, the spectra resemble each other. This observation suggests that even if the initial perturbation contained 256 waves, the wave train modulated in a way that the number of waves per group reduced to only four. In other words, “sidebands” with ± n × δ k   ( n = 1 ,   2 ,   3 ) difference from the carrier wave had grown. Figure 4b shows that those waves had started to grow, and thereby the sidebands not imposed initially had developed (see the bottom diagram of Figure 4b). The amplification ratio increases were 3.20, 3.56 and 3.78 for the BFIs 5, 10 and 15 respectively.

5. Discussion

Numerical study of the hydrodynamic modulated wave train with extremely small steepness revealed that as the steepness increased while retaining the initial modulation scale, the evolution of waves deviated from the Akhmediev breather dynamics and approached a Peregrine-like solution. The number of waves in the localized wave group reduced, and consequently, the spectrum broadened and became asymmetric. Here we investigate the spectral mode evolutions and spectral broadening due to fast envelope variations.

5.1. Spectral Mode Evolutions

The initial condition of the modulated wave train spans the entire model domain. The number of waves in the model domain, therefore, is equivalent to the inverse of the initial spectral bandwidth N = 1 / ( δ k / k c ) . For B F I = 1 , the initial sideband waves correspond to the maximum growth condition. As the B F I increases, the initial perturbation no longer satisfies the fastest growing condition, i.e., a c k c > δ k / k c , and therefore, may trigger the growth of multiple modes with faster growth rates, n δ k / k c ~ O ( a c k c ) . Yuen and Lake [53] have shown that under such conditions, all the unstable modes are eventually excited and evolve in a chaotic manner. Such a type of dynamics has also been observed in nonlinear fibers [54].
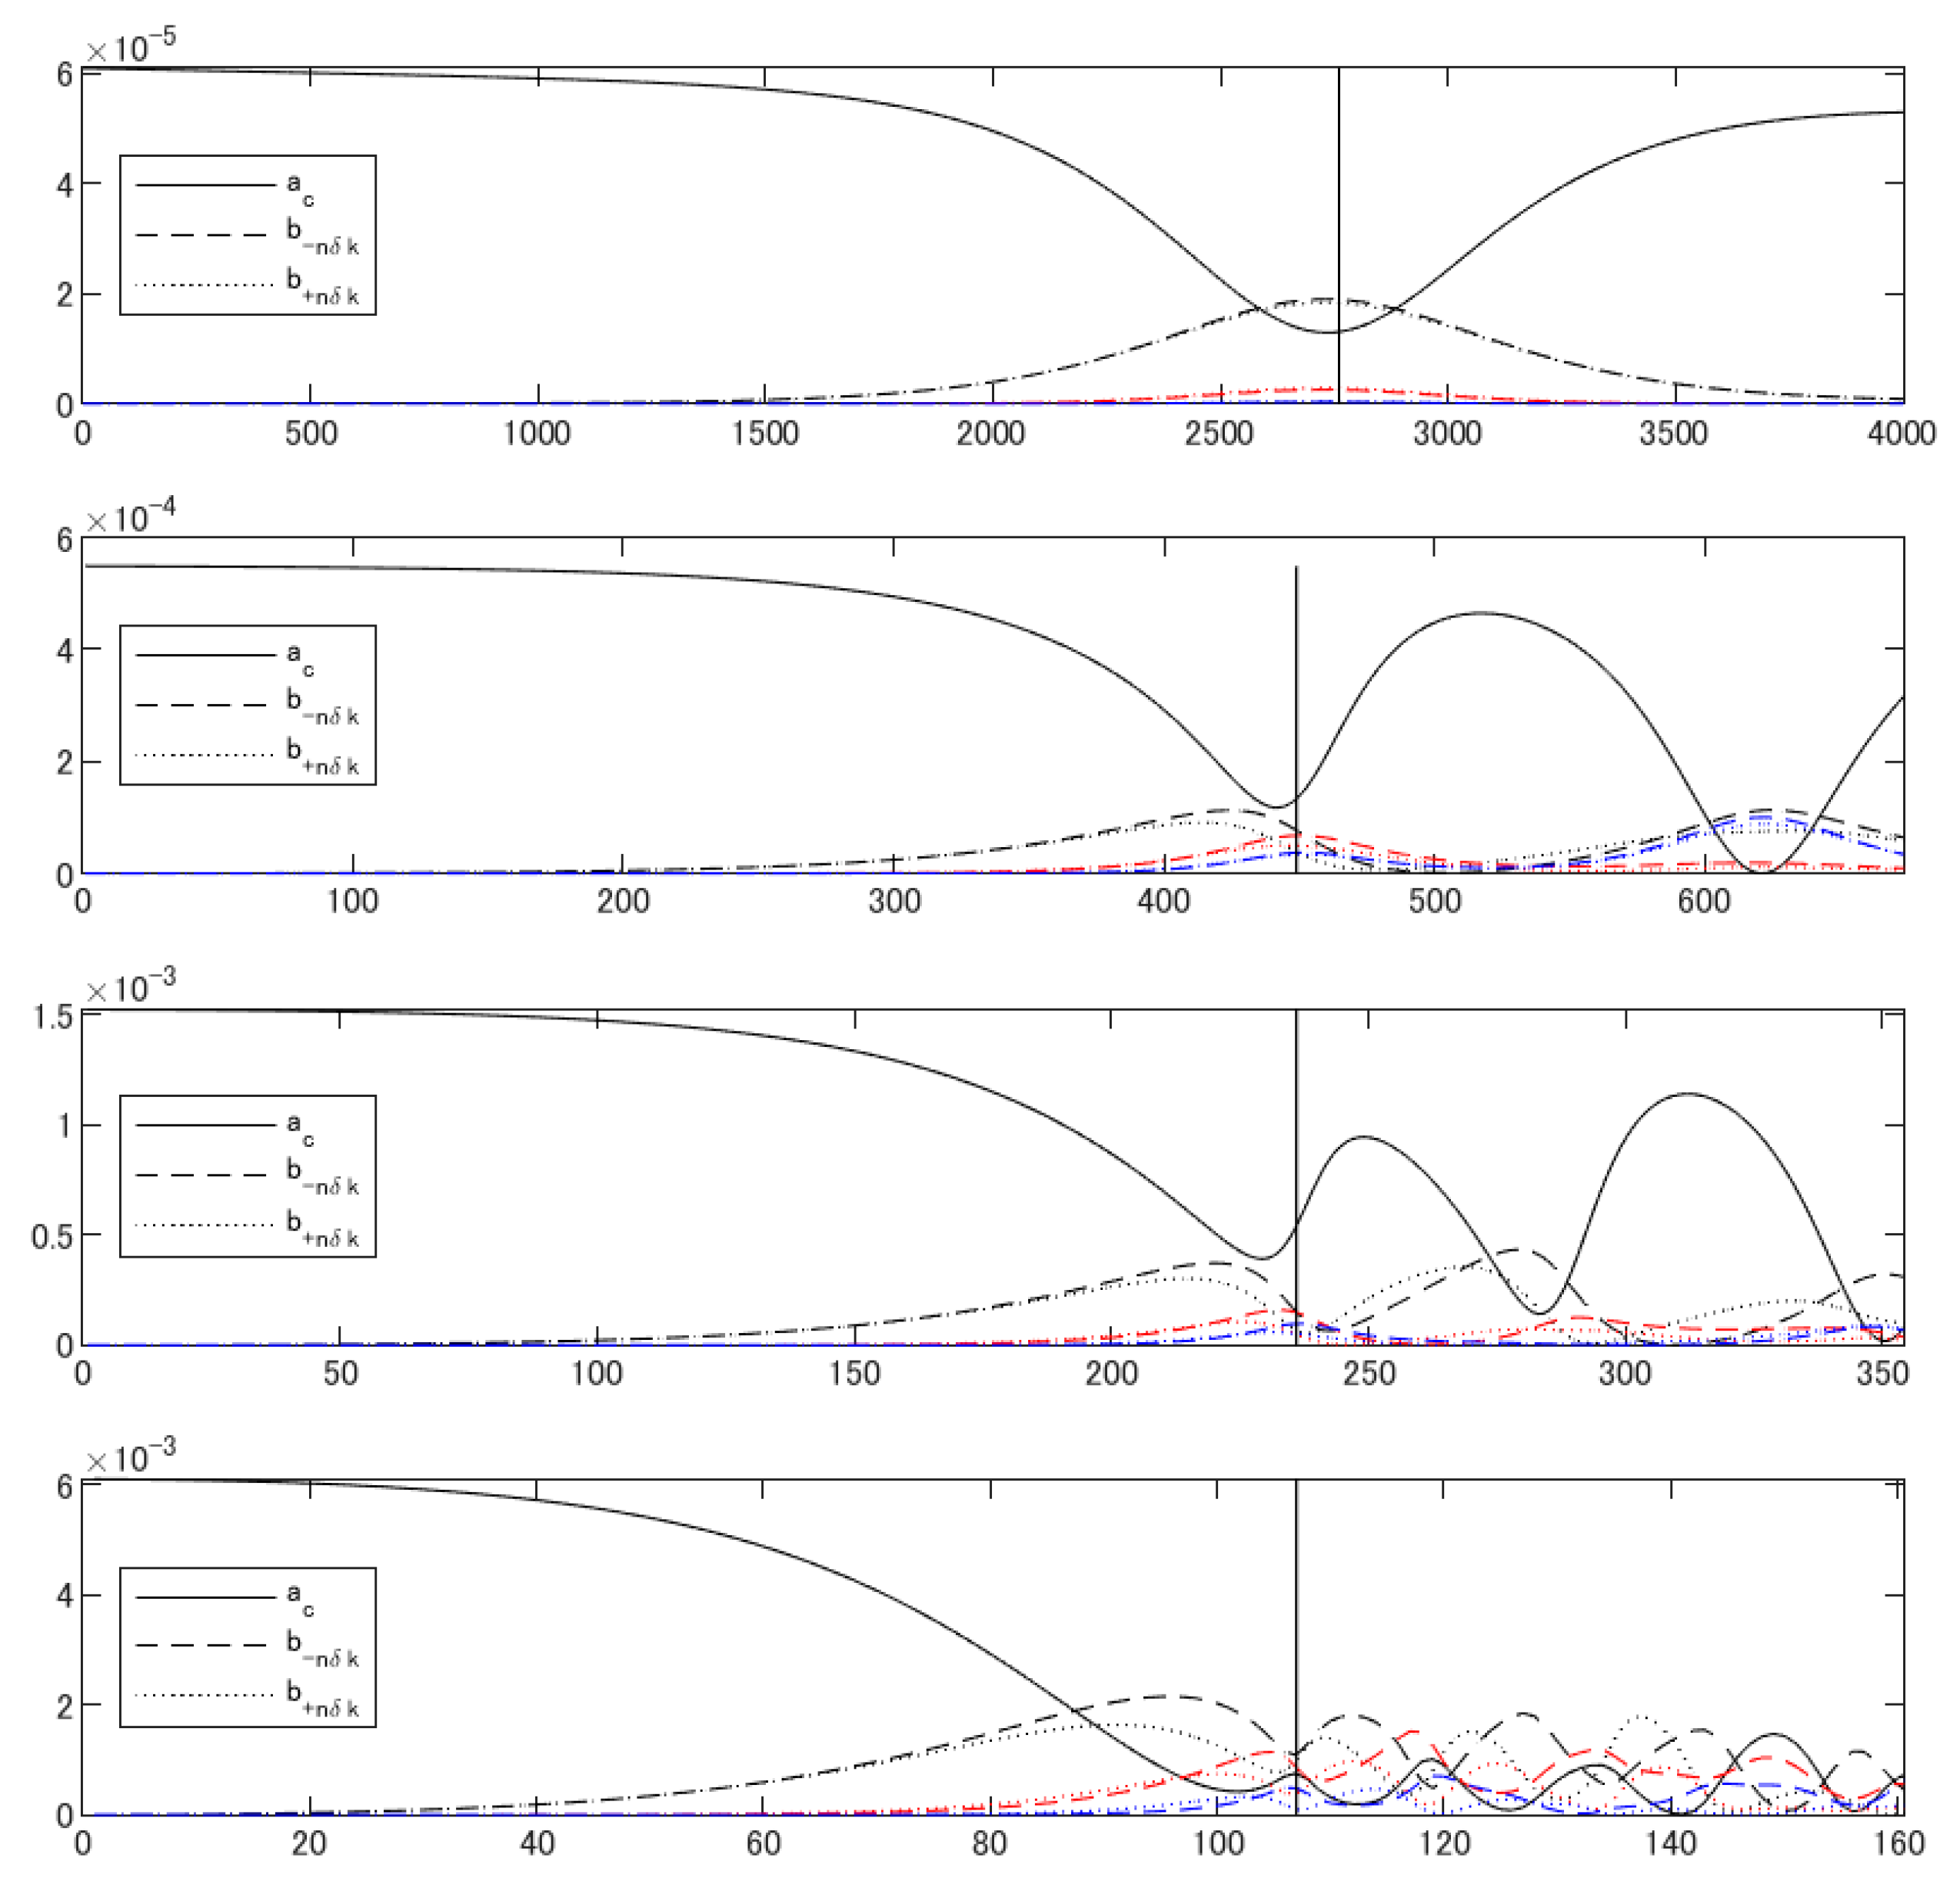
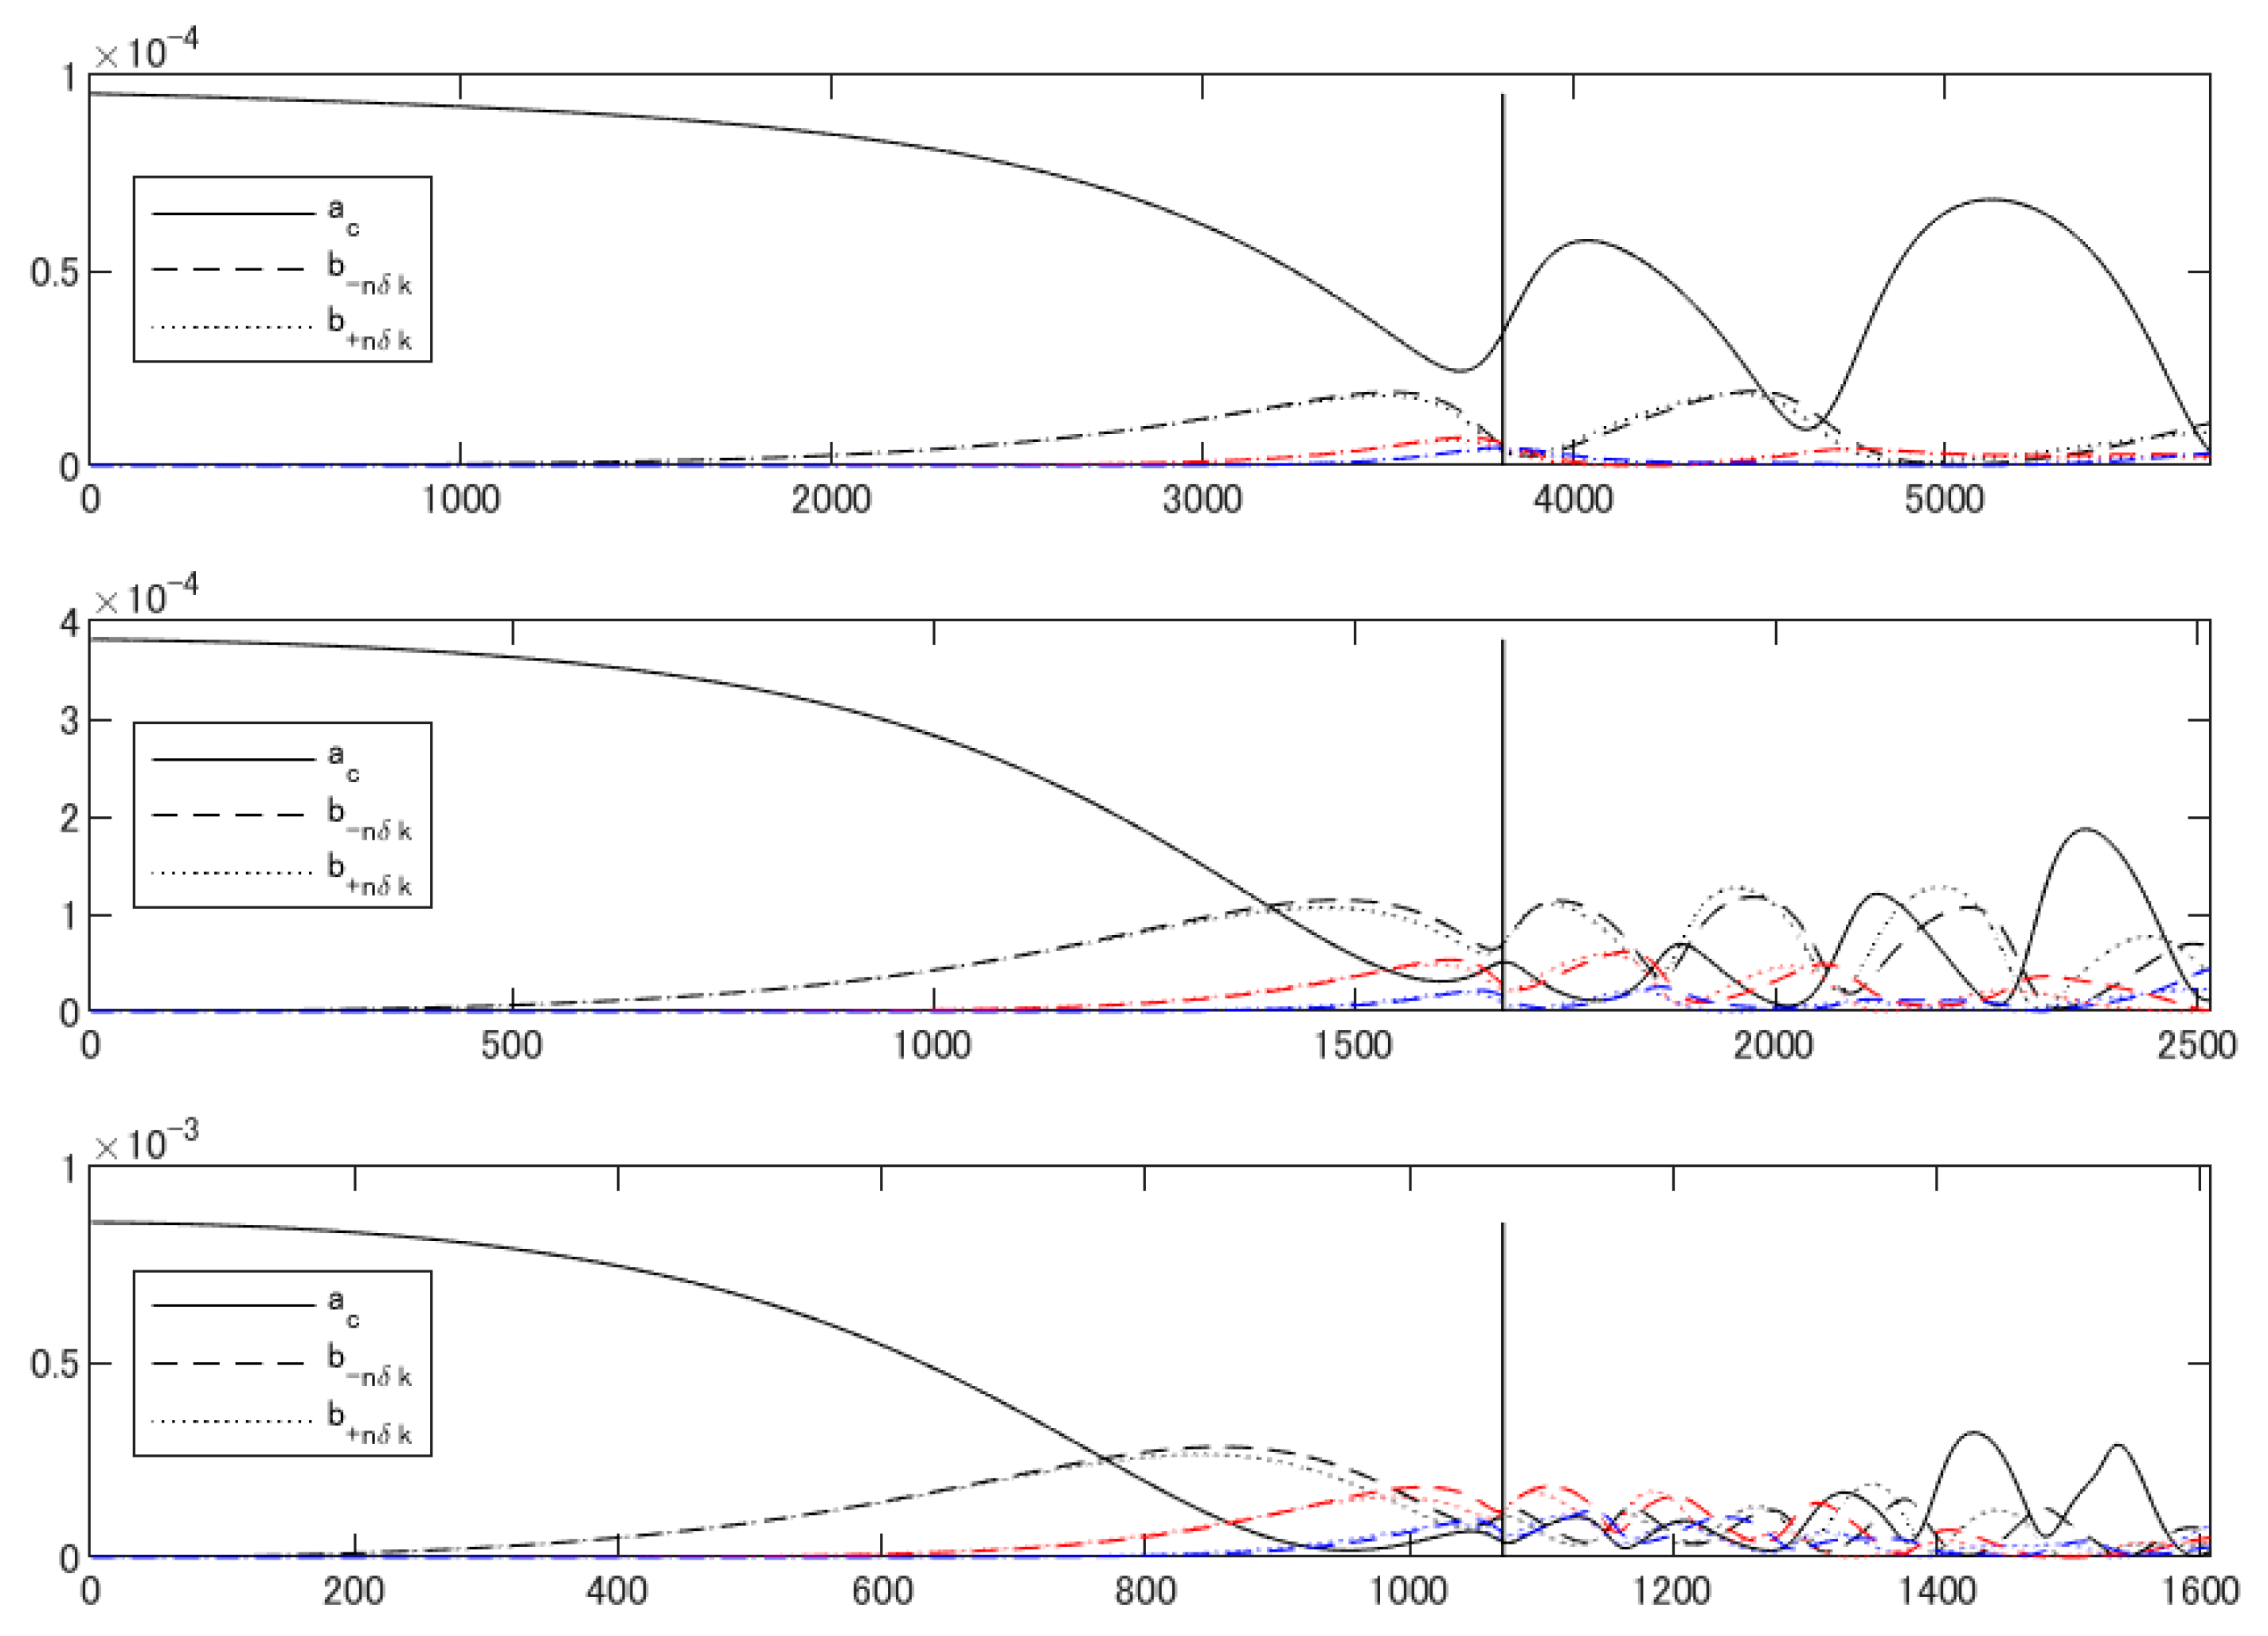
Evolutions of the spectral modes of cases δ k / k c = 0.0156 are shown in Figure 5. The amplitudes of the carrier wave, and the sidebands at k c ± n δ k , where n = 1 ,   2 ,   3 , are shown. The vertical line indicates when the crest height was the largest. Note that the growth rate increases with the initial steepness, and therefore, the timing of the maximum amplification shortens. The horizontal axis is adjusted accordingly in Figure 5. For the B F I = 1 case, the maximum crest amplification occurs when the imposed sidebands at k c ± δ k reaches the maxima (black dashed and dotted lines). Energy is transferred to the naturally growing second set of sidebands at k c ± 2 δ k as well (red dashed and dotted lines). For the higher B F I s, the energy is transferred to even higher modes at k c ± 3 δ k (blue dashed and dotted lines), and their largest amplification coincides with the maximum crest height. At B F I = 3 , the evolutions of the modes are rather chaotic, and the system does not recur.
Similar evolutions are observed for the δ k / k c = 0.0039 cases; B F I = 5 ,   10 and 15 (Figure 6). The corresponding fastest growing set of sidebands are k c ± 5 δ k , k c ± 10 δ k , and k c ± 15 δ k , respectively. In other words, the modulation, k c ± δ k , was excited at the lower end of the stability region, k c 2   ( B F I · δ k ) k k c + 2   ( B F I · δ k ) . Unlike the cases studied by Yuen and Lake exciting the most unstable mode while activating the interaction of wave modes confined to the stability region, in this study, a set of sideband waves with the lowest growth rate was excited while no constraint on the number of active wave modes were given. As a result, the energy of the carrier-wave gradually cascaded down to the neighboring waves including the fastest growing ones. However, the fastest growing wave mode is not predominant when the crest height maximizes in the first modulation cycle (see Figure 4b). After the first recurrence cycle, at B F I = 10 , the evolution of the wave modes becomes chaotic for both N = 64 and N = 256 cases (Figure 5 and Figure 6).

5.2. Spectral Broadening Due to Fast Envelope Variation

The imbalance of the initial perturbation, δ k / k c a c k c , resulted in the excitation of all the unstable wave modes spreading energy in the spectral domain, and localizing the modulation in the physical domain. The spectral evolution somewhat resembles the solution to the discrete Zakaharov’s equation by Yuen and Lake [53] on the transition of the MI to a confined chaos. What is notably different is that while in [53] the fastest growing mode, δ k / k c = a c k c , was excited initially, in this study the slowest growing mode was excited initially. The consequence was that the modulation was highly localized such that the number of waves in the wave group contained far fewer waves compared to the initial perturbation; four waves in a group while 256 waves were contained in the initial perturbation (Figure 4a bottom).
When the modulation period or the length of the wave envelope is sufficiently slow or large compared to the period or the wavelength of the carrier wave, the dynamics can be expressed by the nonlinear Schrödinger equation according to the slow envelope variation approximation [36]. In optics, the frequency of the light is much higher than the modulation frequency, δ k / k c   ~   O ( 10 4 ) , but in the typical water surface wave problem, the frequency of the propagating wave is just an order higher than the modulation frequency, δ k / k c   ~   O ( 10 1 ) . As such, the scales of the wave group and the carrier wave are too close, and the slow envelope variation is violated. This is likely the reason for the asymmetry of the wave profiles and the spectra.
By substantially reducing the frequency bandwidth of the water waves, the evolution of the modulated wave train should be expressed by the NLSE. Then, the wave profiles and spectra are expected to be symmetric. To test this hypothesis, HOSM simulations of the unidirectional modulated wave trains were conducted for δ k / k c = 0.0156 and 0.0039 . The result, however, indicated that the hypothesis was incorrect. As aforementioned, the spectrum broadened and became asymmetric, not because of the large steepness or the large   B F I , but because the number of waves in a group substantially reduced. The reason for the localization of the energy in space is because of the spectral evolution that involved a number of unstable wave modes. It is, therefore, a consequence of the interaction of multiple unstable modes resulting in the formation of the wave group that is substantially smaller in scale from the original perturbation.

5.3. Limitation of the Use of Hydrodynamic Equation in the Optical Regime

The numerical solution to Euler’s equation without constraint of the spectral broadness provided a useful insight in understanding the evolution of high-intensity electronic waves in an optical fiber cable. The notable difference between water wave and optical fiber, however, is the magnitude of dissipation. Typically, the dissipation in a physical water wave tank is large enough to affect the long-term evolution [55]. At the same time, dissipation suppresses the growth of small background noise. On the contrary, because of the infinitesimal dissipation in the optical fiber, waves can propagate for kilometers, and therefore, the background noise can play a significant role [56]. A preliminary study was conducted with the background noise level close to the initial sideband amplitude, b ± / a c = 0.01 , and, in this particular case, the fastest growing mode developed. As a consequence, the Peregrine-like isolated amplification did not occur. This result will be presented in another report.

6. Conclusions

Evolution of the modulated water wave train was studied using a numerical model, without dissipation, for cases with extremely small frequency bandwidth and steepness. The wave evolution in the range of O ( 10 3 ) to O ( 10 5 ) wave periods was observed, which is unusually long for a water wave problem. This idealized numerical experiment was conducted to understand how the asymmetric spectra developed in the optical MI experiments by Dudley et al. [31]. The hydrodynamics simulation in the optical regime successfully reproduced the asymmetry despite the smallness of frequency bandwidth. In the case when the steepness was substantially larger than the frequency bandwidth, as the initial sideband wave mode pair slowly gained energy, all the unstable wave modes are excited. Eventually, the energy is continuously spread in low and high frequencies. As a result, the amplitude modulation localized, and an asymmetric spectrum developed because of the fast envelope variation. In that case, after the first modulation cycle, the wave system evolved into a confined chaos.

Author Contributions

Conceptualization, T.W. and A.C.; methodology, T.W.; software, T.W. and W.F.; investigation, T.W.; writing—original draft preparation, T.W.; writing—review and editing, T.W. and A.C.; funding acquisition, T.W.

Funding

This research was funded by the Grants-in-Aid for Scientific Research, KAKENHI, of Japan Society for the Promotion of Science (JSPS), grant number 16H02429. A.C. acknowledges support from JSPS.

Acknowledgments

T.W. acknowledges Zensho Yoshida for his inspiring question on the appropriateness of scale separation in the water wave modulated wave train, that motivated this study.

Conflicts of Interest

The authors declare no conflict of interest.

Appendix A

The NLS coefficients and parameters for optical fiber and deep-water waves are summarized in Table A1 following the review paper by Chabchoub et al. [38]. Selected experimental conditions of both hydrodynamics and optics are summarized in Table A2.
Table A1. Nonlinear Schrödinger (NLS) coefficients and parameters for optical fiber and deep-water waves.
Optical FiberDeepwater Waves
Dispersion parameter β 2 = λ 2 2 π c D where D ( λ ) = S 0 4 ( λ λ 0 3 λ 2 ) β 2 = 2 g
Nonlinear parameter γ = ω 0 n 2 c A e f f γ = k 0 3
Steepness ϵ = | A | 2 2 γ β 2 ω 0 2 ϵ = | A | k 0
Spectral bandwidth δ = δ ω ω 0 δ = δ ω ω 0
B F I ε δ B F I = | A | 2 2 γ β 2 ω 0 2 δ B F I = | A | k 0 δ
T D I ε 1 / 2 δ T D I = | A | 2 2 γ β 2 ω 0 2 4 δ T D I = | A | k 0 δ
Table A2. Optical rogue wave experimental conditions.
Optical Rogue WavesChabchoub et al. 2015 [38]
Solli et al. 2007 [25]
Dudley et al. 2009 Simulation [31]Dudley et al. 2009 Experiment [31]
Case Akhmediev breatherAkhmediev breather
c   ( ms 1 ) 2.99792458 × 10 8
S 0   ( ps   km 1   nm 2 ) 0.089
n 2   ( m 2 W 1 ) 3 × 10 12 3 × 10 12 3 × 10 12
λ   ( nm ) 1450 1550 1064
D ( λ )   ( ps   km 1   nm 1 ) 1.5424 × 10 17 1.5681 × 10 20 1.2479 × 10 19
β 2   ( s 2 m 1 ) 0.00007237 20 × 10 24 75 × 10 24
ω 0 = c   2 π / λ   ( s 1 ) 1.299 × 10 15 1.2153 × 10 15 1.770 × 10 15
γ   ( m 1 W 1 ) 0.00131744 1.1 60
P = | A | 2   ( W ) 10 × 10 6 30.0 26 ,   43 ,   98
ϵ 0.001337 0.0014948 0.00364 , 0.00469 , 0.007073
δ f   ( GHz ) -289 400   ( 2 σ )
δ - 0.0014948 0.0014196
B F I -1.0 2.566 , 3.300 , 4.982
T D I -25.864842.5, 48.2, 59.2
L = Fiber length (m) -~500 m~ 300 m
ϵ 2 L / λ -7200.78293742, 6189, 14106
Kibler et al. (2010) [26]Kibler et al. (2012) [27]Frisquet et al. (2014) [28]
CasePeregrine solitonKuznetsov-Ma solitonHigh-order Akhmediev breather
c   ( ms 1 ) 2.99792458 × 10 8
λ   ( nm ) 1556 1554 1550
β 2   ( s 2 m 1 ) 8.85 × 10 28 21.8 × 10 24 21.1 × 10 24
ω 0 = c / λ   ( s 1 ) 192670192920193410
γ   ( m 1 W 1 ) 0.01 1.3 1.2
P = | A | 2   ( W ) 0.30 0.70.513
ϵ 0.0021510 0.00023851 0.00019877
δ f   ( GHz ) 24130.5 20 ,   40
δ 0.0012509 0.00015819 0.00010340 ,   0.00020681
B F I 1.7195 1.5077 1.9223 ,   0.9611
T D I 37.076497.628136.3499, 68.1717
L = Fiber length (m) 90053003800
ϵ 2 L / λ 2676.2194.016296.8620

Appendix B

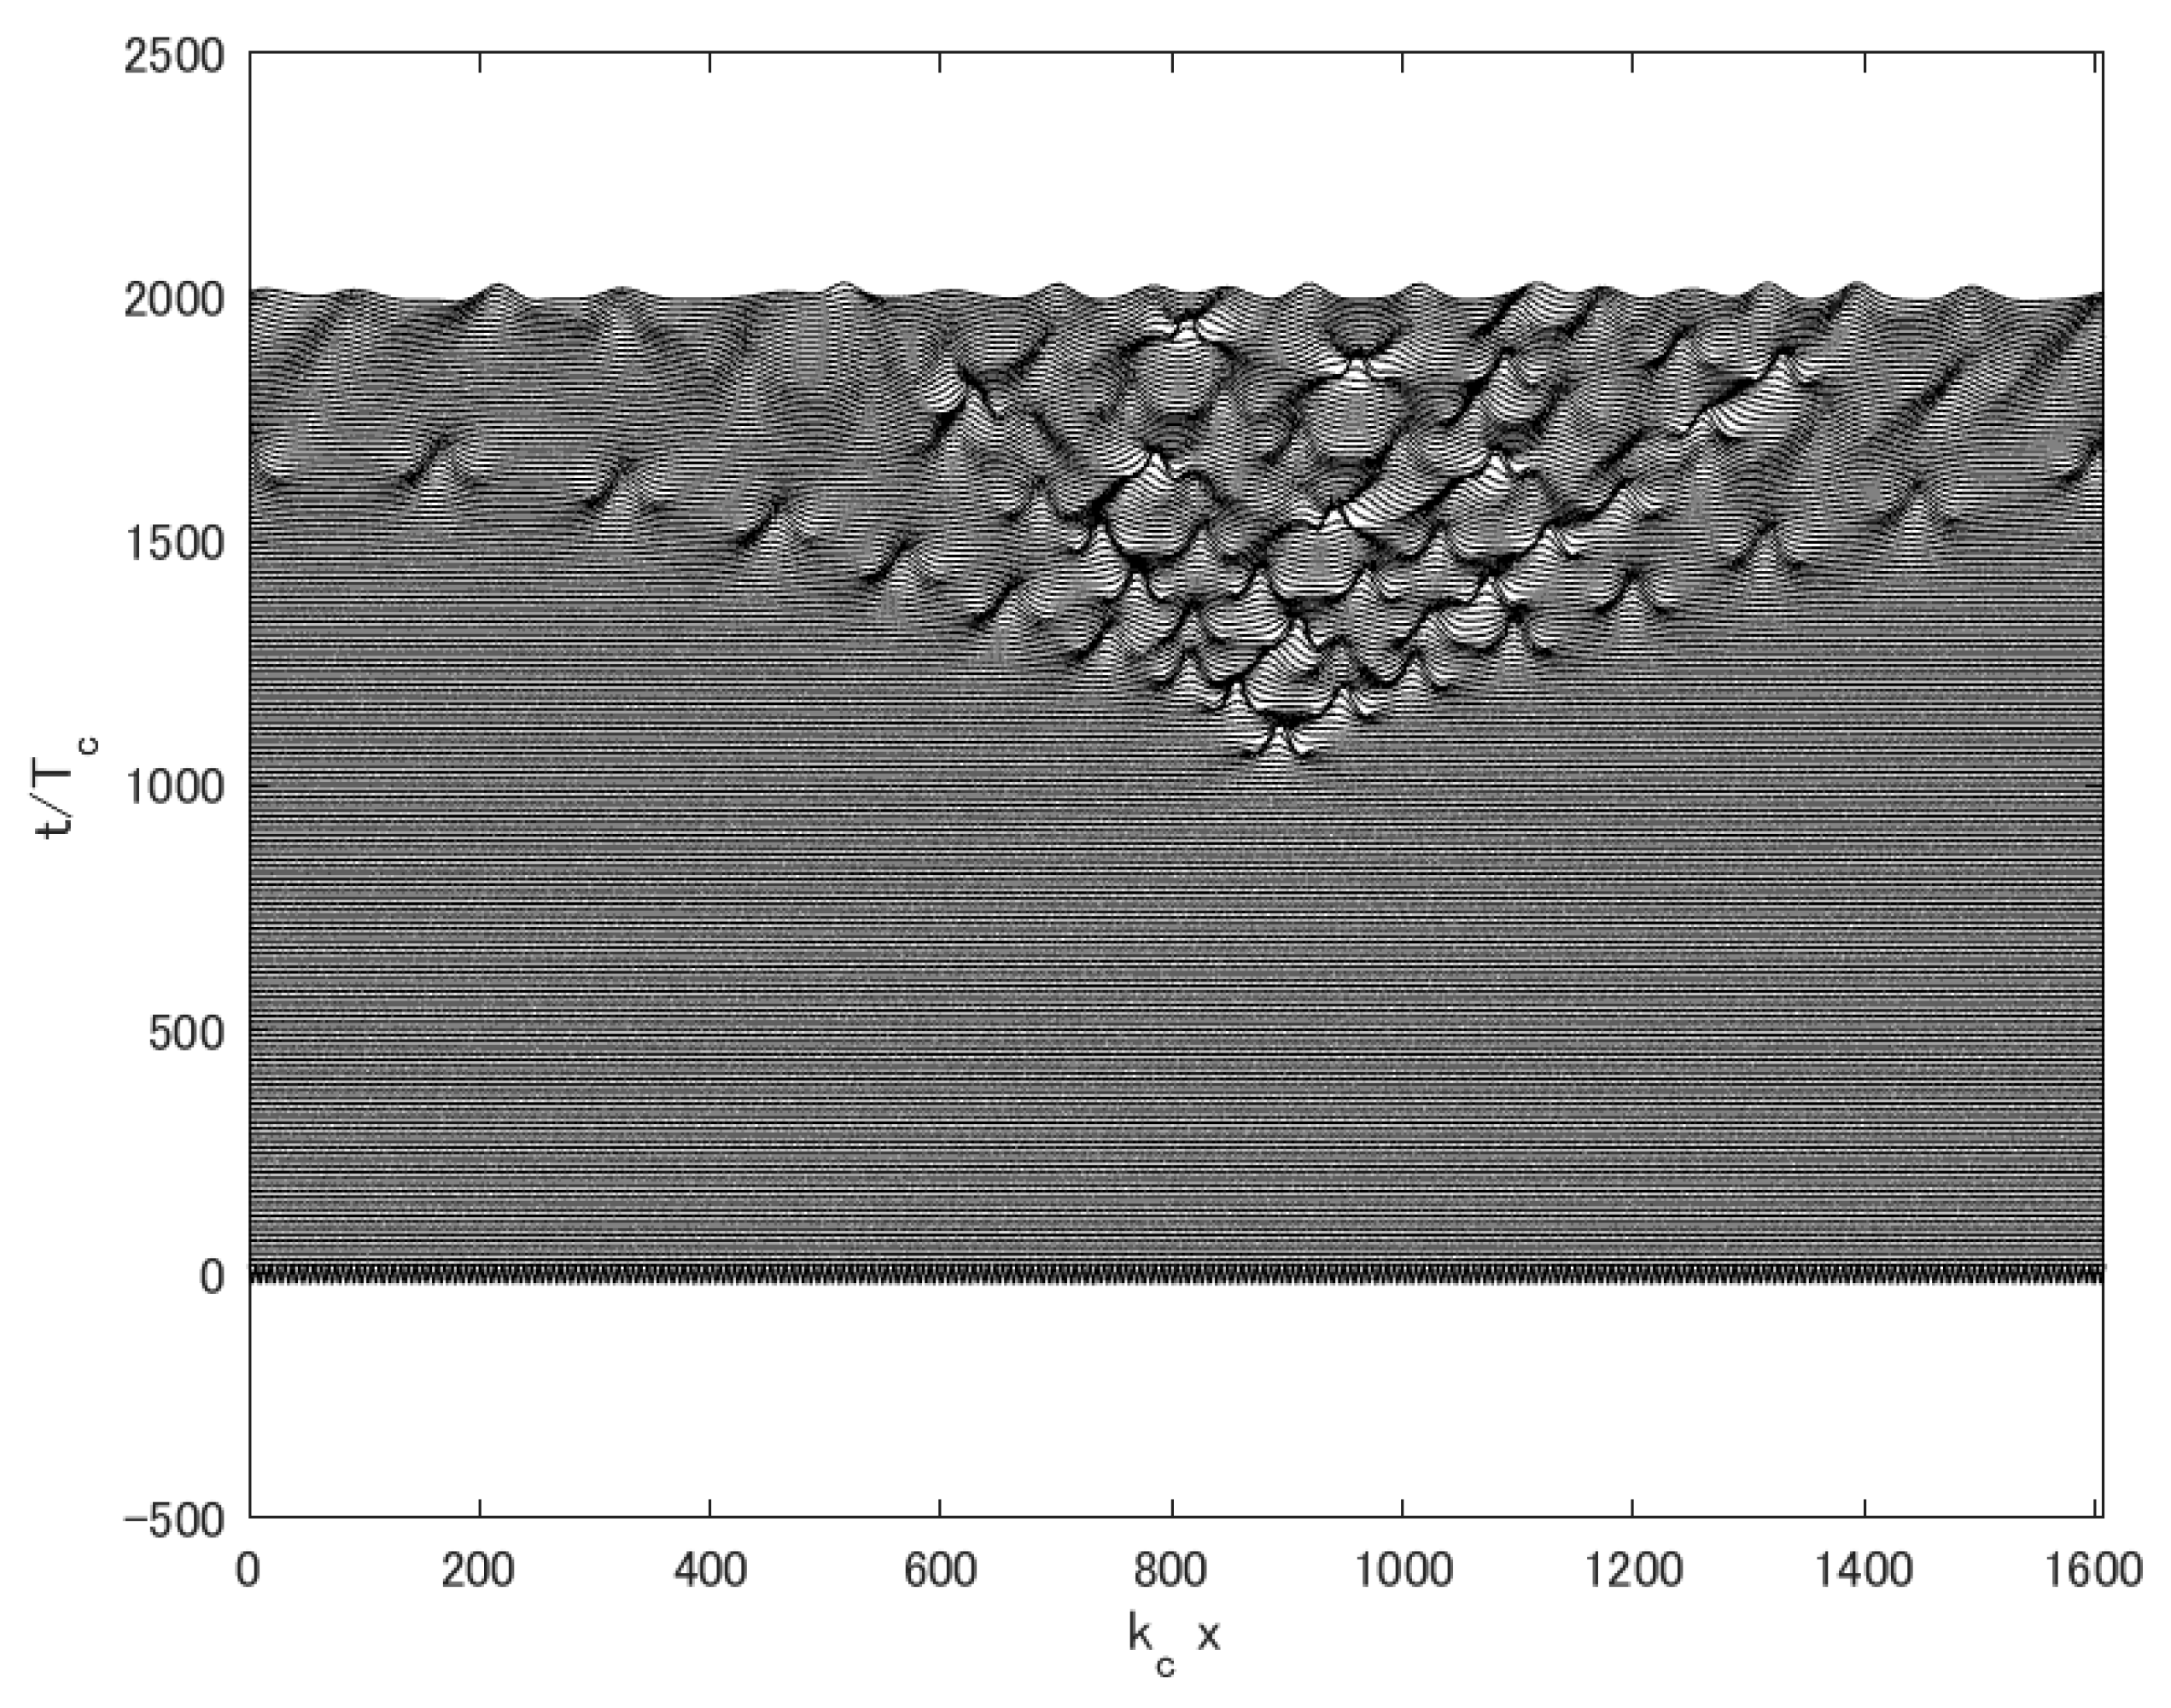
The evolution of the wave envelope for the Case 7 is shown in Figure A1. The first amplification peaks at around 1071 wave periods. Immediately after that, the wave train systematically disintegrates into a number of groups that seem to grow more or less linearly in time, hence, forming a triangular region in the space–time domain. The evolution somewhat resembles the analytical solution to the NLSE [57] but is more irregular due to higher-order hydrodynamic effects. In this paper, only the first peak of the modulation is studied.
Figure A1. Evolution of wave envelope of Case 7. Horizontal axis is kcx and the vertical axis is wave periods t / T p . The horizontal axis is shifted to follow the wave group propagating at a linear group speed.
Fluids 04 00084 g0a1

References

  1. Kharif, C.; Pelinovsky, E.; Slunyaev, A. Quasi-Linear Wave Focusing. In Rogue Waves in the Ocean; Springer: Berlin/Heidelberg, Germany, 2009; pp. 63–89. [Google Scholar]
  2. Toffoli, A.; Lefevre, J.M.; Bitner-Gregersen, E.; Monbaliu, J. Towards the identification of warning criteria: Analysis of a ship accident database. Appl. Ocean Res. 2005, 27, 281–291. [Google Scholar] [CrossRef]
  3. Waseda, T.; Tamura, H.; Kinoshita, T. Freakish sea index and sea states during ship accidents. J. Mar. Sci. Technol. 2012, 17, 305–314. [Google Scholar] [CrossRef]
  4. Haver, S. A possible freak wave event measured at the Draupner Jacket January 1 1995. Rogue Waves. 2004, Volume 2004, pp. 1–8. Available online: http://aircrewremembered.com/PDF/draupner-wave.pdf (accessed on 18 February 2019).
  5. Magnusson, A.K.; Donelan, M.A. The Andrea wave characteristics of a measured North Sea rogue wave. J. Offshore Mech. Arctic Eng. 2013, 135, 031108. [Google Scholar] [CrossRef]
  6. Dias, F.; Brennan, J.; de León, S.P.; Clancy, C.; Dudley, J. Local analysis of wave fields produced from hindcasted rogue wave sea states. In ASME 2015 34th International Conference on Ocean, Offshore and Arctic Engineering; American Society of Mechanical Engineers: New York, NY, USA, 2015. [Google Scholar]
  7. Fedele, F.; Brennan, J.; Ponce de León, S.; Dudley, J.; Dias, F. Real world ocean rogue waves explained without the modulational instability. Sci. Rep. 2016, 6, 1–11. [Google Scholar] [CrossRef] [PubMed]
  8. Trulsen, K.; Nieto Borge, J.C.; Gramstad, O.; Aouf, L.; Lefèvre, J.M. Crossing sea state and rogue wave probability during the Prestige accident. J. Geophys. Res. Ocean 2015, 120, 7113–7136. [Google Scholar] [CrossRef]
  9. Onorato, M.; Waseda, T.; Toffoli, A.; Cavaleri, L.; Gramstad, O.; Janssen, P.A.E.M.; Kinoshita, T.; Monbaliu, J.; Mori, N.; Osborne, A.R. Statistical properties of directional ocean waves: The role of the modulational instability in the formation of extreme events. Phys. Rev. Lett. 2009, 102, 114502. [Google Scholar] [CrossRef] [PubMed]
  10. Onorato, M.; Cavaleri, L.; Fouques, S.; Gramstad, O.; Janssen, P.A.; Monbaliu, J.; Osborne, A.R.; Pakozdi, C.; Serio, M.; Stansberg, C.T.; et al. Statistical properties of mechanically generated surface gravity waves: A laboratory experiment in a three-dimensional wave basin. J. Fluid Mech. 2009, 627, 235–257. [Google Scholar] [CrossRef]
  11. Waseda, T.; Kinoshita, T.; Tamura, H. Evolution of a random directional wave and freak wave occurrence. J. Phys. Oceanogr. 2009, 39, 621–639. [Google Scholar] [CrossRef]
  12. Mori, N.; Onorato, M.; Janssen, P.A. On the estimation of the kurtosis in directional sea states for freak wave forecasting. J. Phys. Oceanogr. 2011, 41, 1484–1497. [Google Scholar] [CrossRef]
  13. Fujimoto, W.; Waseda, T.; Webb, A. Impact of the four-wave quasi-resonance on freak wave shapes in the ocean. Ocean Dyn. 2019, 69, 101–121. [Google Scholar] [CrossRef]
  14. Kokorina, A.; Slunyaev, A. Lifetimes of rogue wave events in direct numerical simulations of deep-water irregular sea waves. Fluids 2019, 4, 70. [Google Scholar] [CrossRef]
  15. Zakharov, V.E. Stability of periodic waves of finite amplitude on the surface of a deep fluid. J. Appl. Mech. Tech. Phys. 1968, 9, 190–194. [Google Scholar] [CrossRef]
  16. Yuen, H.C.; Lake, B.M. Nonlinear deep water waves: Theory and experiment. Phys. Fluids 1975, 18, 956–960. [Google Scholar] [CrossRef]
  17. Benjamin, T.B.; Feir, J.E. The disintegration of wave trains on deep water Part 1. Theory. J. Fluid Mech. 1967, 27, 417–430. [Google Scholar] [CrossRef]
  18. Akhmediev, N.N.; Korneev, V.I. Modulation instability and periodic solutions of the nonlinear Schrödinger equation. Theor. Math. Phys. 1986, 69, 1089–1093. [Google Scholar] [CrossRef]
  19. Chabchoub, A.; Hoffmann, N.P.; Akhmediev, N. Rogue wave observation in a water wave tank. Phys. Rev. Lett. 2011, 106, 204502. [Google Scholar] [CrossRef] [PubMed]
  20. Chabchoub, A.; Hoffmann, N.; Onorato, M.; Akhmediev, N. Super rogue waves: Observation of a higher-order breather in water waves. Phys. Rev. X 2012, 2, 011015. [Google Scholar] [CrossRef]
  21. Chabchoub, A.; Kibler, B.; Dudley, J.M.; Akhmediev, N. Hydrodynamics of periodic breathers. Philos. Trans. R. Soc. A Math. Phys. Eng. Sci. 2014, 372, 20140005. [Google Scholar] [CrossRef]
  22. Perić, R.; Hoffmann, N.; Chabchoub, A. Initial wave breaking dynamics of Peregrine-type rogue waves: A numerical and experimental study. Eur. J. Mech.-B/Fluids 2015, 49, 71–76. [Google Scholar] [CrossRef] [Green Version]
  23. Shemer, L.; Ee, B.K. Steep Unidirectional Wave Groups: Fully Nonlinear Simulations vs Experiments. In ASME 2015 34th International Conference on Ocean, Offshore and Arctic Engineering; American Society of Mechanical Engineers: New York, NY, USA, 2015. [Google Scholar]
  24. Shemer, L. Quantitative Analysis of Nonlinear Water-Waves: A Perspective of an Experimentalist. In New Approaches to Nonlinear Waves; Springer: Cham, Switzerland, 2016; pp. 211–293. [Google Scholar]
  25. Solli, D.R.; Ropers, C.; Koonath, P.; Jalali, B. Optical rogue waves. Nature 2007, 450, 1054. [Google Scholar] [CrossRef]
  26. Kibler, B.; Fatome, J.; Finot, C.; Millot, G.; Dias, F.; Genty, G.; Akhmediev, N.; Dudley, J.M. The Peregrine soliton in nonlinear fibre optics. Nat. Phys. 2010, 6, 790. [Google Scholar] [CrossRef]
  27. Kibler, B.; Fatome, J.; Finot, C.; Millot, G.; Genty, G.; Wetzel, B.; Akhmediev, N.; Dias, F.; Dudley, J.M. Observation of Kuznetsov-Ma soliton dynamics in optical fibre. Sci. Rep. 2012, 2, 463. [Google Scholar] [CrossRef] [Green Version]
  28. Frisquet, B.; Chabchoub, A.; Fatome, J.; Finot, C.; Kibler, B.; Millot, G. Two-stage linear-nonlinear shaping of an optical frequency comb as rogue nonlinear-Schrödinger-equation-solution generator. Phys. Rev. A 2014, 89, 023821. [Google Scholar] [CrossRef] [Green Version]
  29. Kibler, B.; Fatome, J.; Finot, C.; Millot, G. Experiments on breathers in nonlinear fibre optics. In Rogue and Shock Waves in Nonlinear Dispersive Media; Springer: Cham, Switzerland, 2016; pp. 89–115. [Google Scholar]
  30. Travers, J.C. Blue extension of optical fibre supercontinuum generation. J. Opt. 2010, 12, 113001. [Google Scholar] [CrossRef]
  31. Dudley, J.M.; Genty, G.; Dias, F.; Kibler, B.; Akhmediev, N. Modulation instability, Akhmediev Breathers and continuous wave supercontinuum generation. Opt. Express 2009, 17, 21497–21508. [Google Scholar] [CrossRef] [Green Version]
  32. Peregrine, D.H. Water waves, nonlinear Schrödinger equations and their solutions. ANZIAM J. 1983, 25, 16–43. [Google Scholar] [CrossRef]
  33. Akhmediev, N.; Ankiewicz, A.; Soto-Crespo, J.M.; Dudley, J.M. Rogue wave early warning through spectral measurements? Phys. Lett. A 2011, 375, 541–544. [Google Scholar] [CrossRef] [Green Version]
  34. Dysthe, K.B. Note on a modification to the nonlinear Schrödinger equation for application to deep water waves. Proc. R. Soc. Lond. A 1979, 369, 105–114. [Google Scholar] [CrossRef]
  35. Yan, Z. Generalized method and its application in the higher-order nonlinear Schrödinger equation in nonlinear optical fibres. Chaos Solitons Fractals 2003, 16, 759–766. [Google Scholar] [CrossRef]
  36. Amiranashvili, S. Hamiltonian framework for short optical pulses. In New Approaches to Nonlinear Waves; Springer: Cham, Switzerland, 2016; pp. 153–196. [Google Scholar]
  37. Conforti, M.; Marini, A.; Tran, T.X.; Faccio, D.; Biancalana, F. Interaction between optical fields and their conjugates in nonlinear media. Opt. Express 2013, 21, 31239–31252. [Google Scholar] [CrossRef] [PubMed]
  38. Chabchoub, A.; Kibler, B.; Finot, C.; Millot, G.; Onorato, M.; Dudley, J.M.; Babanin, A.V. The nonlinear Schrödinger equation and the propagation of weakly nonlinear waves in optical fibers and on the water surface. Ann. Phys. 2015, 361, 490–500. [Google Scholar] [CrossRef]
  39. Stiassnie, M.; Kroszynski, U.I. Long-time evolution of an unstable water-wave train. J. Fluid Mech. 1982, 116, 207–225. [Google Scholar] [CrossRef]
  40. Tulin, M.P.; Waseda, T. Laboratory observations of wave group evolution, including breaking effects. J. Fluid Mech. 1999, 378, 197–232. [Google Scholar] [CrossRef]
  41. Janssen, P.A. Nonlinear four-wave interactions and freak waves. J. Phys. Oceanogr. 2003, 33, 863–884. [Google Scholar] [CrossRef]
  42. Stiassnie, M. Note on the modified nonlinear Schrödinger equation for deep water waves. Wave Motion 1984, 6, 431–433. [Google Scholar] [CrossRef]
  43. Chabchoub, A.; Hoffmann, N.; Onorato, M.; Genty, G.; Dudley, J.M.; Akhmediev, N. Hydrodynamic supercontinuum. Phys. Rev. Lett. 2013, 111, 054104. [Google Scholar] [CrossRef]
  44. Trulsen, K.; Dysthe, K.B. A modified nonlinear Schrödinger equation for broader bandwidth gravity waves on deep water. Wave Motion 1996, 24, 281–289. [Google Scholar] [CrossRef]
  45. Chabchoub, A.; Kibler, B.; Dudley, J.M.; Akhmediev, N. Hydrodynamics of periodic breathers. Philos. Trans. R. Soc. A 2014, 372, 20140005. [Google Scholar] [CrossRef]
  46. West, B.J.; Brueckner, K.A.; Janda, R.S.; Milder, D.M.; Milton, R.L. A new numerical method for surface hydrodynamics. J. Geophys. Res. Oceans 1987, 92, 11803–11824. [Google Scholar] [CrossRef]
  47. Toffoli, A.; Bitner-Gregersen, E.; Onorato, M.; Babanin, A.V. Wave crest and trough distributions in a broad-banded directional wave field. Ocean Eng. 2008, 35, 1784–1792. [Google Scholar] [CrossRef]
  48. Dommermuth, D. The initialization of nonlinear waves using an adjustment scheme. Wave Motion 2000, 32, 307–317. [Google Scholar] [CrossRef]
  49. Tanaka, M. A method of studying nonlinear random field of surface gravity waves by direct numerical simulation. Fluid Dyn. Res. 2001, 28, 41. [Google Scholar] [CrossRef]
  50. Onorato, M.; Osborne, A.R.; Serio, M. On the relation between two numerical methods for the computation of random surface gravity waves. Eur. J. Mech. B/Fluids 2007, 26, 43–48. [Google Scholar] [CrossRef]
  51. Erkintalo, M.; Genty, G.; Wetzel, B.; Dudley, J.M. Akhmediev breather evolution in optical fiber for realistic initial conditions. Phys. Lett. A 2011, 375, 2029–2034. [Google Scholar] [CrossRef]
  52. Armaroli, A.; Brunetti, M.; Kasparian, J. Recurrence in the high-order nonlinear Schrödinger equation: A low-dimensional analysis. Phys. Rev. E 2017, 96, 012222. [Google Scholar] [CrossRef] [PubMed]
  53. Yuen, H.C.; Lake, B.M. Nonlinear dynamics of deep-water gravity waves. In Advances in Applied Mechanics; Elsevier: Amsterdam, The Netherlands, 1982; Volume 22, pp. 67–229. [Google Scholar]
  54. Erkintalo, M.; Hammani, K.; Kibler, B.; Finot, C.; Akhmediev, N.; Dudley, J.M.; Genty, G. Higher-order modulation instability in nonlinear fiber optics. Phys. Rev. Lett. 2011, 107, 253901. [Google Scholar] [CrossRef]
  55. Kimmoun, O.; Hsu, H.C.; Kibler, B.; Chabchoub, A. Nonconservative higher-order hydrodynamic modulation instability. Phys. Rev. E 2017, 96, 022219. [Google Scholar] [CrossRef] [PubMed]
  56. Armaroli, A.; Conti, C.; Biancalana, F. Rogue solitons in optical fibers: A dynamical process in a complex energy landscape? Optica 2015, 2, 497–504. [Google Scholar] [CrossRef]
  57. Grimshaw, R.H.J.; Tovbis, A. Rogue waves: Analytical predictions. Proc. R. Soc. A 2013, 469, 20130094. [Google Scholar] [CrossRef]
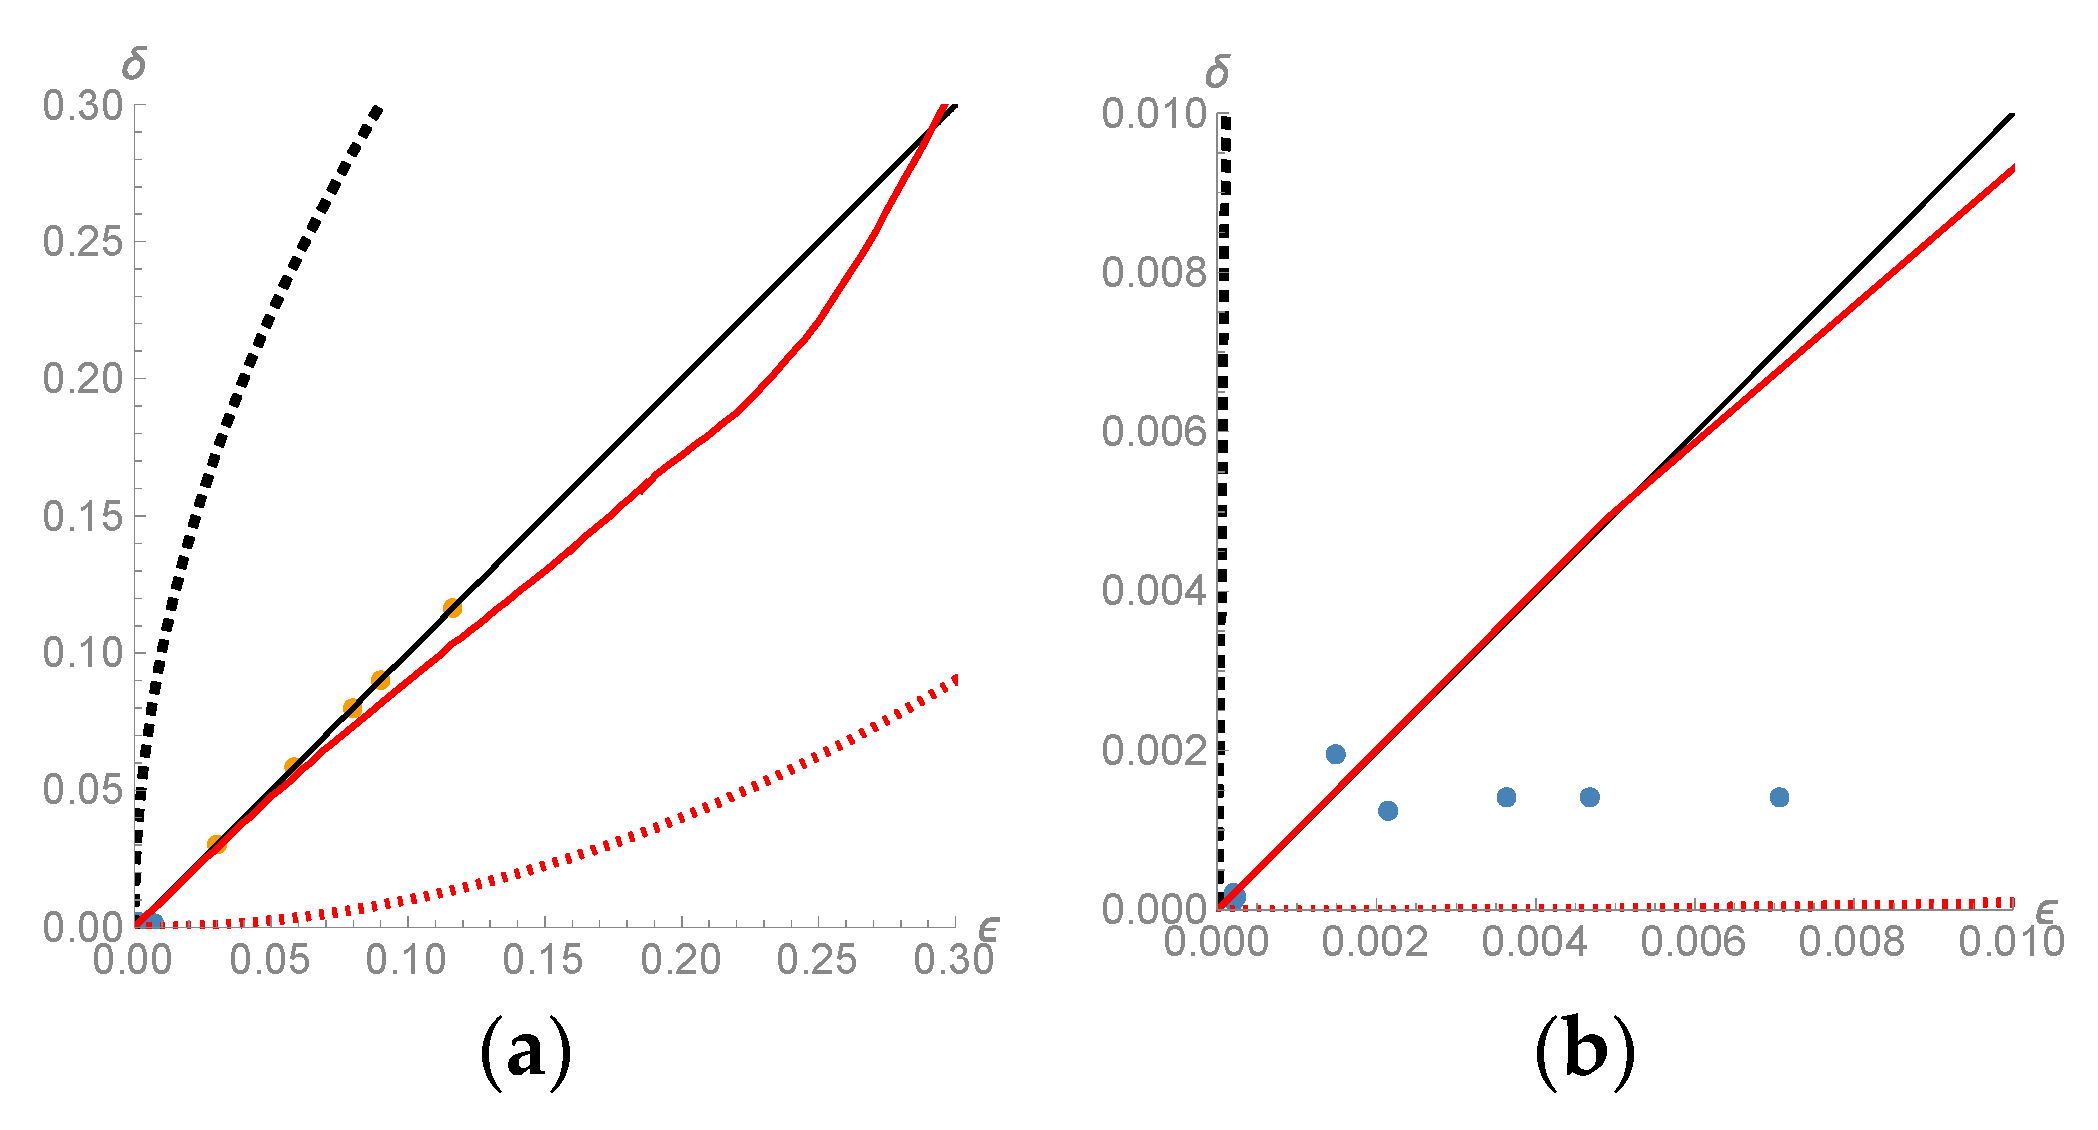
Figure 1. (a) The ϵδ space, mapping the hydrodynamics (red dots) [19,20,21] and optics (blue dots [26,27,28,31] experimental conditions of modulational instability (MI). The horizontal axis is the steepness ϵ representing the nonlinearity and the vertical axis is the spectral bandwidth δ representing dispersion. (b) Enlarged view highlighting the optics experiments. The solid black line corresponds to δ = ϵ or Benjamin–Feir Index ( BFI ) = 1 . Black dashed line corresponds to ε 1 / 2 = δ and B F I < 1 . The red dotted line corresponding to ε 2 = δ and B F I > 1 is plotted for visual guidance. The red solid line indicates the maximum growth condition of the MI [40].
Fluids 04 00084 g001
Figure 2. Experimental results of Dudley et al. of 1 ns pulse at 1064 nm injected into a photonic crystal fiber [31]. As the peak power is increased, i.e., larger ε , the spectrum broadens and becomes asymmetric. Adapted with permission from Reference [31], the Optical Society (OSA).
Fluids 04 00084 g002
Figure 3. Cases of δ k / k c = 0.0156 ( N = 64 ). From top to bottom, Case 1 to 4. (a) Surface elevations at the peak of the modulation. The positions of the wave groups are adjusted to the center. The horizontal axis is k c x , the vertical axis is η k c ; (b) The corresponding wavenumber spectra. The horizontal axis is k / k c . The vertical axis is normalized spectral density; ( η ^ ( k ) k c ) 2 2 π N .
Fluids 04 00084 g003
Figure 4. Cases of δ k k c = 0.0039 ( N = 256 ). From top to bottom, Case 5 to 7. (a) Surface elevations at the peak of the modulation. The positions of the wave groups are adjusted to the center. The second, fourth and the sixth figures from the top are enlarged views to highlight the wave group. The horizontal axis is k c x , the vertical axis is η k c . (b) The corresponding wavenumber spectra. The second, fourth and the sixth figures from the top are enlarged views in a linear–linear plot to highlight the energetic part of the spectrum. The horizontal axis is k / k c . The vertical axis is normalized spectral density; ( η ^ ( k ) k c ) 2 2 π N .
Fluids 04 00084 g004
Figure 5. Evolution of the wave modes of δ k k c = 0.0156 cases: carrier (solid black line), k c ± δ k (red dashed and dotted lines), k c ± 2 δ k (blue dashed and dotted lines). From top to bottom, Case 1 to 4.
Fluids 04 00084 g005
Figure 6. Evolution of the wave modes of δ k k c = 0.0039 cases: carrier (solid black line), k c ± δ k (red dashed and dotted lines), k c ± 2 δ k (blue dashed and dotted lines). From top to bottom, Case 5 to 7.
Fluids 04 00084 g006
Table 1. Cases of high-order spectral method (HOSM) modulated wave train simulations; N: number of waves in a domain; B F I : Benjamin–Feir index; δ k / k c : spectral bandwidth; a c k c : steepness; m : number of grid points.
N B F I δ k / k c a c k c m
Case 16410.01560.00781024
Case 26430.01560.02341024
Case 36450.01560.03911024
Case 464100.01560.07811024
Case 525650.00390.00984096
Case 6256100.00390.01954096
Case 7256150.00390.02934096