Abstract
Transient flows result in unbalanced forces and high pressure in pipelines. Under these conditions, the combined effects of flow-induced forces along with sudden pipe displacements can create cracks in the pipeline, especially at the junctions. This situation consequently results in water leakage and reduced operational efficiency of the pipeline. In this study, displacements and stresses in a buried pressurized water transmission pipe installed by pipe jacking method are investigated using numerical modeling and considering interactions between fluid, pipe, and soil. The analyses were performed consecutively under no-flow, steady flow, and transient flow conditions, in order to investigate the effects of flow conditions on displacements and stresses in the system. Analyses of the results show that displacements and stresses in the jointed concrete pipes are significant under transient flow conditions. Moreover, because of pressure transient effects, maximum tensile stresses exceed the tensile strength of concrete at the junctions, leading to cracks and consequent water leakage.
1. Introduction
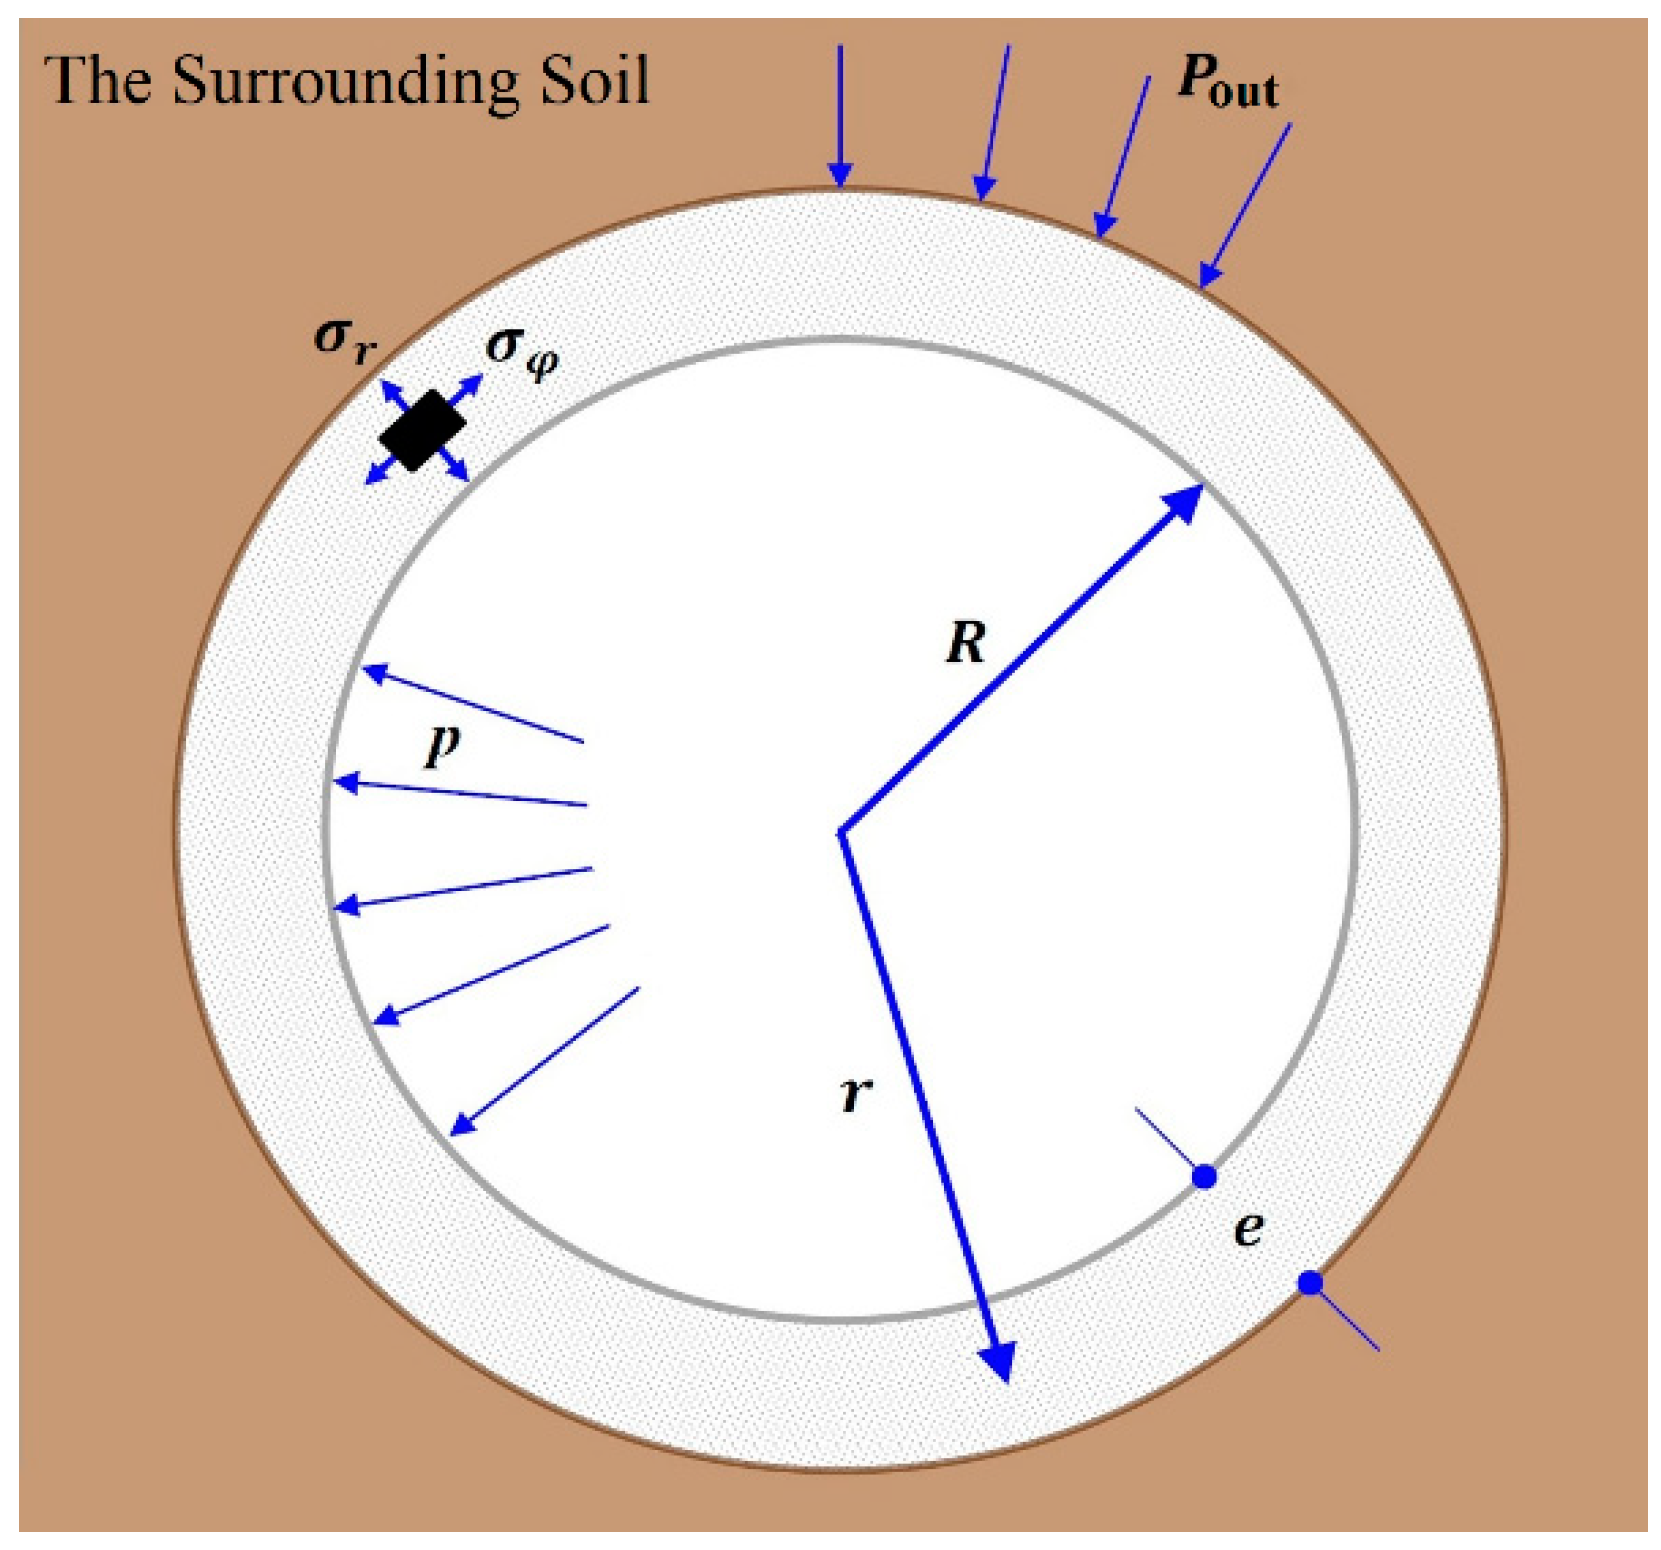
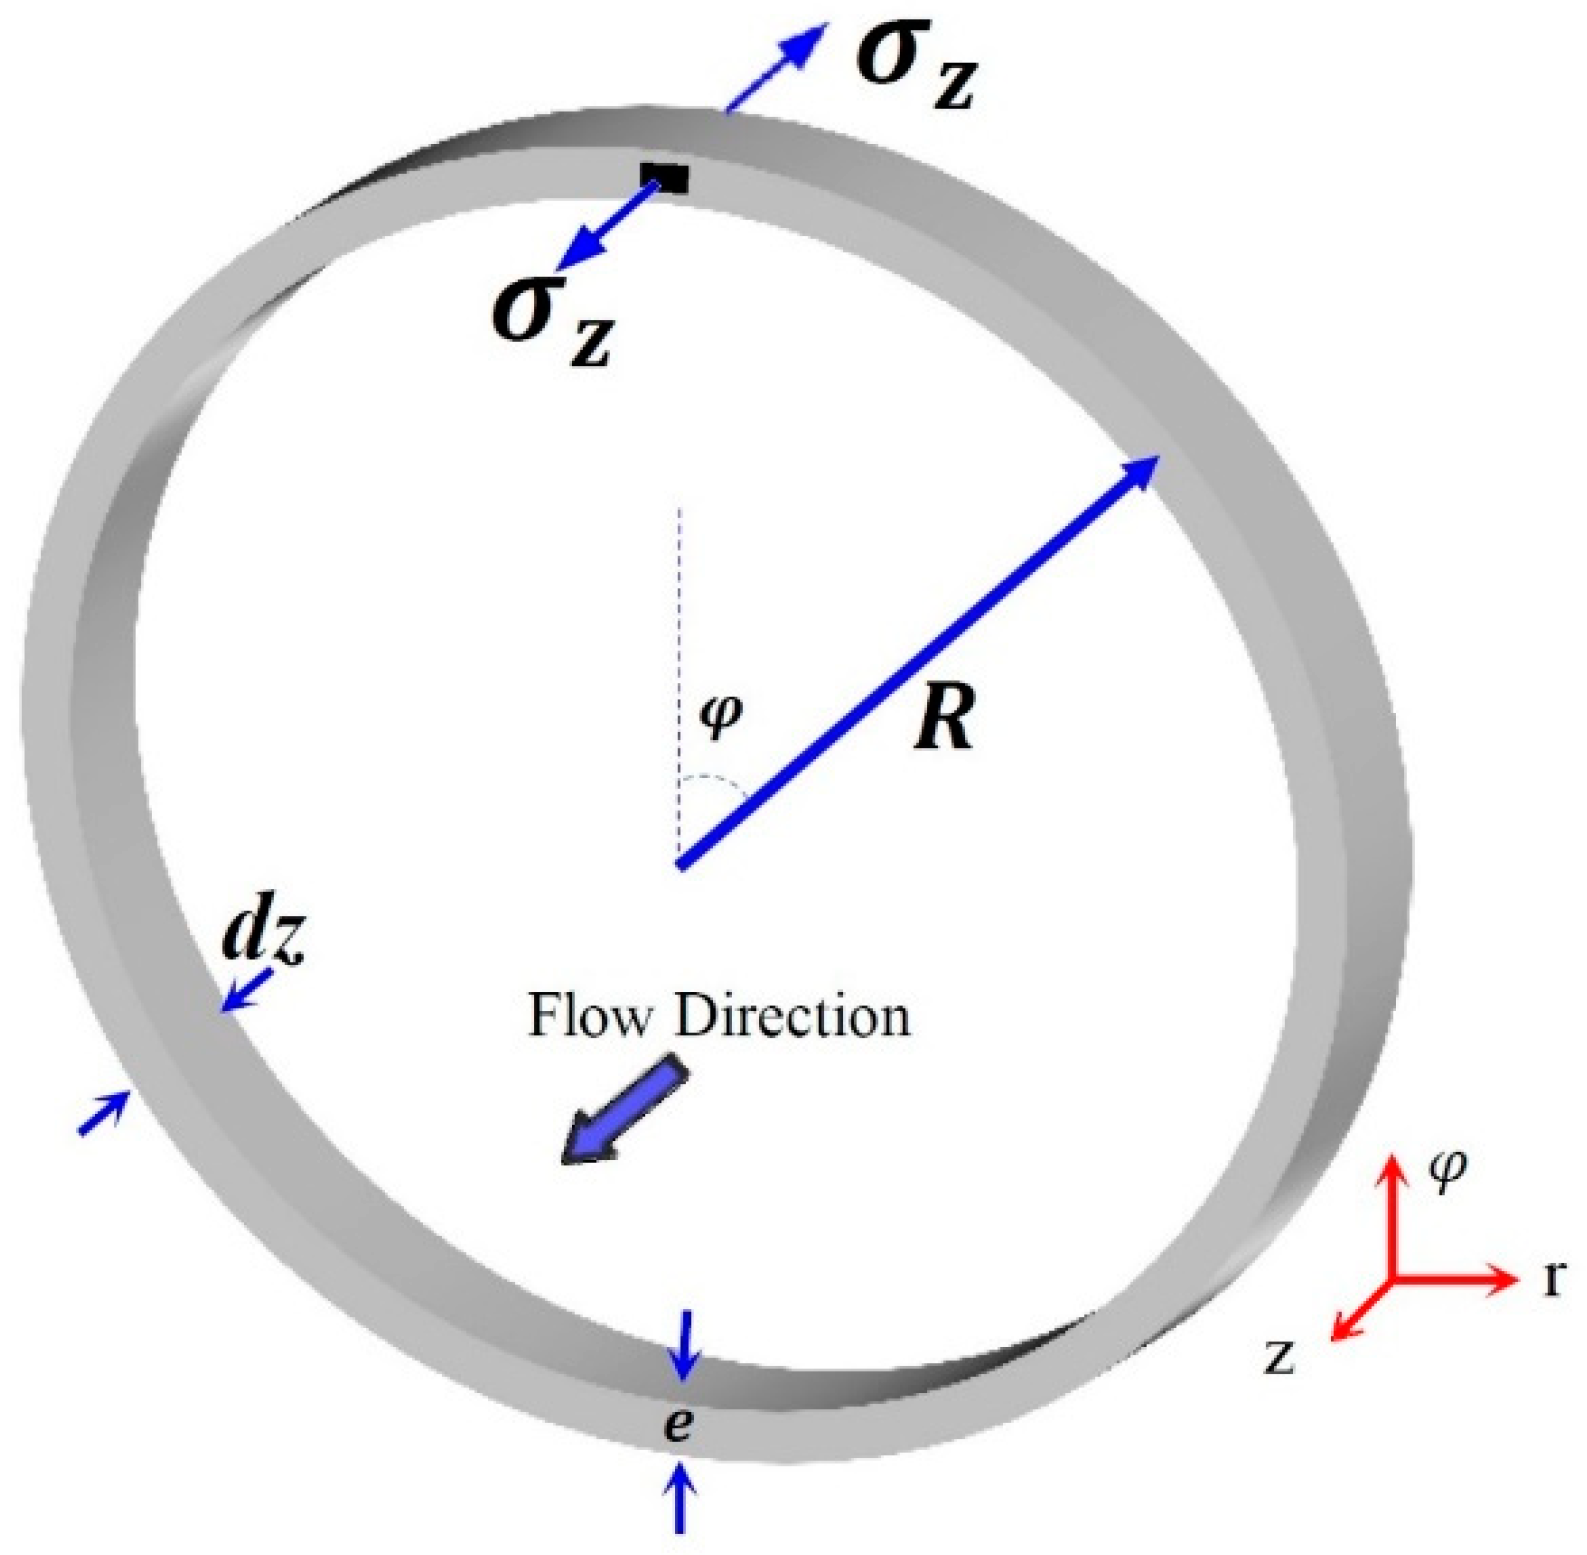
Pipe failures are usually a complex function of different circumstances, including pipe properties, internal and external loadings, and environmental factors. Generally, when applied forces exceed the bearing capacity of the pipe materials, failure occurs [1]. Among pipe damage and causes, several failures have been reported due to pressure transient effects [2,3,4]. Transient pressure in pipe networks is generally formed due to factors such as sudden changes in valve operations, starting or stopping of pumps, the sudden change in reservoir level, and changes in the demand conditions. In such cases, the kinetic energy of the fluid is reduced significantly, and pressure waves are transmitted along the pipeline. This high-pressure build-up can damage the pipeline by creating sudden pipe displacements and excessive stresses in the pipe wall. Figure 1 and Figure 2 show stress distribution in a pressurized pipe, and stresses acting on the pipe wall, in static state.
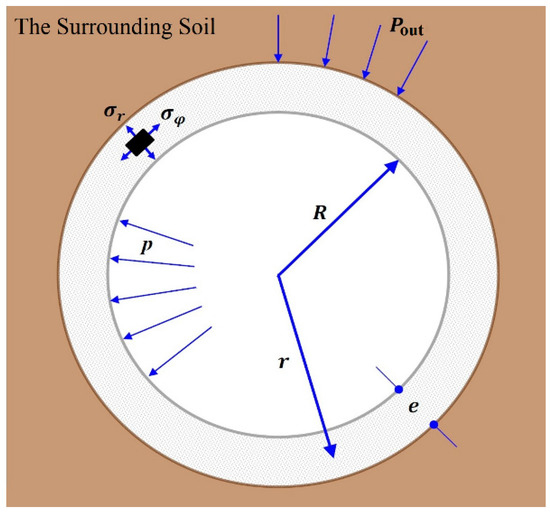
Figure 1.
Pressurized pipe cross section.
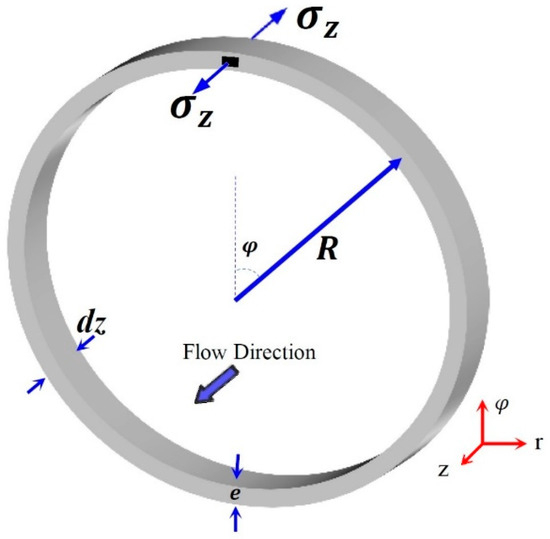
Figure 2.
Side view (z-r plane): stresses acting on pipe wall.
In Figure 1, Pout is the soil overburden pressure on the pipe, P is the transient pressure of the fluid, R is the internal radius, and e is the thickness of the pipe.
According to Figure 2, by considering the existence of two-dimensional axially symmetric stresses in a circular ring subjected to the internal pressure P and external pressure Pout (soil pressure), the pipe displacements can be described by Equations (1) and (2), as [5]
with ρt the mass density of the wall material, and the axial and radial pipe velocities, σr the axial and radial stresses, and σφ the hoop stress. In the present study, the pipes were considered long enough, so that σz becomes negligible due to the plane stress principle.
By solving Equations (1) and (2), the hoop and radial stresses can be calculated using Equations (3) and (4), as
A and C are determined by satisfying the following boundary conditions
It follows that
Finally, the averaged values of σφ and σr are presented in Equations (9) and (10), as
It should be noted that the presented equations are only applicable in the static state, and there is no analytical formula to calculate the stresses and displacements in dynamic state, which is the main core of this article. That is why complex dynamic problems are usually solved numerically.
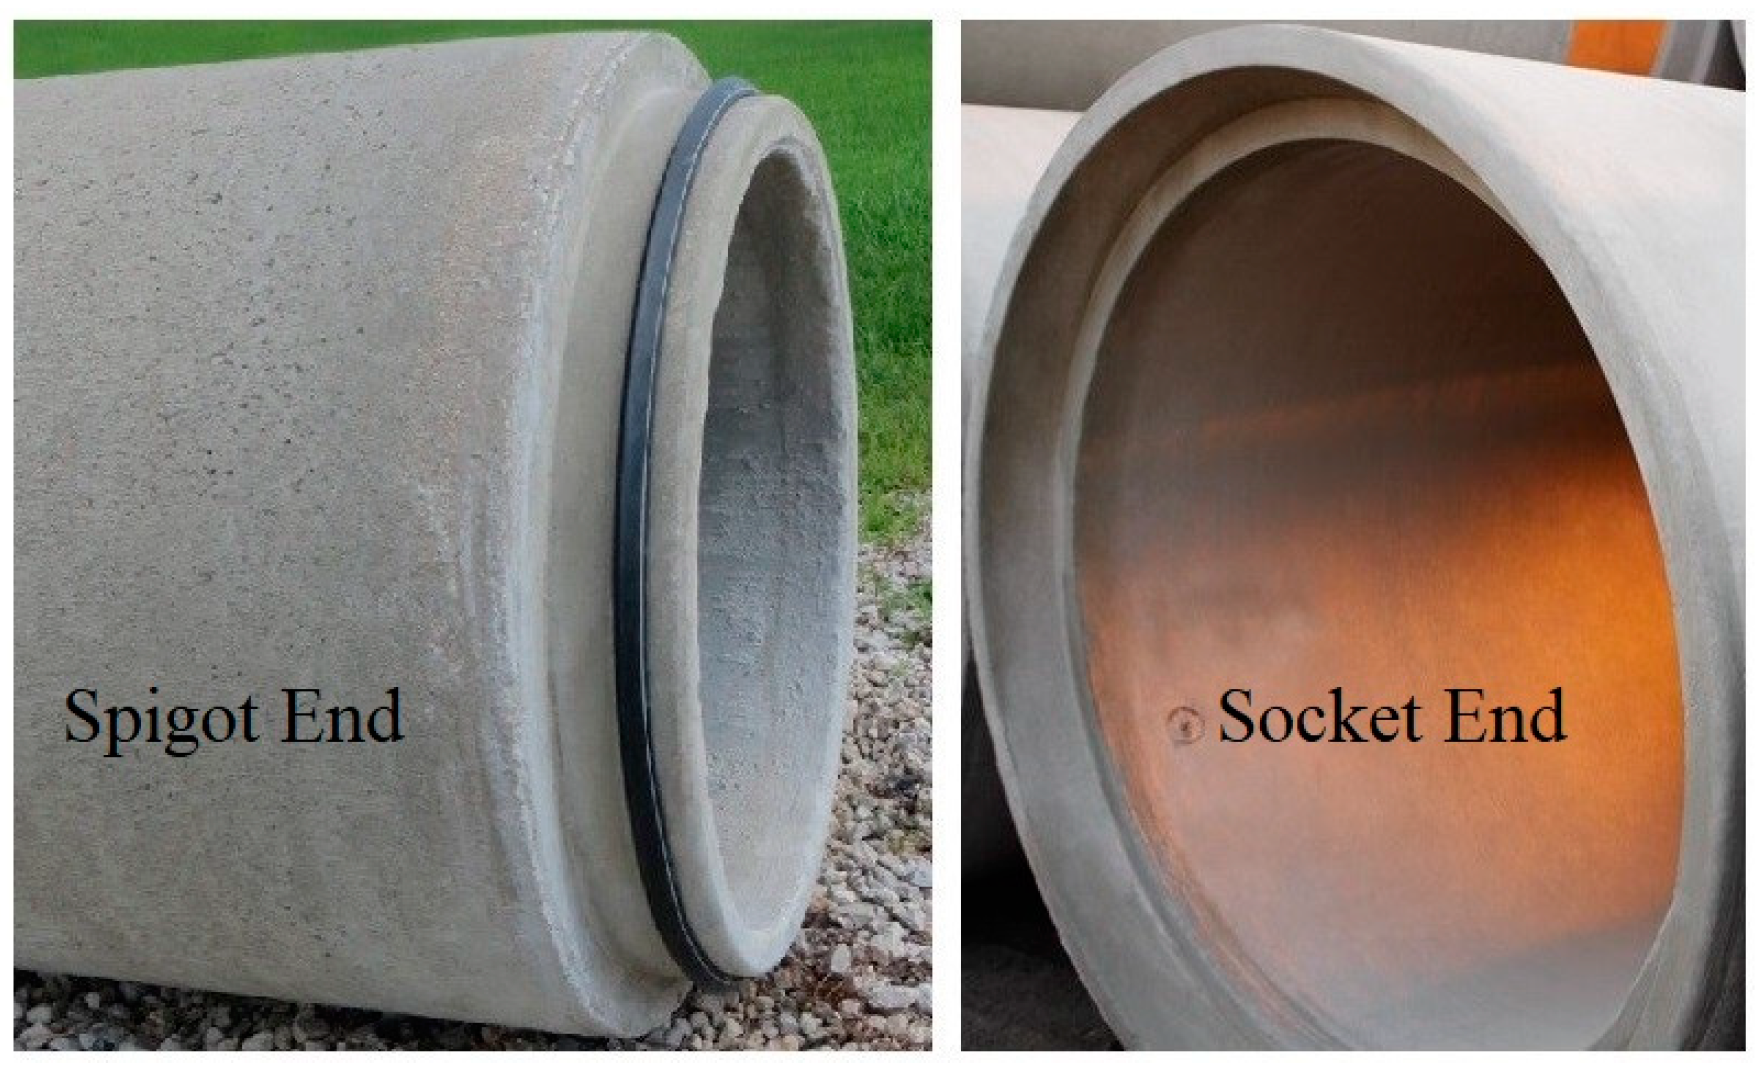
In recent years, the use of underground structures such as pressurized water pipes for the distribution of water has increased. Trenched and trenchless drilling are two methods commonly used for the construction of buried pipelines [6]. In the trenched method, the soil is removed to form a trench in the ground, and as the pipes are installed, the trench is filled with soil again. In this method, issues such as reduced enclosing tensions around the pipe—due to lack of proper soil compaction—can occur, which can consequently result in inadequate safety and instability of the structure, in the event of pressure transient conditions and pipe displacements [1]. Whereas in trenchless drilling, soil compaction, and stresses within the soil are not significantly affected. Pipe jacking is a trenchless drilling technique, used for the installation of underground structures such as pipelines, ducts, and culverts. In this method, powerful hydraulic jacks are used to push concrete or steel pipes through the ground at the same time as drilling is taking place within the shield [7]. In this method, the end connection of a fitting that is to be assembled into another fitting is called ‘the spigot’, and the female connection of the pipe fitting is referred to as ‘the socket’. The spigot end of a fitting is inserted into the socket. Spigot and socket joint pipes are joined and sealed using a rubber ring (Figure 3).
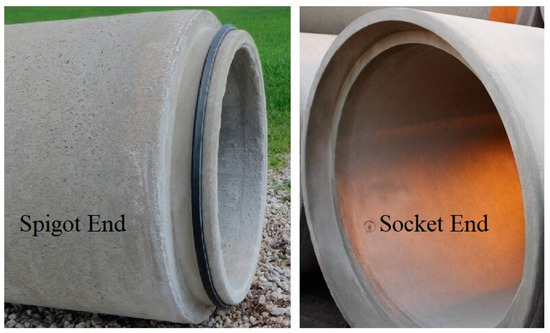
Figure 3.
The spigot and socket ends of a concrete pipe in pipe jacking method.
Literature Review and Motivation
Kyriakides and Babcock [8] studied the propagation of internal pressures in circular pipes. They concluded that transient pressures cause significant stresses in the pipes. In another effort, Milligan et al. [9] investigated the pipe–soil interactions in the pipe jacking method and proposed a theoretical model for the interactions. Using numerical modeling, Valiente [10] evaluated failures in concrete pipes due to internal pressures. He presented equations to estimate maximum stresses in the pipe. Gysling [11] conducted an experimental study on vibrations and displacements around unburied pipes due to dynamic flows. He used sensors to measure displacements, and concluded that unsteady pressures could be damaging to the pipeline.
Wasmer et al. [12] investigated the crack growth in straight and bent unburied cast iron pipes under steady internal pressures, and proposed an analytical model. Meis et al. [13] conducted a research study to determine the static and dynamic behavior of some typical restrained and unrestrained underground pipe joints due to internal pressure and earthquakes. Gou [14] studied a pipeline under oblique loading. He demonstrated the effect of pipe burial depth on displacements around the pipe. Schmitt et al. [15] investigated pipeline failure due to dynamic pressure effects in a case study in Tunisia. They used numerical modeling to investigate damages in the pipe. Tijsseling [5] investigated the impact of dynamic pressures in a pressurized pipe, considering fluid–structure interactions. He presented equations for determining tensions and displacements in unburied pipes. Using the finite element method (FEM), Lydell and Riznic [16] conducted a survey on the damages to pipes in various projects. They categorized various factors, including internal pressures in the pipe.
More recently, Vazouras et al. [17] investigated the mechanical behavior of buried steel pipelines crossing an active strike-slip fault. They studied the effects of fault displacements and evaluated the critical strain in the pipeline. Wu et al. [18] used a three-dimensional finite element analysis to study the effects of load and displacement-controlled bending on the plastic collapse of pressurized pipes. Rezai et al. [1] studied the impact of transient hydraulic conditions on pipe failures by analyzing historical records and investigating different case studies. Wang [19] used the FEM to study damages in underground pipes as a function of soil overburden and surface loads. He proposed a method to evaluate the magnitude of damage in pipes within a short period of time as a result of an impact load on the surface. Xu et al. [20] studied the effects of soil overburden and traffic loads on a concrete pipeline. The results indicated that applied loads had considerable impacts on damages to the pipe.
The literature review indicates that flow-induced stresses and displacements in buried pressurized water transmission pipes installed using trenchless drilling (pipe jacking method) have not been investigated. Therefore, this study aims to fill this gap in the literature.
2. Materials and Methods
The FEM, is a numerical method for solving complex engineering and mathematical physics problems. Studying or analyzing a phenomenon with FEM is often referred to as finite element analysis (FEA). In this research, a typical water transmission concrete pipe in a soil environment is numerically studied using the Abaqus FEA Ver. 2018 (Abaqus Inc., Palo Alto, CA, USA), under three scenarios: (a) drilling and pipe installation (no-flow condition); (b) steady flow in the pipe; (c) transient flow in the pipe. General steps for setting up the model are presented in the following sub-sections.
2.1. Model Geometry
Geometries of the soil mass, pipe cross-section, and model boundaries are shown in Figure 4. A long concrete pipe, with internal and external radii of 45 and 50 cm, respectively, was modeled. Model boundaries were determined by trial and error in a way that the area around the pipe is not affected by the boundaries, and they do not affect the analysis results. Therefore, the stress distribution and displacements only occur around the pipe. Moreover, the side boundaries of the soil were constrained in horizontal direction, and the bottom boundary both in vertical and horizontal directions.

Figure 4.
Cross section of the pipe and soil.
2.2. Soil and Material Properties
The geomechanical properties of the soil mass were selected based on the characteristics of normally consolidated clay in urban areas [21]. Moreover, the properties of the pipe were selected based on the characteristics of typical water transmission concrete pipes [22]. Table 1 presents soil and material properties used in the model.

Table 1.
Properties of the materials used in the model [21,22]
2.3. Flow Characteristics
Internal pressure and flow velocity in the pipe under steady flow conditions were selected to be 0.5 MPa (72.52 psi) and 4 m/s, respectively, as typical values in urban water transmission pipes.
2.4. Modeling Procedure
In the present study, the general assumptions that were necessary to model the FSI (fluid–structure interaction) problem are as follows:
- The surrounding soil is monolith.
- The concrete lining behavior is considered as non-linear.
- A damage plasticity behavior is considered in the concrete lining.
- The CPE8R (eight-node plane strain quadrilateral, biquadratic displacement, reduced integration) elements are used for the simulation of the concrete pipe.
- Based on the Cam-Clay criterion, the soil is considered as a plastic material.
- Dynamic explicit method is applied to solve the finite element equations in the Abaqus FEA.
2.4.1. Acoustic Environment
Inside a pressurized water pipe, the only degree of freedom in nodes of the finite element model of the fluid is pressure. In Abaqus FEA, acoustic environments and acoustic materials possess this feature. An acoustic environment is an elastic environment where no shear stress is present (assuming non-viscous fluid), and the pressure is proportional to volumetric strain. Acoustic environments consider the effects of inertia and fluid compressibility, and pressure wave propagation can be simulated in these environments. [23]. Therefore, in order to investigate the impact of transient pressures on pipe displacements and the distribution of stresses in the pipe wall, AC2D4 (Acoustic Continuum 2-Dimension 4-Node) elements were implemented to simulate fluid motion in the pipe, in 0.01 s time increments.
2.4.2. Interactions between Model Components and Meshing
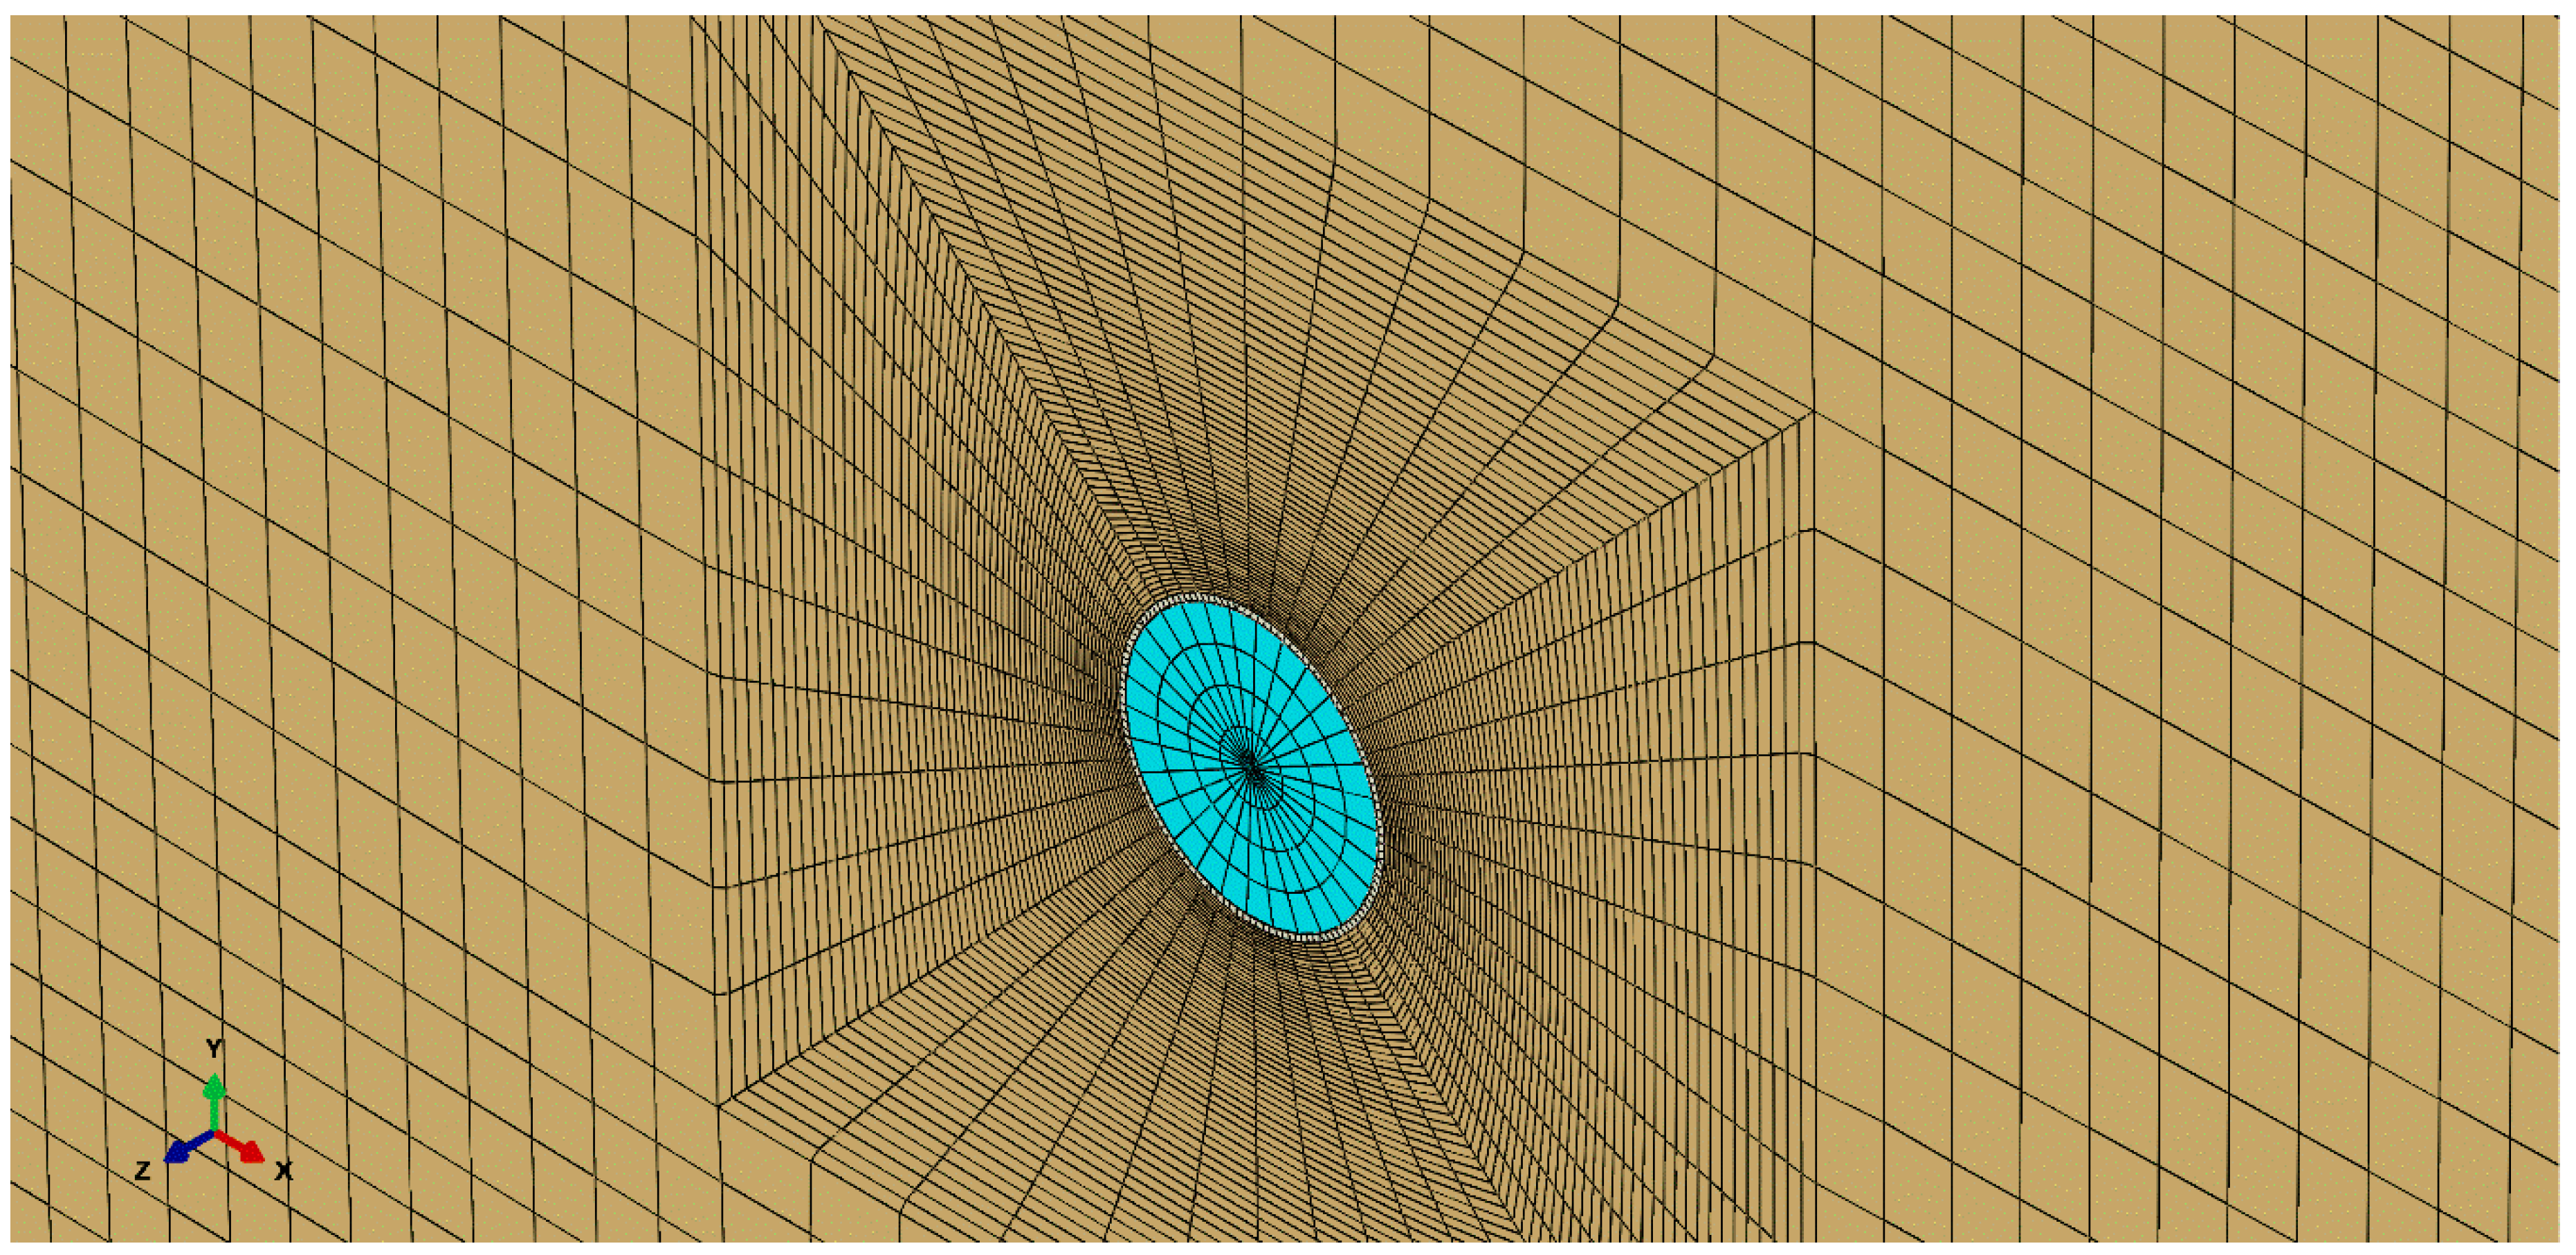
As stated above, the only variable in the acoustic environment is pressure. The value of this variable was applied to each node by applying initial conditions using a quasi-static wave method [24]. The interactions between the pipe and fluid were introduced to the model by coupling displacement matrixes of the inner pipe surface with displacement matrixes of the fluid boundary elements. Moreover, the interactions between the pipe and soil were introduced to the model by defining cohesive elements between the soil and the outer pipe surface. Sensitivity analysis on mesh size was not performed in this study. However, sensitivity analysis on the distance of boundaries from the pipe was performed. Figure 5 shows the meshing of the soil, pipe, and fluid environments in a 3D view.
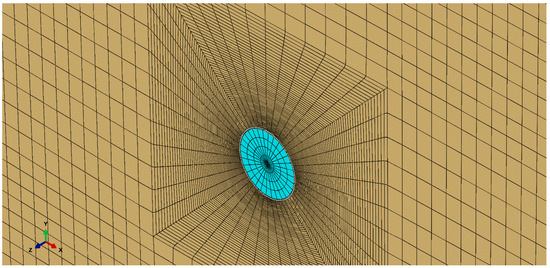
Figure 5.
Finite element model mesh—3D View.
2.4.3. Transient Flow in the Pipe
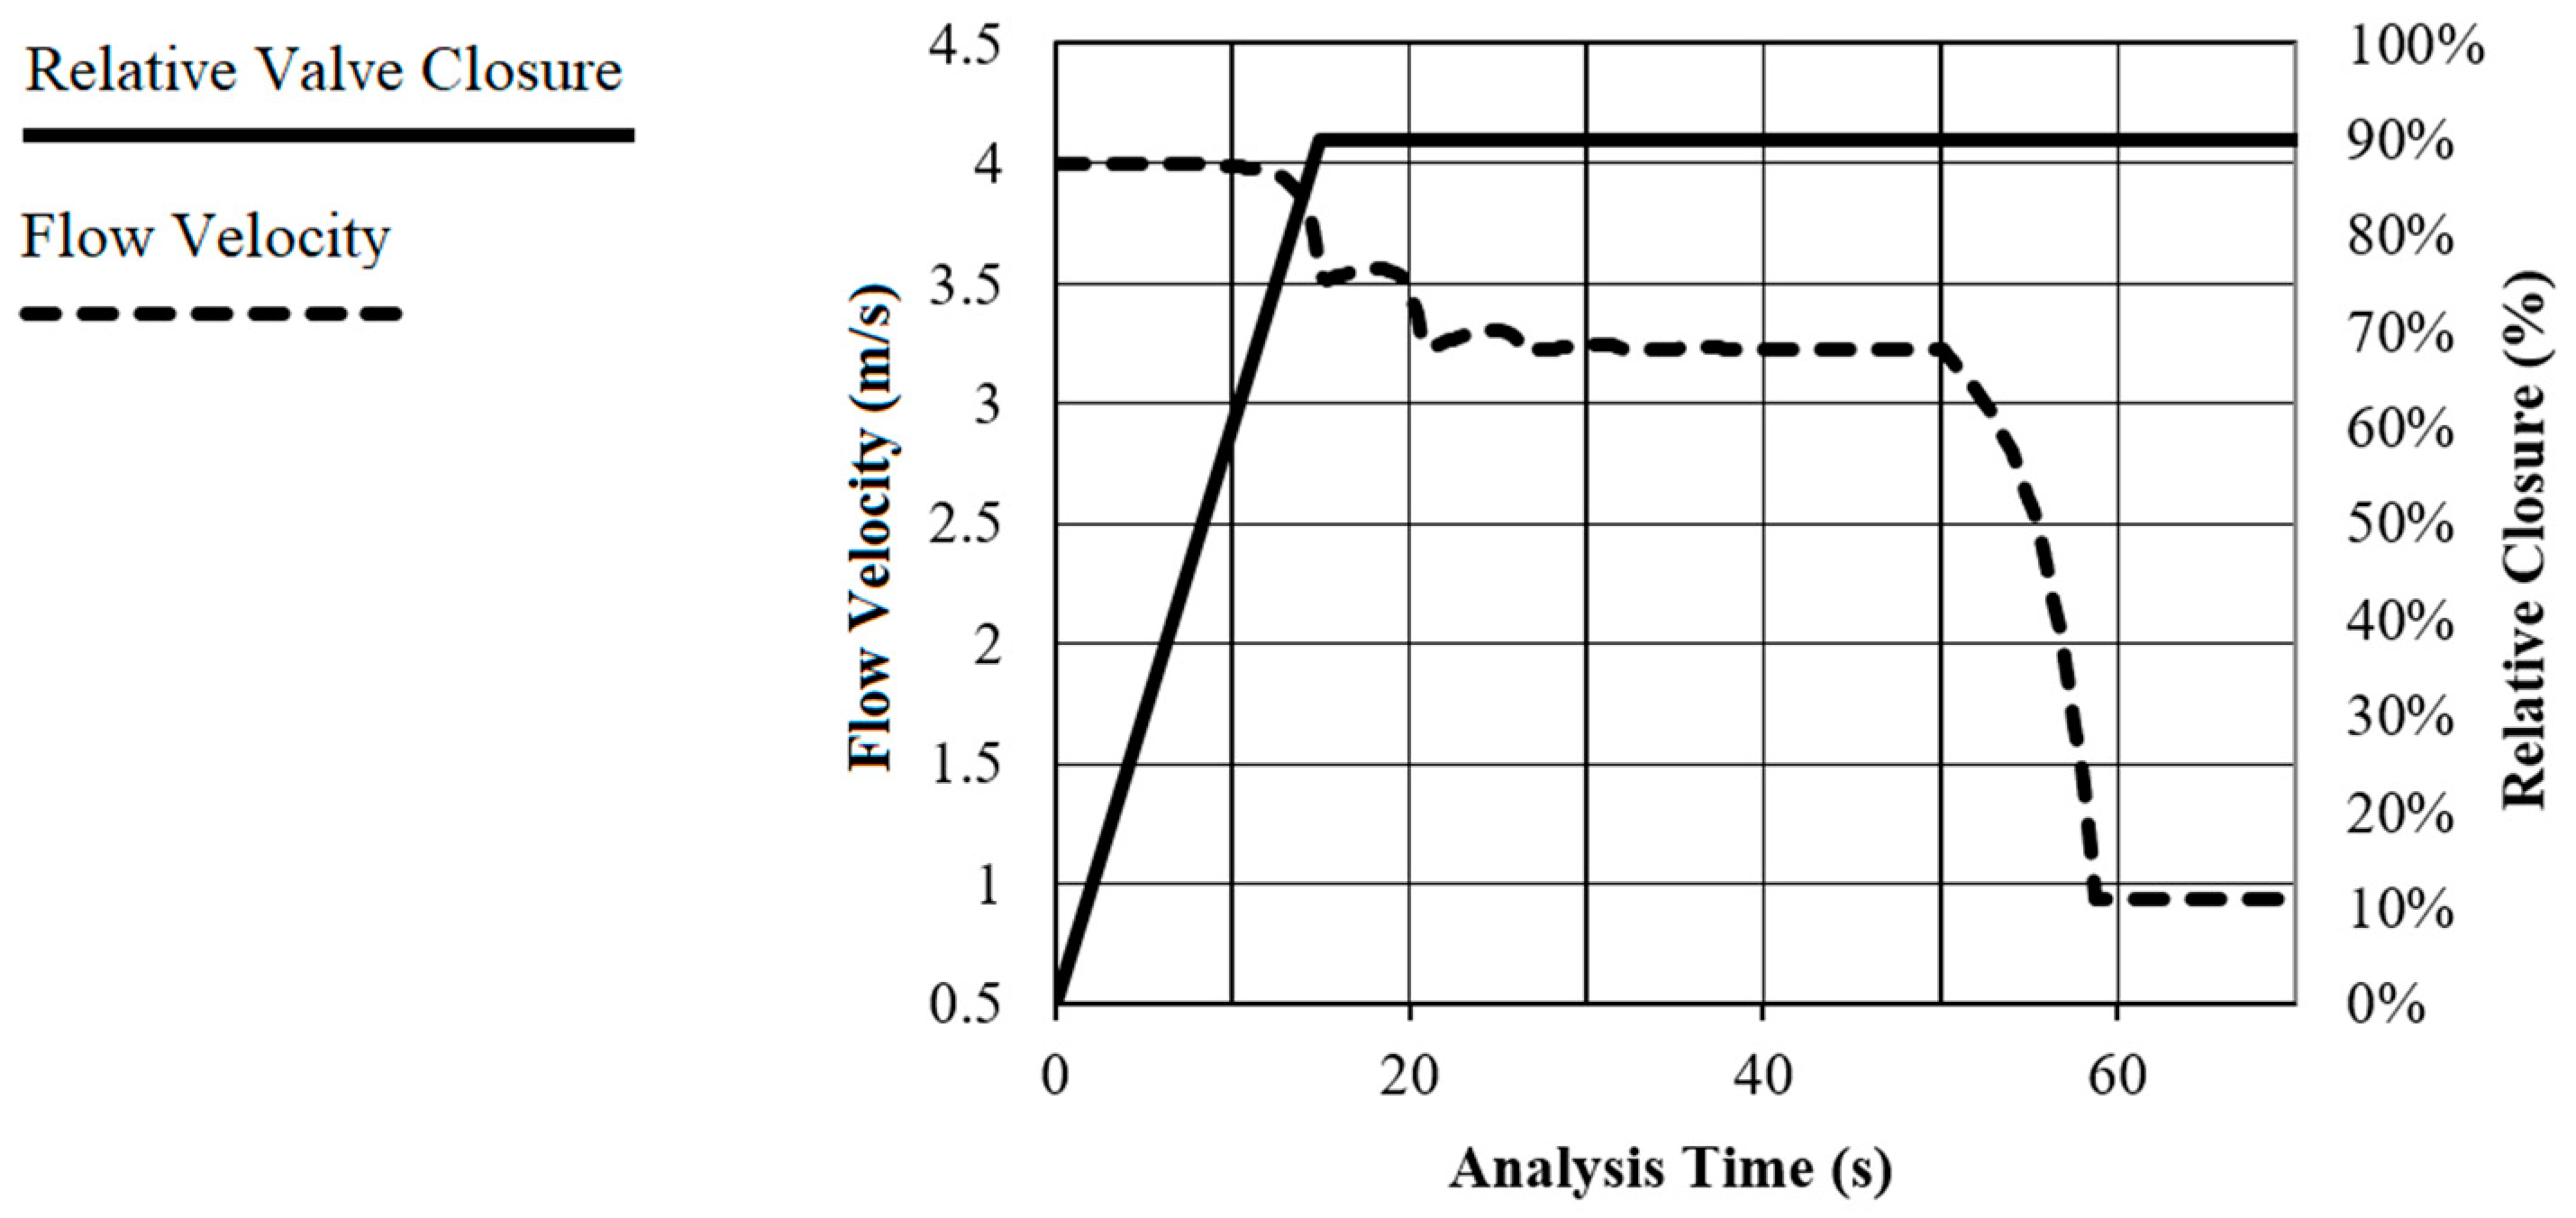
To create transient flow in the pipe, it was assumed that 90% of a valve on the path was closed. In this condition, based on hydraulic analysis using the method of characteristics (MOC) [25], flow velocity upstream of the valve will reach 1 m/s, and pressure waves will form in the pipe. Figure 6 shows the change in flow velocity as a result of the relative valve closure percentage and the closure time. The flat lines in the figure continue until the end of the simulation time.
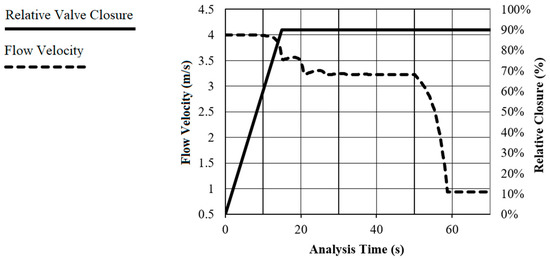
Figure 6.
Flow velocity upstream of the valve and relative valve closure.
If the time it takes to close the valve is less than wave travel time, the change in pressure head can be obtained using Equation (11) [26]. According to Figure 6, the time it takes to close 90% of the valve is about 15 s, while the wave travel time is about 59 s. Therefore, Equation (11) is applicable.
In Equation (11), ΔH (m) is the change in pressure head, a (m/s) is the pressure wave velocity, g is the acceleration of gravity, and ΔV (m/s) is the change in water velocity in the pipe. In Equation (12), ρw (kg/m3) is the specific mass of water, kw (GPa) is the bulk modulus of water, d (m) is the pipe diameter, E (GPa) is the modulus of elasticity of concrete, and e (m) is the thickness of the pipe [27]. The calculated values for a and maximum pressure under the transient flow conditions are presented in Table 2.

Table 2.
Transient flow characteristics
The calculated maximum transient pressure was applied to fluid elements in the model as impact load. The transient pressure from fluid elements transfers to pipe elements, leading to pipe displacements and stresses in the pipe wall.
3. Results
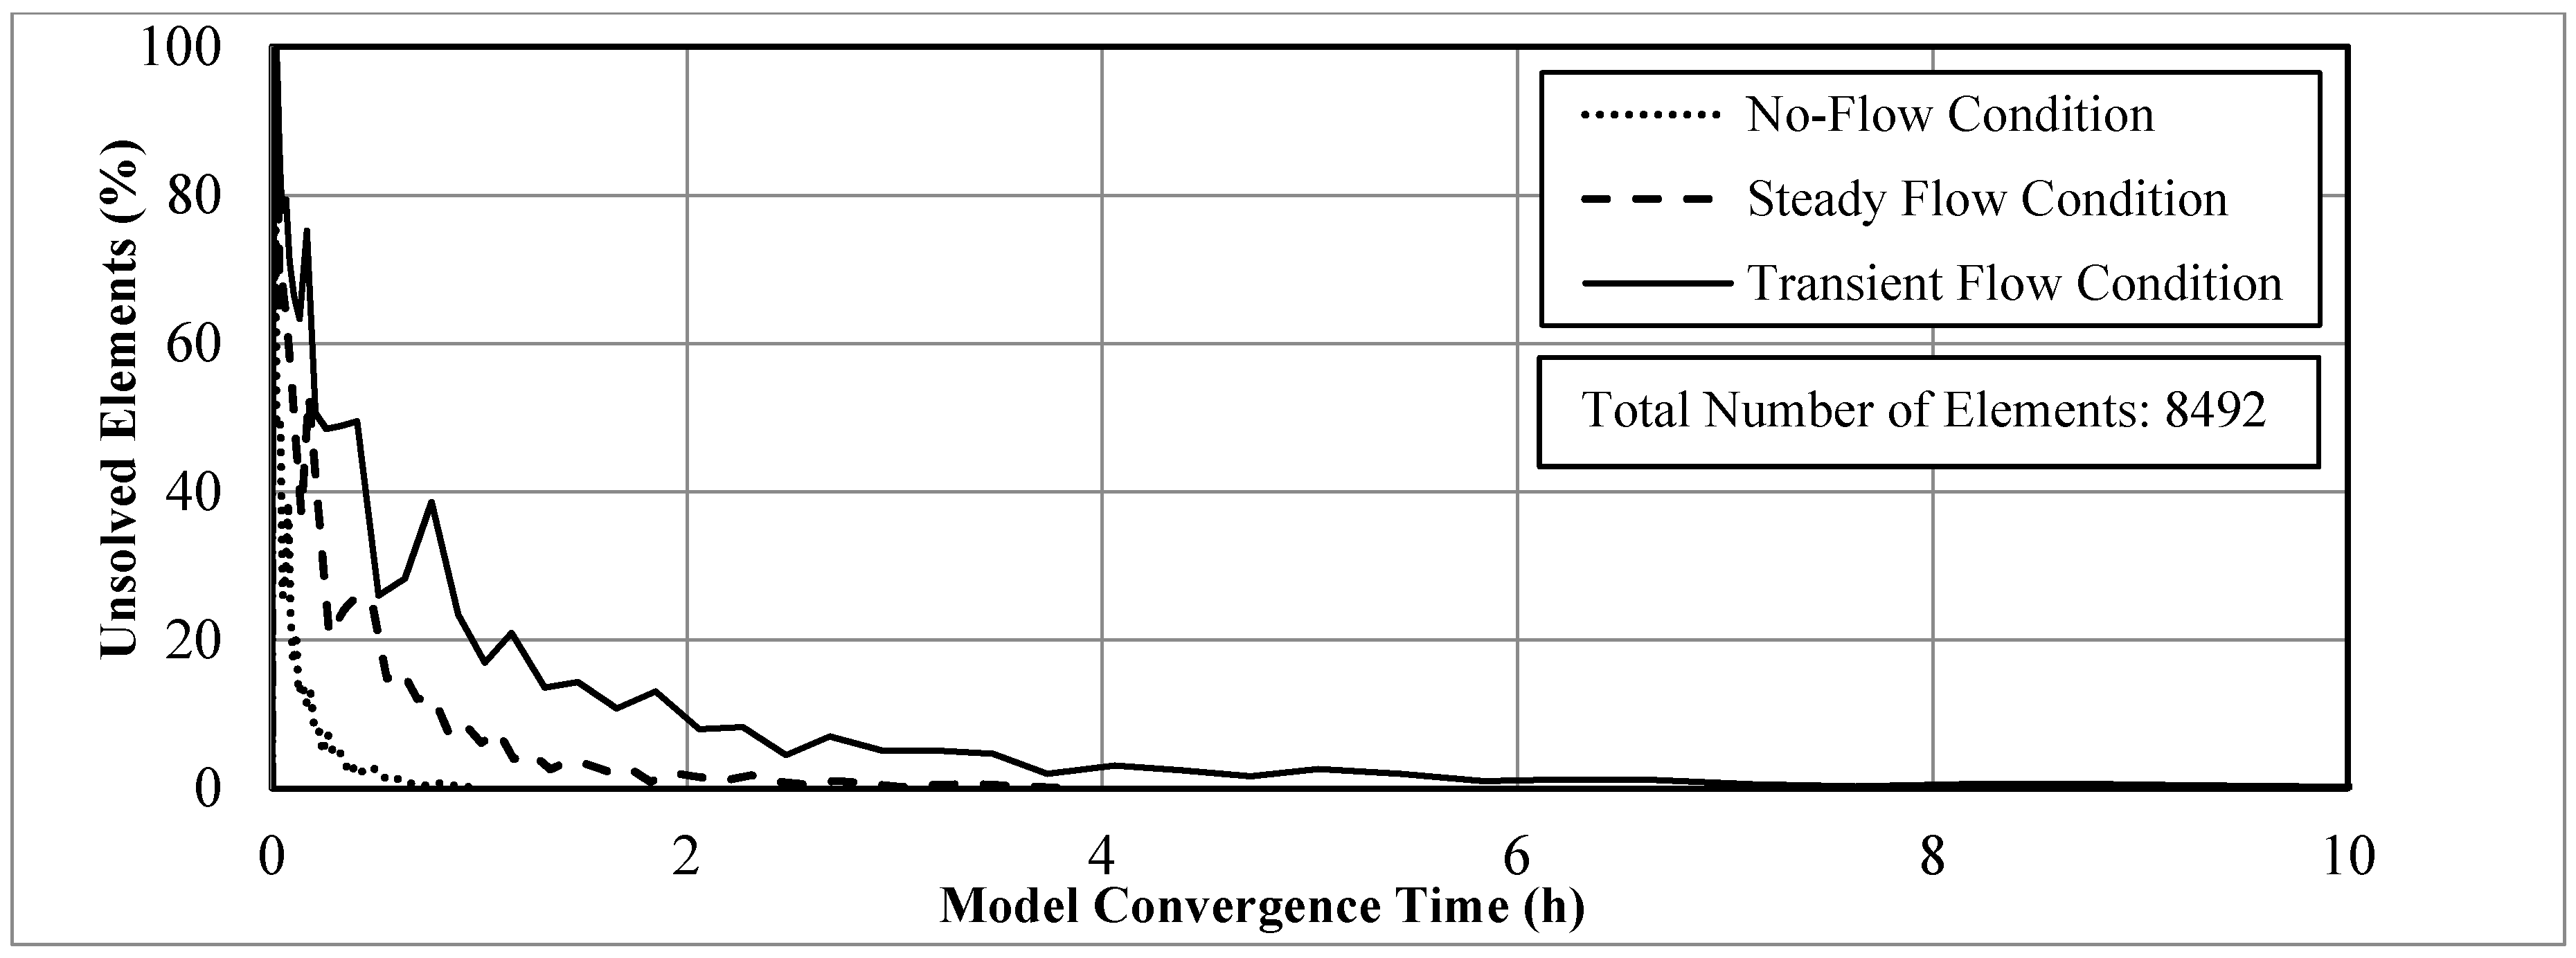
In the following sections, displacements in the soil environment and stresses in the pipe wall are presented. Displacements under all scenarios are measured relative to their position right after drilling and pipe installation (before reaching a new equilibrium). The location where displacements and stresses are analyzed is near the valve, and the displacements in each stage are cumulative. Moreover, Figure 7 shows the convergence of the model for all scenarios. According to Figure 7, as the simulation proceeds, more elements are solved. In this study, the simulations were run on a computer with 4 GB of RAM, and an Intel Core 2 Due CPU @ 2.53 GHz.
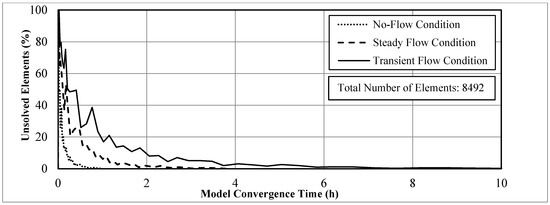
Figure 7.
Convergence of the model for all scenarios.
3.1. No-Flow Condition
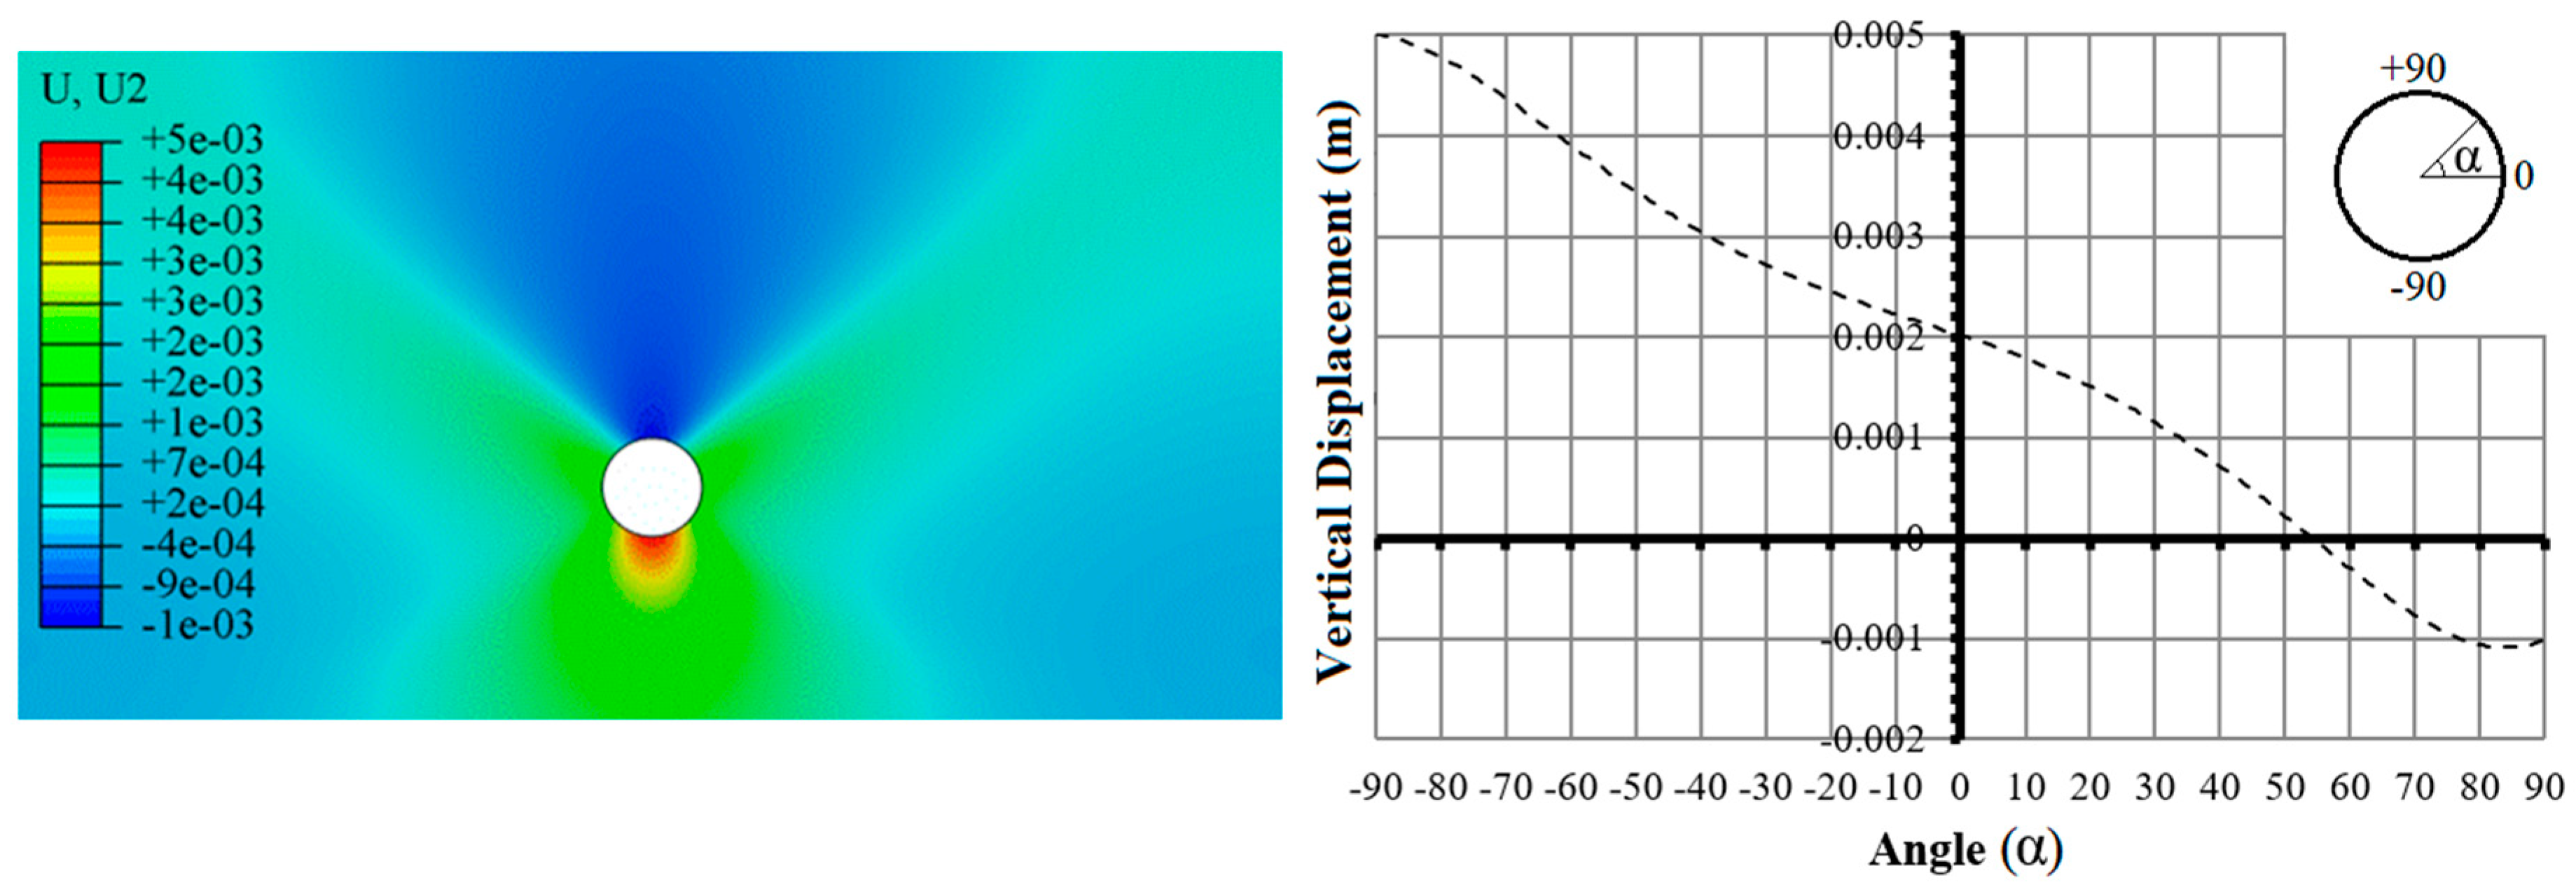
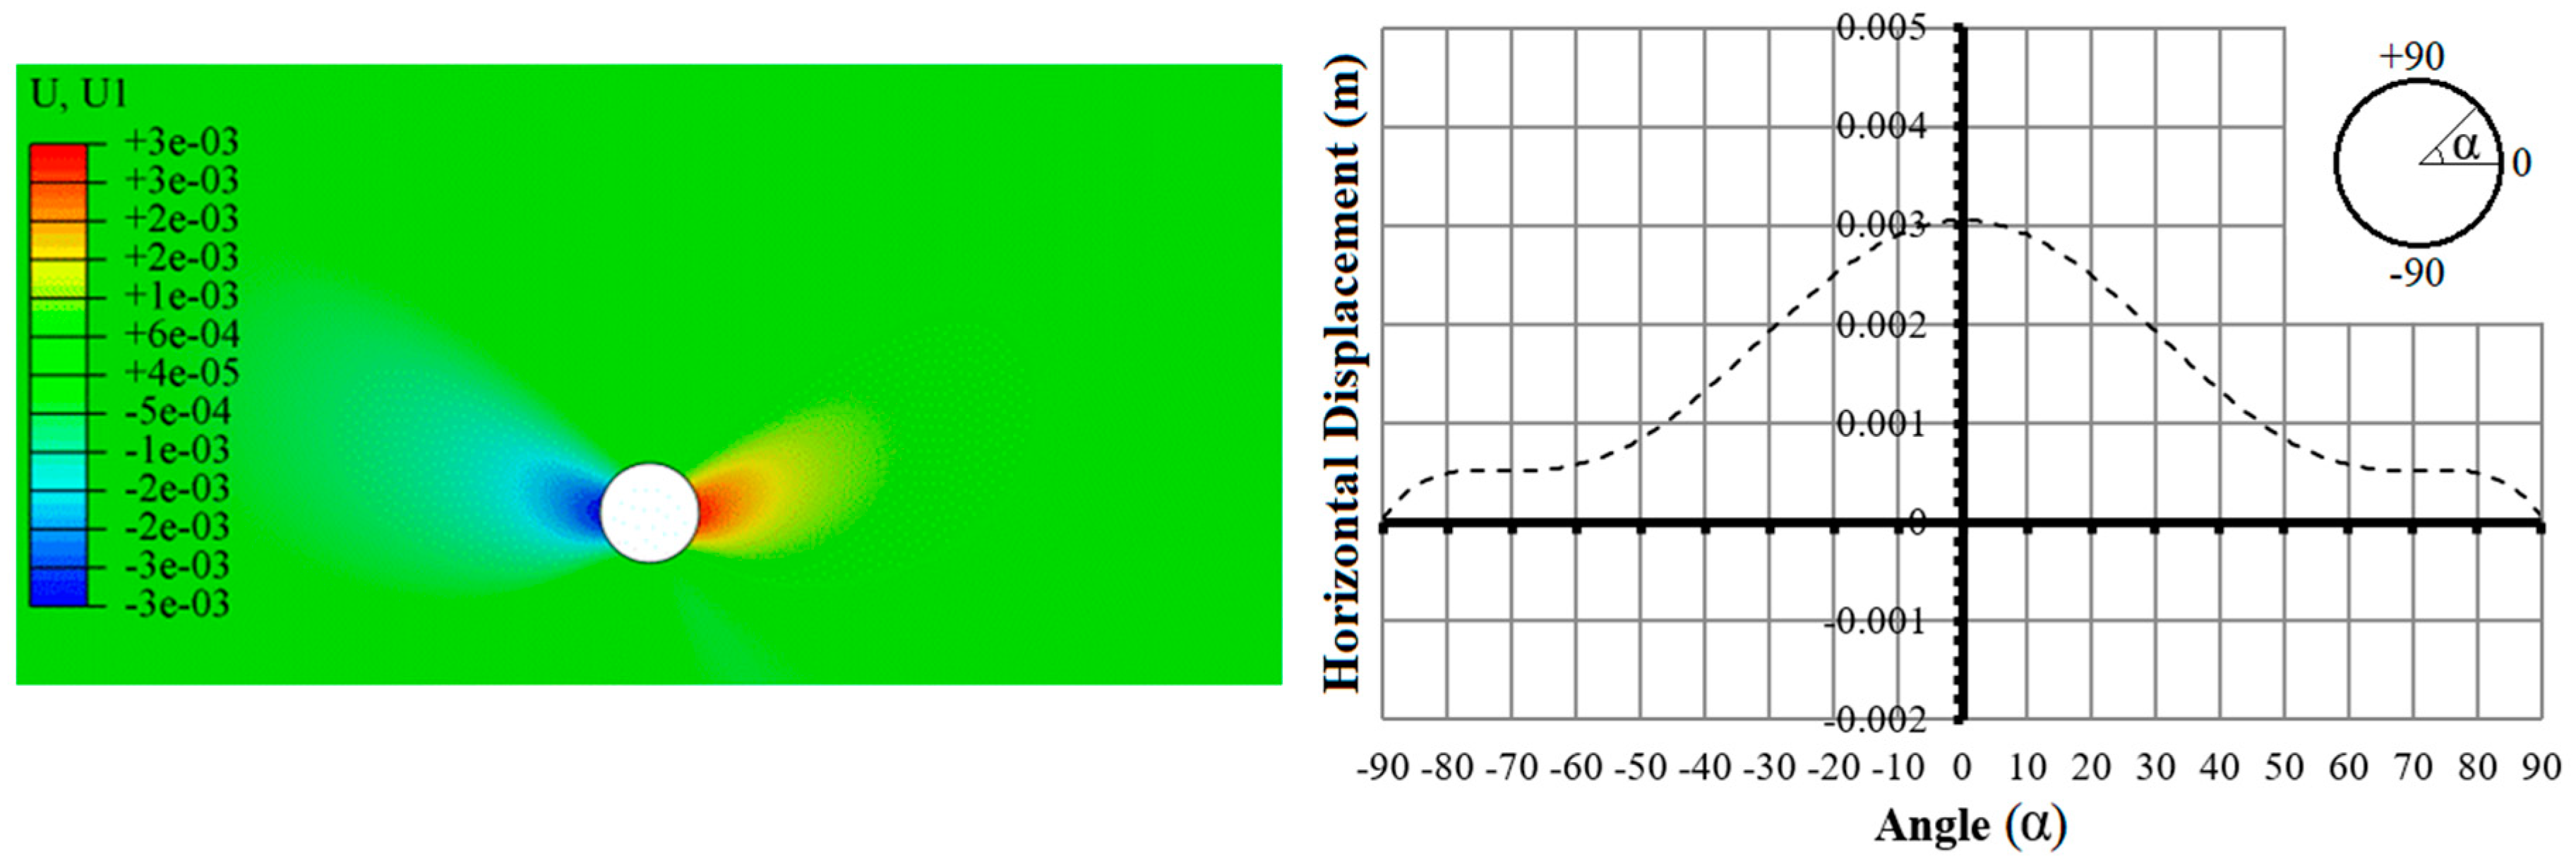
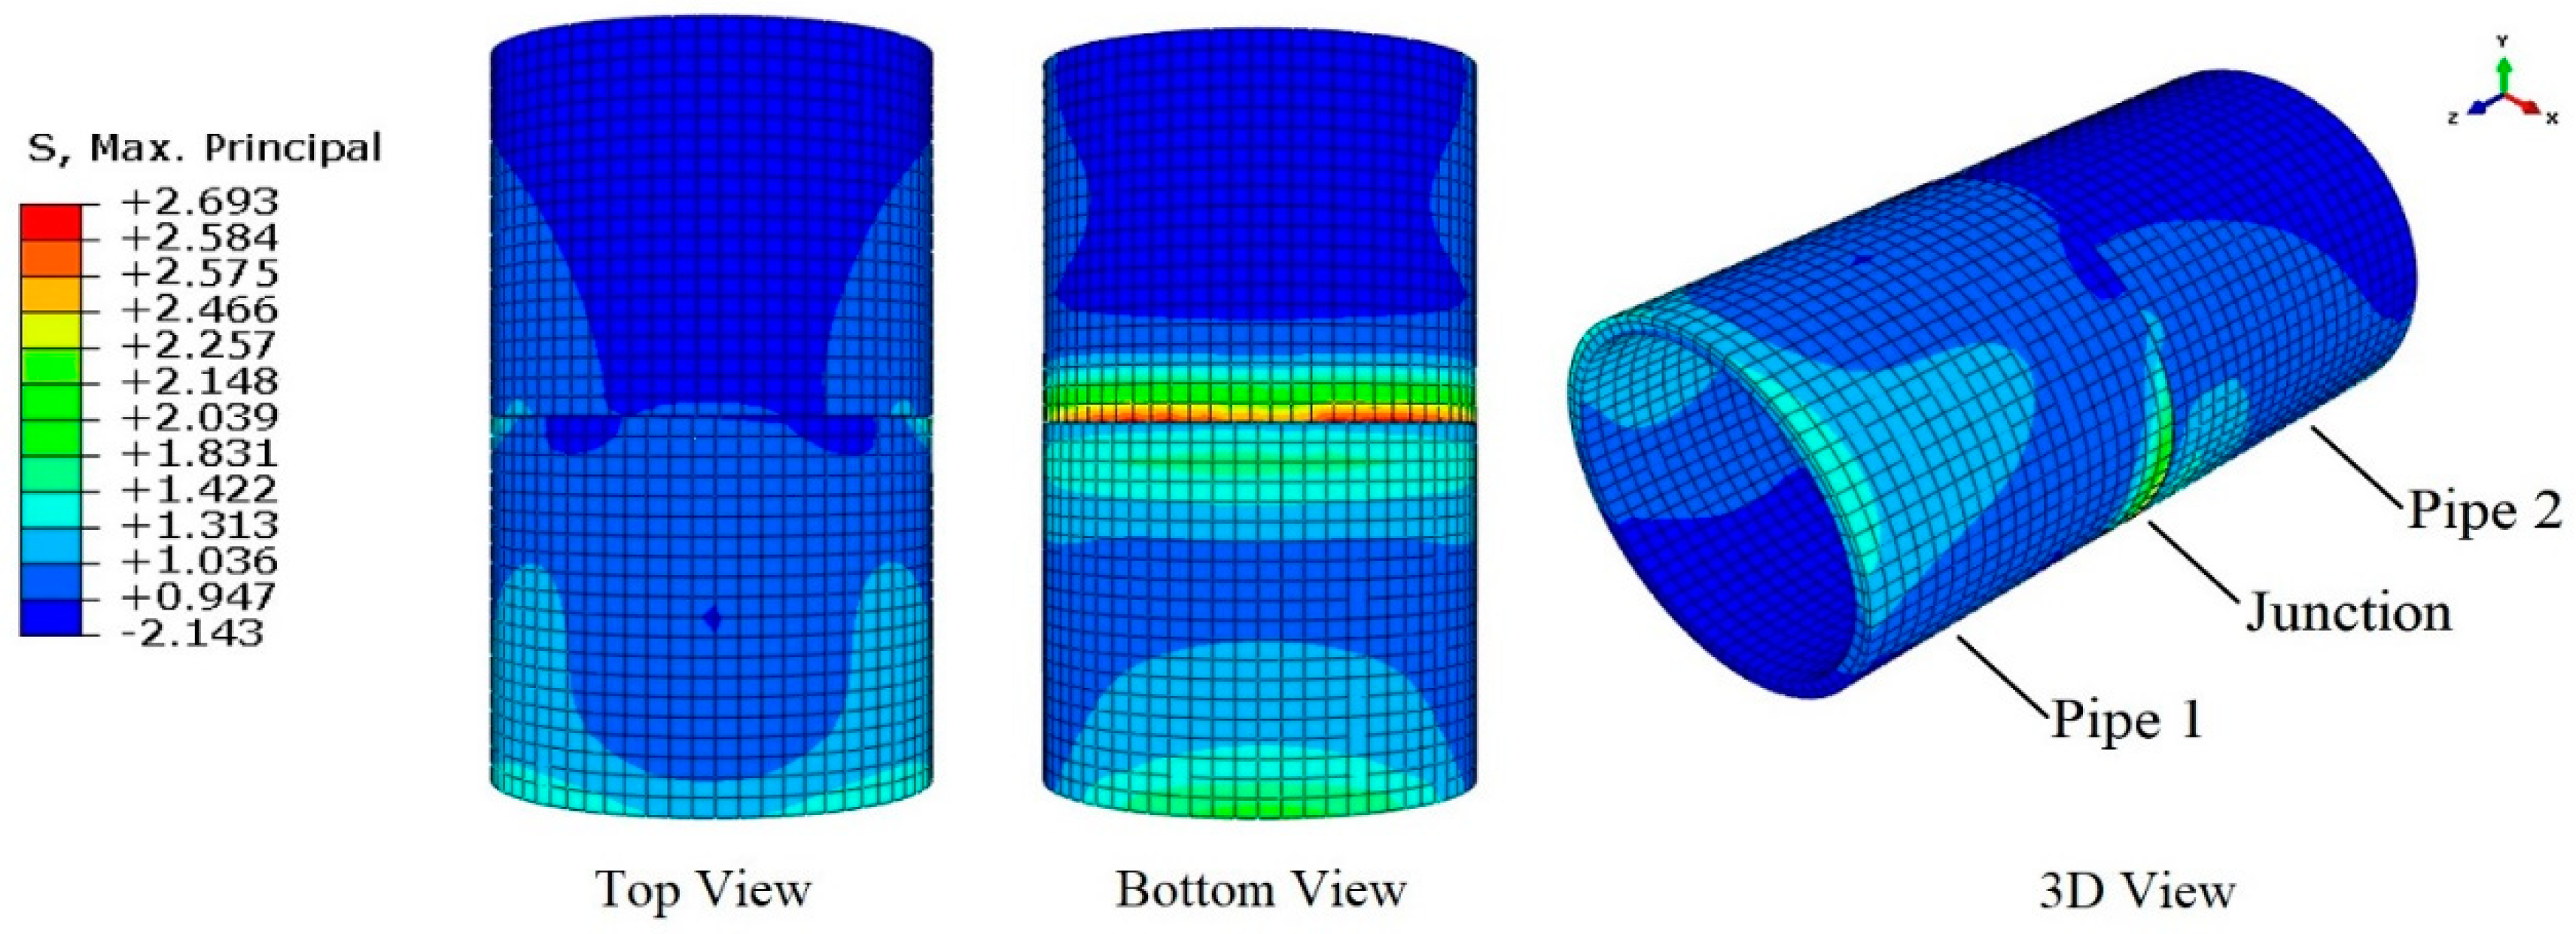
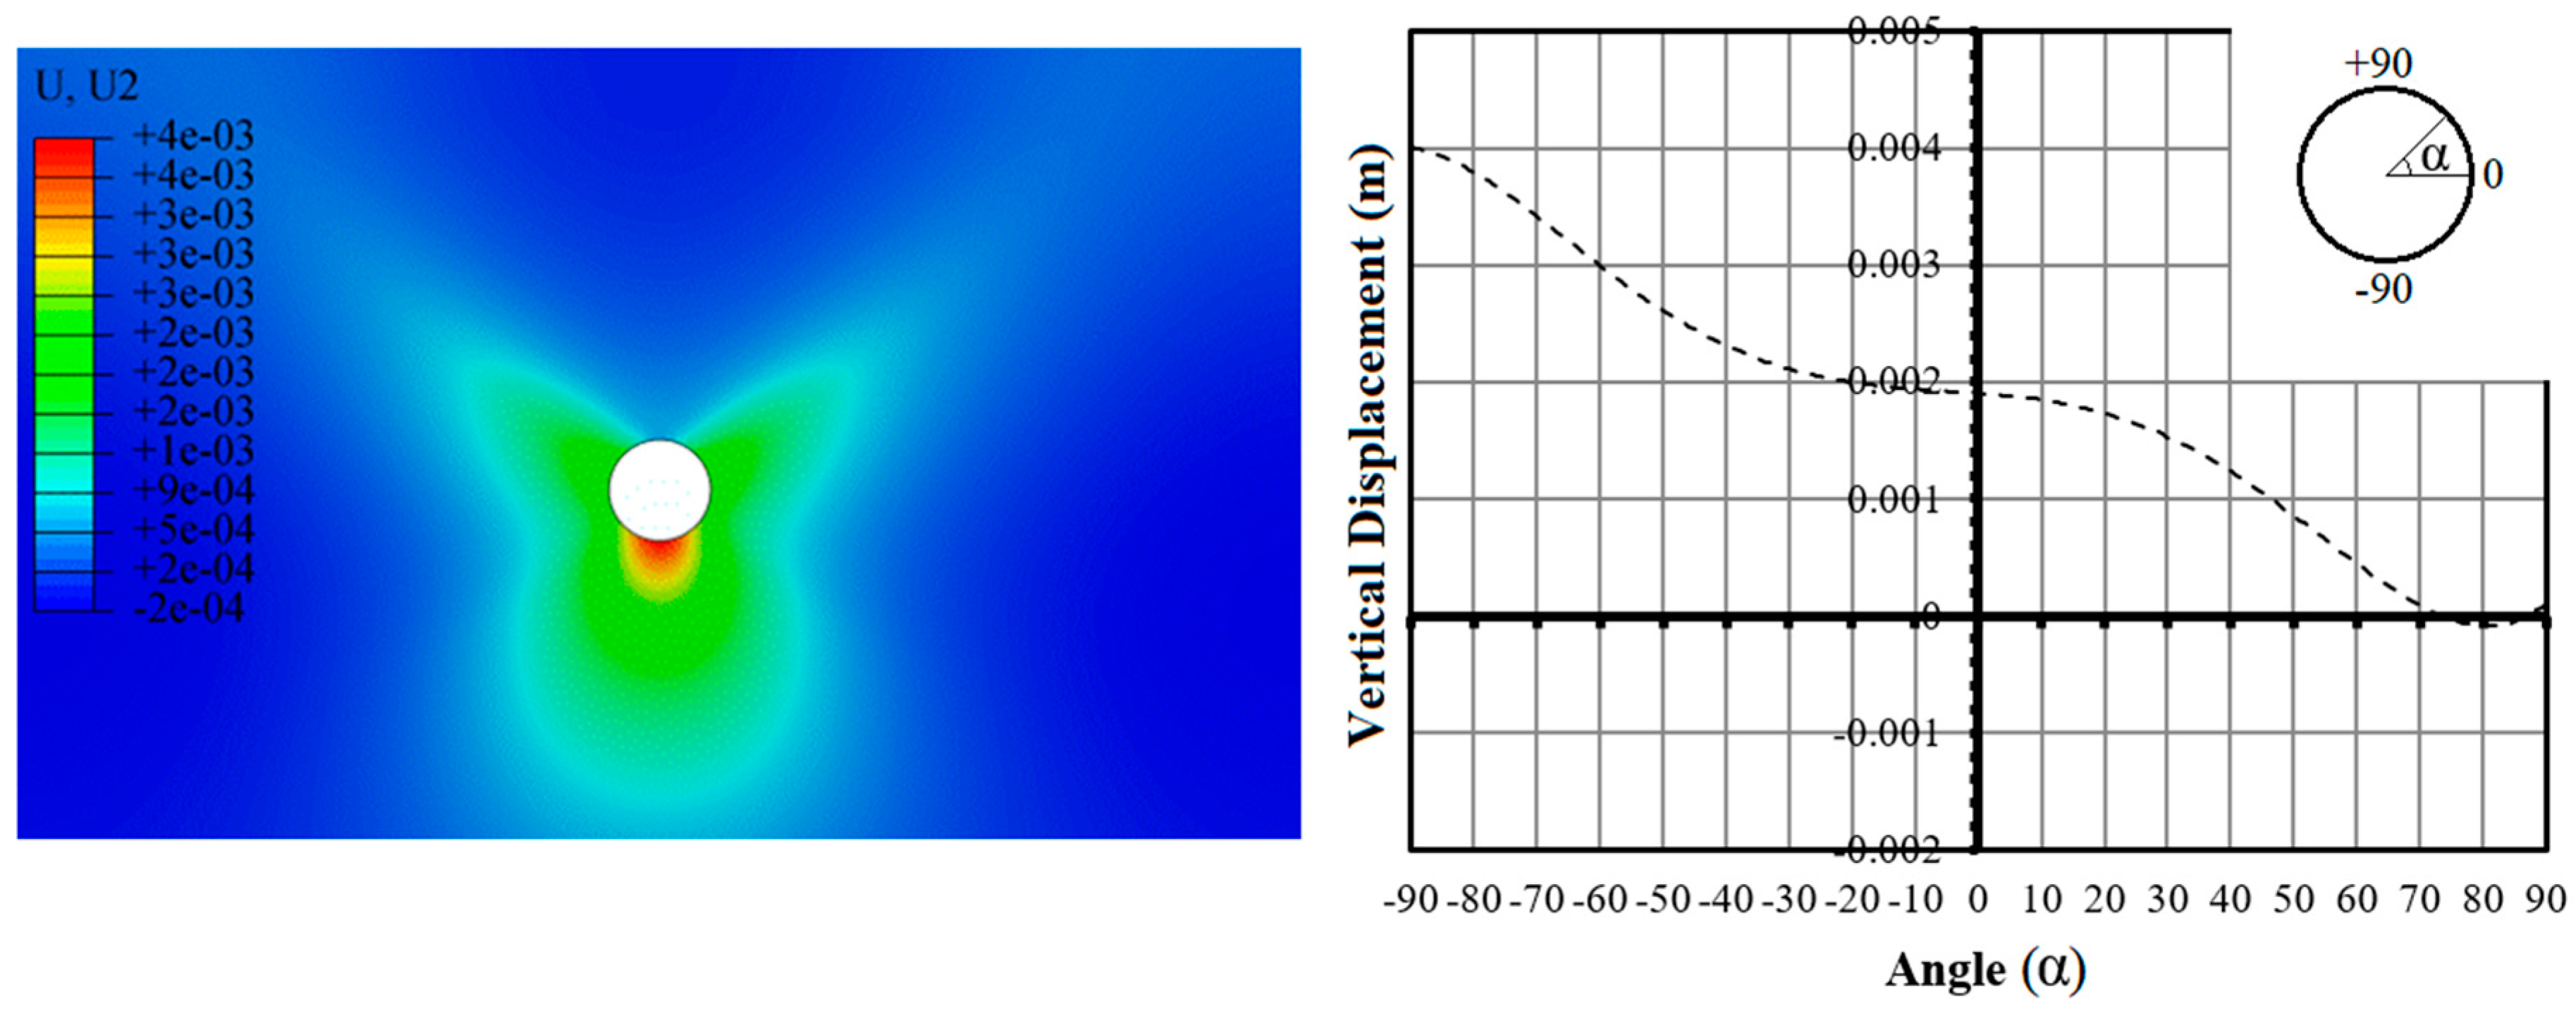
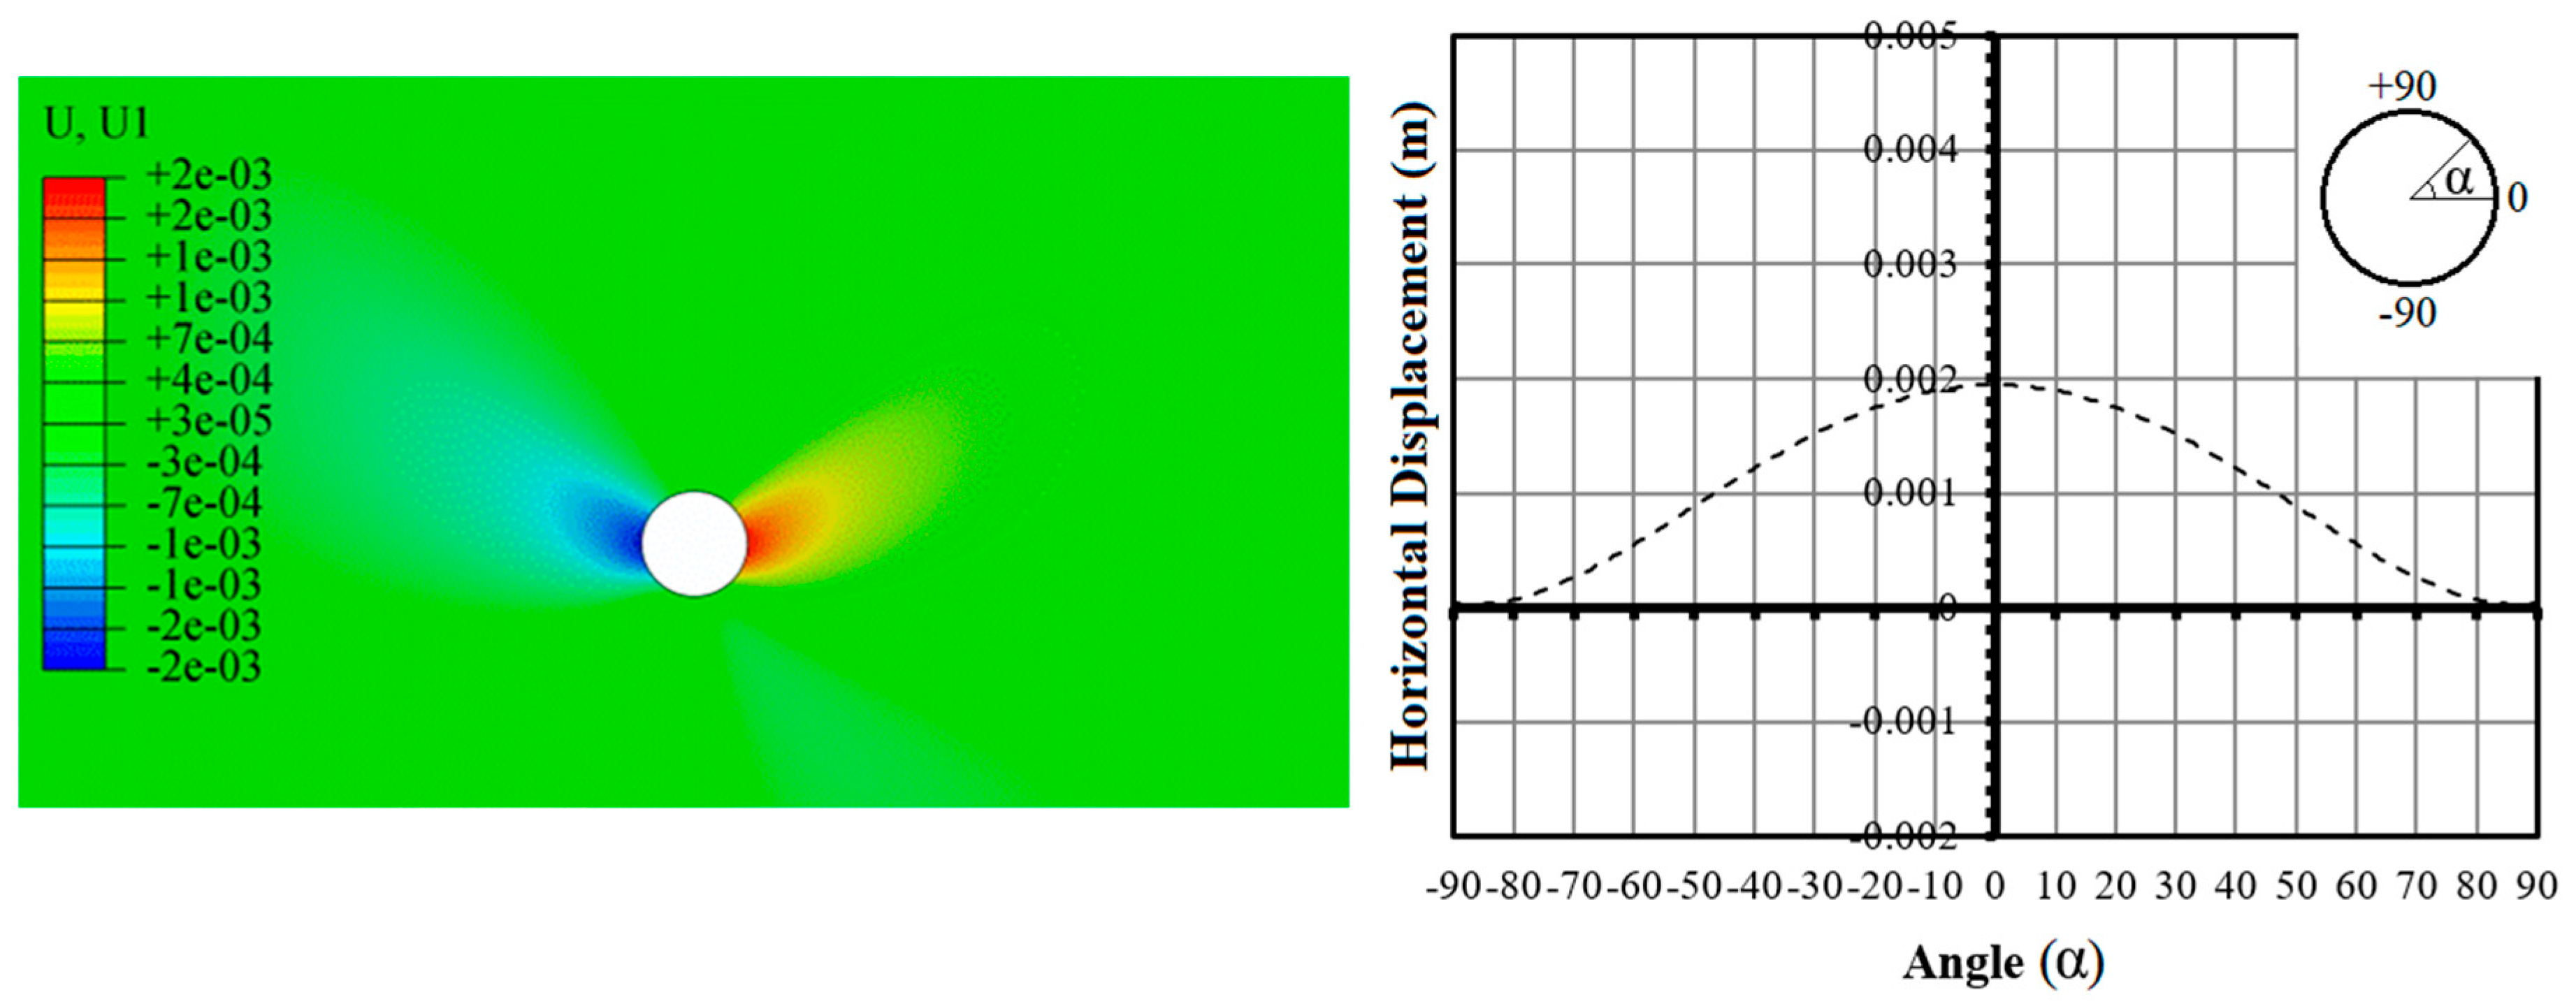
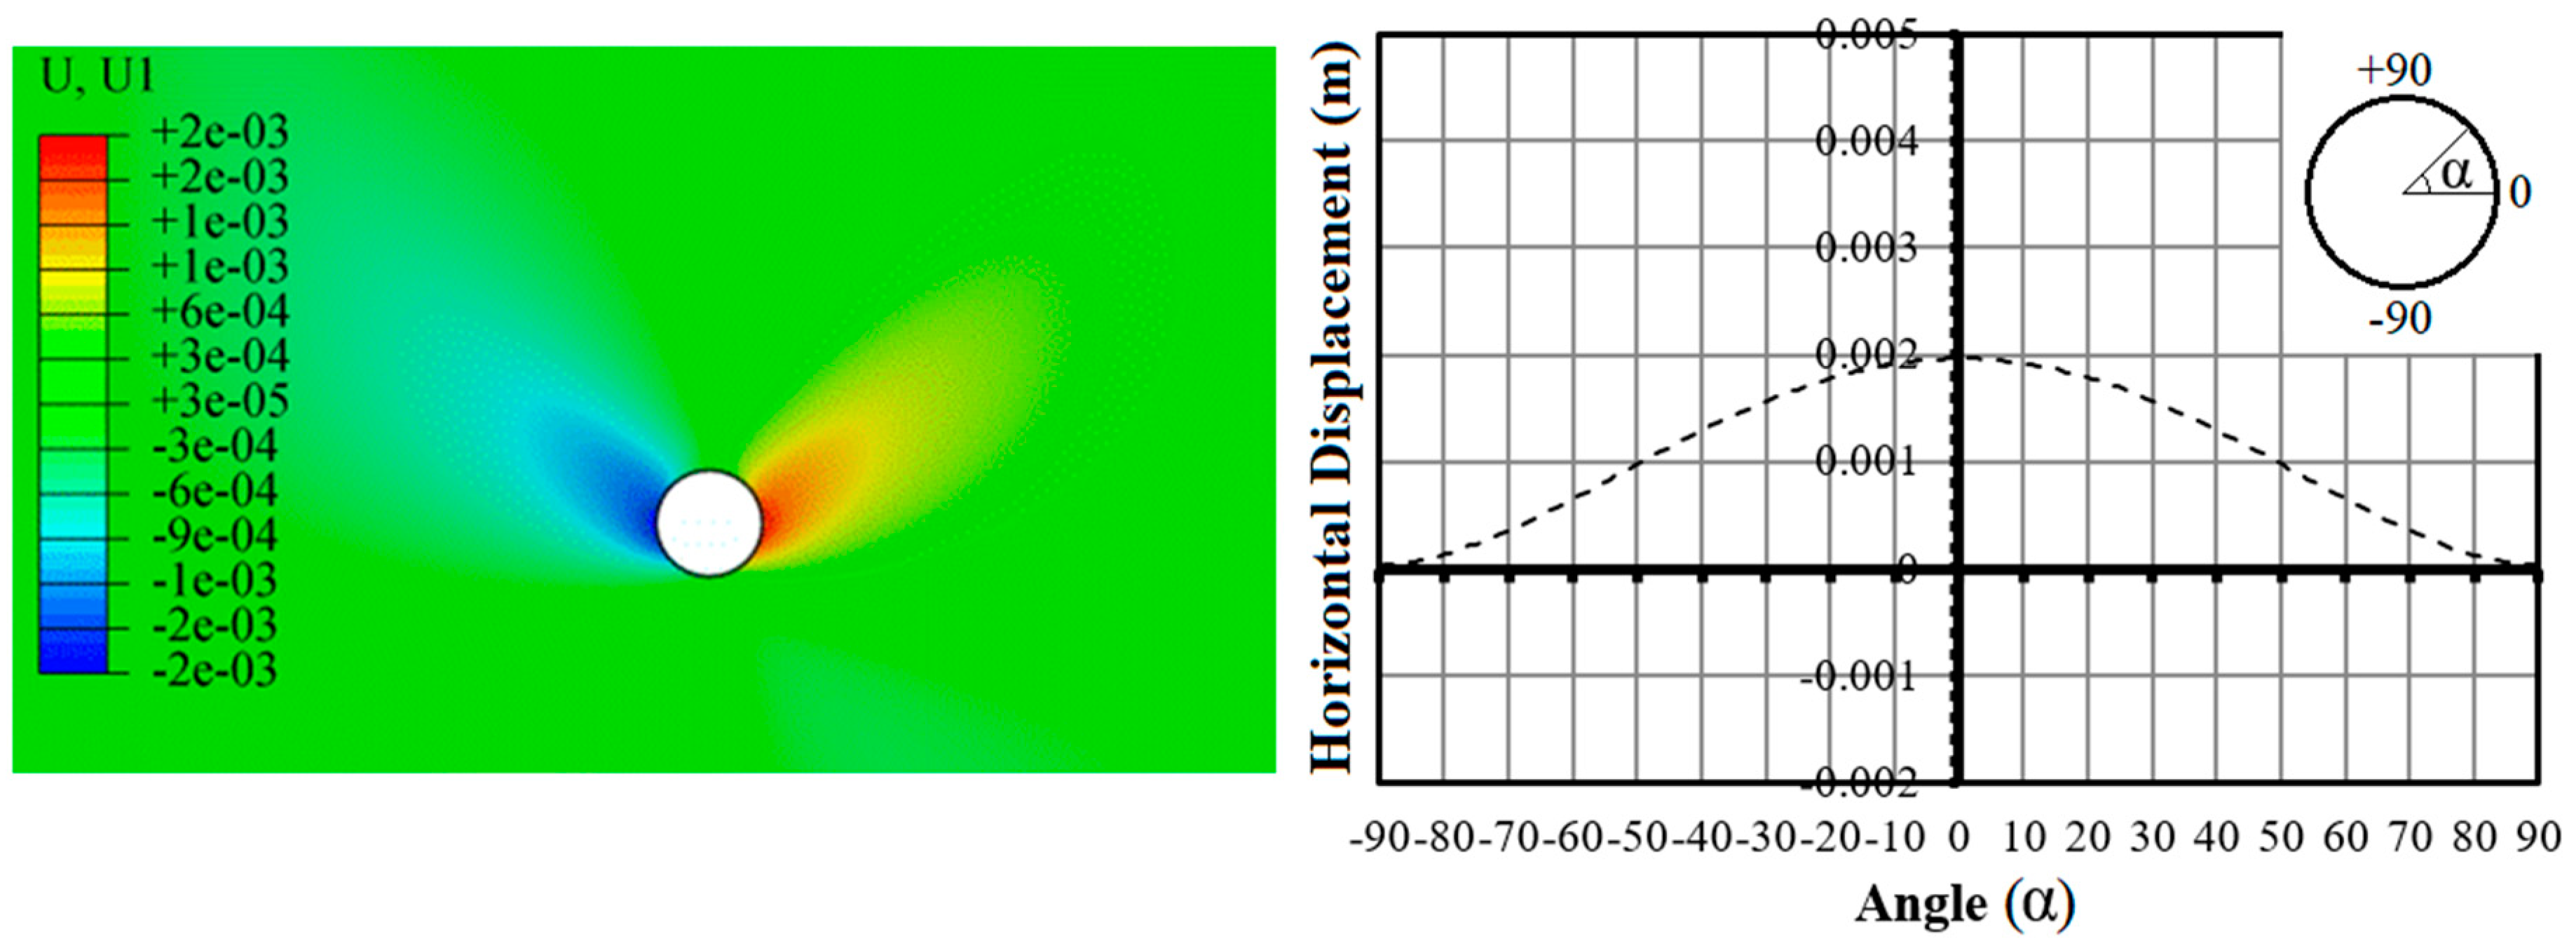
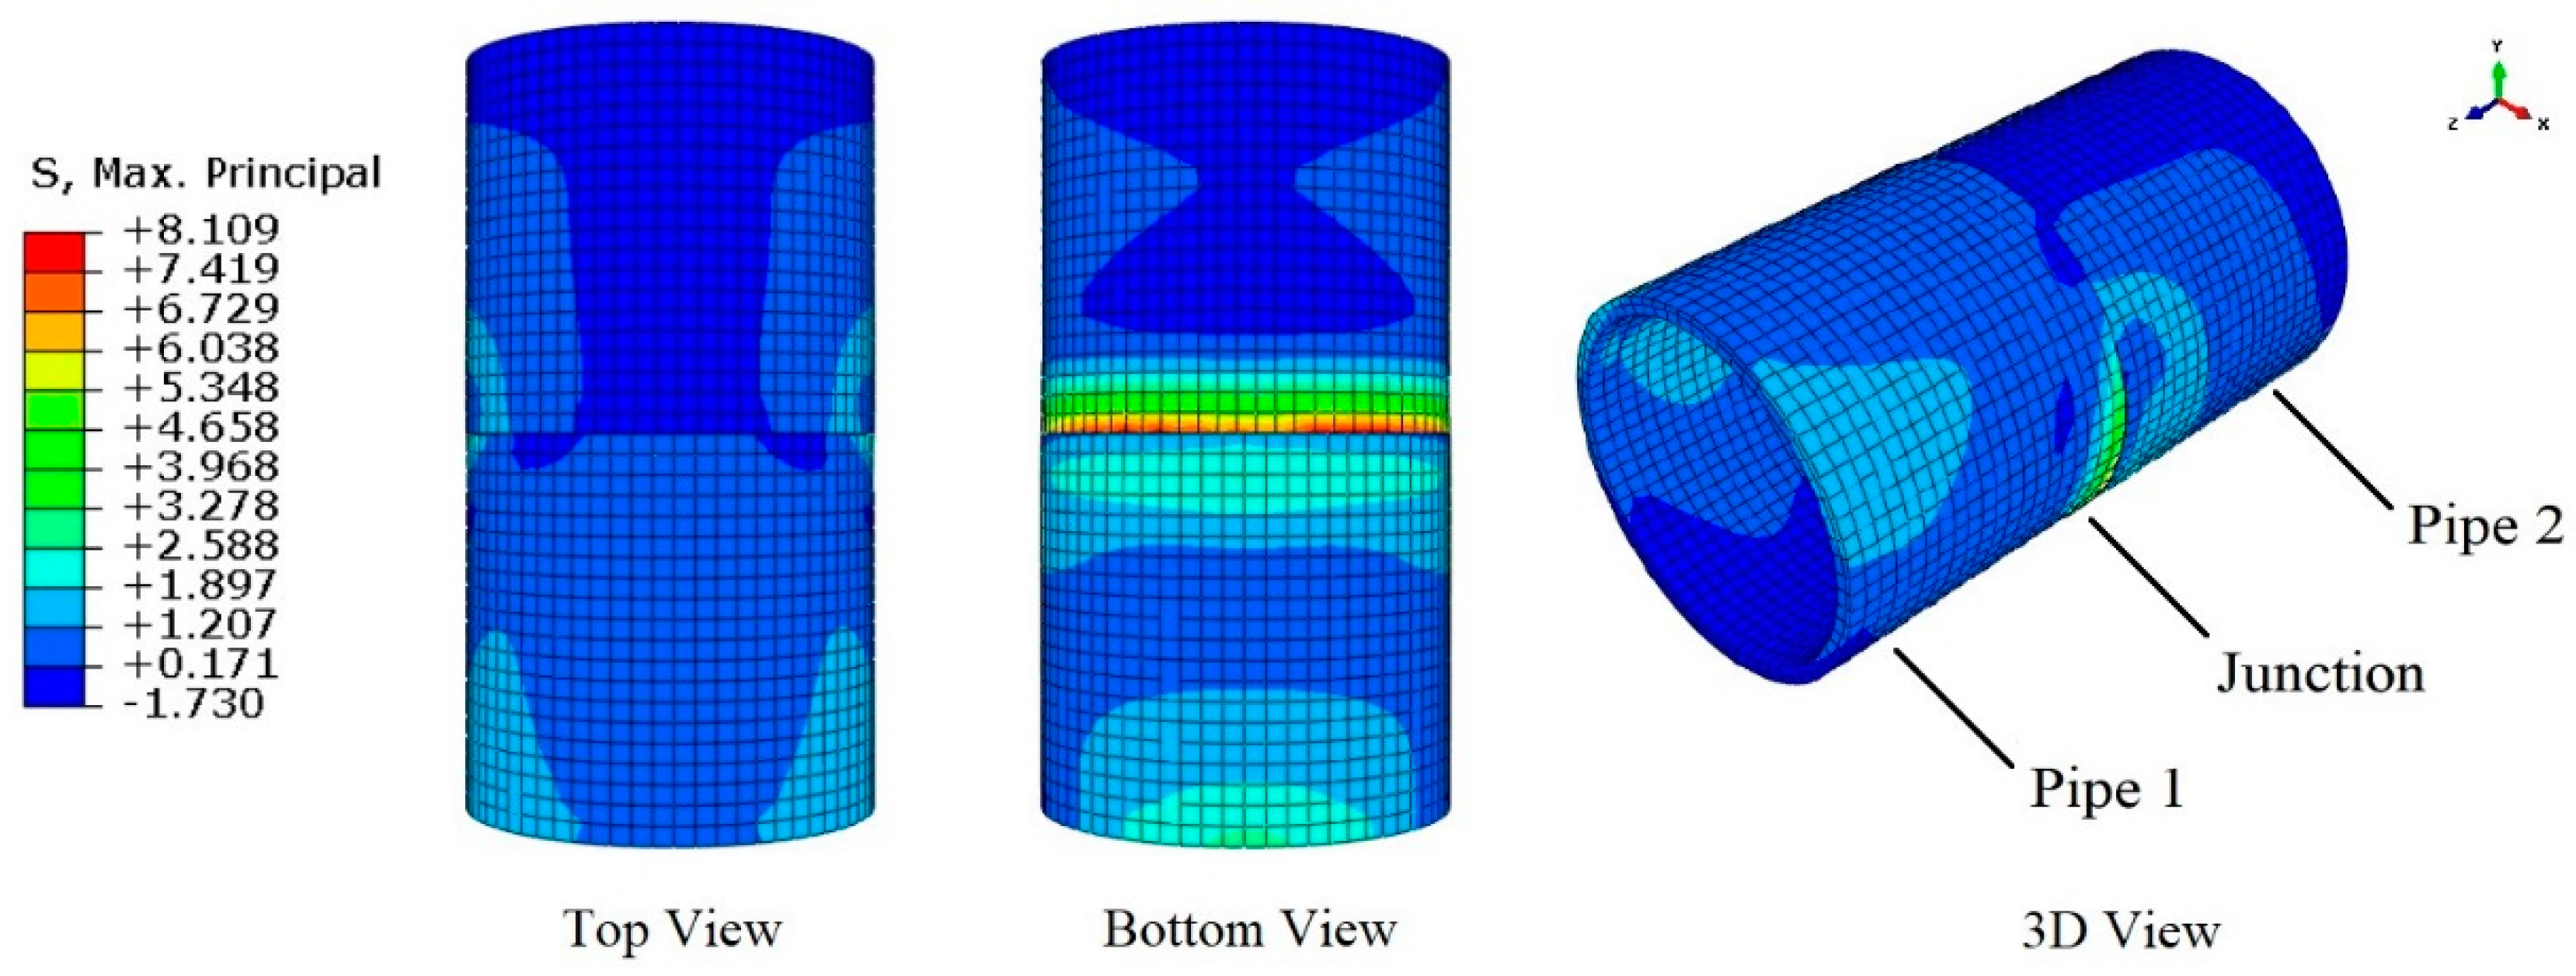
Figure 8 and Figure 9 show vertical (U2) and horizontal (U1) displacements in the soil environment, respectively, and Figure 10 shows stresses in the pipe wall under no-flow conditions. In Figure 10, as well as in other figures showing stress distribution contours in the following sections, the blue color shows areas in compression, while red shows areas in tension.
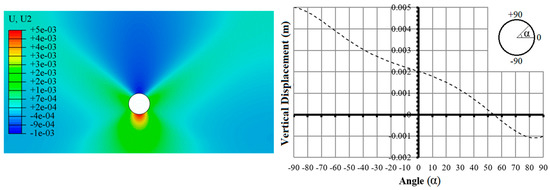
Figure 8.
Displacements in the vertical direction under no-flow conditions.
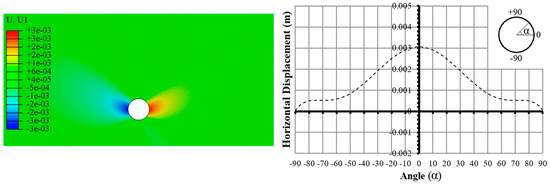
Figure 9.
Displacements in the horizontal direction under no-flow conditions.
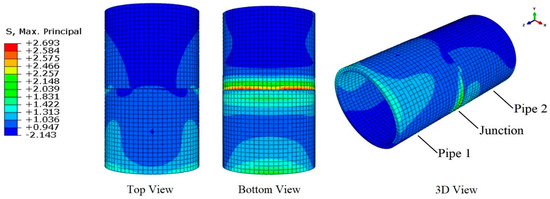
Figure 10.
Stresses in the pipe wall under no-flow conditions (MPa).
After drilling and pipe installation, distribution of stresses in the soil will change, and eventually, due to the stress release phenomenon, the soil mass will reach a new equilibrium. Figure 8 shows that soil at the bottom of the section has become swollen. The amount of this uplift at the bottom (5 mm) is greater than the amount of displacement in the crown (1 mm). According to Figure 9, horizontal displacements on the top and bottom sides are quite symmetrical and uniform, with a maximum of 3 mm on the sides. Therefore, under the no-flow conditions and due to unloading and inflation of the soil, among all displacements, the greatest occurs at the bottom.
Stress distribution contours mostly show compression (blue) at the top and tension (red) at the bottom of the pipe (Figure 10). Under this condition, the highest tensions occurred at the bottom of the pipe with a maximum value of 2.69 MPa (390.15 psi) at the junction.
3.2. Steady Flow Condition
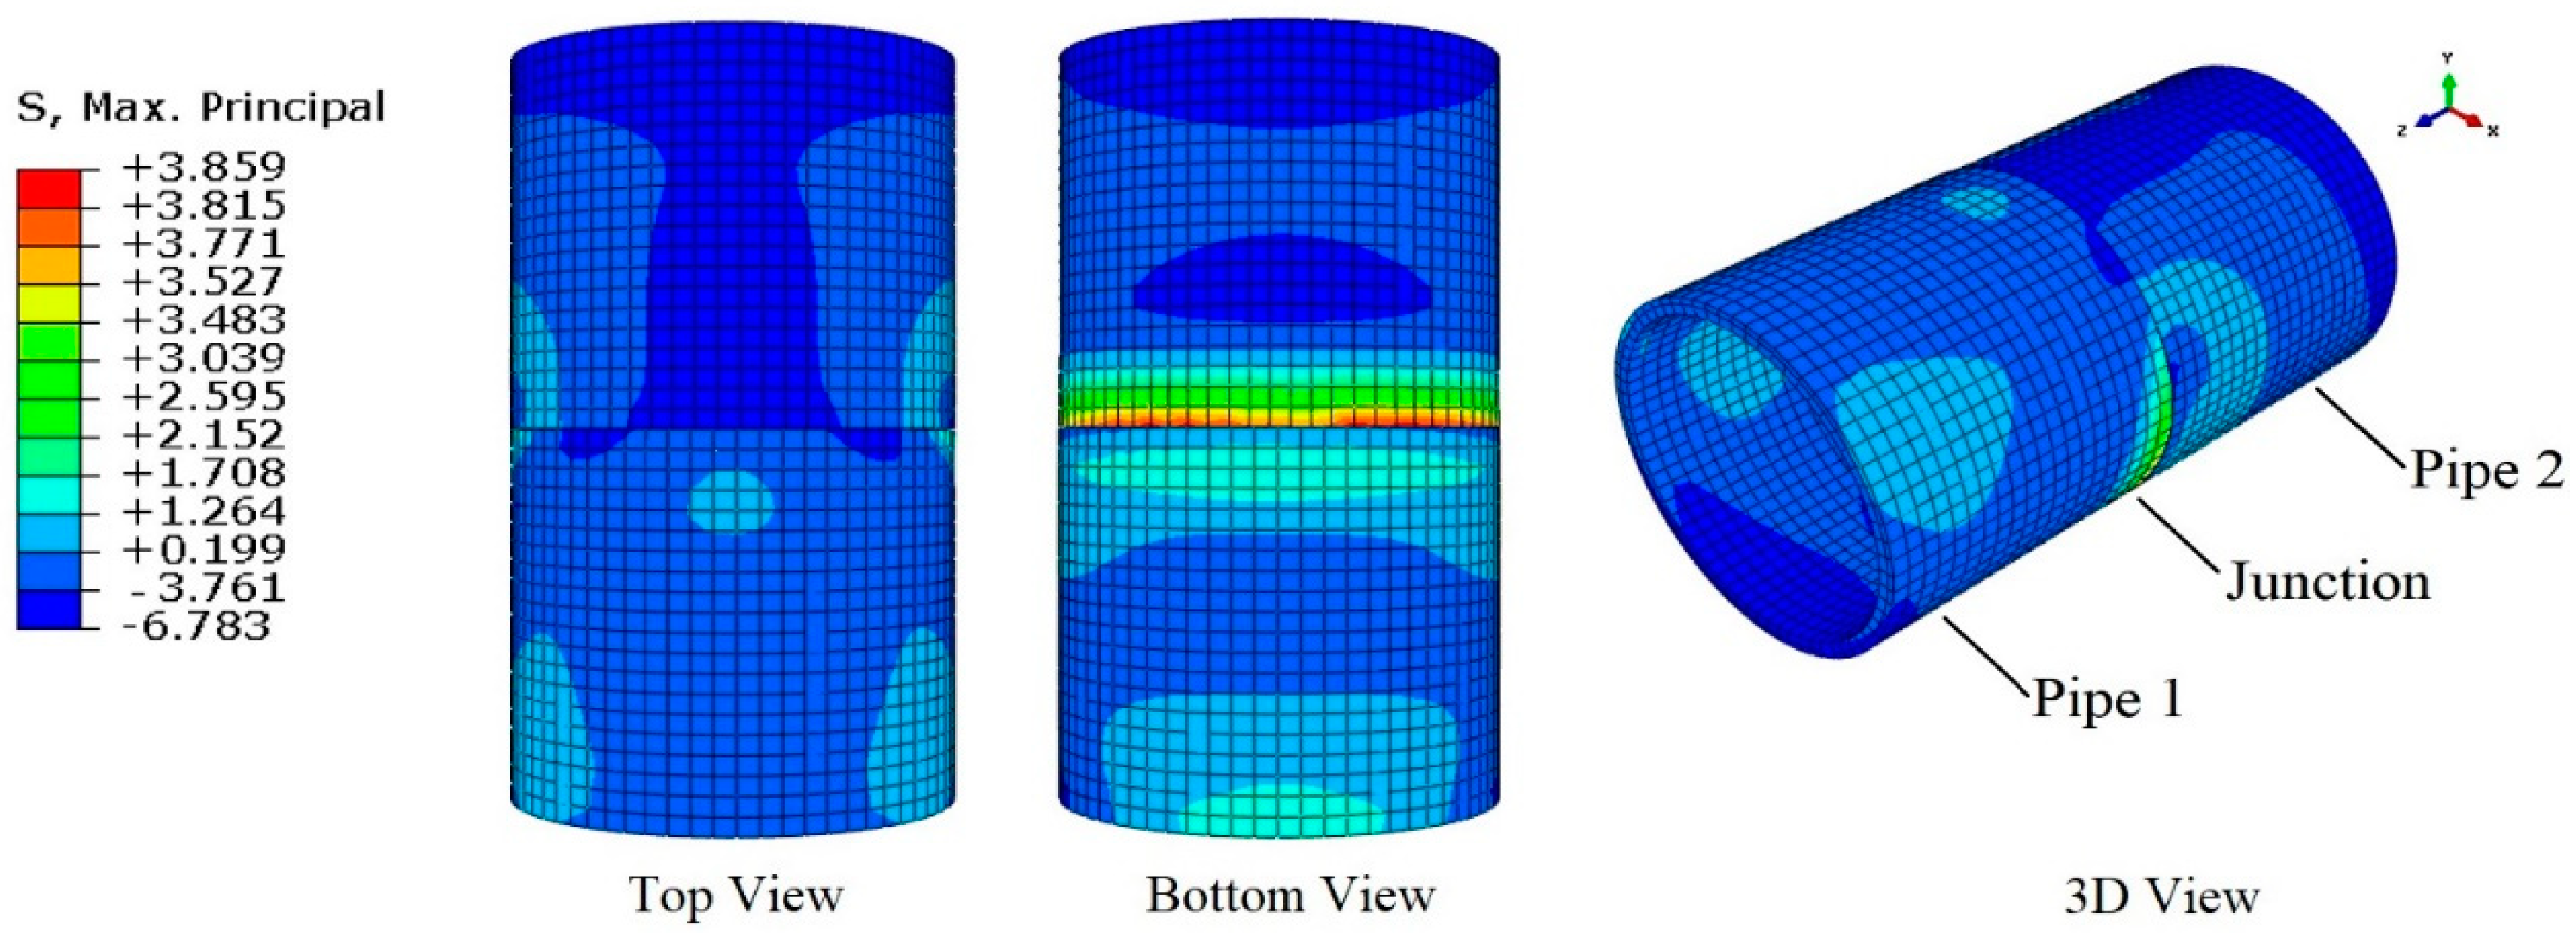
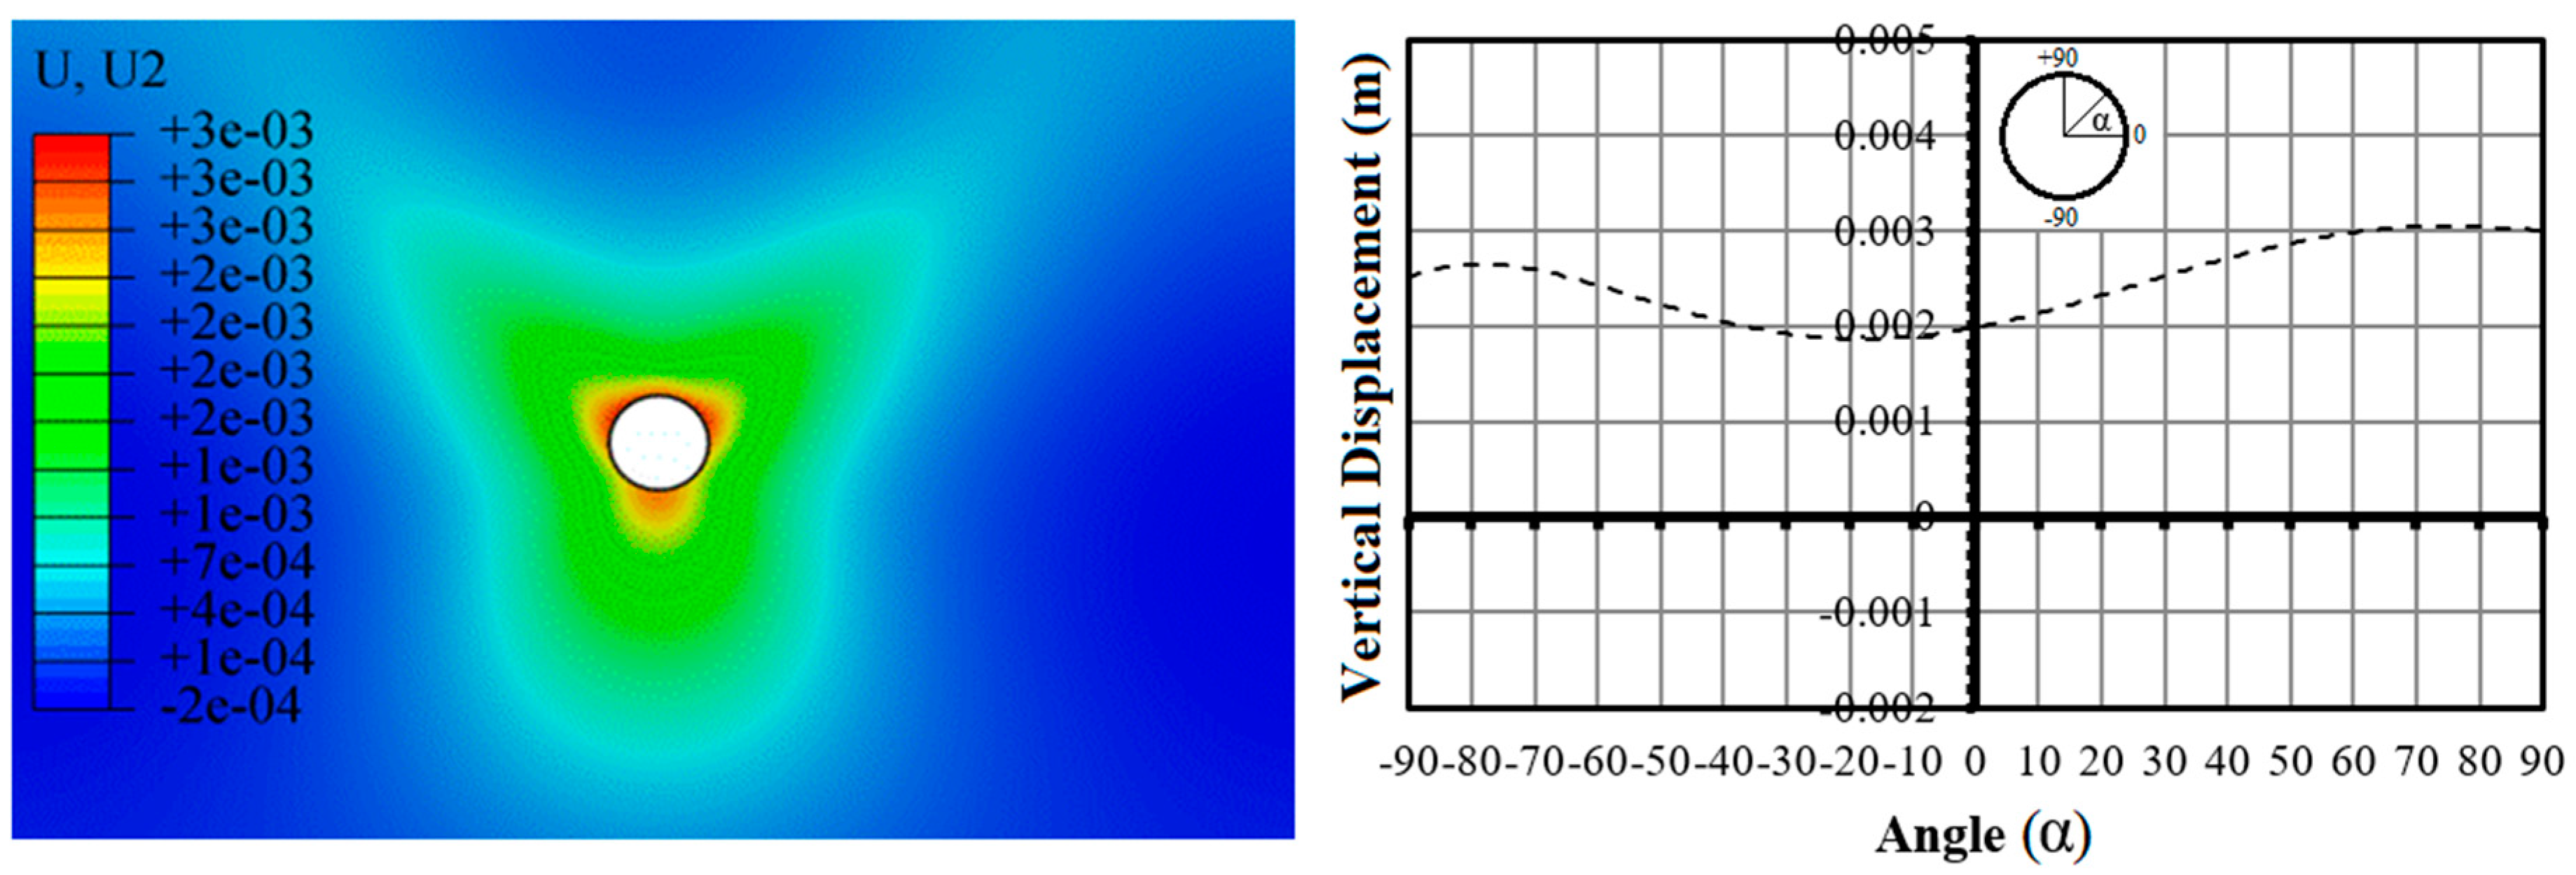
Figure 11 and Figure 12 show vertical (U2) and horizontal (U1) displacements in the soil environment, respectively, and Figure 13 shows the stresses in the pipe wall under steady flow conditions.
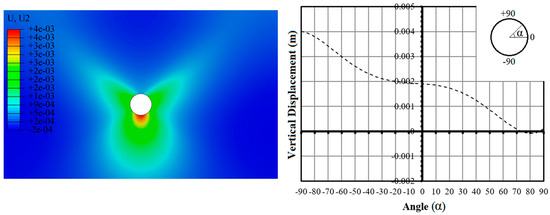
Figure 11.
Displacements in the vertical direction under steady flow conditions.
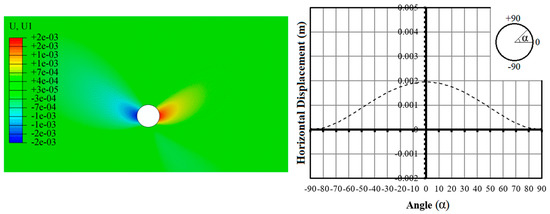
Figure 12.
Displacements in the horizontal direction under steady flow conditions.
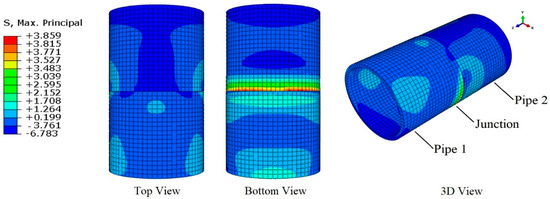
Figure 13.
Stresses in the pipe wall under steady flow conditions (MPa).
As mentioned earlier, in this scenario, the pressurized pipe is operating under a steady flow with 0.5 MPa (72.52 psi) of pressure. Due to this pressure, as well as the fluid weight, the concrete pipe moves, and this displacement transfers to the surrounding soil. As a result, displacements that took place under no-flow conditions will change. The figures show that the maximum displacement under steady flow conditions is 1 mm, both in vertical and horizontal directions. This value is obtained from the maximum vertical pipe displacement difference in Figure 8 and Figure 11. The same value is obtained by comparing horizontal displacements in Figure 9 and Figure 12.
Similar to the no-flow condition, stress distribution contours mostly show compression at the top, and tension at the bottom of the pipe (Figure 13). Under this condition, due to the addition of the internal pressure, the highest tensions occurred at the bottom of the pipe, with a maximum value of 3.86 MPa (559.85 psi) at the junction.
3.3. Transient Flow Condition
Figure 14 and Figure 15 show vertical (U2) and horizontal (U1) displacements in the soil environment, respectively, and Figure 16 shows the stresses in the pipe wall under transient flow conditions.
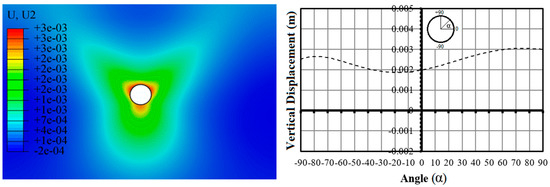
Figure 14.
Displacements in the vertical direction under transient flow conditions.
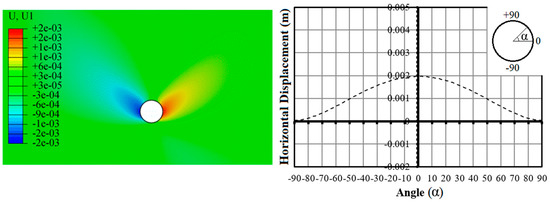
Figure 15.
Displacements in the horizontal direction under transient flow conditions.
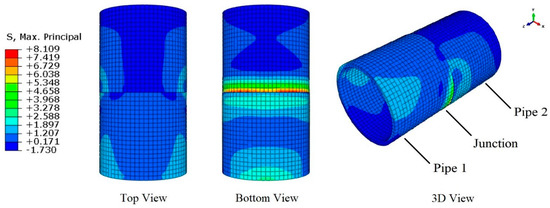
Figure 16.
Stresses in the pipe wall under transient flow conditions (MPa).
According to Figure 14 and Figure 15, relative to steady flow condition, displacements in the soil have increased under the influence of transient pressures in the pipe. The results obtained at this stage indicate that maximum displacements occurred at the upper portions of the section, with a maximum value of 3.1 mm in the crown.
Similar to the two previous conditions, stress contours show areas under compression at the top of the pipe and areas under tension at the bottom of the pipe. In the event of a transient flow, the maximum tension remained at the bottom of the pipe, with a maximum value of 8.1 MPa (1174.81 psi) at the junction.
4. Discussion
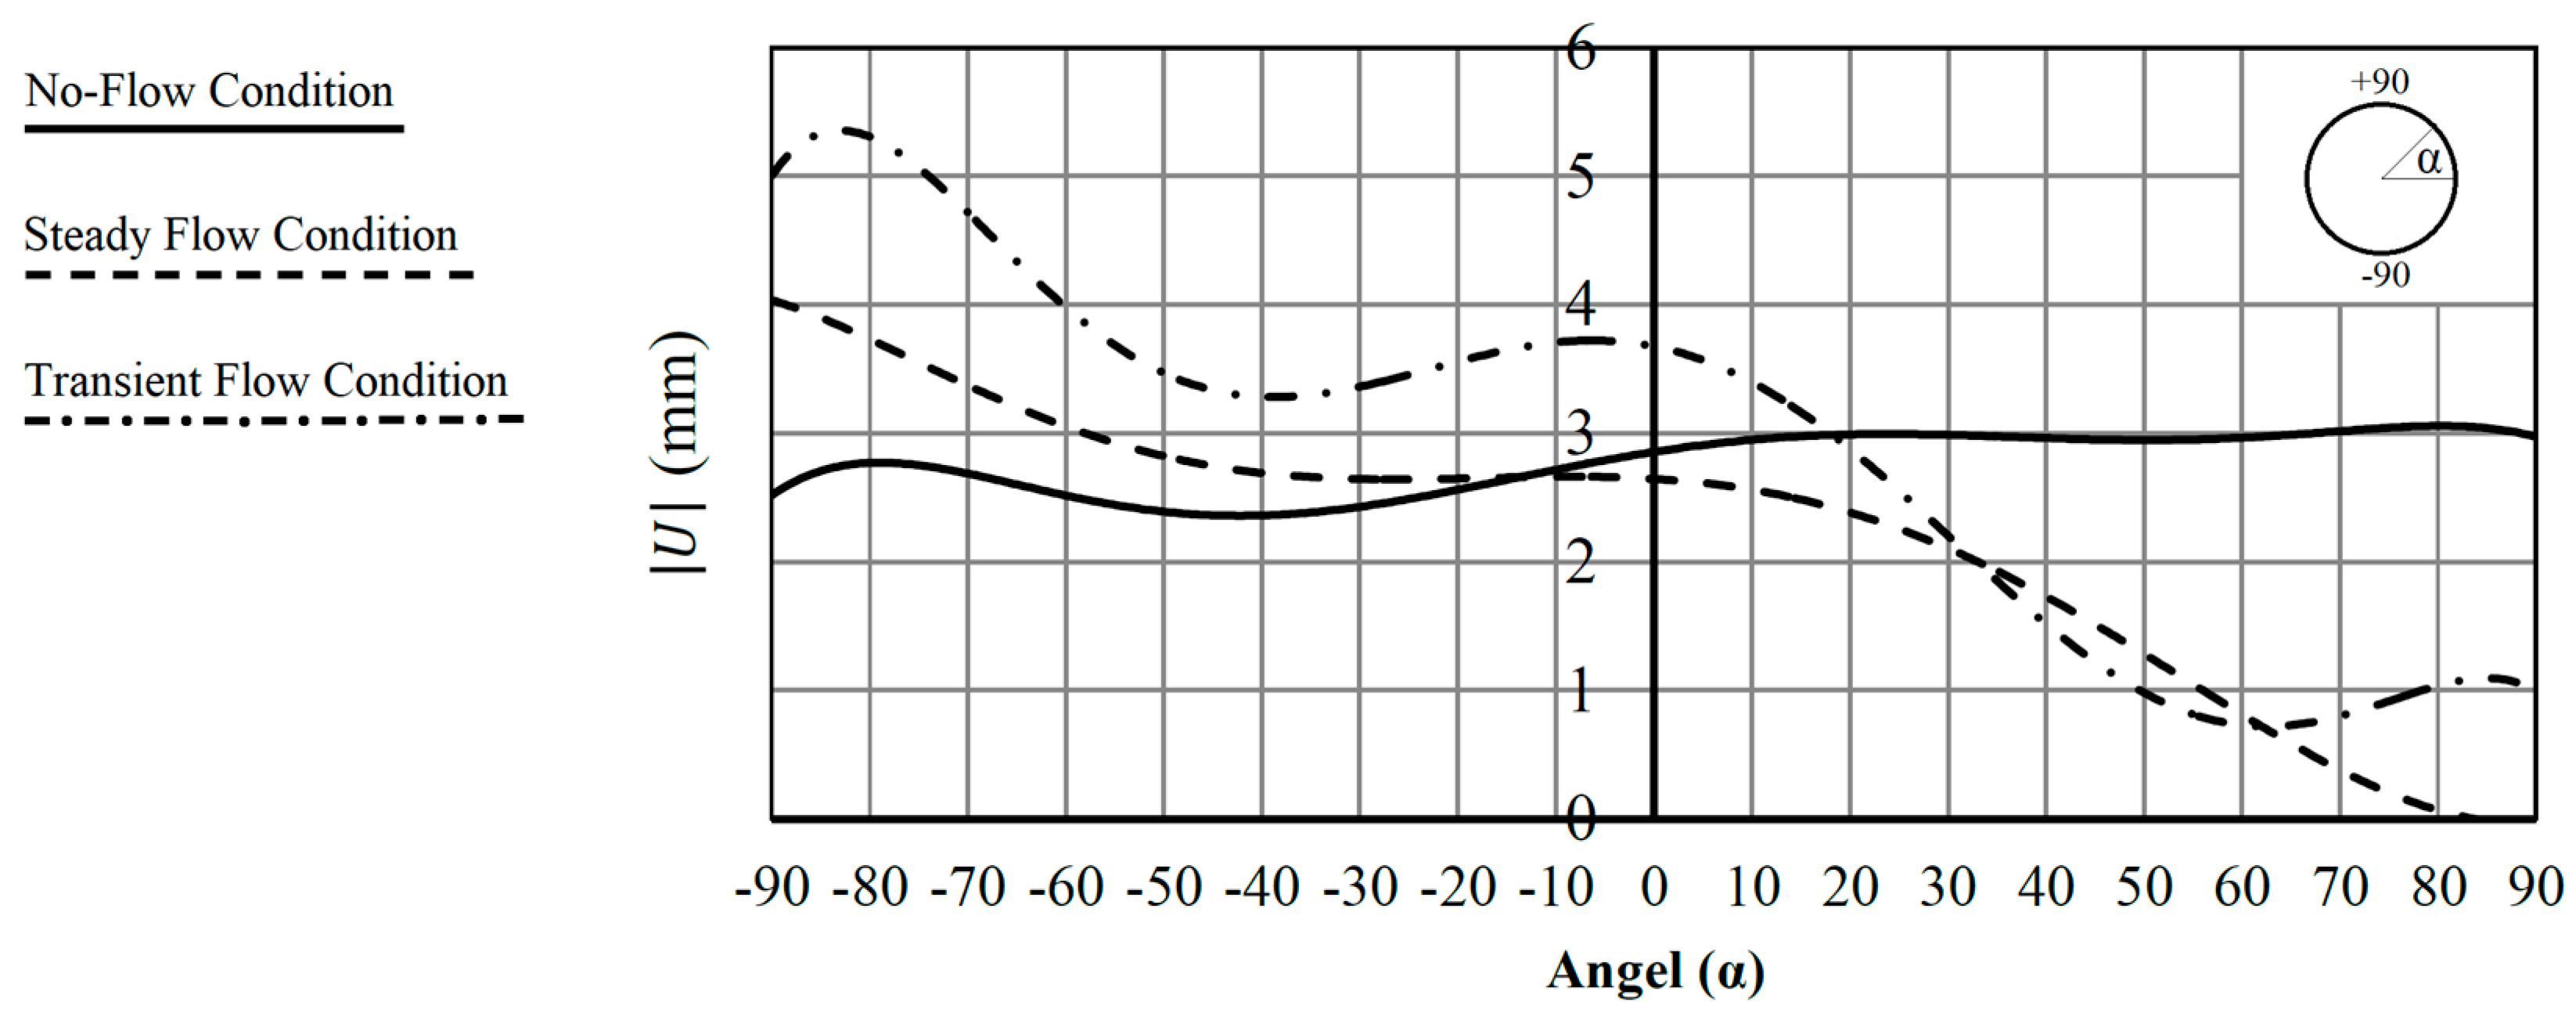
In Figure 17, the absolute value of total displacements (resultant of vertical and horizontal displacements) under each scenario are shown. UNo-flow, USteady, and UTransient, refer to total displacements under no-flow, steady flow, and transient flow conditions, respectively.
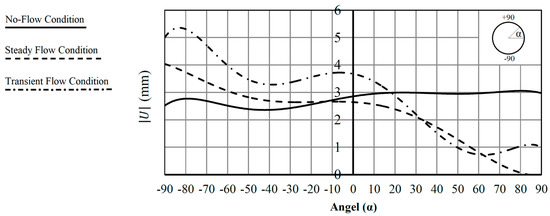
Figure 17.
Total displacements under: no-flow, steady flow, and transient flow conditions.
Figure 17 shows that under the no-flow condition, maximum displacements occurred at the bottom of the section, which can be attributed to soil inflation, as a result of unloading the soil, soil overburden, soil type, and distribution of loads in the drilled environment. Under steady flow condition, the greatest displacement occurred at the bottom of the section, which can be attributed to the internal pressure, fluid weight, and soil overburden. Finally, under transient flow condition, the entire section of the pipe moved upward, and the maximum displacement occurred in the crown. Concerning stresses, junctions were the most critical points. In all cases, the maximum compressive and tensile stresses were formed at the junction.
Table 3 summarizes the maximum displacements along with the maximum compressive and tensile stresses in the pipe wall under each scenario.

Table 3.
Maximum displacements and stresses under each scenario
Considering the range of 2.2 to 4.2 MPa for the tensile strength of concrete, under transient flow conditions, the tensile stress in the concrete pipe wall exceeds this range. High tensile stresses will cause cracks in the pipe wall, especially at the junctions, and consequently result in water leakage, soil wash, and generally reduced operational capacity of the pipeline.
5. Conclusions
A concrete water transmission pipe installed underground in ordinary compacted clay soil using trenchless drilling (pipe jacking method) was modeled in Abaqus FEA. The purpose of this study was to investigate flow-induced stresses in the pipe wall and displacements in the soil environment, under no-flow, steady flow, and transient flow conditions in the pipe. The following are the key findings of this study:
- Under the no-flow condition, the most significant displacements occurred at the bottom of the section. This can be attributed to the soil inflation phenomenon, as a result of drilling and alteration of stress distribution in the soil environment.
- Under steady flow condition, the soil environment showed small displacements, due to the internal pressure and fluid weight in the pipe.
- By the occurrence of transient pressure due to the event of transient flow in the pipe, the displaced region was enlarged, and the pipe and surrounding soil showed an upward movement.
- Under all scenarios, maximum compressive and tensile stresses were formed at the junction. The maximum value was observed under the transient flow condition, where the tensile stress exceeded the allowable tensile capacity of the concrete. This situation will cause cracks in the pipe wall and consequently lead to water leakage and reduced operational capacity of the pipeline.
Future work can be done on optimizing the valve closure pattern, considering the internal pressure in the pipe, existing soil overburden on the pipe, and soil type, in order to minimize transient pressures and resultant pipe displacements. Moreover, a comprehensive parametric study can be performed on different model components to investigate the impact of each parameter on the model results.
Author Contributions
Conceptualization, M.K. (Mehrdad Karami); Methodology, M.K. (Moses Karakouzian), M.K. (Mehrdad Karami), M.N.-S. and S.A.; Software, M.K. (Mehrdad Karami); Writing—original draft preparation, M.K. (Mehrdad Karami) and M.N.-S.; Writing—review and editing, M.K. (Moses Karakouzian) and S.A.
Funding
This research received no external funding.
Conflicts of Interest
The authors declare no conflict of interest.
References
- Rezaei, H.; Ryan, B.; Stoianov, I. Pipe failure analysis and impact of dynamic hydraulic conditions in water supply networks. Procedia Eng. 2015, 119, 253–262. [Google Scholar] [CrossRef]
- Kodikara, J.; Rathnayaka, S.; Zhang, J.; Crawly, C.; Zhang, D.; Blaha, F. Lessons Learned from Large-Diameter Pipe Failure Case Studies. Pipelines 2017, 561–571. [Google Scholar] [CrossRef]
- Zarghamee, M.S.; Ojdrovic, R.P. Some Lessons Learned from Failure of a Pipeline. Pipelines 2006. [Google Scholar] [CrossRef]
- Meniconi, S.; Brunone, B.; Frisinghelli, M.; Mazzetti, E.; Larentis, M.; Costisella, C. Safe transients for pipe survey in a real transmission main by means of a portable device: The case study of the Trento (I) supply system. Procedia Eng. 2017, 186, 228–235. [Google Scholar] [CrossRef]
- Tijsseling, A.S. Water hammer with fluid–structure interaction in thick-walled pipes. Comput. Struct. 2007, 11, 844–851. [Google Scholar] [CrossRef]
- Ma, B.; Najafi, M. Development and applications of trenchless technology in China. Tunn. Undergr. Space Technol. 2008, 23, 476–480. [Google Scholar] [CrossRef]
- Yen, J.; Shou, K. Numerical simulation for the estimation the jacking force of pipe jacking. Tunn. Undergr. Space Technol. 2015, 49, 218–229. [Google Scholar] [CrossRef]
- Kyriakides, S.; Babcock, C.D. Experimental determination of the propagation pressure of circular pipes. J. Press. Vessel Technol. 1981, 103, 328–336. [Google Scholar] [CrossRef]
- Milligan, G.W.E.; Norris, P. Pipe–soil interaction during pipe jacking. Proc. Inst. Civ. Eng. Geotech. Eng. 1999, 137, 27–44. [Google Scholar] [CrossRef]
- Valiente, A. Stress corrosion failure of large diameter pressure pipelines of prestressed concrete. Eng. Fail. Anal. 2001, 8, 245–261. [Google Scholar] [CrossRef]
- Gysling, D.L. Displacement Based Pressure Sensor Measuring Unsteady Pressure in a Pipe. U.S. Patent No. 6,463,813, 15 October 2002. [Google Scholar]
- Wasmer, K.; Nikbin, K.M.; Webster, G.A. Creep crack initiation and growth in thick section steel pipes under internal pressure. Intl. J. Press. Vessels Pip. 2003, 80, 489–498. [Google Scholar] [CrossRef]
- Meis, R.D.; Maragakis, E.M.; Siddharthan, R. Behavior of Underground Piping Joints Due to Static and Dynamic Loading; MCEER: Buffalo, NY, USA, 2003. [Google Scholar]
- Guo, P. Numerical modeling of pipe–soil interaction under oblique loading. J. Geotech. Geoenviron. Eng. 2005, 131, 260–268. [Google Scholar] [CrossRef]
- Schmitt, C.; Pluvinage, G.; Hadj-Taieb, E.; Akid, R. Water pipeline failure due to water hammer effects. Fatigue Fract. Eng. Mater. Struct. 2006, 29, 1075–1082. [Google Scholar] [CrossRef]
- Lydell, B.; Riznic, J. OPDE—The international pipe failure data exchange project. Nuclear Eng. Des. 2008, 238, 2115–2123. [Google Scholar] [CrossRef]
- Vazouras, P.; Karamanos, S.A.; Dakoulas, P. Finite element analysis of buried steel pipelines under strike-slip fault displacements. Soil Dyn. Earthq. Eng. 2010, 30, 1361–1376. [Google Scholar] [CrossRef]
- Wu, G.Y.; Smith, D.J.; Pavier, M.J. Effects of load and displacement controlled bending on plastic collapse of pressurized pipes. Procedia Mater. Sci. 2014, 3, 1204–1209. [Google Scholar] [CrossRef]
- Wang, S. Evaluation of underground pipe-structure interface for surface impact load. Nuclear Eng. Des. 2017, 317, 59–68. [Google Scholar] [CrossRef]
- Xu, M.; Shen, D.; Rakitin, B. The longitudinal response of buried large-diameter reinforced concrete pipeline with gasketed bell-and-spigot joints subjected to traffic loading. Tunn. Undergr. Space Technol. 2017, 64, 117–132. [Google Scholar] [CrossRef]
- Ortiz, M.; Pandolfi, A. A variational Cam-clay theory of plasticity. Comput. Methods Appl. Mech. Eng. 2004, 193, 2645–2666. [Google Scholar] [CrossRef]
- Zhang, Y.; Yan, Z.G.; Zhu, H.H.; Ju, J.W. Experimental study on the structural behaviors of jacking prestressed concrete cylinder pipe. Tunn. Undergr. Space Technol. 2018, 73, 60–70. [Google Scholar] [CrossRef]
- ABAQUS. Theory Guide, Release 6.14; ABAQUS, Inc.: Palo Alto, CA, USA, 2014. [Google Scholar]
- Hachem, F.E.; Schleiss, A.J. A review of wave celerity in frictionless and axisymmetrical steel-lined pressure tunnels. J. Fluids Struct. 2011, 27, 311–328. [Google Scholar] [CrossRef]
- Wylie, E.B.; Streeter, V.L.; Suo, L. Fluid Transients in Systems; Prentice Hall: Englewood Cliffs, NJ, USA, 1993; Volume 1, p. 464. [Google Scholar]
- Joukowsky, N. On the Hydraulic Hammer in Water Supply Pipes; Division of Physical Sciences of O.L.E., University of California: Berkeley, CA, USA, 1897. [Google Scholar]
- Halliwell, A.R. Velocity of a water-hammer wave in an elastic pipe. J. Hydraul. Div. 1963, 89, 1–21. [Google Scholar]
© 2019 by the authors. Licensee MDPI, Basel, Switzerland. This article is an open access article distributed under the terms and conditions of the Creative Commons Attribution (CC BY) license (http://creativecommons.org/licenses/by/4.0/).

