Abstract
The simultaneous visualization and characterization of heat transfer processes from hot vibrating objects is a challenging task. This article presents an experimental set-up for the investigation of thermomechanical oscillations in thin cylindrical heaters, allowing us to visualize convection processes using Schlieren photography, infrared photometry, and other methods. It is demonstrated that heat transfer considerably changes in the regions of parametric instability.
1. Introduction
Visualization of convective heat transfer processes in aero- and hydrodynamics has always been of considerable interest [1,2,3,4,5]. The improvement of infrared thermometry and the availability of infrared cameras have caused a rapid development in this field in recent years. However, the study of thermal convection around hot objects moving in air is still associated with technical difficulties. In this paper, we demonstrate the visualization of thermal convection around an oscillating thin cylindrical heater.
The combination of thermal oscillations and mechanical vibrations is customarily termed thermomechanical oscillations (TMOs). Similar oscillations are observed in systems where bodies at a temperature , differing from the medium ambient temperature , are in periodic motion. The simplest model of such a system is a hot cord vibrating in air. Since the rate of cooling of a heated body in a liquid or a gas increases as the relative velocity V increases, the coefficient of heat transfer depends on V: . According to the theory of heat transfer under conditions of transverse flow around a hot cylinder (in the regions of small Re numbers),
holds [5,6,7] where is the Nusselt number, and is the Reynolds number. Therefore, the coefficient of heat transfer is connected to the velocity V of the moving hot body via
where is the coefficient of heat transfer of a stationary body, and h is a constant that depends on its geometry as well as on its thermo-physical properties. The higher the amplitude or the frequency of the mechanical oscillation, the higher the velocity and thus the heat transfer. This should remain valid when the flow changes from laminar to turbulent and the velocity dependence of deviates from that in Equation (2). The good agreement of these formulas and experimental data of TMO is demonstrated in [8]. As a consequence, the intensity of heat transfer from the heated cylinder oscillating transversely to the cold medium changes periodically and so does its temperature. The oscillation of temperature in turn leads to pulsations of the heater’s shape and dimensions so that mechanical vibrations arise. In other words, in such systems, thermal oscillations feed back to non-thermal oscillations and vice versa (for more details on TMO we refer the reader to [9]). Under certain conditions, they can reinforce each other, leading to the appearance of resonance effects [8,9,10,11,12,13,14,15,16].
2. Materials and Methods
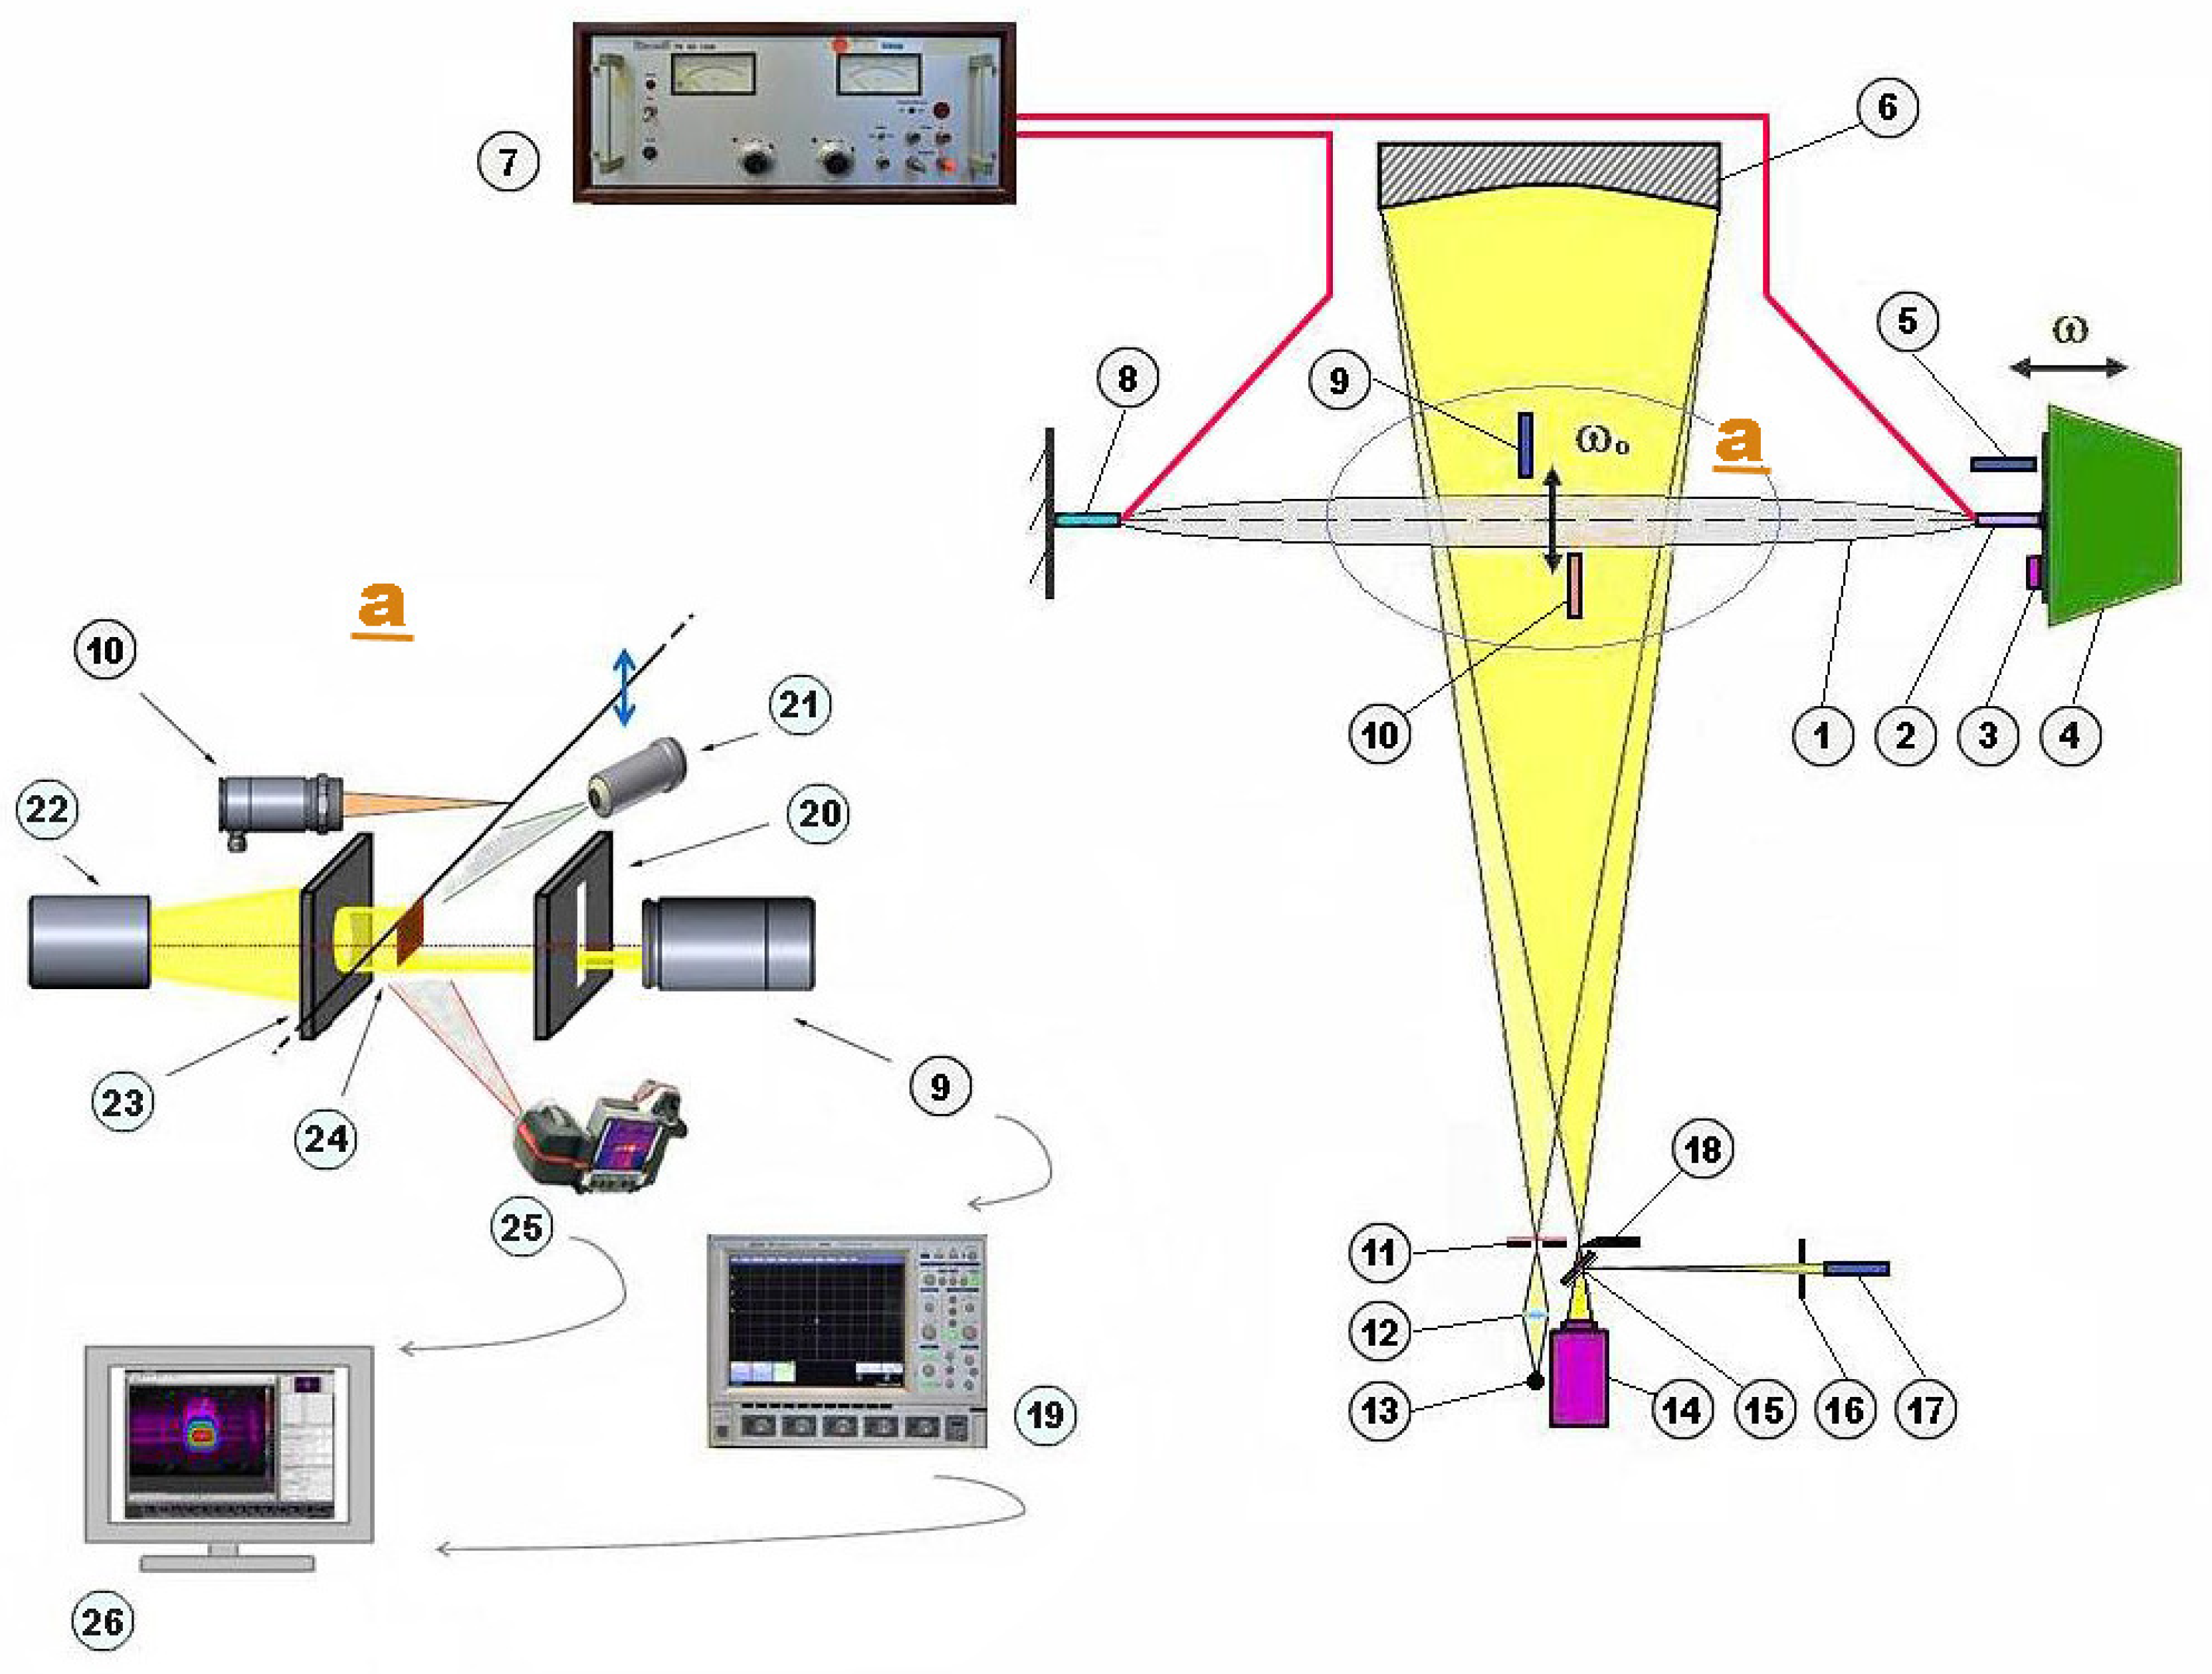
We studied the heat transfer around a thin cylindrical horizontal heater in air during TMO using a special set-up (see Figure 1). The thermomechanical vibratory system is realized by a stretched wire heated by a dc-current (1). As is known, it is possible to excite parametric resonance by modulating some of the vibrational parameters of the system. In our case, these are the combined mechanical and thermal effects on the linear dimensions of the cord—the variation of the applied stress and of the stress due to thermal expansion and contraction (the latter effect may be quite complicated due to turbulence or to a shedding of thermal plumes). As an external modulator (4), a low-frequency loudspeaker generates pulsations of wire tension of frequency and thus also provides the initial excitation. At certain excitation frequencies , the wire starts to perform transverse oscillations of frequencies , resulting in a modulation of heat transfer (see above). An alternative way to excite a resonance without using the modulator is to vary the pre-stress of the heated wire until a stable resonance occurs.
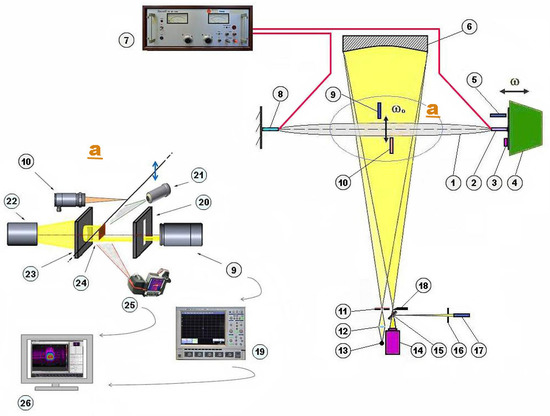
Figure 1.
The overview scheme of the experimental installation. 1—wire heater; 2—micrometer worm mechanism; 3—longitudinal accelerometer; 4—low-frequency loudspeaker’s head; 5—photomultiplier; 6—parabolic mirror; 7—DC source, 8—quartz force sensor; 9—photomultiplier; 10—infrared thermometer; 11—iris diaphragm with red filter, 12—lens; 13—point light source; 14—digital photo-camera; 15—translucent mirror; 16—slit diaphragm; 17—photomultiplier; 18—Foucault’s knife; 19—oscilloscopes; 20—slit diaphragm; 21—microscope USB-camera; 22—light source; 23—iris diaphragm; 24—light beam shattering flag; 25—infrared photo-camera; 26—computer.
We used Cr20Ni80 and Kanthal-A wires with diameters d from 0.3 to 0.6 mm and lengths L from 2000 to 3900 mm. The heating current was furnished by a Heinzinger 80-1200 (Heinzinger electronic GmbH, Rosenheim, Germany) DC source (7). In this way, the temperature difference between the surrounding medium and a fixed heater could be changed from 50 to . The initial normal stress (tension) of the wire was applied via a micrometer screw mechanism (2). The tension modulations were varied in intervals of 35 MPa using the electrodynamical head of the low-frequency loudspeaker Earthquake DBXi-15 (Earthquake Sound Corp., Hayward, CA, USA) (4). The loudspeaker’s head received electric pulsing from a generator Toellner TOE 7704 (TOELLNER Electronic Instrumente GmbH, Herdecke, Germany), which was combined with an amplifier Kampo SUB-100A (Conrad Electronic SE, Hirschau, Germany) and an impulse counter Toellner TOE 6705 (TOELLNER Electronic Instrumente GmbH). In this way, sinusoidal and rectangular pulsing with a repetition frequency from 0 to 30 Hz was applied. The variable normal stress of the oscillating thin heater was recorded by a quartz force sensor (“Kistler Instrumente AG” Quartz Force Sensor Type 9207, Winterthur , Switzerland) (8) combined with an amplifier (“Kistler Instrumente AG” Charge Amplifier Type 5073A, with software “Kistler Instrumente AG” ManuWare v.1.0.2). The longitudinal displacements of the loudspeaker membrane were recorded by a mini accelerometer (“Brüel and Kjær” DeltaTronTM 4397A, Nærum, Denmark) (3), which was fixed on the cone of the loudspeaker. In addition, an optical system with a photomultiplier FEU-85 (MELZ FEU, Moscow, Russia) was used (5). The transverse vibrations of the wire were measured by another photomultiplier FEU-85 (9) with an optical system (20,22,23,24). The time-averaged temperature at an arbitrary point of the thin wire heater was monitored by an infrared photo-camera (FLIR T335) (25) with a post-processing program FLIR ResearchIR Max v.3.1 (FLIR Systems, Inc., Wilsonville, OR, USA). Temperature oscillations on the heater surface were measured by the infrared thermometer Optris CTLaser 3MH-CF1 (Optris Infrared Sensing, LLC, Portsmouth, NH, USA) (10) with software CompactConnect v.1.8.6.15 (Optris Infrared Sensing, LLC, Portsmouth, NH, USA). This IR-thermometer can measure the temperature only in one point, although it is possible to micrometrically move it along the cord. Two multichannel oscilloscopes LeCroy WaveSurfer 64Xs (LeCroy Corporation, Chestnut Ridge, NY, USA) and ”Hameg Instruments” HM 1508-2 (HAMEG Instruments GmbH, Mainhausen, Germany) (19) displayed the signals from the sensors using the software HMLab v.1.08 (HAMEG Instruments GmbH, Mainhausen, Germany). The visual control of TMO was implemented with the aid of a ”Conrad Electronic SE” (Hirschau, Germany) USB microscope camera 500x DSO-P03 (21).
We have visualized the convective air flows around the oscillating heater employing Schlieren photography with a symmetric arrangement of illuminant and photosensor relative to the concave mirror’s optical axis. Such a two-dimensional model of visualization is fully justified since steady state (stationary) elastic TMOs always occur in a vertical plane, which has been noted in a number of works [9,11,12,13,15,16]. Exceptions occur, e.g., in the areas of the parametric instability of the TMO, resulting in an enhanced heat transfer. However, the data we present only refer to situations where we observed vertical in-plane oscillations (up and down) of the wire. In our case, a Dobson-telescope ‘parabolic main mirror 8’ (“Galaxy”, type D8K, aperture ratio f/6, diameter D = 200 mm, focal length f = 1200 mm, BK7) (6) mounted on a multi-positional table was used. A high-power light-emitting diode (LED) (140,000 mcd) (13) with optics (11,12) served as a point light source. The light beams are reflected by the parabolic mirror and pass through the area of convective flows. They are focused on the blade of a Foucault’s knife (18) disposed on 2f distance from the parabolic mirror (f: focus length). Then the beam is divided by a semitransparent plane mirror (15) into two directions—one way to a digital photocamera Nikon D5100 (CMOS-Sensor 16,9 MPix, (Nikon Corporation, Tokyo, Japan)) with teleobjective Jupiter-37A (14), the other way to a photomultiplier FEU-110 (Ekran Optical Systems, Novosibirsk, Russia) (17), displaying velocities and density changes of the convection streams.
3. Results and Discussion
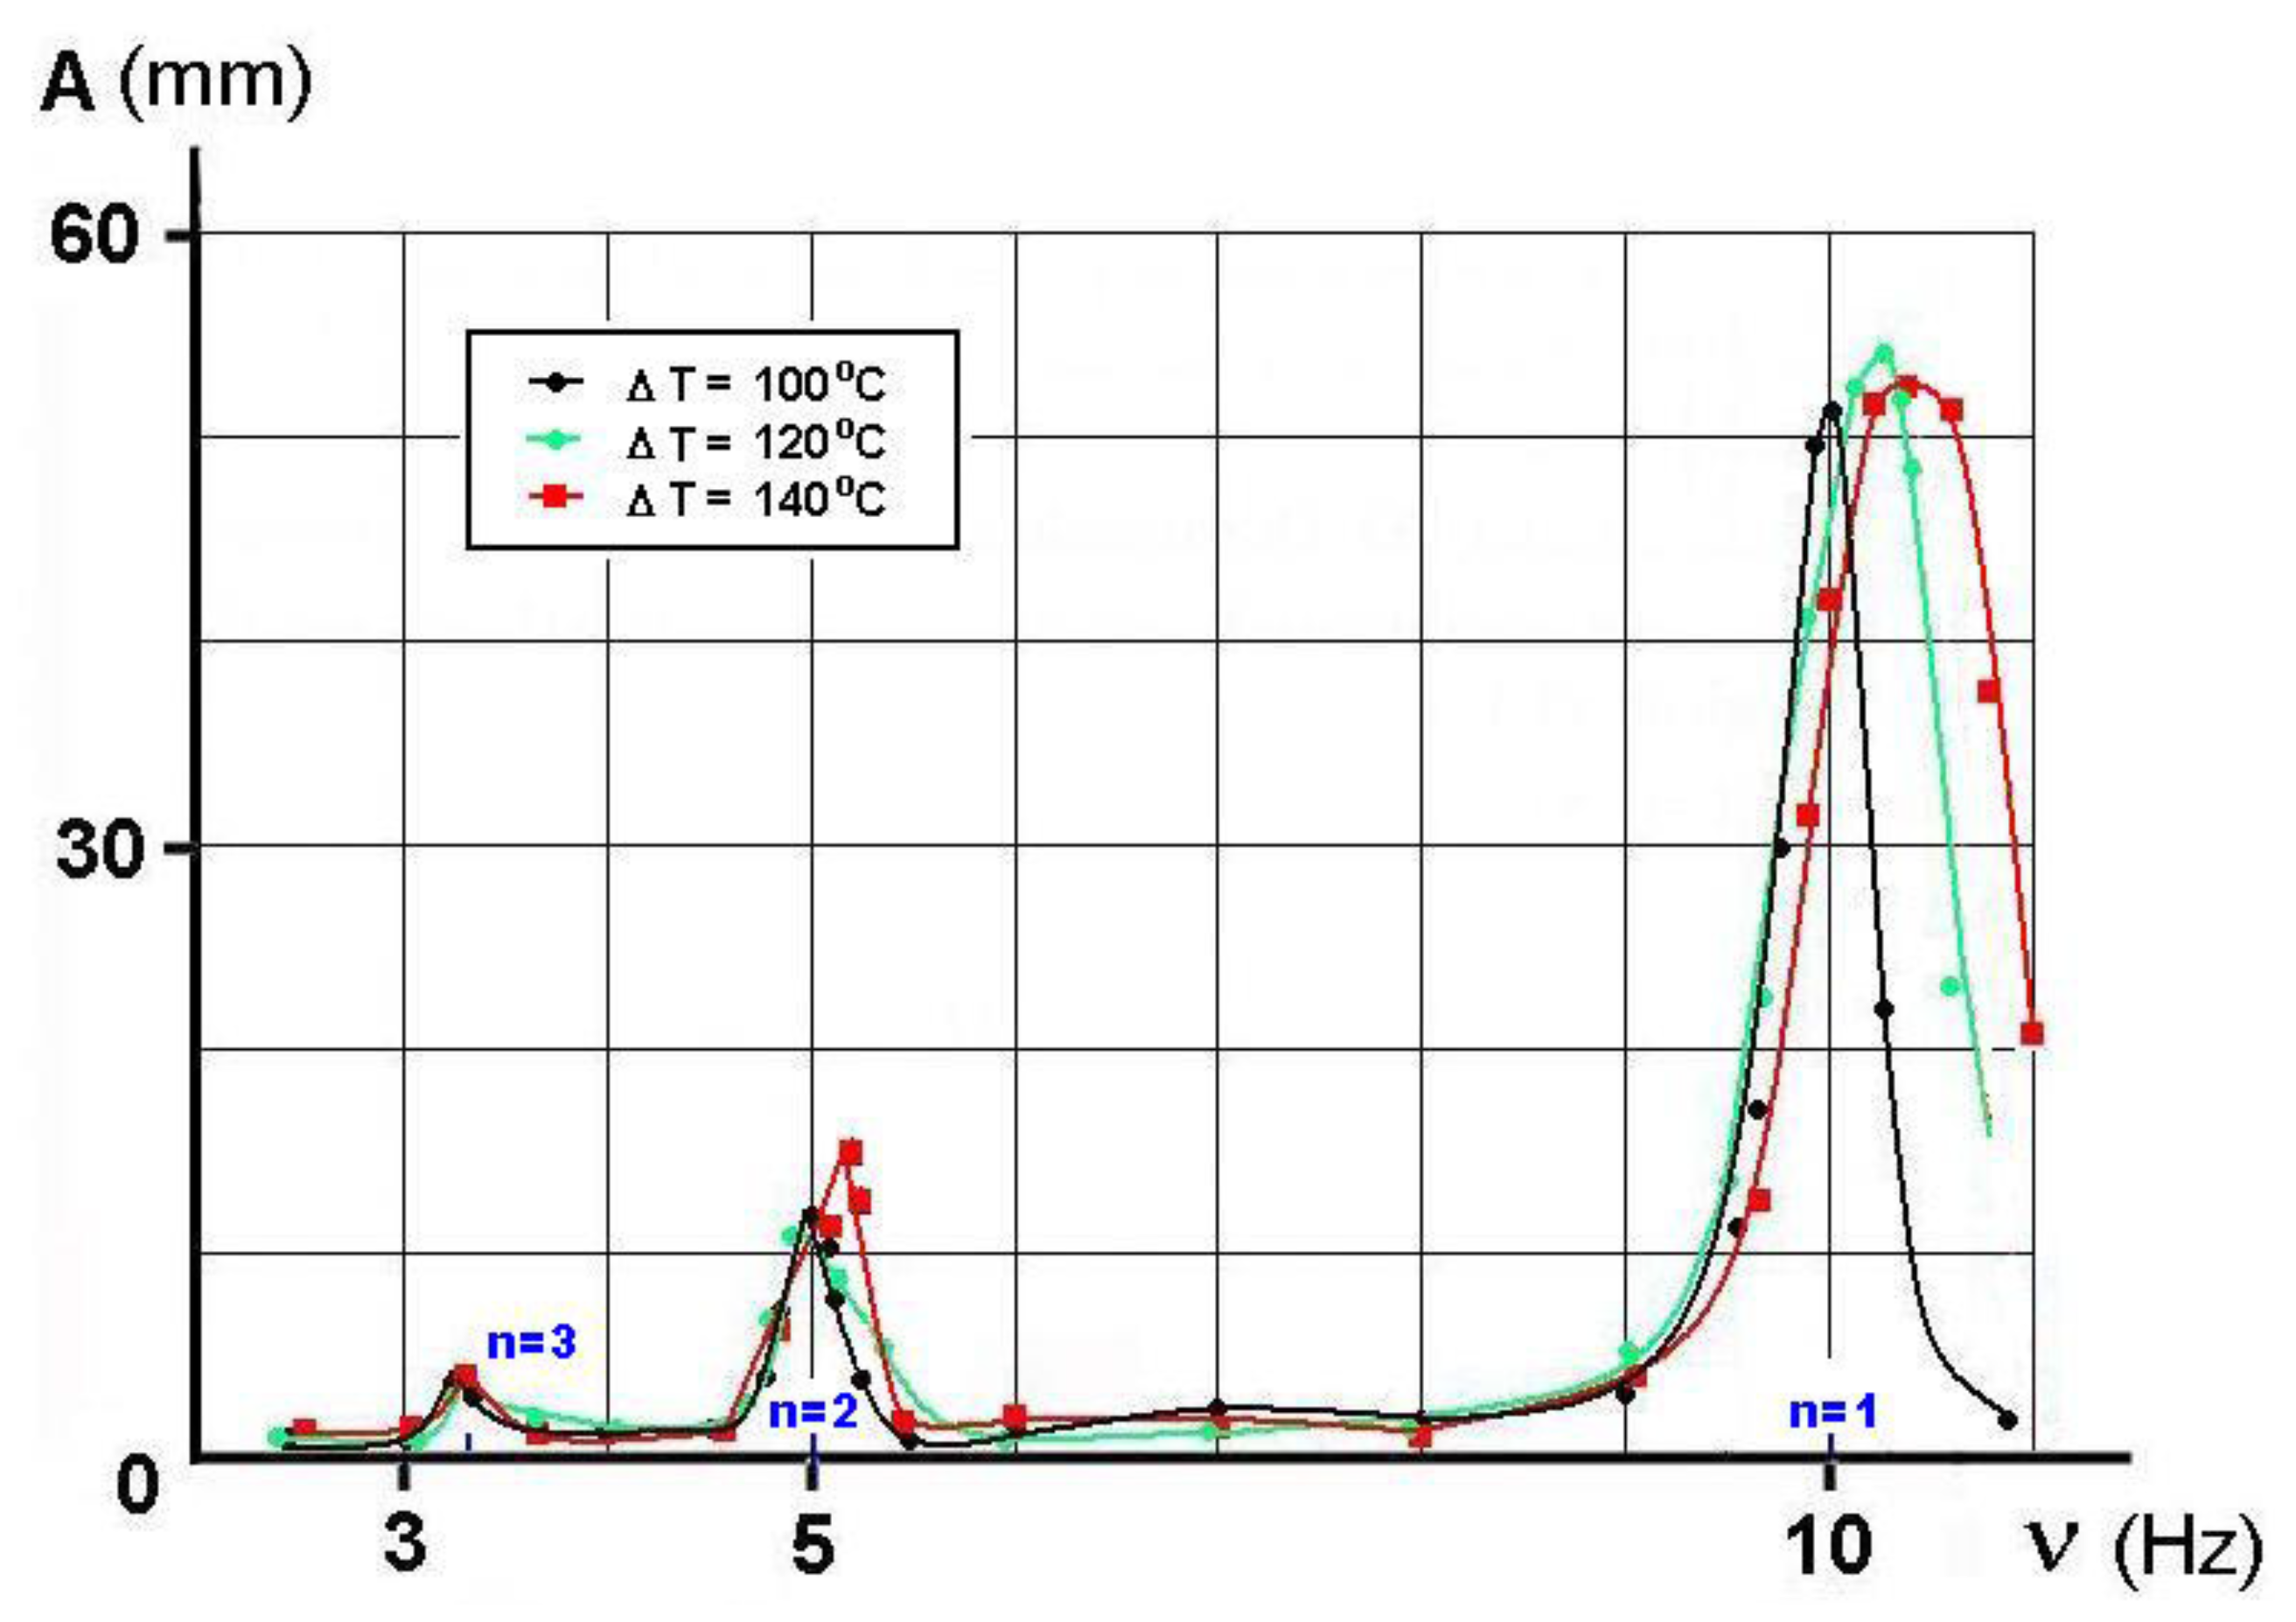
Previous experiments have shown that the TMO heat transfer depends on properties of the vibrating system (eigenfrequency, temperature difference, dissipative loss, etc.) and parameters of the modulating waveforms (intensity, shape, and periodicity), which can swing the system parametrically [9,13,14]. A parametric amplification of elastic TMO in the vertical plane arises when
holds, i.e., when the frequency of the external modulation is in resonance with the fundamental frequency of the oscillating wire (L denotes the length of the wire, its density, and the applied strain). In Figure 2, we show the amplitude of mechanical deflection, A, for the heated wire as a function of the frequency of external modulation, . The first resonance near Hz ( Hz and ) exhibits the highest amplitude. The second ( near Hz) and third ( above Hz) are less pronounced.

Figure 2.
Resonance spectra displaying the amplitude of the oscillating thin heater, A, as a function of the frequency of external modulation, , at various temperature differences ( denotes the time averaged temperature of the wire during a stationary oscillation and the temperature of the surrounding air). The lines are a guide to the eyes.
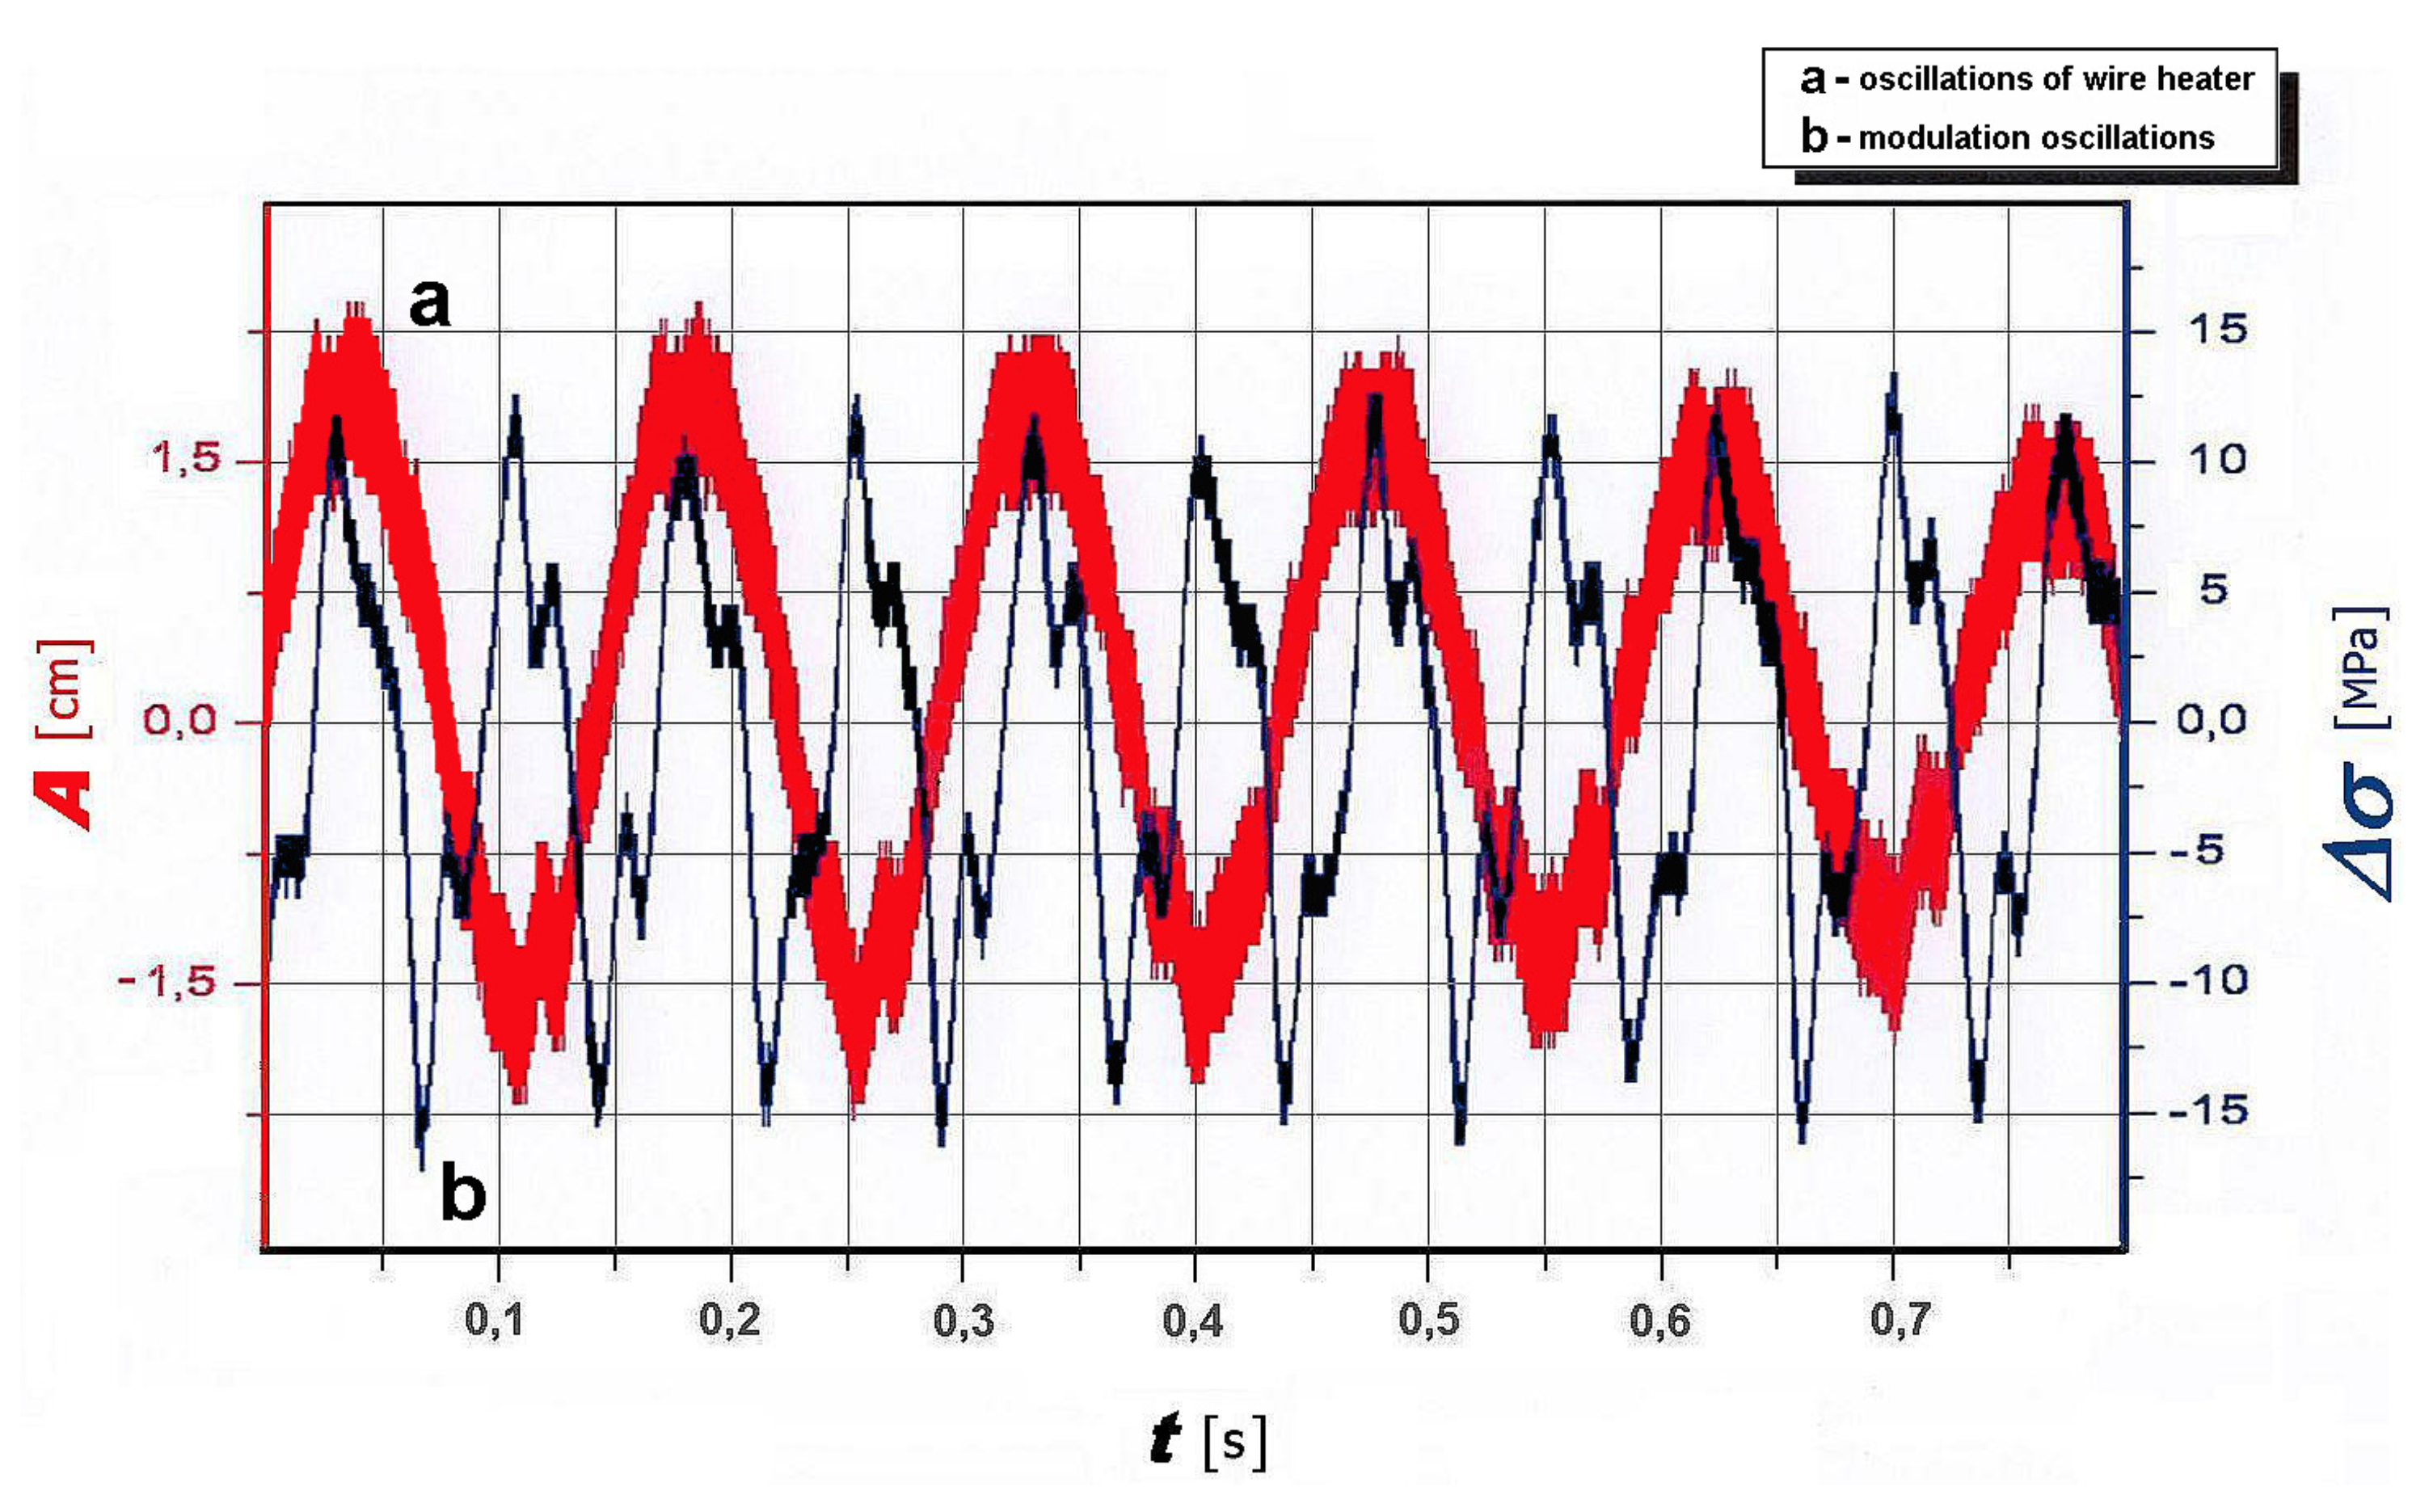
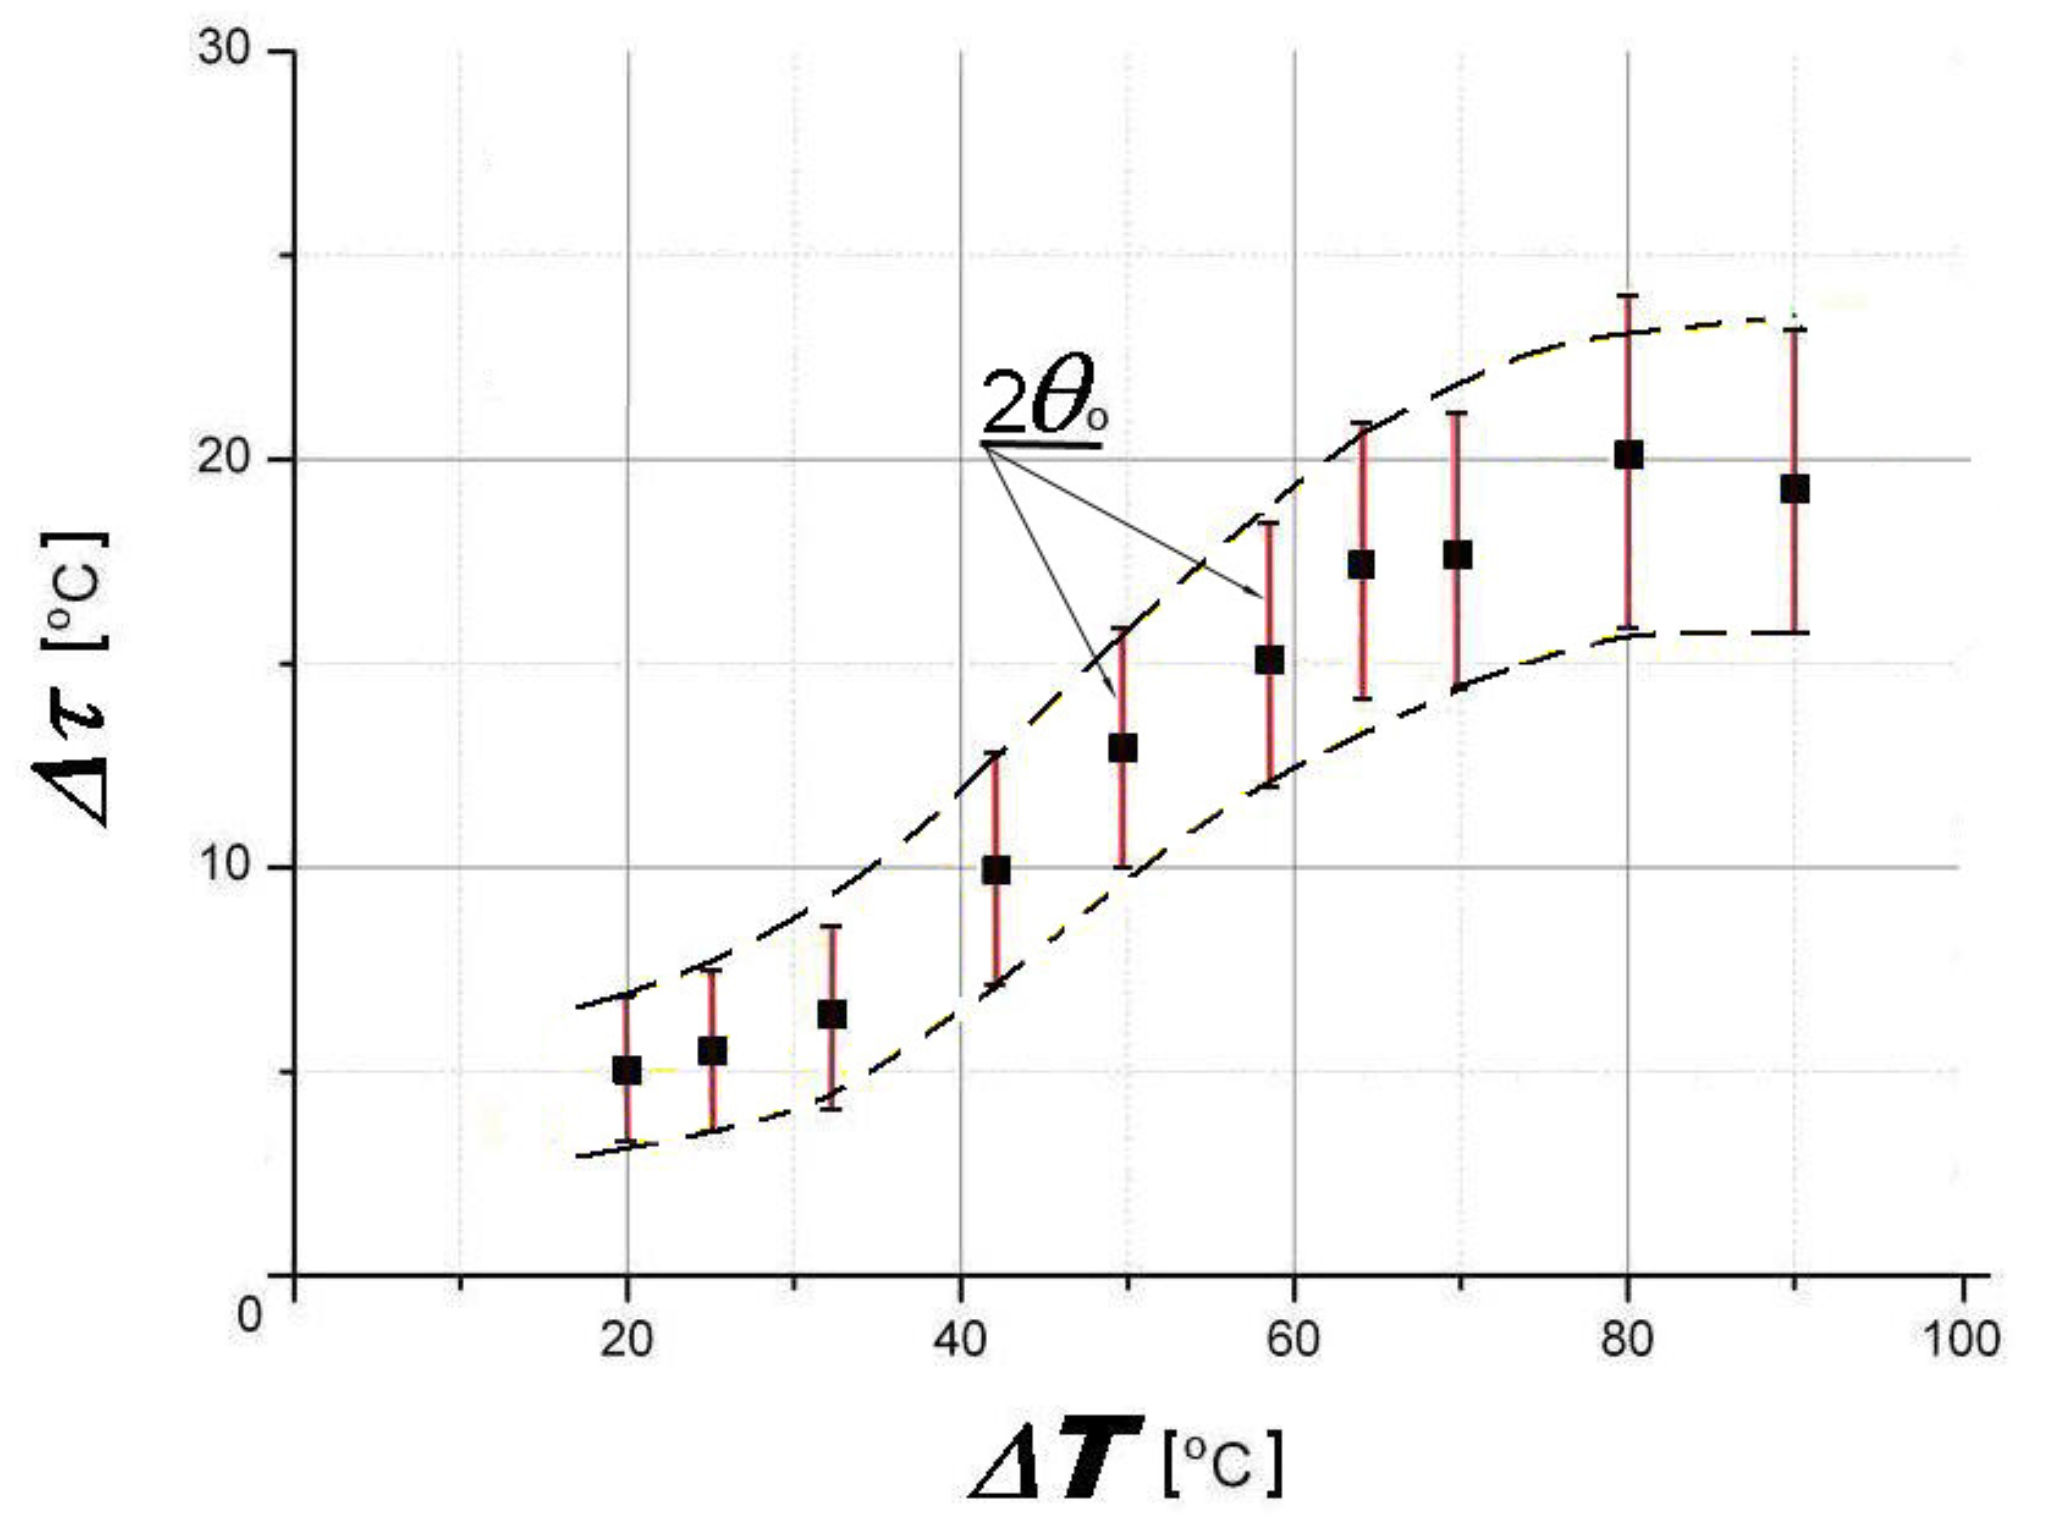
As an example for a stationary oscillation close to the first resonance, we display in Figure 3 the transverse deflection of the wire and its normal stress as a function of time. However, the development of such a stationary self-oscillating mode takes some time. The higher the initial temperature difference
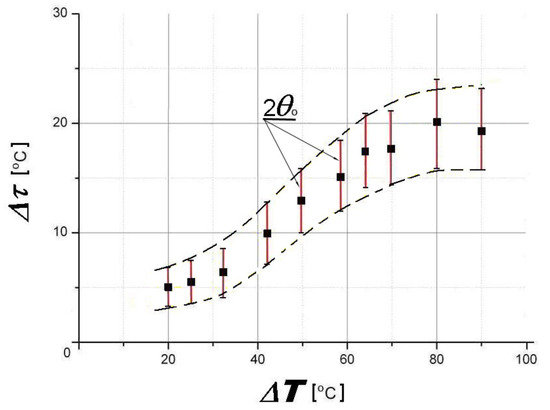
between wire, , and surrounding medium, , the shorter the transition period (see Figure 4). During TMO excitation, the wire cools down rapidly. Its temperature drops to a time-averaged value , around which the thermal pulsations with amplitude occur. The higher the initial temperature difference , the higher the cooling of the heater and the amplitude of temperature pulsations in the stationary state, (see Figure 5). Note that a stronger heating of the wire results in an increase of both the temperature pulsation and the heat transfer to the surrounding medium ( in Equation (2)). In fact, these two quantities are correlated (see [9]).

Figure 3.
Typical waveform of the TMO wire heater near the first resonance ( in Equation (3)): (a) transverse deflection, A, of the thin heater (red curve, Hz); (b) pulsations of stress (modulation oscillation Hz, blue curve); note the beating. Here, the pre-stress of the heated wire was varied using a micrometer worm mechanism (see (2) in Figure 1) to excite the stable resonance, i.e., we did not make use of the external modulator (loudspeaker).
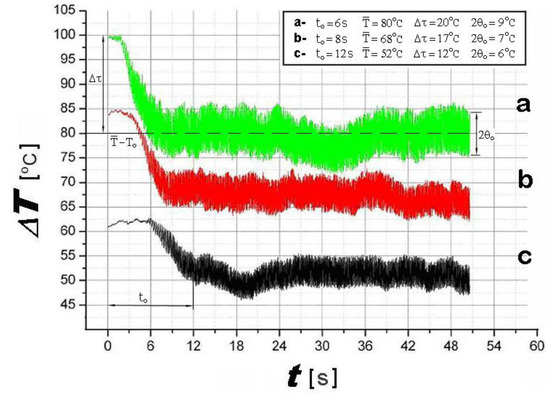
Figure 4.
Thermograms of TMO excitations for various initial temperatures of the fixed heater near the first resonance (excited by varying the pre-stress of the heated wire, i.e., without an external modulator). We display the temperature difference between the heated wire and the surrounding air as a function of time, t. The oscillation in the surrounding air leads to a cooling of the heated wire; i.e., during a characteristic time , its temperature decreases from to a lower time averaged value , where the stationary mode oscillation is attained (compare with Figure 3). denotes the cooling of the wire and the amplitude of the temperature pulsations in the stationary mode (with frequencies in the range from 9 to 10 Hz). The frequencies of transverse deflection A was in the range from 4.5 to 4.9 Hz (close to , compare with Figure 3). [(Cr20Ni80)-wire of thickness mm; variable normal stress = 15.3 MPa; modulation depth (ratio of the modulation amplitude and the amplitude of the fundamental oscillation)].
Furthermore, we have visualized the thermo-convective currents around a hot thin cylinder, oscillating in air medium, using Schlieren photography (see Figure 6). These are typical images taken with a time resolution of 30 frames per second. As is known [5,7] the heat flow around a fixed horizontal cylindrical heater is caused, first of all, by free convection. Figure 6a shows the forms of laminar currents (hot plumes) rising vertically upwards (their velocity is about 5–7 cm/s corresponding to Re = 100–150). However, just a few centimeters above the heater, these hot plumes lose stability, and a turbulent flow regime is observed.
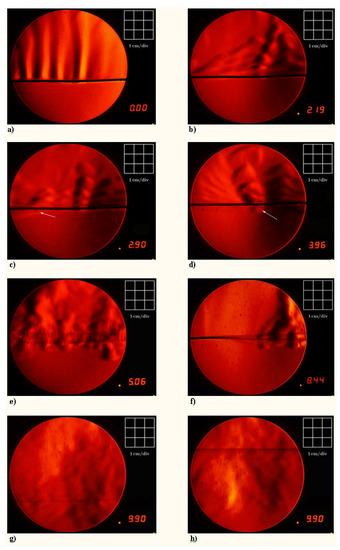
Figure 6.
Typical images of convective flow during TMO for a (Kanthal A)-wire of thickness mm at an intial temperature difference of K (see Equation (4)), a stress pulsation of MPa and fundamental frequency = 5 Hz. The modulation frequency was increased from 0 to 15 Hz to produce the oscillations shown (the respective value of in Hz is indicated by the number at the bottom right of each picture). (a) Fixed heater at , where holds (A is the amplitude of the wire deflection), laminar flow convection (Re ≃ 106), W/mK. (b) Mechanical vibrations of small amplitude ( Hz, mm), modulation depth . (c,d) The forming of hot air zone under the heater indicated by (arrows): Hz and mm in (c), Hz and mm in (d). (e) TMO in a parametric instability area (2nd resonance, ); Hz and mm. Powerful ejections of hot air under the heater are observed. (f) Generation of high-order harmonics of TMO (two antinodes), Hz and mm. (g,h) Maximum TMO intensity at the 1st resonance (), Hz, and mm, W/m K. The lowest (g) and the highest position (h) of the heater is shown. Passing the equilibrium position the heater is shrouded in a dense convective flow and hardly visible.
The excitation of TMO adds the vibration component to the convection process, stirring up the differently heated air layers. The elastic TMO initiated by a low-frequency modulation of the wire tension substantially changes the convection pattern around the heater. At low frequencies, the strata of hot air periodically break off from the heater surface, in time with its mechanical vibrations. These layers move up as a kind of “thermal shaft” (see Figure 6b). With increasing frequency, turbulence increases and a hot zone appears under the heater (see Figure 6c,d). In our view, the appearance of this hot zone is explained by the insufficient speed of evacuation of hot air around the heated wire. This effect is significantly enhanced in the areas of parametric instability, where the amplitudes of the mechanical vibrations and the temperature oscillations sharply increase (see Figure 6e,g,h). These are the cases of parametric resonance where Equation (3) holds. At the same time, according to [17,18,19,20], the time averaged heat transfer should increase. In fact, we obtain = 159 W/m K at the first resonance compared to 130 W/m K for the fixed heater (see Equations (3) and [9]). As expected, the most intensive air turbulence near the heater is observed at the first (dominant) resonance (n = 1) (Figure 6g,h). The dominance of the first (main) resonance is explained by the Ince–Strutt diagram of instability [17,19]. According to the classical theory of parametric resonance in this case, the pumping of energy into the system will be the greatest, which leads to active mixing of the medium and, as a consequence, maximum turbulence of the surrounding air. At the same time, it should be noted that, with TMO, the distribution of instability regions sometimes turns out to be different from the Ince–Strutt diagram, which significantly changes the picture of resonances [9,13,14,16].
For the first resonance, the amplitude of the wire’s deflection is at its maximum (cp. Figure 2), so that the low rate of outflow of hot air relative to the speed of the heater leads to the proliferation of the hot zone around it. The hot area around the wire grows to such a size that the mechanical oscillations occur inside this volume. Note that, with increasing frequency, the volume of the heated air zone increases much more than the heat transfer due to the movement of the wire. The wire oscillates in a volume that is proportional to the amplitude, , while the additional heat transfer due to the movement, , increases with increasing velocity V (see Equation (2)). For a harmonic oscillation of the type we thus have , and the ratio of heated volume to additional heat transfer becomes . For example, at frequencies , , and Hz, we obtain ratios of , , , and (see Figure 6b,d,e,g). With increasing amplitude, especially at the first resonance, more hot air is quickly pushed downwards by the moving wire before it can rise. However, the actual processes involving the buoyancy of heated air and the parallel or antiparallel movement of the wire are rather complicated, and our qualitative arguments cannot explain in detail complex phenomena involving turbulence.
It should be noted that, under certain conditions, the high-order harmonics of TMO could be generated (see Figure 6f). Higher harmonics appear in the form of several antinodes along a heated wire. For example, the deflection of the wire in Figure 6f differs from that in the other pictures, indicating a node on the left and an antinode on the right side (outside the display window). Their appearance is associated with changes in the vibrational parameters of the system (temperature difference, convection conditions, linear dimensions of the heater, wire tension, etc.). At the same time, the effect of higher harmonics on heat transfer remains to be ascertained.
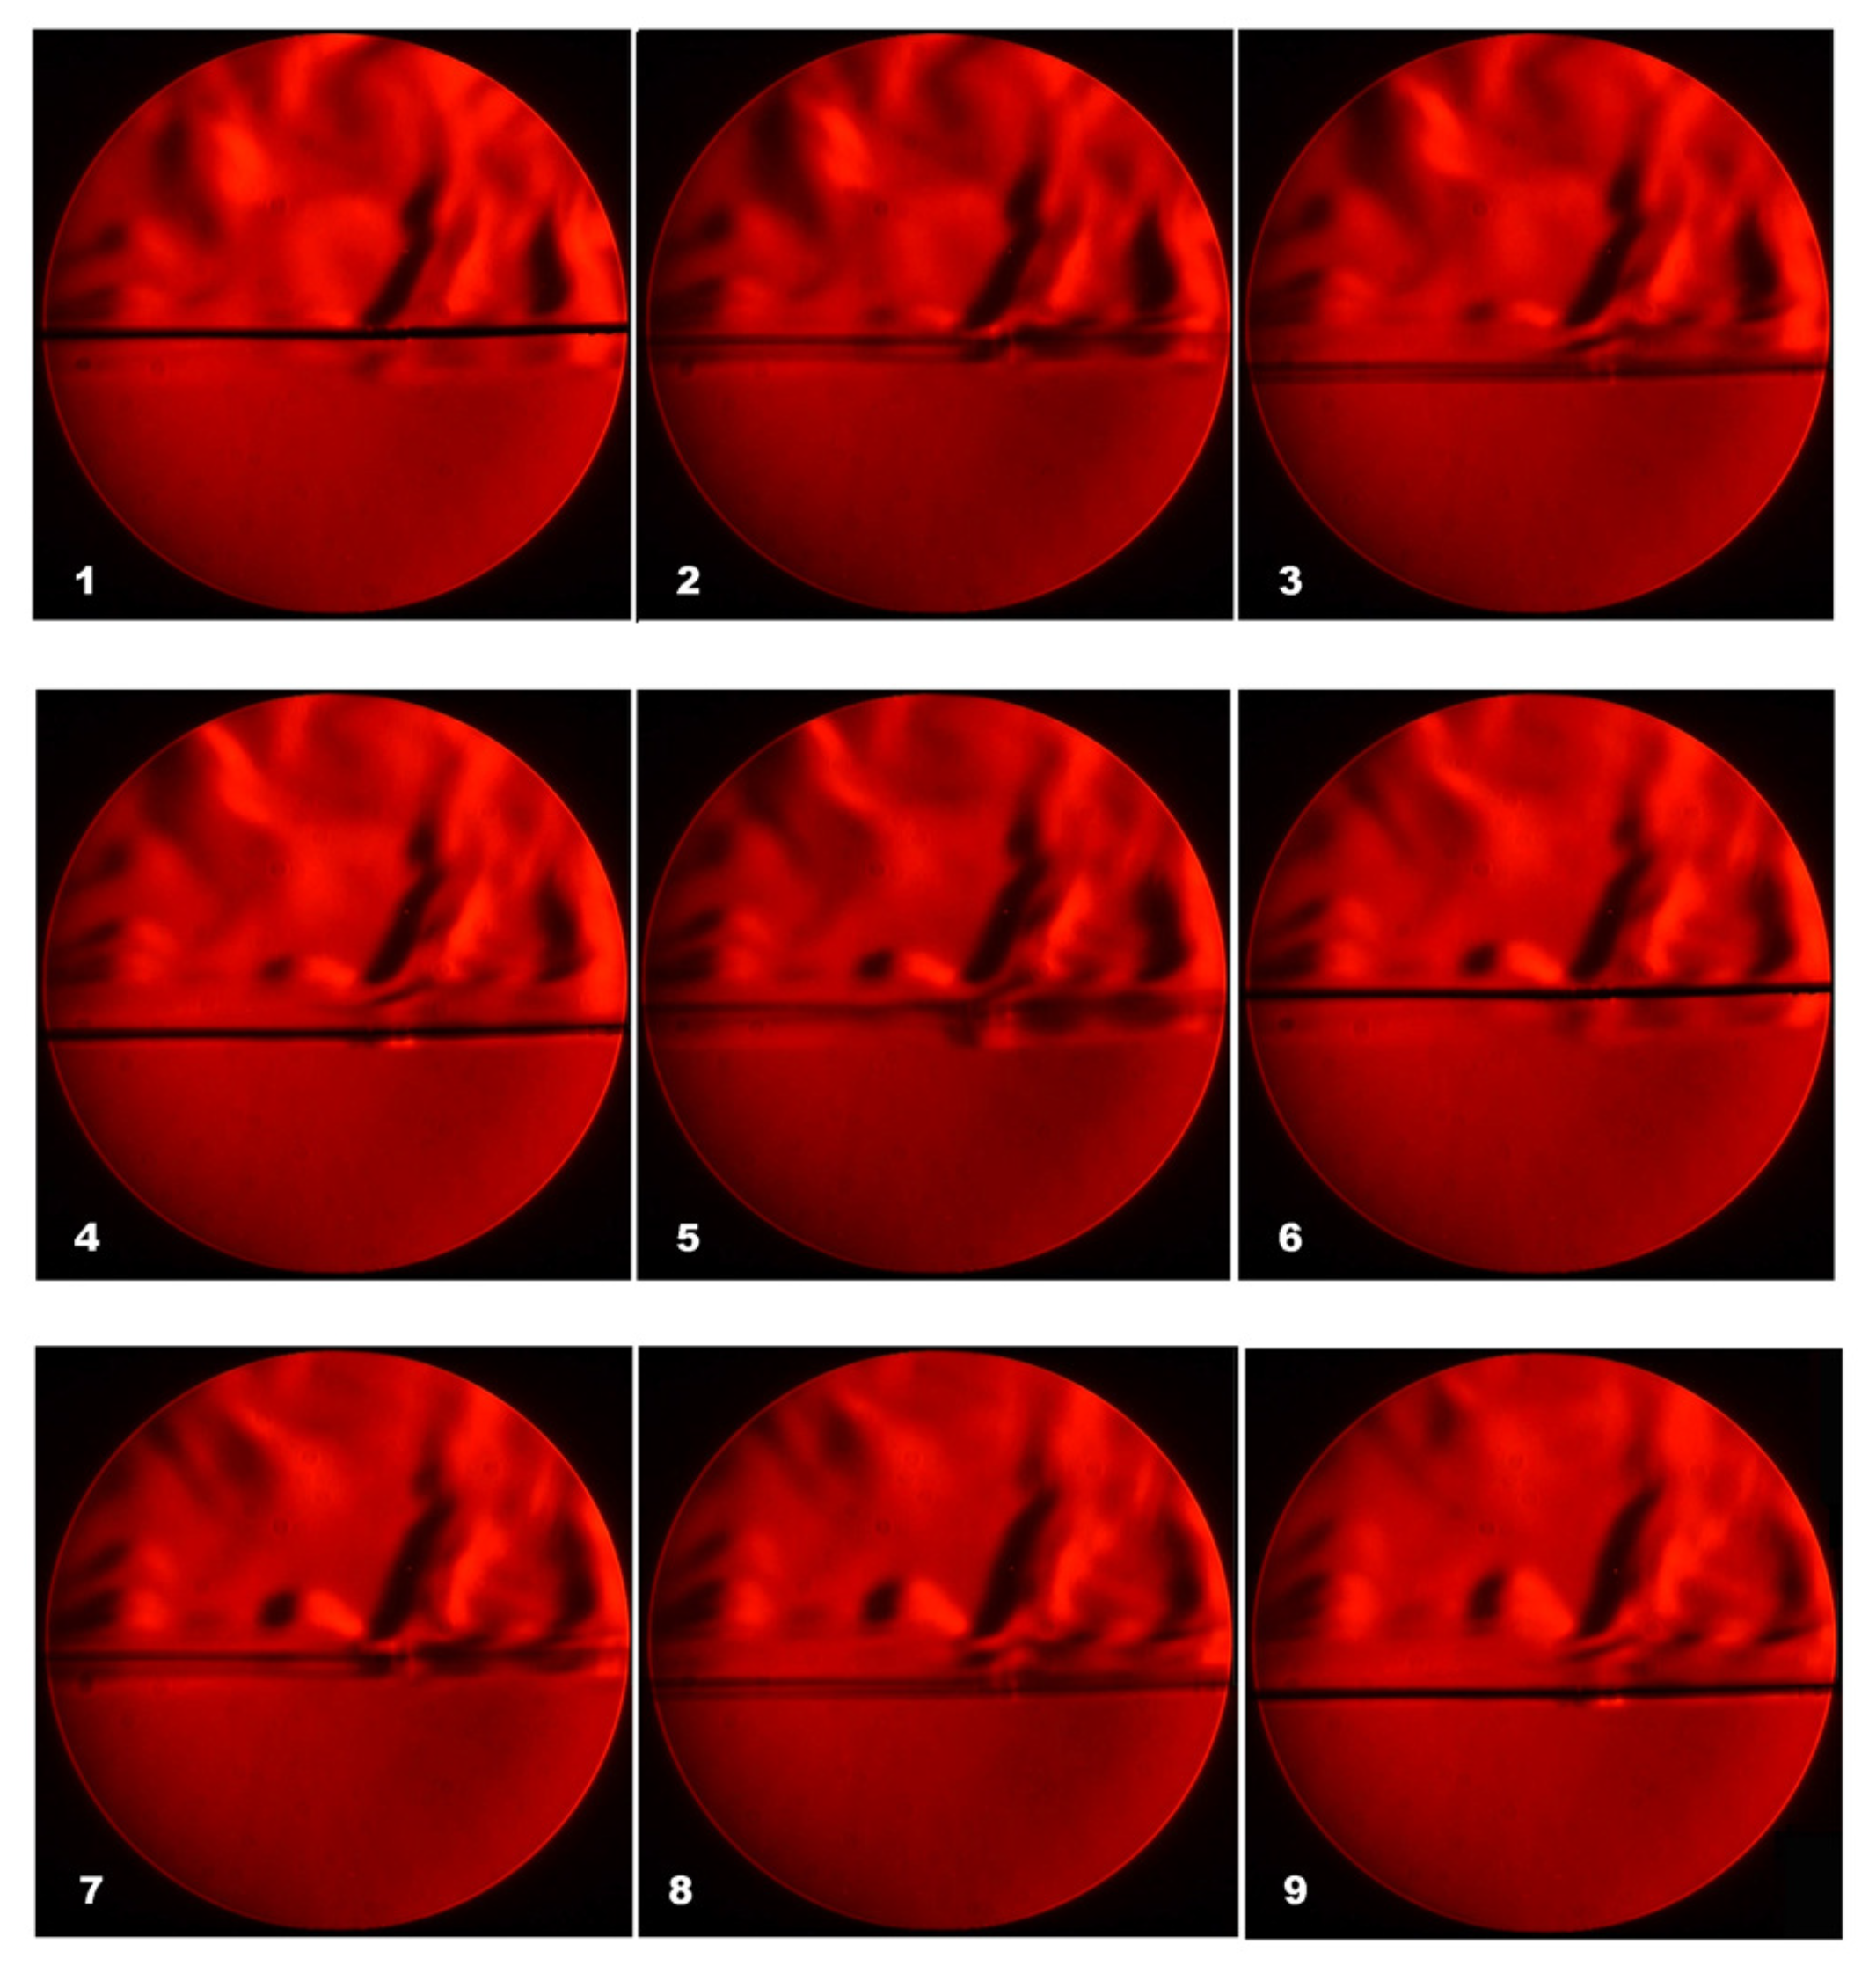
For higher temperature differences between wire and air, the turbulence seems to be stronger, but the pictures are similar (not shown). Finally, we present a time sequence of the oscillation near the 2nd resonance, showing the convective flow (Figure 7). During downward motion, the zone of hot air seems to detach from the wire; during upward motion, the wire moves in regions of hot air.
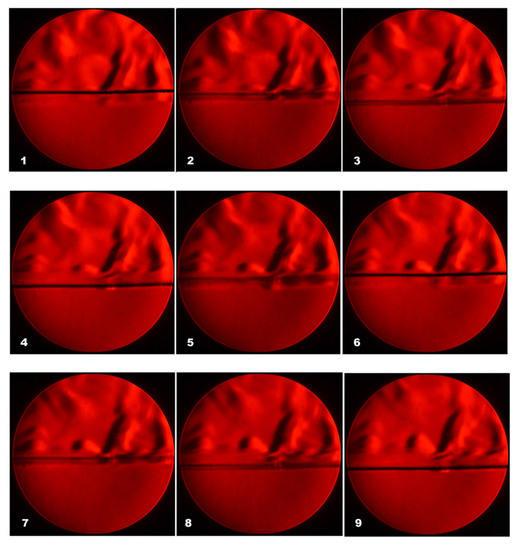
Figure 7.
Time-sequence of images at intervals of 40 ms showing the convection flow and the spatial position of the wire heater during TMO [(Cr20Ni80)-wire of thickness mm; pulsation of stress MPa; Hz, modulation frequency Hz; mm]. Subfigures 1–9 show two periods of the heater motion from its upper position (subfigures 1 and 6) to the lower position (subfigures 4 and 9).
4. Conclusions
The experimental set-up presented offers the possibility to study the physical processes during thermomechanical oscillations of thin heaters. In particular, we have demonstrated the visualization of convective heat transfer in and out of resonance using a rather simple set-up of high sensitivity. In the future, it will be interesting to study, e.g., whether there is a phase shift between mechanical and thermal oscillations.
Author Contributions
In our experimental work, the conceptualization was constructed by S.N. and R.P. For methodology, validation, formal analysis, and supervision S.N. was responsible. S.N. also wrote the review. The project administration, resources, software, and main editing were performed by R.P. The investigation and the data curation were made by R.P., D.G., and T.G. The visualization of the experiments was created by D.G.
Funding
This research received no external funding.
Conflicts of Interest
The authors declare no conflict of interest.
References
- Hauf, W.; Grigull, U.; Mayinger, F. Optische Meßverfahren der Wärme- und Stoffübertragung; Springer: Berlin/Heidelberg, Germany, 1991; ISBN 978-3-662-09125-8. [Google Scholar]
- Settles, G.S. Schlieren and Shadowgraph Techniques: Visualizing Phenomena in Transparent Media; Springer: Berlin/Heidelberg, Germany, 2001; ISBN 978-3-642-56640-0. [Google Scholar]
- Van Dyke, M. An Album of Fluid Motion; Parabolic Press Inc.: Stanford, CA, USA, 1982; ISBN1 0915760029. ISBN2 978-0915760022. [Google Scholar]
- Astashev, V.K.; Korendyasev, G.K. Thermomechanical Model of the Occurrence of Oscillations in Metal Cutting. J. Mach. Manuf. Reliab. 2012, 41, 189–193. [Google Scholar] [CrossRef]
- Gröber, H.; Erk, S.; Grigull, U. Die Grundgesetze der Wärmeübertragung; Springer: Berlin/Heidelberg, Germany; New York, NY, USA, 1988; ISBN1 3540029826. ISBN2 9783540029823. [Google Scholar]
- Reynolds, A.J. Turbulent Flows in Engineering; John Wiley: London, UK; New York, NY, USA, 1974; ISBN 0471717827. [Google Scholar]
- Mikheev, M.A.; Mikheeva, I.M. Fundamentals of Heat Transfer; Bastet Press: Moscow, Russia, 2010; ISBN 978-5-903178-20-9. [Google Scholar]
- Galitseiskii, B.M.; Ryzhev, Y.A.; Yakush, E.V. Thermal and Hydrodynamic Processes in Oscillating Flows; Mashinostroenie Press: Moscow, Russia, 1977. [Google Scholar]
- Nesis, E.; Nesis, S. Thermomechanical and Thermoacoustic Self-Excited Oscillations (Review). J. Eng. Phys. Thermophys. 1988, 55, 1178–1194. [Google Scholar] [CrossRef]
- Penner, D.; Duboshinskii, Y.; Duboshinskii, D.; Petrosov, V.; Porotnikov, A. Thermomechanical Oscillations. In Some Questions on the Excitation of Non-Damping Oscillations; Vladimir, V1; VSPI: Philadelphia, PA, USA, 1974; pp. 163–183. [Google Scholar]
- Nesis, S.; Kul’gin, A.A. Experimental Study of Thermomechanical Oscillations of a Cylindrical Heater in an Air Medium with Free Convection. J. Eng. Phys. Thermophys. 1979, 37, 1051–1053. [Google Scholar] [CrossRef]
- Nesis, S. Experimental Study of Temperature Oscillations in a Vibrating Spiral Heater. J. Eng. Phys. Thermophys. 1983, 44, 197–199. [Google Scholar] [CrossRef]
- Nesis, S. Temperature Oscillations and Their Interactions with Oscillations of a Different Physical Nature. J. Eng. Phys. Thermophys. 1998, 71, 807–810. [Google Scholar] [CrossRef]
- Nesis, E.; Borisov, E.A. Contribution to the Theory of Parametric Excitation of Thermomechanical Oscillations. J. Eng. Phys. Thermophys. 1991, 63, 884–888. [Google Scholar] [CrossRef]
- Nesis, S.; Pelster, R. Zur Demonstration und ErläUterung Thermomechanischer Schwingungen, Didaktik der Physik, Bochum 2009; Lehmanns Media: Berlin, Germany, 2009; ISBN 978-86541-371-0. [Google Scholar]
- Nesis, S.; Monz, C.; Pelster, R. Zur Anregung Thermomechanischer Schwingungen: Wärmekonvektion, Wärmeübertragung und Modulationsformen, Didaktik der Physik, Hannover 2010; Lehmanns Media: Berlin, Germany, 2010; ISSN 2191-379X. [Google Scholar]
- Magnus, K. Schwingungen; Teubner: Stuttgart, Germany, 1961; ISBN 978-3-519-22302-3. [Google Scholar]
- Landau, L.; Lifshits, I. Theoretical Physics Mechanics, 3rd ed.; Nauka: Moscow, Russia, 1993; ISBN 0-7506-2896-0. [Google Scholar]
- Strutt, M.J.O. Lamésche-Mathieusche-und Verwandte Funktionen in Physik und Technik; Springer: Berlin/Heidelberg, Germany, 1932; ISBN 978-3-642-92306-7. [Google Scholar]
- McLachlan, N.W. Theory and Application of Mathieu Functions; Reprint Edition; Dover Publications Inc.: New York, NY, USA, 1964. [Google Scholar]


© 2018 by the authors. Licensee MDPI, Basel, Switzerland. This article is an open access article distributed under the terms and conditions of the Creative Commons Attribution (CC BY) license (http://creativecommons.org/licenses/by/4.0/).