Article

The Influence of the Installation Angle of a Blade’s Low-Pressure Edge on the Cavitation Performance of Francis Pump-Turbines

1
Special Pump System Technology National and Local Joint Engineering Research Center, Xi’an Aeronautical University, 259 West Second Ring Road, Xi’an 710077, China
2
AECC Xi’an Engine Control Co., Ltd., Xi’an 710077, China
*
Author to whom correspondence should be addressed.
Fluids 2025, 10(9), 248; https://doi.org/10.3390/fluids10090248
Submission received: 19 July 2025 / Revised: 4 September 2025 / Accepted: 18 September 2025 / Published: 22 September 2025

Abstract

The low-pressure edge of a pump-turbine runner blade is more prone to cavitation than other parts. The installation angle of the blade’s low-pressure edge is one of the key parameters affecting the cavitation performance of the pump-turbine. Based on the installation angle of the blade’s low-pressure edge obtained by the principle of normal outflow of the turbine runner, two other installation angles of the low-pressure edge are constructed by increasing the installation angle of the low-pressure edge toward the band direction. Three types of blades are designed based on the parametric design program of the pump-turbine runner. The Zwart cavitation model is adopted to carry out full-channel steady numerical simulations for the three runners. The efficiencies and internal flow fields of the draft tube under turbine operating conditions are compared. The cavitation characteristics in pump mode, the distribution of the turbulent flow field, and the pressure distribution on the blade surface are analyzed. The influence laws of the installation angle of the blade’s low-pressure edge on pump-turbine performance is summarized. A design method for anti-cavitation of Francis pump-turbine runners has been explored. The results show that the LP1 blade can achieve normal outflow under the turbine’s rated operating condition, but due to the large inflow attack angle under pump operating conditions, the cavitation performance in pump mode is very poor. By increasing the installation angle of the blade’s low-pressure edge toward the band direction, the efficiencies and cavitation performances of the pump mode can be improved. The LP3 blade reduces the inflow attack angle while optimizing the pressure distribution on the blade’s suction surface, thereby reducing the superimposed effect of two phenomena under large-discharge pump operating conditions with low cavitation numbers: flow separations on the pressure surface caused by inflow impact, and flow separations on the suction surface of adjacent blades caused by cavitation. As a result, the cavitation performance of the LP3 blade is significantly better than that of the LP1 and LP2 blades. The proposed anti-cavitation design method is simple and effective and can be applied to the research and modification design of Francis pump-turbine runners.

1. Introduction

Cavitation under pump operating conditions is one of the problems that affects the energy characteristics and safe and stable operation of the Francis pump-turbine [1]. Cavitation results in lower efficiency and head of the pump-turbine. The unsteady flow and pressure pulsation caused by cavitation make the flow control of the hydraulic system difficult [2] and cause vibrations in surrounding structures; the vibration frequency is several times higher than the mechanical rotation frequency, and the wide-band shock waves generated by cavitation risk resonating with other components [3,4]. Cavitation near the solid wall surface collapses, producing high pressure and high temperature, which act on the material, leading to cavitation damage. Once cavitation damage occurs, erosion spots will accelerate unstable flow and re-cavitation, resulting in a shortened maintenance cycle of the unit [5]. Therefore, studying the cavitation flow characteristics and anti-cavitation measures in pump-turbines has far-reaching scientific significance and important engineering value.
With the rapid development of experimental measurement technology for cavitation, various studies on the cavitation phenomenon of pump-turbines in different power stations have been conducted, and the cavitation positions, cavitation patterns, and pressure pulsation characteristics of the pump-turbine under different operating conditions were obtained [6,7,8,9,10]. CFD numerical simulation technology has been used to demonstrate the inception, development, and collapse of internal cavitation in pump-turbines under pump mode, which can be mutually confirmed with the relevant conclusions of experiments [11,12]. Furthermore, by employing advanced methods to analyze the numerical simulation results, many phenomena that are difficult to observe in experiments were discovered. Yanzhao Wu [13] and others used the dynamic mode decomposition (DMD) method to investigate the incipient cavitation and critical cavitation of a model pump-turbine. Cong Wang [14] proposed a novel mathematical model, namely the entropy production diagnostic model with phase transition (EPDMS, an extension of EPDM), which is practical for analyzing irreversible losses in cavitation flow in hydraulic machinery by including mass transfer and slip velocity. Jingwei Cao [15] developed a procedure to map cavities from computational fluid dynamics (CFD) simulations to finite element models, which can reveal the dynamic behavior of a pump-turbine runner in cavitating flow from the perspective of fluid–structure interaction. Li Qifei [16,17] analyzed the turbulent kinetic energy distribution of the intermediate flow surface and the distribution law of cavitation bubbles on the blades under different cavitation coefficients, and explored the interrelationship between the distribution region of cavitation bubbles and the vortex in the inner blade channel of the runner. These studies provide powerful methods and conclusions for cavitation research on pump-turbines.
Meanwhile, some scholars consider the cavitation effect to study the instability problem in pump-turbines. Deyou Li [18] and others adopted large eddy simulation considering the cavitation effect to reveal the influence mechanism of cavitation on the pressure fluctuation in the hump region of the pump-turbine. Guocheng Lu [19] studied the influence of cavitation on the slope of the operating condition performance curve of low-specific-speed pump-turbines based on experimental data and found that the change in the cavitation coefficient had a significant impact on the occurrence of rotational stalls. Xiaolong Fu [20] investigated the cavitation characteristics of pump-turbines and the time-domain characteristics of pressure pulsation during the power-off transition process of the pump mode using the three-dimensional CFD method and the one-dimensional and three-dimensional coupling method. Guo Junxun [21] conducted a numerical simulation of the full flow system load rejection transition process of the prototype pump-turbine based on the multiphase flow cavitation model. The research found that the cavitation phenomena during the load rejection process of the pumped storage unit mainly include airfoil cavitation on the suction surface of blades near the top cover, and short-term, high-frequency cavitation with cavity development and collapse. Shang Chaoying [22] found that the formation of the “S” characteristic is related to high-speed recirculation and flow separation at the runner inlet. As cavitation occurs, more vortices will be formed in the flow field, increasing the instability of the flow. Lin Song [23] found that the abnormal increase in cavitation at the operating point of the hump characteristic causes irregular changes in hydraulic losses. The transition of the separation vortex near the band at the runner inlet and in the double-row cascade is related to the formation of the hump phenomenon. These studies indicate that cavitation in pump-turbines is closely related to various hydraulic instability problems such as unstable “S” characteristics, unstable hump regions, rotational stall, and load loss of pump-turbines. The mechanism by which cavitation induces hydraulic instability and methods for its suppression require in-depth research.
At present, cavitation suppression methods for pump-turbine runners can be classified into two aspects. On one hand, from the material perspective, coatings are applied to areas prone to cavitation [24], or cavitation and erosion areas are repaired by welding or grinding during maintenance. This approach is a remedial measure taken after the fact and does not fundamentally solve the cavitation problem. On the other hand, from a design perspective, advanced numerical simulation methods are used to predict the occurrence, development, and vibration characteristics induced by cavitation in the runner. By changing the geometric features of the runner, the occurrence of cavitation flow can be controlled, thereby improving the cavitation performance of the pump-turbine. Li Yuanyu [25], in response to the cavitation defects in the pump-turbine runner of Shahe Pumped Storage Power Station, carried out a modified and optimized design of the high-pressure and low-pressure edges of the runner blades based on the analysis of cavitation causes. The optimized runner is suitable for the renovation characteristics of Shahe Power Station and has excellent cavitation performance.
According to the research conducted by Zanao Hu [26] on the influence of runner geometric parameters on pump-turbine runner cavitation performance, the design of the runner blades’ low-pressure edge is the key factor affecting runner cavitation. Parametric design methods for runner blades indicate that the key parameters characterizing the runner blades’ low-pressure edge include meridional position, thickness distribution, and installation angle distribution. Therefore, investigating the influence of these three parameters on the runner’s cavitation performance can help identify design methods to improve the runner’s cavitation resistance. Based on this thinking, Ning Nan [27] designed short blades with different low-pressure edge positions considering the runner’s structural characteristics and investigated the influence of short blades’ low-pressure edge position on the cavitation performance of high-head pump-turbines with long and short blades. Ran Tao [28] and Di Zhu [29] studied the influence of blade airfoil leading-edge geometric characteristics on pump-turbine primary cavitation by combining numerical simulation and experiments. Through redesigning the blade profile, the cavitation performance of reversible pump-turbines under pump conditions was improved. Ruan Hui [30,31] investigated the influence of blade low-pressure edge meridional position and thickness distribution on high-head pump-turbine cavitation performance and summarized the influence laws. These studies focused on the influence of low-pressure edge position and thickness distribution on cavitation. However, there have been no reports on the effect of low-pressure edge installation angles on the blades’ cavitation performance.
When designing a turbine runner, it is required that the installation angle of the blade’s low-pressure edge should comply with the principle of normal outflow. When designing a pump runner, it is required that the installation angle of the blade’s low-pressure edge should comply with the principle of no inflow impact. In most cases, these two installation angles of the blade’s low-pressure edge are not the same, which leads to a situation where a single installation angle of the blade’s low-pressure edge cannot simultaneously meet the optimal design requirements of both turbine mode and pump mode. Moreover, the energy characteristics of the turbine mode and the cavitation characteristics of the pump mode are sometimes contradictory. How to determine the installation angle of the blade’s low-pressure edge to balance these multiple contradictions depends entirely on the experience of designers, and no systematic method has been established. Therefore, this paper aims to investigate the influence of the installation angles of the blade’s low-pressure edge on the energy characteristics and cavitation performance of the pump-turbine, summarize a feasible method for calculating the installation angles of the blade’s low-pressure edge, and effectively improve the runner’s cavitation performance while meeting the pump-turbine’s energy characteristics.
Therefore, based on the pump-turbine runner design program in this paper, three blades with different low-pressure edge installation angles, designed according to different principles, are developed. The Zwart cavitation model is used to perform steady-state numerical simulations of the full flow channel for the three runners under multiple operating conditions. The efficiency and flow characteristics under turbine operating conditions are compared. The cavitation characteristics of runners with the three blade types under pump operating conditions (optimal discharge and large discharge) are analyzed quantitatively. The positions and intensity of cavitation occurrence for different runner blades are analyzed qualitatively, and the influence of low-pressure edge installation angles on cavitation and the runner’s internal flow field is explored. This research provides guidance for the safe and stable operation of pump-turbines and runner design and offers technical support for the development of large-capacity pumped storage power stations.

2. Methodology

2.1. Blade Design

This paper takes the pump-turbine of a 200 m head pumped storage power station as the research object. The basic parameters of this pump-turbine are as follows: the diameter of the runner’s low-pressure side (D2) = 2.2912 m; the diameter of the runner’s high-pressure side (D1) = 3.58 m; the installation elevation is 260 m, and the suction height is −55 m. The specific operating parameters of the pump-turbine are shown in Table 1.
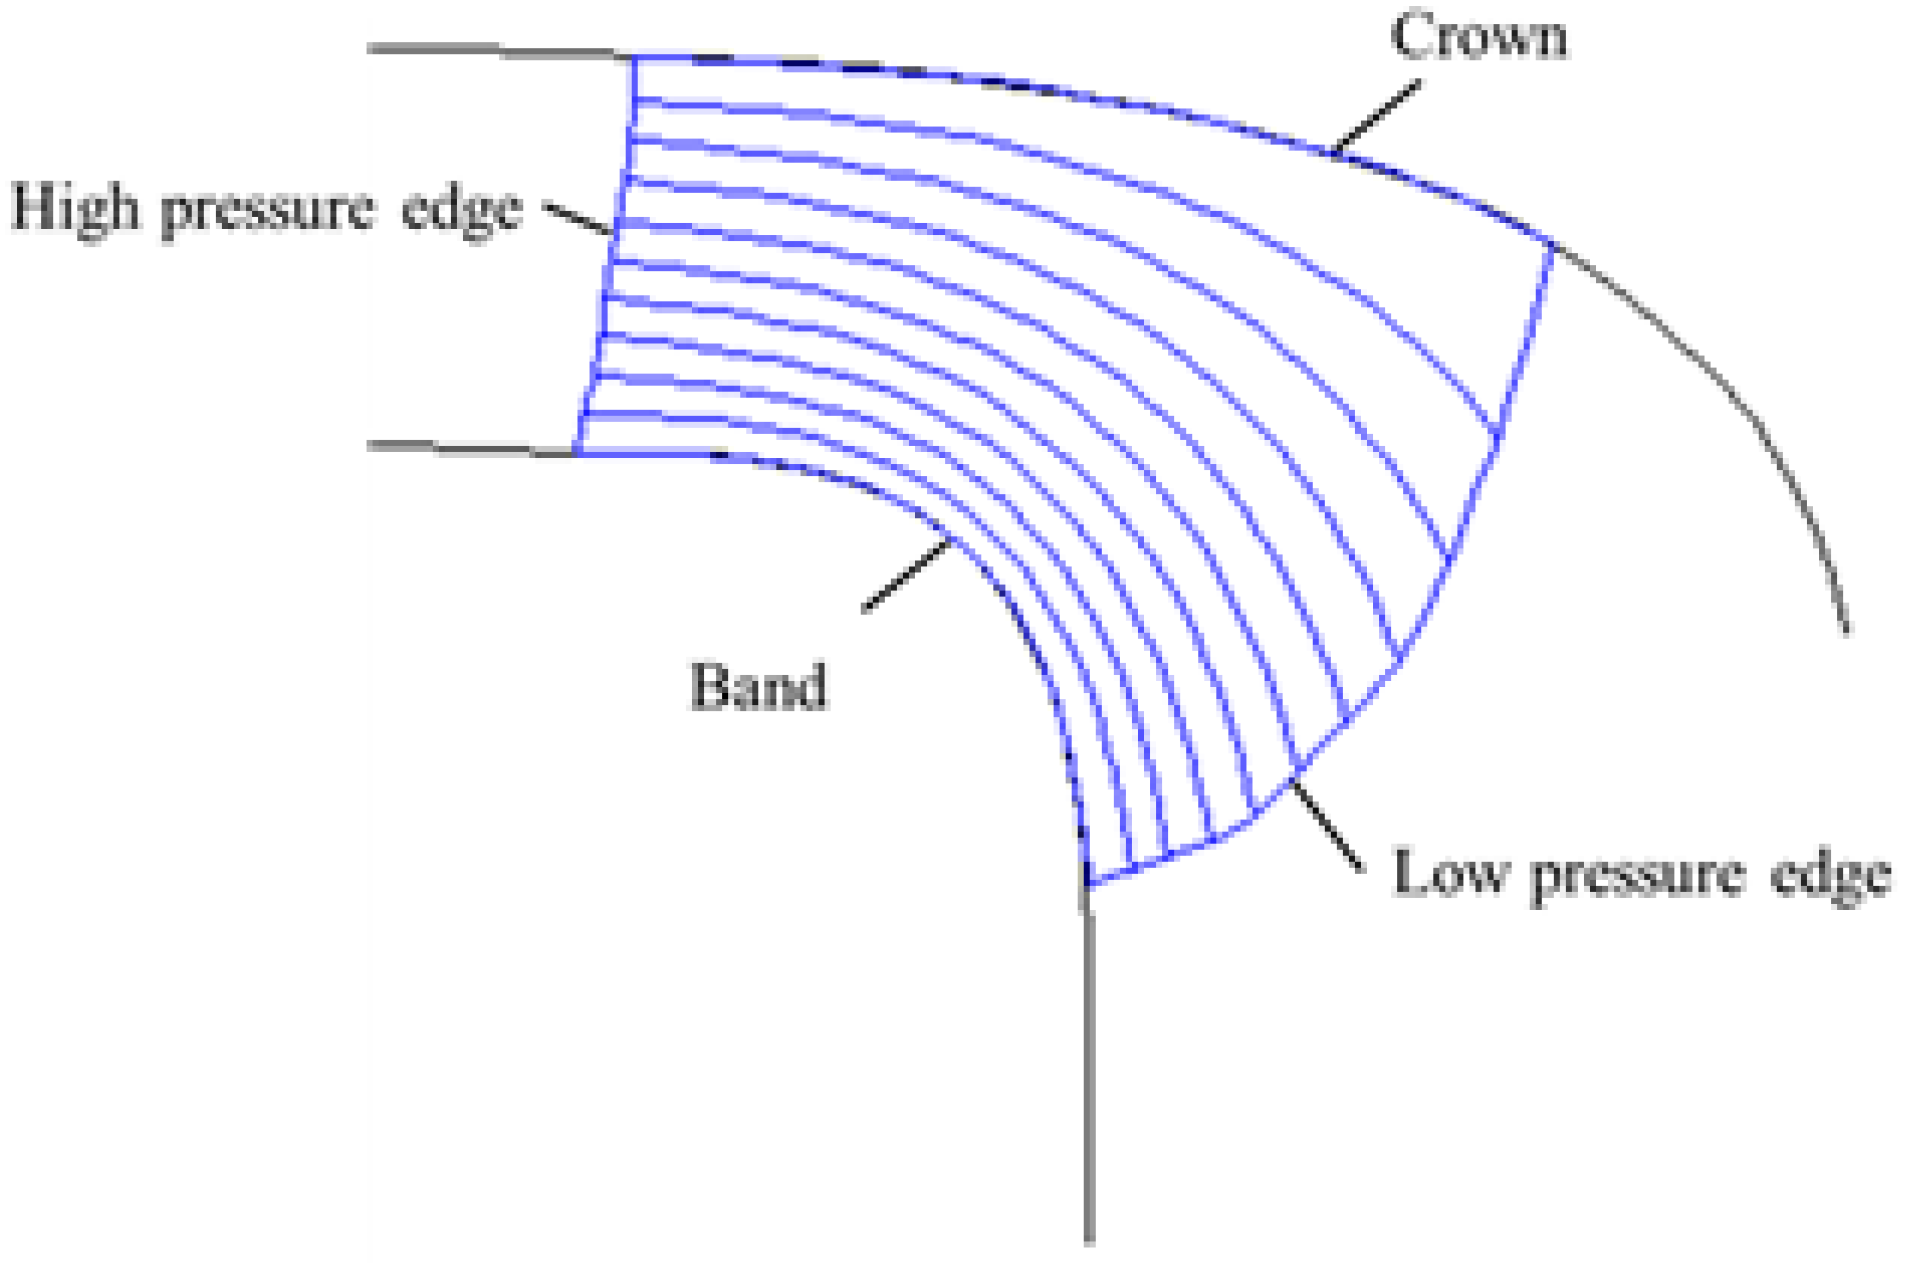
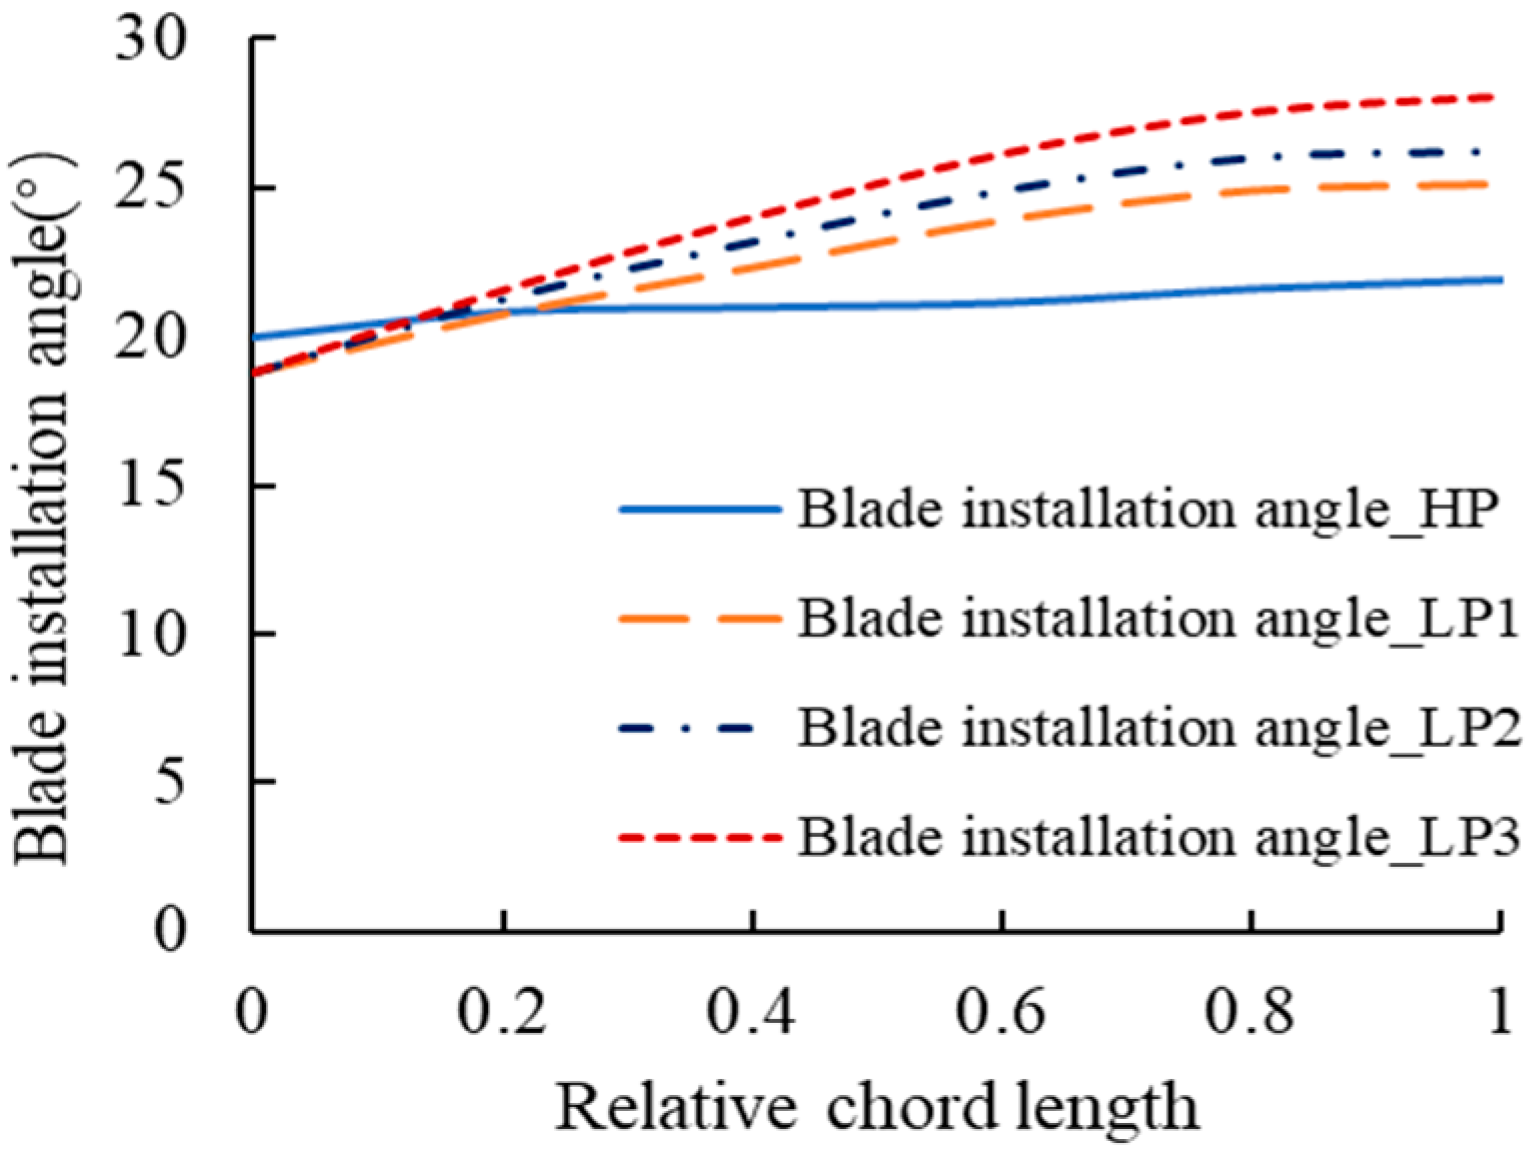
The design of the runner blades in this paper is based on the pump-turbine runner blade design platform V1.0. Figure 1 shows the design flowchart of the pump-turbine runner. Based on the blade profile distribution on the meridional plane (shown in Figure 2), and by ensuring consistency in the high-pressure edge installation angles, the blade installation angle distribution control coefficient, thickness distribution, and number of blades, the high-pressure edge installation angle distributions and low-pressure edge installation angle distributions (shown in Figure 3) were specified, and three runners with different low-pressure edge installation angles were designed.
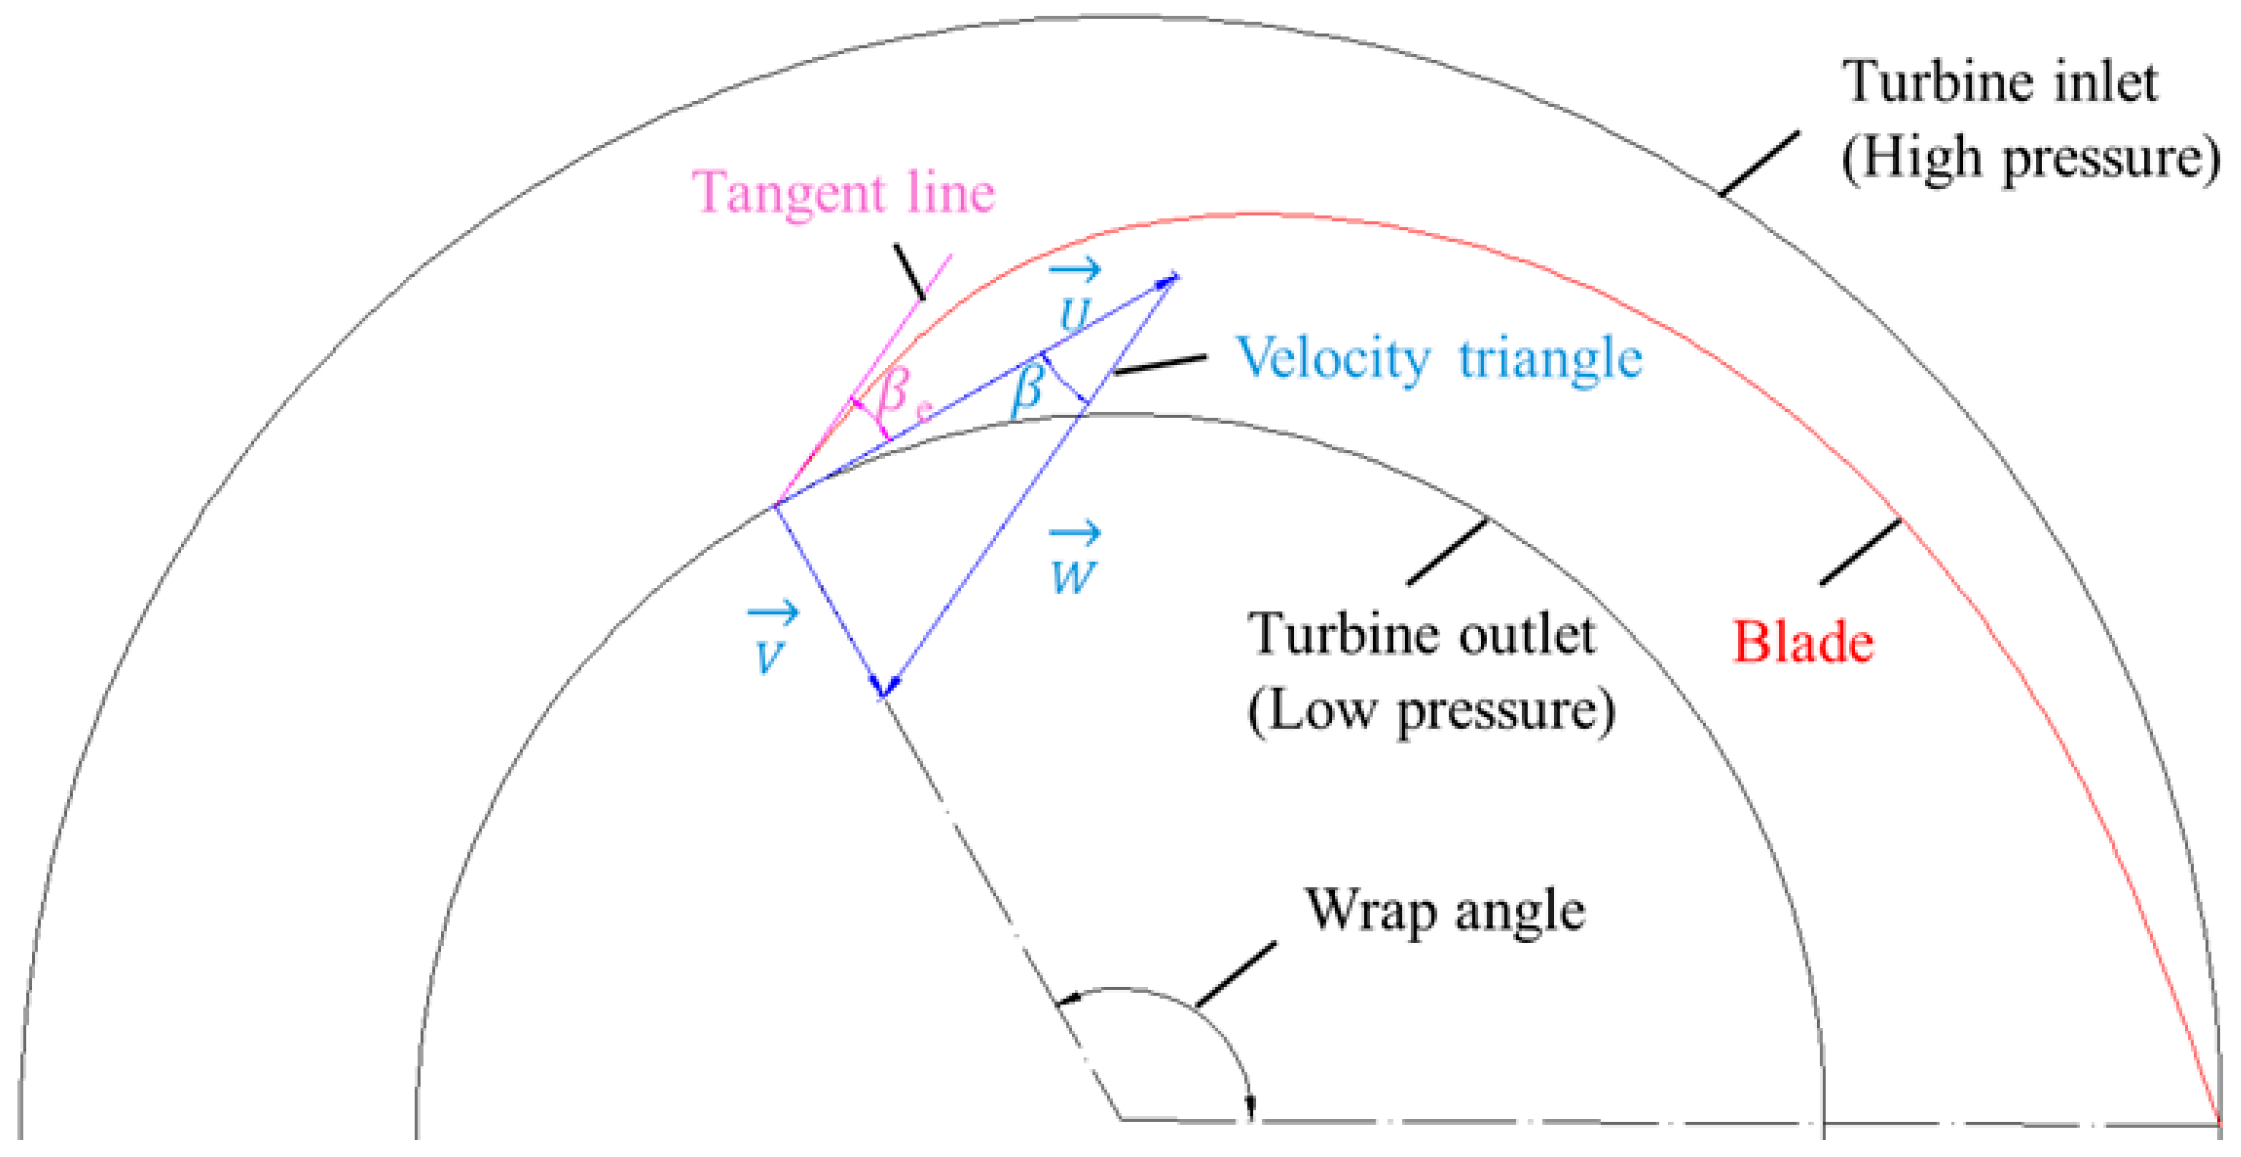
In Figure 3, the horizontal coordinate represents the relative lengths of each point from the crown to the band. A position with a relative length of 0 indicates the crown, and a position with a relative length of 1 indicates the band. The low-pressure edge 1 (LP1) installation angle distribution is calculated based on the normal outflow design principle of the turbine under the rated operating condition; that is, the LP1 installation angle is equal to the water flow angle ( β e = β ), as shown in Figure 4, and the water flow angle is derived based on the velocity triangle relationship. The low-pressure edge installation angle at the crown is 18.79° and gradually changes toward the band. The LP1 installation angle at the band is 25.12°.
Because the band is more prone to cavitation than the crown of the blade’s low-pressure edge, the installation angle of the low-pressure edge at the crown is kept consistent. The installation angle of low-pressure edge 2 (LP2) at the band is calculated based on the design principle of no-impact inflow for the pump under design operating conditions. Since the pump discharge under design conditions is greater than the turbine discharge under rated operating conditions, the LP2 installation angle at the band is greater than that of LP1 at the band. The LP2 installation angle at the band is 26.22°, which is an increase of 1.1° compared to LP1. To reduce the impact angle under large-discharge conditions for the pump, the installation angle of low-pressure edge 3 (LP3) at the band is increased by 1.8° compared to that of LP2 at the band, with the LP3 installation angle at the band being 28.02°. After determining the low-pressure edge installation angles at the crown and band, the installation angles of the middle section smoothly transition from the crown to the band, as shown in Figure 3.
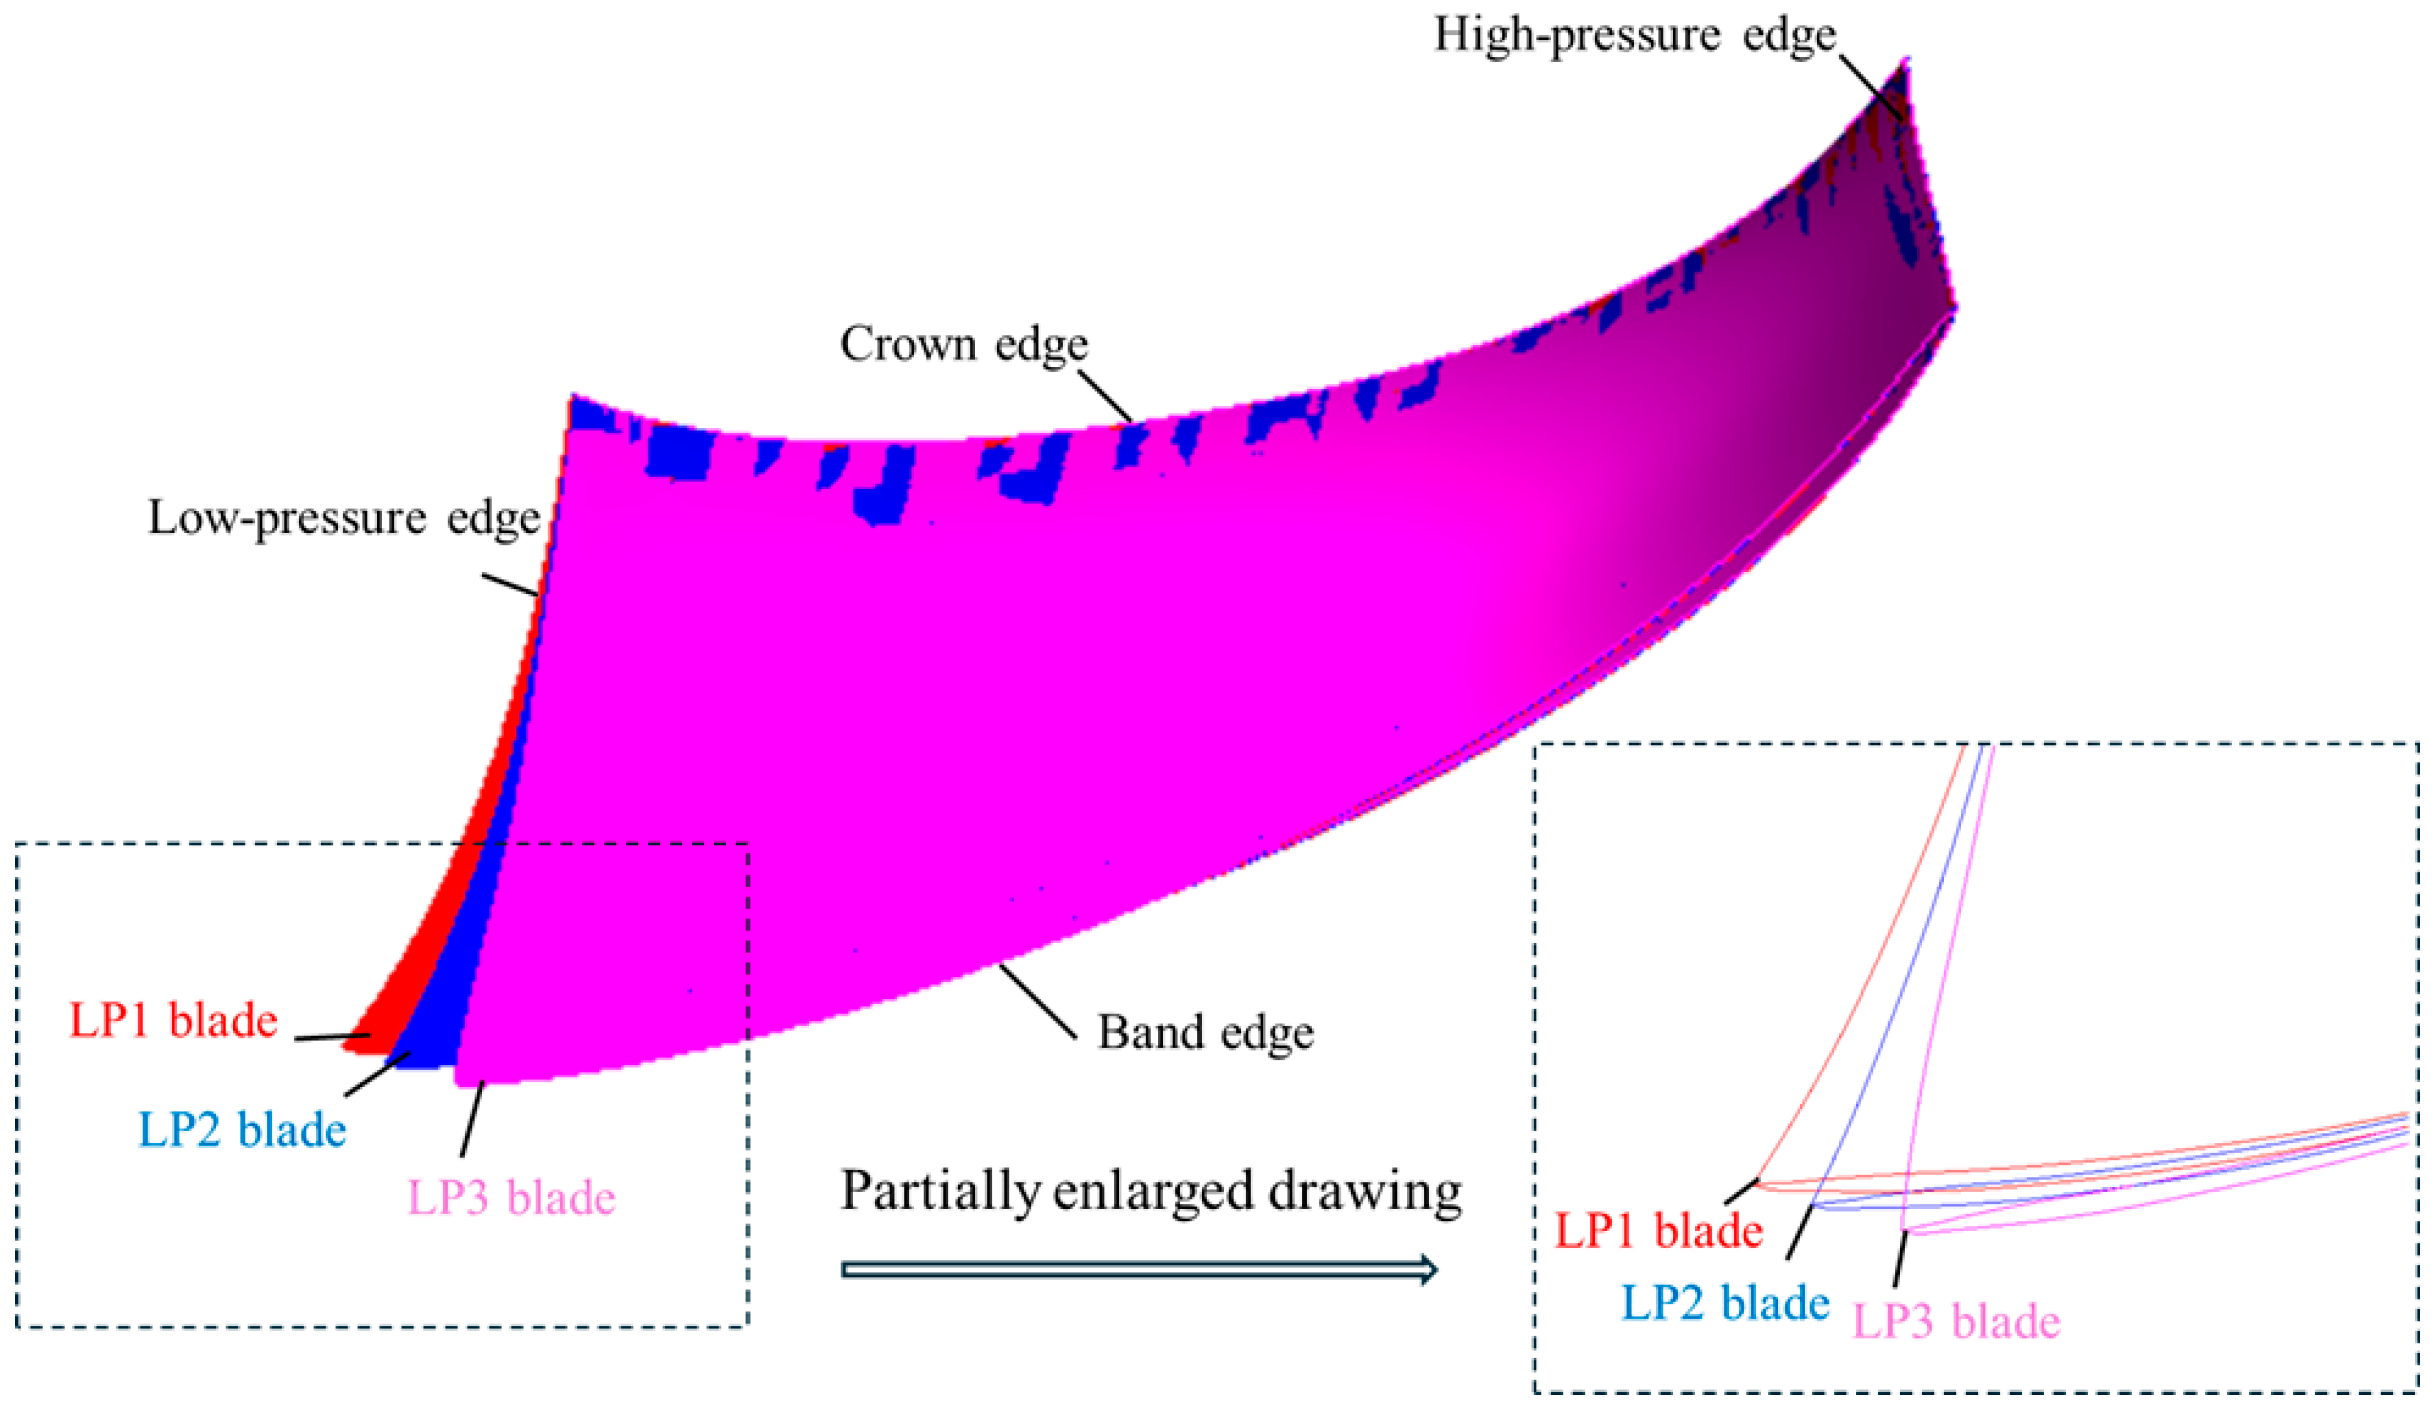
Figure 5 shows the geometric comparison of the blades designed based on three low-pressure edge installation angles. For clarity, the three types of blades are named LP1 blade, LP2 blade, and LP3 blade. The cross-sectional profiles of the three blades at the crown are consistent, with a wrap angle of 115°. The cross-sectional profiles of the band vary significantly. The wrap angle of the LP1 blade at the band is 119.46°, which is 4.46° larger than that at the crown. The wrap angle of the LP2 blade at the band is 115.03°, which is close to that of the crown profile; the low-pressure edge of the LP2 blade is basically on the same meridional plane. The wrap angle of the LP3 blade at the band is 110.38°, which is 4.62° smaller than that at the crown.

2.2. Numerical Schemes and Boundary Conditions

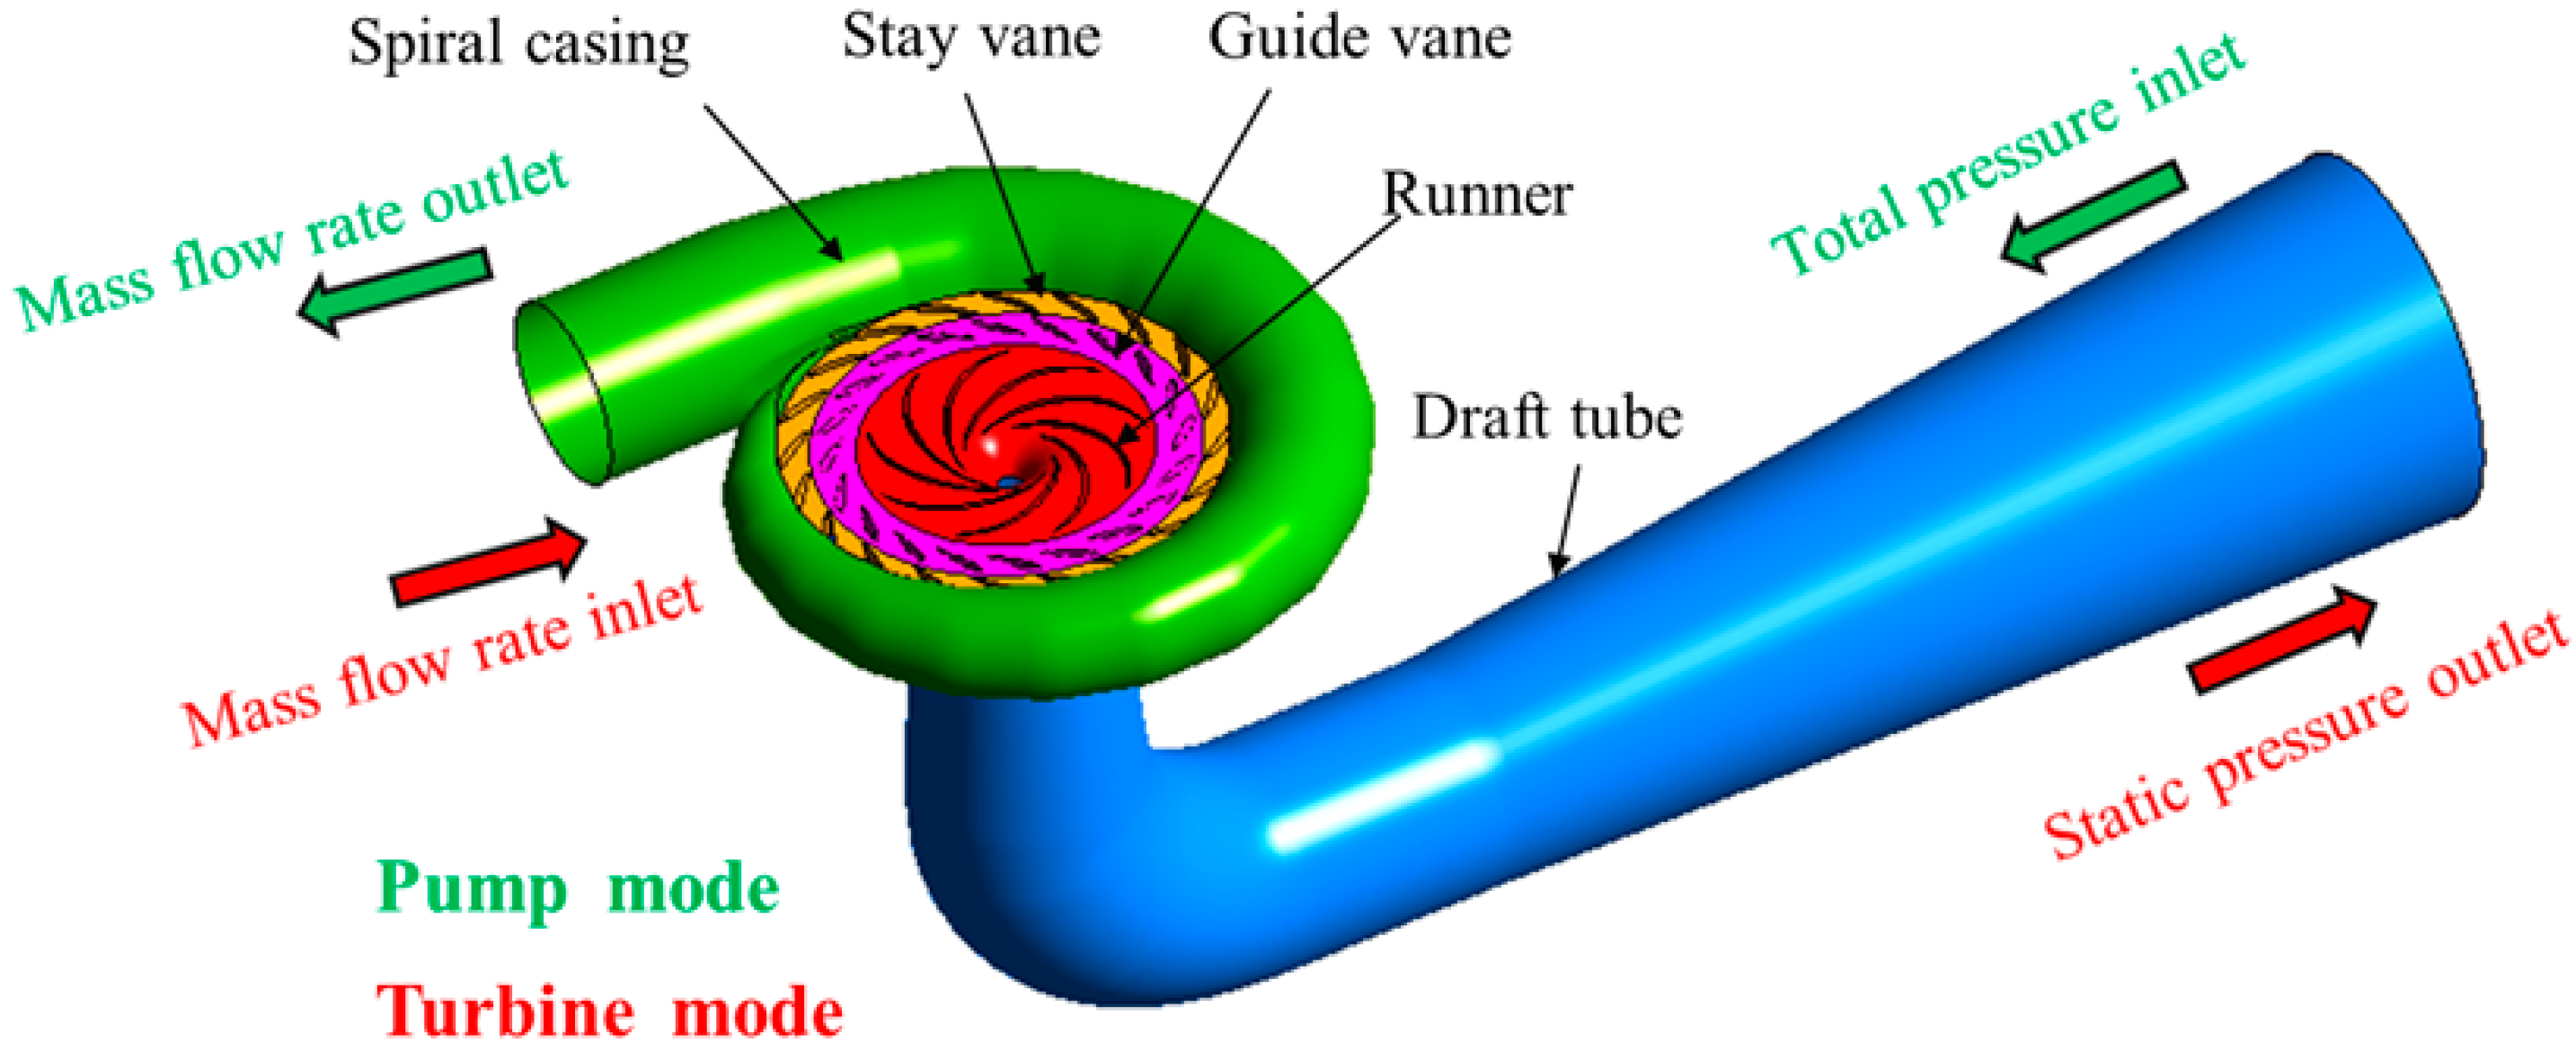
Numerical calculations were performed on the entire flow channel region, including the spiral casing, stay vanes, guide vanes, runner, and draft tube, as shown in Figure 6. The boundary conditions for turbine mode are as follows: the mass flow rate is set at the spiral casing inlet, with the velocity direction perpendicular to the inlet section; the relative static pressure at the draft tube outlet is set to 0 kPa. The boundary conditions for pump mode are as follows: total pressure is set at the draft tube inlet, and mass flow rate is set at the spiral casing outlet. The wall condition is a no-slip boundary. The general grid interface (GGI) is applied to the interfaces between the spiral casing and stay vanes, and between stay vanes and guide vanes; the frozen rotor interface is applied to runner-related interfaces (guide vane-runner and runner-draft tube).
The numerical calculation of the internal flow field in the pump-turbine is based on the continuity equation and the momentum conservation equation (Navier–Stokes) for a constant-temperature, compressible Newtonian fluid. The RANS equation is obtained by Reynolds-averaging the Navier–Stokes equation. The Reynolds stress in the RANS equation is estimated using the eddy viscosity model (by introducing the eddy viscosity coefficient). The SST k-ω turbulence model is used to solve for the eddy viscosity coefficient, thereby closing the governing equations for the internal flow of the pump-turbine. The mathematical expressions are as follows:
t ( ρ k ) + x j ( ρ u j k ) x j ( ( μ + σ k 0 μ t ) k x j ) = min ( μ t P k , 10 β * ρ k ω ) β * ρ k ω
t ( ρ ω ) + x j ( ρ u j ω ) x j ( ( μ + σ ω 0 μ t ) ω x j )   = α 0 ρ P k β 0 ρ ω 2 + 2 ρ σ ω 2 ( 1 F 1 ) ω k x i ω x i
where
P k = u i x j ( u i x j + u j x i ) ,   F 1 = tanh ( arg 1 4 ) ,   arg 1 = min ( arg 2 , 4 ρ σ ω 2 k C D k ω d 2 )
arg 2 = max ( 2 k β * ω d , 500 μ ρ d 2 ω )   ,   C D k ω = max ( 2 ρ σ ω 2 ω k x i ω x i , 1 0 10 )
and where d is the distance from the wall, and the constants with subscript 0 are computed by blending the corresponding constants from the k-ω model with subscript 1 and from the k-ε model with subscript 2 via   α 0 = α 1 F 1 + α 2 ( 1 F 1 ) , and β = 0.090 ,   α 1 = 0.5532 ,   β 1 = 0.0750 ,   σ k 1 = 0.850 , σ ω 1 = 0.500 ,   α 2 = 0.4404 , β 2 = 0.0828 , σ k 2 = 1.000 , σ ω 2 = 0.856 .
μt is defined as follows:
μ t = a 1 k ( ρ v + ( 1 α v ) 10 ( ρ l ρ v ) ) max ( a 1 ω , F 2 P k )
where a 1 = 0.31 ,   F 2 = tan h ( arg 2 ) .
For the mixture fluid of liquid and vapor, the homogeneous equilibrium modeling approach is adopted, which assumes that vapor is evenly dispersed in a finite volume of liquid, and hence velocity and pressure are equal between the two phases inside each finite volume. The assumption enables us to treat the mixture fluid as a single pseudo-fluid with variable fluid properties corresponding to the composition of the two phases. The density ρ and viscosity μ of the mixture fluid are averaged on a volume fraction basis, as in the volume-of-fluid method.
ρ = α v ρ v + ( 1 α v ) ρ l μ = α v μ v + ( 1 α v ) μ l
where αν is the vapor volume fraction, and the subscripts v and l indicate vapor and liquid, respectively.
The continuity equation for the vapor phase contains the mass transfer rate m ˙ per unit volume from the vapor to the liquid as a sink term, as follows:
t α v ρ v + x j α v ρ v u j = m ˙
The cavitation model proposed by Zwart et al. uses Equation (5) as a vapor transport equation. The direct proportionality of m ˙ to the volume fraction of liquid for evaporation is added based on the physical reasoning that the nucleation-site density for evaporation must decrease accordingly as αν increases. The nucleation-site volume fraction γ n u c and the nucleation-site radius RB are constants. m ˙ is defined by
m ˙ = C e 3 γ n u c ρ v R B 2 3 P v P ρ l 1 α v 0                   P < P v
m ˙ = C c 3 ρ v R B 2 3 P P v ρ l α v 0                       P   >   P v                  
The finite volume method was used for the discretization of the governing equation, in which the convection term was discretized using a first-order upwind difference scheme and the diffusion term using a central difference scheme. The velocity–pressure coupling problem in the momentum equation was solved using the SIMPLEC algorithm.

2.3. Grid Generation and Independence Validation

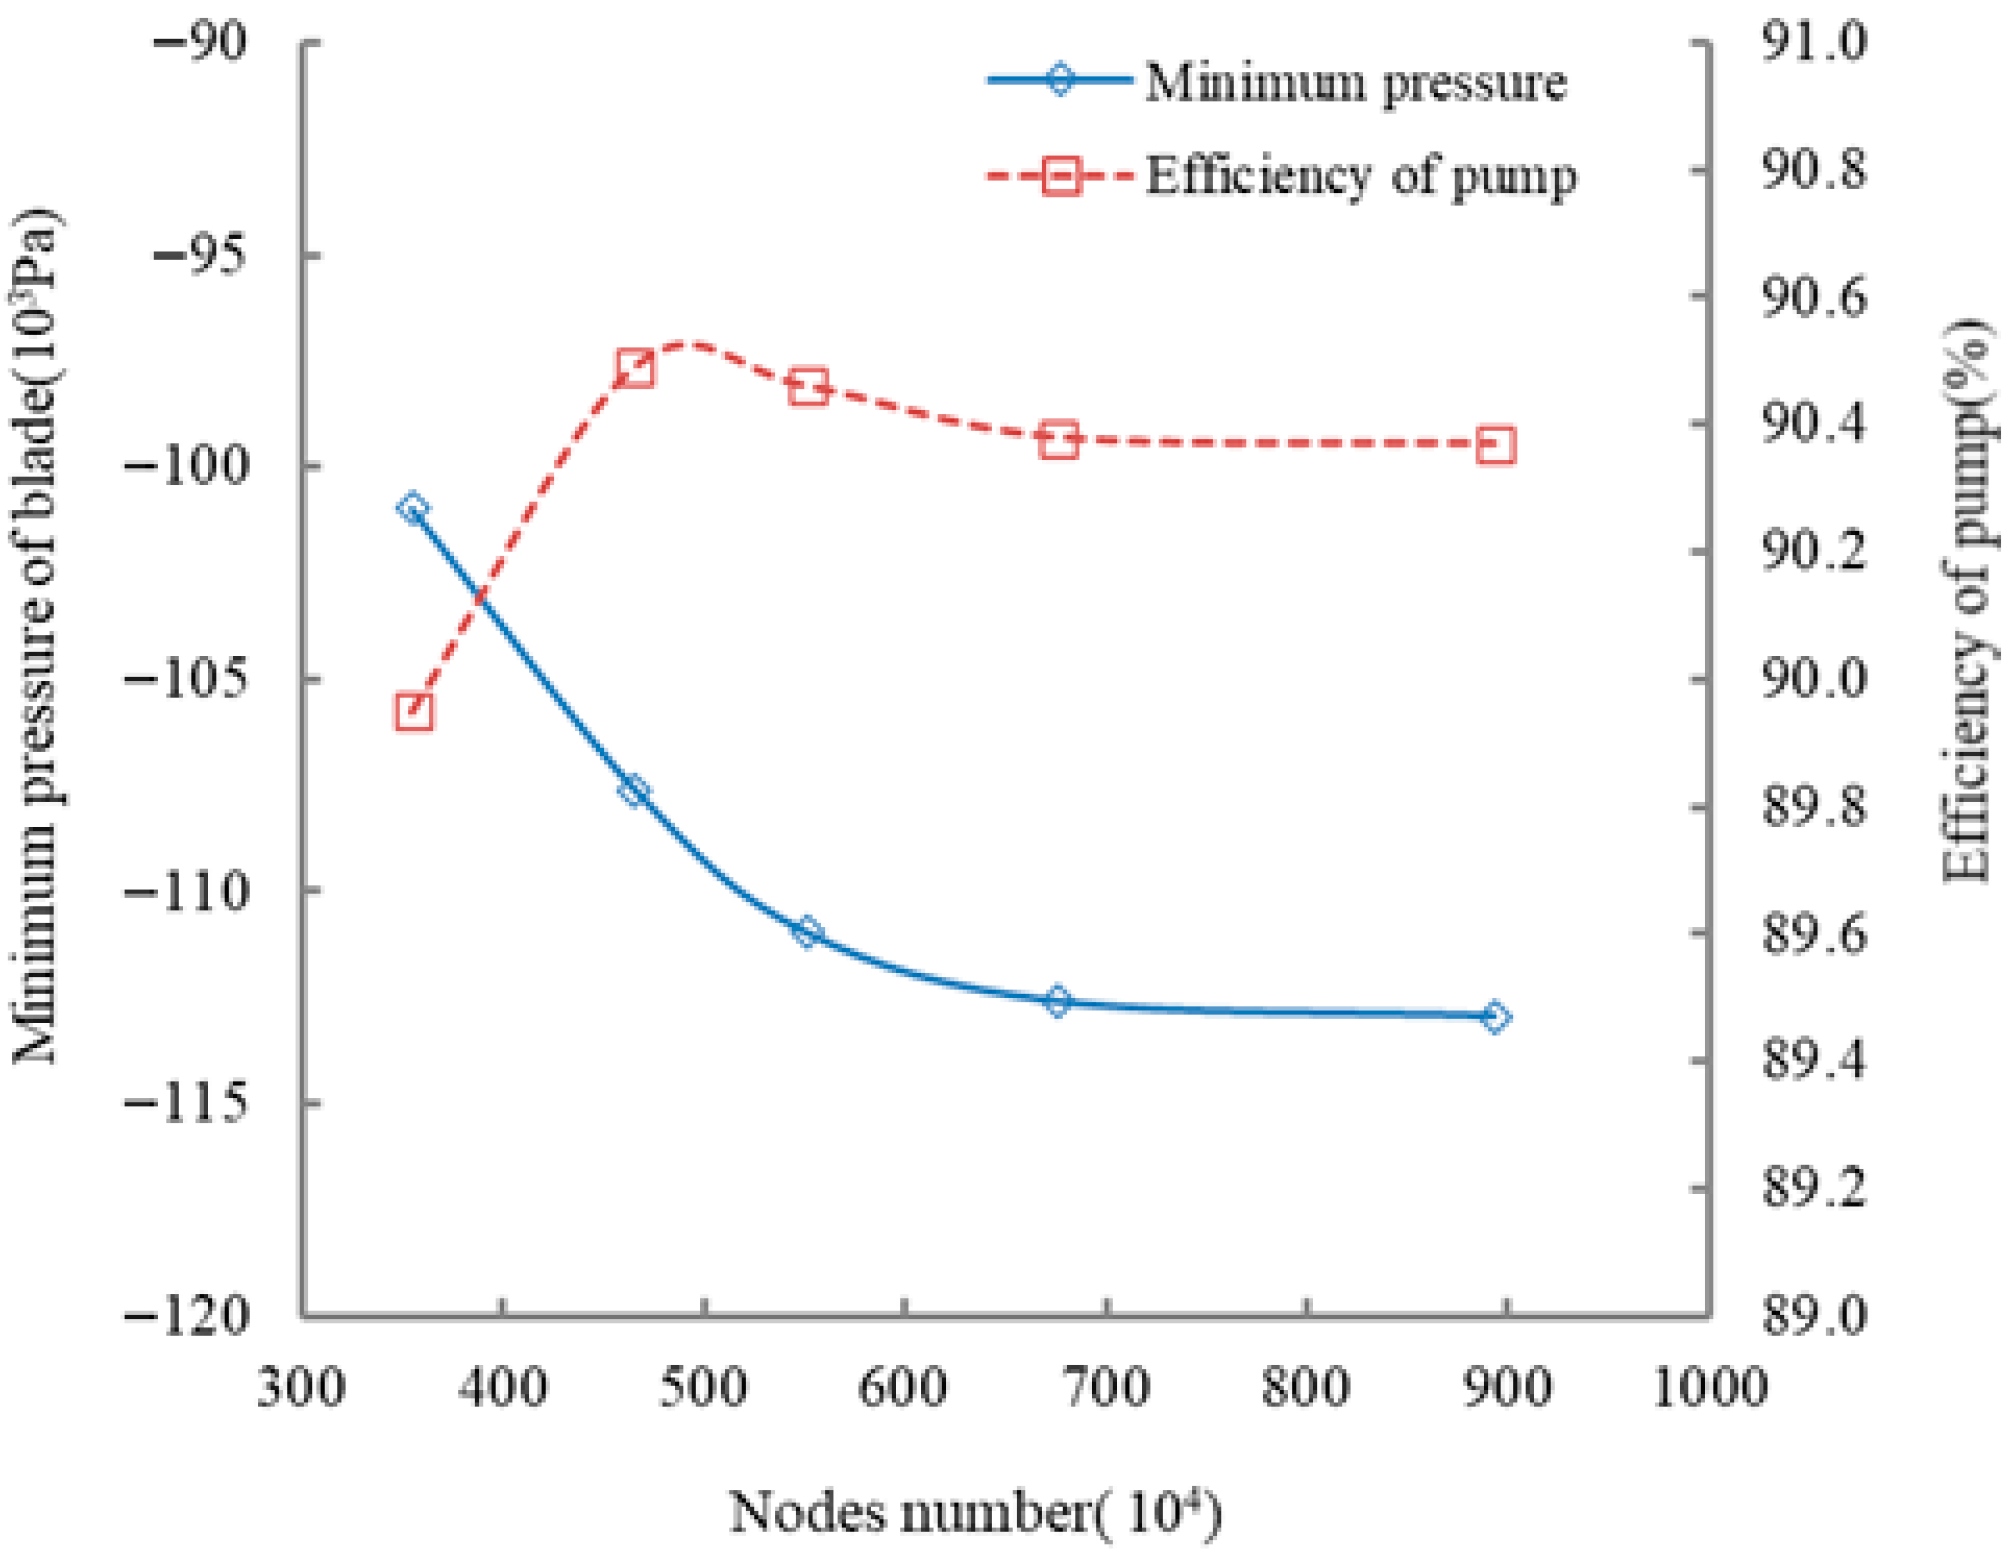
Based on the accurate definition of the pump-turbine’s calculation domain and time step, structured grids were used to divide each component. To ensure that the influence of grid node count on calculation accuracy can be ignored, a grid independence analysis was conducted for the pump-turbine’s calculation domain. Since the minimum pressure on the blade surface directly affects the runner’s cavitation performance in cavitation calculations, Figure 7 shows the relationship between grid node count, minimum pressure on the blade surface, and pump efficiency under a pump operating condition with a discharge of 0.27031 m3/s. The minimum pressure on the blade surface (indicated by the solid line) decreases as grid node count increases, with a maximum decrease of 11,970 Pa; the pump efficiency (indicated by the dashed line) fluctuates with changes in node count. When the grid node count increases from 6.76 million to 8.93 million, the minimum pressure on the blade surface decreases by 350 Pa, while pump efficiency (indicated by the dashed line) remains unchanged, meeting the calculation accuracy requirements. Thus, a grid distribution with 6.76 million nodes in the computational domain was selected for the numerical calculations. The grid node counts for specific components are as follows: spiral casing, 510,000; stay vanes, 1,200,000; guide vanes, 1,810,000; runner, 2,760,000; and draft tube, 480,000. The grid distribution is shown in Figure 8. The boundary layers in the draft tube, runner, and guide/stay vanes were set sufficiently densely to ensure that the average y + value was less than 2.

2.4. Experimental Validation

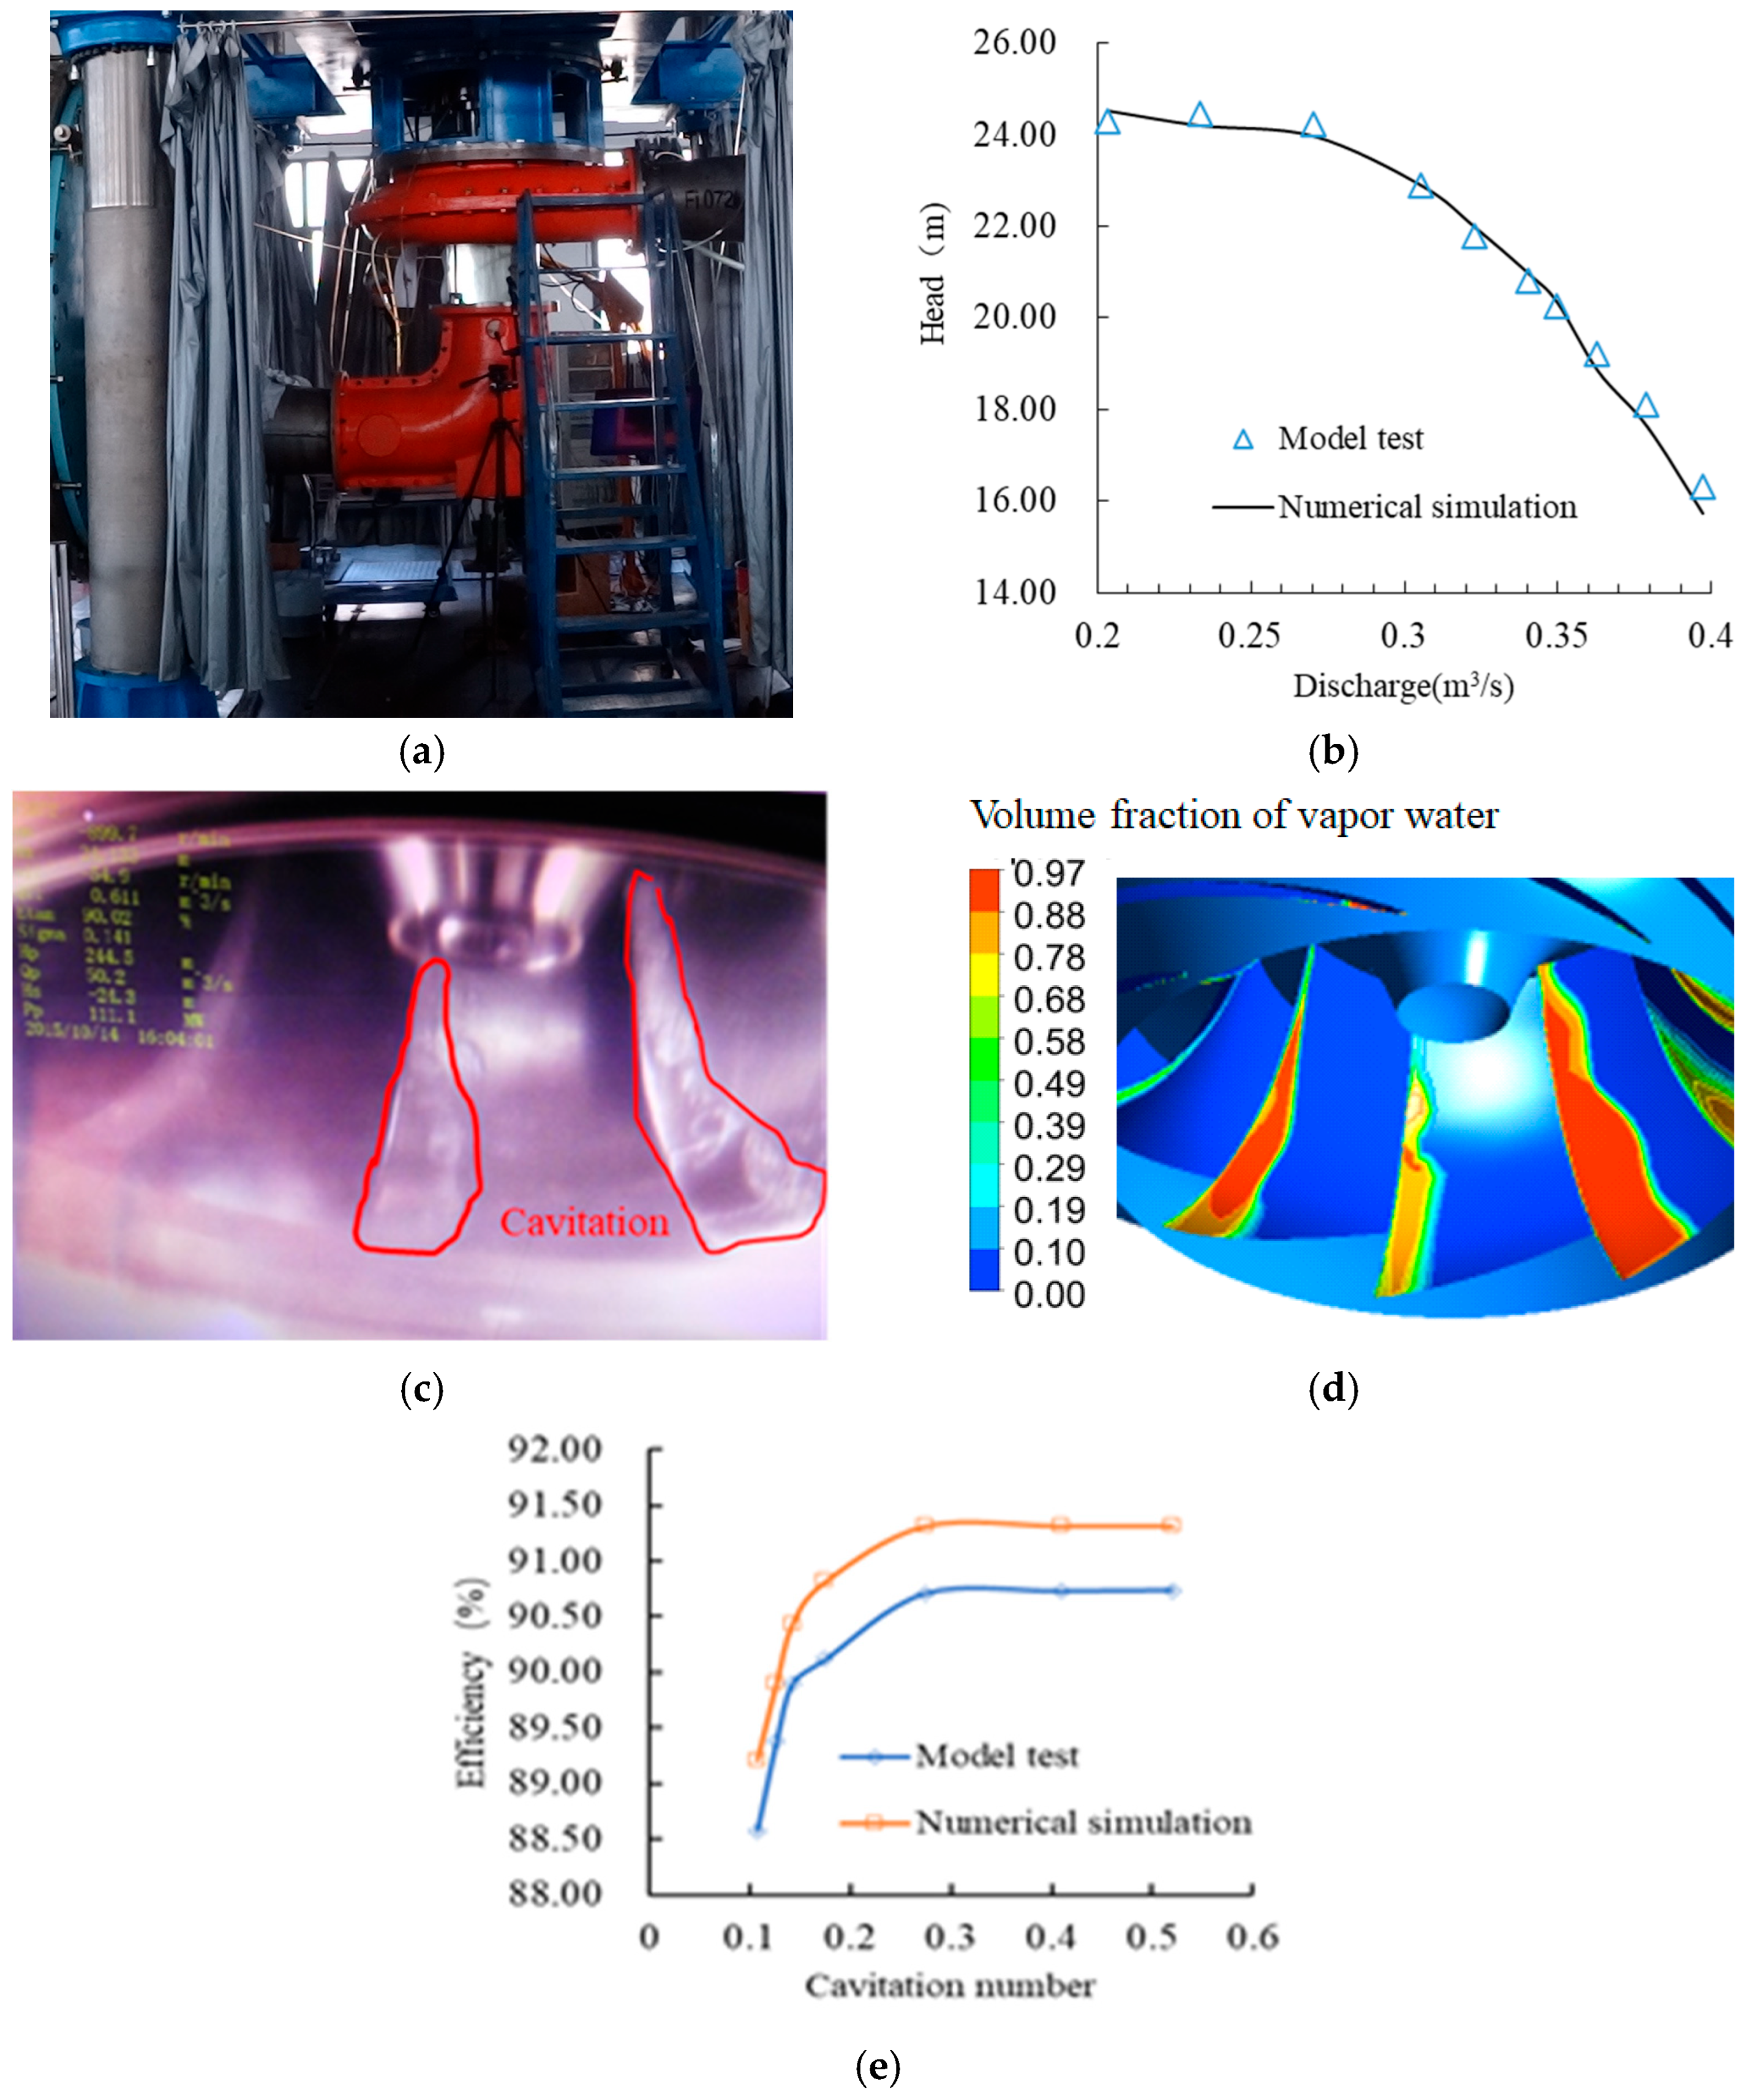
The experiments were conducted on the high-precision test rig for hydraulic machinery. The experimental setup can assess both turbine and pump performance, with a composite error of approximately ±0.2% for efficiency measurement. It operates in a closed loop with a maximum head of 40 m and a maximum discharge of 1.8 m3/s, respectively. All measurements complied with the International Electrotechnical Commission (IEC) standards [32]. The model test rig for the tested pump-turbine model is shown in Figure 9a, and detailed information on the test rig is provided in previously published papers [33].
Figure 9b presents the head–discharge relationship curves for pump operation with a 22° guide vane opening, calculated via numerical simulation, along with a comparison of performance parameters at the operating point from model tests. Under a flow condition of 0.20317 m3/s, the numerically calculated head is 0.22 m higher than that measured in the model test, with a relative error of 0.91%. The heads calculated via numerical simulation under the three flow conditions (0.20317 m3/s, 0.23326 m3/s, and 0.30558 m3/s) are slightly lower than those measured in the model test.
Under the flow condition of 0.23326 m3/s, the head calculated by numerical simulation is 0.24 m smaller than that measured in the model test, with a relative error of 0.97%. Under the flow condition of 0.27031 m3/s, the head calculated by numerical simulation is 0.27 m smaller than that measured in the model test, with a relative error of 1.13%. Under the flow condition of 0.30558 m3/s, the head calculated by numerical simulation is 0.02 m smaller than that measured in the model test, with a relative error of 0.08%; the head error is the smallest at this time. The heads calculated by numerical simulation under the three flow conditions (0.32279 m3/s, 0.34039 m3/s, and 0.34959 m3/s) are slightly higher than those measured in the model test. Under the flow condition of 0.32279 m3/s, the numerically calculated head is 0.21 m higher, with a relative error of 0.96%. Under the flow condition of 0.34039 m3/s, the numerically calculated head is 0.15 m higher, with a relative error of 0.72%. Under the flow condition of 0.34959 m3/s, the numerically calculated head is 0.07 m higher, with a relative error of 0.36%. The heads calculated by numerical simulation under the three flow conditions (0.36289 m3/s, 0.37889 m3/s, and 0.39701 m3/s) are 0.39 m, 0.47 m, and 0.60 m lower than those measured in the model test, with relative errors of 2.03%, 2.59%, and 3.64%, respectively. It can be seen from these results that near the small discharge and under optimal operating conditions, the pump head error obtained via numerical simulation is relatively small. In the large-discharge operating region, however, the pump head error obtained via numerical simulation is relatively large, but all errors fall within a reasonable range and meet actual engineering requirements. This indicates that the numerical simulation method adopted in this paper is reasonable.
Figure 9c,d present the cavitation contour on the blade surface under a pump condition with a discharge of 0.27031 m3/s and a cavitation number of σ = 0.141. When comparing the cavitation contour with the actually observed cavitation morphology (marked with the red dotted circle in the figure), the cavitation position obtained from numerical simulation is completely consistent with the location where cavitation occurred in the cavitation test, and the cavitation morphology is also basically consistent.
Figure 9e presents the cavitation inception curves under a pump condition with a discharge of 0.27031 m3/s. The efficiency obtained from numerical simulation is higher than that from model testing. When the cavitation number is 0.521, the efficiency from model testing is 90.74%, while that from numerical calculation is 91.32%, with an error of 0.58%. When the cavitation number is 0.175, the efficiency from model testing is 90.12%, and that from numerical calculation is 90.82%, which is 0.7% higher than the efficiency from model testing. When the cavitation number is 0.107, the efficiency from model testing is 88.58%, and that from numerical calculation is 89.21%, with an error of 0.63%. Thus, under the pump condition with a discharge of 0.27031 m3/s, the error of the pump efficiency obtained from numerical simulations of cavitation is within 1%.

3. Result Analysis and Discussion

3.1. Comparative Analysis of Energy Performance Under the Turbine Operating Conditions

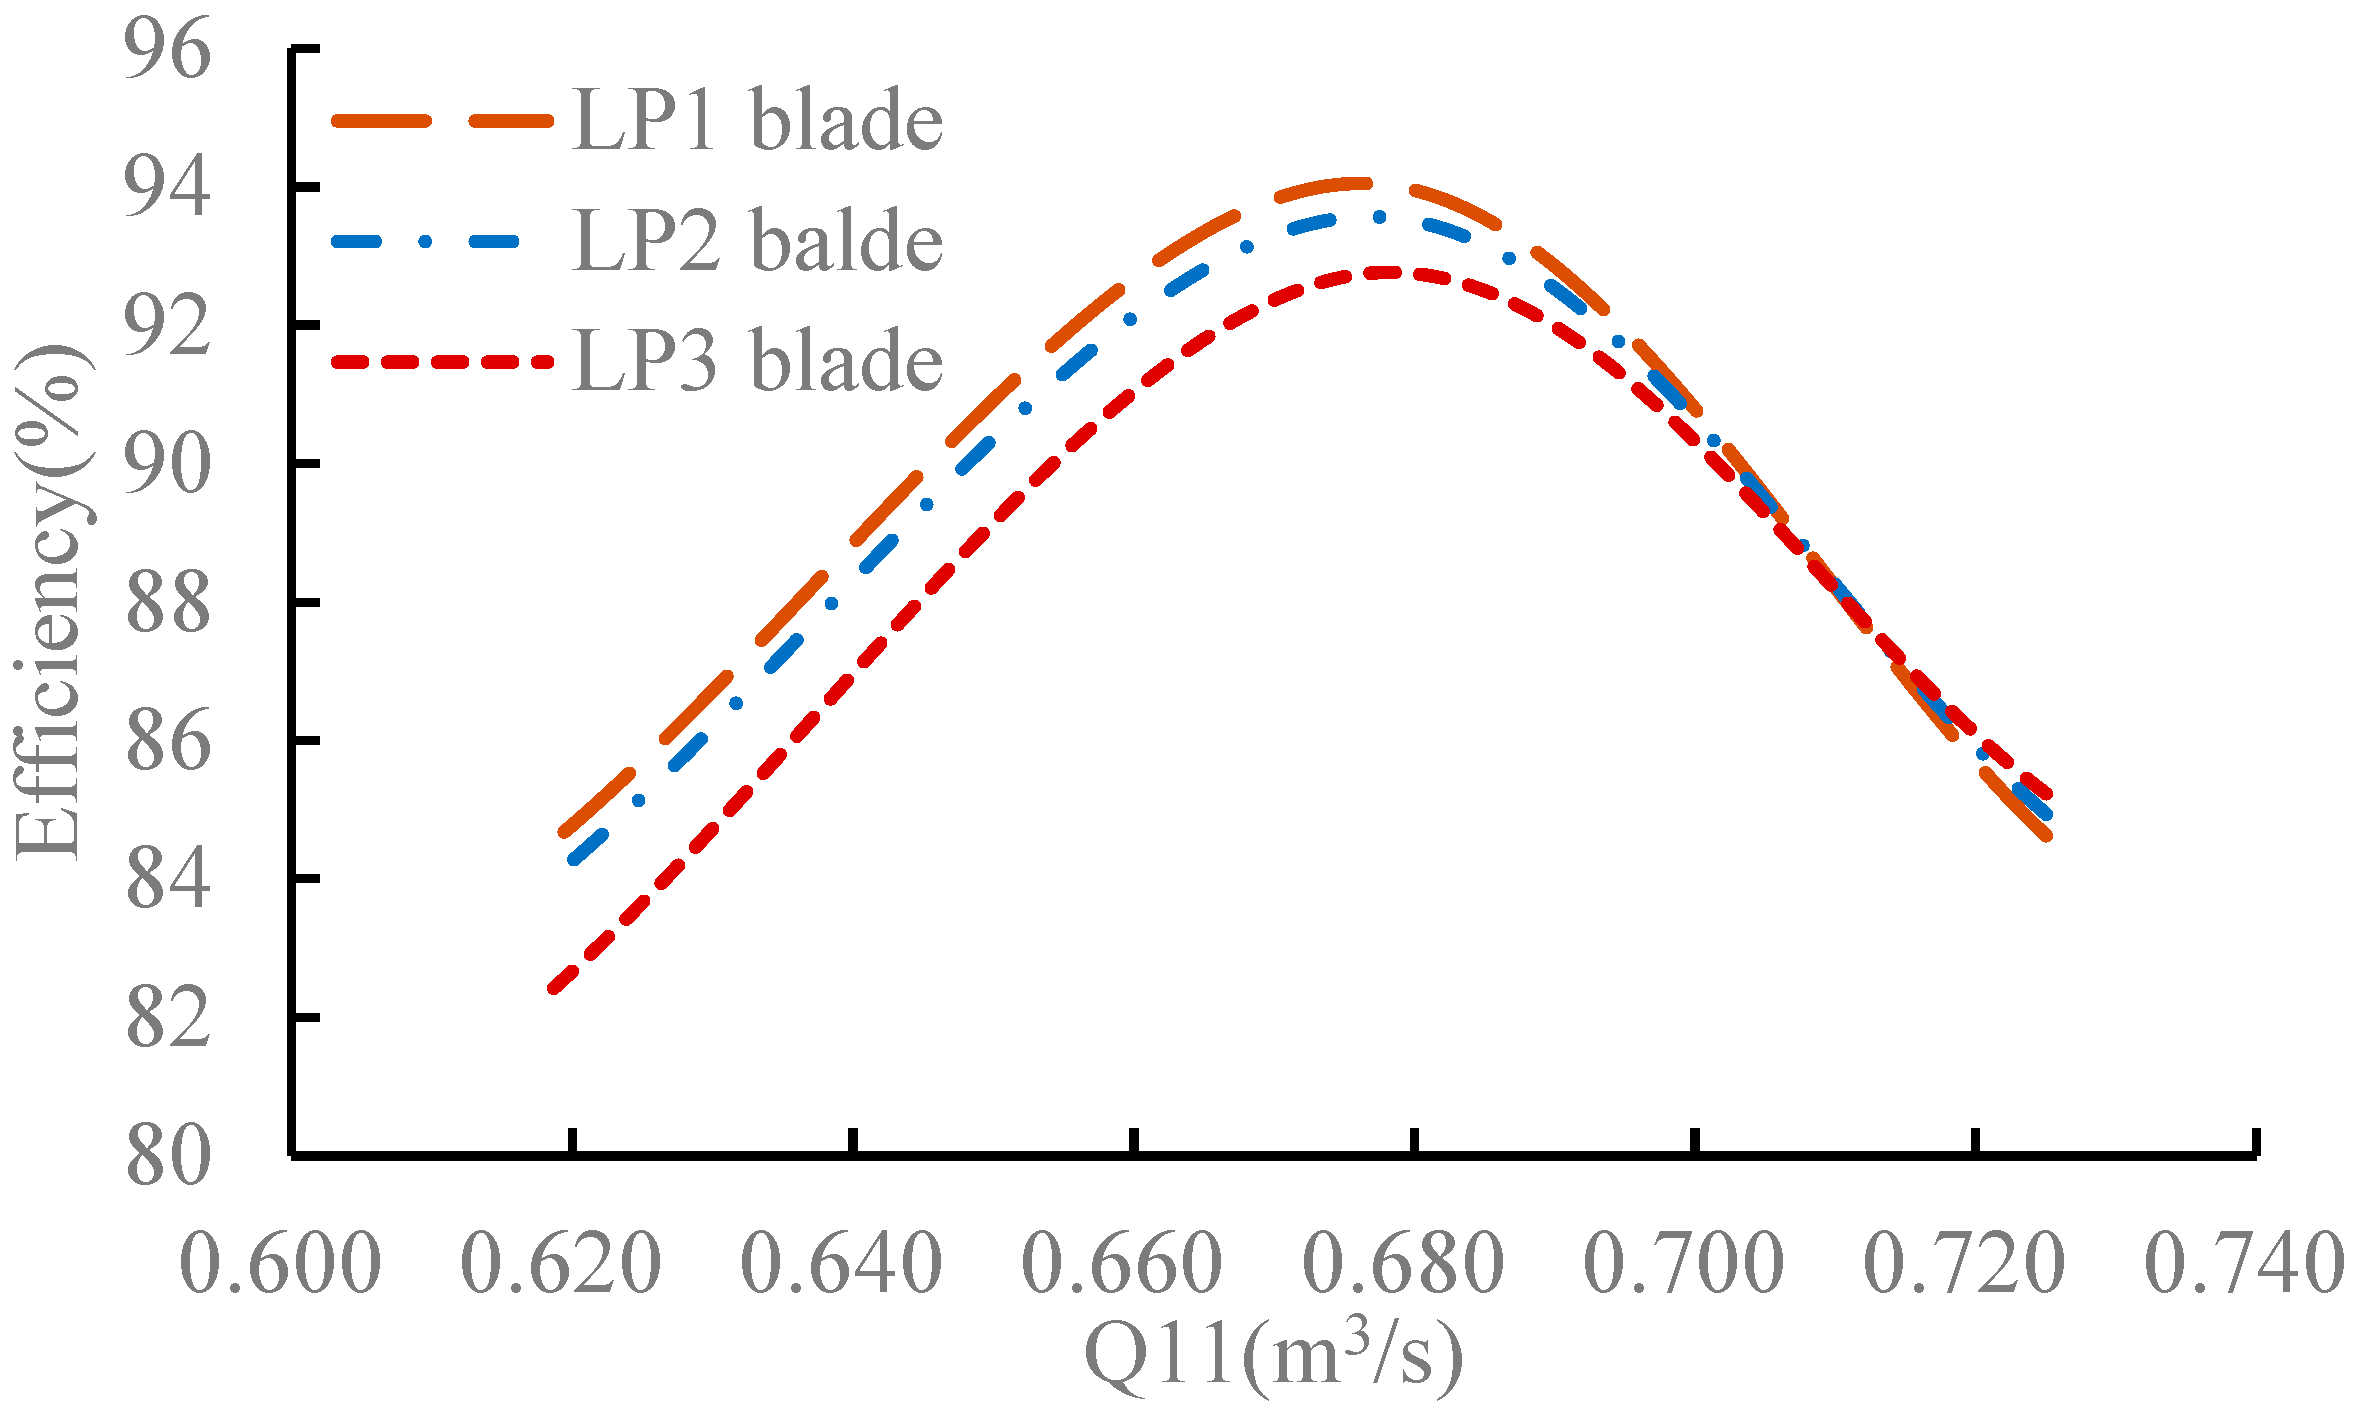
In order to investigate the influence of low-pressure edge blade installation angles on the energy characteristics of turbine operating conditions, three different output conditions were selected in this paper to calculate the turbine performance. The three output conditions are as follows: operating condition 1 (n11 = 63.46 r/min, Q11 = 0.618 m3/s), operating condition 2 (n11 = 56.05 r/min, Q11 = 0.676 m3/s), and operating condition 3 (n11 = 41.79 r/min, Q11 = 0.725 m3/s). Figure 10 presents the efficiency comparison curves of the three blade runner types under different turbine flow conditions. Under operating condition 1, the LP3 blade runner has the lowest efficiency at 82.31%. The LP1 blade runner has the highest efficiency at 84.45%, which is 2.14% higher than that of the LP3 blade runner. The LP2 blade runner has intermediate efficiency at 83.92%. Under operating condition 2, the LP3 blade runner has the lowest efficiency at 92.74%. The LP1 blade runner has the highest efficiency at 94.05%, which is 1.31% higher than that of the LP3 blade runner. The LP2 blade runner has intermediate efficiency at 93.57%. Under operating condition 3, the LP1 blade runner has the lowest efficiency at 84.63%. The LP3 blade runner has the highest efficiency at 85.24%, which is 0.61% higher than that of the LP1 blade runner. The LP2 blade runner has intermediate efficiency at 84.94%. It can be concluded that under turbine operating conditions, the energy performance of the LP1 blade runner is superior to that of the LP2 and LP3 blade runners.

3.2. Comparative Analysis of Flow Characteristics Under the Turbine Operating Conditions

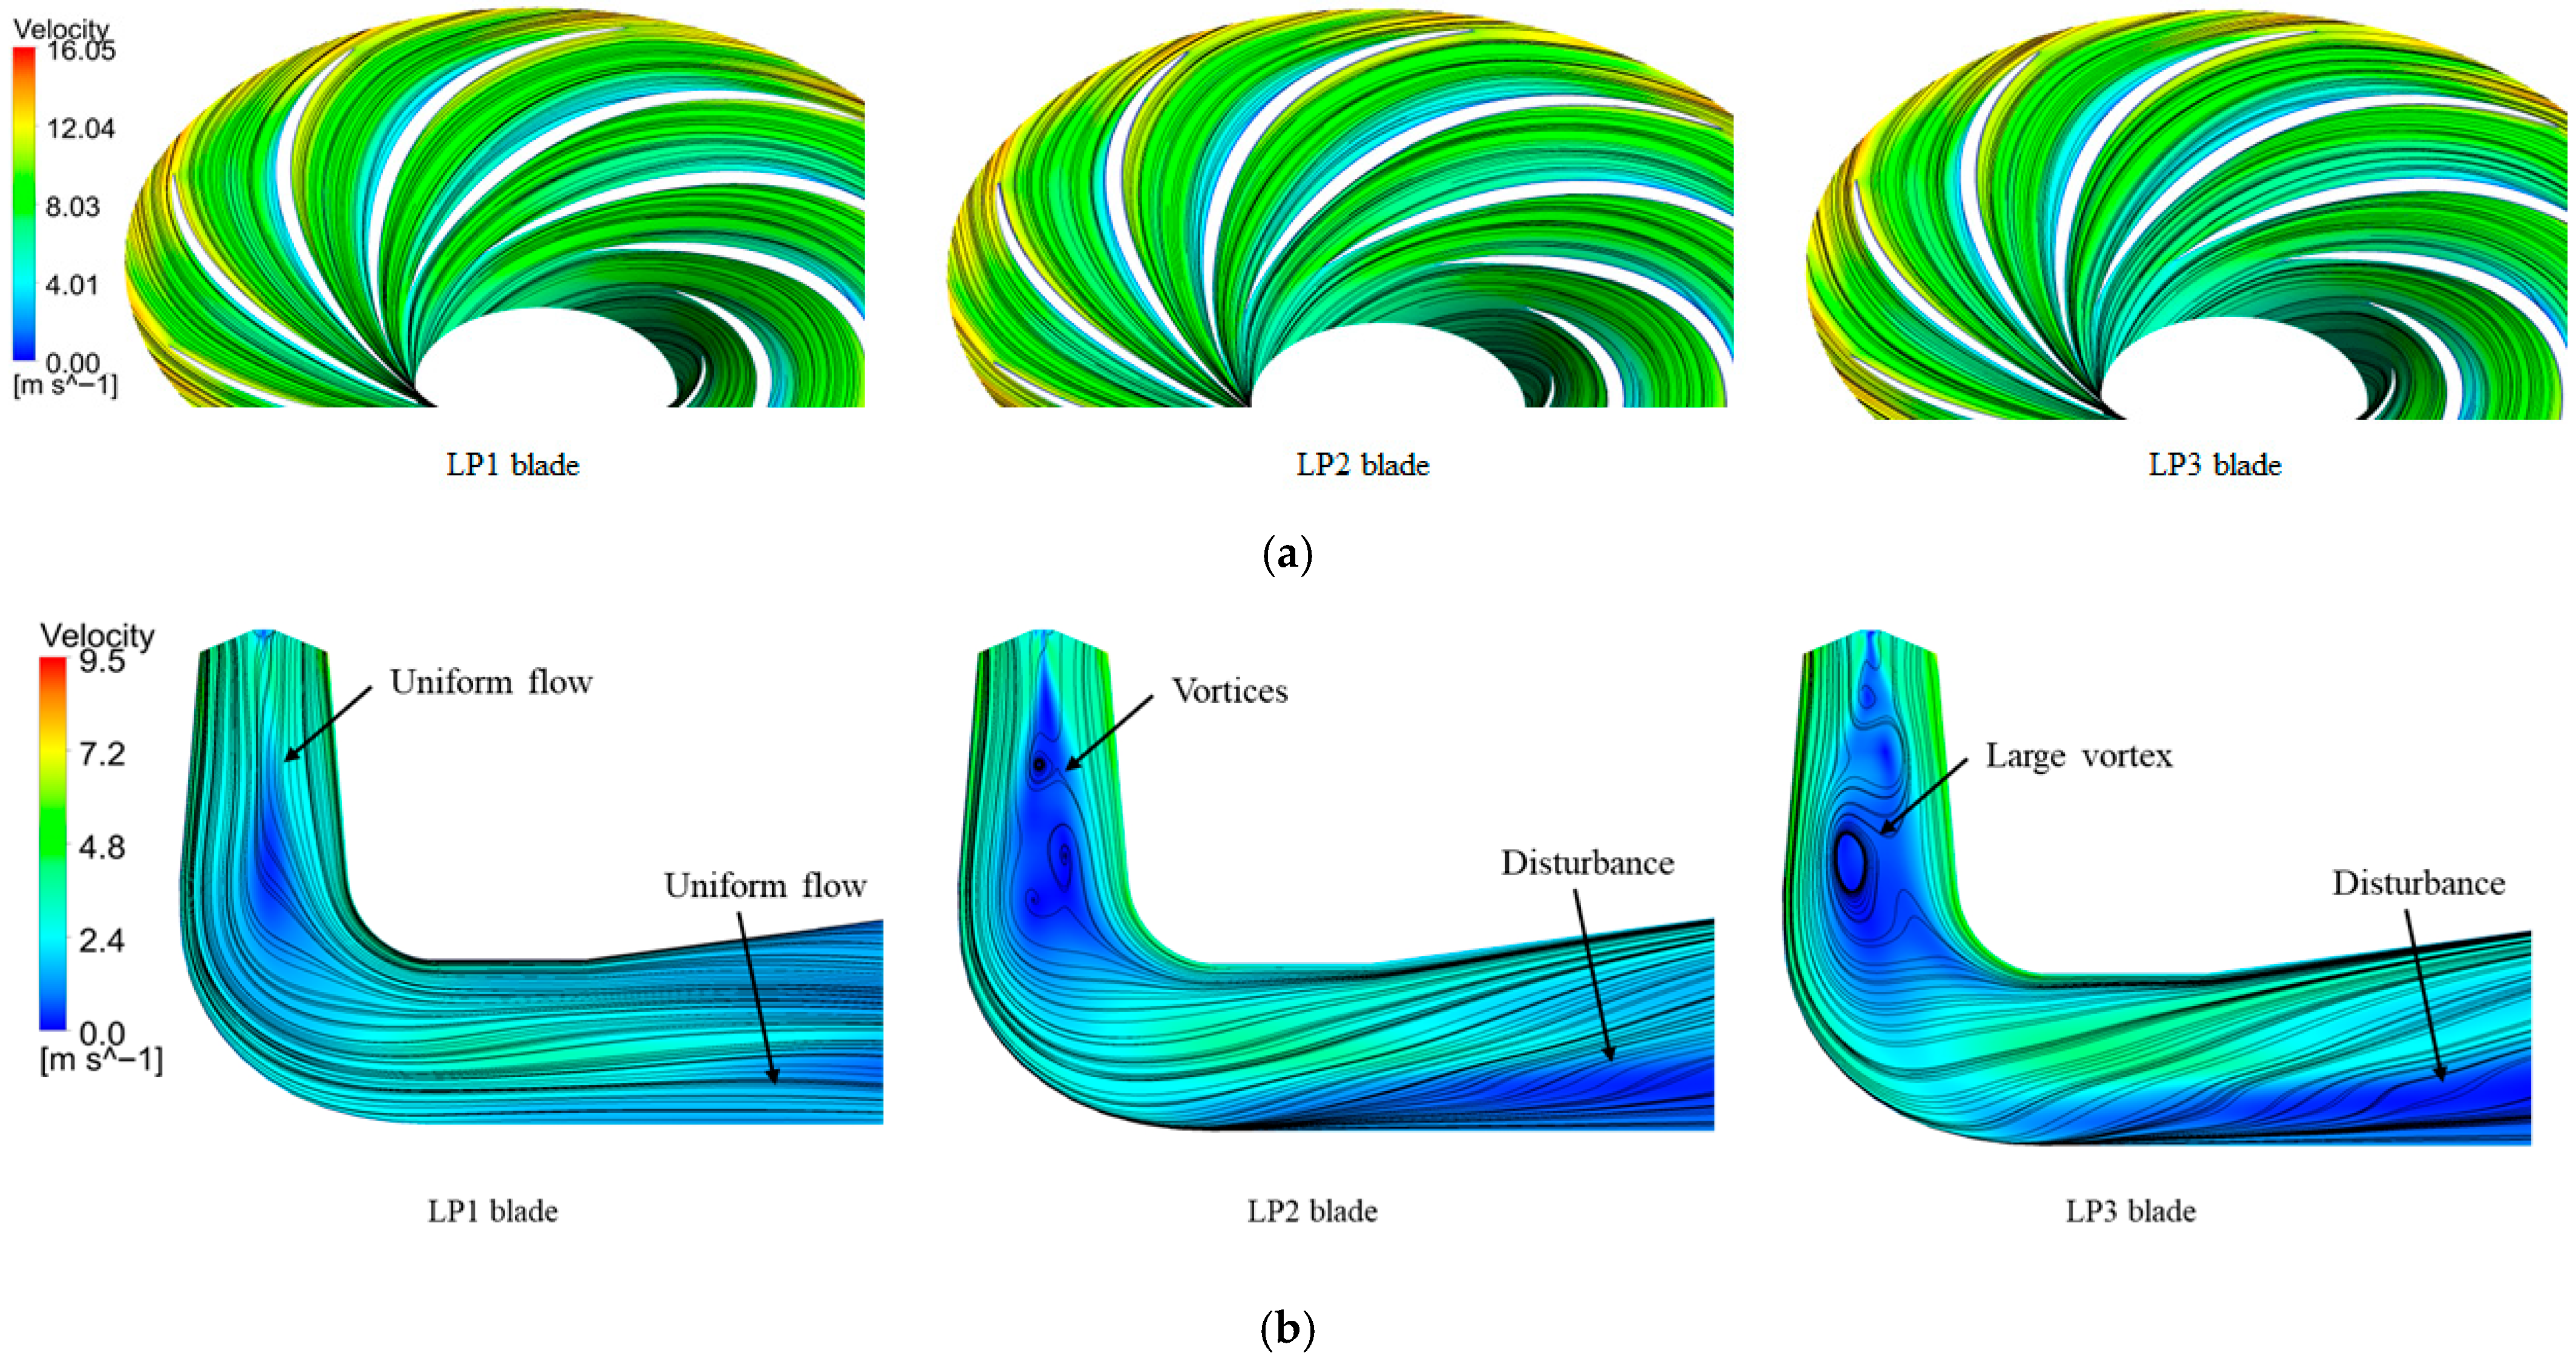
Figure 11 presents the internal streamline distribution diagrams of the three blade runner types and their draft tubes under the rated turbine operating condition (operating condition 2). Figure 11a shows that the flow patterns in the three runner types are all excellent: the streamlines are evenly distributed, and the water flow is in close contact with the pressure and suction sides of the blades, with no impact or obvious flow separation. Figure 11b shows significant differences in the streamline distribution within the draft tubes of the three blade runners. The streamline distribution in the LP1 blade runner’s draft tube is relatively uniform, with no vortices, and the draft tube’s energy recovery is relatively high. Disturbances and slight vortices occur in the streamlines of the straight cone section in the LP2 blade runner’s draft tube, and the water flow in the diffusion section flows upward. A large reflux vortex appears in the straight cone section of the LP3 blade runner’s draft tube. Moreover, after flowing through the elbow section, the water rushes to the upper half of the diffusion section, resulting in severe flow separation in the lower half of the diffusion section. This affects energy recovery in the draft tube and leads to a decrease in turbine efficiency. It can be concluded that the LP1 blade runner has basically achieved ideal normal outflow. A slight increase in the blade installation angles of the LP2 and LP3 blade runners, which does not affect the flow field distribution within the runner, has a significant impact on the flow state and energy recovery in the draft tube, resulting in relatively low efficiencies under turbine operating conditions.

3.3. Comparative Analysis of Cavitation Characteristics Under the Pump Operating Conditions

In order to investigate the influence of the low-pressure edge blade installation angle on the cavitation performance under pump operating conditions, two pump operating conditions with discharges of 0.32279 m3/s (optimal operating condition) and 0.37889 m3/s (large-discharge condition) from Figure 9 were selected for numerical simulation. The specific parameters for cavitation calculations under these pump operating conditions are shown in Table 2.
Figure 12 presents a comparison of the cavitation number and efficiency curves for the three runner types, calculated via numerical simulation under the optimal pump operating condition (OP4, Qm = 0.32279 m3/s). When the cavitation number is greater than 0.115, the efficiencies of the three runner types remain basically unchanged. Among them, the LP1 blade runner has an efficiency of 92.89%, the LP2 blade runner 93.1%, and the LP3 blade runner has 93.37–0.48% higher efficiency than that of the LP1 blade runner. When the cavitation number is 0.088, the efficiencies of the three runner types begin to decrease slightly: the LP1 blade runner has an efficiency of 92.38% (a decrease of 0.51%); the LP2 blade runner 92.87% (a decrease of 0.23%); and the LP3 blade runner 93.04% (a decrease of 0.33%). When the cavitation number is 0.065, the efficiencies of the three runner types decrease significantly: the LP1 blade runner has an efficiency of 84.5% (a decrease of 8.39%); the LP2 blade runner 84.75% (a decrease of 8.62%); and the LP3 blade runner 82.68% (a decrease of 10.69%). It can be concluded that under the optimal pump operating condition, the variation trends of the three runner types’ efficiencies with cavitation numbers are basically the same. Under conditions of a larger cavitation number, the efficiency of the LP3 blade runner is slightly higher than that of the other two runner types.
To compare and analyze differences in cavitation positions and forms among the three runner types, Figure 13 presents the cavitation contours of the three runner types under conditions with different cavitation numbers, under the optimal pump operating condition. When the cavitation number is 0.192, the cavitation performance of the three runner types is relatively good. Among them, the LP1 blade runner has basically no cavitation, while the LP2 and LP3 blade runners exhibit slight cavitation at the low-pressure edge near the band on the blade suction surface. When the cavitation number is 0.088, cavitation occurs on the LP1 blade runner near the band on the blade suction surface, and also on the pressure surface of the LP1 blades. However, cavitation occurs only on the blade suction surfaces of the LP2 and LP3 blade runners, with the cavitation region of the LP3 blade runner being larger than that of the LP2 blade runner. It can be seen that under the optimal pump operating condition, when the cavitation number is relatively small, as the low-pressure edge blade installation angle increases, cavitation on the blade pressure surface gradually disappears, while cavitation near the band on the blade suction surface gradually intensifies.
To further analyze the cavitation flow characteristics of the three runner types under optimal pump operating conditions and their mechanism of interference-induced instability with the mainstream, Figure 14 presents the velocity vector distributions of liquid water near the band of the runners for different cavitation numbers. At a cavitation number of 0.192, flow separation occurs at the inlet of the LP1 runner. This indicates a mismatch between the blade angle and the inflow angle under optimal operating conditions. Although no cavitation occurs in the LP1 runner, the inlet separation causes losses, resulting in its relatively lowest efficiency. The LP2 runner essentially achieves shock-free inflow, with the water adhering to the blade surfaces and flowing smoothly out of the runner. The LP3 runner exhibits slight cavitation on the suction surface near the blade inlet, but no obvious flow loss occurs, and it hardly affects the main flow.
In Figure 14b, when the cavitation number is 0.088, the LP1 blade runner has cavitation on both the suction surface and the pressure surface of the blades. The cavitation at these two positions superimposes on each other, resulting in obvious disturbances in the runner’s blade passages. Cavitation on the suction surface of the LP2 blade runner causes local flow separation on the blade, but it does not affect the flow in the downstream blade channels. Cavitation on the suction surface of the LP3 blade runner also causes local flow separation on the blade. The flow separation region is slightly larger than that caused by cavitation on the LP2 blade runner, but it does not have a significant impact on the flow in the downstream non-cavitation region. It can be concluded that under the optimal operating condition, the anti-cavitation performance of the LP2 blade runner is slightly better than that of the other two blade runner types.
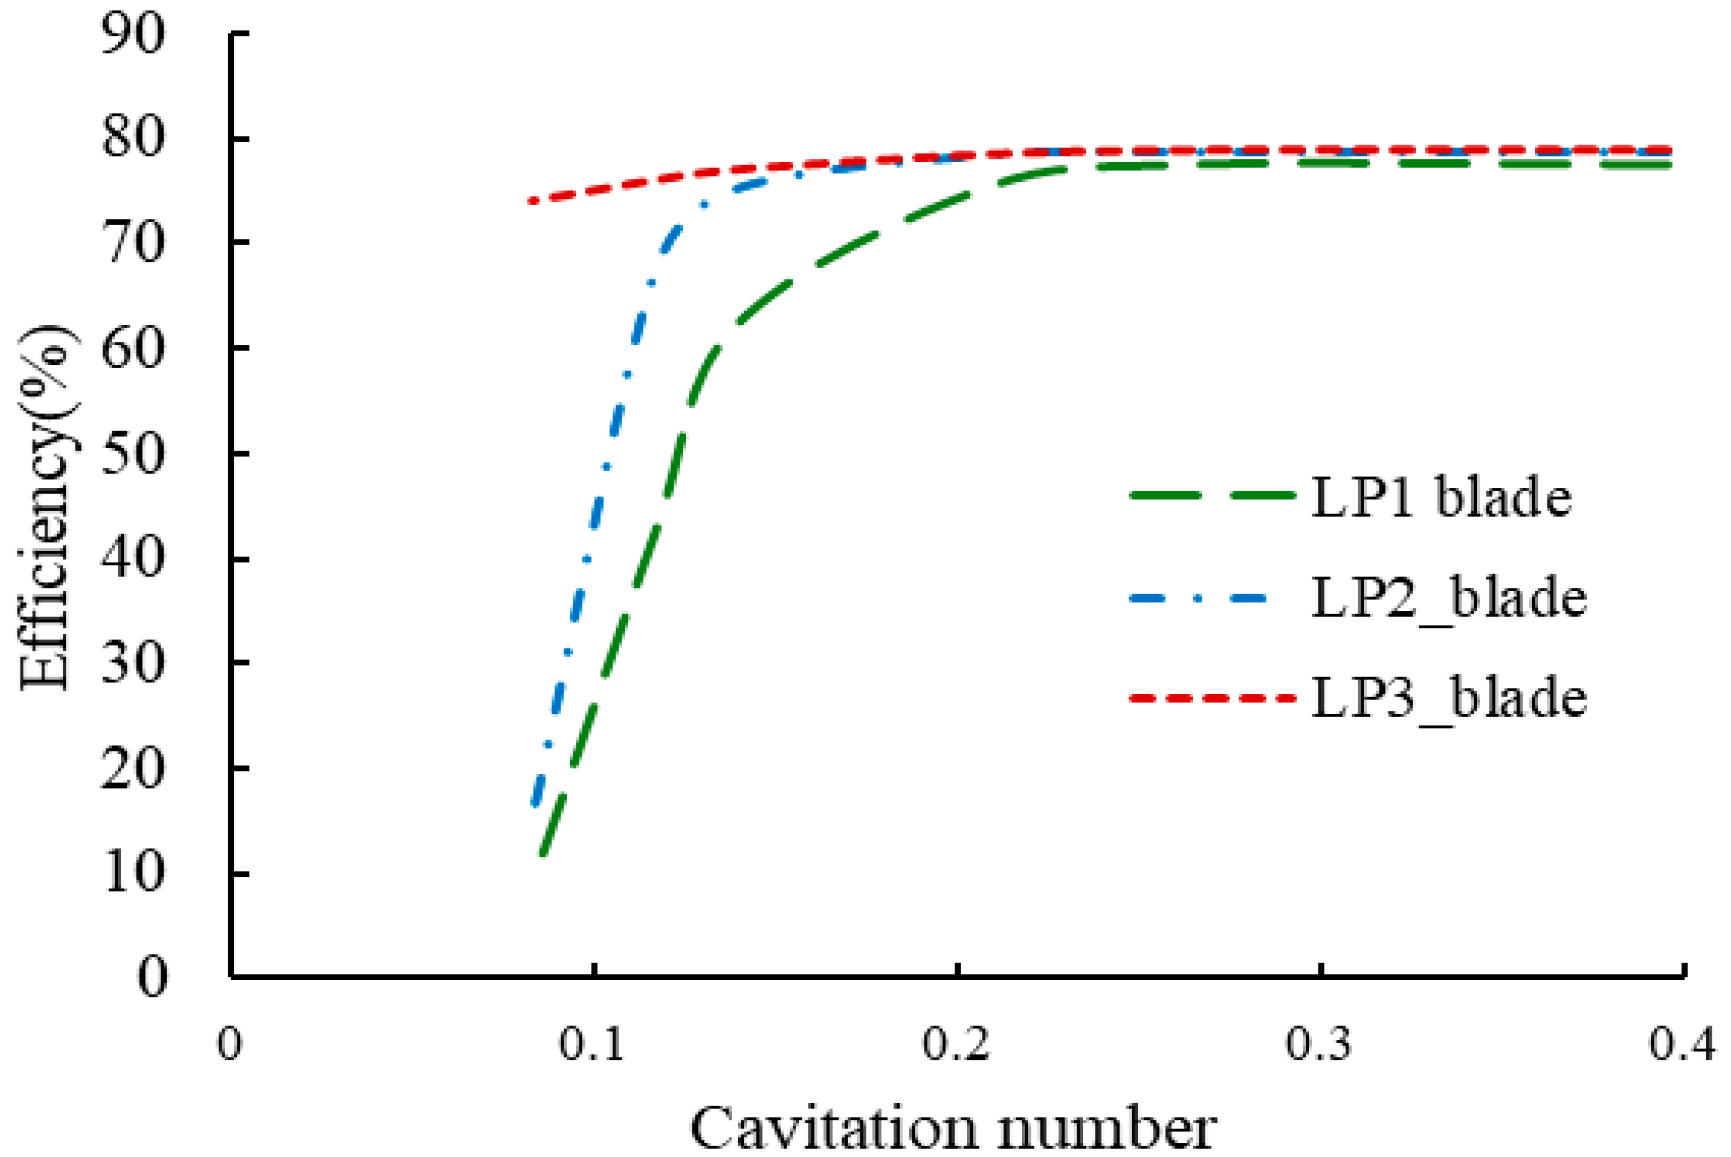
Figure 15 presents a comparison of the cavitation number and efficiency curves for the three runner types, calculated via numerical simulation under the large-discharge pump operating condition (OP5, Qm = 0.37889 m3/s). When the cavitation number is greater than 0.265, the efficiencies of the three runner types are very close: the LP1 blade runner has an efficiency of 77.48%; the LP2 blade runner 78.63%; and the LP3 blade runner has 78.77–1.29% higher efficiency than that of the LP1 blade runner. When the cavitation number is 0.209, the efficiencies of the three runner types begin to decline: the LP1 blade runner has an efficiency of 75.36% (a decrease of 2.12%); the LP2 blade runner 78.36% (a decrease of 0.27%); and the LP3 blade runner 78.39% (a decrease of 0.38%).
When the cavitation number is 0.139, the efficiency of the LP1 blade runner decreases significantly to 62.15% (a decrease of 15.33%), indicating that cavitation seriously impairs the internal energy conversion of the LP1 blade runner, leading to a sharp decrease in efficiency. The efficiencies of the LP2 and LP3 blade runners decrease slightly, reaching 75.13% and 76.93%, respectively.
When the cavitation number is 0.117, the efficiency of the LP1 blade runner is 42.18%, which decreases by 35.3%. The efficiency of the LP2 blade runner is 67.11%, which decreases by 11.52%. The efficiency of the LP3 blade runner is 75.92%, which decreases by 2.85%. At this time, the difference in cavitation performance between the LP2 and LP3 blades begins to gradually increase. When the cavitation number is 0.083, the efficiency of the LP1 blade runner further decreases to 8.88%. The efficiency of the LP2 blade runner also begins to decrease significantly, reaching only 15.22%, indicating that cavitation leads to a sharp deterioration in the performance of the LP2 blade runner, resulting in a significant reduction in efficiency. However, the efficiency of the LP3 blade runner does not decline significantly under this condition, reaching 73.96%, which is only 4.81% lower than the efficiency without cavitation. It can be concluded that under the large-discharge pump operating condition, the cavitation performance of the LP3 blade runner is superior to that of the other two blade runners.
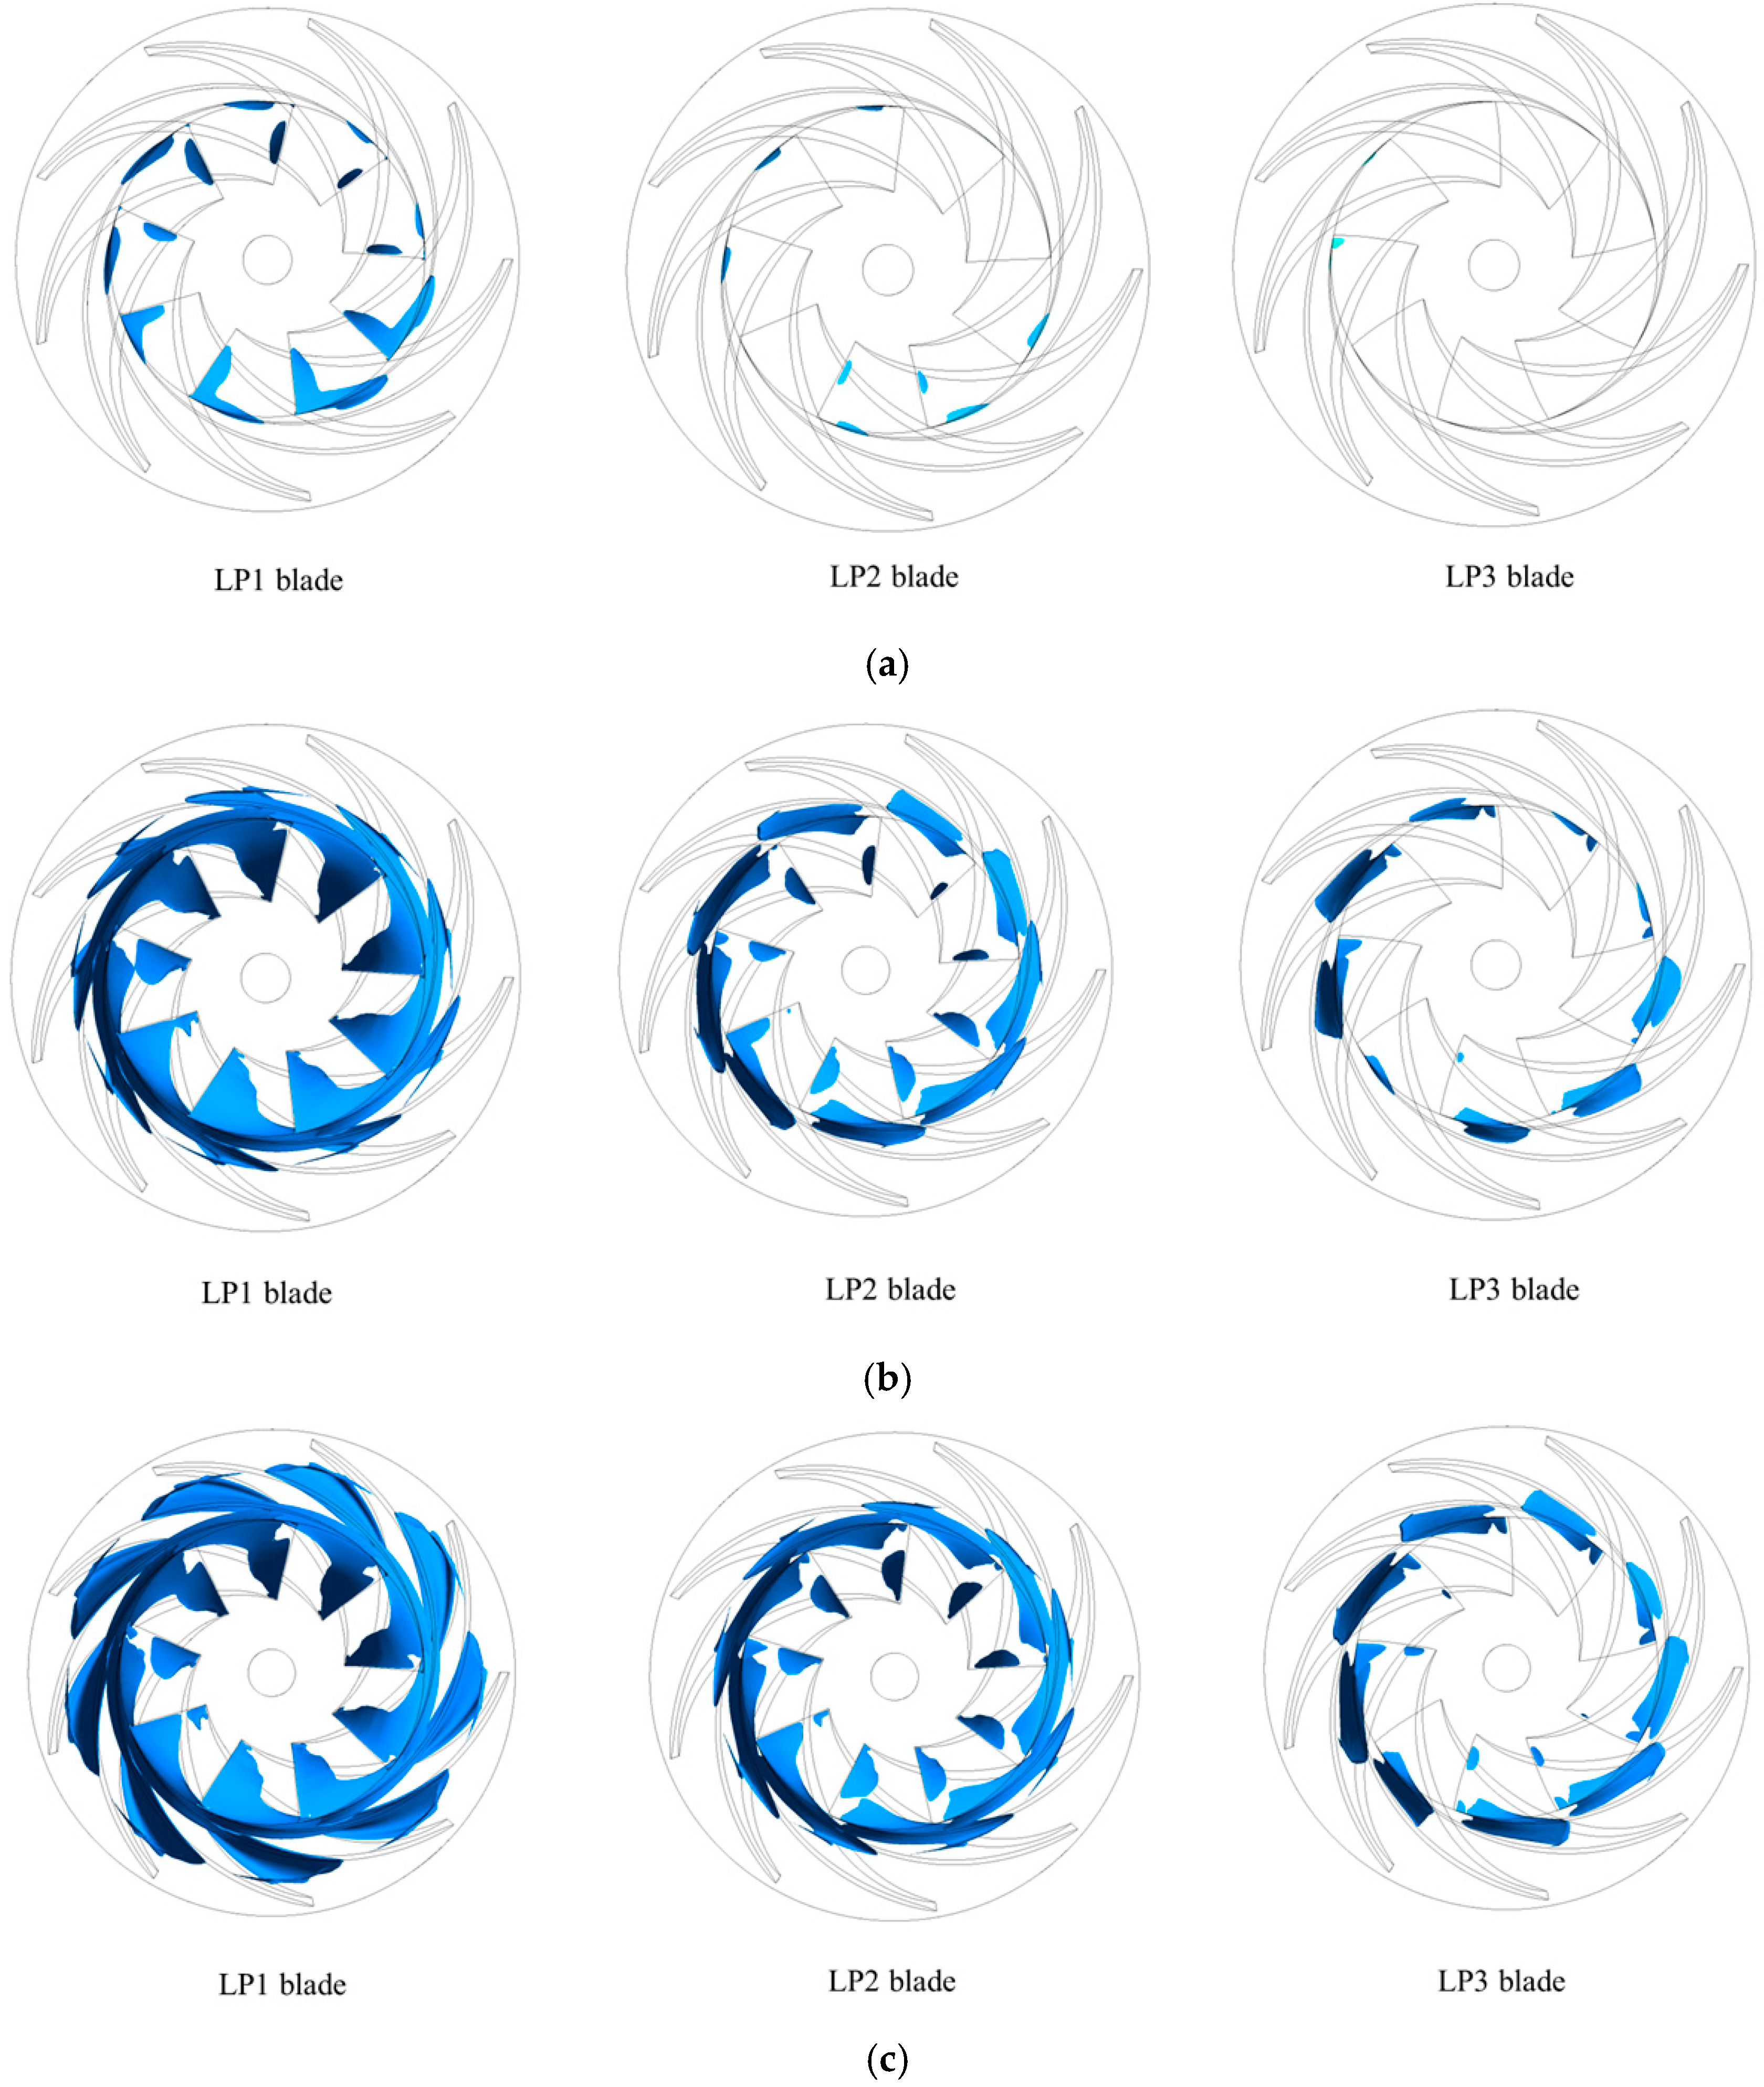
Figure 16 presents the isosurface of the vapor water volume fraction of the three runner types under conditions with different cavitation numbers, under the large-discharge pump operating condition. In Figure 16a, when the cavitation number is 0.265, cavitation occurs at the low-pressure edge and at the intersection of the pressure surface and the band of the LP1 blade runner, while no cavitation occurs on the blade suction surfaces. Slight cavitation occurs at the low-pressure edge of the blade pressure surface and at the connection between the blade pressure surface and the band of the LP2 blade runner. No cavitation occurs in the LP3 blade runner.
In Figure 16b, when the cavitation number is 0.139, the cavitation at the blade’s low-pressure edge and at the intersection of the pressure surface and the band of the LP1 blade runner intensifies. The cavitation extends simultaneously toward the upper crown and the blade’s high-pressure edge, and severe cavitation also occurs at the suction surface of the mid-blade. The cavitation at the low-pressure edge of the blade pressure surface and the connection between the pressure surface and the band of the LP2 blade runner are intensified, with the cavitation region expanding, and cavitation also begins to occur at the connection between the suction surface of the mid-blade and the band. Cavitation only occurs at the connection between the pressure surface of the LP3 blade runner and the band.
In Figure 16c, when the cavitation number is 0.117, large-scale cavitation occurs on both the pressure surface and the suction surface of the LP1 blade runner. The cavitation region of the LP2 blade runner on both the pressure surface and suction surface expands further; the cavitation region of the LP3 blade runner at the connection between the blade pressure surface and the band increases slightly, and cavitation occurs at the connection between the suction surface of the mid-blade and the band. Overall, as the low-pressure edge blade installation angle increases, the cavitation position on the suction surface shifts from 1/2 of the blade height to the connection between the suction surface and the band, and the cavitation position on the pressure surface shifts from 2/3 of the blade length to 1/4 of the blade length. It can be concluded that as the cavitation number decreases, the cavitation region of the LP1 blade runner expands sharply, and its anti-cavitation performance is very poor. However, the cavitation region of the LP3 blade runner increases slowly, showing relatively good anti-cavitation performance under the large-discharge pump operating condition.
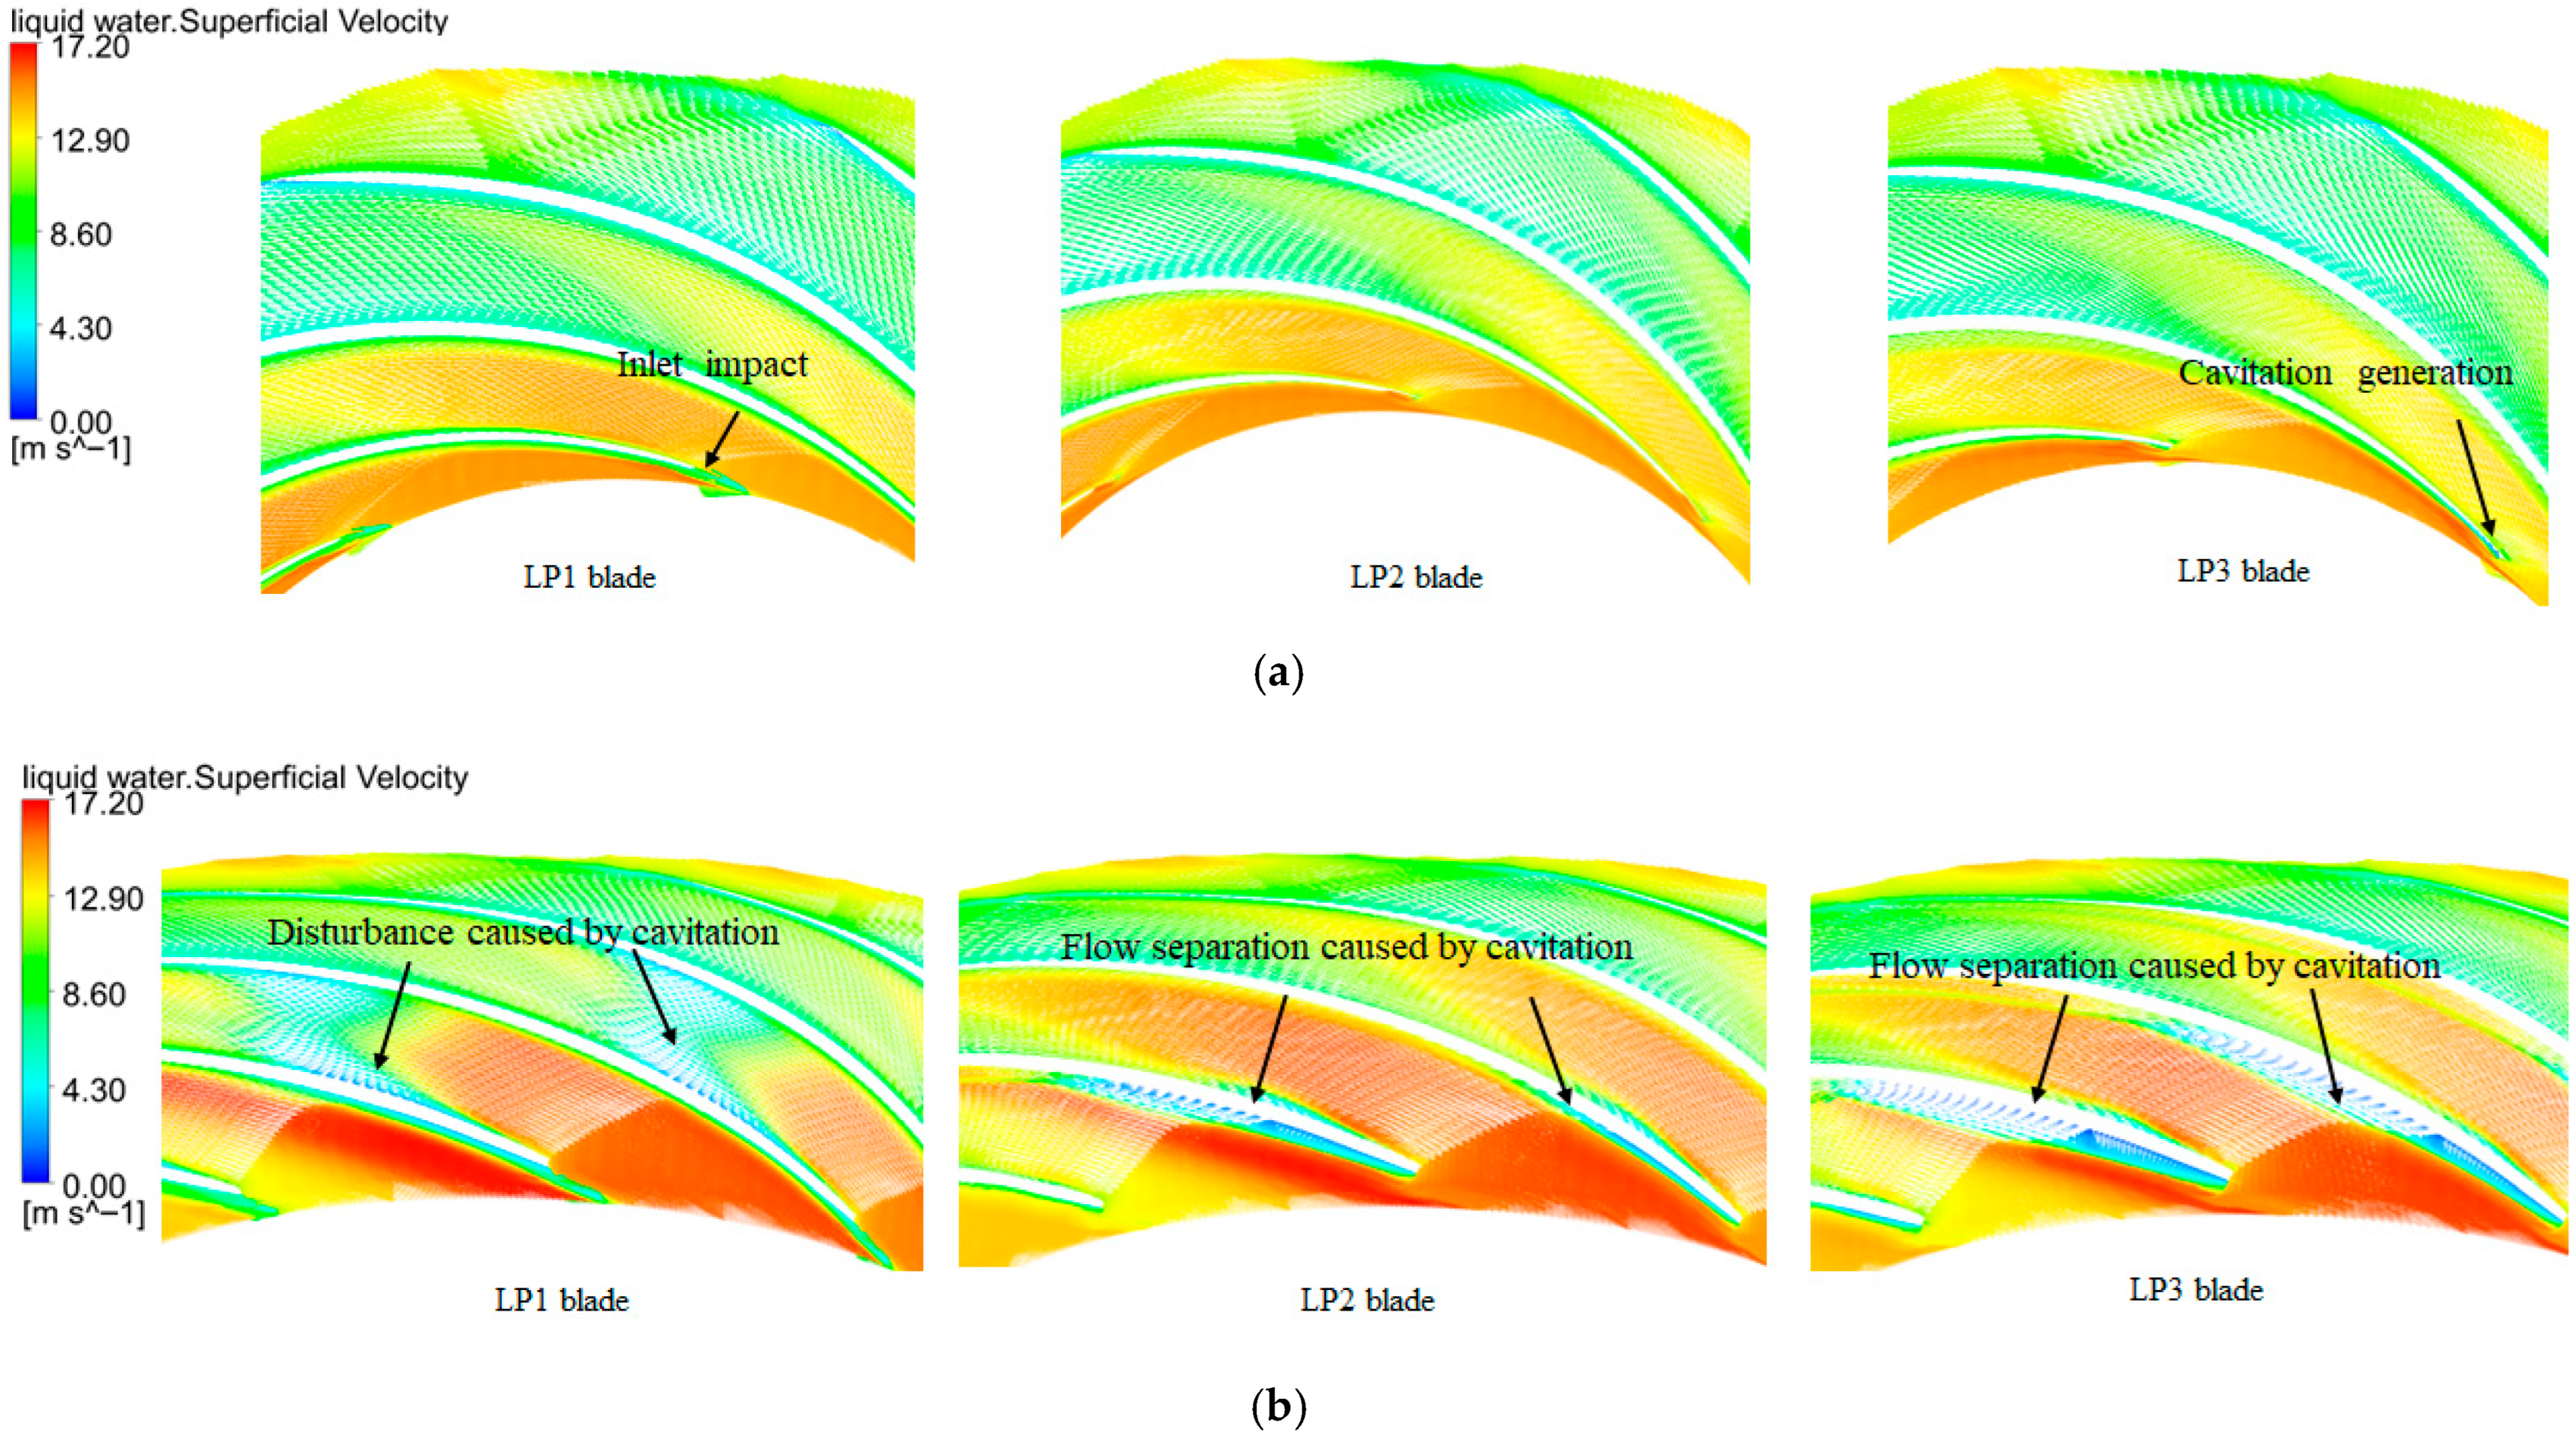
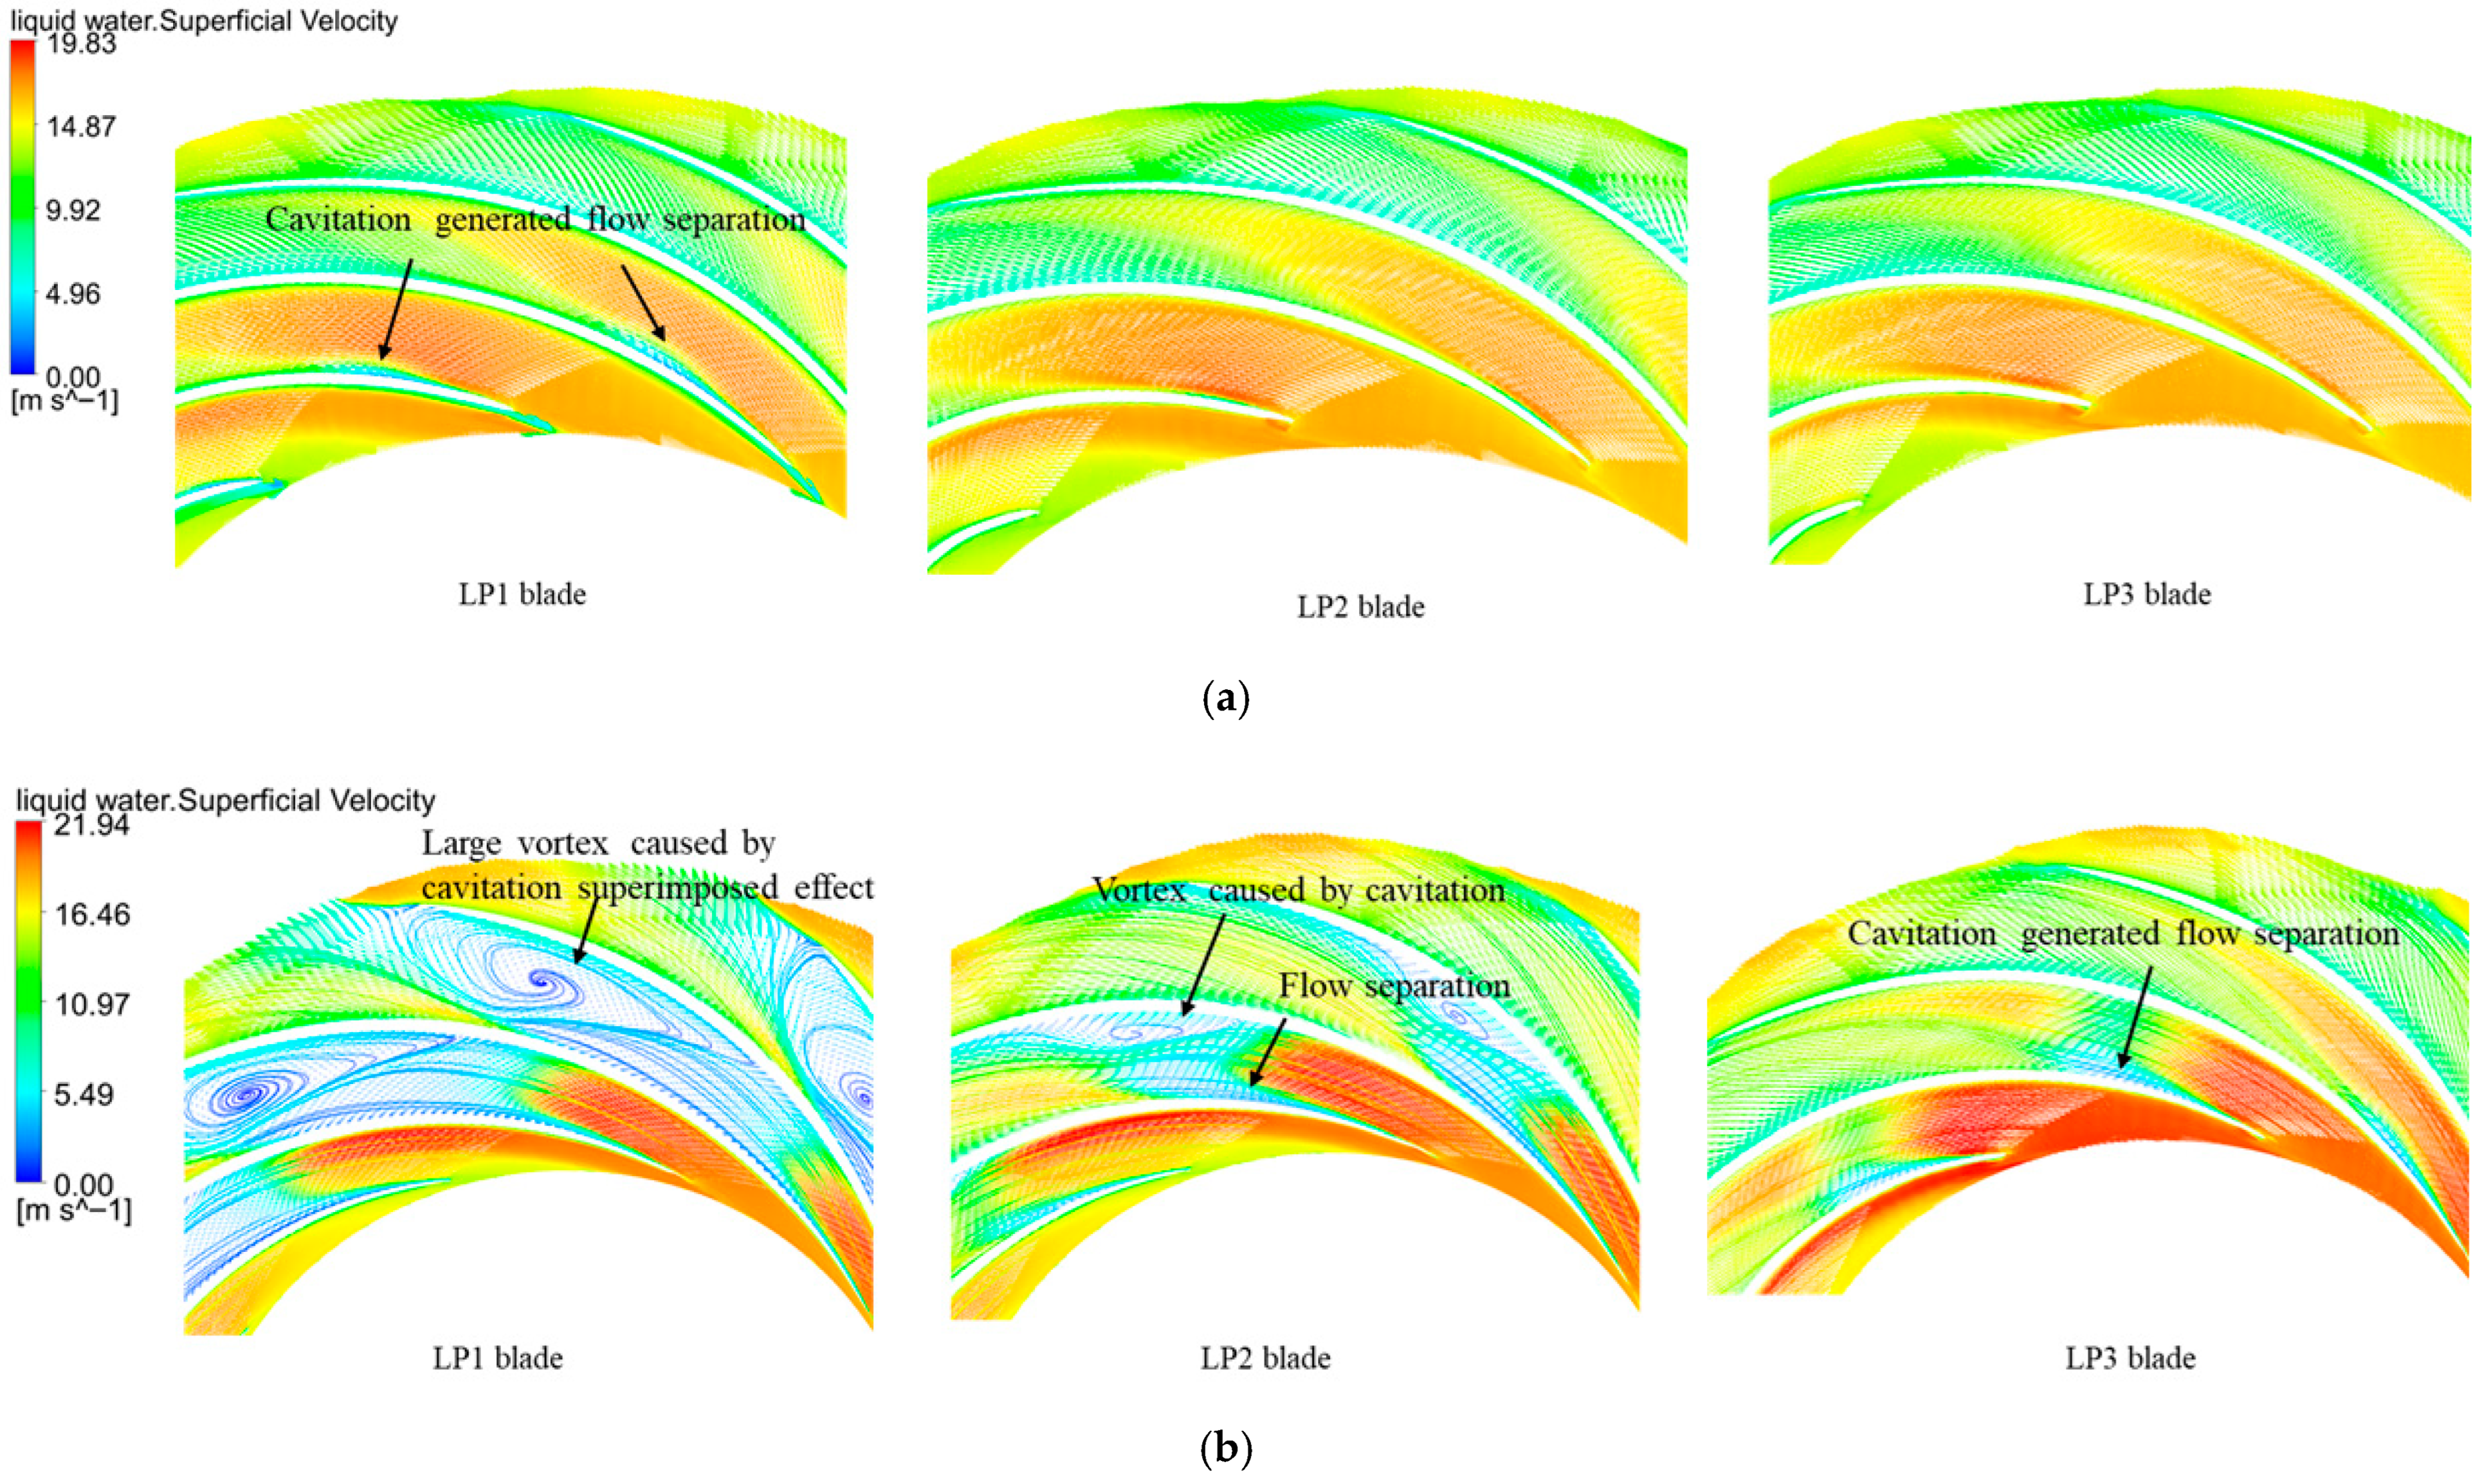
Figure 17 presents the velocity vector distribution of liquid water near the band of the three runner types with different cavitation numbers under the large-discharge operating condition of the pump. When the cavitation number is 0.265, a low-speed zone of liquid water appears in the LP1 blade runner near the low-pressure edge of the blade pressure surface, but it does not affect the water flow in the middle of the blade channel. The water flow inside the LP2 and LP3 blade runners basically adheres to the blade surfaces.
In Figure 17b, when the cavitation number is 0.139, the LP1 blade runner experiences severe flow separation due to intensified cavitation at the low-pressure edge of the blade pressure surface. Moreover, it superimposes the vortex caused by cavitation on the suction surface of the adjacent blade, forming a very large vortex in the downstream blade channel, which seriously hinders the downstream water flow. Cavitation near the low-pressure edge of the LP2 blade runner’s pressure surface causes flow separation. The flow separation caused by cavitation on the suction surface of adjacent blades cannot flow downstream smoothly with the main flow, forming a local vortex. However, the unstable flows caused by cavitation at these two positions do not have a significant superposition effect. A low-velocity zone of liquid water appears on the LP3 blade runner near the low-pressure edge of the blade pressure surface, but it does not affect the mainstream flow in the blade channel.
In Figure 17c, when the cavitation number is 0.117, due to large-scale cavitation occurring on both the pressure and suction sides of the LP1 blade runner, the velocity of liquid water in the blade channel is very low, forming a large-scale backflow zone that blocks the downstream water flow, resulting in a rapid decrease in the pump’s head and efficiency. The flow separation caused by cavitation on the pressure surface of the LP2 blade runner and the vortex caused by cavitation on the suction surface of the adjacent blades superimpose to form a very large vortex downstream of the blade channel, which hinders the downstream flow. Flow separation begins to occur in the low-velocity zone of liquid water near the low-pressure edge of the LP3 blade runner’s pressure surface, and the suction surface of adjacent blades also starts to show flow separation. However, these two flow separations do not superimpose to form a large vortex, and the water flow in the blade channel can still flow out smoothly. At this time, the LP3 blade runner still maintains a relatively high pump head and efficiency.
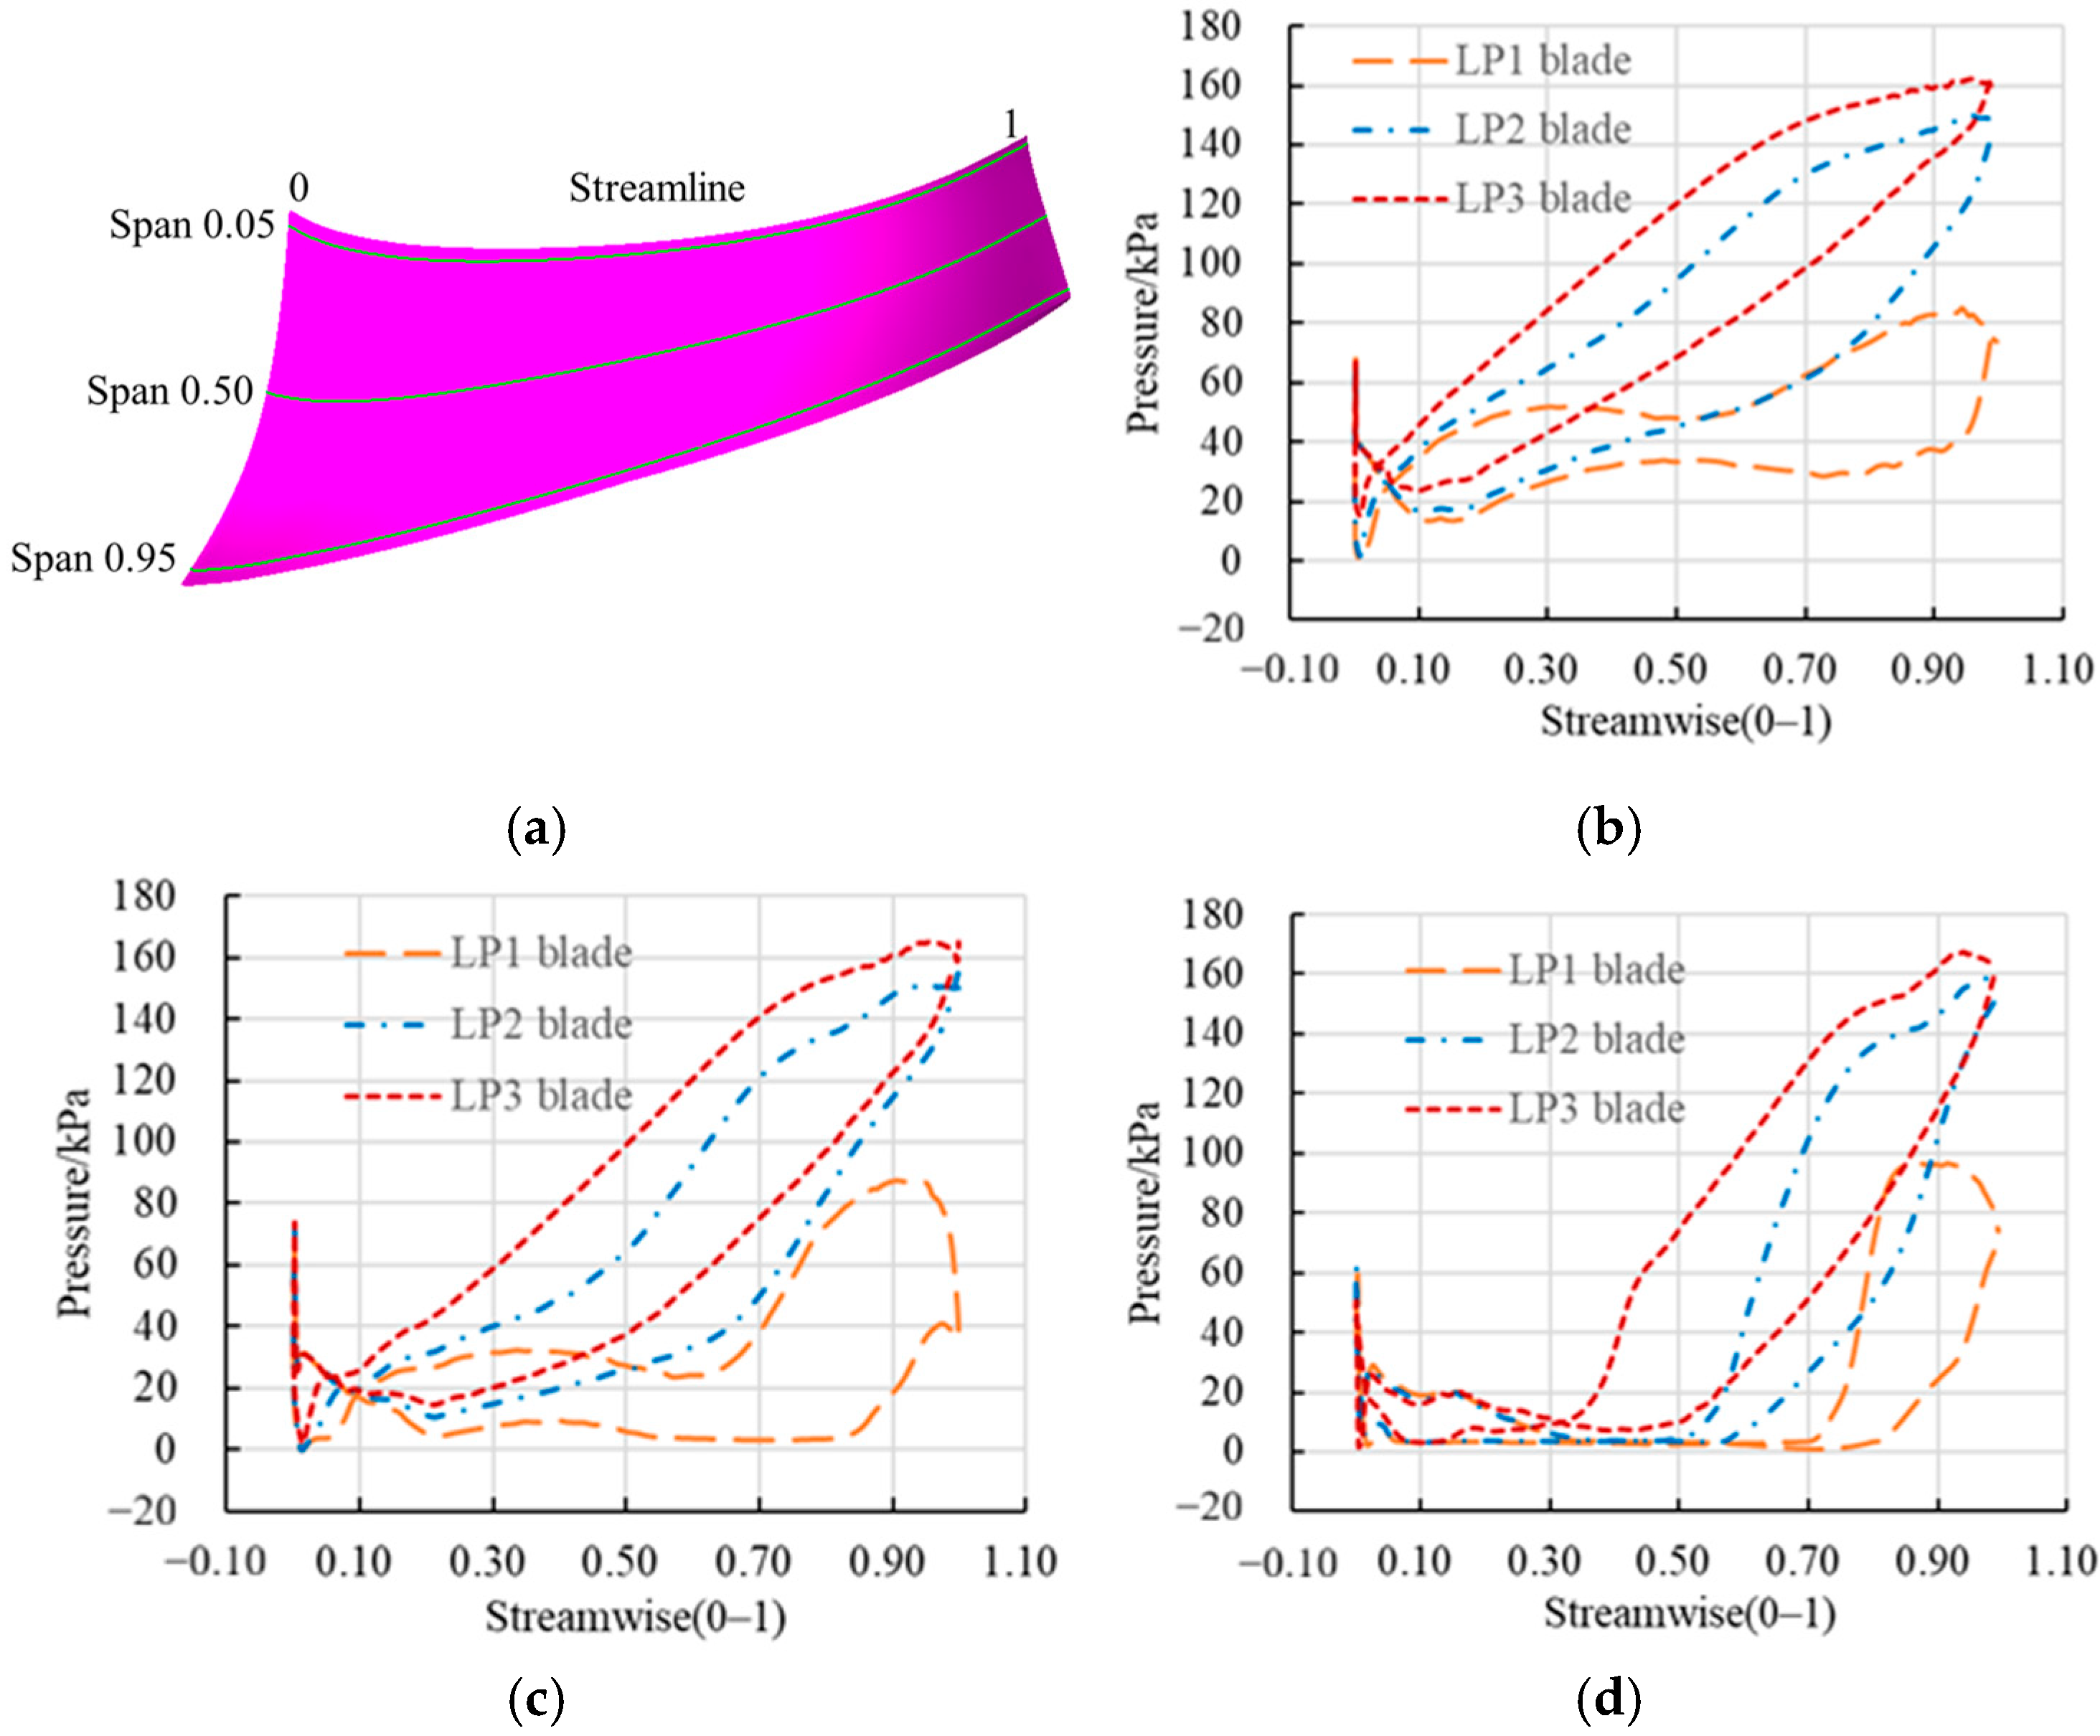
Figure 18 presents the pressure distribution diagrams of the three runner types under the large-discharge pump operating condition with a cavitation number of 0.117. Figure 18a shows the positions of the three selected sections: span 0.05 is near the crown, span 0.50 is the middle section, and span 0.95 is near the band. Along the streamline direction, the low-pressure side is defined as position 0, and the high-pressure side as position 1, corresponding to the abscissas in Figure 18b–d.
By comparing the pressure distribution curves of the three blades on the span 0.05 section in Figure 18b, it can be found that the pressure on the high-pressure side of the blades increases as the low-pressure edge blade installation angle increases. Among them, the pressure on the high-pressure side of the LP1 blade is the lowest, at 84,843.56 Pa, while the pressure on the high-pressure side of the LP3 blade is the highest, at 162,115.67 Pa, which is 77,272.11 Pa higher than that of the LP1 blade. The pressure surface of the LP1 blade shows a negative pressure gradient within the range of 0.3 to 0.5 of the streamline length, and the suction surface also shows a negative pressure gradient within the range of 0.5 to 0.7 of the streamline length. Although no cavitation bubbles are observed on the blades at this section position, the blade load distribution is still affected. The pressure distribution of the LP2 and LP3 blades is relatively better, and the overall pressure of the LP3 blade is higher than that of the LP2 blade.
According to Figure 18c, it can be seen that the pressure surface of the LP1 blade experiences a negative pressure gradient within the range of 0.3 to 0.65 of the streamline length, while the suction surface of the LP1 blade shows a pressure close to zero within the range of 0.53 to 0.85. This indicates that cavitation has occurred within the 0.53 to 0.85 range of the suction surface at this time, and the vaporized water has significantly reduced the load on the blade surface. Meanwhile, the pressure distributions of the LP2 and LP3 blades are relatively good.
According to Figure 18d, due to cavitation, all three types of blades exhibit negative pressure gradients in their pressure curves, but the position intervals vary significantly. For the LP1 blade, the pressure surface curve overlaps with the suction surface curve within the range of 0.3 to 0.7 of the streamline length (with a pressure difference of 0). For the LP2 blade, a similar overlap occurs within the range of 0.3 to 0.5 of the streamline length. This indicates that cavitation in the blade passages of LP1 and LP2 is severe in the corresponding position segments, and the water, becoming gaseous, is unable to flow downstream, resulting in the failure of the runner to perform work. For the LP3 blade, a negative pressure gradient occurs within the range of 0.2 to 0.4 of the streamline length, and slight cavitation occurs at this position. However, the flow separation caused by the cavitation does not affect the main flow, so the downstream flow is good, and the pressure difference between the pressure and suction sides of the blade quickly returns to normal. By comparing the pressure distribution curves of the three sections on the blade surfaces, it can be concluded that the pressure distribution of the LP3 blade is significantly better than that of the LP2 and LP1 blades. It has a favorable pressure gradient, a large pressure difference, and a high pressure at the high-pressure edge outlet, thus exhibiting excellent anti-cavitation performance.

4. Conclusions

This paper investigates the influence laws of three different installation angles of the blade’s low-pressure edge on the energy characteristics and cavitation characteristics of the pump-turbine, and explores an anti-cavitation design method for the Francis pump-turbine runner. The obtained influence laws and the design method are summarized as follows:
(1)
The low-pressure edge blade installation angles have a significant influence on the efficiencies of turbine operations and the internal flow field of the draft tube. The blade design with the LP1 blade installation angle calculated based on the normal outflow design principle can ensure the normal outflow of the runner under the rated turbine operation condition, with uniform internal flow lines in the draft tube and high energy recovery efficiency. It achieves a hydraulic efficiency of 94.05%, indicating that the low-pressure edge installation angle calculated based on the normal outflow principle in this paper is accurate. The installation angles of the LP2 and LP3 blades are slightly increased based on that of the LP1 blade, but this leads to disturbances and vortices in the draft tube; the greater the increase in the low-pressure edge installation angle, the more severe the disturbances and vortices in the draft tube.
(2)
Although the LP1 blade has high efficiency and a good flow pattern under the rated turbine operating condition, its cavitation performance under the pump operating condition is very poor. This is because the discharge at the pump’s optimal operating condition is generally greater than that at the turbine’s rated operating condition, resulting in the installation angle of LP1 being smaller than the inlet angles of water under the pump’s optimal operating condition. This causes impact and flow separation. Moreover, as the discharge increases, the attack angle of the inflow becomes larger, the impact becomes more intense, and the flow separation becomes more severe, causing a low-pressure area on the blade. Especially under the condition of a low cavitation number, the large areas of low pressure on the blade’s suction surface accelerate water vaporization, and the flow separation on the pressure surface of the adjacent blade produces an additive effect, forming a large vortex, which causes the pump performance to decline rapidly. The LP2 and LP3 blades improve the pump’s inlet conditions by increasing the low-pressure edge blade installation angles and reducing the attack angles under the optimal pump operating condition and large-discharge condition, thereby enhancing the performance under pump operating conditions.
(3)
By comparing the cavitation performance of the LP2 and LP3 blades under pump operating conditions, it is found that the improvement effect of LP2’s blade installation angle on cavitation performance under large-discharge conditions is less than that of LP3’s. Through an analysis of the internal flow field, it is discovered that although the installation angle of the LP2 blade has reduced the attack angle of incoming flow and improved the flow separation problem on the blade pressure surface caused by inlet impact, the flow separation problem caused by the pressure decrease on the blade suction surface is not effectively solved. As the cavitation number decreases, the flow separation on the blade pressure surface and that on the suction surface of the adjacent blade form a superimposed effect, resulting in a large-area vortex and hindering water flow. However, the installation angle of the LP3 blade at the band is 1.8° larger than that of the LP2 blade at the band, and the blade wrap angle of the LP3 blade is reduced by 4.65°. This design further reduces the attack angle of incoming flow, reduces flow separation on the blade pressure surface, and mitigates the formation of the low-pressure area in the middle position of the blade suction surface. It effectively avoids the superimposed effect between the flow separation on the blade pressure surface caused by inlet impact and that on the adjacent blade suction surface caused by cavitation-induced low-pressure areas, thereby significantly improving cavitation performance under large-discharge and low cavitation number conditions.
(4)
Taking into account the turbine operation efficiency, pump operation efficiency, and pump cavitation performance, the LP3 blade exhibits the best comprehensive performance for the pump-turbine researched in this paper. With the LP1 blade as the reference, although the LP3 blade shows a 1.31% decrease under rated turbine operation, its efficiency in pump design operation increases by 0.48%, and its efficiency in the pump’s large-discharge and high cavitation number operation condition increases by 1.29%. Under this condition, the LP3 blade still maintains an efficiency of 73.96% with a good internal flow state. However, under this condition, the LP1 and LP2 blades could no longer operate due to internal flow field blockage caused by severe internal cavitation. In actual power station operation, the LP3 blade has good cavitation performance, which can reduce unit maintenance downtime and extend the runner’s service life.
(5)
The research has found that when designing the blades of a pump-turbine runner, using the traditional method of specifying velocity moment is very complicated. The distribution of velocity moment makes it difficult to simultaneously meet the comprehensive performance requirements of both pump and turbine operating conditions, and it is not easy to determine, with a large trial calculation workload. However, this paper adopts the method of specifying blade installation angle distribution, which is simple and effective. Firstly, the blade installation angle of the low-pressure side is calculated according to the normal outflow principle of the turbine’s rated operating condition; then, the installation angle at the band position (where cavitation is prone to occur) is increased, with a gradual change implemented in the middle section, to obtain the corrected low-pressure edge blade installation angle; finally, the blade design is carried out based on the corrected low-pressure edge blade installation angle. The determination of the increment value requires calculation according to the flow parameters and changes in the blade wrap angle. The research object of this paper is the pump-turbine in the 200 m head section. Within the range of 5° control for blade wrap angle changes, the low-pressure edge blade installation angle is increased by approximately 1 to 2°, and after two trials, a relatively optimal LP3 blade installation angle is obtained. This method can be applied to the research, modification, and optimization of Francis pump-turbine runners.

Author Contributions

Conceptualization, H.R. and X.L.; methodology, H.R.; software, W.C.; validation, C.W.; formal analysis, Q.Z.; investigation, W.C.; resources, C.W.; data curation, L.Q.; writing—original draft preparation, H.R.; writing—review and editing, X.L.; visualization, W.C.; supervision, Q.Z.; project administration, H.R.; funding acquisition, H.R. All authors have read and agreed to the published version of the manuscript.

Funding

This work was supported by the Open Research Fund Program of State Key Laboratory of Water Engineering Ecology and Environment in Arid Area, Xi’an University of Technology (Grant No. 2023KFKT-22) and Natural Science Basic Research Program of Shaanxi Province (No. 2023-JC-YB-407), and Natural Science Basic Research Program of Shaanxi Province (No. 2024JC-YBMS-447).

Institutional Review Board Statement

Not applicable.

Informed Consent Statement

Not applicable.

Data Availability Statement

The original contributions presented in this study are included in the article. Further inquiries can be directed to the corresponding author.

Acknowledgments

We acknowledge the technical support provided by the Special Pump System Technology National and Local Joint Engineering Research Center.

Conflicts of Interest

Author C.W. was employed by the company AECC. The remaining authors declare that the research was conducted in the absence of any commercial or financial relationships that could be construed as a potential conflict of interest.

References

  1. Luo, X.; Zhu, G.; Feng, J. Progress and development trends in hydraulic turbine technology. J. Hydroelectr. Eng. 2020, 39, 1–18. [Google Scholar]
  2. Wang, L.; Tang, F.P.; Liu, H.Y.; Zhang, X.; Sun, Z.; Wang, F. Investigation of cavitation and flow characteristics of tip clearance of bi directional axial flow pump with different clearances. Ocean. Eng. 2023, 288, 115960. [Google Scholar] [CrossRef]
  3. Liu, H.Y.; Tang, F.P.; Shi, L.J.; Dai, L.; Shen, J.; Liu, J. The analysis of cavitation flow and pressure pulsation of bi-directional pump. J. Mar. Sci. Eng. 2023, 11, 268. [Google Scholar] [CrossRef]
  4. Liu, T.; Feng, C.; Yang, M.; Tao, J.; Zhu, H. Experimental investigation on cavitation induced noise and vibration characteristics of mixed-flow pump model. Fluid Mach. 2023, 51, 7–12. [Google Scholar]
  5. Tao, Y.; Qian, Y.; Xiang, X. Reaserch and Repair Applcation on Cavitation Erosion of Runner Blades in Shitang Power Statio. Large Mot. Technol. 2023, 5, 77–89. [Google Scholar]
  6. Kang, W.; Zhou, L.; Wang, Z. Analysis of flow characteristics and cavitation in the vanes of a reversible pump-turbine in pump mode. J. Energy Storage 2023, 68, 690–699. [Google Scholar] [CrossRef]
  7. Yang, W. Cavitation Characteristics of Pump Turbine in High Head Pumped Storage Power Station; Xi’an University of Thechnology: Xi’an, China, 2017. [Google Scholar]
  8. Zhang, J. Study on Cavitation Characteristics of the Pump-Turbine Under Partial Load Condition; Lanzhou University of Technology: Lanzhou, China, 2017. [Google Scholar]
  9. Qian, X. Research on the Effect Mechanism of Pump’s Pulsation Characteristics and Cavitation Characteristics on Blades Stress; Shanghai Jiao Tong University: Shaihai, China, 2020. [Google Scholar]
  10. Ruan, H.; Guo, P.; Yu, L.; Zhou, C.; Chao, W.; Li, X. Cavitation induced flow instability mechanism of pump-turbine under pump conditions. J. Drain. Irrig. Mach. Eng. 2023, 41, 779–786. [Google Scholar]
  11. Tao, R.; Zhou, X.; Xu, B. Numerical investigation of the flow regime and cavitation in the vanes of reversible pump-turbine during pump mode’s starting up. Renew. Energy 2019, 141, 9–19. [Google Scholar] [CrossRef]
  12. Yuan, Z.; Zhang, Y.; Zhang, J.; Zhu, J. Experimental studies of unsteady cavitation at the tongue of a pump-turbine in pump mode. Renew. Energy 2021, 177, 1265–1281. [Google Scholar] [CrossRef]
  13. Wu, Y.; Zhu, D.; Tao, R.; Xiao, R.; Liu, W. Analysis of two-phase flow in cavitation condition of pump-turbine based on dynamic mode decomposition method in turbine mode. J. Energy Storage 2022, 56, 107–113. [Google Scholar] [CrossRef]
  14. Wang, C.; Zhang, Y.; Yuan, Z.; Ji, K. Development and application of the entropy production diagnostic model to the cavitation flow of a pump-turbine in pump mode. Renew. Energy 2020, 154, 774–785. [Google Scholar] [CrossRef]
  15. Cao, J.; Luo, Y.; Presas, A. Numerical analysis on the modal characteristics of a pumped storage unitrunner in cavitating flow. J. Energy Storage 2022, 56, 105998–106010. [Google Scholar] [CrossRef]
  16. Li, Q.; Chen, X.; Meng, Q.; Cai, T.; Zhou, F.; Wei, X. Analysis of Correlation Characteristics of Pump-turbine under Different Cavitation Numbers. Trans. Chin. Soc. Agric. Mach. 2020, 51, 130–138. [Google Scholar]
  17. Li, Q.; Zhang, J.; Liu, M.; Liu, Q. Analysis of the Internal Cavitation Characteristics of a Reversible Turbine under the Pump Condition. Therm. Energy Power Eng. 2017, 32, 84–89. [Google Scholar]
  18. Li, D.; Zhu, Y.; Lin, S.; Gong, R.; Wang, H.; Luo, X. Cavitation effects on pressure fluctuation in pump-turbine hump region. J. Energy Storage 2022, 47, 936–945. [Google Scholar] [CrossRef]
  19. Lu, G.; Zuo, Z.; Sun, Y. Experimental evidence of cavitation influences on the positive slope on the pump performance curve of a low specific speed model pump-turbine. Renew. Energy 2017, 113, 1539–1550. [Google Scholar] [CrossRef]
  20. Fu, X.; Li, D.; Wang, H. Cavitation mechanism and effect on pump power-trip transient process of apumped-storage unit. J. Energy Storage 2023, 66, 405–457. [Google Scholar] [CrossRef]
  21. Guo, J.; Zhou, D.; Shao, Y. Simulation of Load Rejection Transition Process of Pump Turbine Based on Cavitation. J. Eng. Thermophys. 2023, 44, 2106–2111. [Google Scholar]
  22. Shang, C. Cavitation Effect on the S-Shaped Characteristics of Pump-Turbine; Harbin Institute of Technology: Harbin, China, 2020. [Google Scholar]
  23. Song, L. Study on the Influence of Cavitation on The Hump Characteristics of Pump-Turbine; Harbin Institute of Technology: Harbin, China, 2019. [Google Scholar]
  24. Liang, Y.; Ma, Y.; Zhou, L.; Liu, Y. New Developments in the Research of Wear-Resistant Coatings for Hydraulic Machinery. J. Beijing Univ. Civ. Eng. Archit. 2025, 41, 123–127. [Google Scholar]
  25. Li, Y.; Yang, W.; Zheng, Z.; Zhang, T.; Li, J. Cavitation Characteristics of Optimized Runner in ShaHe Pumped Storage Power Station. J. Northeast. Electr. Power Univ. 2021, 41, 82–89. [Google Scholar]
  26. Hu, Z.; Cheng, Y.; Liu, D.; Chen, H.; Ji, B.; Ding, J. Broadening the operating range of pump-turbine to deep-part load by runner optimization. Renew. Energy 2023, 207, 73–88. [Google Scholar] [CrossRef]
  27. Ni, N.; Lai, X.; Li, P. Effects of low-pressure edges of short blades on cavitation performance of pump-turbine. J. Hydroelectr. Eng. 2019, 38, 97–105. [Google Scholar]
  28. Tao, R.; Xiao, R.; Wang, F.; Liu, W. Improving the cavitation inception performance of a reversible pump-turbine in pump mode by blade profile redesign, design concept, method and applications. Renew. Energy 2019, 133, 325–342. [Google Scholar] [CrossRef]
  29. Zhu, D.; Xiao, R.; Liu, W. Influence of leading-edge cavitation on impeller blade axial force in the pump mode of reversible pump-turbine. Renew. Energy 2021, 163, 939–949. [Google Scholar] [CrossRef]
  30. Ruan, H.; Liao, W.; Luo, X.; Zhao, Y.; Qin, H.; Yang, Z. Effects of low-pressure meridional position on cavitation performance for high-head pump-turbine. Trans. Chin. Soc. Agric. Eng. 2016, 32, 73–81. [Google Scholar]
  31. Ruan, H.; Luo, X.; Liao, W.; Zhao, Y. Effects of low-pressure edge thickness on cavitation performance and strength for pump-turbine. Trans. Chin. Soc. Agric. Eng. 2015, 31, 32–39. [Google Scholar]
  32. International Electrotechnical Comission. Hydraulic Turbines, Storage Pumps and Pump-Turbines Model Acceptance Tests; International standard IEC: Geneva, Switzerland, 1999. [Google Scholar]
  33. Ruan, H. Performance Analysis and Optimization for High-Head Pump-Turbine Considering the Compressibility of Water; Xi’an University of Technology: Xi’an, China, 2018. [Google Scholar]
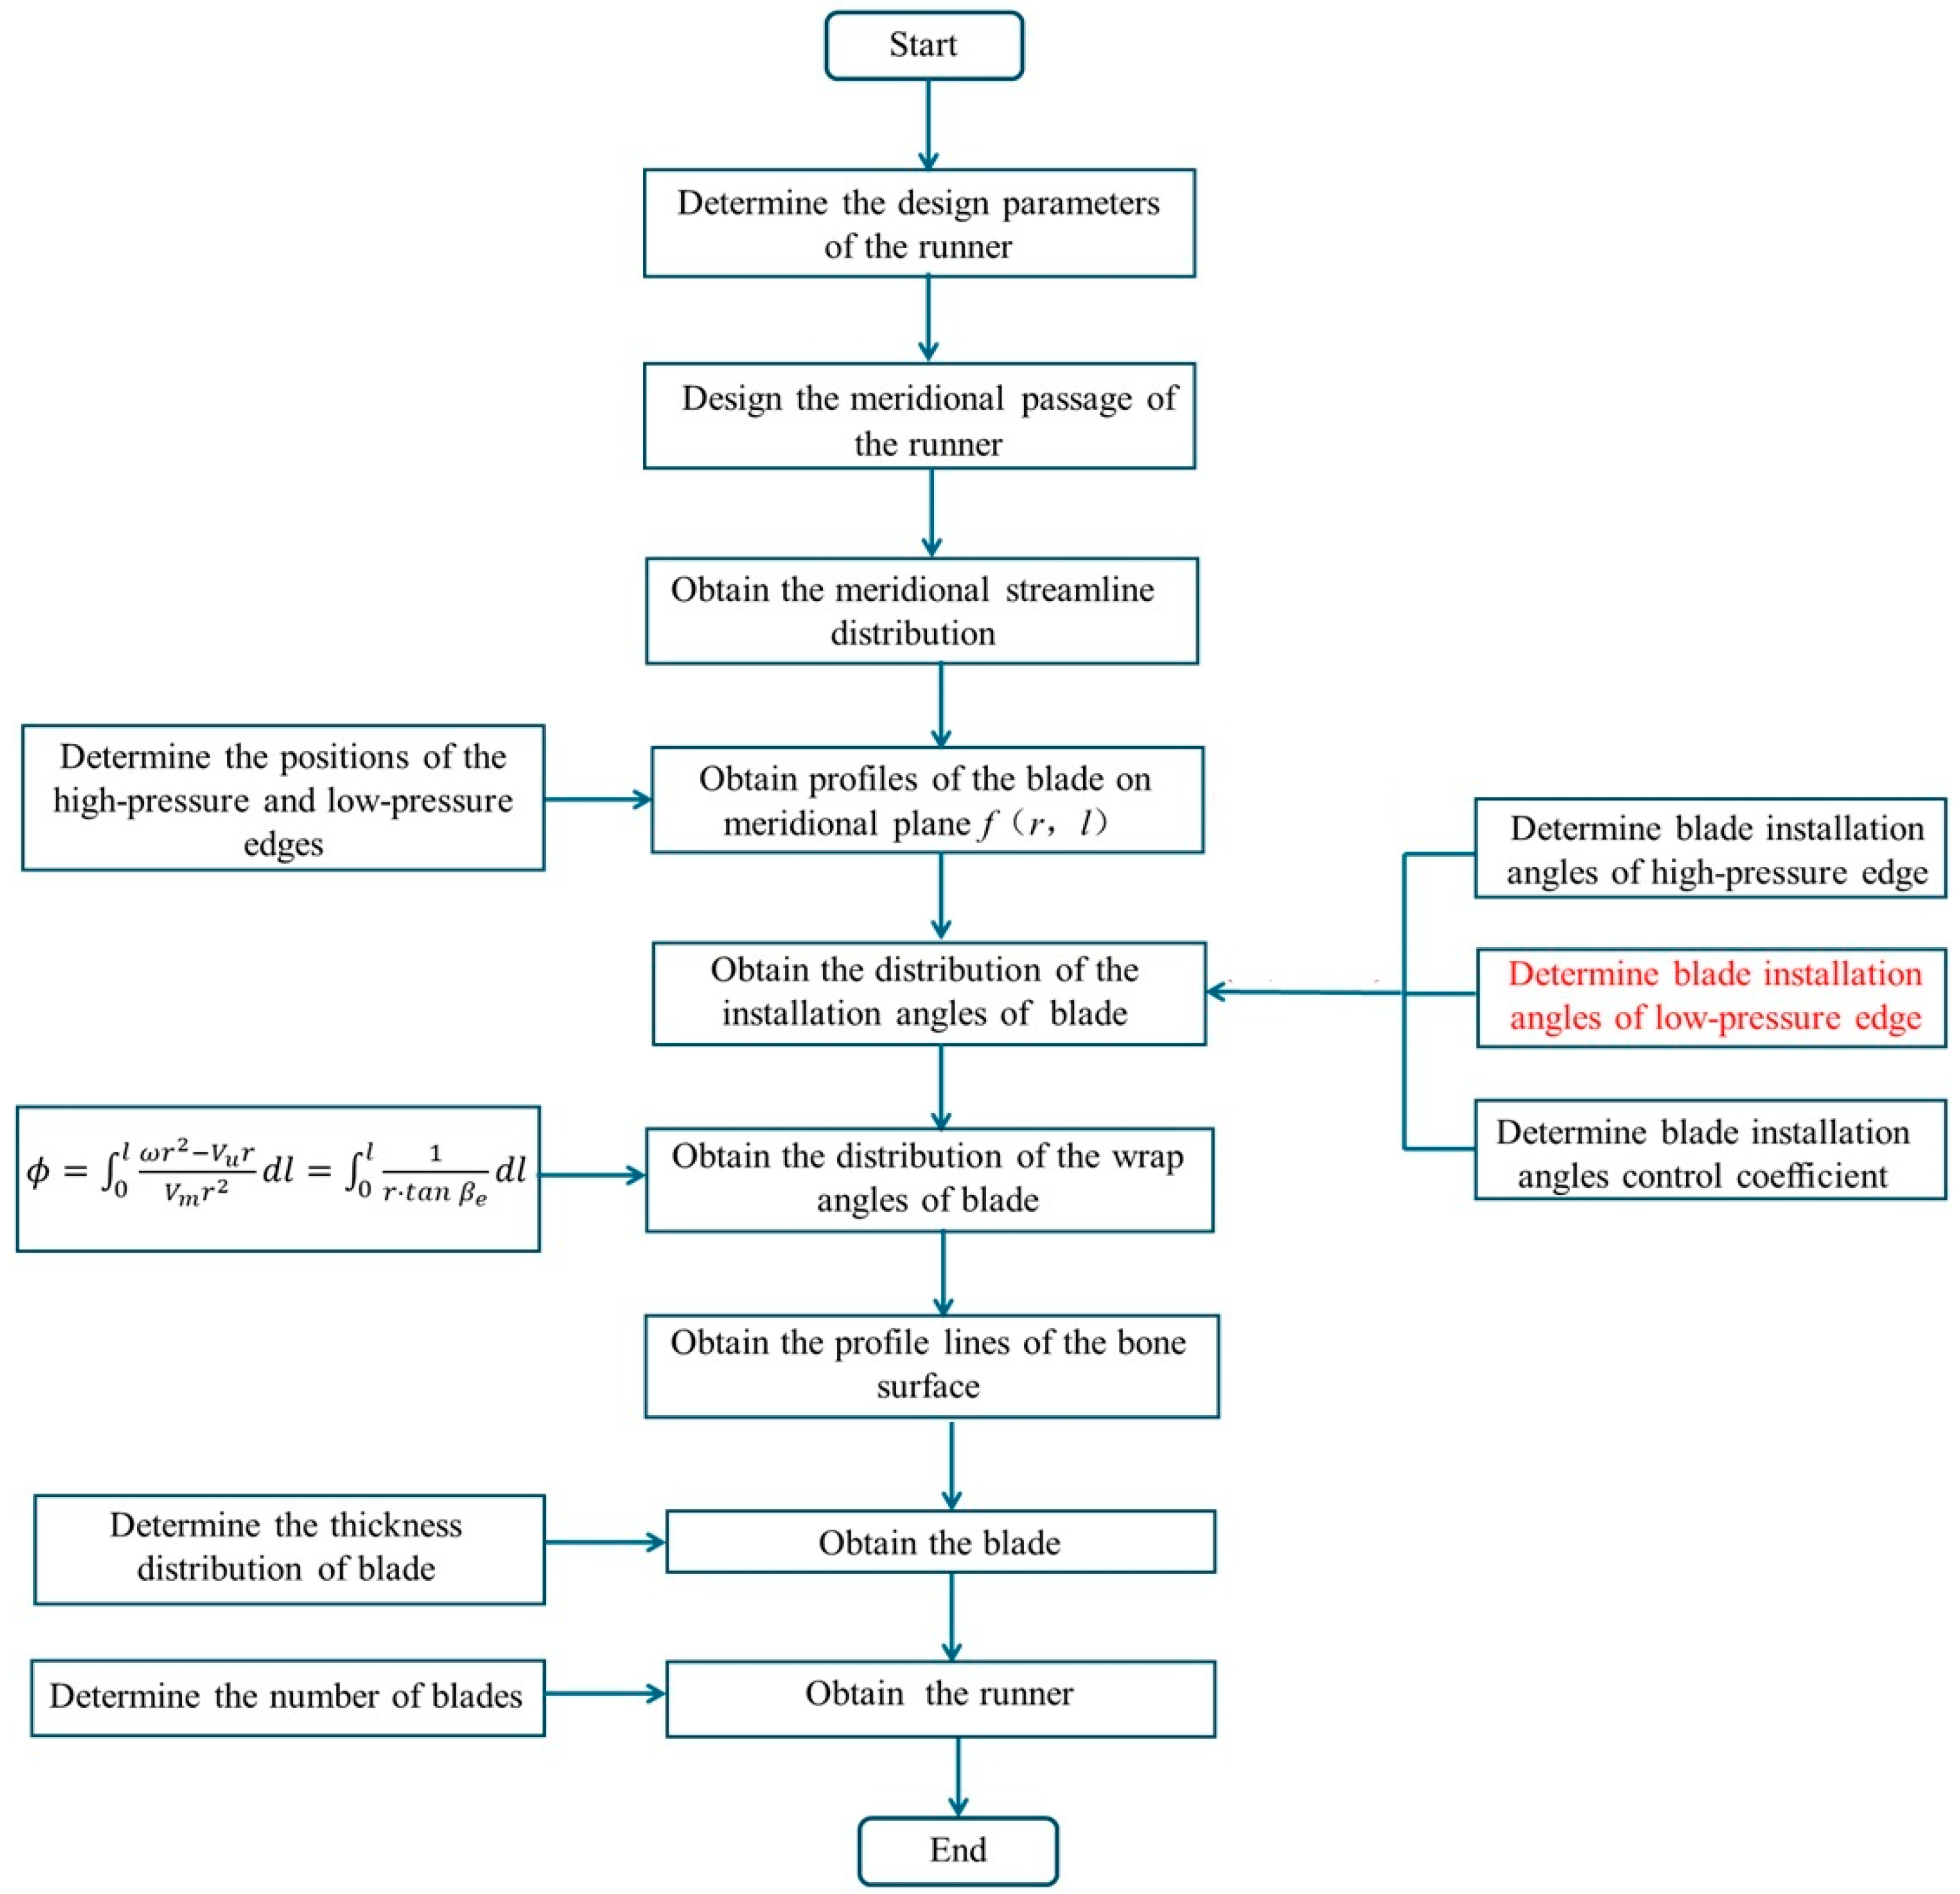
Figure 1. The design flowchart of the pump-turbine runner.
Fluids 10 00248 g001
Figure 2. The profile distribution of the blade on the meridional plane.
Fluids 10 00248 g002
Figure 3. Comparison of the blade angle distributions.
Fluids 10 00248 g003
Figure 4. Schematic diagram of blade parameters.
Fluids 10 00248 g004
Figure 5. Comparison of runner blades.
Fluids 10 00248 g005
Figure 6. The three-dimensional model of the pump-turbine.
Fluids 10 00248 g006
Figure 7. Grid independence validation.
Fluids 10 00248 g007
Figure 8. Mesh distribution. (a) Spiral casing; (b) Guide vanes; (c) Runner; (d) Draft tube.
Fluids 10 00248 g008
Figure 9. Experimental validation. (a) Pump and turbine model test rig; (b) The H-Q curves of the pump operating condition; (c) Cavitation test; (d) Numerical simulation of cavitation; (e) Cavitation inception curves.
Fluids 10 00248 g009
Figure 10. Comparison of the efficiency under turbine operating conditions.
Fluids 10 00248 g010
Figure 11. Streamlines distribution under the rated operating condition of the turbine. (a) Streamlines distribution in runners; (b) Streamlines distribution in draft tubes.
Fluids 10 00248 g011
Figure 12. Cavitation number and efficiency curve of the optimal operating condition of the pump.
Fluids 10 00248 g012
Figure 13. Cavitation contours of three types of runners under optimal operating conditions of the pump. (a) Vapor water volume fraction on blades when cavitation number is 0.192; (b) Vapor water volume fraction on blades when cavitation number is 0.088.
Fluids 10 00248 g013
Figure 14. Velocity vectors of the three types of runners near the band section under the optimal operating condition of the pump. (a) Cavitation number is 0.192; (b) Cavitation number is 0.088.
Fluids 10 00248 g014
Figure 15. Cavitation number and efficiency curve of large-discharge operating condition of pump.
Fluids 10 00248 g015
Figure 16. Isosurface of vapor water volume fraction of three types of runners under the large-discharge operating condition of the pump. (a) Cavitation number is 0.265; (b) Cavitation number is 0.139; (c) Cavitation number is 0.117.
Fluids 10 00248 g016
Figure 17. Velocity vector diagrams of the three types of runners near the band section under the large-discharge operating condition of the pump. (a) Cavitation number is 0.265; (b) Cavitation number is 0.139; (c) Cavitation number is 0.117.
Fluids 10 00248 g017aFluids 10 00248 g017b
Figure 18. Pressure distribution diagrams of the three types of runners under the large-discharge operating condition of the pump, and the cavitation number is 0.117. (a) Span and streamline numbers of blades; (b) Pressure distribution curves of span 0.05; (c) Pressure distribution curves of span 0.50; (d) Pressure distribution curves of span 0.95.
Fluids 10 00248 g018
Table 1. Parameters of the pump-turbine.
ParameterValue
Maximum head of the turbine214.7 m
Rated head of the turbine190.0 m
Minimum head of the turbine160.0 m
Maximum head of the pump216.7 m
Minimum head of the pump163.7 m
Table 2. The parameters of the pump cavitation condition.
Operating Condition SpeedGuide Vane OpeningDischargeCavitation Number of Device
nm (r/min)αm (°)Qm (m3/s)σp
OP4−900220.322790.288
OP5−900220.378890.319
Disclaimer/Publisher’s Note: The statements, opinions and data contained in all publications are solely those of the individual author(s) and contributor(s) and not of MDPI and/or the editor(s). MDPI and/or the editor(s) disclaim responsibility for any injury to people or property resulting from any ideas, methods, instructions or products referred to in the content.