Abstract
As an efficient drag reduction technique, ventilated cavity technology demonstrates significant application in underwater launch systems. This study employs numerical simulations to systematically examine the ventilated cavity flow characteristics and cavity–rudder interaction mechanisms for a rudder-equipped axisymmetric body. Numerical simulation predicts the gas leakage behavior, cavity geometry, and internal flow structure. The results indicate that the development of the ventilated cavity proceeds through three distinct stages: rapid growth, slow development, and quasi-periodic shedding. During this process, local high pressure at the leading edge of the rudder suppresses cavity growth, while cavity shedding is associated with re-entrant jet effects. Under the influence of the ventilated cavity, the overall load on the entire body and the local load on the rudder exhibit consistent patterns: Fx > Fy > Fz ≈ 0 and Tz > Tx ≈ Ty ≈ 0, with Fy and Tz fluctuating the most violently. The shedding cavity clusters are primarily concentrated at the rudder root during the quasi-periodic shedding stage.
1. Introduction
Ventilated supercavity technology achieves effective drag reduction for the axisymmetric body in high-speed underwater motion, providing promising applications in marine engineering, high-speed underwater vehicles, and hydrodynamic systems [1]. Compared to traditional fluid drag reduction methods, ventilated supercavity technology alters the flow patterns around the body through cavity formation, effectively reducing hydrodynamic resistance to enhance operational efficiency and reduce energy consumption [2,3,4,5,6]. Therefore, research on unsteady cavity shedding holds significant importance for engineering design.
Current research on ventilated supercavities around the axisymmetric body primarily focuses on three aspects: the morphology and closure mechanisms of ventilated cavities, the characteristics of vortex evolution under cavitation influence, and the pressure fluctuations in ventilated cavity flows [7]. Specifically, regarding the morphology of ventilated cavities and their closure mechanisms, Yao et al. [8] systematically investigated cavity formation, evolution, and collapse through water tunnel experiments. The results indicated that cavity breakup generated bidirectional jets, and the jet intensity diminished with decreasing cavitation number. Zhi et al. [9] numerically investigated free-surface effects on ventilated supercavity dynamics. They indicated that free surface significantly altered the cavity features, and the internal cavity flow exhibited distinct zonal characteristics: a ventilation-affected zone, an internal boundary layer zone, and a reverse flow zone. Liu et al. [10] combined experiments and simulations to study partial cavitation characteristics on the axisymmetric body at varying angles of attack. Wang et al. [11] employed both experimental and numerical analyses to investigate the unsteady shedding characteristics of partial ventilated cavitation on the axisymmetric body. Three stages of cavity formation, i.e., rapid growth, pulsating development, and periodic shedding, were identified. Lv et al. [12] examined three-dimensional unsteady characteristics of ventilated cavitation on the axisymmetric body. The results revealed that re-entrant jets at different circumferential positions moved upstream at varying velocities, exhibiting strong three-dimensional asymmetry. Hao et al. [13] experimentally and theoretically analyzed gas ingestion and leakage mechanisms under different ventilated cavity flow modes. Wu et al. [14] compared the re-entrant jet cavity (RJ) and twin-vortex cavity (TV) closure modes using atomized PIV (Particle Image Velocimetry). Yang et al. [15] experimentally characterized tail-ventilated cavity collapse, identifying three modes: intact cavity (IC), partially broken cavity (PBC), and pulsating foam cavity (PFC). Karn et al. [16] systematically quantified the effects of flow velocity, ventilation rate, and cavitator size on supercavity closure mode transitions using high-speed photography and pressure measurements in a recirculating water channel.
Regarding the vortex evolution characteristics under the cavitation effect, Wang et al. [17] applied proper orthogonal decomposition (POD) analysis to bluff-body wakes, revealing that as the gas coefficient increased, the cavity area expanded, and the vortex shedding frequency decreased. Yu et al. [18] employed large eddy simulation (LES) to analyze the shedding characteristics of ventilated cavities on the axisymmetric body. They reported that foamy cavity (FC) or continuous transparent and foamy cavity (CTFC) flow regimes featured shedding driven by localized high pressure, re-entrant jets, and vortices. In supercavity (SC) regimes, tail vortex pairs exhibited pronounced shear effects. Xie et al. [19] numerically investigated the influence of ventilation rate on the evolution of vortex structures at the tail of ventilated supercavities. Jiang et al. [20] injected high-temperature gas to identify three cavity zones: ventilation-affected, boundary layer, and reverse flow. Du et al. [21] proposed a new model based on cavity number density and found that the inhomogeneity of vortex distribution was the dominant factor in collapse dynamics. Wang et al. [22] examined the flow field structure and vortex shedding dynamics of ventilated cavities. Cui et al. [23] numerically analyzed the characteristics of vortex structures in partial cavitation flows around the axisymmetric body. Three typical vortex structures were identified: large-scale cloud-like vortices, U-shaped vortices, and small-scale vortices.
Regarding pressure behavior in ventilated cavitation flows, Zhang et al. [24] combined experimental and numerical research to identify periodic vortex shedding as the primary excitation mechanism for pressure waves around underwater vehicles. Karn et al. [25] conducted high-speed water tunnel experiments to compare the formation, maintenance, and collapse characteristics of artificial supercavities under free closure models (FCM) and confined closure models (CCM). Sun et al. [26] employed multi-field synchronous measurements to investigate the evolution of natural cloud cavitation around the conical axisymmetric body. They observed that cavitation development can be divided into three stages: attached cavity growth, shedding, and collapse. The evolution of attached cavities and the collapse of shed cavities induced intense pressure fluctuations. Melissa et al. [27] conducted numerical simulations to investigate the internal pressure characteristics of artificially ventilated cavities. They indicated that the cavity interior does not maintain a uniform pressure field but instead exhibits multi-peak distributions, with different peaks corresponding to distinct characteristic regions. Shao et al. [28] numerically explored the microcavity drag reduction characteristics of axisymmetric underwater vehicles. Chen et al. [29] employed pressure spectral analysis to examine the influence of exhaust jets on the morphology and surface pressure of ventilated cavities on underwater vehicles. Zhang et al. [30] utilized a high-speed visualization system to study the influence of air injection on pressure fluctuations in unsteady cloud cavitation flows. Zhao et al. [31] designed an active ventilation dual-vehicle water-exit device and found that active ventilation reduced inter-vehicle cavitation suppression and collapse-induced pressure peaks.
Critically, existing research primarily addresses the bare axisymmetric body, where cavity evolution and hydrodynamic characteristics are relatively well established. However, practical engineering applications require the rudders for motion stability, which fundamentally alter flow structures. These rudders would introduce complex hydrodynamic coupling between ventilated cavities and rudders. Consequently, results from the bare axisymmetric body studies are difficult to directly apply to the rudder-equipped axisymmetric body.
In recent years, several scholars have begun examining cavity flow phenomena around the rudder-equipped axisymmetric body. For instance, Zhou et al. [32] conducted numerical simulations on the cavity morphology and hydrodynamic characteristics of supercavitating vehicles with tail fins, highlighting the critical role of tail fins in maintaining vehicle attitude and stability under supercavitating flow conditions. Pei et al. [33] determined that the sweep angle and installation position of tail fins significantly influence supercavity tail closure and vehicle mechanical properties by analyzing cavity geometry, drag, lateral forces, and normal moments under varying operating conditions. Xing et al. [34] investigated the hydrodynamic effects of tail fins on ventilated supercavitating vehicles through water tunnel tests and analyzed the generation and development processes of ventilated supercavities. Zhou et al. [35] numerically explored the influence of bow rudder configurations on ventilated supercavity morphology and hydrodynamic characteristics. Shang et al. [36] numerically examined the supercavitation characteristics of submarines with different configurations (bare hull, appendage-equipped, and full-configuration). They indicated that appendages raise supercavity expansion and coverage over the stern, significantly reducing drag.
Although existing studies provide preliminary insights into rudder–cavity interactions and the resulting body forces, the fundamental coupling mechanisms between ventilated cavities and hydrodynamic rudders remain insufficiently resolved, particularly regarding the influence of unsteady shedding of the ventilated cavity on the hydrodynamic characteristics and flow field distribution around the hydrodynamic rudder itself. Therefore, this study employs high-resolution numerical simulations based on the volume of fluid (VOF) method and a mixture multiphase flow model, focusing on the unsteady cavity evolution influenced by the rudder, the re-entrant jet-driven quasi-periodic shedding mechanisms, and the effects of cavitation shedding on rudder hydrodynamics and flow field characteristics. This paper is structured as follows. First, numerical simulations are conducted under the conditions of Fr = 6.033, CQ = 0.082, and the angle of attack is 0°, and the simulation results are compared with experiments to verify the reliability of the numerical approach. Second, the evolution of the ventilated cavities around the rudder-equipped axisymmetric body is investigated. Then, the influence of cavity shedding on the hydrodynamic characteristics of the rudder and the entire axisymmetric body is examined. Finally, the effect of cavity shedding on the flow field distribution near the rudder is analyzed.
2. Methodology
This study primarily focuses on the numerical simulation of ventilated cavitating flow around an axisymmetric body under typical operational parameters. These parameters include the inflow velocity, the angle of attack, and the ventilation rate. Here, the inflow velocity refers to the relative speed of the fluid against the body, the angle of attack is the angle between the axis of the body and the horizontal direction, and the ventilation rate is the volume of gas injected into the flow field per unit time. In practical research, to satisfy the similarity law, the velocity and ventilation rate are typically non-dimensionalized as the Froude number and the ventilation coefficient. (The angle of attack does not require non-dimensionalization, as it is inherently dimensionless.) The calculation formulas of the Froude number and air entrainment coefficient are shown in Equations (1) and (2):
where Uin is the inflow velocity; D is the diameter of the axisymmetric body of 70 mm; g is the gravitational acceleration of 9.81 m/s2, the direction of which is along the negative y-axis; and Qin is the ventilation flow rate.
This study primarily investigates the flow characteristics of ventilated cavities around a rudder-equipped axisymmetric body, with an Fr of 6.033, a CQ of 0.082, and an of 0°. To accurately simulate the ventilated cavitating flow around the axisymmetric body under this operating condition and to properly reveal the unsteady evolution characteristics of the ventilated cavity and its interaction mechanisms with the hydrodynamic rudders in subsequent analyses, it is essential to appropriately select the governing equations, grid generation strategy, and numerical solution methods. Detailed discussions on these aspects will be provided in the subsequent parts of this section.
2.1. Governing Equations
The ventilated cavity flow in this study involves only the interaction between the gas and liquid phases, with liquid water serving as the primary phase and air as the secondary phase. This study employs a mixture multiphase model, incorporating gravity and surface tension effects to capture the essential gas–liquid flow characteristics. The governing equations are fully described by the continuity and momentum equations, as shown in Equations (3) and (4), respectively.
where ρm is the mixed density, is the mass average velocity, and is the volume fraction of the k-th phase.
where n is the number of phases, is the viscosity of the mixture, and is the drift velocity of the k-th phase. represents the velocity of the secondary phase k (air) relative to the primary phase q (water), calculated using the algebraic drift formulation proposed by Manninen et al. [37], as detailed below:
where is the relative Reynolds number, defined as follows:
is the Schiller–Naumann drag coefficient, defined as follows:
is the acceleration of the secondary phase k particles, defined as follows:
is the characteristic length scale of the interaction, which, in this study, is taken as the particle diameter of the secondary phase k.
In gas–liquid momentum transfer, turbulence plays a critical role in governing the evolution of the ventilated cavity. This study employs the detached eddy simulation (DES) method to resolve multi-scale turbulent structures around the rudder-equipped axisymmetric body. This hybrid approach combines the Spalart–Allmaras (SA) turbulence model for near-wall regions with the large eddy simulation applied to far-field regions. The multiphase governing equations undergo Reynolds averaging prior to turbulence closure via the single-equation SA model.
This study adopts the volume of fluid (VOF) method to achieve enhanced high-precision simulation of ventilated cavities. This approach utilizes a volume fraction function to describe the phase distribution within each computational grid cell. Specifically, a value of 1 indicates a cell filled with fluid, while a value of 0 represents a cell entirely occupied by air. Intermediate values between 0 and 1 denote the presence of a fluid–air interface within the grid cell. The interface transport equation, shown in Equation (9), is solved for these interface-containing grid cells, followed by the reconstruction of the local interface.
where is the volume fraction of the q-th phase in the grid cell, and is the relative velocity between phases.
2.2. Mesh Generation and Computational Setup
Based on the above theoretical foundation, this study conducts high-precision numerical simulation of ventilated cavity flows around a rudder-equipped axisymmetric body under stable inflow conditions. A conical axisymmetric body is used in the current calculation, with a diameter of 70 mm. The sketch of the axisymmetric body and hydrodynamic rudder is shown in Figure 1. A ventilating ring and a pair of hydrodynamic rudders are positioned at the shoulder and tail, respectively.
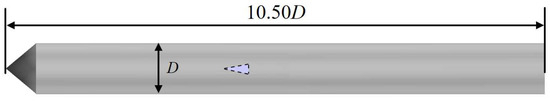
Figure 1.
Dimensions of the axisymmetric body with a hydrodynamic rudder.
The computational domain and boundary conditions for the numerical simulation are illustrated in Figure 2. A rectangular domain with dimensions of 17.14 D in length, 8.57 D in width, and 8.57 D in height is employed. A velocity inlet on the left boundary controls the incoming flow at 5 m/s, while the pressure outlet on the right boundary is set to a pressure of 101,325 Pa. The ventilation ring on the rudder-equipped axisymmetric body is defined as a mass flow inlet boundary, and all other surfaces are specified as no-slip wall boundaries.
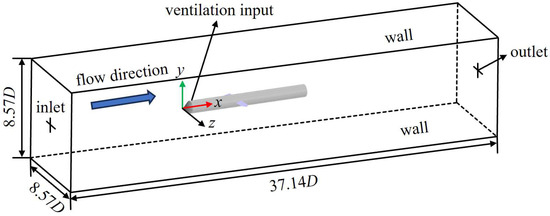
Figure 2.
Computational domain and boundary conditions.
For the geometric model described above, a uniform grid division strategy is applied using a trimmed mesh. Twenty-four layers of boundary layer grids are implemented with a grid height of 0.1 mm at the wall and a total thickness of 2 mm to accurately capture the flow separation within the boundary layer. Local grid refinement is applied to varying degrees in cavity-affected areas, such as the axisymmetric body and hydrodynamic rudder, to analyze the evolution characteristics of the ventilated cavity. The total number of grids generated using the aforementioned method is 10.32 million, as depicted in Figure 3, and the y+ is controlled within 30. This approach ensures comprehensive and accurate simulation of the flow dynamics within the computational domain.
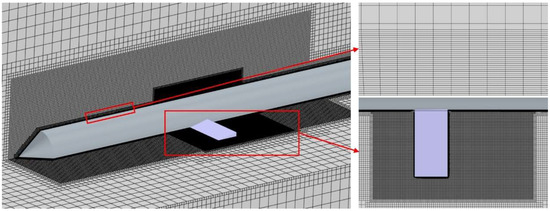
Figure 3.
Mesh generation and refinement zones.
Based on the mentioned grid division, unsteady solutions are obtained using an implicit first-order discretization scheme with a time step of 5.0 × 10⁻⁵ s. The segregated flow approach is adopted to decouple the continuity and momentum equations, enabling separate solutions for velocity and pressure. Velocity and pressure sub-relaxation factors are set to 0.4 and 0.2, respectively, to ensure numerical stability and efficient convergence. All numerical simulations in this study were performed using STAR-CCM+ (14.06.013.R8).
2.3. Accuracy Verification of the Numerical Simulation Method
This study compares the simulation with experimental results [38] to verify the accuracy of the numerical simulation method, with a focus on the morphological characteristics of the ventilated cavity. Figure 4a indicates that the water tunnel experiments reveal the following distinctive features of the ventilated cavity morphology: (1) the cavity exhibits upward buoyancy-induced asymmetry; (2) the cavity front is transparent, while the cavity tail consists of white foam containing water–air mixtures; and (3) large-scale shedding phenomena are prominent at the cavity tail. Figure 4b depicts the corresponding numerical simulation results, which exhibit all the mentioned morphological characteristics with consistency. This comprehensive qualitative agreement between simulation and experimental results substantiates the computational accuracy and reliability of the proposed numerical method.
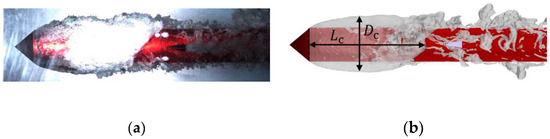
Figure 4.
Ventilation cavity morphology in the (a) water tunnel experiment and (b) numerical simulation.
This study extracts the ventilation cavity shape parameters of the two methods to further assess the accuracy of numerical methods from a quantitative standpoint, as shown in Figure 5. Table 1 lists the cavity diameter (Dc), cavity length (Lc), and their relative errors between the experimental and numerical results. The experimental value of the dimensionless cavity diameter is 1.786, whereas the simulation result is 1.692, yielding a relative error of 5.26%. The dimensionless cavity length from the experiment is 3.245, while the simulation result is 3.373, with a relative error of 3.94%. These results indicate that the numerical simulation aligns well with the experimental findings, with errors in the key cavity shape parameters remaining within 10%. This quantitative validation confirms the high accuracy and reliability of the numerical simulation method adopted in this study.
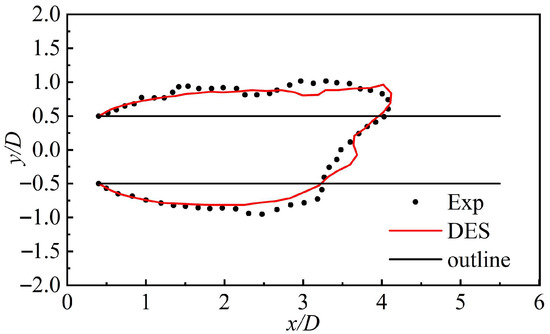
Figure 5.
Extraction of non-dimensional shape parameters of the cavity.

Table 1.
Non-dimensional cavity length (Lc), diameter (Dc), and relative errors of the experiments and numerical simulations.
3. Results and Discussions
3.1. Unsteady Evolution of Ventilated Cavities with the Rudder Effect
The surface pressure and cavity morphologies of the axisymmetric body at different instants were analyzed to investigate the influence of the hydrodynamic rudder on the unsteady evolution of ventilated cavities around an axisymmetric body, as shown in Figure 6. The pressure distribution on the surface of the axisymmetric body remains consistent over time, featuring localized high-pressure zones at the head of the axisymmetric body, the ventilated cavity tail, and the leading edge of the rudder. Low-pressure zones are observed within the cavity and at the trailing edge of the rudder. In contrast to the pressure distribution, the cavity morphologies exhibit variations over time, indicating pronounced unsteady behaviors. Specifically, as ventilation duration increases, the cavity undergoes three distinct stages: rapid growth, slow development, and a quasi-periodic shedding stage.
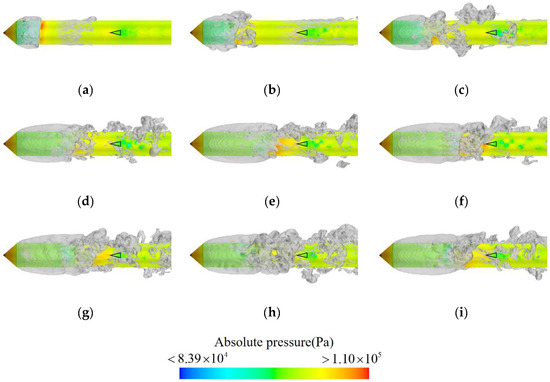
Figure 6.
Pressure distribution on the surface of the axisymmetric body and the cavity shape around the axisymmetric body at different instants. (a) t0, (b) t0 + 0.05 s, (c) t0 + 0.10 s, (d) t0 + 0.25 s, (e) t0 + 0.40 s, (f) t0 + 0.50 s, (g) t0 + 0.55 s, (h) t0 + 0.70 s, (i) t0 + 0.85 s.
The cavity morphologies during the rapid growth stage are presented in Figure 6a–c. At t0, the ventilation cavity begins to form with good overall symmetry, and small-scale cavity clusters start to shed in the tail. As time goes by, more gas is introduced into the cavity, resulting in a significant increase in both its length and diameter. As the cavity size increases, its symmetry gradually diminishes, and the scale of the shedding cavity at the tail also increases. At t0 + 0.10 s, large-scale cavity clusters begin to shed alternately from the cavity tail.
During the slow development stage, as depicted in Figure 6d–f, the cavity tail continues shedding large-scale cavities. As the duration progresses, both the cavity length and diameter increase gradually, while its symmetry decreases progressively. When the cavity length reaches a certain threshold (around t0 + 0.25 s), its growth is significantly inhibited due to the presence of a local high-pressure region near the leading edge of the rudder. Therefore, the growth of cavity length eventually stabilizes.
In the quasi-periodic shedding stage, illustrated in Figure 6g–i, the size of the ventilated cavity remains relatively constant. As gas continues to be introduced, the cavity can no longer expand due to a balance between the gas leakage and ventilation. Instead, the gas is shed as cavity clusters, leading to an increase in the scale and size of the unsteady shedding at the cavity tail. This gives rise to a more distinct periodicity during the shedding stage.
The ventilated cavity enters the quasi-periodic shedding stage at t0 + 0.55 s, indicating that the underwater movement of the rudder-equipped axisymmetric body spends most of its time in this stage. Given the dominance of this stage throughout the motion process, it is essential to conduct further research into the evolution of cavity behavior during the quasi-periodic shedding stage and its influencing factors.
Figure 7 illustrates the velocity vector distribution of the flow field at t0 + 1 s to analyze the mechanism of cavity shedding at this stage, where ux is the velocity in the x-direction, and u∞ is the inlet velocity. In the flow field region outside the cavity, due to the minimal influence from the cavity, the flow remains relatively stable. Therefore, the direction and magnitude of the velocity are consistent with those of the free incoming flow. Along the cavity contour line, the shear effect at the water–air interface induces a slight reduction in velocity amplitude, and the velocity direction is downstream along the contour line of the cavity. A re-entrant jet exists inside the cavity, and the specific formation mechanism is explained in Figure 8.
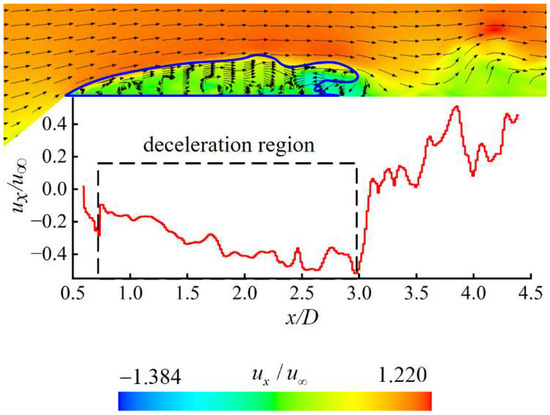
Figure 7.
Velocity vector distribution of the flow field on the xoy-plane at z = 0 at t0 + 1 s.
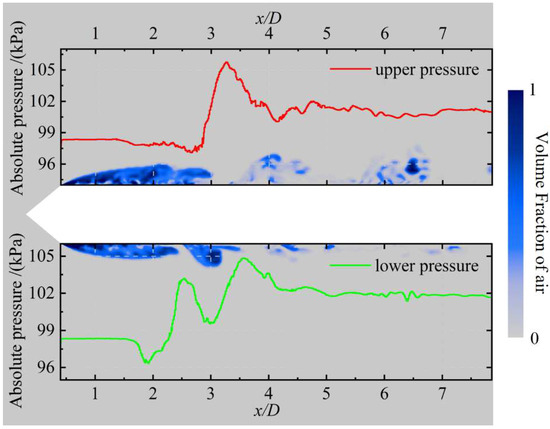
Figure 8.
Absolute pressure distribution and distribution of the air volume fraction on the xoy-plane at z = 0 at t0 + 1 s.
Figure 7 also presents the axial velocity (ux) curves at different axial positions (x) located 3 mm away from the upper side of the axisymmetric body. It indicates that within the range of x/D = 0.5–3, the axial velocity shows negative values, providing quantitative evidence for the existence of a re-entrant jet. In addition, along the upstream direction, the |ux| gradually decreases, indicating that the re-entrant jet decays during its upstream propagation.
Figure 8 displays the absolute pressure on the upper and lower sides of the rudder-equipped axisymmetric body to gain a deeper understanding of the formation mechanism of the re-entrant jet. Inside the cavity, the absolute pressures on both sides remain stable at approximately 98 kPa. Outside the cavity, the lower surface is subjected to a pressure of around 102 kPa, whereas the upper surface exhibits a slightly lower pressure due to the gravity effect; however, it remains significantly higher than the internal pressure within the cavity. This pressure difference produces an obvious adverse pressure gradient in the cavity closure region, propelling the high-pressure fluid into the cavity interior and thus forming the re-entrant jet.
In addition, asymmetric cavity morphology causes an asymmetric pressure distribution on the upper and lower surfaces of the body of revolution. This asymmetric pressure distribution between the upper and lower surfaces generates a lateral force in the y-direction and a moment in the z-direction, which will be discussed in the following section.
Figure 9 presents cross-sectional views of the cavities along the axial direction at various positions of the axisymmetric body at t0 + 1 s to examine the mechanism by which the re-entrant jet affects the development of ventilated cavities. Figure 10 shows the distribution of the air volume fraction at different cavity cross-sections. The cavities demonstrate clear spatial evolution characteristics along the axial direction.
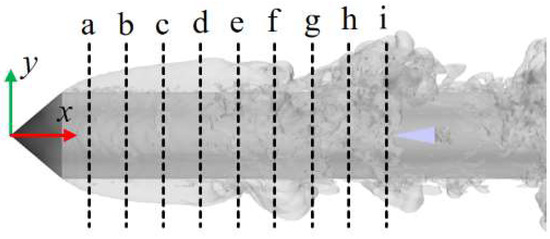
Figure 9.
Cross-sectional profiles of the ventilation cavities at different positions. (Positions a–i respectively represent the positions of the corresponding cross-sections in Figure 10. The gray region represents the isosurface corresponding to a vapor volume fraction of 0.1, indicating the morphology of the ventilated cavity).
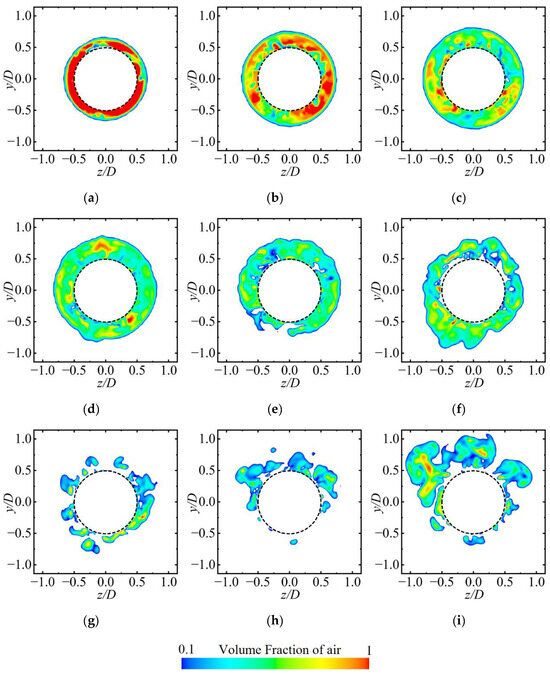
Figure 10.
Distribution of the air volume fraction at different cavity cross-sections, with subfigures (a–i) corresponding to positions a–i in Figure 9. (a) x/D = 0.71, (b) x/D = 1.14, (c) x/D = 1.57, (d) x/D = 2.00, (e) x/D = 2.43, (f) x/D = 2.86, (g) x/D = 3.29, (h) x/D = 3.57, (i) x/D = 4.00.
At position a–b, the cavity cross-section maintains a circular shape with a uniformly distributed gas–liquid interface, and the interior is nearly fully occupied by air, which corresponds to the transparent area observed in Figure 4a. This phenomenon is attributed to the fact that the cross-section is close to the ventilation ring, which results in a low-intensity re-entrant jet and stable gas content.
At positions c–e, with an increase in axial distance, the cavity shape begins to undergo noticeable deformation. Although the overall circular form is retained, the gas–liquid interface exhibits significant fluctuations due to the combined shear effects of the re-entrant jet and the free flow. In addition, gravitational influence causes the cavities to shift upward, as indicated by the upper cavity thickness being significantly greater than that of the lower cavity. Additionally, the influence of the re-entrant jet allows a small amount of liquid to enter the cavity, thereby transforming the cross-section from a single gas phase to a water–gas mixture state. This is consistent with the white foam region shown in Figure 4a.
At positions f–i, the cavity structure experiences substantial changes. The previously continuous cavity cross-section becomes segmented, the air volume fraction decreases sharply, and the upward motion becomes more pronounced. This occurs because the cross-section lies near the closure region, where the re-entrant jet reaches its peak intensity. The interaction between the re-entrant jet and the free flow results in the formation of a strong vortex structure, which further destabilizes the cavities, causing them to roll, detach, and fragment. This behavior is consistent with the cavity shedding observed in Figure 4a.
3.2. Influence of Cavitation Evolution on the Hydrodynamic Characteristics of the Axisymmetric Body and Rudder
This study tracks the resultant force and moment exerted on both the axisymmetric body and the hydrodynamic rudder during the quasi-periodic shedding stage to examine the effects of the ventilated cavity evolution on the hydrodynamic characteristics of the axisymmetric body and the rudder.
Figure 11a presents the evolution curves of the forces acting on the axisymmetric body during the quasi-periodic shedding stage. As shown in Figure 2, the coordinate system is defined such that the x-axis aligns with the flow direction, the y-axis corresponds to the vertical direction, and the z-axis follows the spanwise direction of the rudder. The magnitude of Fx is the highest among the three force components. Fx exhibits pulsations that correspond to the quasi-periodic shedding of the ventilated cavity.
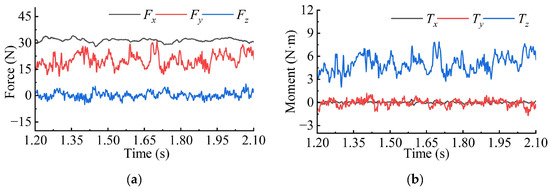
Figure 11.
Evolution curves of (a) the force and (b) moment of the axisymmetric body during the quasi-periodic shedding stage.
The force Fy exhibits a slightly lower magnitude than Fx. Its generation is attributed to the pressure difference caused by the change in depth between the upper and lower surfaces of the axisymmetric body and the asymmetric pressure distribution within the cavity. In addition, Fy shows the strongest pulsation, which results from the significant difference in shedding scale between the upper and lower surfaces of the axisymmetric body.
The force Fz remains closest to zero, as the cavity exhibits near symmetry along the z-axis, resulting in approximately balanced forces on the front and back surfaces. However, minor pulsations in Fz arise from the non-strict symmetry of the cavity.
Figure 11b shows the evolution curves of the moments acting on the axisymmetric body relative to the axial position (x/D = 0). The moments Tx, Ty, and Tz represent the axial, lateral, and pitching moments, respectively. The overall magnitude of Tx is nearly zero and exhibits the smallest pulsation amplitude.
In contrast, Ty is also close to zero but exhibits a larger pulsation amplitude. This is attributed to the significant lever arm associated with the lateral moment, which enhances the pulsation characteristics. The moment Tz possesses the greatest magnitude. In addition, Tz exhibits the most intense pulsation due to the influence of cavity shedding.
In conclusion, the hydrodynamic characteristics of the axisymmetric body are markedly affected by the shape and evolution of the ventilated cavity. The cavity symmetry in various directions influences the mean values of the forces and moments, while the shedding of the ventilated cavity induces high-frequency pulsations in these quantities.
Figure 12a,b presents the evolution curves of the force and moment in three directions acting on the hydrodynamic rudder during the quasi-periodic shedding stage. The force exhibits Fx > Fy > Fz ≈ 0, while the moment shows Tz > Tx ≈ Ty ≈ 0. The pulsations of Fy and Tz are relatively pronounced. A comparison between Figure 11 and Figure 12 reveals a strong correlation between the force characteristics of the hydrodynamic rudder and those of the entire axisymmetric body.
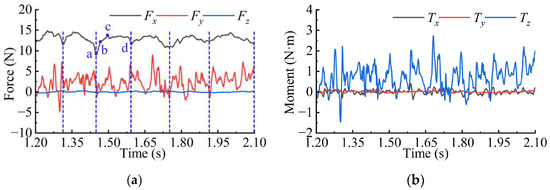
Figure 12.
Evolution curves of (a) the force and (b) moment of the rudder during the quasi-periodic shedding stage. (Positions a, b, c, and d represent the force conditions at time points t1 = 1.450 s, t2 = 1.468 s, t3 = 1.497 s, and t4 = 1.594 s. The blue dotted lines represent one cycle).
In addition, as the rudder is located downstream of the ventilated cavity, it is more significantly influenced by cavity shedding. Therefore, the evolution patterns of Fx and Tz differ markedly from those of the axisymmetric body.
Regarding Fx, the force in this direction mainly originates from the incoming flow thrust. Given that the axisymmetric body maintains uniform motion, the incoming flow conditions remain stable, resulting in a smooth variation in Fx. In contrast, the incoming flow to the rudder periodically carries shedding cavity clusters, leading to a periodic change in Fx, as illustrated in Figure 12a.
The Fx experienced by the rudder exhibits a periodic variation with a cycle of 0.15 s, displaying a pattern of initially increasing and decreasing within each period. Hence, Figure 13 presents the distribution of cavity clusters near the rudder at various instants within a single cycle. Comparing Figure 13 with Figure 12a indicates that at instant t1, the cavity clusters from the previous cycle are entirely detached from the rudder, resulting in Fx attaining its minimum value. As upstream cavity clusters gradually approach and adhere to the rudder surface, Fx increases, reaching its peak at time t3. Thereafter, due to the shear effect of the incoming flow, the adhered cavity clusters reduce in size and eventually detach, leading Fx to decrease and return to its minimum value at time t4.
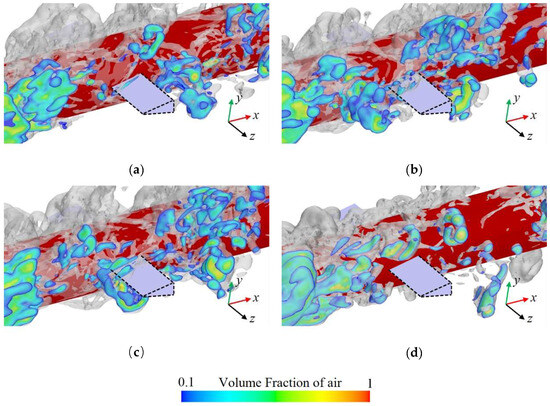
Figure 13.
Distribution of cavities near the hydrodynamic rudder at different instants (a) t1 = 1.450 s, (b) t2 = 1.468 s, (c) t3 = 1.497 s, (d) t4 = 1.594 s.
This phenomenon demonstrates that the attachment of cavity clusters leads to an increase in the Fx experienced by the hydrodynamic rudder, with the periodicity of Fx directly corresponding to the growth and shedding cycle of the adhered cavity clusters.
In terms of Tz, the moment in this direction is primarily influenced by the force distribution. For the axisymmetric body, this asymmetry arises from the shape of the ventilated cavity, while for the hydrodynamic rudder, it results from the scale difference in the shedding cavities on its upper and lower surfaces. A comparison of Figure 11b and Figure 12b reveals that the Tz of the rudder exhibits a significantly higher pulsation-to-time-averaged value ratio than that of the axisymmetric body, with instances where Tz becomes negative. This indicates that the shedding cavities exhibit stronger spatial asymmetry compared to the ventilated cavities.
This study examined the shedding cavities on its upper and lower surfaces at different instants to investigate the cause of the negative Tz observed in the rudder, as illustrated in Figure 14. Figure 12 and Figure 14 show that the difference in the sizes of shedding cavities on the upper and lower surfaces of the rudder influences the direction of Fy, affecting whether Tz assumes a positive or negative value. Specifically, when t = 1.81 s, the shedding cavities on the upper surface are larger than those on the lower surface, resulting in a more significant effect from the upper cavities. As a result, Fy points in the negative y-axis direction, producing a negative moment relative to x/D = 0. In contrast, when t = 1.90 s, the shedding cavities on the lower surface are larger than those on the upper surface, leading to a stronger effect from the lower cavities. Therefore, Fy points in the positive y-axis direction, generating a positive moment relative to x/D = 0.
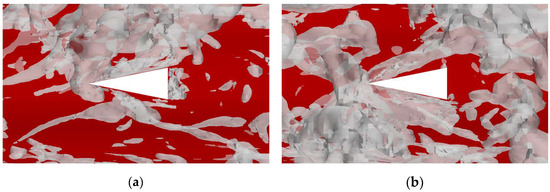
Figure 14.
Cavity distribution around the rudder at different instants (a) t = 1.81 s, (b) t = 1.90 s (The gray region represents the isosurface corresponding to a vapor volume fraction of 0.1, indicating the morphology of the cavity clusters).
3.3. Influence of Cavity Shedding on the Flow Field Distribution near the Rudder
The hydrodynamic characteristics of the rudder are closely related to the distribution of the surrounding flow field. For a rudder-equipped axisymmetric body, the introduction of the rudder not only modifies the flow field structure around the original single axisymmetric body but also increases the overall complexity of the flow system. In addition, under the influence of periodically shedding cavity clusters, the flow field distribution near the rudder undergoes further alterations. Therefore, an in-depth study of the flow field distribution characteristics near the rudder under the influence of cavity shedding is of considerable significance for understanding the rudder’s effect and improving control efficiency.
This study selected four spanwise sections, as shown in Figure 15, and extracted the air volume fraction contours at 1.7 s to systematically examine how shedding cavity clusters influence the flow field distribution around the rudder in the spanwise direction. As shown in Figure 16, at the rudder root (z/D = 0.51), the upstream shedding cavity clusters adhere to its surface, and the cavity size on the lower surface is relatively larger. In addition, some cavities accumulate near the trailing edge of the rudder to form small-scale cavities. As the spanwise distance increases, the size of the adhered cavities on both the upper and lower surfaces of the rudder, as well as the tail cavities at the trailing edge, gradually decreases. When the spanwise distance becomes sufficiently large, the rudder is influenced only by the free inflow without cavities, as shown in Figure 16d. These phenomena indicate that, due to the limited thickness of the ventilated cavities, the shedding cavity clusters primarily concentrate near the rudder root region, and their influence gradually diminishes with increasing spanwise distance.
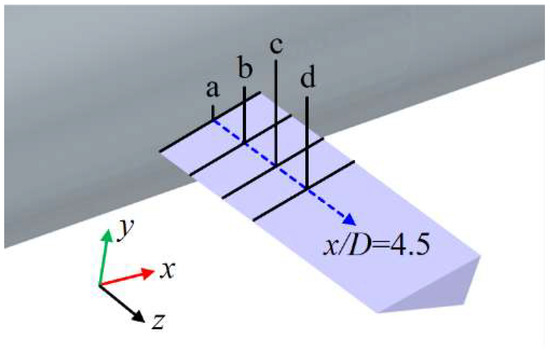
Figure 15.
Positions of different cross-sections near the rudder. (Position a corresponds to z/D = 0.51, b corresponds to z/D = 0.66, c corresponds to z/D = 0.80, and d corresponds to z/D = 0.94).
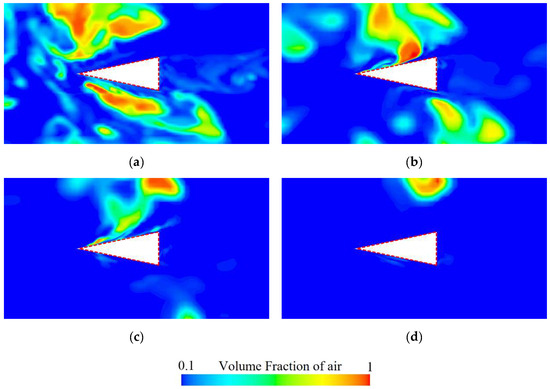
Figure 16.
The air volume distribution at 1.7 s, with the cross-section (a) z/D = 0.51, (b) z/D = 0.66, (c) z/D = 0.80, (d) z/D = 0.94 corresponding to the positions shown in Figure 15.
This study analyzed the vortex, velocity, and pressure distribution contours at various sections of the rudder, as shown in Figure 17, Figure 18 and Figure 19, respectively, to explore how the shedding cavity clusters affect the flow field near the rudder.
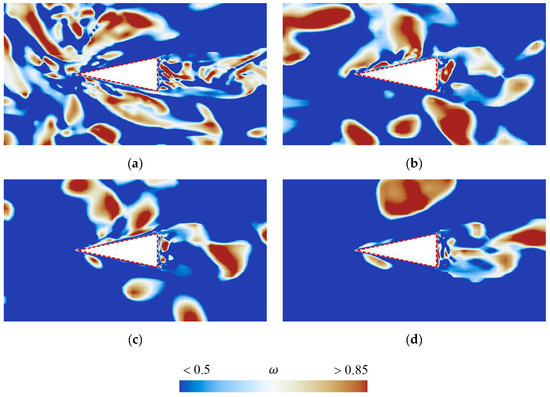
Figure 17.
Vortical structure contours at the cross-section (a) z/D = 0.51, (b) z/D = 0.66, (c) z/D = 0.80, (d) z/D = 0.94, colored by Omega.
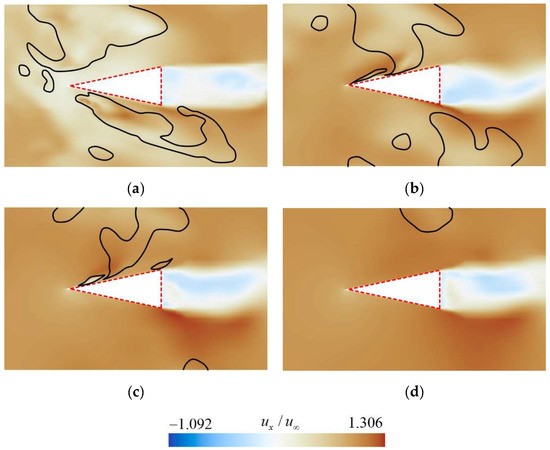
Figure 18.
Velocity distribution at the cross-section (a) z/D = 0.51, (b) z/D = 0.66, (c) z/D = 0.80, (d) z/D = 0.94 corresponding to the positions shown in Figure 15. (The black isolines represents the gas–liquid interface corresponding to a vapor volume fraction of 0.1).
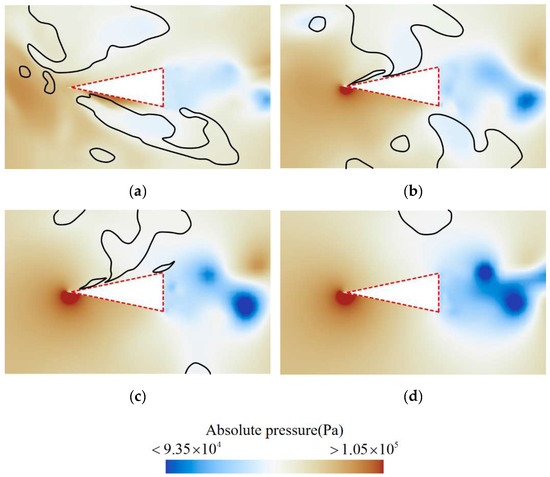
Figure 19.
Pressure distribution at the cross-section (a) z/D = 0.51, (b) z/D = 0.66, (c) z/D = 0.80, (d) z/D = 0.94 corresponding to the positions shown in Figure 15. (The black isolines represents the gas–liquid interface corresponding to a vapor volume fraction of 0.1).
Due to the highly complex vortex structures near the rudder, more advanced vortex structure identification methods like Liutex, Omega, etc. [39,40], should be employed to further investigate the relationship between vortex structures and the shedding cavity clusters. Figure 17 shows the vortical structure contours at the cross-section a–d. It can be observed that a large number of vortex structures accumulate near the rudder root, and the number of vortices decreases with increasing spanwise distance. Additionally, the vortices on the upper surface of the rudder are generally more numerous than those on the lower surface. Furthermore, by comparing Figure 16 and Figure 17, it can be seen that the distribution of vortices near the rudder highly coincides with the characteristics of cavity distribution. This indicates that the shedding cavity clusters significantly alter the distribution of the vortex around the rudder, and the evolution of vortex structures is closely related to the motion of cavities.
At the rudder’s root section, as shown in Figure 18a, a significant backflow is observed on the blunt surface. This observation corresponds to the distribution of shedding cavity clusters illustrated in Figure 16a. The wake of the rudder exhibits reverse velocity associated with flow separation at the trailing edge. As the spanwise distance increases, the reverse flow area remains nearly unchanged, while the incoming flow velocity gradually increases. This indicates a growing velocity difference between the reverse flow and the mainstream, resulting in an enhanced relative intensity of flow separation.
Figure 19 shows that on the cross-section at the rudder root, the pressure is relatively low in regions where cavities adhere to the upper and lower surfaces, while a local high-pressure region appears on the lower surface. In the wake region of the rudder, alternating low-pressure zones are evident, indicating the formation of Karman vortices at the rudder’s trailing edge due to flow separation.
As the spanwise distance increases, the influence of the adhering cavities diminishes, causing the local high-pressure area on the upper surface to shift closer to the leading edge and the pressure value to gradually increase. Simultaneously, as the cavity size on the rudder decreases, the intensity of flow separation at the rear becomes greater, leading to a further reduction in pressure in the wake and a more pronounced Karman vortex phenomenon.
Figure 20 presents the air volume fraction distribution and velocity vectors around the rudder. It indicates that the shedding cavity clusters are mainly concentrated near the rudder root region, and there is a difference in the cavity distribution on the upper and lower surfaces of the rudder due to the effect of buoyancy. The cavity on the upper surface is significantly higher than that on the lower surface. In addition, under the influence of the shedding cavity clusters, complex vortex structures occur near the rudder root. Figure 21 shows the air volume fraction and pressure distribution of the rudder. There is a relatively high air volume fraction near the rudder root. Along the spanwise direction, the pressure gradually decreases, and the air volume fraction becomes almost zero. This is mainly related to the reduction in thickness of the ventilated cavity.
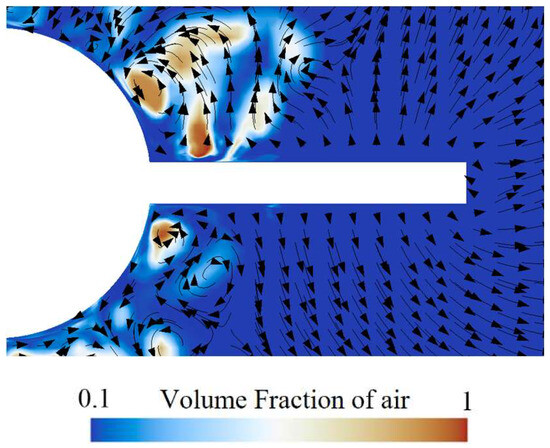
Figure 20.
The air volume fraction distribution and velocity vectors around the rudder.
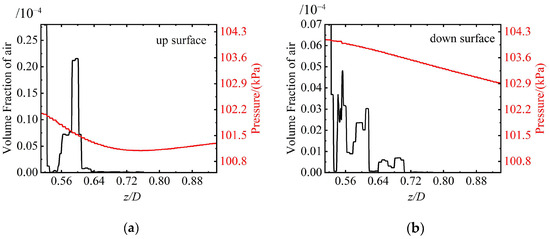
Figure 21.
Air volume fraction and pressure distribution on the (a) upper side and (b) lower side of the rudder.
4. Conclusions
High-precision numerical simulations are conducted to examine the ventilated cavity flow around a rudder-equipped axisymmetric body under specific conditions: Fr = 6.033, CQ = 0.082, and 0° angle of attack. The main conclusions are as follows:
- (1)
- This study reveals the ventilated cavity flow characteristics for a rudder-equipped axisymmetric body. The results indicate that the development of the ventilated cavity proceeds through three distinct stages: rapid growth, slow development, and quasi-periodic shedding. During this process, local high pressure at the leading edge of the rudder suppresses cavity growth, while the cavity shedding is associated with a re-entrant jet.
- (2)
- This study summarizes the influence of cavity shedding on the hydrodynamic characteristics of the axisymmetric body and its rudder. The overall load on the axisymmetric body and the local load on the rudder both follow the following patterns: Fx > Fy > Fz ≈ 0 and Tz > Tx ≈ Ty ≈ 0, among which Fy and Tz fluctuate most violently. The time-averaged difference results from the cavity asymmetry, while the pulsation characteristics are associated with the quasi-periodic shedding. In addition, the force characteristics of the rudder differ from those on the axisymmetric body, where Fx exhibits periodic variations, and Tz presents a negative moment due to the influence of the ventilated cavities.
- (3)
- This study indicates that cavity clusters are primarily concentrated in the rudder root region, inducing a local reverse flow and a high-pressure zone. Along the spanwise direction, the size of the attached clusters decreases. Its influence on the flow field distribution around the hydrodynamic rudder gradually decreases. As a result, the flow separation at the rudder tail is progressively intensified.
Author Contributions
Conceptualization, R.H.; methodology, W.X.; software, W.X.; formal analysis, W.X. and Y.L.; resources, L.H.; writing—original draft preparation, Y.L.; writing—review and editing, W.X., R.H., W.Y. and W.J.; supervision, R.H.; project administration, R.H.; funding acquisition, R.H. and W.Y. All authors have read and agreed to the published version of the manuscript.
Funding
The authors would like to gratefully acknowledge the National Natural Science Foundation of China (No. U22B6010, 12472246), the International partnership program of the Chinese Academy of Sciences (Grant No. 025GJHZ2022118FN), the Postdoctoral Fellowship Program of China Postdoctoral Science Foundation (Grant No. GZB20240337), and the China Postdoctoral Science Foundation (Grant No. 2025M770915).
Institutional Review Board Statement
Not applicable.
Informed Consent Statement
Not applicable.
Data Availability Statement
The data will be made available upon reasonable request.
Conflicts of Interest
The authors declare no conflicts of interest.
References
- Huang, B.; Huang, H.; Liu, T.; Zhang, M.; Wang, G. Research progress and prospects of ventilated cavitating flows characteristics. Acta Aerodyn. Sin. 2020, 38, 724–745. [Google Scholar]
- Reichardt, H. The Laws of Cavitation Bubbles as Axially Symmetrical Bodies in a Flow; Reports and Translations; Ministry of Aircraft Productuin (Great Britian): London, UK, 1945; Volume 766, pp. 322–326. [Google Scholar]
- Stinebring, D.R.; Cook, R.B.; Dzielski, J.E.; Kunz, R.F. High-Speed Supercavitating Vehicles. In Proceedings of the AIAA Guidance, Navigation, and Control Conference 2006, Keystone, CO, USA, 21–24 August 2006. [Google Scholar]
- Wang, X.; Song, M.; Cheng, H.; Ji, B.; Farhat, M. New Insights into Cloud Cavitation Noise Spectrum. Acta Mech. Sin. 2025, 42, 325186. [Google Scholar] [CrossRef]
- Zhao, X.; Cheng, H.; Ji, B.; Li, L.; Bensow, R.E. Insights into the Characteristics of Sheet/Cloud avitation and Tip-Leakage Cavitation Based on a Compressible Euler-Lagrange Model. Phys. Rev. Fluids 2024, 9, 104304. [Google Scholar] [CrossRef]
- Xu, M.; Cheng, H.; Ji, B.; Peng, X.; Liu, C. Numerical Study on the Scale Effect of Tip Vortex Cavitation with Special Emphasis on Non-Condensable Nuclei. Int. J. Multiph. Flow 2025, 192, 105346. [Google Scholar] [CrossRef]
- Cai, S.-T.; Huang, R.-F.; Qian, Z.-H.; Luo, X.-W.; Wang, Y.-W. Unsteady Flow Characteristics of Backflow Vortices in an Axial-Flow Pump at Low Flow Rates. J. Hydrodyn. 2025, 37, 359–376. [Google Scholar] [CrossRef]
- Yao, X.; Qu, Z.; Ma, G.; Yang, N.; Quan, X.; Cheng, S. Experimental Study on Motion Characteristics of Cavity Attached to the Tail of Underwater Vehicle. J. Mar. Sci. Eng. 2023, 11, 1287. [Google Scholar] [CrossRef]
- Zhi, Y.; Zhan, J.; Huang, R.; Wang, Y.; Li, N. Numerical Investigation on the Ventilated Supercavity around a Body under Free Surface Effect. J. Mar. Sci. Eng. 2023, 11, 24. [Google Scholar] [CrossRef]
- Liu, T.; Huang, B.; Wang, G.; Zhang, M. Experimental Investigation of Ventilated Partial Cavitating Flows with Special Emphasis on Flow Pattern Regime and Unsteady Shedding Behavior around an Axisymmetric Body at Different Angles of Attack. Ocean Eng. 2018, 147, 289–303. [Google Scholar] [CrossRef]
- Wang, G.; Kong, D.; Wu, Q.; Liu, T.; Zheng, Y.; Huang, B. Physical and Numerical Study on Unsteady Shedding Behaviors of Ventilated Partial Cavitating Flow around an Axisymmetric Body. Ocean Eng. 2020, 197, 106884. [Google Scholar] [CrossRef]
- Lv, Y.; Kong, D.; Zhang, M.; Liu, T.; Huang, B.; Fu, X.; Wang, Y. Unsteady Behavior of Ventilated Cavitating Flows around an Axisymmetric Body. Ocean Eng. 2021, 236, 109308. [Google Scholar] [CrossRef]
- Hao, L.; Zhang, H.; Yang, Q.; Liu, T.; Huang, B.; Wang, G. Experimental Investigation on the Ventilated Cavitating Flow Characteristics around an Axisymmetric Body with an Unsteady Ventilation. Ocean Eng. 2024, 313 Pt 1, 119307. [Google Scholar] [CrossRef]
- Wu, Y.; Liu, Y.; Shao, S.; Hong, J. On the Internal Flow of a Ventilated Supercavity. J. Fluid Mech. 2019, 862, 1135–1165. [Google Scholar] [CrossRef]
- Yang, Q.; Wang, C.; Wei, Y.; Wang, Y.; Zhang, D.; Hu, X. Experimental Study on the Collapse of Tail Cavity Induced by Underwater Ventilation. Phys. Fluids 2022, 34, 112111. [Google Scholar] [CrossRef]
- Karn, A.; Arndt, R.E.; Hong, J. Gas Entrainment Behaviors in the Formation and Collapse of a Ventilated Supercavity. Exp. Therm. Fluid Sci. 2016, 79, 294–300. [Google Scholar] [CrossRef]
- WWang, Z.; Zhang, M.; Kong, D.; Huang, B.; Wang, G.; Wang, C. The Influence of Ventilated Cavitation on Vortex Shedding Behind a Bluff Boby. Exp. Therm. Fluid Sci. Int. J. Exp. Heat Transf. Thermodyn. Fluid Mech. 2018, 98, 181–194. [Google Scholar] [CrossRef]
- Yu, A.; Li, L.; Zhou, D. Large Eddy Simulation of the Cavity Shedding Characteristics of Ventilated Cavitation around the Underwater Vehicle. Ocean. Eng. 2024, 301, 117546. [Google Scholar] [CrossRef]
- Xie, B.; Ding, Y.; Zhao, C.; Zhao, C.; Sun, T. Numerical Study of the Effects of Ventilation Rates on Supercavity Dynamics and Acoustic Characteristics. Ocean Eng. 2023, 284, 115242. [Google Scholar] [CrossRef]
- Jiang, Y.; Hong, J.-W.; Pham, V.-D.; Ahn, B.-K. Experimental Study on Supercavitating Flow by Injection of 773 K Ventilated Gas. Eur. J. Mech.-B/Fluids 2023, 99, 136–147. [Google Scholar] [CrossRef]
- Du, T.; Wang, Y.; Huang, C.; Liao, L. A Numerical Model for Cloud Cavitation Based on Bubble Cluster. Theor. Appl. Mech. Lett. 2017, 7, 231–234. [Google Scholar] [CrossRef]
- Wang, Z.; Huang, B.; Zhang, M.; Wang, G.; Zhao, X. Experimental and Numerical Investigation of Ventilated Cavitating Flow Structures with Special Emphasis on Vortex Shedding Dynamics. Int. J. Multiph. Flow 2018, 98, 79–95. [Google Scholar] [CrossRef]
- Cui, D.; Liu, X.; Chen, T.; Wang, G. Investigation of Unsteady Ventilated Partial Cavitating Flow around an Axisymmetric Body with Particular Emphasis on the Vortex Structure. Theor. Appl. Mech. Lett. 2025, 15, 100596. [Google Scholar] [CrossRef]
- Zhang, X.; Wang, C.; Wekesa, D.W. Numerical and Experimental Study of Pressure-Wave Formation around an Underwater Ventilated Vehicle. Eur. J. Mech.-B/Fluids 2017, 65, 440–449. [Google Scholar] [CrossRef]
- Karn, A.; Rosiejka, B. Air Entrainment Characteristics of Artificial Supercavities for Free and Constrained Closure Models. Exp. Therm. Fluid Sci. 2017, 81, 364–369. [Google Scholar] [CrossRef]
- Sun, T.; Zhang, X.; Zhang, J.; Wang, C. Experimental Study on the Unsteady Natural Cloud Cavities: Influence of Cavitation Number on Cavity Evolution and Pressure Pulsations. J. Mar. Sci. Eng. 2021, 9, 487. [Google Scholar] [CrossRef]
- Fronzeo, M.A.; Kinzel, M.; Lindau, J.W. An Assessment of Pressure Variations in Artificially Ventilated Cavities. Ocean Eng. 2019, 177, 85–96. [Google Scholar] [CrossRef]
- Shao, X.; Liang, N.; Qin, S.; Cao, L.; Wu, D. Numerical Investigation of Microbubble Drag Reduction on an Axisymmetric Body Based on Eulerian Multiphase Model. Ocean Eng. 2024, 298, 117157. [Google Scholar] [CrossRef]
- Chen, X.; Wang, R.; Qi, X.; Zhang, Z.; Fan, W. Influence of exhausted gas tail jet on ventilated cavitation shape and surface pressure of underwater vehicle. J. Solid Rocket Technol. 2023, 46, 521–527. [Google Scholar]
- Zhang, N.; Zhao, Y.; Wei, H.; Chen, G. Experimental Study on the Influence of Air Injection on Unsteady Cloud Cavitating Flow Dynamics. Adv. Mech. Eng. 2016, 8, 1687814016676678. [Google Scholar] [CrossRef]
- Zhao, Q.; Hao, N.; Xiao, W.; Yao, X. Experimental Study on Cavitation Characteristics and Pressure Load of Actively Ventilated Double-Vehicle Configuration during Water Exit. Int. J. Multiph. Flow 2024, 179, 104916. [Google Scholar] [CrossRef]
- Zhou, Q. Numerical Simulation of Hydrodynamic Characteristics of Under-Water Supercavitation Vehicle with Fins. Master’s Thesis, Harbin Institute of Technology, Harbin, China, 2013. [Google Scholar]
- Pei, X.; Zhang, Y.; Yuan, X.; Zhang, J. Exploring experimentally effect of tail wing on shape and dynamics characteristics on supercavitation vehicle. J. Exp. Fluid Mech. 2011, 25, 23–28. [Google Scholar]
- Xing, Y.; Zhang, J.; Cao, W.; Wang, C.; Wang, B. Experimental investigation of the effect of tail wings wedge angle on ventilated supercavity hydrodynamic. J. Harbin Inst. Technol. 2013, 45, 25–29. [Google Scholar]
- Zhou, S.; Li, D.; Huang, C.; Xu, H. Ventilated Supercavity Shapes and Hydrodynamic Characteristics of Bow Rudder Layout. Appl. Ocean Res. 2022, 124, 103192. [Google Scholar] [CrossRef]
- Shang, Z. Numerical Investigations of Supercavitation around Blunt Bodies of Submarine Shape. Appl. Math. Model. 2013, 37, 8836–8845. [Google Scholar] [CrossRef]
- Manninen, M.; Taivassalo, V.; Kallio, S. On the Mixture Model for Multiphase Flow; Technical Report; Technical Research Centre of Finland: Espoo, Finland, 1996. [Google Scholar]
- Li, H.; Hao, L.; Zhang, M.; Liu, T.; Kong, D. Experimental study on the flow pattern and pressure fluctuation characteristics of ventilated cavitating flows around a conical axisymmetric body at high Froude number. J. Exp. Fluid Mech. 2024, 38, 1–11. [Google Scholar]
- Liu, C. Liutex-third generation of vortex definition and identification methods. Acta Aerodyn. Sin. 2020, 38, 413–431. [Google Scholar]
- Zhi, Y.; Qiu, R.; Huang, R.; Wang, Y. Application of Omega Identification Method in the Ventilated Cavities around a Surface-Piercing Hydrofoil. In Liutex and Third Generation of Vortex Identification: Workshop from Aerospace and Aeronautics World Forum 2021; Springer: Singapore, 2023; pp. 359–370. [Google Scholar]


Disclaimer/Publisher’s Note: The statements, opinions and data contained in all publications are solely those of the individual author(s) and contributor(s) and not of MDPI and/or the editor(s). MDPI and/or the editor(s) disclaim responsibility for any injury to people or property resulting from any ideas, methods, instructions or products referred to in the content. |
© 2025 by the authors. Licensee MDPI, Basel, Switzerland. This article is an open access article distributed under the terms and conditions of the Creative Commons Attribution (CC BY) license (https://creativecommons.org/licenses/by/4.0/).