Article

CFD Analysis of Non-Isothermal Viscoelastic Flow of HDPE Melt Through an Extruder Die

Department of Mechanical Engineering, Thammasat School of Engineering, Faculty of Engineering, Thammsat University, Pathumthani 12121, Thailand
*
Author to whom correspondence should be addressed.
Fluids 2025, 10(9), 238; https://doi.org/10.3390/fluids10090238
Submission received: 28 July 2025 / Revised: 30 August 2025 / Accepted: 1 September 2025 / Published: 8 September 2025

Abstract

The optimization of polymer extrusion processes is crucial for improving product quality and manufacturing efficiency in plastic industries. This study aims to investigate the viscoelastic flow behavior of high-density polyethylene (HDPE) through an extrusion die with an internal mandrel, focusing on the effects of die geometry and flow parameters. A two-dimensional (2D) numerical model is developed in COMSOL Multiphysics using the Oldroyd-B constitutive equation, solved using the Galerkin/least-square finite element method. The simulation results indicate that the Weissenberg number (Wi) and die geometry significantly influence the dimensionless drag coefficient (Cd) and viscoelastic stress distribution along the die wall. Furthermore, filleting sharp edges of the die wall surface effectively reduces stress oscillations, enhancing flow uniformity. These findings provide valuable insights for optimizing die design and improving polymer extrusion efficiency.

1. Introduction

Non-Newtonian fluids have diverse applications in daily life, including drag reduction, printing technology, damping and braking devices, personal protective equipment, and food products. Their use has also expanded into biomedical engineering, particularly in the design of medical devices and treatments [1]. One of the most important properties of these fluids is viscoelasticity, which exhibits both elastic and viscous behavior. Understanding non-Newtonian fluids is crucial for industries such as polymer processing, food processing, refrigeration, and power generation. Extrusion is a common polymer processing technique that involves feeding polymer pellets into an extruder. The viscoelastic behavior of a polymer melt is influenced by a combination of factors, including molecular weight, temperature, time and strain rate [2,3,4]. Excessive elasticity can lead to flow anomalies and undesired effects during processing. Understanding the viscoelastic properties of polymeric materials enables optimization of plastic formulations, blends, and processing properties [5].
Cha et al. [6] investigated the viscoelastic behavior of ABS polymer sheets under thermoforming process conditions, such as strain, strain rate, and temperature, numerically and experimentally. The thickness distribution of the ABS polymer, which is the result of changing viscoelasticity, was found to be consistent with industrial manufactured products. Liao et al. [7] studied temperature and strain-rate dependence viscoelasticity of Very High Bond polymer (VHB) by proposing a finite strain thermo-viscoelastic constitutive model. The study found that the numerical model exhibited satisfactory agreement with the experimental data, as it accurately predicted strain across a range of temperature conditions. Janardhana Reddy et al. [8] studied the effect of temperature-dependent viscosity on entropy generation of a viscoelastic polymeric flow numerically. The viscosity variation parameter, as a function of temperature, and viscoelastic parameter were set to study the effect of temperature on second-grade fluid flow. It was found that the flow decelerates with the increasing value of the viscoelastic parameter due to higher elastic effects. The rising value of the viscoelastic parameter resulted in the decrease of average wall shear stress and wall heat transfer rate.
Modeling the viscoelastic flow of molten polymers is a challenging issue due to its complicated nature. Various viscoelastic models have been developed to describe the flow characteristics of polymer melt. Phan–Thien–Tanner (PTT) and Oldroyd-B are the commonly used viscoelastic models. Ansari et al. [9] examined various aspects of the capillary flow behavior of high-density polyethylene (HDPE) melt, such as the entrance pressure drop, compressibility, viscosity’s sensitivity to pressure and temperature, and slip effects, by both experimental and numerical analyses. The results indicated that the viscoelastic K-BKZ/PSM model showed high level agreement with the experimental data, while the purely viscous Cross model exhibited a discrepancy between its predictions and the actual behavior of HDPE in the experiments. Moreover, in the study of squeeze flow of a finite amount of fluid between infinite plates on both Newtonian and Oldroyd fluids, it is found that the present of elasticity in the fluid had greater effect on the squeeze force [10].
Many viscoelastic models have been utilized in a number of studies. Mu et al. [11] performed numerical study of three-dimensional polymer extrusion flow with a PTT viscoelastic model. The influence of the Weissenberg number, material parameters, and die geometry, particularly die contraction angles on the polymer melts’ flow, was studied. In another study by Mu et al. [12], three-dimensional planar contraction flow of viscoelastic fluids using various differential constitutive models, including PTT, Giesekus, and FENE-P was investigated. The numerical results of flow velocity, shear stress, and the first normal stress difference showed satisfactory agreement with prior experimental data. Cao et al. [13] added an additional shear rate contribution on the right side of the PTT model, just like in the Oldroyd-B model. The modified PTT model was used in his work instead of using the Oldroyd-B model to simulate the viscoelastic flow of melt polymer in compression molding. While the PTT model is advantageous for empirical fitting of rheological data, the Oldroyd-B model offers specific benefits, particularly in describing self-similar breakup and exponential thinning of polymeric threads—critical aspects of the extrusion process [14]. Moreover, its mathematical framework supports stable numerical approximations without stringent time step constraints, enhancing computational efficiency [15].
Bush [16] studied the extrudate swell of dilute polymer solution using the Oldroyd-B model in which the author discussed the importance of viscoelastic parameters, such as the Weissenberg number (Wi) and relative solvent viscosity, with respect to total viscosity (β). It was found that the swell ratio of polymer extrudate increases with the Wi at a given relative solvent viscosity, with respect to total viscosity. Moreover, many studies have been conducted on one of the benchmark problems: the viscoelastic fluid flow past a cylinder using the Oldroyd-B model [17,18,19,20]. Fan et al. [17] introduced a new Galerkin least-square formulation named MIXI1 based on an FEM (Finite Element Method) algorithm. In their work, MIXI1 was compared with EVSS and DEVSS formulations and found out that MIXI1 and DEVSS methods were superior to the EVSS method. Alves et al. [18] implemented two high-resolution schemes (MINMOD and SMART) based on an FVM (Finite Volume Method) and compared with their results with those of [17]. The comparison indicated that the result of dimensionless drag coefficients ( C d ) on the cylinder showed a good agreement between their studies. Xiong, Bruneau and Yang studied the effect of the Reynolds numbers (Re), Weissenberg numbers (Wi), and relative solvent viscosity, with respect to total viscosity ( β ), on the drag coefficient of the cylinder surface [19]. It was found that the drag impact of elastic forces was determined by the dominating forces in the fluid flow. When inertial forces dominated, polymer additives reduced drag by decreasing turbulence; however, excessive additives could increase drag by making elastic forces predominate, corresponding to low Reynolds numbers.
Previous studies have primarily employed purely viscous models to analyze the resistance of HDPE melt to shear flow through extrusion dies [8,21,22]. Mamalis et al. [23] examined pressure variations, flow characteristics, and temperature uniformity in the extrusion process of high-density polyethylene (HDPE) rods after developing inelastic generalized Newtonian viscosity models, particularly, the Carreau–Yasuda model and the Power Law model. However, these models fail to accurately capture the flow behavior of melted HDPE due to the significant elasticity present in its flow [9,10,24]. Among the well-established viscoelastic models, the Oldroyd-B model is widely recognized for describing the behavior of viscoelastic fluids, such as polymer solutions, which exhibit both viscous and elastic properties [25]. This model qualitatively predicts instabilities in shearing flows of viscoelastic fluids, including polymer melts, by accounting for normal stress effects that purely viscous models overlook. It was concluded that the viscoelastic model was most suitable for contraction die flow as the viscoelastic behavior of the polymer was influenced more strongly by shear stress profiles than by pure viscosity [24]. Additionally, its computational efficiency and stability make it a practical choice for numerical simulations, ensuring well-posedness under various initial conditions and demonstrating strong agreement with experimental and theoretical predictions [14,26]. Consequently, the Oldroyd-B model enhances the understanding of complex flow behaviors during extrusion processes [27,28].
Extensive research has been conducted on the numerical implementation of the Oldroyd-B model, demonstrating its effectiveness as a constitutive model for studying viscoelastic fluids. Nevertheless, numerical studies on the flow of melted HDPE in an extruder die using this model remain limited. To address this research gap, the present study conducts a two-dimensional numerical simulation of HDPE flow in the extrusion process by implementing the Oldroyd-B constitutive model. In this study, the Oldroyd-B model is adopted, as it provides a well-established and computationally efficient framework that captures essential viscoelastic effects, such as normal stress development and elastic recovery, which are critical in polymer extrusion. Although this model is known to face limitations at very high Weissenberg numbers, it remains adequate for the low-to-moderate range considered here, as validated against both numerical and experimental benchmarks [14,26,27,28]. The study focuses on analyzing the influence of extruder die geometry through a parametric investigation, varying relaxation time, inlet velocity, and die shape. The die is specifically designed with an extreme geometry to clearly illustrate the effects of these parameters. Additionally, the role of fillets along the die wall in modifying the flow characteristics is examined. The findings of this study will enhance understanding of the viscoelastic and thermal behaviors of HDPE during extrusion, facilitating process optimization in plastic manufacturing.

2. Mathematical Modelling

2.1. Assumptions

The following assumptions ensure computational feasibility, while maintaining accuracy, in predicting viscoelastic behavior.

2.1.1. Fluid Properties and Behavior

  • The polymer melt (HDPE) is treated as an incompressible, viscoelastic fluid;
  • The flow follows the Oldroyd-B constitutive model to capture viscoelastic effects;
  • The effect of thermal radiation is neglected, assuming it has a negligible contribution compared to conduction and convection, under the present operating conditions.

2.1.2. Simulation and Geometry

  • The study is conducted in 2D for computational efficiency, while preserving flow characteristics;
  • The extruder die is simplified as a steady-state flow problem;
  • The mesh resolution is optimized based on a grid independence study.

2.1.3. Boundary Conditions and Temperature Effects

  • Constant inlet velocity is assumed at the extruder entrance;
  • The inner and outer die walls are maintained at constant temperatures with no-slip boundary conditions.

2.2. Die Geometry

In this study, a mandrel is implemented in the die to shape and support the material during extrusion, primarily defining the internal geometry of the extruded product while ensuring uniform wall thickness and structural integrity [29]. As the polymer melt flows through the narrow channel of the die, it undergoes shear and extensional stresses. The extruder die geometry employed in this study is adapted from a conical extruder commonly used in pipe extrusion machinery, shown in Figure 1, suitable for processing various polymer types, including HDPE. The die has a radius of 9 mm at the point of entry, the resulting pipe has a diameter of 15 mm and a wall thickness of 12 mm at the point of exit. The schematic representation of the two-dimensional extruder die domain is presented in the Governing Equations
The governing equations to solve polymer melt flow problems can be derived from the continuity, motion, and energy equations. The flow is assumed to be incompressible, non-isothermal, and steady. Additionally, the effects of inertia and gravitational forces are ignored due to the low Reynolds number of polymer melts. The equations of continuity, momentum, and energy are given in Equations (1)–(3), as in the non-isothermal polymer extrusion flow study [23,30].
Continuity equation
u i x i = 0  
Momentum equation
( ρ u i ) t + ( ρ u j u i ) x j = p x i + τ i j t o t x j
Energy equation
ρ c p u i T x i = q i x i + Q v d
where the heat flux q i is modeled using Fourier’s law of heat conduction, q i = k T x i w and k denotes thermal conductivity. In addition, u i   is the velocity component, ρ denotes the density, p is the hydrostatic pressure, c p is the specific heat capacity, T is temperature, and Q v d represents the viscous dissipation.

2.2.1. Oldroyd-B Model

The Oldroyd-B model is a constitutive model used to describe the flow of viscoelastic fluids and used in many studies of polymer flow [17,18,19]. This model is equivalent to a fluid filled with elastic beads and spring dumbbells.
λ   τ i j p t + u k τ i j , k p u i , k τ k j p u k , i τ k j p + τ i j p = 2 η p D i j
D i j   = 0.5   ( u i , j + u j , i )
where λ is the relaxation time and τ ij p are polymeric part of the extra stress tensor. u i are the velocity components and η p is the zero-shear-rate viscosity of the polymer. D i j are the components of the rate of the deformation tensor.

2.2.2. Weissenberg Numbers

A Weissenberg number (Wi) is a dimensionless number that compares elastic forces to viscous forces. A zero Weissenberg number corresponds to no elastic response. An infinite Weissenberg number responds to a purely elastic response.
Wi   = U L / λ
where U is the average velocity, L is the radius length scale at the die inlet of flow geometry, and λ is relaxation time.

2.3. Dimensionless Parameters

In investigating the viscoelastic flow characteristics of high-density polyethylene (HDPE), this study utilizes two dimensionless parameters. The first parameter, donated as β, represents the relative solvent viscosity, which indicates the viscosity of the solvent within melted HDPE relative to the overall viscosity, and β = 0.59 is used as in the studies of viscoelastic flow [17,18]. The second parameter is the dimensionless drag coefficient, Cd, used to analyze the drag experienced on the inner wall of the extruder die during the flow process [17,18].
β = η s η s + η p
η = η s + η p
where η s is solvent viscosity and η p is polymer viscosity.
C d = 1 η   U S   τ tot   p I n i ^ d S
where I is the identity tensor, n is the unit normal vector to the cylinder surface, and i ^ is the unit vector in the x-direction.

2.4. Numerical Methodology

The Galerkin Least Squares (GLS) method has emerged as a promising breakthrough in finite element analysis in recent years, particularly in the context of stabilized finite element methods for fluid flow equations, as explored by Hughes et al. [31]. It improves solution stability and enhances convergence, making it ideal for handling complex geometries commonly found in practical applications [32,33,34]. The Galerkin Least Squares (GLS) method proves highly effective in stabilizing viscoelastic flow simulations, as demonstrated by its accurate prediction of drag forces on a cylinder in an Oldroyd-B fluid, confirming its reliability in capturing complex viscoelastic behavior across various flow conditions [35]. The governing equations, which describe the velocity field and stress tensor in the fluid, are discretized using the Galerkin finite element method. The weak form of the equations is derived, and SUPG stabilization terms are immediately incorporated into the constitutive equations. This helps stabilize the solution in advection-dominated regions and reduces oscillations in viscoelastic flows. The numerical solution of these equations is then obtained using the COMSOL Multiphysics 6.1 solver [36].
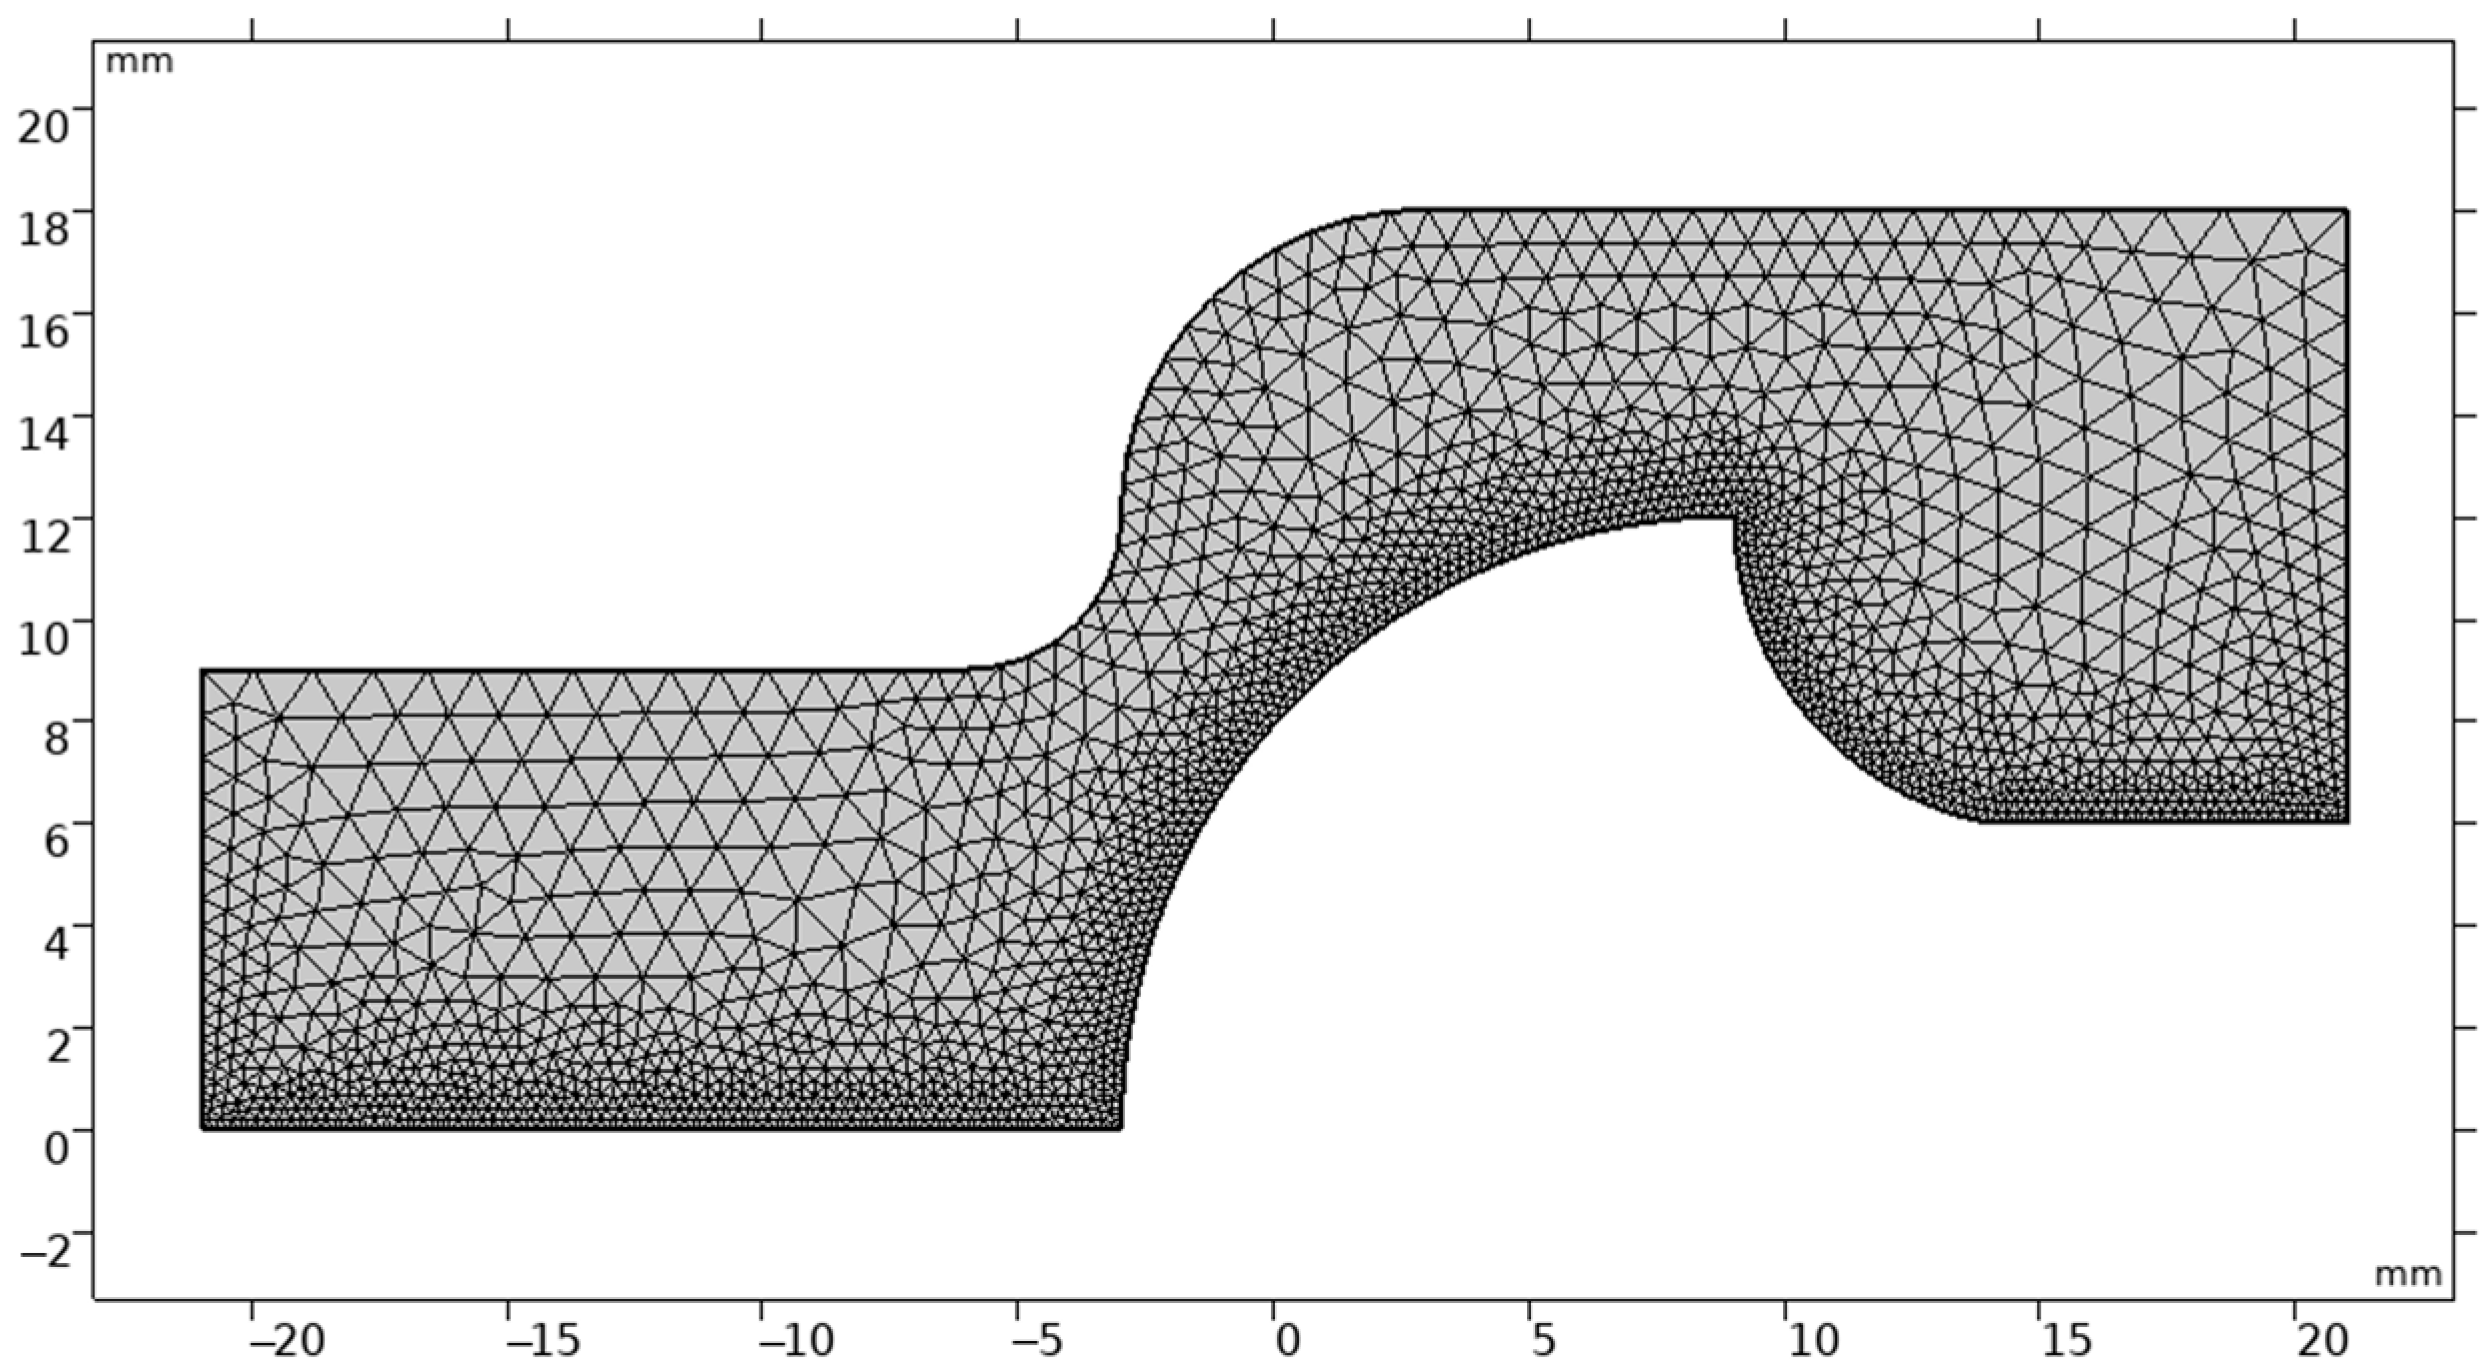
Mesh resolution was carefully selected using COMSOL’s predefined levels, with an Extra Fine setting at critical regions such as the inner wall, where parameters like the dimensionless drag coefficient and viscoelastic stress are computed. A grid independence study ensured a balance between accuracy, mesh quality, and computational efficiency. The element sizes ranged from 0.0027 mm to 0.234 mm, with a scaled mesh of 3867 elements, as illustrated in Figure 2. A grid independence study was carried out by comparing two refined meshes against a coarser baseline. The monitored quantities included the drag coefficient (Cd) and the maximum normal stress at the die wall. As shown in Table 1, the difference between medium and fine meshes was less than 1%, while CPU time increased significantly with refinement. Based on this, the fine mesh with 3867 elements was selected for all simulations, as it provided a good balance between accuracy and computational cost.
COMSOL’s Galerkin finite element discretization scheme was applied to handle complex fluid dynamics and viscoelastic stresses. A stationary solver with a 10−6 relative tolerance ensured convergence. A geometrically graded mesh was used toward edges and contraction corners (minimum element size ≈ 0.0027 mm), with Extra Fine resolution in critical regions. Local error indicators were based on line/arc probes intersecting high-gradient zones. The monitored quantities, which are peak and average τxx and τxy, changed by <1–2% between the final two refinement levels, which we take as mesh-independent for the purposes of this study. The numerical solution was validated against a benchmark problem from the literature.
The present computations employ GLS with SUPG stabilization in the constitutive equations, which was sufficient for stable and accurate solutions in the studied regime (Wi ≤ 0.21). For higher Wi values or more severe gradients, established alternatives such as DEVSS can be used, possibly combined with the log-conformation reformulation to improve numerical robustness. Extending the present framework with such approaches is a promising direction for future work.

2.5. Boundary Conditions

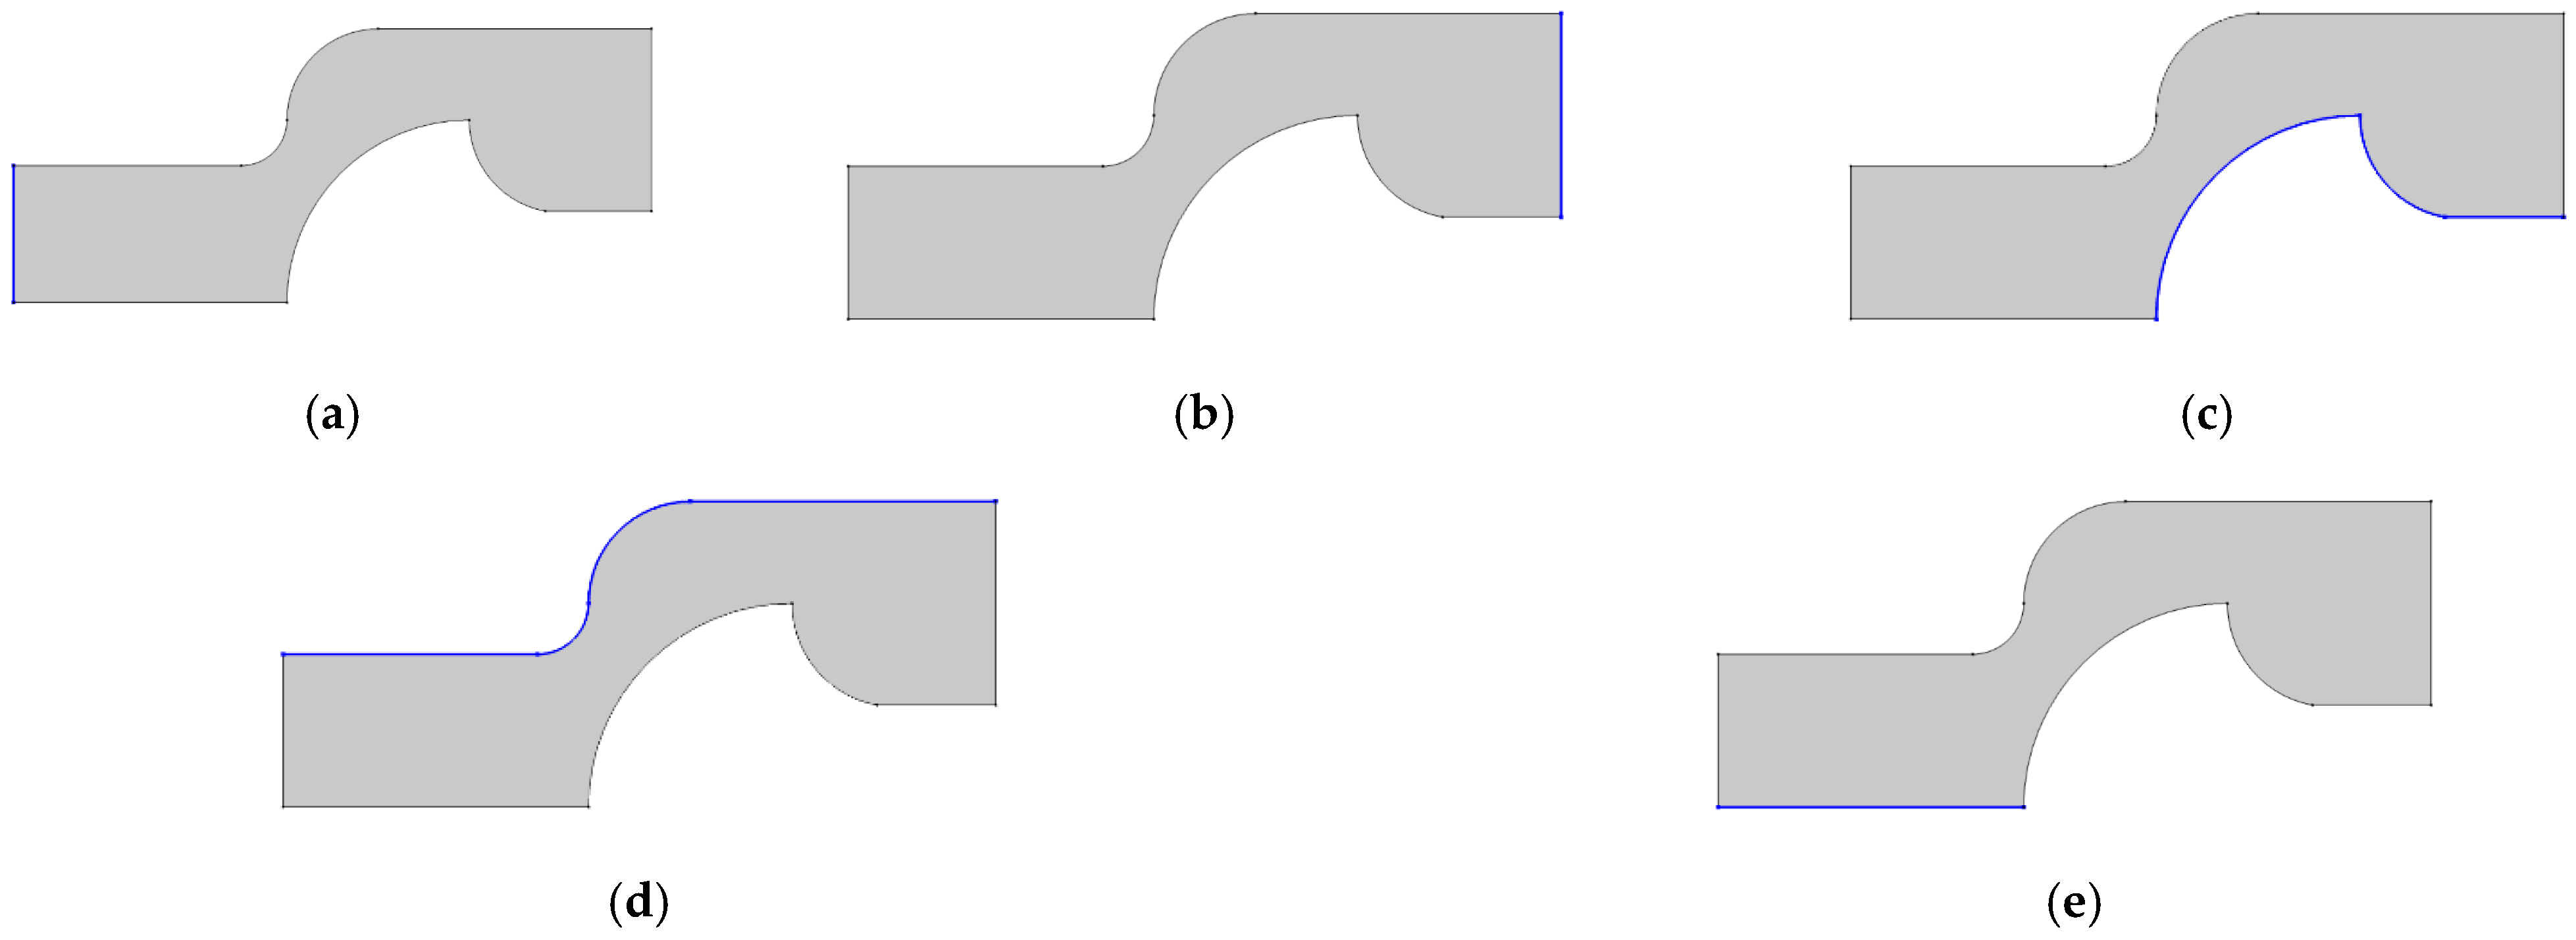
Specific conditions are given to the five domain boundaries depicted in Figure 3.
The boundary conditions imposed in this work follow the conditions of the viscoelastic flow of polymer melts [30,36]. At the inlet (Figure 3a), a fully developed flow profile is imposed, as follows:
u y = 0
u x = U 1 y 2
At the stationary solid walls (Figure 3c,d), a nonslip condition is imposed on all the velocity components, as follows:
u x = u y = 0
Extra stress components at the inlet are as follows:
τ x x   =   2 η p W i u y 2
τ x y = η p u y
τ y y = 0
A constant temperature is also imposed at the inlet.
T = Tinlet
The parameter ranges investigated in this study (Wi ≤ 0.21, λ = 0.02–0.06 s, U = 0.02–0.03 m/s) are consistent with reported values for HDPE melts under extrusion-relevant conditions. Relaxation times of HDPE exhibit a broad spectrum, spanning from fractions of a second to 104–105 s depending on molecular weight distribution and temperature [37,38]. The selected λ values therefore correspond to the short-time regime of the relaxation spectrum, which is particularly relevant for capturing melt response during flow through narrow die contractions. Similarly, the inlet velocity range (0.02–0.03 m/s) is representative of moderate-throughput extrusion scenarios, consistent with reported volumetric flow rates of approximately 4–5 kg/h for HDPE at 170–200 °C through laboratory-scale dies [39].
The following boundary conditions are applied. The velocity of melted HDPE at the die inlet is specified as 2.5 × 10⁻² cm/s. The volume flow rate of HDPE is 6.36 cm3/s, which is approximately equivalent to the value (7.9 cm3/s) used in [40]. The boundary condition for outlet pressure, temperature of the fluid at the inlet, and temperature of the die on the inner wall are 0 Pa, 473.15 K, and 471 K, respectively [41]. The temperature of the die on the outer wall is kept constant at 469 K [40]. The die walls were modeled with a constant temperature to represent industrial temperature-controlled zones. So wall temperatures are typically maintained within a narrow band. This assumption is widely used and can capture free-surface behavior accurately in comparable extrusion problems [21,22,23]. The material parameters of HDPE are shown in Table 2.
The boundary conditions are specified based on the domain boundaries illustrated in Figure 3, as follows.

2.5.1. Viscoelastic Flow

(a) Inlet velocity: U = 2.5 cm / s (volume flow rate = 6.36 cm3/s);
(b) Outlet pressure: 0   kPa ;
(c) No slip condition: u   =   0 ;
(d) No slip condition: u   =   0 ;
(e) Axial symmetry condition: u n   =   0 .

2.5.2. Heat Transfer

(a) Inlet temperature = 473.15 K;
(b) Outflow: n ( q ) = 0 ;
(c) Constant die temperature = 471 K;
(d) Uniform and constant die temperature = 469 K;
(e) Axial symmetry condition: T = 0 .

2.6. Numerical Model Validation

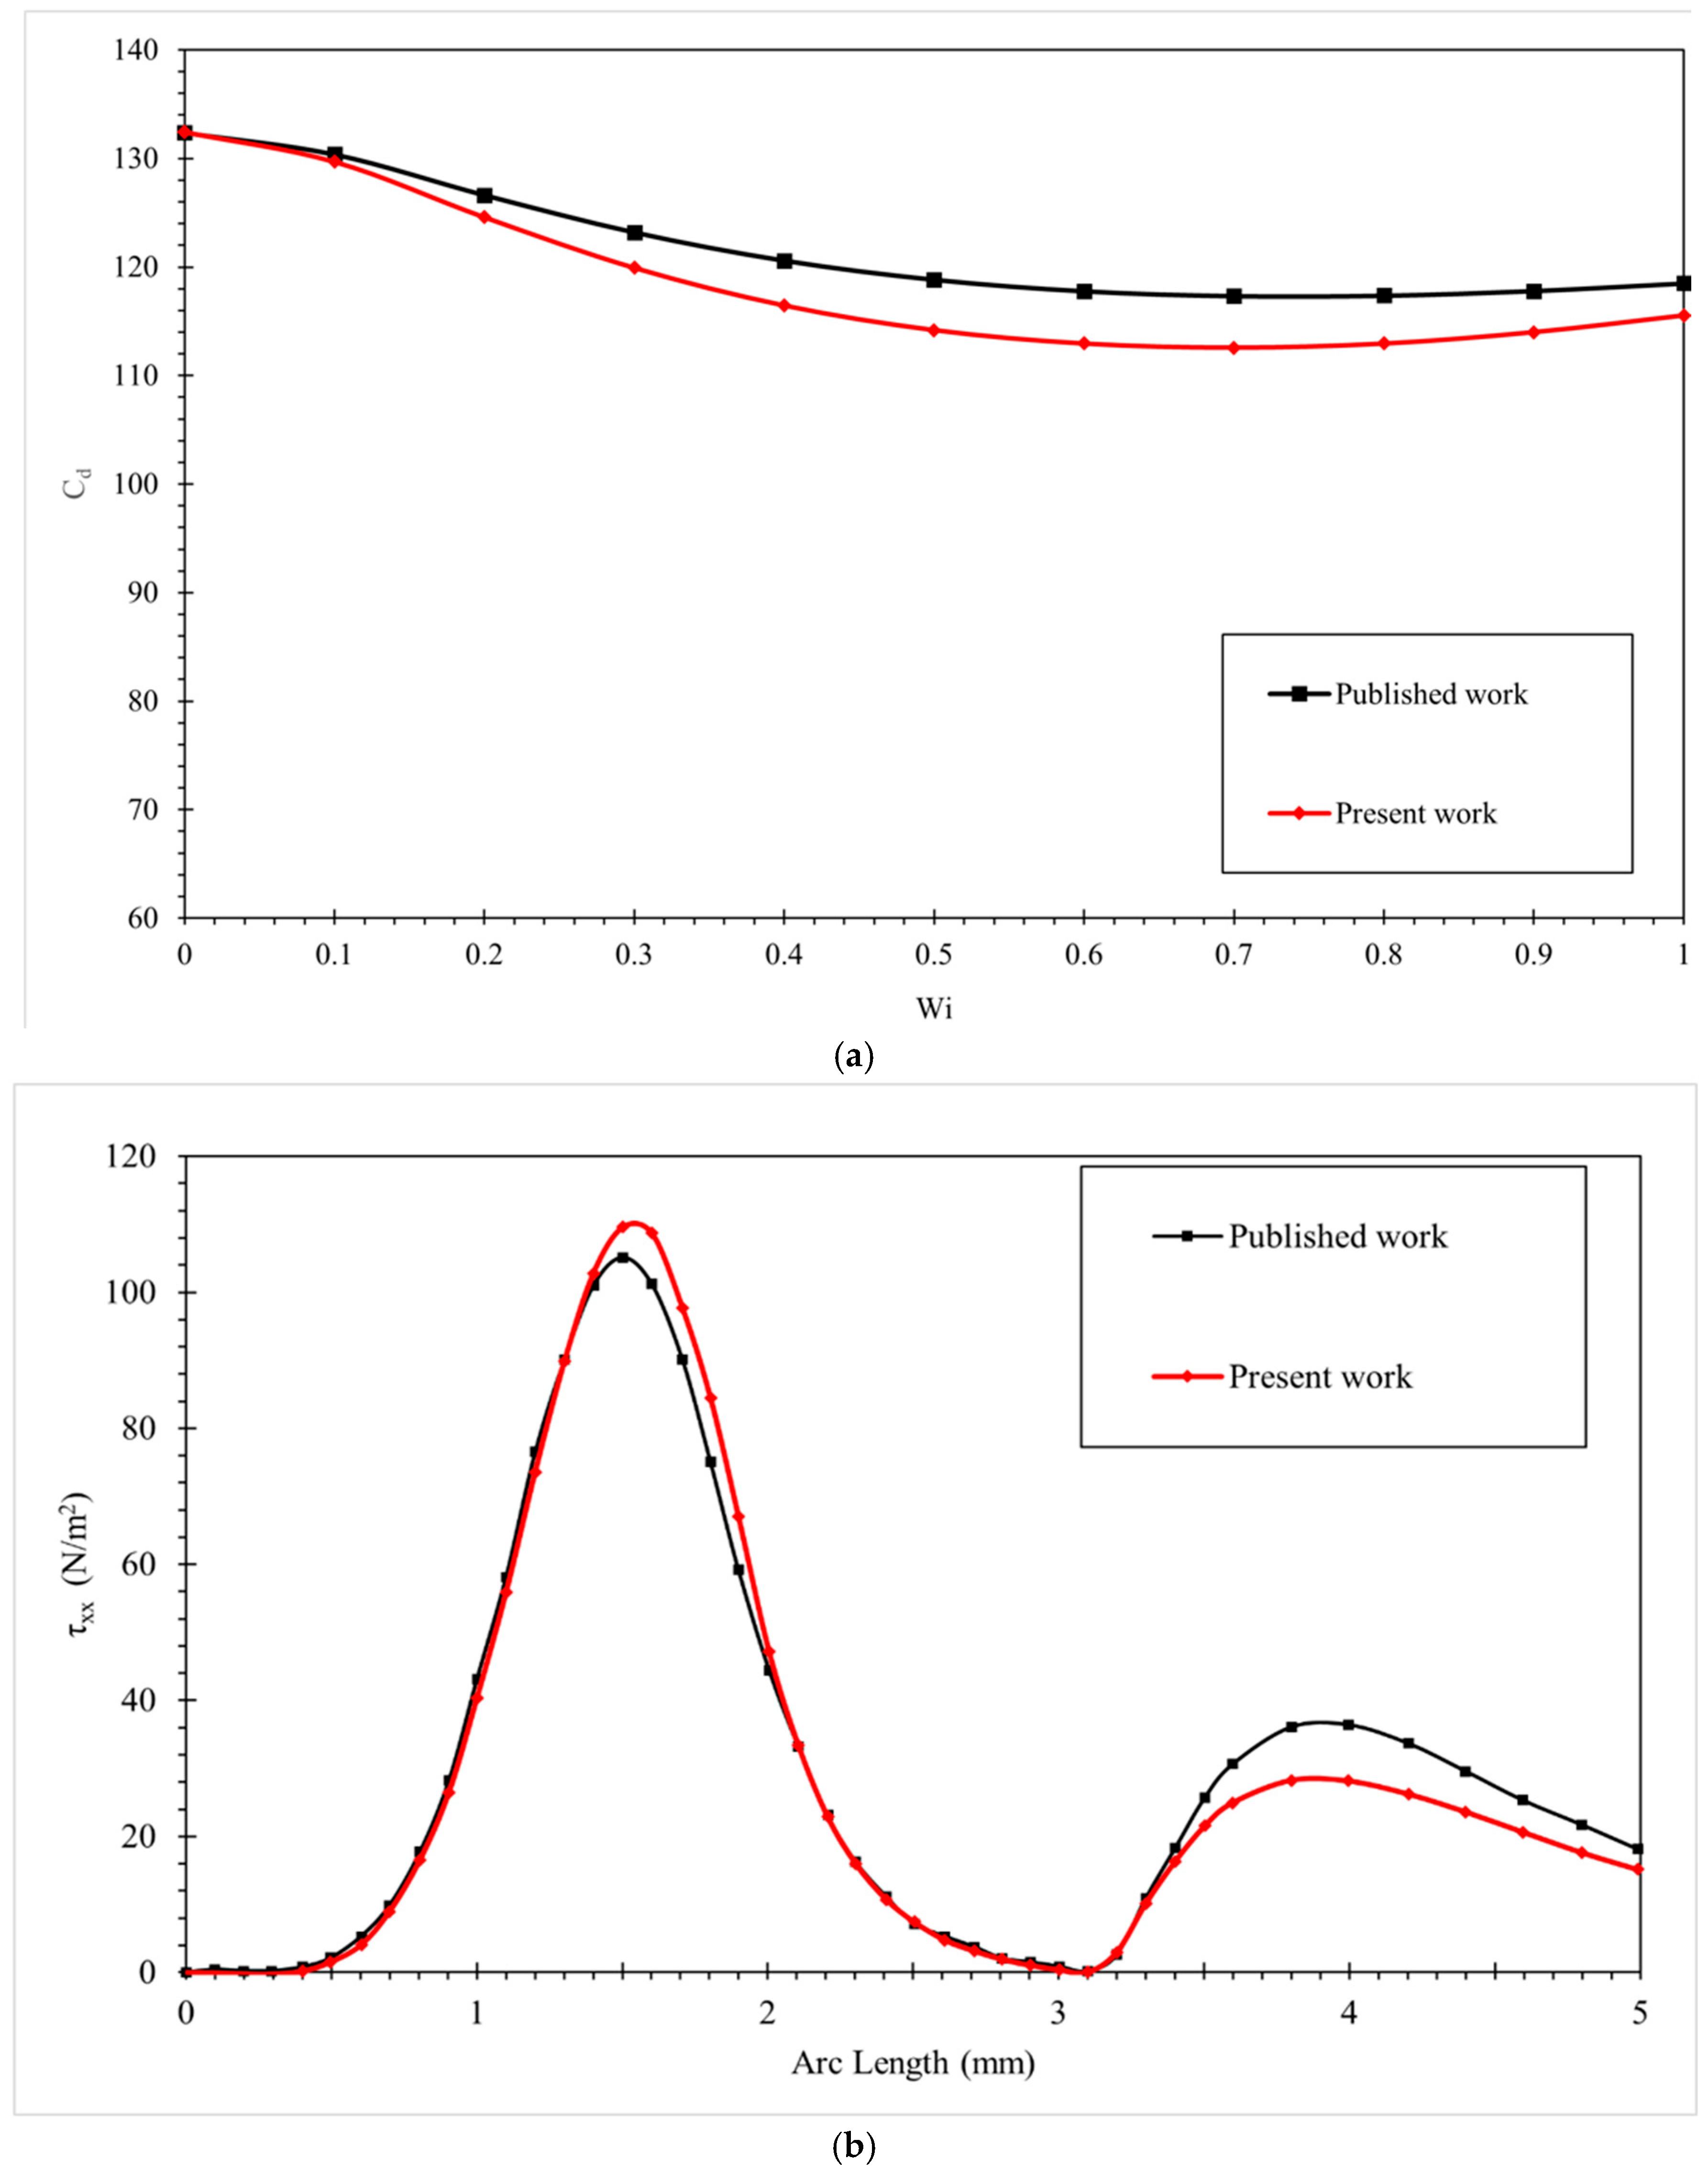
The mathematical model and numerical method are validated against the published work in which the Oldroyd-B model is used to study the viscoelastic flow using Galerkin least-square finite-element methods [17]. The CFD simulation is conducted for the problem of viscoelastic fluid flow around the cylinder through a channel. Figure 4a presents both Cd from the literature and COMSOL, which show the lowest values at a medium–high Wi = 0.7. The minimum and maximum error percentages between the literature and COMSOL simulation results are 0.06% and 4.27%. The maximum stresses ( τ xx ) for both the literature and COMSOL simulation occur at the narrowest channel, arc length (s/R) = 1.5 mm, which can be seen in Figure 4b. The error percentage at the maximum stress is calculated to be 6% and the percent discrepancy for both the dimensionless drag coefficient and normal stress on the cylinder are less than 10% and follow the same trend, indicating a high level of agreement.
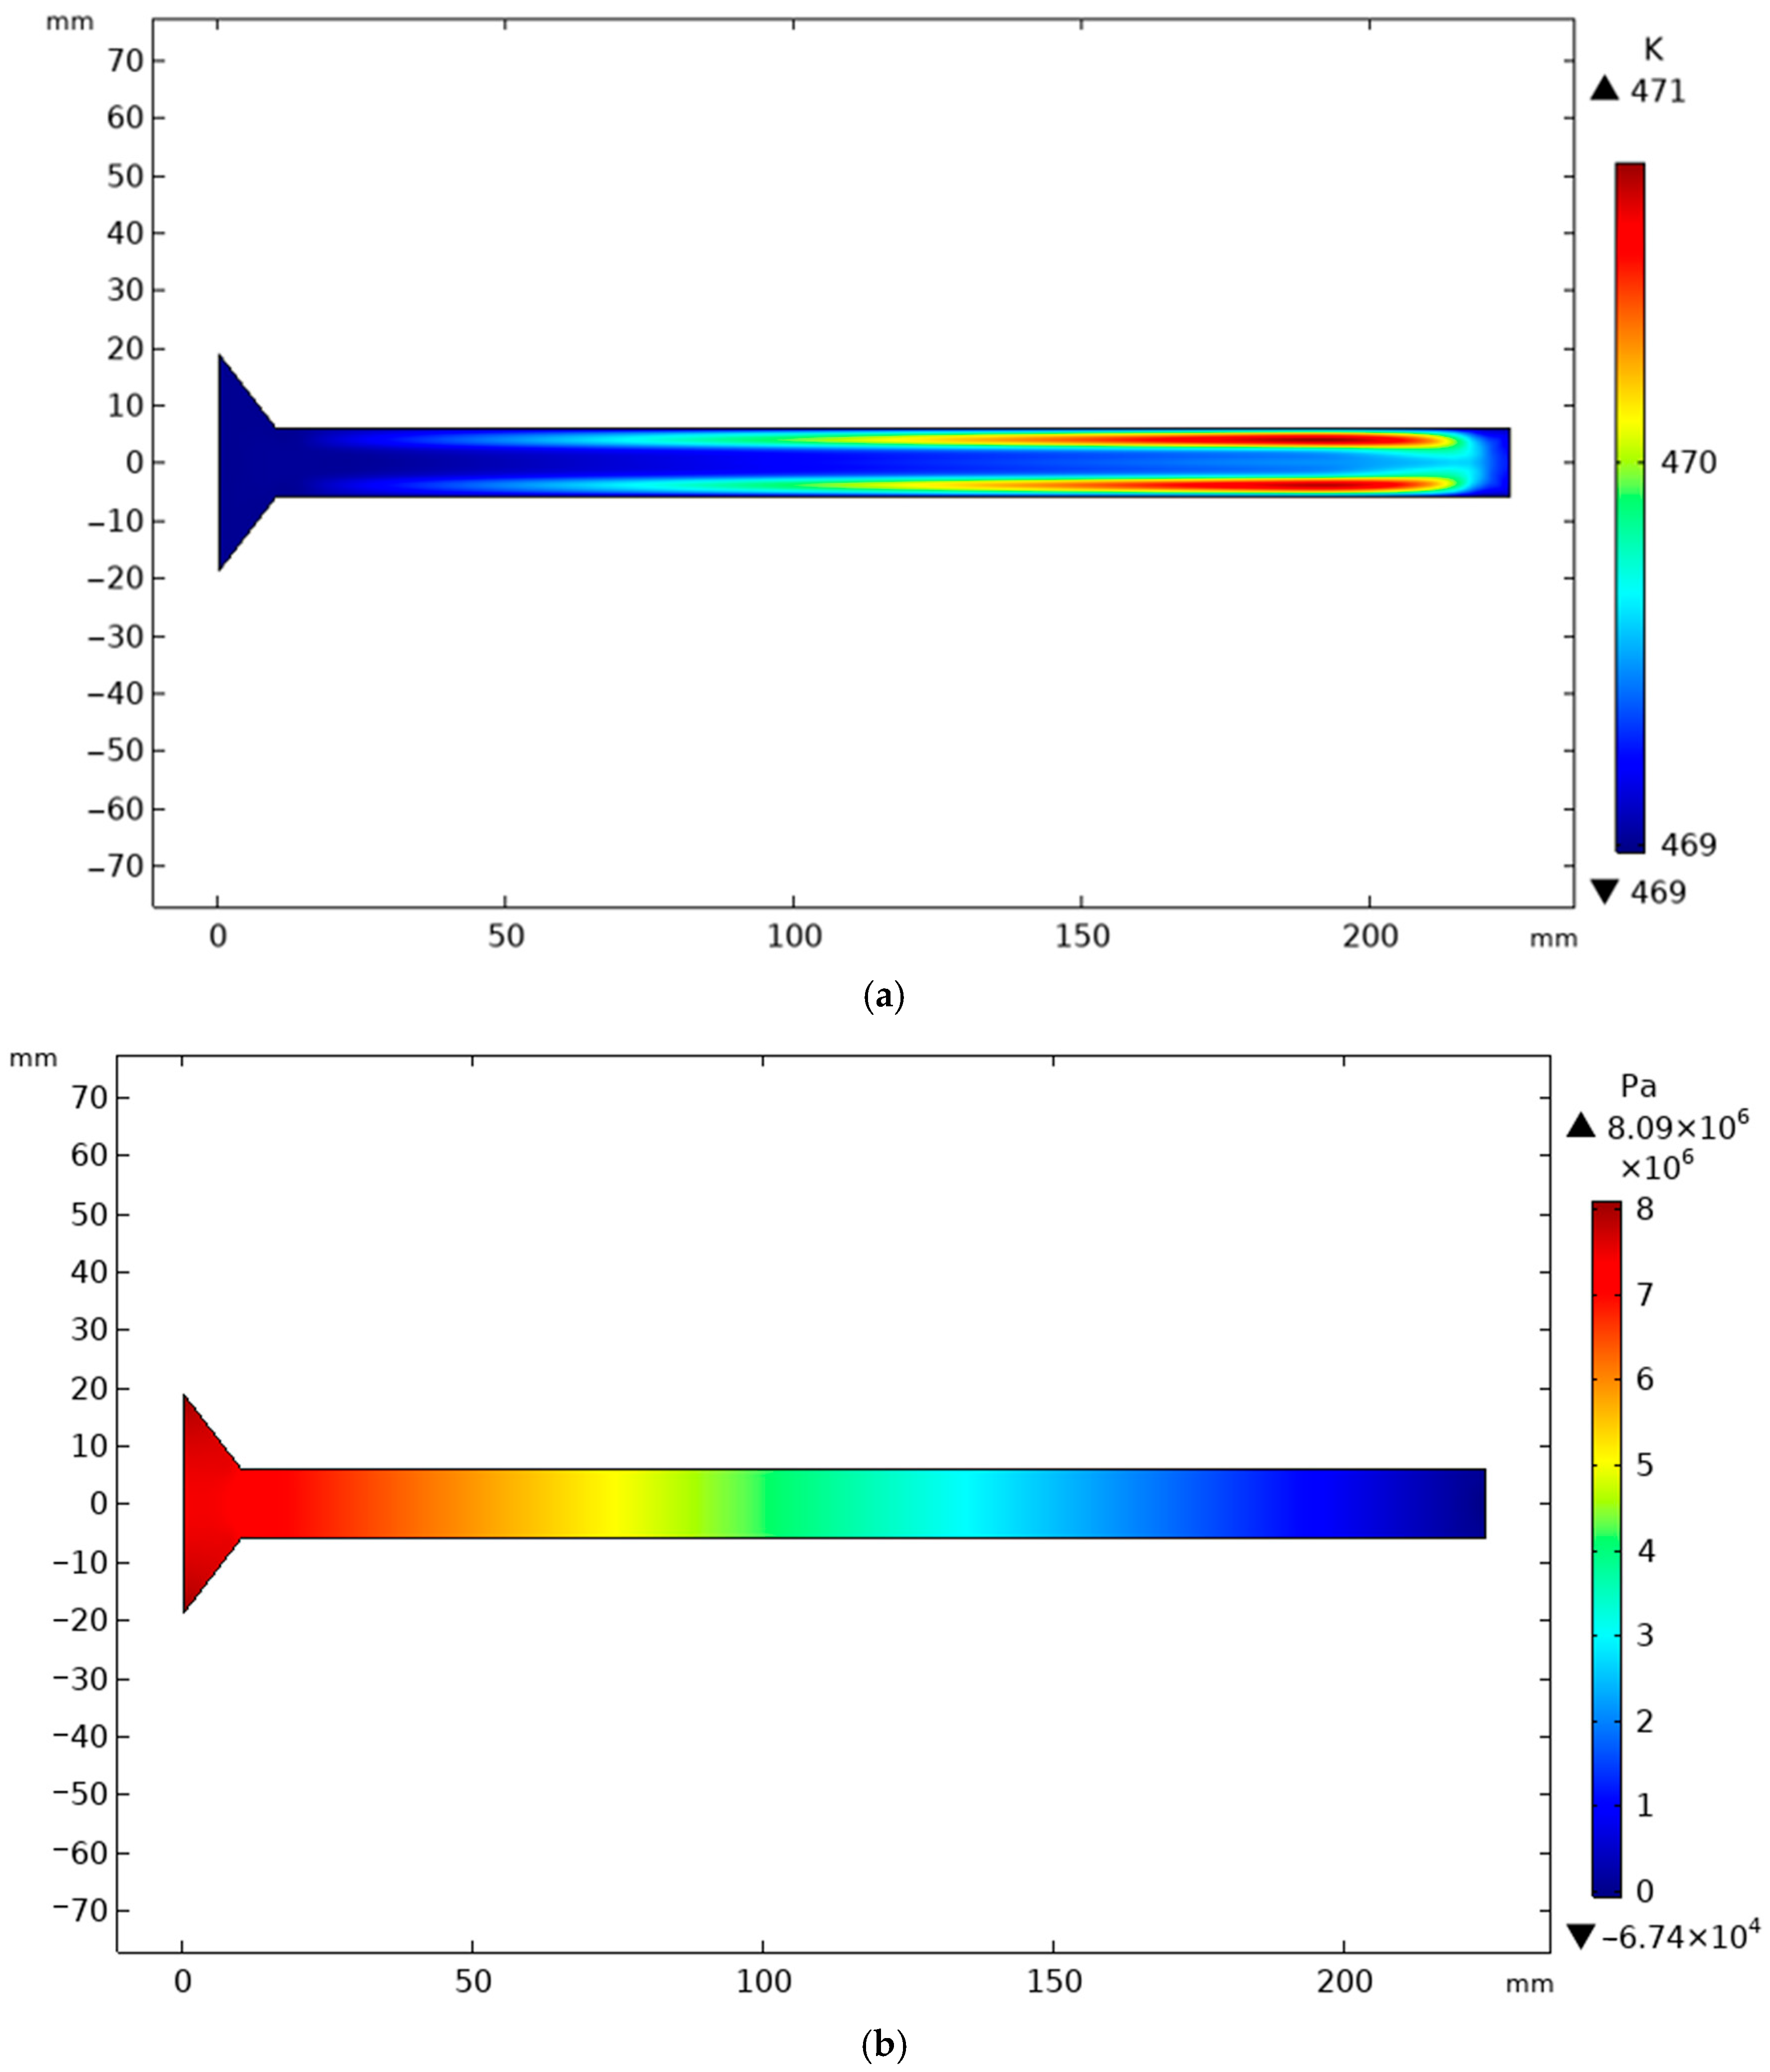
The validation of HDPE flow through the extrusion die is conducted against the published literature, where the flow was analyzed using the Carreau–Yasuda and Power Law models and compared with experimental results [23]. According to the literature, the bulk temperature differences for the Carreau–Yasuda and Power Law models, as well as the experimental data, were reported as 2.1 K, 2.1 K, and 2.0 K, respectively. The validation using the Oldroyd-B model yielded a bulk temperature difference of 2.0 K, which is identical to the experimental reference, as shown in Figure 5a. Similarly, the pressure drops reported in the literature for the Carreau–Yasuda, Power Law, and experimental data were 8.1 MPa, 8.2 MPa, and 8.19 MPa, respectively. The Oldroyd-B model predicted a pressure drop of 8.15 MPa, resulting in a 0.49% error compared to the experimental result, as illustrated in Figure 5b. The close agreement between the validation results and the literature confirms the reliability of the Oldroyd-B model for accurately simulating HDPE flow in the extrusion process. Therefore, the close agreement with both the literature and experimental data confirms that the present results are not significantly influenced by small uncertainties in the initial or rheological parameters [23,42,43,44]. Although a detailed sensitivity analysis was not performed, the error levels (≤10% for stresses and <1% for temperature and pressure) indicate that the adopted rheological parameters yield robust and reliable predictions of HDPE extrusion flow.
It is noted that while stress distribution patterns are of great interest, their direct measurement in polymer extrusion experiments is highly challenging. Consequently, most validation studies focus on accessible quantities such as pressure, temperature, or extrudate swell [23,42]. By demonstrating excellent agreement with these measurable benchmarks, the present validation ensures that the adopted model reliably captures the viscoelastic flow behavior relevant to industrial extrusion.

3. Result and Discussion

3.1. Simulated Multi-Field Analysis

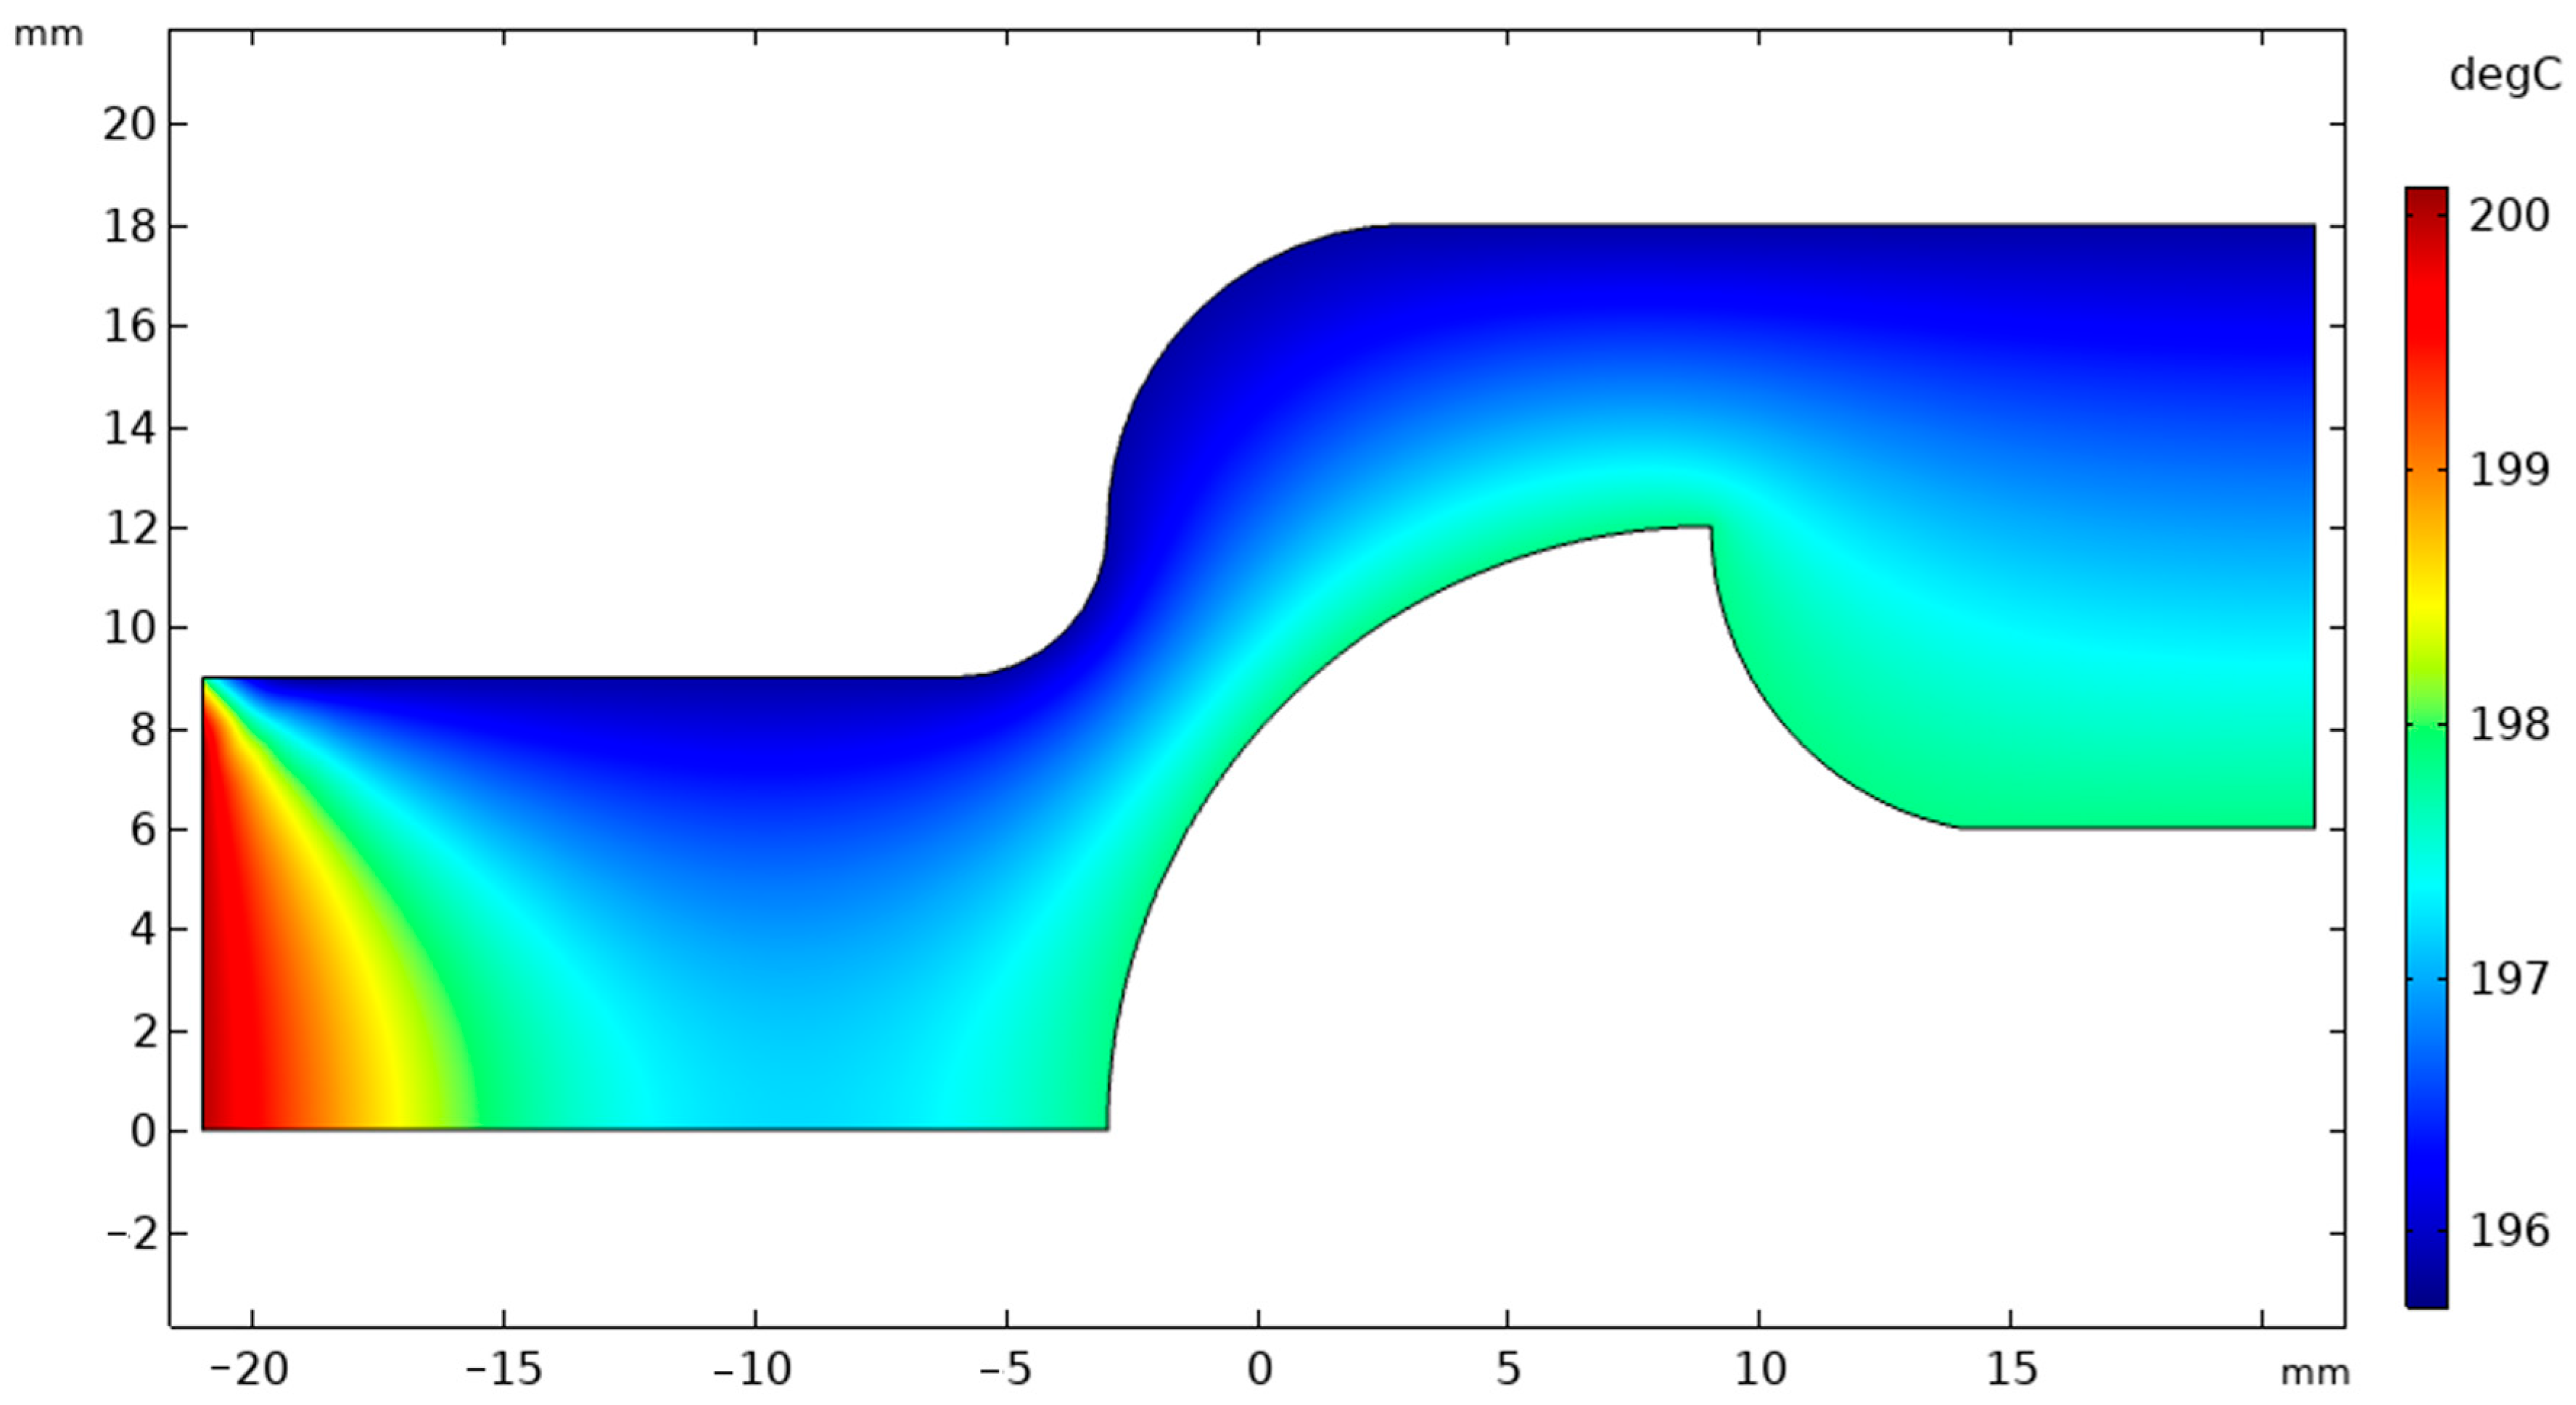
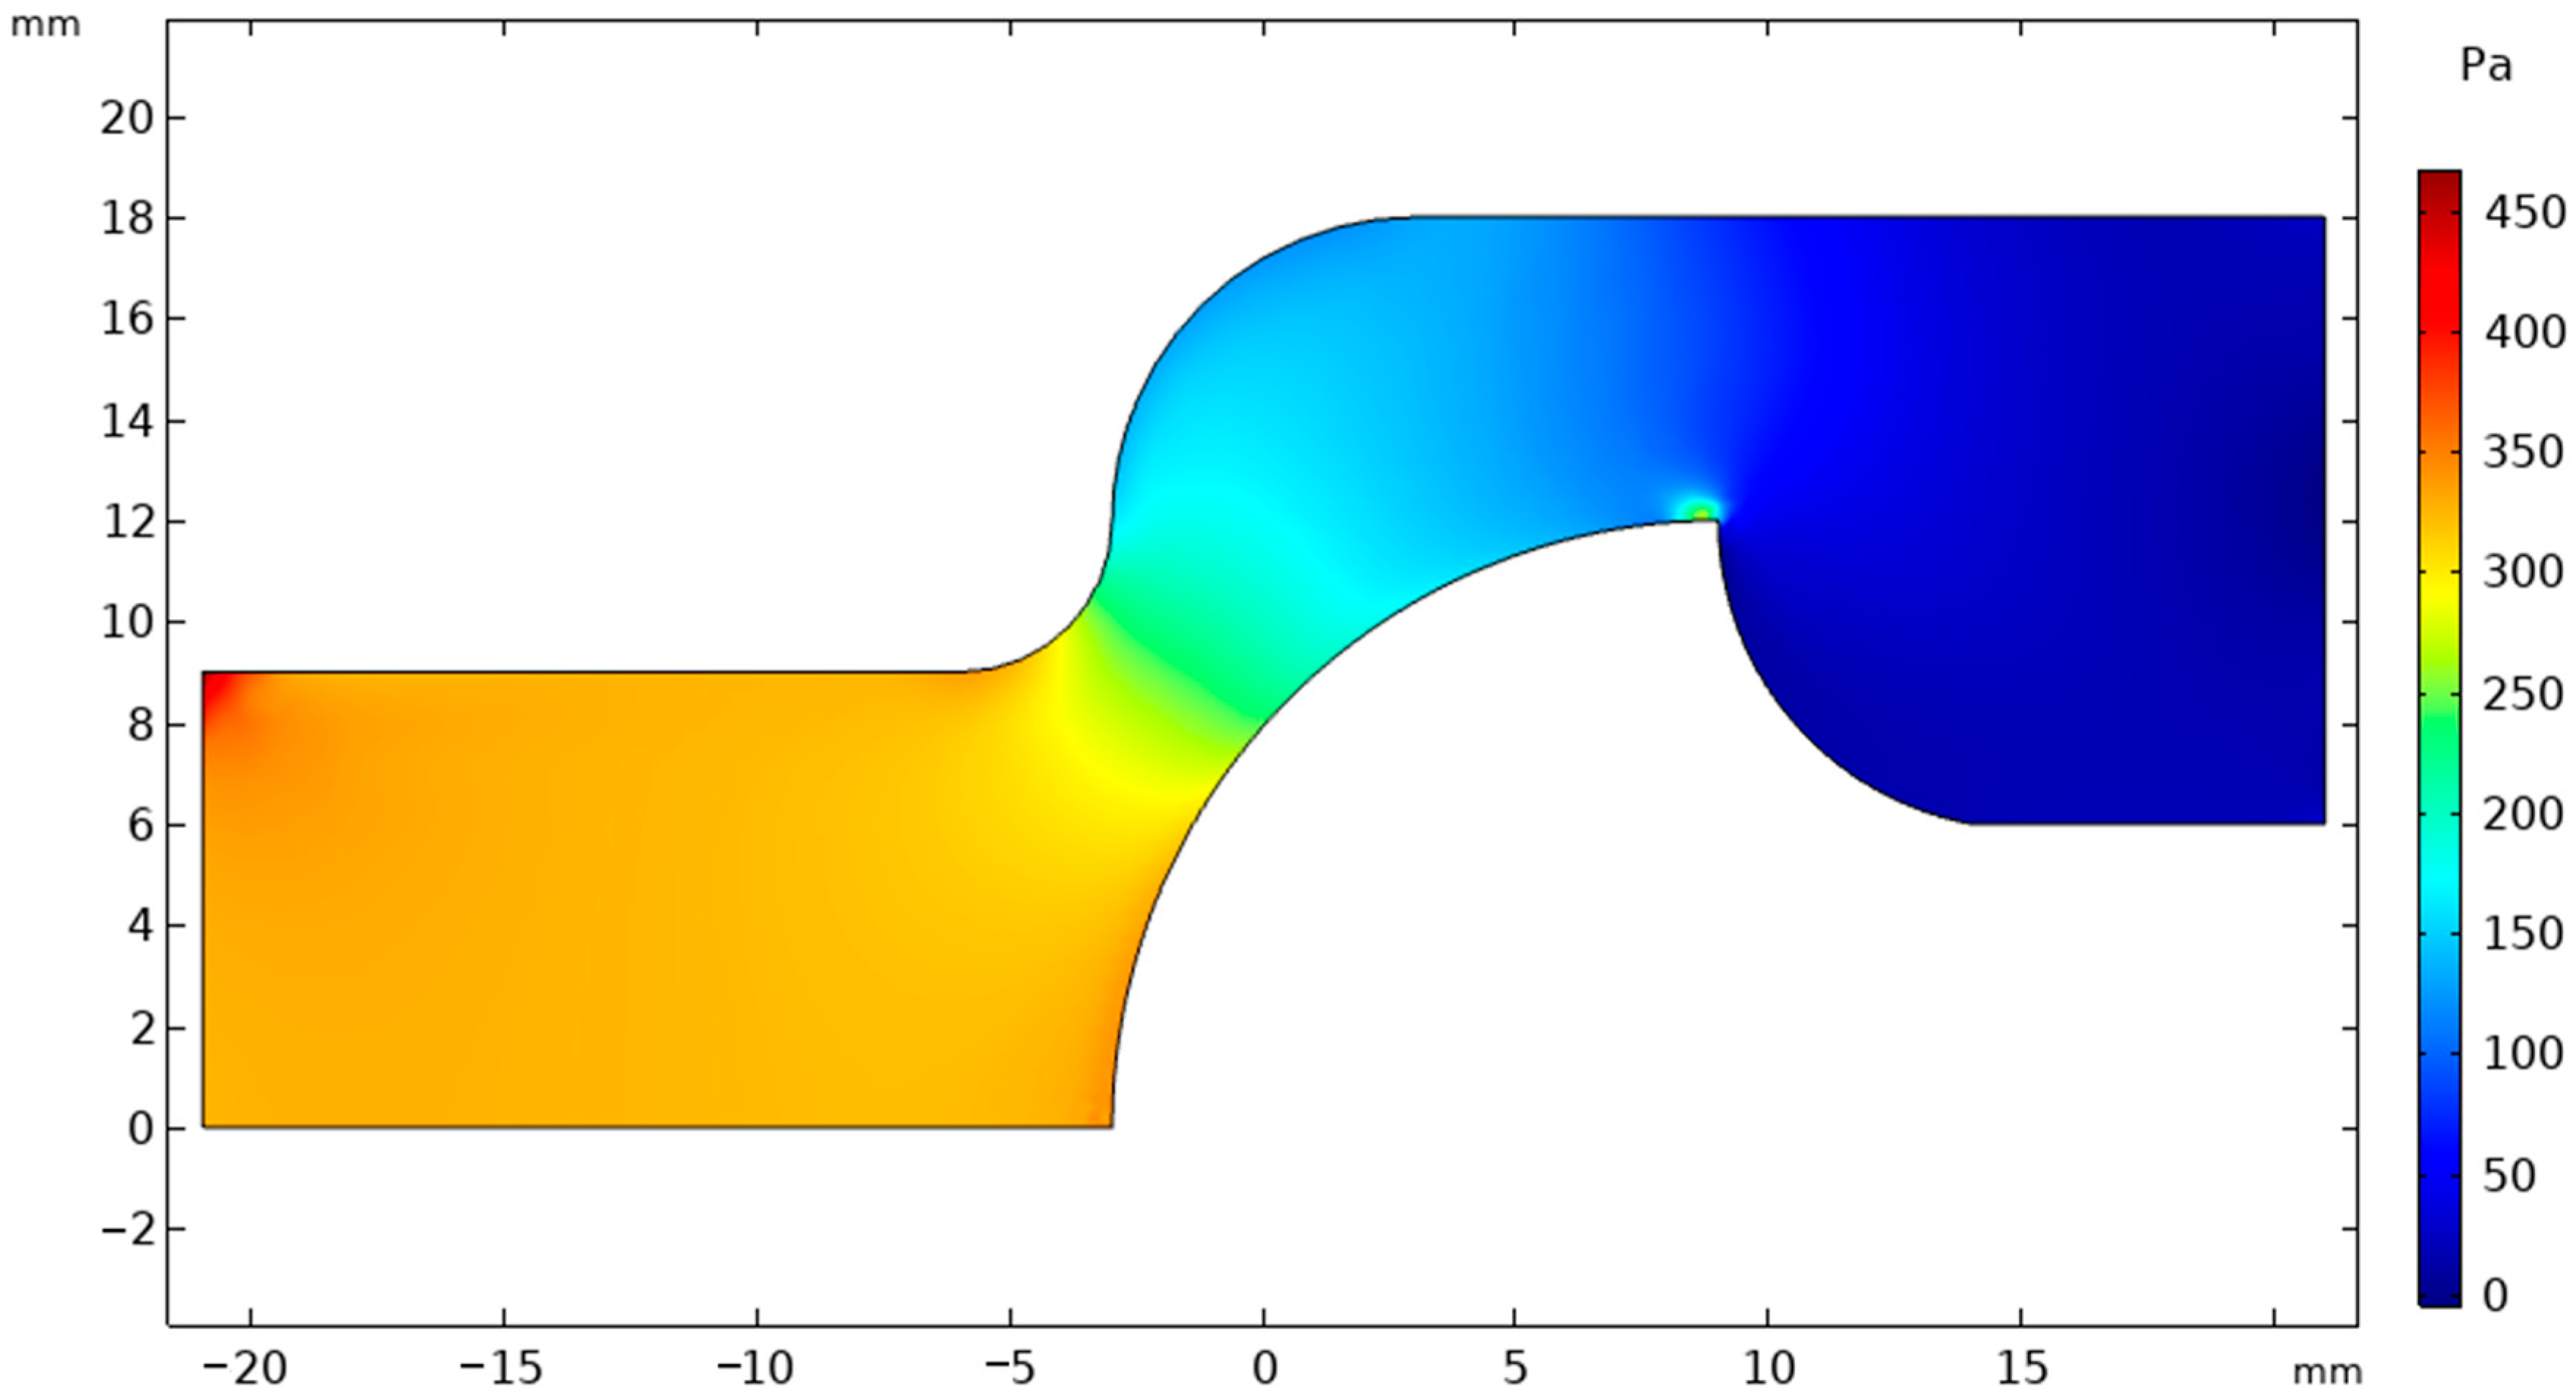
The flow and heat transfer simulation of a non-isothermal fluid through the extruder die in Figure 1 is implemented at Wi values of 0, 0.1, 0.15 and 0.21, where the Wi indicates the ratio of elastic to viscous responses exhibited by the HDPE melt. While the present simulations were restricted to Weissenberg numbers up to 0.21, it is recognized that in practical extrusion the Wi can exceed unity. Such high-Wi regimes are closely linked to instabilities, such as melt fracture and severe die swell. However, numerical divergence beyond this range is a manifestation of the High Weissenberg Number Problem (HWNP), a well-documented challenge in viscoelastic flow simulations. The current study therefore emphasizes low-to-moderate Wi values, which are still industrially relevant and provide critical insights into stress development and geometric effects [27,28]. The velocity, temperature, and pressure fields over the symmetric domain inside the extruder die are shown in Figure 6, Figure 7 and Figure 8 respectively. In Figure 7, temperature is the highest at the die entrance, where a constant temperature is imposed for the heated polymer melt. The average temperature of the melt at the die outlet is recorded as 197.49 °C for the steady state solution. At the narrowest region of the extruder dies (throat), the highest velocity (0.08 m/s) with the highest velocity gradient (the highest shear rate) is observed. This results in a significant viscous dissipation at the inner wall of the throat (mandrel surface) as indicated by the highest temperature gradients [45]. The thermal conductivity of HDPE varies only modestly with temperature (~10–20% across the extrusion range), and the enclosed opaque melt renders radiation negligible compared to conduction. While including such effects could slightly modify the predicted temperature gradients near the throat, they are not expected to alter the overall flow and stress behavior.
Pressure distribution within the die is shown in Figure 8, where the highest is at the die inlet and decreases along the die channel towards the exit. The highest pressure drop occurs at the throat area, where the highest velocity gradients are also observed, as expected from a contraction flow through a narrower channel.

3.2. Effect of Weissenberg Number

The dimensionless drag coefficient (Cd) on the inner wall of the extruder die, shown in Figure 9, demonstrates the impact of the Weissenberg number (Wi) on the simulation results of HDPE flow using the Oldroyd-B model. As Wi increases, representing higher fluid elasticity, the drag coefficient initially rises, peaking at a very low Wi of 0.015. It then steadily decreases, reaching a minimum at Wi = 0.13, where the viscoelastic effects cause a reduction in drag. At lower Wi values, the polymer melt behaves more like a Newtonian fluid, where the viscous resistance dominates, leading to a higher drag coefficient. In contrast, at higher Wi, the elastic effects become more pronounced. The polymer chains align more with the flow direction and resist deformation less near the wall. This reduces the shear forces acting on the wall and, consequently, the viscous dissipation in this region. The result is a smoother flow, less interaction with the wall, and a lower drag coefficient, Cd. After the minimum, Cd starts to rise again as the Wi continues to increase, reflecting the increasing dominance of elastic forces. This trend is consistent with the behavior of viscoelastic fluids, where the balance between viscous and elastic forces shifts as the Weissenberg number changes. This behavior is consistent with findings from both experimental and numerical studies, validating the Oldroyd-B model’s ability to simulate such viscoelastic flows in polymer processing [43,44]. The Oldroyd-B model effectively captures this behavior by modeling the fluid’s memory effects and elastic stress contribution. However, beyond Wi = 0.21, the solution fails to converge due to the high localized stress gradients, a common issue known as the High Weissenberg Number Problem. This divergence is typical in simulations involving highly elastic flows, where excessive stress can make numerical stability challenging [46]. The non-linear variation of Cd with Wi can be explained in terms of polymer chain dynamics. At low Wi, polymer chains remain mostly coiled, as their relaxation times are short compared to the imposed deformation rate, resulting in viscous resistance and relatively high Cd. At intermediate Wi values, chains begin to align with the flow direction, reducing entanglements and wall interactions, which corresponds to the observed decrease in Cd. At higher Wi values, however, chain relaxation is too slow relative to the deformation rate and chains become significantly stretched, leading to stored elastic energy and increased resistance, which explains the rise in Cd. This interpretation is consistent with tube-based models of entangled polymer dynamics [47] and experimental observations of flow-induced chain orientation and stretching in polyethylene melts [48].
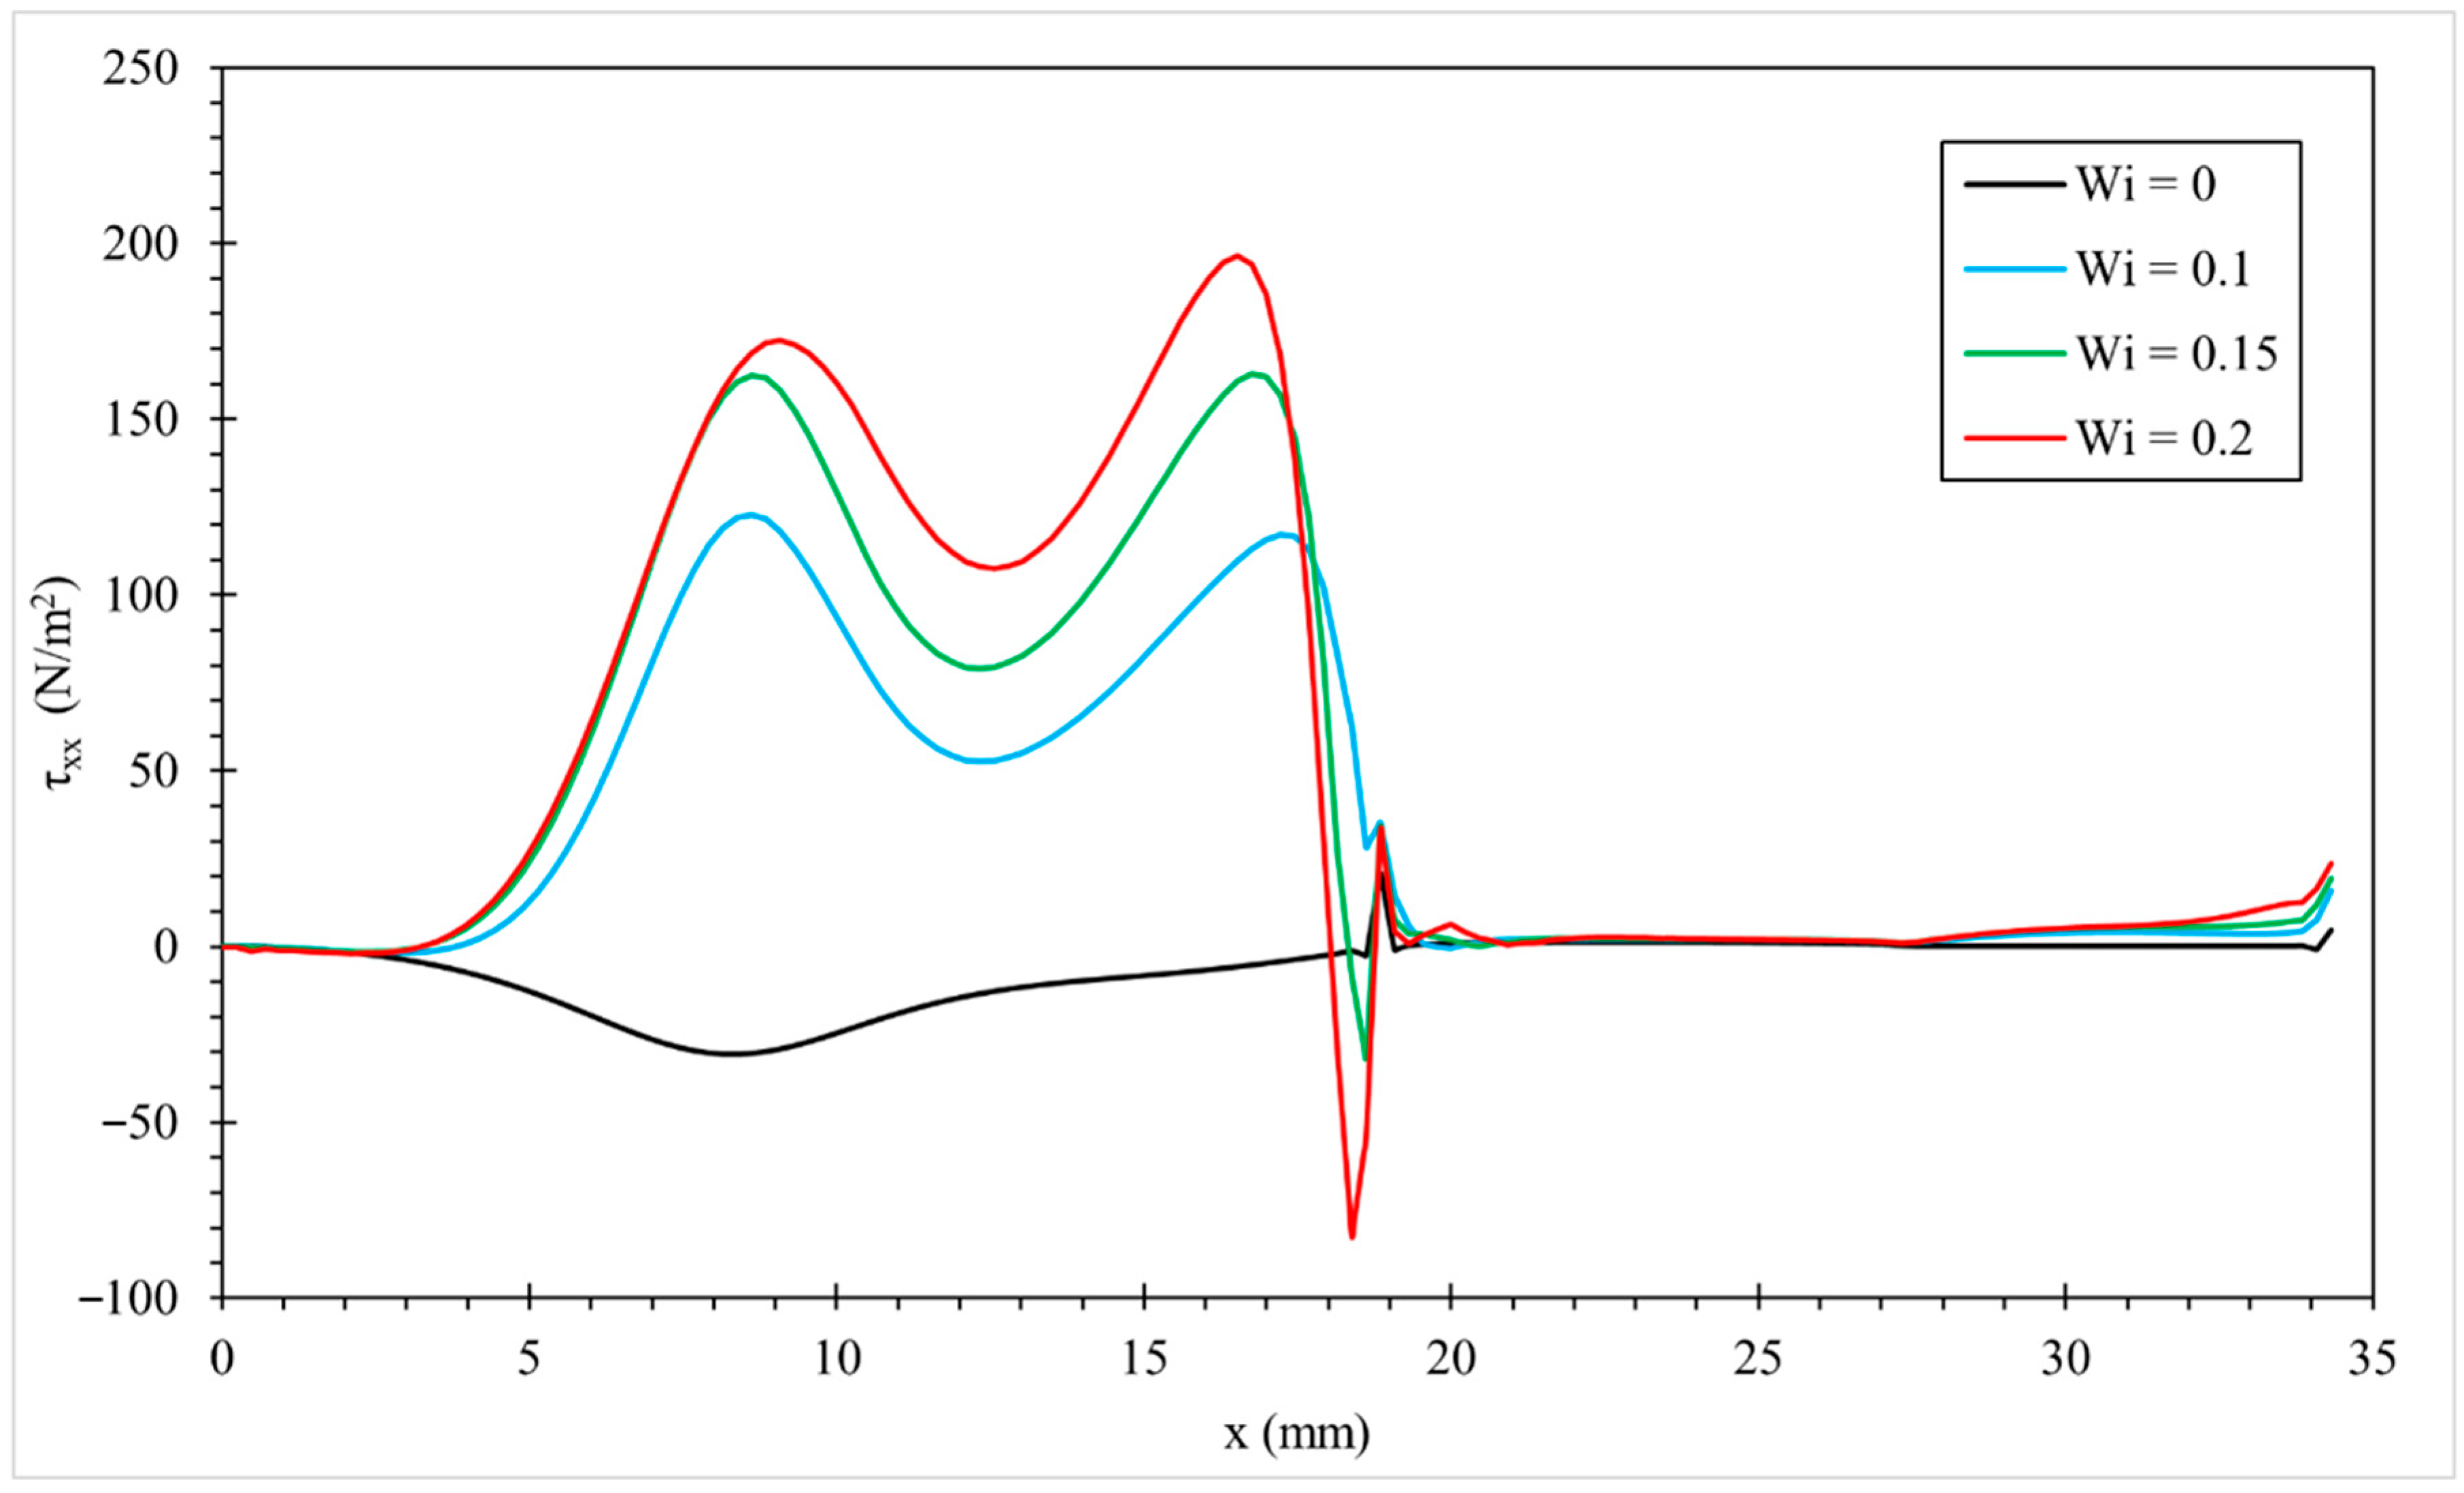
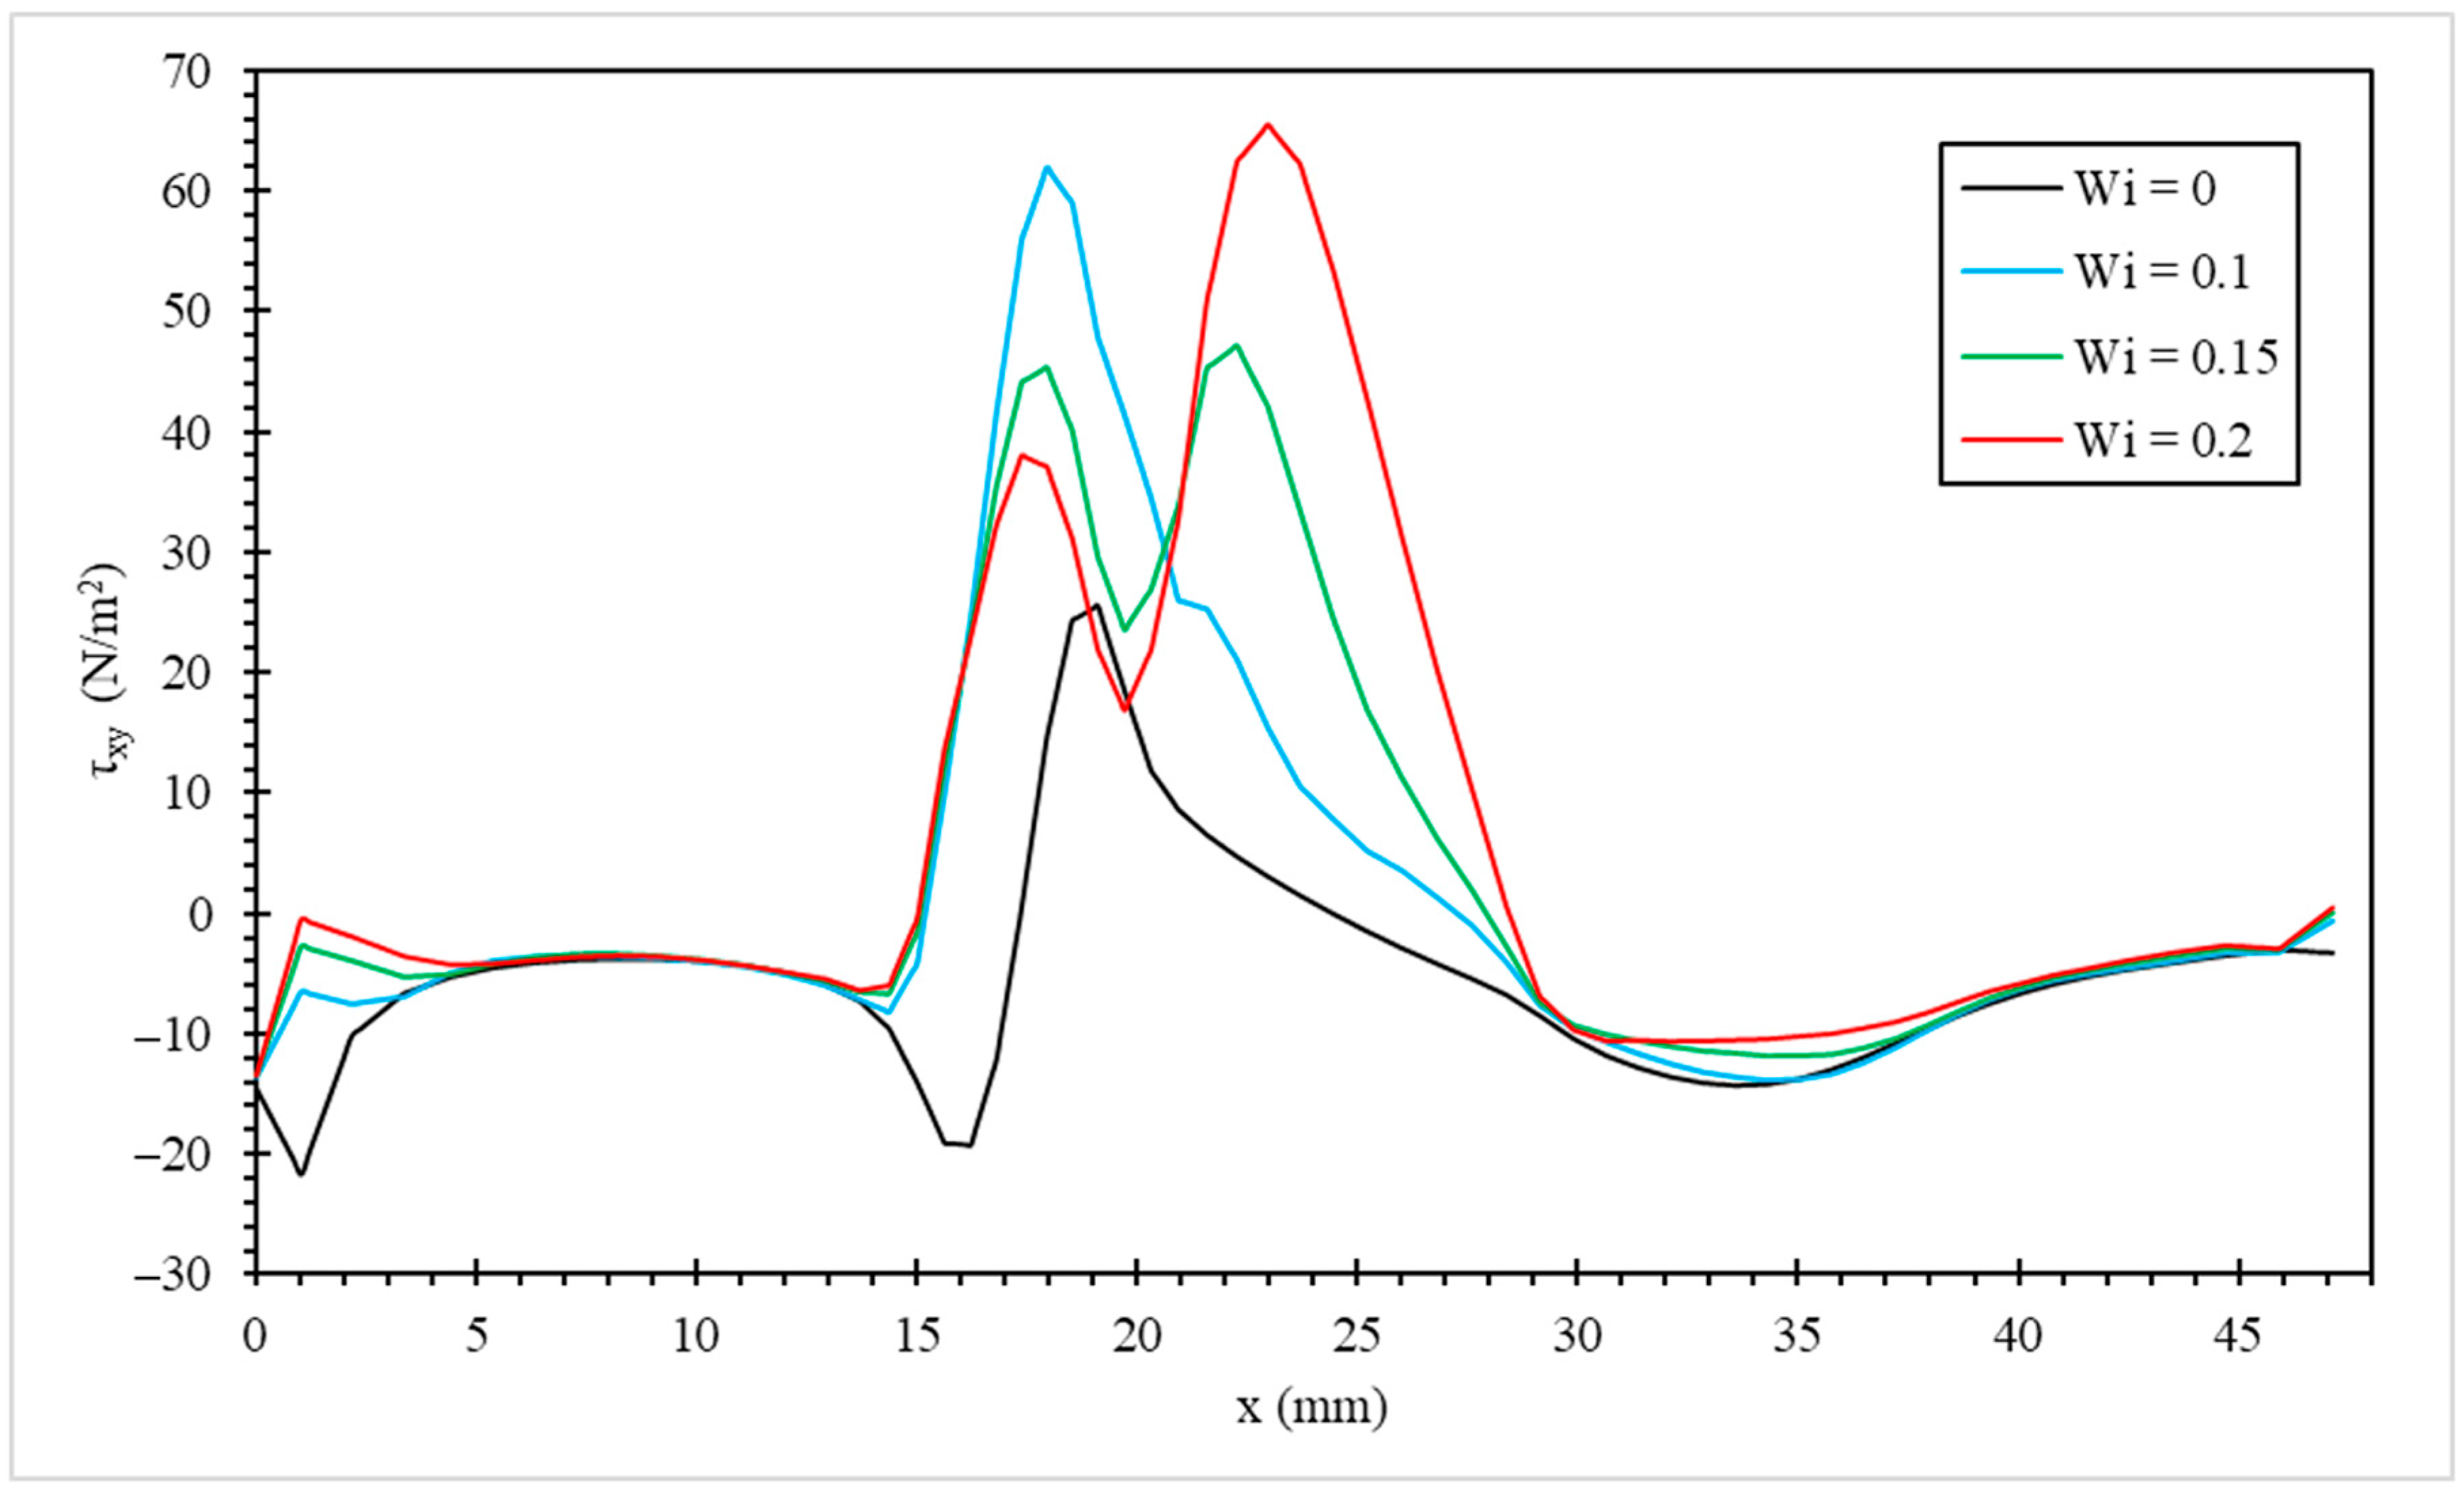
In Figure 10 and Figure 11, normal stress (τxx) and shear stress (τxy) on both the inner and outer walls of the extruder die are presented at various Weissenberg numbers (Wi = 0, 0.1, 0.15, and 0.2). The length along the die profile is denoted as x (mm), where x = 0 mm corresponds to the front stagnation line of the torpedo head on the inner wall. With higher Wi values, both normal and shear stresses rise significantly due to the increasing elastic component in the HDPE melt, as described by the Oldroyd-B model. Notably, the normal stress (τxx) exhibits two distinct peaks. The first peak occurs at approximately x = 8.5 mm, corresponding to the region of flow contraction, where the velocity gradient is high. The second peak appears near x = 17.5 mm, just before the sharp edge of the torpedo head. Additionally, immediately downstream of the sharp edge, where the flow area abruptly expands, secondary flow patterns generate localized regions of negative stress, particularly in the presence of strong elastic effects [49]. At higher Wi values, stretching is more pronounced because the fluid does not relax quickly. This stretching increases the elastic stored energy, leading to higher normal stresses. Higher normal stresses potentially cause die swell in polymer extrusion. Unlike the normal stress, the shear stress (τxy) on the inner wall shows a single maximum near the flow contraction region (x ≈ 7.5 mm), reflecting the complex interaction between the viscoelastic properties of HDPE and the die geometry. Stress concentrations are especially prominent around the sharp edge of the torpedo head (x = 18.85 mm), where both normal and shear stresses exhibit spikes. As the Wi increases, the stress stored in the fluid grows because the polymer chains do not fully relax. This results in a larger shear stress build-up. Even at Wi = 0 (purely viscous behavior), significant stress variations occur around this sharp edge, which could lead to Sharkskin defects, adversely impacting the final HDPE product quality [50]. These high-stress regions are driven by the elastic nature of the polymer melt, where increased strain rates near geometric features like sharp edges lead to localized stress peaks. This viscoelastic behavior of melted HDPE will be mitigated by incorporating fillets in the parametric study.
Figure 12 and Figure 13 illustrate the normal and shear stresses on the outer wall of the die. The stresses here are substantially lower than on the inner wall due to the simpler geometry of the outer profile. At Wi = 0, the normal stress shows a single peak at approximately x = 17.5 mm, and remains stable throughout the die exit. As Wi increases, the normal stress on the outer wall begins to rise, exhibiting two distinct peaks. The first peak occurs between x = 14–17.5 mm, in the same region as at Wi = 0. The second peak appears between x = 33–34 mm, likely due to the geometric contraction in this area. At higher Wi values, the elastic stresses in the HDPE melt intensify, with the maximum normal stress on the outer wall occurring earlier, reflecting the influence of higher velocity gradients. At Wi = 0, the shear stress remains relatively low, with negative values in the early region of up to approximately 18 mm. The shear stress profile becomes more noticeable with positive peaks and fluctuations starting from Wi = 0.1, particularly in the 17–25 mm region. The profile exhibits a sharp peak followed by a significant drop, indicating that a higher Wi amplifies viscoelastic effects. This enhancement leads to greater shear stress variations, which may contribute to flow instabilities, resulting in melt fracture in polymer extrusion. This mirrors the inner wall behavior, where higher Wi values cause elastic stresses to propagate across the flow field, increasing stress throughout the die.
The results demonstrate that as the Weissenberg number increases, the elastic forces in the HDPE melt, as modeled by the Oldroyd-B equation, leading to significant stress buildup on both the inner and outer walls. The emergence of stress peaks correlates with regions of high velocity gradients and sharp geometric transitions. This behavior indicates that at higher Wi values, the viscoelastic properties of the melt dominate and the stress distribution becomes more complex, spreading across the entire flow cross-section.

3.3. Parametric Study

The viscoelastic stress is strongly influenced by both the Weissenberg number (Wi) and the geometry of the extruder die. As the Wi is dependent on the characteristic relaxation time of the melt (λ) and the inlet velocity (U), a parametric study is conducted on the effects of λ, U, and die geometry, where fillets are added to the sharp edges of the inner wall surface. These modifications aim to smooth out the flow, reduce stress concentrations, and further investigate how geometric changes impact the overall flow dynamics within the die.

3.3.1. Effect of the Characteristic Relaxation Time (λ)

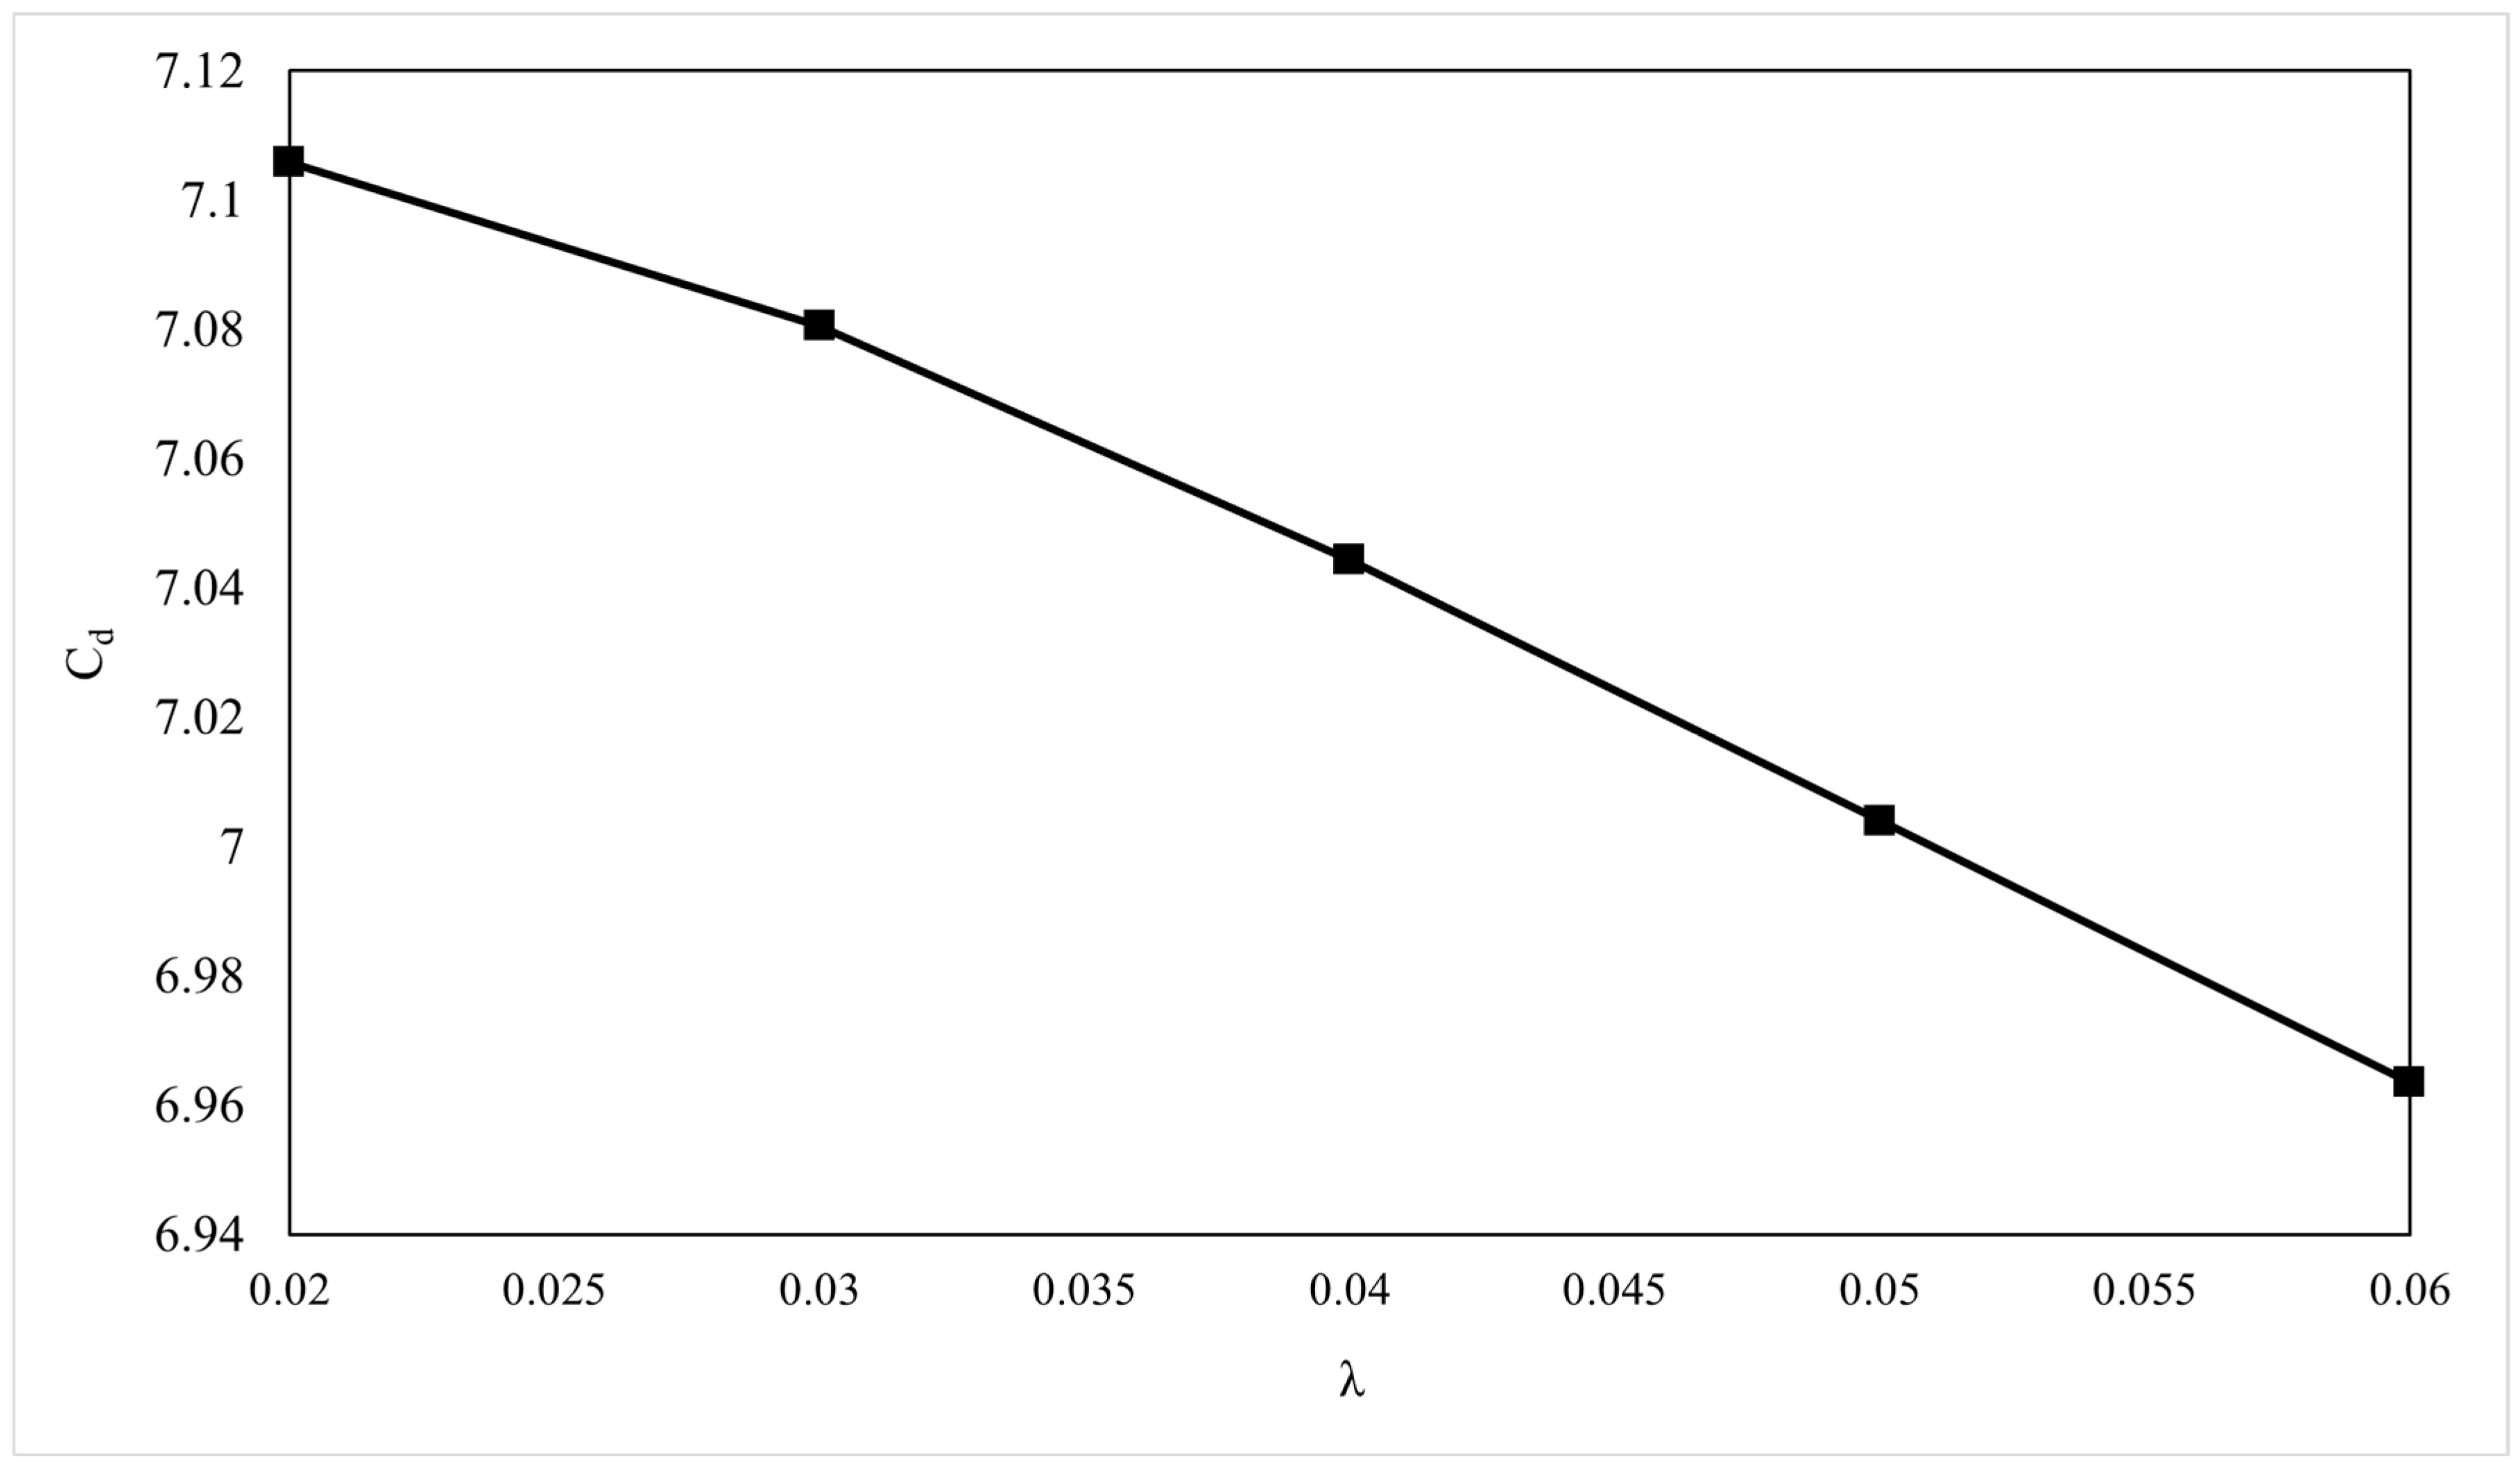
The relaxation time of a polymer indicates how long it takes for polymer chains to relax under an applied force, making it crucial for simulating viscoelastic flows. Generally, polymers with higher molecular weight or more complex structures possess higher relaxation time. At a fixed die geometry and a fixed inlet velocity, the variation of relaxation time resulted in the changes in the Wi and the simulated Cd, as shown in Table 3. Here, the values of the λs are selected based on the initial simulation results, which are suitable for HDPE viscoelastic properties during extrusion [51,52]. The inlet velocity of the HDPE melt is set at 2.5 cm/s (volume flow rate = 6.36 cm3/s), a typical value for industrial extrusion, ensuring that the relaxation times reflect realistic processing conditions [40].
In the simulation results (Figure 14), the dimensionless drag coefficient, Cd, decreases as the relaxation time λ increases. This behavior is somewhat counterintuitive given that increasing relaxation time typically suggests stronger elastic effects in viscoelastic materials like high-density polyethylene (HDPE). However, the Oldroyd-B model, which combines both viscous (Newtonian) and elastic (Maxwell) behaviors, shows that as the relaxation time λ increases, the elastic components of the material become more dominant, causing the material to resist flow. In other words, the polymer melt under high Weissenberg numbers is more capable of recovering from deformation. With increasing λ, the polymer melt’s elasticity aids in the recovery from deformation, reducing the overall frictional interaction between the melt and the inner wall. This can explain the observed decline in Cd, as the resistance to flow near the wall decreases.
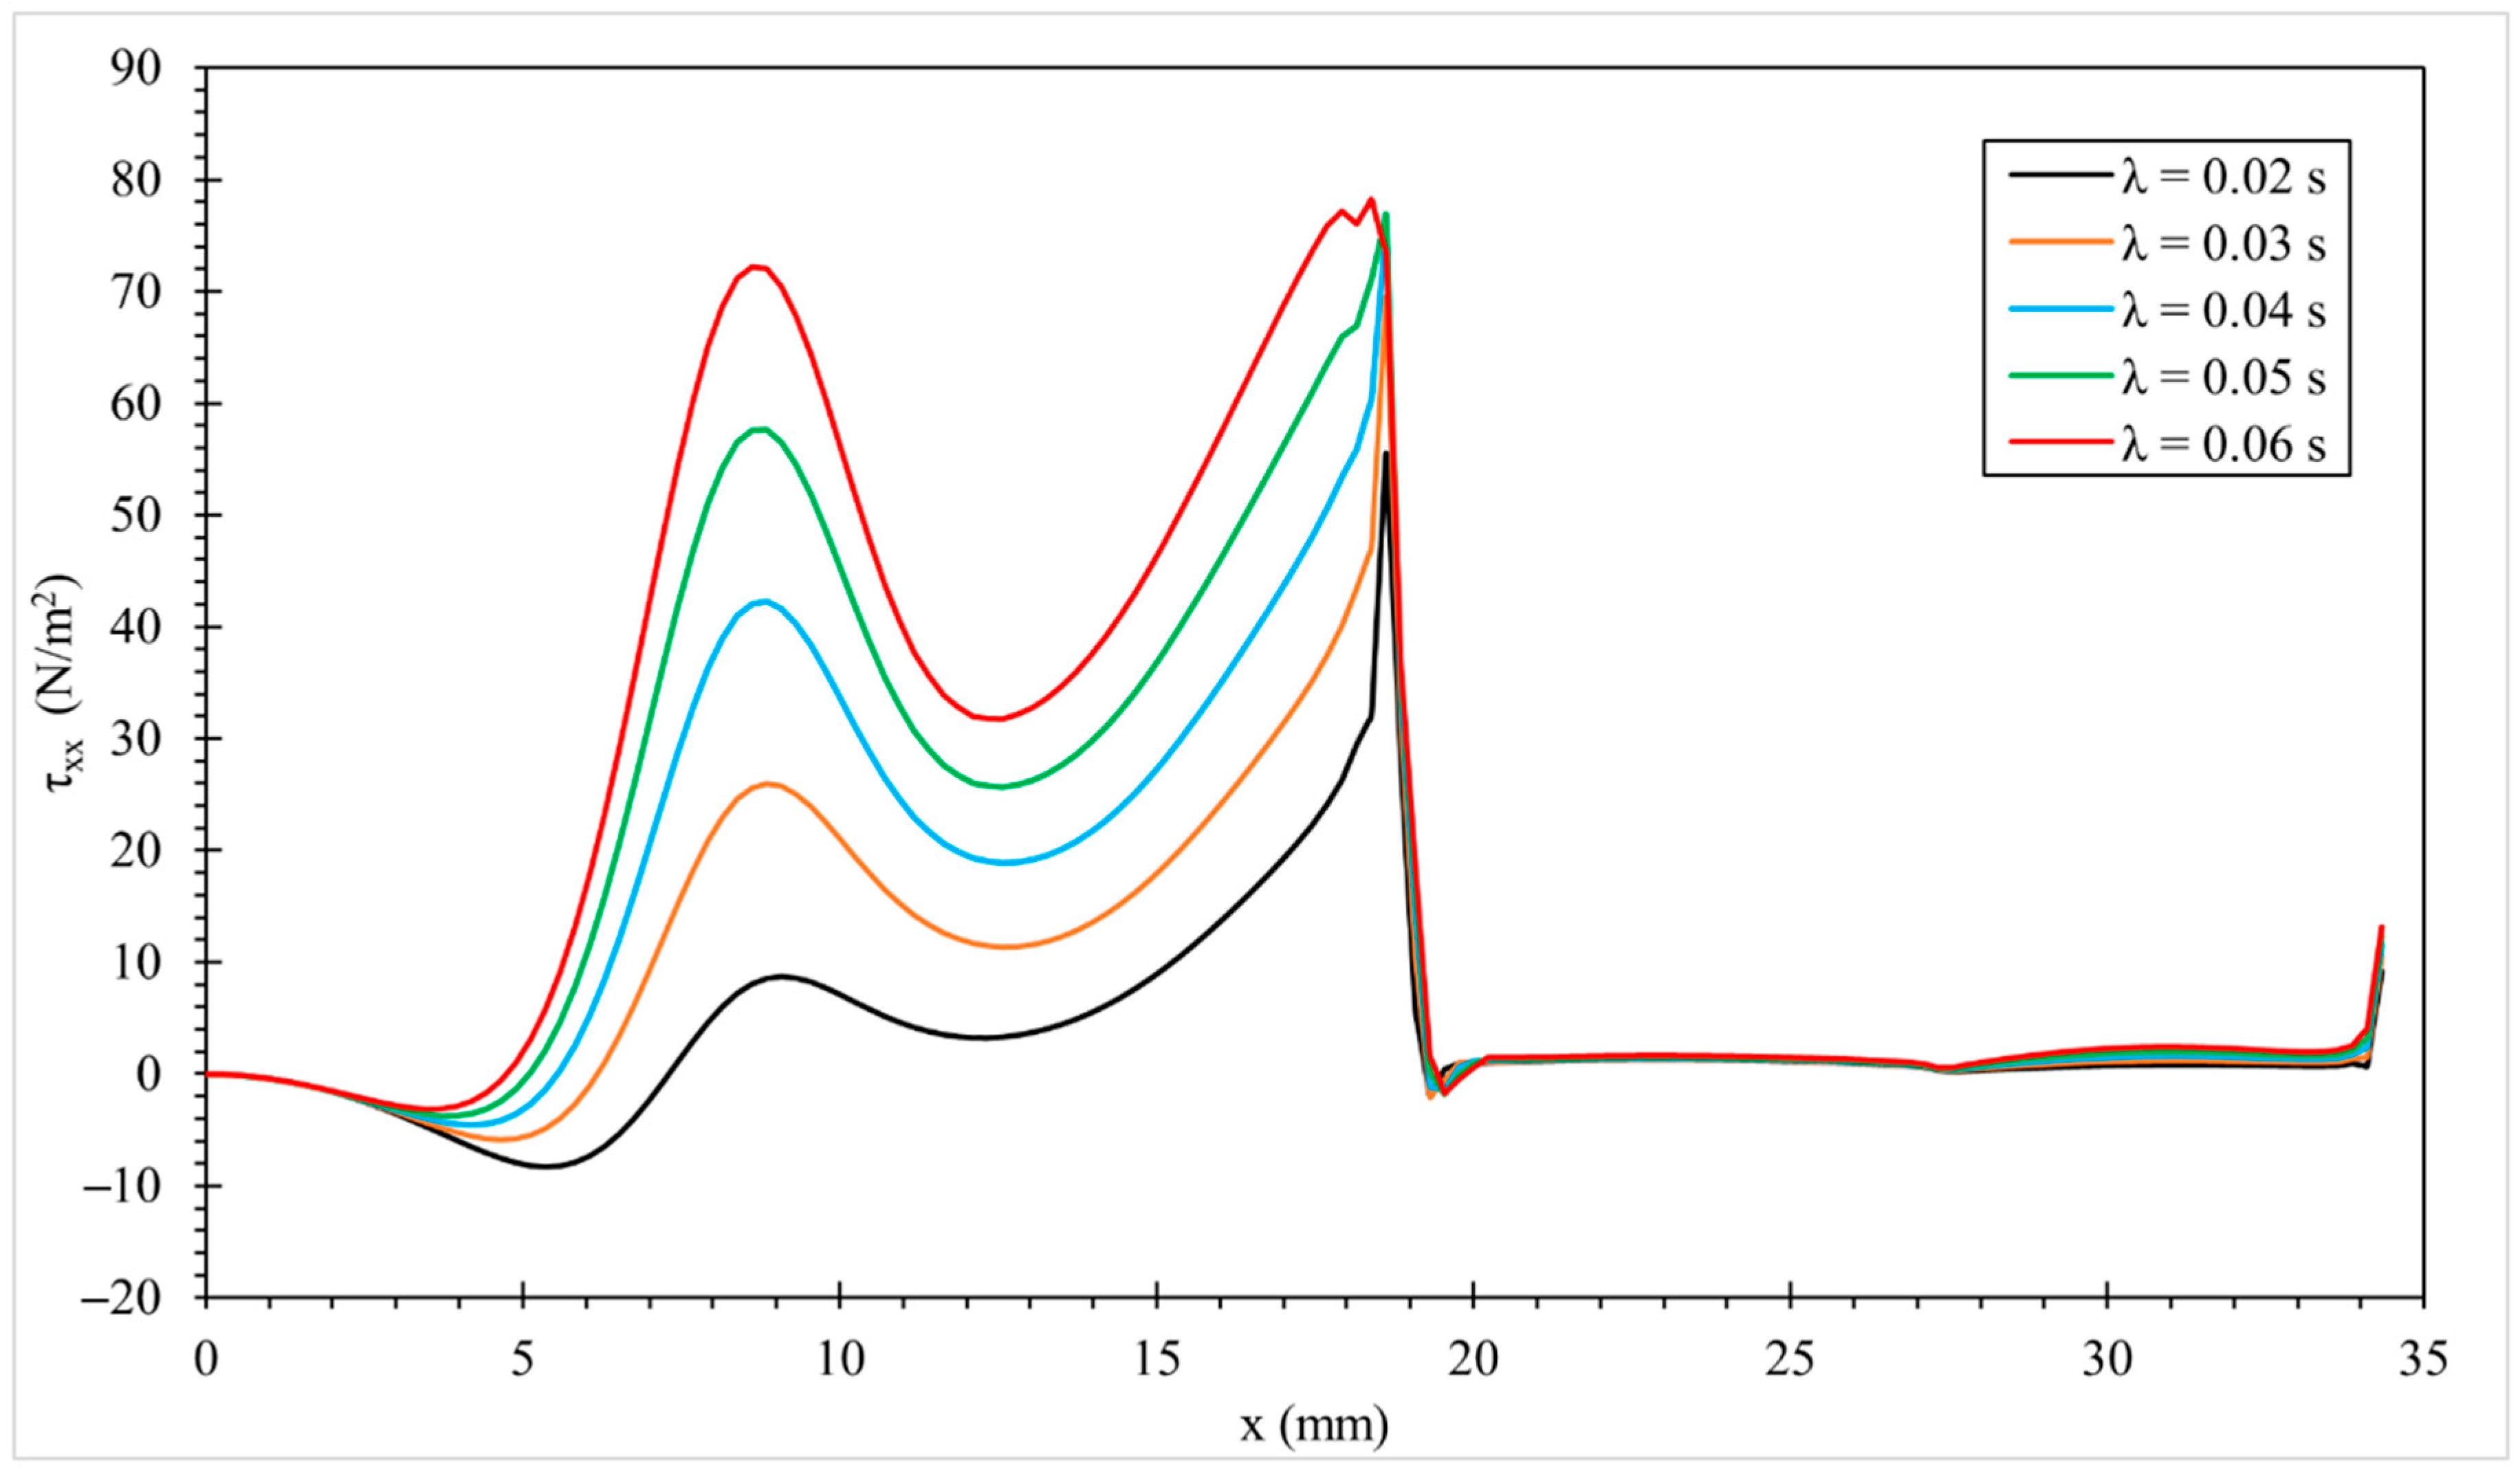
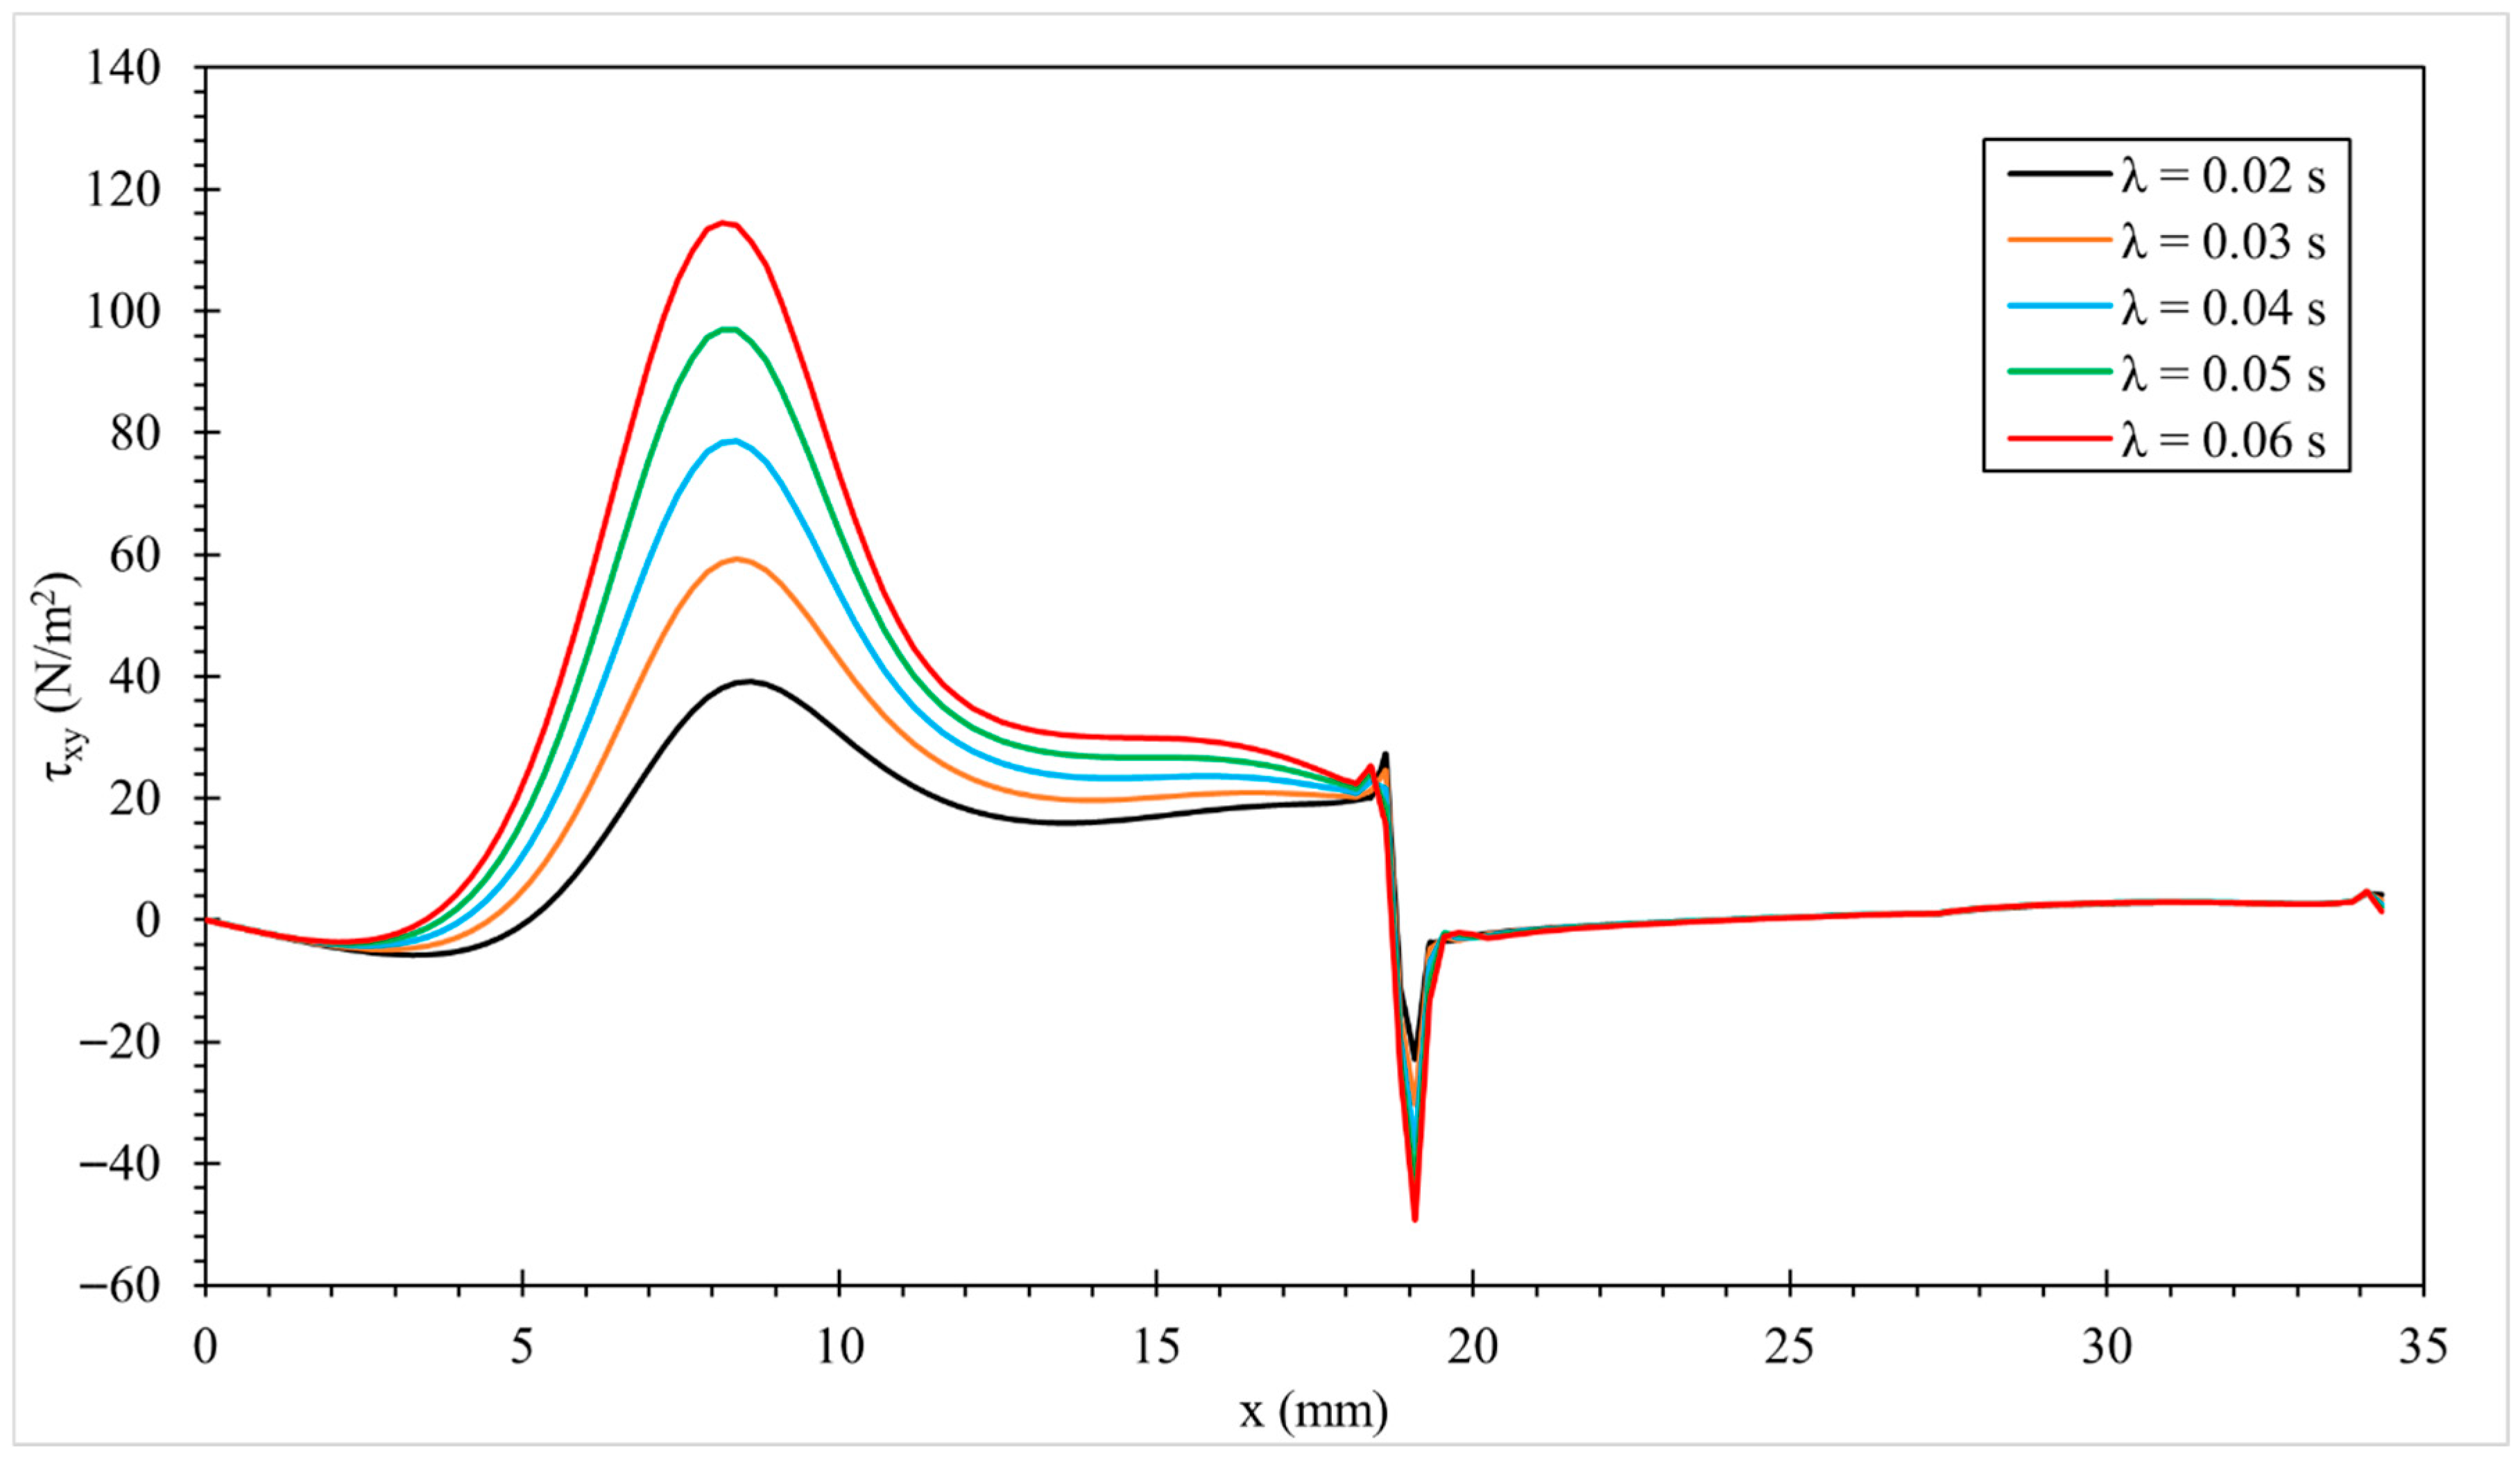
Normal stress ( τ x x ) and shear stress ( τ x y ) at the inner wall of the extruder die at different values of λ   are illustrated in Figure 15 and Figure 16, respectively. It is observed from the simulation results that τ x x at the inner wall increases as the relaxation time of HDPE increases. Longer relaxation times can lead to stronger elastic effects. This means that the fluid resists deformation more effectively and stores more energy during flow. As a result, higher stresses can develop near the wall as the fluid attempts to recover its original shape after deformation. The same behavior can be seen in shear stress ( τ x y ) at the inner wall, emphasizing the influence of relaxation time on these crucial mechanical properties.

3.3.2. Effect of Inlet Velocity

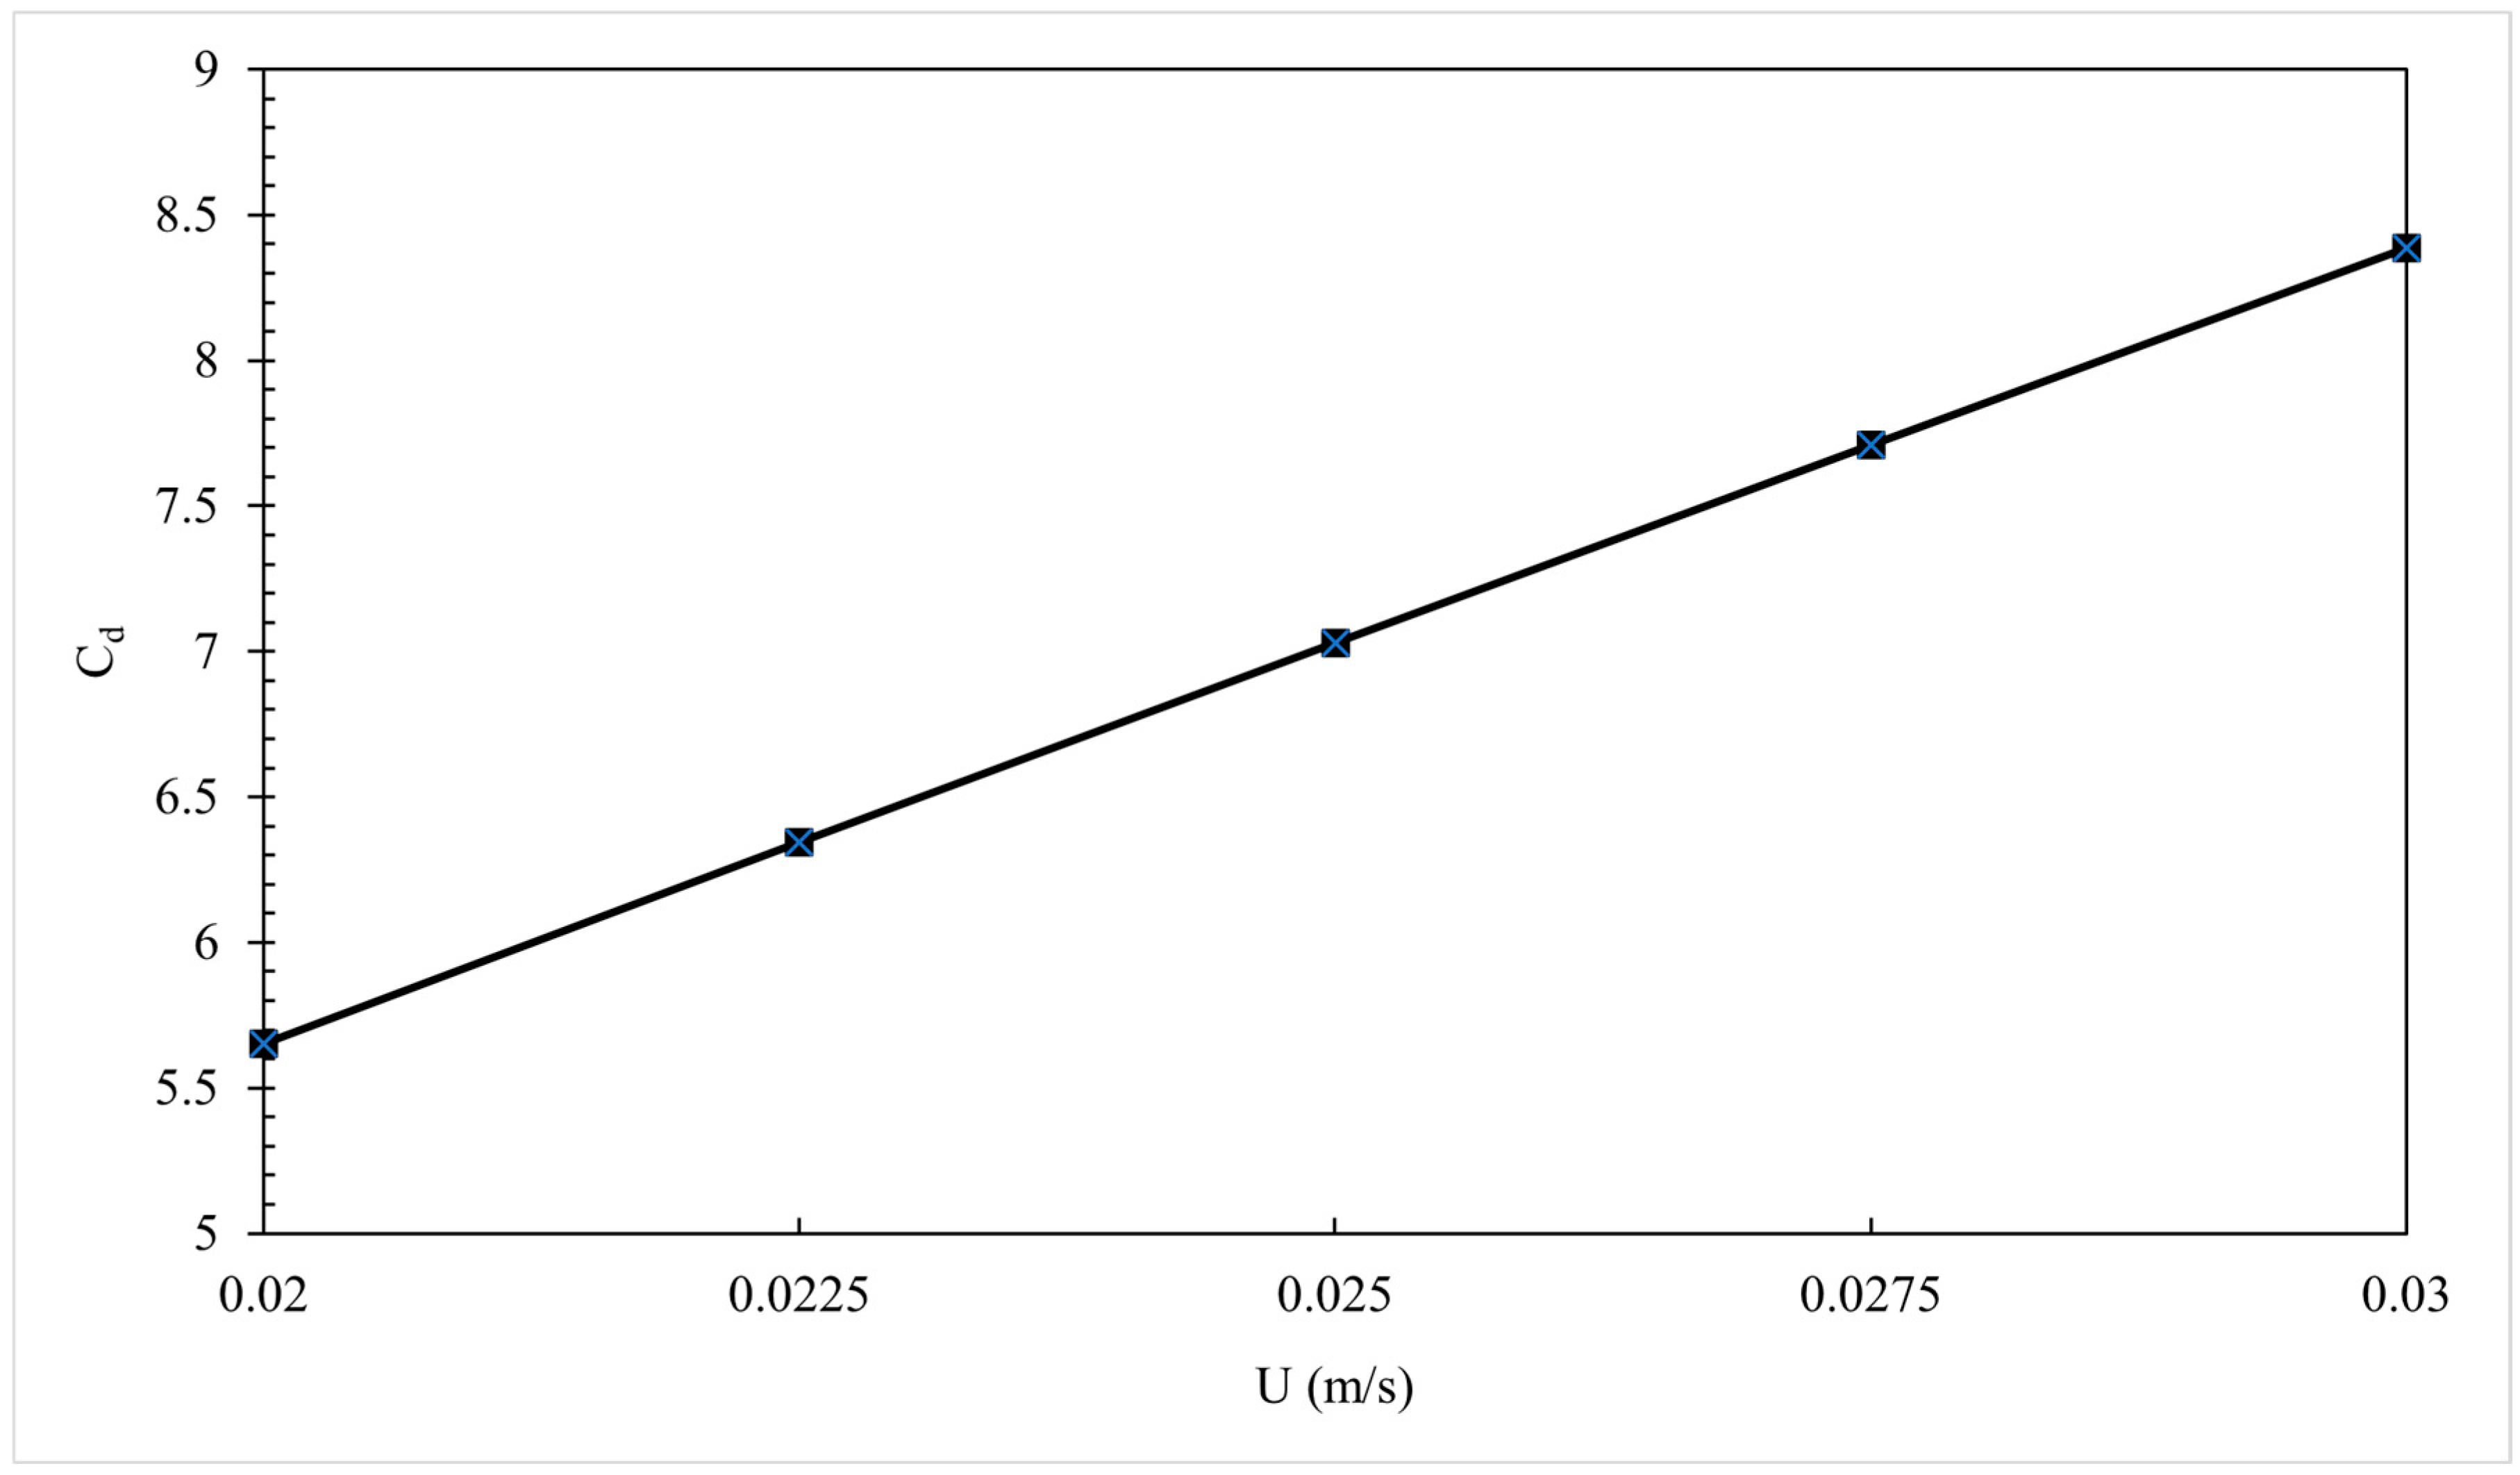
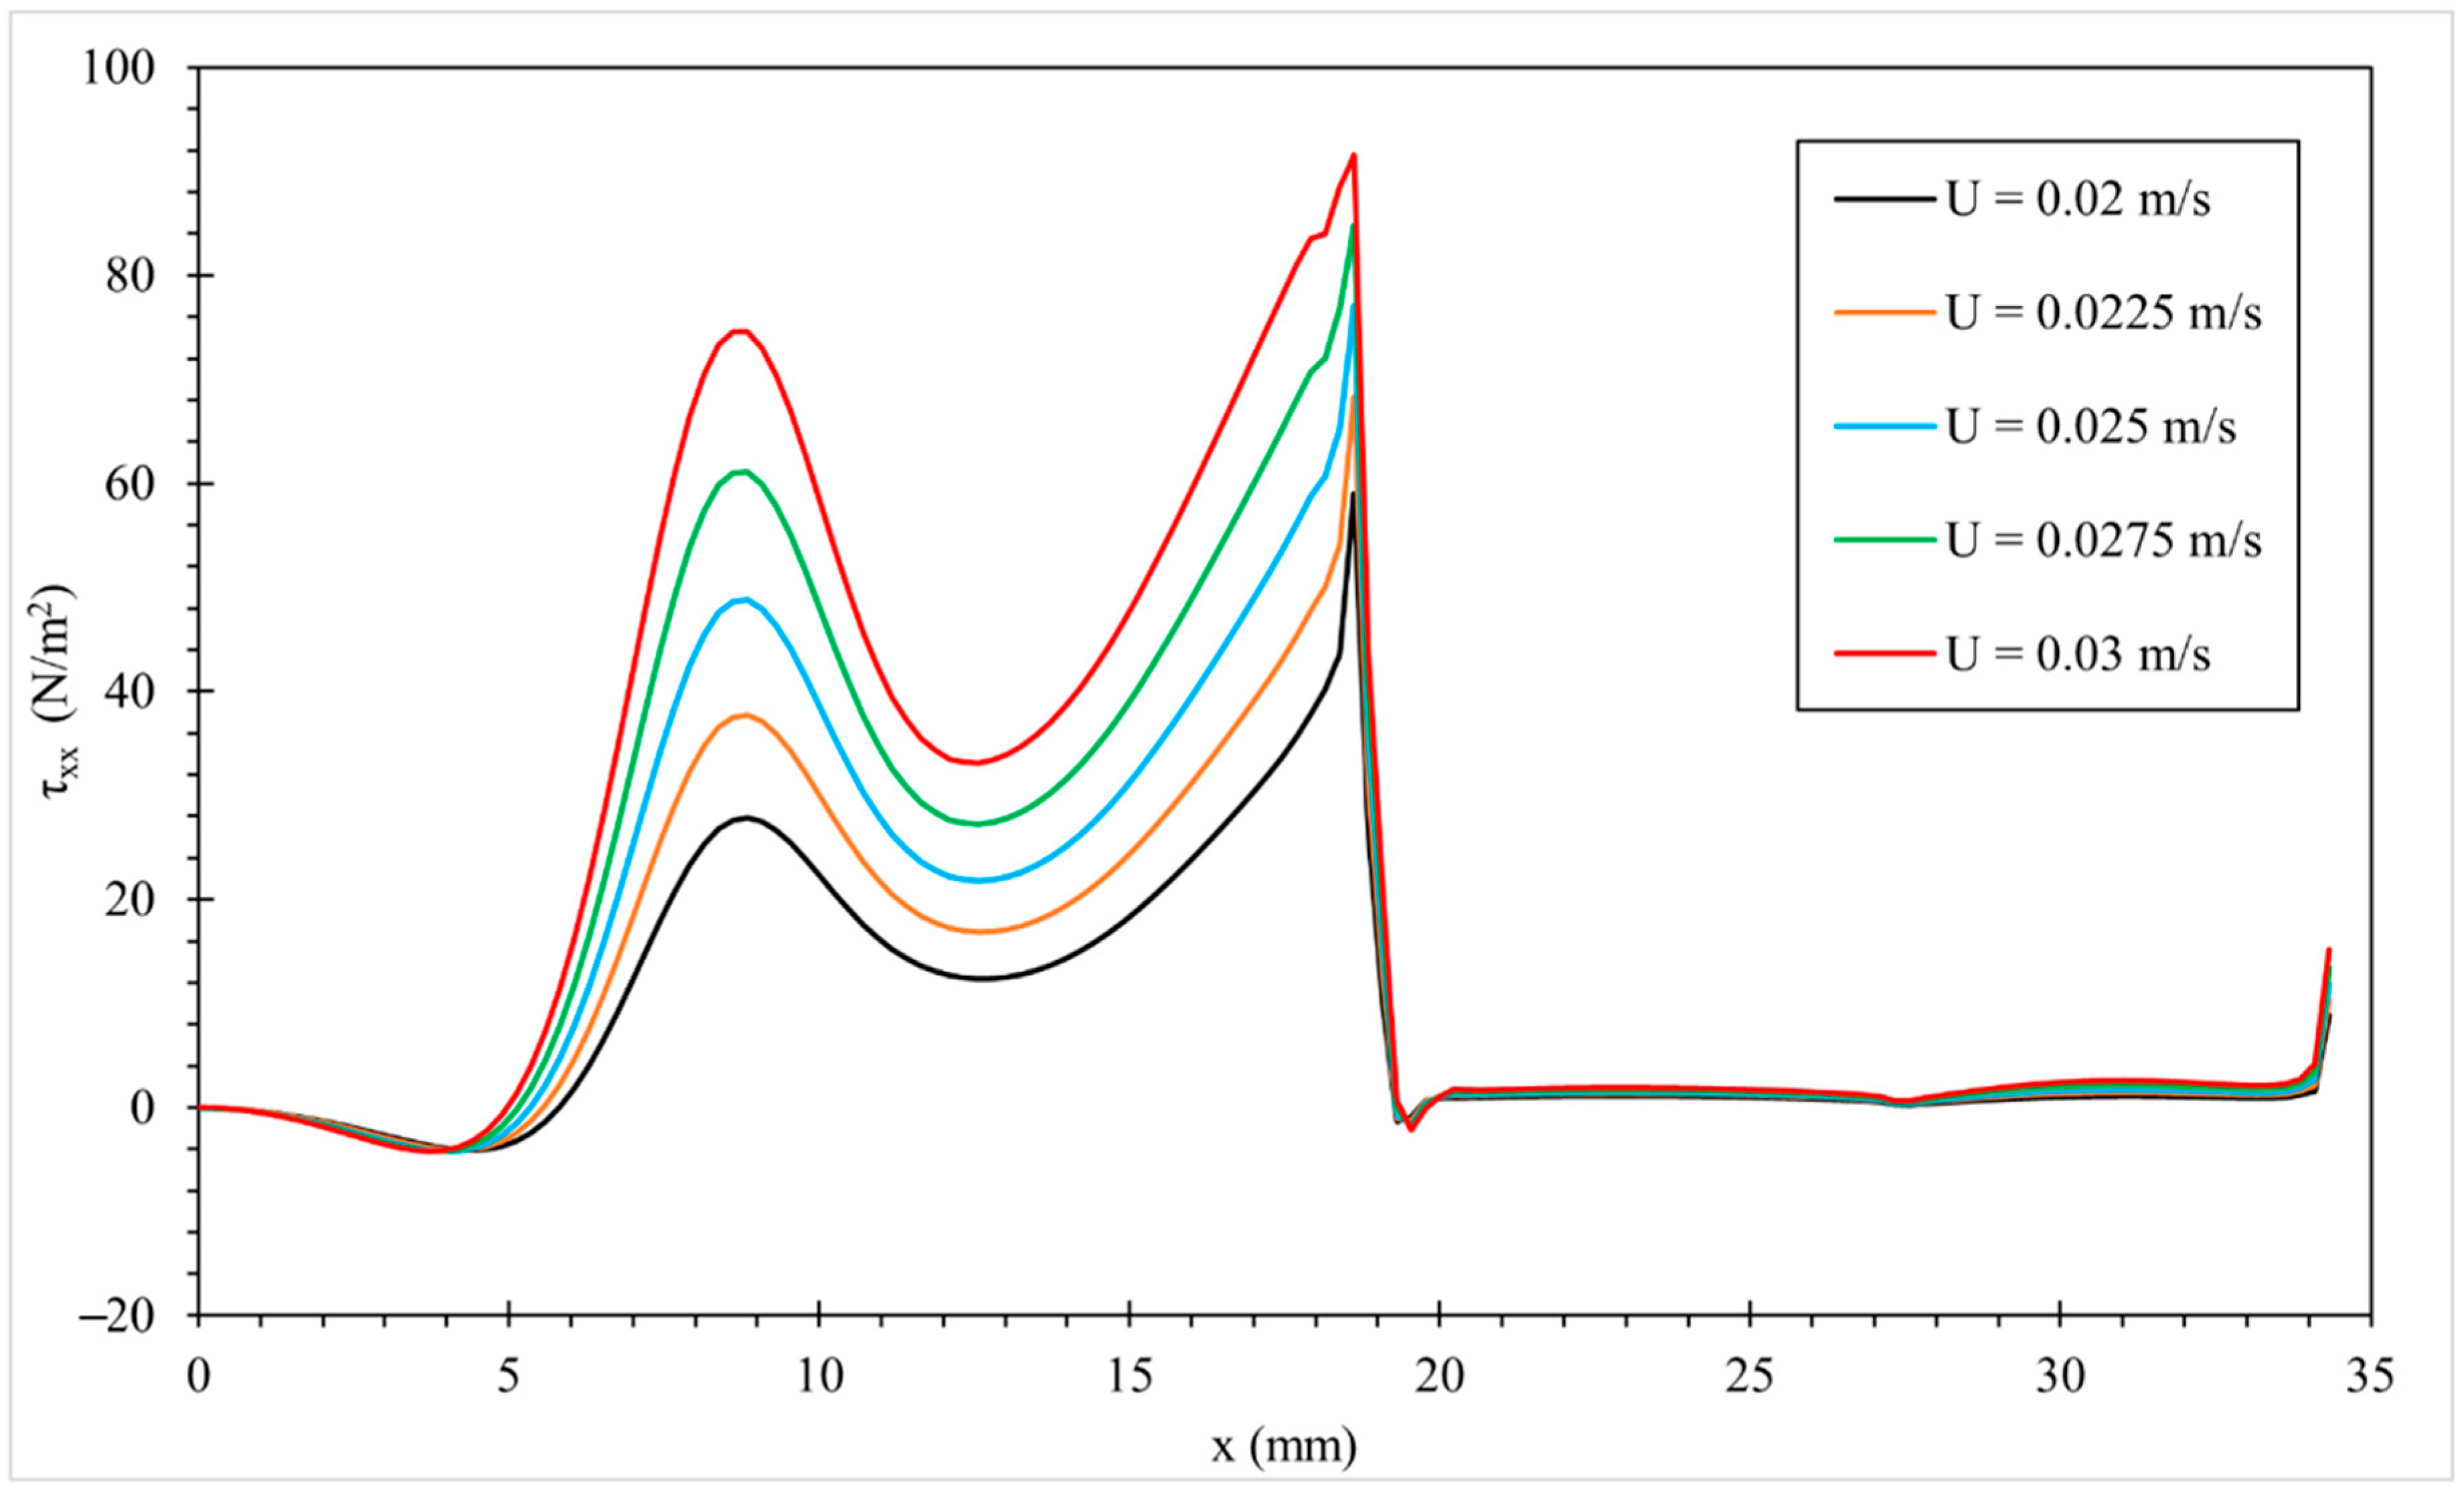
To explore the effect of inlet velocity, five constant inlet velocities are selected: 0.02 m/s, 0.0225 m/s, 0.025 m/s, 0.0275 m/s, and 0.03 m/s, with a fixed average relaxation time of 0.0442 s. Table 4 reports the corresponding Wi values and the resulting Cd (Table 4). Figure 17 shows a direct correlation between the inlet velocity and Cd. This behavior can be attributed to the influence of the Weissenberg number (Wi), as discussed in the previous section.
τ x x and τ x y at the inner wall are presented in Figure 18 and Figure 19, respectively, also increase with inlet velocity. Sharp increase in both stresses near the die’s sharp edge is due to the fluid’s sudden deceleration and reorientation, which is particularly pronounced at higher velocities.

3.3.3. Effect of Geometry

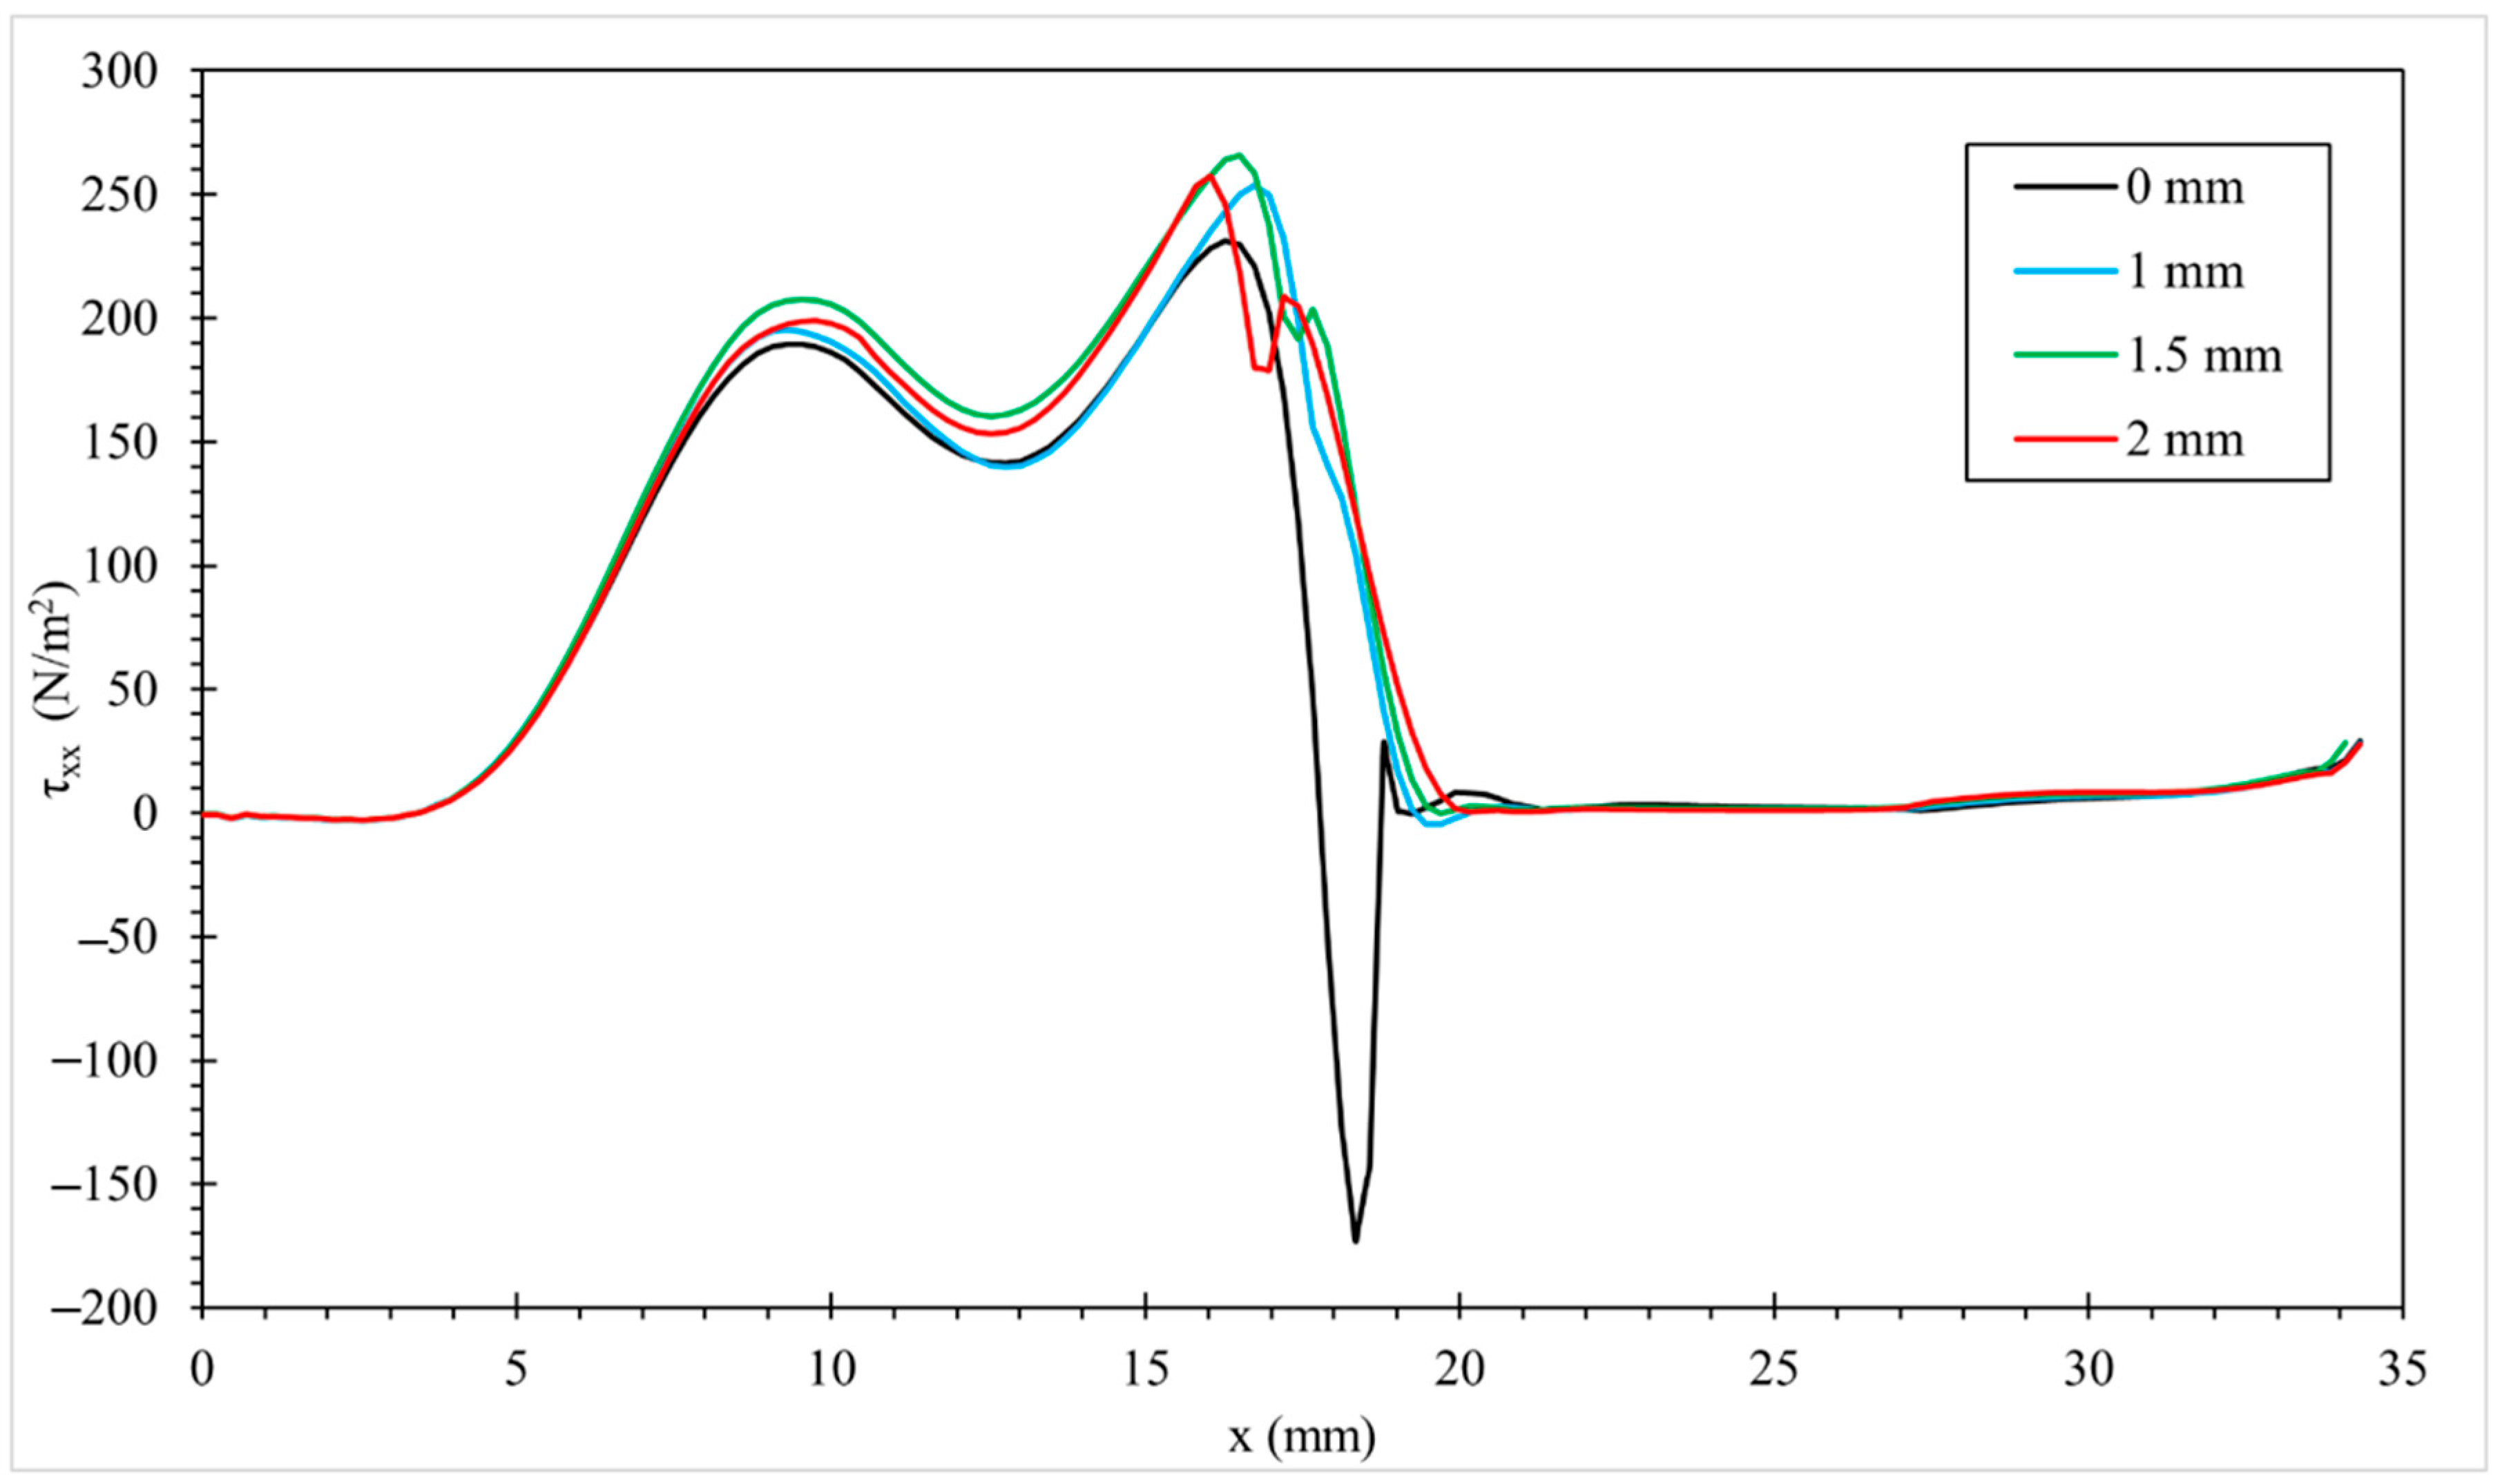
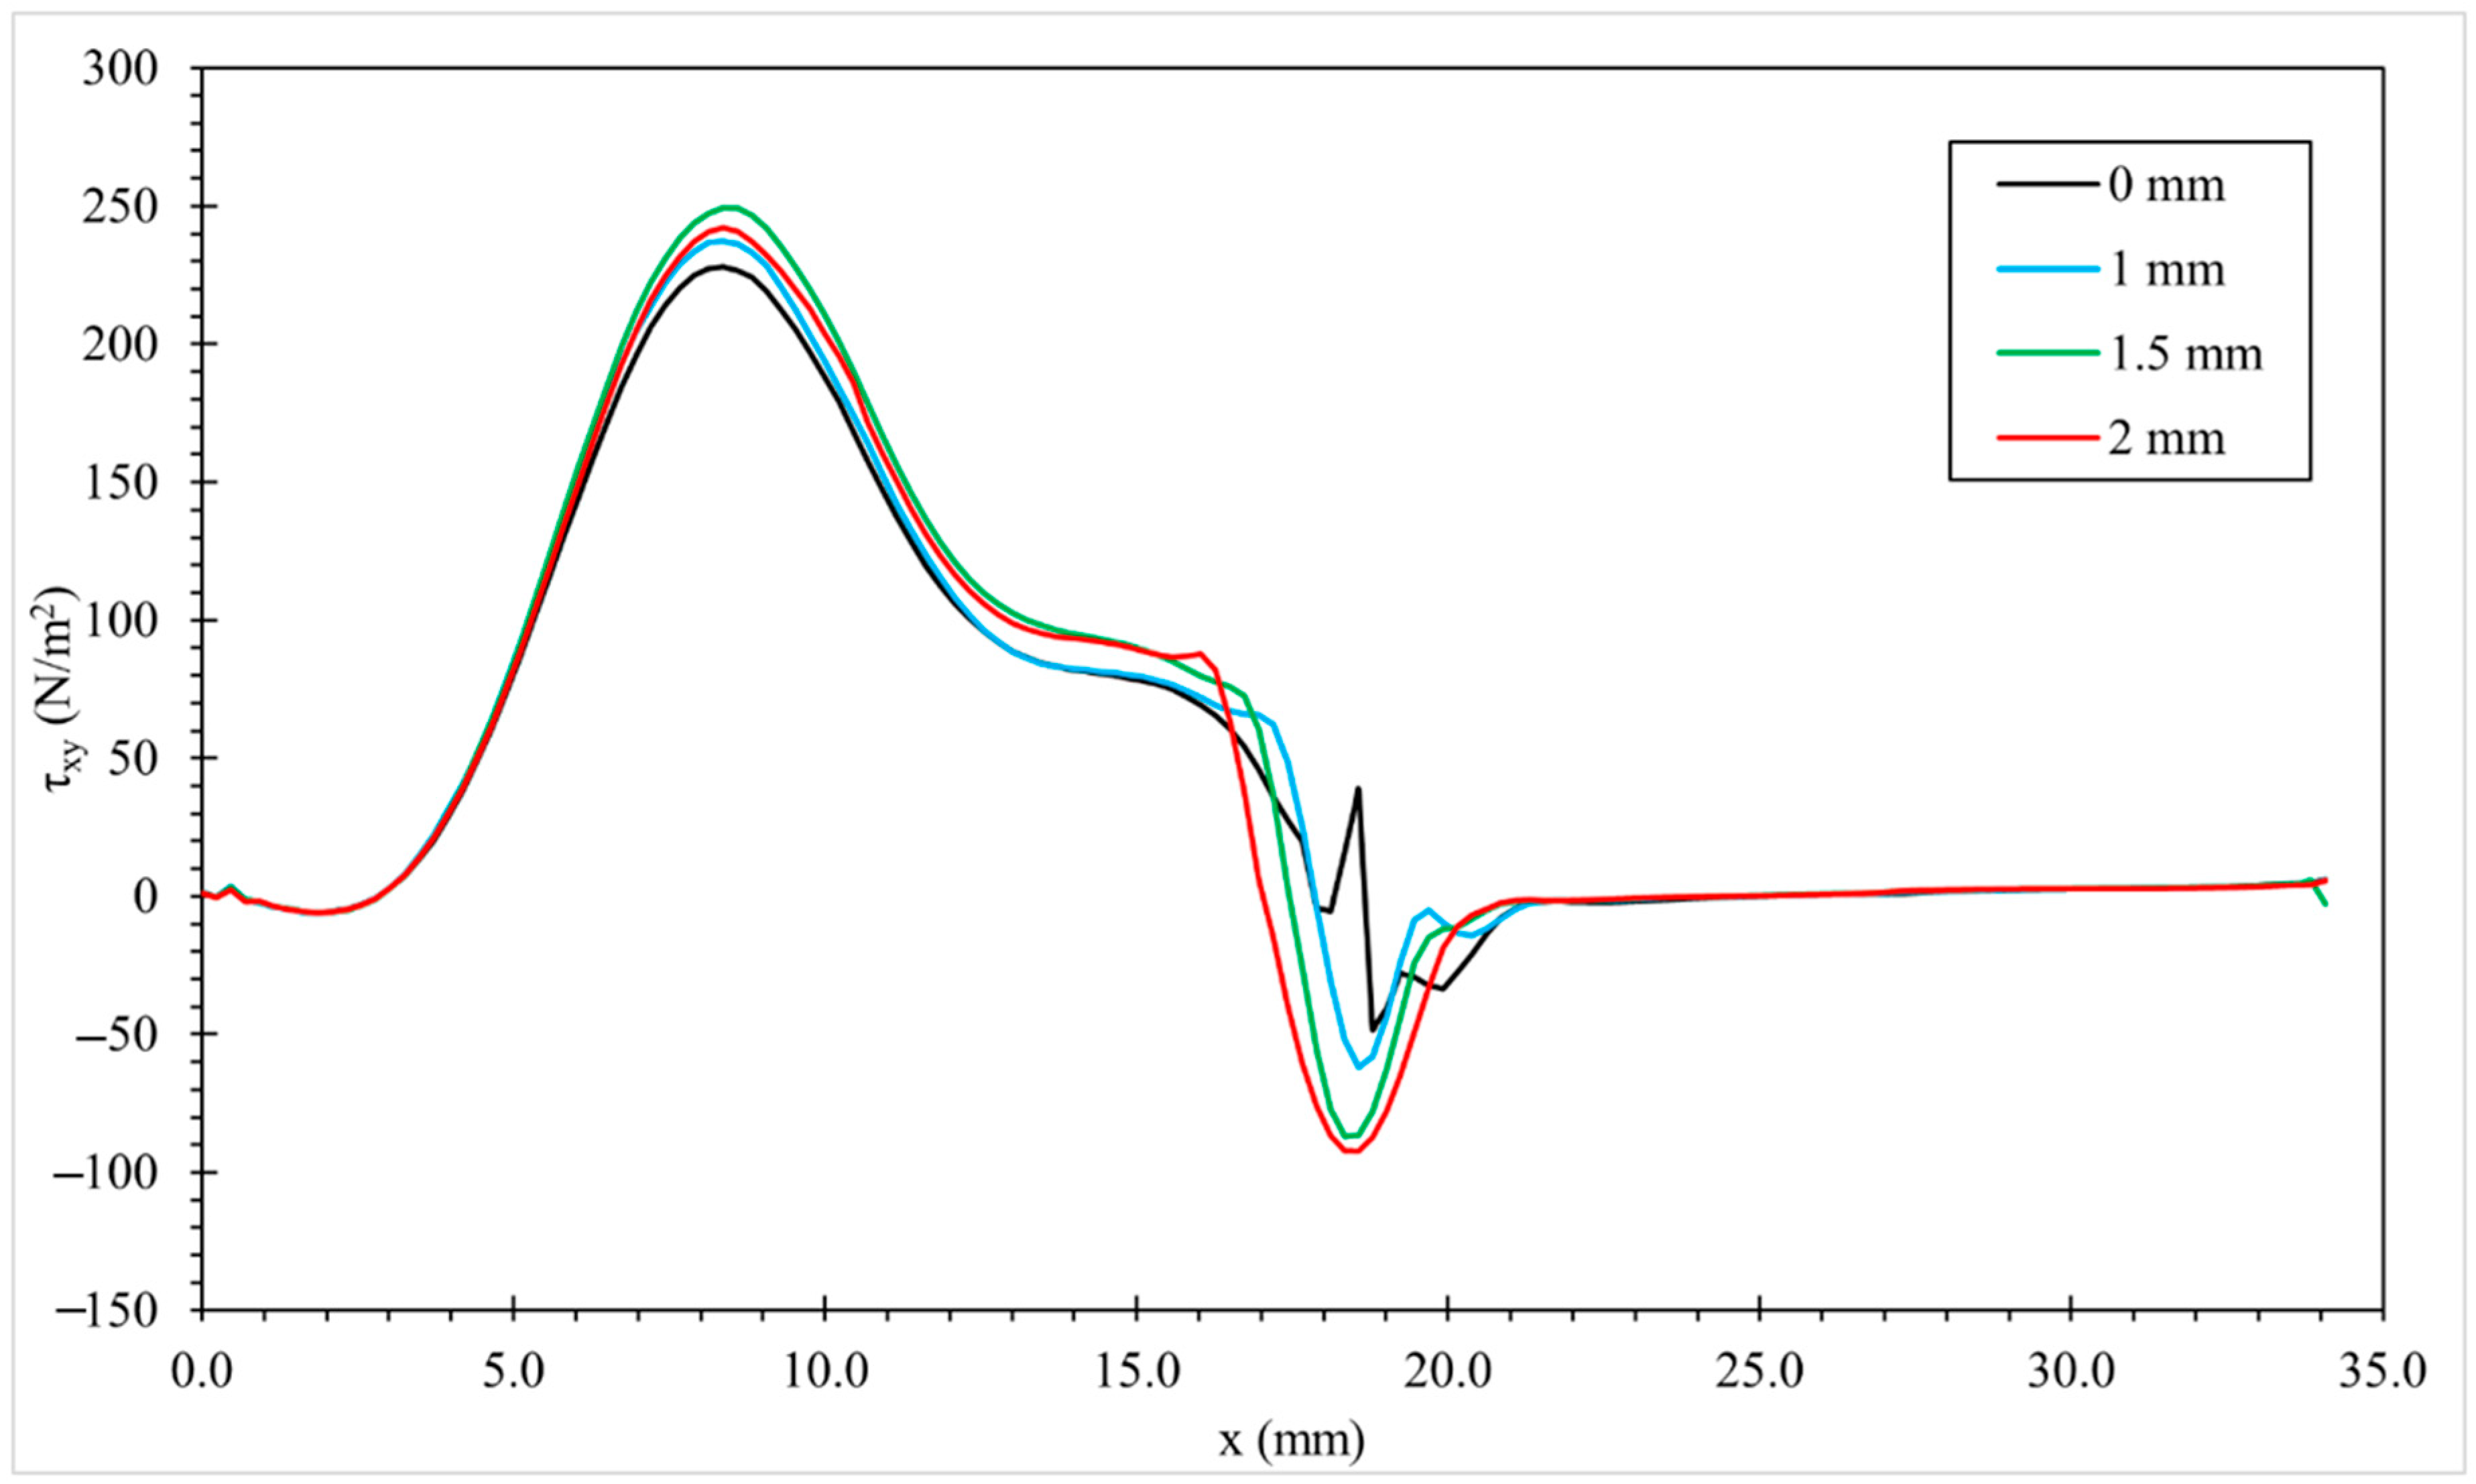
The investigation in the preceding sections reveals a significant increase in normal stress, accompanied by large fluctuations in both normal and shear stress, at the sharp edge of the inner wall, particularly for the case of a high Wi (Wi = 0.2), as shown in Figure 10 and Figure 11. The elevated stress and large stress fluctuations are undesirable, as they can lead to melt instability and surface roughness of the plastic product at the die outlet. To further explore this phenomenon, a study was conducted to examine the impact of die geometry, specifically by introducing a fillet to smooth the sharp edge of the inner wall. Three fillet radius values (1 mm, 1.5 mm, and 2 mm) were applied to the sharp edge, as shown in Figure 20.
The results for the normal stress τ x x and shear stress τ x y on the inner wall for the case of Wi = 0.21 are illustrated in Figure 21 and Figure 22, respectively. A key observation is that the introduction of a fillet significantly reduces the degree of fluctuations in normal and shear stresses that are caused by the presence of the sharp edge at the inner wall. This reduction in stress variation plays a crucial role in preventing surface defects, such as sharkskin, which are commonly associated with abrupt stress changes in polymer extrusion processes [16]. As the fillet radius increases (resulting in a smoother edge), the extent of both normal and shear stress fluctuations around the sharp edge decreases. However, a drawback of this fillet radius adjustment is that a slight increase in τ x x fluctuations is observed upstream, near the onset of the curvature, along with a slight increase in τ x y undershoot and fluctuations downstream of the smoothed edge. The findings emphasize the importance of die design, such as the fillet radius, in improving the control of stress distribution and flow stability in polymer extrusion.
Since the inlet velocity was fixed in all simulations, the volumetric throughput of the HDPE melt remained unchanged with different fillet radii. Furthermore, the global pressure drop across the die, which is mainly governed by the throat contraction, was not significantly altered by the introduction of fillets. Consequently, no appreciable change in energy consumption is expected. The primary benefit of increasing the fillet radius is, therefore, the mitigation of local stress fluctuations, which improves flow stability and reduces the likelihood of surface defects.
It should be noted that the present study focuses exclusively on the viscoelastic flow behavior inside the forming head and does not explicitly model the free-surface post-extrusion swelling. Nevertheless, the internal flow field is a decisive factor for the subsequent quality of the extrudate. The velocity distribution, pressure drop, and elastic stress state developed within the forming head define the boundary conditions at the die exit, which strongly govern the extent and uniformity of die swell. Non-uniform stresses or velocities at the exit can lead to asymmetric swelling, thickness variations, or distortions of the extruded profile, whereas a well-balanced internal flow promotes a more controlled and symmetric extrudate shape. This interpretation is consistent with the literature reports that relate die swell directly to the stored elastic energy and normal stresses at the die exit [16,53]. Therefore, although post-extrusion swelling is beyond the scope of this work, the analysis of internal viscoelastic flow provides essential insights into the initial conditions that ultimately affect product quality. Incorporating a full analysis of post-extrusion swelling represents an important direction for future work.

4. Conclusions

This work has investigated the viscoelastic flow of HDPE melt in an extrusion die using the Oldroyd-B constitutive model, with particular attention to the effects of the Weissenberg number and die geometry. The results demonstrate that increasing Wi values alters the balance between viscous and elastic forces, producing a non-monotonic trend in drag coefficient and distinct stress distributions along die walls. High stress concentrations were identified at contraction zones and sharp edges, providing a mechanistic explanation for defects such as sharkskin and melt fracture. A key contribution of this study is the demonstration that introducing fillets at sharp die edges reduces stress fluctuations and improves flow stability, highlighting the strong link between die design and extrudate quality. While the analysis was restricted to low-to-moderate Wi values due to numerical stability constraints, this range remains industrially relevant and enabled clear identification of the interplay between viscoelastic stresses and die geometry, which represents the novelty of this work. Although post-extrusion swelling was not modeled, the findings clarify how internal flow fields define the initial conditions for downstream behavior. Extending the analysis to higher Wi values and incorporating extrudate swell and surface evolution are important directions for future work to complete the connection between internal flow dynamics and final product characteristics.

Author Contributions

Conceptualization, W.P.; methodology, W.P. and A.K.K.M.; software, W.P.; validation, A.K.K.M. and N.T.; formal analysis, W.P. and A.K.K.M.; investigation, W.P., A.K.K.M. and N.T.; resources, W.P.; data curation, A.K.K.M. and N.T.; writing—original draft preparation, A.K.K.M. and N.T.; writing—review and editing, W.P. and A.K.K.M.; visualization, W.P. and A.K.K.M.; supervision, W.P.; project administration, W.P.; funding acquisition, W.P. All authors have read and agreed to the published version of the manuscript.

Funding

This research is supported by Thailand Science Research and Innovation (TSRI) Fundamental Fund, fiscal year 2025.

Data Availability Statement

The original contributions presented in this study are included in the article. Further inquiries can be directed to the corresponding author.

Conflicts of Interest

The authors declare no conflict of interest.

Abbreviations

The following abbreviations are used in this manuscript:
Cddimensionless drag coefficient
Cpspecific heat capacity, J/(Kg·K)
Dijcomponents of the rate of the deformation tensor, 1/s
L radius length scale at the die inlet of flow geometry, m
Ppressure, Pa
Qvdviscous dissipation heat, W/m3
u i velocity component, m/s
U average velocity, m/s
Ttemperature, K
WiWeissenberg number
βrelative solvent viscosity with respect to total viscosity
γ ˙ strain rate, 1/s
ηviscosity, N·s/m2
ηssolvent viscosity, N·s/m2
ηppolymer viscosity, N·s/m2
λrelaxation time, s
ρdensity, Kg/m3
τxxnormal stress, N/m2
τxyshear stress, N/m2
τ i j p polymeric part of the extra stress tensor, N/m2

References

  1. Ishtiaq, F.; Ellahi, R.; Bhatti, M.M.; Anwar, M. Convective heat transfer with Hall current using magnetized non-Newtonian Carreau fluid model on the cilia-attenuated flow. Int. J. Numer. Methods Heat Fluid Flow 2024, 34, 3328–3354. [Google Scholar] [CrossRef]
  2. Schreiber, H.P.; Rudin, A.; Bagley, E.B. Separation of elastic and viscous effects in polymer melt extrusion. J. Appl. Polym. Sci. 1965, 9, 887–892. [Google Scholar] [CrossRef]
  3. Carella, J.M.; Graessley, W.W.; Fetters, L.J. Effects of chain microstructure on the viscoelastic properties of linear polymer melts: Polybutadienes and hydrogenated polybutadienes. Macromolecules 1984, 17, 2775–2786. [Google Scholar] [CrossRef]
  4. Graessley, W.W. Effect of long branches on the temperature dependence of viscoelastic properties in polymer melts. Macromolecules 1982, 15, 1164–1167. [Google Scholar] [CrossRef]
  5. Abeykoon, C.; Pérez, P.; Kelly, A.L. The effect of materials’ rheology on process energy consumption and melt thermal quality in polymer extrusion. Polym. Eng. Sci. 2020, 60, 1244–1265. [Google Scholar] [CrossRef]
  6. Cha, J.; Song, H.Y.; Hyun, K.; Kim, S.; Lee, Y. Rheological measurement of the nonlinear viscoelasticity of the ABS polymer and numerical simulation of thermoforming process. Int. J. Adv. Manuf. Technol. 2020, 107, 2449–2464. [Google Scholar] [CrossRef]
  7. Liao, Z.; Hossain, M.; Yao, X.; Li, H.; Zhou, D. On thermo-viscoelastic experimental characterization and numerical modelling of VHB polymer. Int. J. Non-Linear Mech. 2020, 118, 103263. [Google Scholar] [CrossRef]
  8. Janardhana Reddy, G.; Kumar, M.; Anwar Beg, O. Effect of temperature dependent viscosity on entropy generation in transient viscoelastic polymeric fluid flow from an iso-thermal vertical plate. Physica A 2018, 510, 426–445. [Google Scholar] [CrossRef]
  9. Ansari, M.; Hatzikiriakos, S.G.; Mitsoulis, E. Slip effects in HDPE flows. J. Non-Newton. Fluid Mech. 2012, 167–168, 18–29. [Google Scholar] [CrossRef]
  10. Debbaut, B. Non-isothermal and viscoelastic effects in the squeeze flow between infinite plates. J. Non-Newton. Fluid Mech. 2001, 98, 15–31. [Google Scholar] [CrossRef]
  11. Mu, Y.; Zhao, G.; Qin, S.; Li, X.; Wang, J. Numerical simulation of three-dimensional polymer extrusion flow with differential viscoelastic model. Polym. Adv. Technol. 2007, 18, 1004–1014. [Google Scholar] [CrossRef]
  12. Mu, Y.; Zhao, G.; Wu, X.; Li, H. Modeling and simulation of three-dimensional planar contraction flow of viscoelastic fluids with PTT, Giesekus and FENE-P constitutive models. Appl. Math. Comput. 2012, 218, 8429–8443. [Google Scholar] [CrossRef]
  13. Cao, W.; Shen, Y.; Wang, P.; Liu, Q. Viscoelastic modeling and simulation for polymer melt flow in injection/compression molding. J. Non-Newton. Fluid Mech. 2019, 274, 104186. [Google Scholar] [CrossRef]
  14. Wan, R.; Zhang, H.; Liu, Q. Some new global results to the incompressible Oldroyd-B model. Z. Angew. Math. Phys. 2019, 70, 28. [Google Scholar] [CrossRef]
  15. Barrett, J.W.; Boyaval, S. Existence and approximation of a (regularized) Oldroyd-B model. Math. Models Methods Appl. Sci. 2011, 21, 1783–1837. [Google Scholar] [CrossRef]
  16. Bush, M.B. A numerical study of extrudate swell in very dilute polymer solutions represented by the Oldroyd-B model. J. Non-Newton. Fluid Mech. 1990, 34, 15–24. [Google Scholar] [CrossRef]
  17. Fan, Y.; Tanner, R.I.; Phan-Thien, N. Galerkin/least-square finite-element methods for steady viscoelastic flows. J. Non-Newton. Fluid Mech. 1999, 84, 233–256. [Google Scholar] [CrossRef]
  18. Alves, M.A.; Pinho, F.T.; Oliveira, P.J. The flow of viscoelastic fluids past a cylinder: Finite-volume high-resolution methods. J. Non-Newton. Fluid Mech. 2001, 97, 207–232. [Google Scholar] [CrossRef]
  19. Xiong, Y.L.; Bruneau, C.H.; Yang, D. Numerical study on viscoelastic fluid flow past a rigid body. Appl. Math. Model. 2017, 42, 188–208. [Google Scholar] [CrossRef]
  20. Dou, H.-S.; Phan-Thien, N. Viscoelastic flow past a confined cylinder: Instability and velocity inflection. Chem. Eng. Sci. 2007, 62, 3909–3929. [Google Scholar] [CrossRef]
  21. Mamalis, A.; Kouzilos, G.; Vortselas, A. Design feature sensitivity analysis in a numerical model of an extrusion spider die. J. Appl. Polym. Sci. 2011, 122, 3537–3543. [Google Scholar] [CrossRef]
  22. Rabhi, F.; Barriere, T.; Sahli, M. Multiphysics modeling and simulation of monolayer flow and die swelling in industrial tube extrusion process. Polym. Eng. Sci. 2024, 64, 5315–5328. [Google Scholar] [CrossRef]
  23. Mamalis, A.; Spentzas, K.; Kouzilos, G. On the high-density polyethylene extrusion: Numerical, analytical and experimental modeling. Adv. Polym. Technol. 2010, 29, 173–184. [Google Scholar] [CrossRef]
  24. Kihara, S.; Gouda, T.; Matsunaga, K. Numerical simulation of three-dimensional viscoelastic flow within dies. Polym. Eng. Sci. 1999, 39, 152–163. [Google Scholar] [CrossRef]
  25. Norouzi, M.; Davoodi, M.; Anwar Bég, O. Theoretical study of Oldroyd-B visco-elastic fluid flow through curved pipes with slip effects in polymer flow processing. Int. J. Appl. Comput. Math. 2018, 4, 108. [Google Scholar] [CrossRef]
  26. Turkoz, E.; Lopez-Herrera, J.M.; Eggers, J. Axisymmetric simulation of viscoelastic filament thinning with the Oldroyd-B model. J. Fluid Mech. 2018, 851, R2. [Google Scholar] [CrossRef]
  27. Castillo Sánchez, H.A.; Jovanović, M.R.; Kumar, S. Understanding viscoelastic flow instabilities: Oldroyd-B and beyond. J. Non-Newton. Fluid Mech. 2022, 302, 104742. [Google Scholar] [CrossRef]
  28. Bird, R.B.; Drugan, W.J. An exploration and further study of an enhanced Oldroyd model. Phys. Fluids 2017, 29, 5. [Google Scholar] [CrossRef]
  29. Silbermann, M.; Schenkel, M.; Hoffmann, T. Die for a Hollow Profile Extruder. U.S. Patent US20190299514A1, 26 March 2019. [Google Scholar]
  30. Mu, Y.; Zhao, G.; Wang, Y. Numerical study of nonisothermal polymer extrusion flow with a differential viscoelastic model. Polym. Eng. Sci. 2008, 48, 316–328. [Google Scholar] [CrossRef]
  31. Hughes, T.J.R.; Franca, L.P.; Hulbert, G.M. A new finite element formulation for computational fluid dynamics: VIII. The Galerkin/least-squares method for advective-diffusive equations. Comput. Methods Appl. Mech. Eng. 1989, 73, 173–189. [Google Scholar] [CrossRef]
  32. Behr, M.A.; Franca, L.P.; Tezduyar, T.E. Stabilized finite element methods for the velocity-pressure-stress formulation of incompressible flows. Comput. Methods Appl. Mech. Eng. 1993, 104, 31–48. [Google Scholar] [CrossRef]
  33. Xia, K.; Yao, H.; Li, Z. A Galerkin/least-square finite element formulation for nearly incompressible elasticity/Stokes flow. Appl. Math. Model. 2007, 31, 513–529. [Google Scholar] [CrossRef]
  34. Wang, X.; Ye, X.; Zhang, S. A weak Galerkin least squares finite element method of Cauchy problem for Poisson equation. J. Comput. Appl. Math. 2022, 401, 113767. [Google Scholar] [CrossRef]
  35. Behr, M.; Arora, D.; Pasquali, M. Stabilized finite element methods of GLS type for Oldroyd-B viscoelastic fluid. In Proceedings of the European Congress on Computational Methods in Applied Sciences and Engineering (ECCOMAS), Jyväskylä, Finland, 24–28 July 2004. [Google Scholar]
  36. Craven, T.; Rees, J.; Zimmerman, W.B. Stabilised finite element modelling of Oldroyd-B viscoelastic flows. In Proceedings of the COMSOL Conference, Boston, MA, USA, 8–10 November 2006. [Google Scholar]
  37. Yu, T.-H.; Wilkes, G.L. Influence of molecular weight distribution on the melt extrusion of high density polyethylene (HDPE): Effects of melt relaxation behavior on morphology and orientation in HDPE extruded tubular films. J. Rheol. 1996, 40, 1079–1093. [Google Scholar] [CrossRef]
  38. Kraft, M.; Meissner, J.; Stutz, J. Linear viscoelastic characterization of polymer melts with long relaxation times. Macromolecules 1999, 32, 751–757. [Google Scholar] [CrossRef]
  39. Chaturvedi, E.; Rajput, N.S.; Upadhyaya, S.; Pandey, P. Experimental study and mathematical modeling for extrusion using high-density polyethylene. Mater. Today Proc. 2017, 4, 1670–1676. [Google Scholar] [CrossRef]
  40. Kouzilos, G.N.; Seretis, G.V.; Provatidis, C.G. Design of polymer extrusion dies using finite element analysis. In Extrusion of Metals, Polymers, and Food Products; IntechOpen: Rijeka, Croatia, 2017; Chapter 10. [Google Scholar]
  41. Marschik, C.; Roland, W.; Dörner, M. Application of network analysis to flow systems with alternating wave channels: Part B (superimposed drag-pressure flows in extrusion). Polymers 2020, 12, 1900. [Google Scholar] [CrossRef]
  42. Hopmann, C.; Bastian, M.; Windeck, C. A method for the validation of simulated mixing characteristics of single-screw extrusion. Polymers 2020, 12, 2234. [Google Scholar] [CrossRef] [PubMed]
  43. Oliveira, P.J. Method for time-dependent simulations of viscoelastic flows: Vortex shedding behind cylinder. J. Non-Newton. Fluid Mech. 2001, 101, 113–137. [Google Scholar] [CrossRef]
  44. Kato, H.; Mizuno, Y. Method for time-dependent simulations of viscoelastic flows: Vortex shedding behind cylinder. Bull. JSME 1983, 26, 529–536. [Google Scholar] [CrossRef]
  45. Reddy, B.; Kumar, K.A.; Bujula, R. Impact of Soret and Dufour on MHD mixed convective flow of non-Newtonian fluid over a coagulated surface. Heat Transfer 2021, 50, 567–580. [Google Scholar]
  46. Renardy, M. High Weissenberg number boundary layers for the upper convected Maxwell fluid. J. Non-Newton. Fluid Mech. 1997, 68, 125–132. [Google Scholar] [CrossRef]
  47. McLeish, T.C.B. Tube theory of entangled polymer dynamics. Adv. Phys. 2010, 51, 1379–1527. [Google Scholar] [CrossRef]
  48. Somani, R.H.; Yang, L.; Zhu, L.; Hsiao, B.S. Flow-induced shish–kebab precursor structures in entangled polymer melts. Polymer 2005, 46, 8587–8623. [Google Scholar] [CrossRef]
  49. Cao, Y.; Yang, W.-J.; Guo, X.-W. Role of nonmonotonic constitutive curves in extrusion instabilities. Int. J. Polym. Sci. 2015, 2015, 312839. [Google Scholar] [CrossRef]
  50. Kwon, Y.; Park, J.; Lee, S. Melt fracture modeled as 2D elastic flow instability. Rheol. Acta 2015, 54, 445–453. [Google Scholar] [CrossRef]
  51. Agrawal, P.; Silva, M.H.A.; Cavalcanti, S.N. Rheological properties of high-density polyethylene/linear low-density polyethylene and high-density polyethylene/low-density polyethylene blends. Polym. Bull. 2022, 79, 2321–2343. [Google Scholar] [CrossRef]
  52. Erbetta, C.; Manoel, G.; Oliveira, A. Rheological and thermal behavior of high-density polyethylene (HDPE) at different temperatures. Mater. Sci. Appl. 2014, 5, 923–931. [Google Scholar] [CrossRef]
  53. Tanner, R.I. Engineering Rheology, 2nd ed.; Oxford University Press: Oxford, UK, 2000. [Google Scholar]
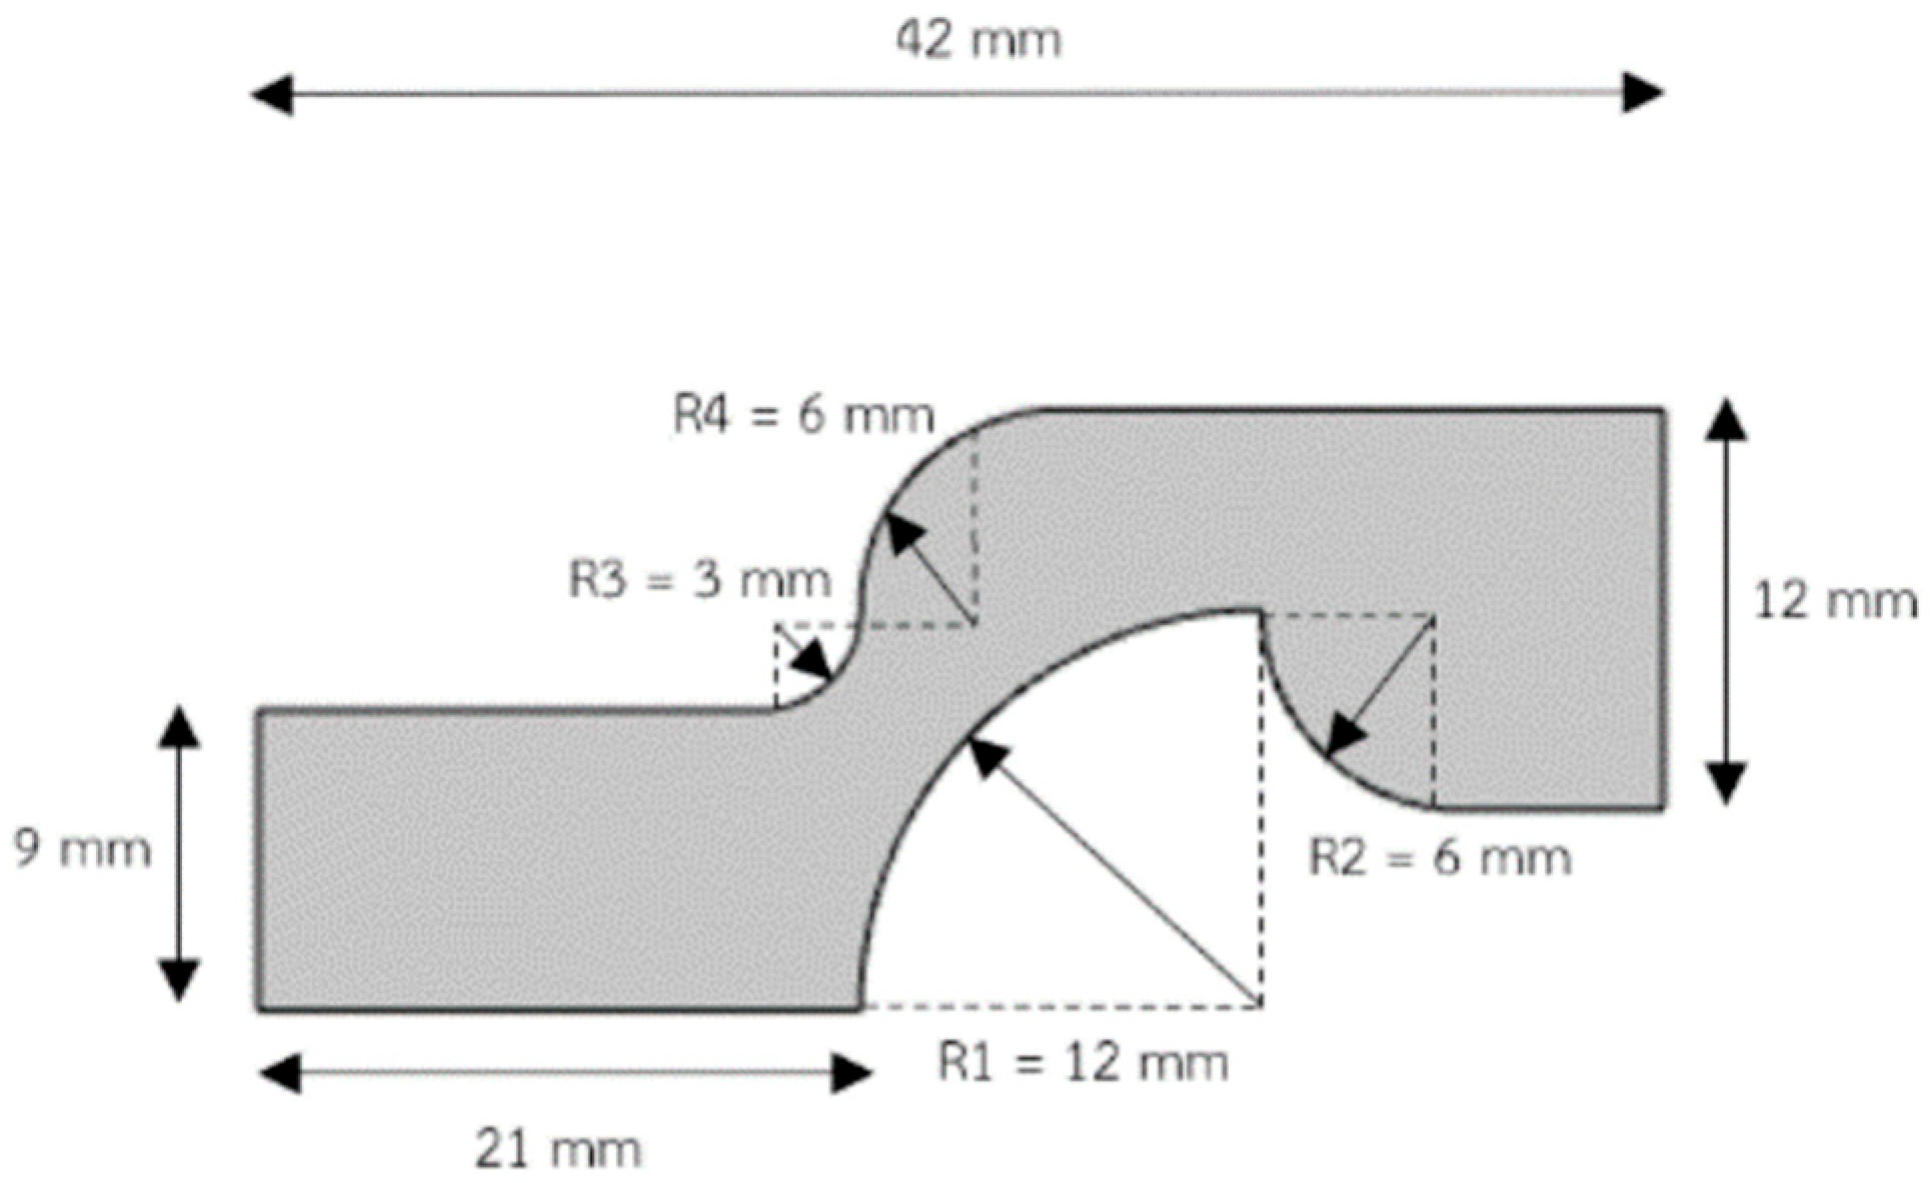
Figure 1. A 2D schematic diagram of the die channel.
Fluids 10 00238 g001
Figure 2. Mesh of the modelling domain.
Fluids 10 00238 g002
Figure 3. Domain boundaries: (a) inlet, (b) outlet, (c) inner wall (mandrel surface), (d) outer wall, and (e) symmetry plane.
Fluids 10 00238 g003
Figure 4. The computed results from a previous study [18] and the present study: (a) dimensionless drag coefficient from Wi = 0 to Wi = 1 and (b) normal stress τ xx at Wi = 0.7.
Fluids 10 00238 g004
Figure 5. The simulation results from present study: (a) temperature distribution and (b) pressure distribution.
Fluids 10 00238 g005
Figure 6. Velocity distribution inside the extruder die at Wi = 0.21.
Fluids 10 00238 g006
Figure 7. Temperature distribution inside the extruder die at Wi = 0.21.
Fluids 10 00238 g007
Figure 8. Pressure distribution inside the extruder die at Wi = 0.21.
Fluids 10 00238 g008
Figure 9. Dimensionless drag coefficient on the inner wall surface of the extruder die (Wi = 0 to Wi = 0.21).
Fluids 10 00238 g009
Figure 10. Normal stress, τ xx , on the inner wall at different Weissenberg numbers.
Fluids 10 00238 g010
Figure 11. Shear stress, τ xy , on the inner wall surface at different Weissenberg numbers.
Fluids 10 00238 g011
Figure 12. Normal stress, τ xx , on the outer wall at different Weissenberg numbers.
Fluids 10 00238 g012
Figure 13. Shear stress, τ xy , on the outer wall surface at different Weissenberg numbers.
Fluids 10 00238 g013
Figure 14. Dimensionless drag coefficient, Cd, on the inner wall at various relaxation time values.
Fluids 10 00238 g014
Figure 15. Normal stress, τ xx , on the inner wall at different relaxation time values.
Fluids 10 00238 g015
Figure 16. Shear stress, τ xy , on the inner wall surface at different relaxation time values.
Fluids 10 00238 g016
Figure 17. Dimensionless drag coefficient, Cd, on the inner wall at different inlet velocity values.
Fluids 10 00238 g017
Figure 18. Normal stress, τ x x , on the inner wall at different inlet velocity values.
Fluids 10 00238 g018
Figure 19. Shear stress, τ x y , on the inner wall surface at different inlet velocity values.
Fluids 10 00238 g019
Figure 20. Extruder die geometry with three difference fillet radii: (a) 1 mm, (b) 1.5 mm, and (c) 2 mm.
Fluids 10 00238 g020
Figure 21. Normal stress, τ x x , on the inner wall of the extruder die with different fillet radius values at Wi = 0.21.
Fluids 10 00238 g021
Figure 22. Shear stress, τ x y , on the inner wall of the extruder die with different fillet radius values at Wi = 0.21.
Fluids 10 00238 g022
Table 1. Grid independence study.
Mesh LevelElementsCd Max   τ xx (Pa)CPU Time
(Relative)
Coarse12007.03201.21.0×
Medium25007.10199.02.15×
Fine38677.11198.53.57×
Table 2. HDPE material parameters [23,24].
ρ (Kg/m3)k (W/m.K) C p (J/Kg.K)T (K) β
7520.482400473.150.59
Table 3. Wi and Cd results from the extruder dies at various relaxation time values.
λ (s)WiCd
0.020.0567.1059
0.030.0837.0806
0.040.1117.0444
0.050.1397.0040
0.060.1676.9635
Table 4. Wi and Cd at various inlet velocity values.
U (m/s)WiCd
0.020.0985.6521
0.02250.1116.3421
0.0250.1237.0276
0.02750.1357.709
0.030.1478.3863
Disclaimer/Publisher’s Note: The statements, opinions and data contained in all publications are solely those of the individual author(s) and contributor(s) and not of MDPI and/or the editor(s). MDPI and/or the editor(s) disclaim responsibility for any injury to people or property resulting from any ideas, methods, instructions or products referred to in the content.