Article

Effects of Airfoil Parameters on the Cavitation Performance of Water Jet Propulsion Pumps

1
National Research Center of Pumps, Jiangsu University, Zhenjiang 212013, China
2
Marine Design and Research Institute of China, Shanghai 200011, China
*
Authors to whom correspondence should be addressed.
Fluids 2025, 10(9), 227; https://doi.org/10.3390/fluids10090227
Submission received: 12 July 2025 / Revised: 10 August 2025 / Accepted: 25 August 2025 / Published: 28 August 2025
(This article belongs to the Section Turbulence)

Abstract

This paper investigates the influence of airfoil parameters on the cavitation performance of water jet propulsion pumps through numerical simulation methods. The effects of a varying inlet pressure and different airfoil structures on the critical net positive suction head (NPSH), head, and efficiency were systematically studied. Subsequently, the impact pattern of the airfoil structure on the cavitation performance was analyzed. The results demonstrate that the NACA0009-16_0004-16 airfoil exhibited the lowest required NPSH and superior cavitation resistance relative to the other tested airfoils. Nevertheless, the NACA0009-13_0004-13 airfoil demonstrated an optimal comprehensive performance, balancing the efficiency, head, and cavitation resistance. By extracting a water velocity isosurface of 23.6 m/s, we further investigated the flow characteristics of the suction surfaces of different airfoils at different cavitation conditions and found that the cavitation mainly includes TIP cavitation and sheet cavitation. With an increasing cavitation intensity, the sheet cavitation region progressively develops axially from the blade tip towards the blade outlet, extends radially from the shroud to the hub, and eventually nearly extends over the entire blade surface. The area of the TIP cavitation also expands, spreading downward in the same direction as the impeller rotation. The velocity vector exhibits a significantly higher density near the shroud and blade tips, suggesting potential flow separation and complex vortex structures in these regions. Near the blade leading edge, the water velocity isosurface area contracts, whereas near the trailing edge, it expands. These alterations indicate that the cavitation development modifies the flow field velocity distribution and adversely affects the impeller performance. This study establishes a theoretical foundation and offers practical guidelines for the multi-objective collaborative design of water jet propulsion pumps.

1. Introduction

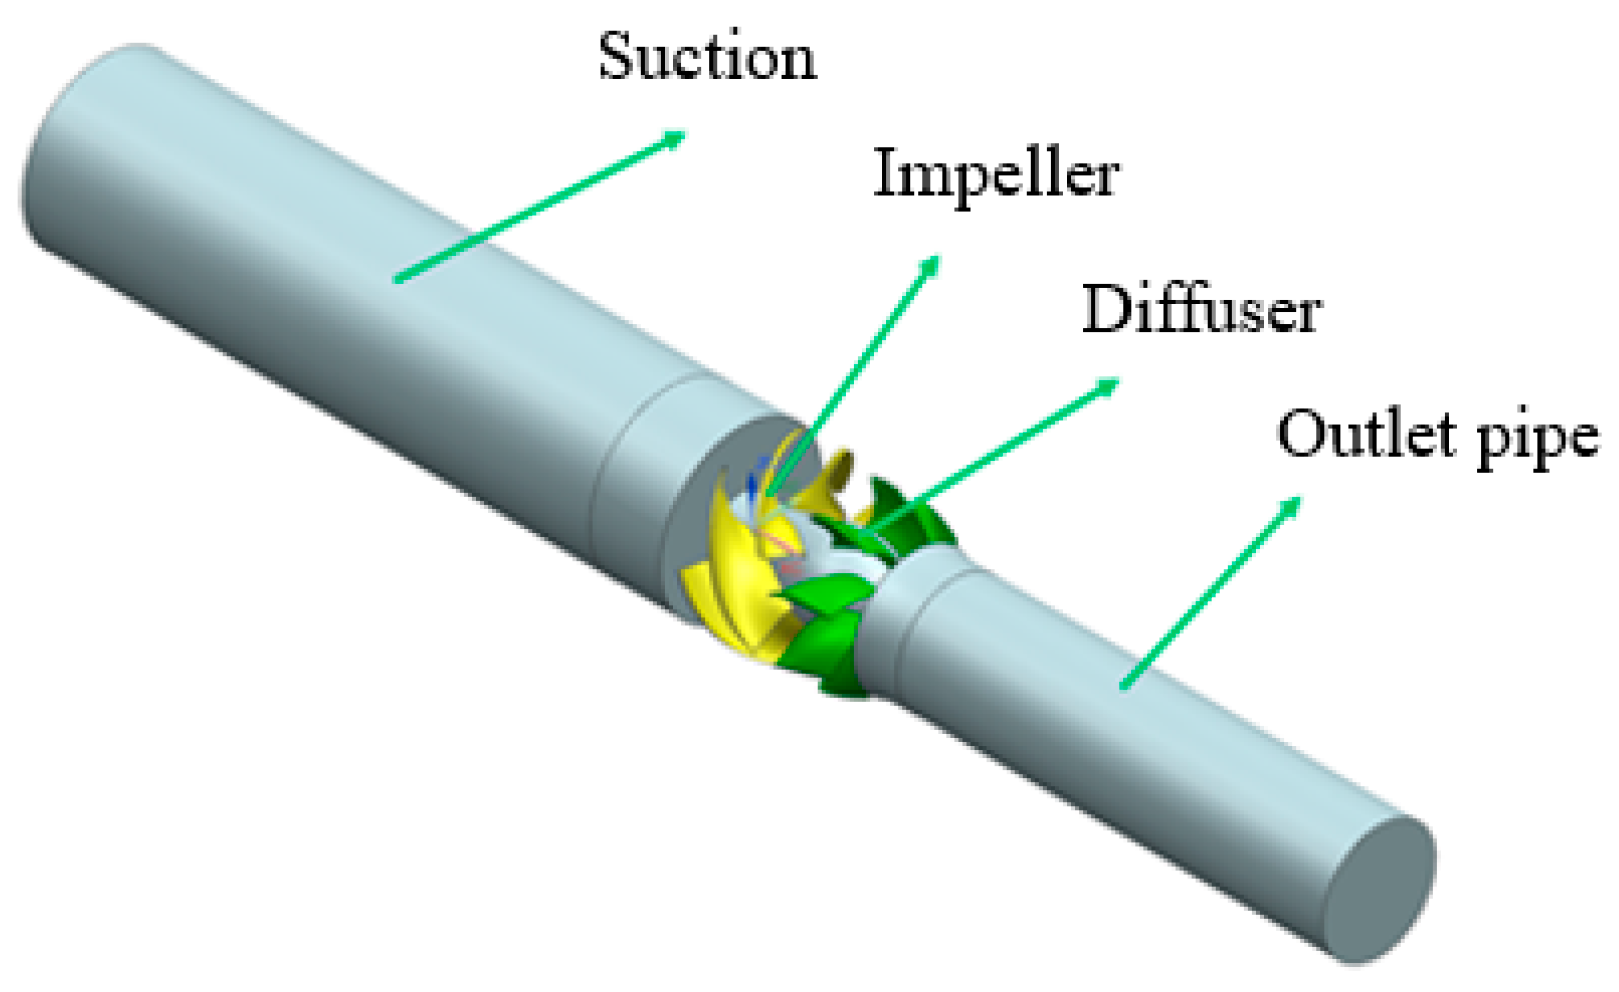
Differently from the propeller propulsion developed in the 19th century [1], water jet propulsion is a special propulsion method that has been developed and matured in the past 40 years. Figure 1 shows the core components of the water jet propulsion pump and its working process [2]. After water flows into the pump body through the suction pipe, it gains kinetic energy and pressure energy under the rotation of the impeller. After being rectified by the diffuser, it is discharged through the outlet pipe. It uses the reaction force of the water flow from the propulsion pump to propel the ship forward and controls the forward navigation and turning of the ship by changing the pressure and velocity distribution of the internal flow channel as well as the flow direction of the fluid after the nozzle [3]. Compared with conventional propeller propulsion, water jet propulsion has the advantages of low noise, a good anti-cavitation performance, and high propulsion efficiency at high speeds [4,5,6,7,8]. It has been more and more widely used in high-performance ships.
The efficiency of a water jet propulsion system is closely linked to the operating efficiency of its pump, so many experts and scholars have conducted in-depth research on this. The optimization of water jet propulsion pumps primarily focuses on hydraulic performance optimization and cavitation performance optimization.
Regarding the hydraulic optimization of water jet propulsion pumps, Lu [9] and Ji [10] found that an increase in the tip clearance affects the internal flow field of the pump and reduces its overall performance. Sun [11] simulated the cavitation performance using the Schnerr–Sauer cavitation model. The results showed that when the incoming flow angle is 30°, the pump-jet propulsor with a rear stator no longer exhibits high efficiency, losing 60% and 40% of its thrust, respectively. Huang [12] completed the multi-objective optimization design of the water jet propulsion flow channel through parametric modeling and optimization algorithms. Huang [13] conducted studies on mixed-flow pumps through CFX simulations and experiments and found that reducing the blade thickness and adjusting inlet angles have beneficial effects on both the hydraulic performance and cavitation performance. Tian [14] carried out the parametric modeling and simulation of the pump impeller, with the efficiency and head as the optimization objectives. Through the optimization using the multi-island genetic algorithm, the hydraulic efficiency under design conditions was increased by 6.3%, and the total entropy generation was significantly reduced.
In addition to the hydraulic performance, the cavitation performance and its optimization of water jet propulsion pumps have also received extensive attention. Based on empirical formulas, Kunz [15], Merkle [16], and Saito [17] proposed cavitation models. Based on the Rayleigh–Plesset equation, Singhal [18], Schnerr and Sauer [19], and Yuan [20] derived cavitation models. Katz [21] found that the axial shear vortex structure in the separation region has an impact on the development of cavitation. Laberteaux [22] et al. observed cavitation vortex structures in the closed region of the attached cavitation using high-speed photography technology. When Arno [23] predicted the cavitation of a centrifugal pump with a specific speed of 85, by specifying the ratio of a certain pressure isosurface to the blade area and using statistical methods, it was determined that when the area ratio was between 1% and 2%, the prediction of the required net positive suction head was in good agreement with the experimental results. Xu [24] and Han [25] adopted the SAS and LES turbulence models combined with the ZGB cavitation model, respectively, and revealed the interaction between cavitation and vortices in the tip region. David Tan [26] and Long [2,27,28,29,30,31] captured the flow field structures under critical cavitation conditions using high-speed photography technology and studied the mechanisms by which cavitation causes performance degradation and damage to the pump. Long [2,27,28,29,30,31] also proposed a cavitation prediction method based on the pressure isosurface of the single-phase medium, which accelerates the optimization design process. Xu [32] studied the spatiotemporal evolution characteristics of tip leakage vortex (TLV) cavitation under different cavitation conditions through large eddy simulations and cavitation experiments, revealing the influence of TLV cavitation development on the blade flow field. Qiu [33] investigated the cavitation pulsating pressure characteristics at different positions in the pump via experiments and numerical simulations and found that the cavitation pulsating pressure near the impeller leading edge within the tip clearance is the largest. Xia [34] studied the cavitation characteristics under three operating conditions based on a hybrid model combining the Zwart–Gerber–Belamari cavitation model and the homogeneous flow model, analyzing the critical cavitation state and the distribution of cavitation regions. Gong [35] researched the characteristics of tip leakage vortex (TLV) cavitation, as well as pressure fluctuations and vibrations caused by cavitation, and found that the formation of TLV cavitation clouds significantly reduces the pump performance and alters the pressure distribution. Xu [36] adopted the SST k-ω turbulence model and the barotropic law cavitation model to study the internal flow field and cavitation characteristics of two axial-flow pumps, analyzing the variations in the cavitation location, velocity field, and blade load with the cavitation number. Huang [37] studied the spatiotemporal spectrum of the cavitating flow in a mixed-flow pump using the fast Fourier transform and wavelet transform, numerically simulating the unsteady cavitating flow through the Reynolds-Averaged Navier–Stokes method and exploring the time-varying frequency characteristics of the cavitating flow. Zheng [38] obtained the cavitation vortex structures in the pump under different flow rates through high-speed photography and, combined with numerical simulations, obtained the cavitation performance curves and cavitation flow field structures under five flow rates, establishing the correlation between the cavitation performance and cavitation vortex structures under different flow velocities. Figure 2 shows the experimental research for cavitation performance and optimization of water jet propulsion pumps [2,27,28,29,30,31].
With the advancement of microfabrication technology, flow cavitation in micro- and nanoscale channels has become increasingly common. Regarding flow issues at the microscale, in 2004 Husband [39] proposed that the influence of microscale hydrodynamic cavitation must be considered in the research of micropumps. Tsunenori [40] observed the graphite surface damaged by cavitation erosion using a surface profilometer and found that cavitation erosion increased the surface roughness. Mishra [41] conducted a series of experiments using deionized water and refrigerants as working media to study the flow characteristics and mechanisms of microscale hydrodynamic cavitation phenomena and also performed a comparative analysis on the similarities and differences between microscale hydrodynamic cavitation and macroscale cavitation. Zwaan [42] induced the generation of cavitation in microchannels via a laser, forming planar bubble flows. It was observed that high-speed jet phenomena occur when bubbles are collapsed by PIV technology. Moreover, the bubble flow patterns in the microchannels were compared with the two-dimensional Rayleigh model, and comparative experiments under various conditions were conducted by changing the channel cross-sections. Shao Hua [43] built a microscale hydrodynamic cavitation test bench equipped with a microfluidic chip. The microfluidic chip consists of a 2500 μm long microchannel with a micro-throat. Experiments conducted under different pressure conditions showed that cavitation mainly occurs at the throat of the micro-throat and its downstream position, and the cavitation bubbles almost block the entire throat.
Regarding the airfoil optimization for improving the cavitation performance of water jet propulsion pumps, Su [44,45] and Lu [46] conducted comparative studies between impellers with bionic airfoils and those with traditional airfoils and found that bionic airfoils exhibit a better hydraulic performance. Li [47] pointed out through research that the S-type blade tip features a smaller range of high-pressure areas, a smaller area of high-speed regions at the outlet, a more uniform velocity distribution, and more stable flow. Hao [48] optimized the NACA-6510 airfoil using an improved particle swarm optimization algorithm, which increased the lift–drag ratio by 14.7% and effectively suppressed cavitation. When the optimized airfoil was applied to the propulsion pump, the thrust increased by 2.55% and the efficiency improved by 6.38%. In summary, many scholars have carried out research on the optimized design of the hydraulic performance and cavitation performance of water jet propulsion pumps through approaches such as the optimization of the inlet flow channel and the optimization of the blades. Existing studies have clearly established that cavitation is a critical issue affecting the performance of water jet propulsion pumps, leading to reduced efficiency, intensified vibration and noise, and component damage. The airfoil design is a core link in improving the internal flow and cavitation characteristics of the pump.
However, there remains a deficiency in the current research on the quantitative impact of airfoil parameters on the cavitation performance of water jet propulsion pumps. Most studies focus on the overall performance of a single airfoil, lacking a comparative analysis of different airfoil structures throughout the entire cavitation process, and the mechanism by which airfoil parameters affect the initiation, development, and collapse of cavitation by altering the flow field is not sufficiently revealed.
To address this research gap, this study establishes a numerical model of hydraulic components for water jet propulsion pumps, building upon existing cavitation research and experimental foundations. The reliability of the simulation methodology was ensured through a mesh independence verification and appropriate boundary condition settings. Subsequently, three distinct NACA-series airfoils with varying thicknesses (NACA0009_0004, NACA0009-13_0004-13, and NACA0009-16_0004-16) were comparatively analyzed. Their critical net positive suction head (NPSH), head, efficiency, and other performance metrics under different inlet pressures were evaluated to determine their impact on the cavitation performance. Furthermore, by extracting velocity isosurfaces at 23.6 m/s, the relationship between the airfoil parameters and cavitation pattern evolution was revealed. This enabled the proposal of an airfoil selection strategy that balances cavitation resistance with the overall hydraulic performance. These findings provide theoretical support for anti-cavitation designs in water jet propulsion pumps and deliver actionable optimization strategies for practical engineering applications.

2. Numerical Calculation Method

2.1. Numerical Calculation Model

The key hydraulic components of the pump model comprise the impeller, diffuser, suction, and outlet pipe. Based on the design drawings, three-dimensional (3D) models of these hydraulic components were created using NX 12.0 software. According to the inlet and outlet pipe diameters, we matched the suction and the outlet straight pipe sections with four times the pipe diameter. The resulting three-dimensional computational domain, incorporating all components, is presented in Figure 3.

2.2. Mesh Generation

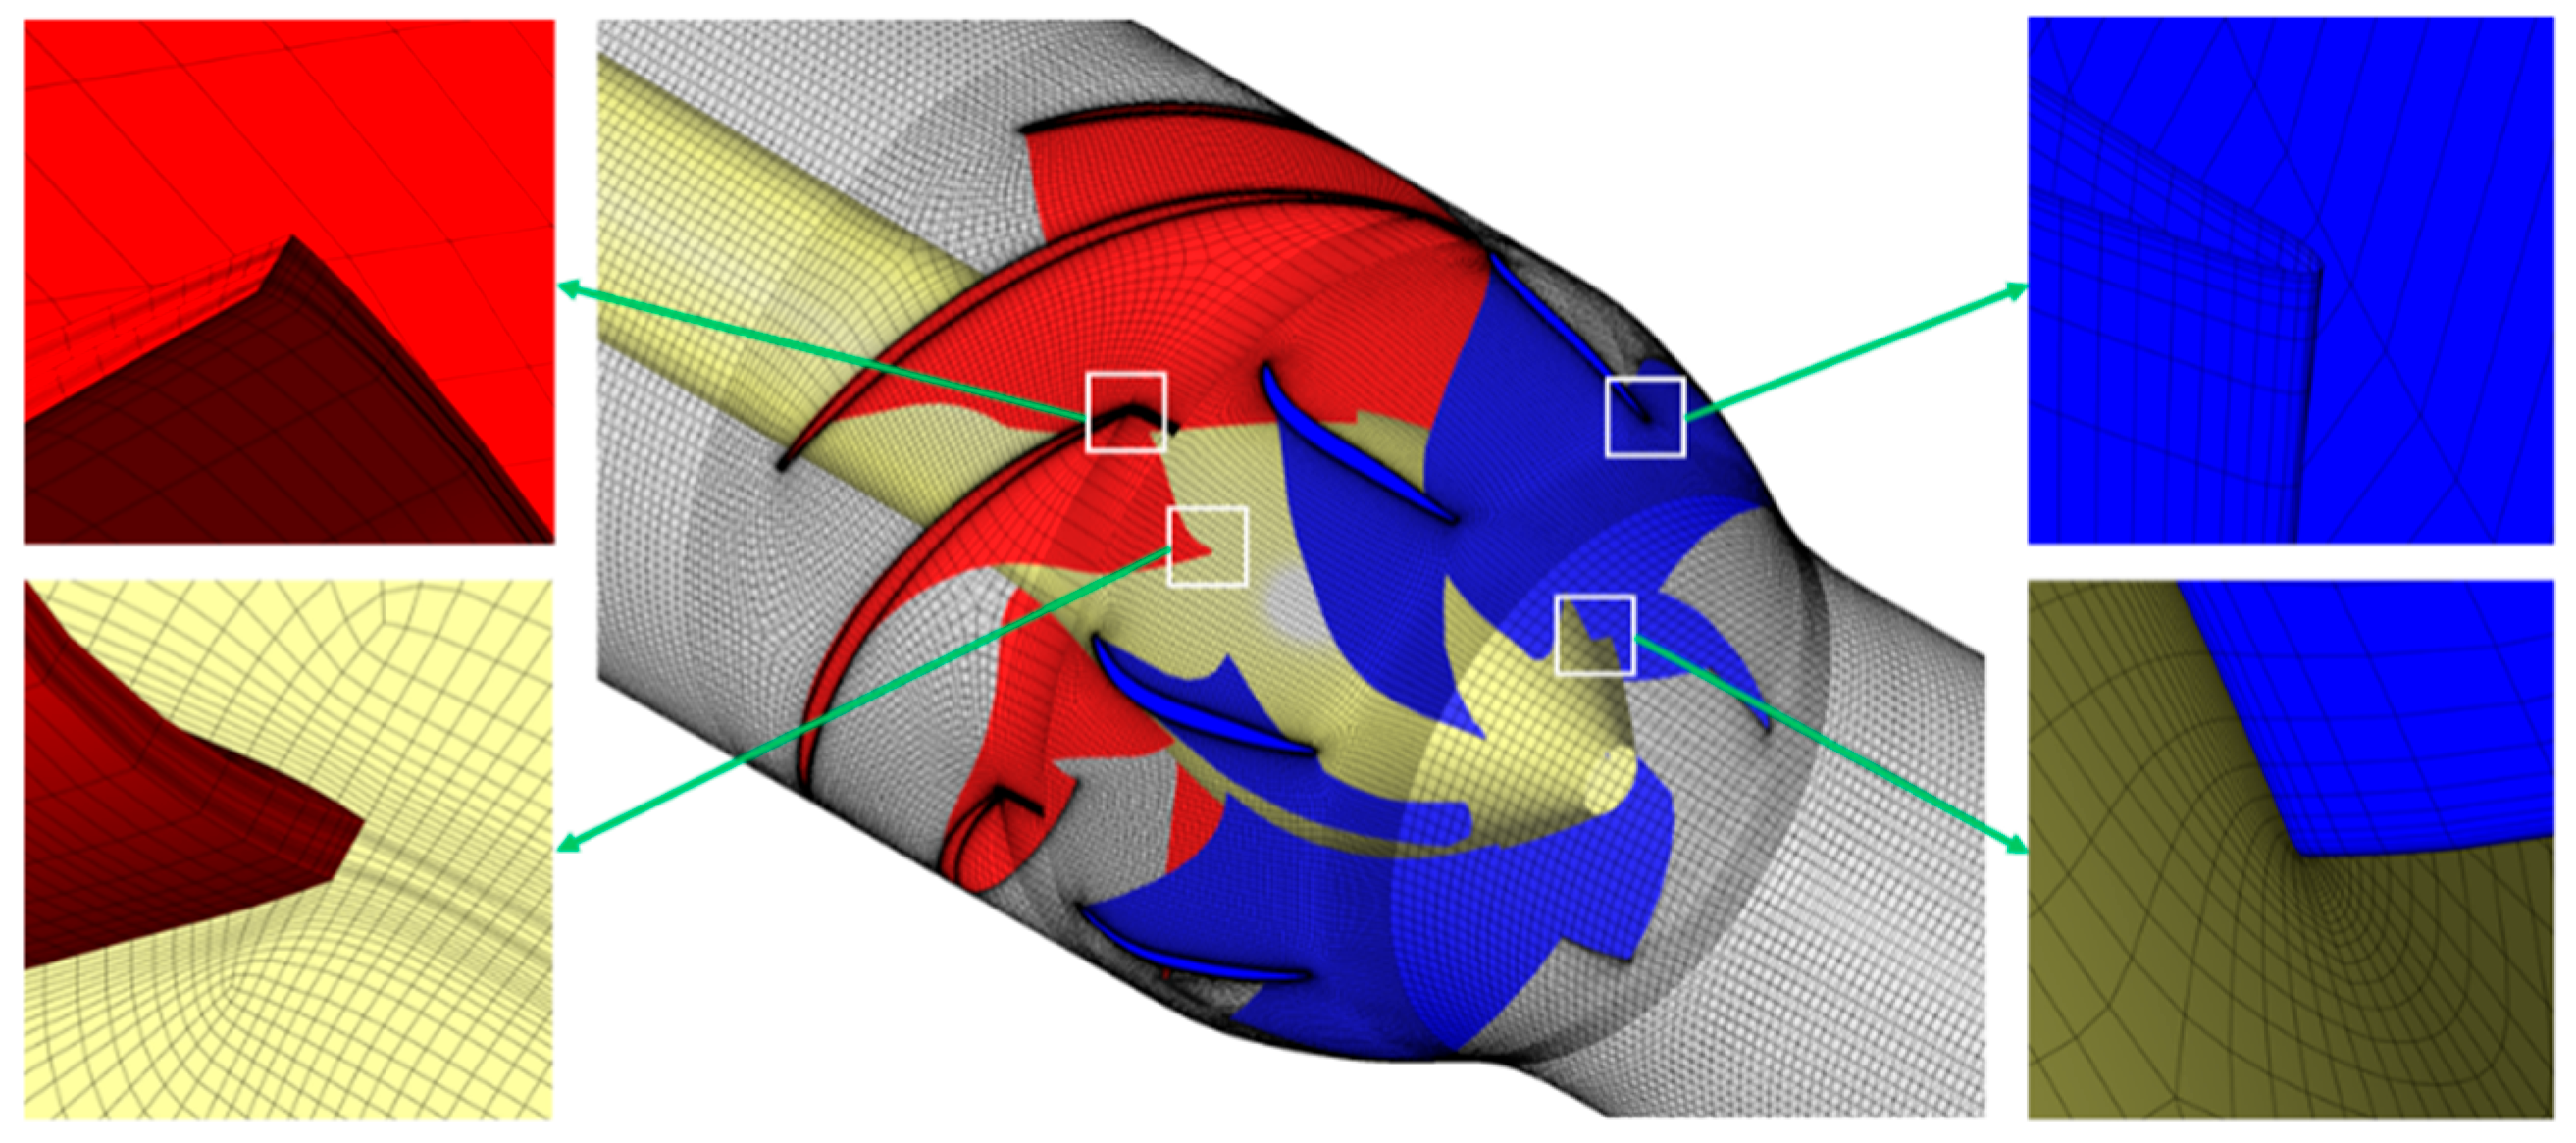
Blade section curve data for both the impeller and diffuser were extracted using the NX software. Subsequently, these data were imported into ANSYS BladeGen to reconstruct the three-dimensional geometries of the impeller and diffuser. Finally, high-quality structured hexahedral meshes were generated for the impeller and diffuser domains using ANSYS TurboGrid. The NX was used to establish the models of the inlet and outlet fluid domains, and the ICEM was used for the structured mesh generation of these domains. The boundary layer was refined on each wall, and the total number of meshes was 4,764,064. The mesh partial enlargement is shown in Figure 4. The y+ values of each component are shown in Table 1. Currently, the first layer grid is in the viscous bottom layer, which meets the calculation requirements of the SST k-ω turbulence model.

2.3. Turbulence Model

The Navier–Stokes (N-S) equations can be used to directly solve for the fluid flow under laminar conditions. However, the fluid flow in practical engineering applications is mostly turbulent. Turbulence is a complex, large-scale flow process occurring in three-dimensional space and is ubiquitous in engineering applications. The N-S equations become less effective for directly solving the turbulent fluid flow in complex flow domains. Therefore, it is necessary to apply appropriate averaging processing to the N-S equations to derive the Reynolds-Averaged Navier–Stokes (RANS) equations. Different mathematical formulations are then introduced to encapsulate the turbulence effects, forming various turbulence models.
Selecting an appropriate turbulence model is crucial for numerical calculations. To obtain energy characteristic curves closer to experimental data, four commonly used turbulence models in practical engineering were selected for the preliminary numerical simulation comparison: the Standard k-ε model, RNG k-ε model, Standard k-ω model, and SST k-ω model. The Standard k-ε model is widely applied, offers good convergence, and has low memory requirements. However, it performs poorly in simulating complex flows with high curvatures, strong pressure gradients, or swirl. The RNG k-ε model can simulate complex flows, such as separated flows, secondary flows, swirls, and jets, but it is often limited by the assumption of isotropic eddy viscosity. The Standard k-ω model is suitable for simulating the boundary layer flows, separation, and transition under adverse pressure gradients but suffers from a poorer convergence. The SST k-ω model integrates the strengths of the Standard k-ε model in free-stream calculations and the Standard k-ω model in near-wall calculations. However, due to its strong dependence on the wall distance, it is less suitable for free shear flows.
Pumps exhibit significant flow separation and backflow phenomena in the hump region and under low-flow operating conditions. The SST k-ω model is well-suited for simulating these conditions, and the calculated results closely match the experimental data. Therefore, after a comprehensive consideration, the SST k-ω model was adopted for the numerical calculations in this study. This model was first proposed by Menter [49,50,51], and its mathematical expressions are shown below:
ρ k t + ρ k u i x i = x j μ + μ t σ k 3 k x j + P k β * ρ k ω
( ρ ω ) t + ( ρ ω u i ) x i = x j μ + μ t σ ω 3 ( ω ) x j + α 3 ω k p k β 3 ρ ω 2 + 2 ( 1 F 1 ) ρ 1 ω σ ω 2 k x j ω x j
In the equations, β* = 0.09, and Pk represents the turbulence production term.

2.4. Cavitation Model

The cavitation flow in the water jet propulsion pump is characterized by high shear and a transient phase change. The mass exchange between gas and liquid phases needs to be described by mass transfer equations. The cavitation model is a model used to describe the mutual transformation between gas and liquid phases during flow. It simplifies the cavitation flow model and converts it into a non-slip mixed fluid model. There are various cavitation models based on the Rayleigh–Plesset equation, such as the ZGB cavitation model, the Kunz cavitation model, and the Schnerr–Sauer cavitation model [52]. Among them, the ZGB model is integrated in ANSYS CFX and is known for its high convergence and prediction accuracy. This paper selects the ZGB cavitation model by Zhong to study the cavitation flow inside the water jet propulsion pump. Its expression is as follows:
ρ ν α ν t   +   · ρ ν α ν u   =   m ˙ + +   m ˙
m ˙ + = F vap 3 α ruc 1     α ν ρ ν R B 2 3 p ν p ρ l , p     p ν
m ˙ = F cond 3 α ν ρ ν R B 2 p     p ν 3 , p   >   p ν
In the formula, α is the volume fraction of the gas phase; rnuc is the volume fraction of the gas core; pv represents the saturated vapor pressure at room temperature; RB represents the bubble radius at the nucleation position; and Fvap and Fcond represent the empirical parameters in the gasification and compression process, respectively. The parameters are set as follows: rnuc = 5 × 10⁻⁴, pv = 3574 Pa, RB = 1 × 10⁻⁶ m, Fvap = 50, and Fcond = 0.01.

2.5. Boundary Condition

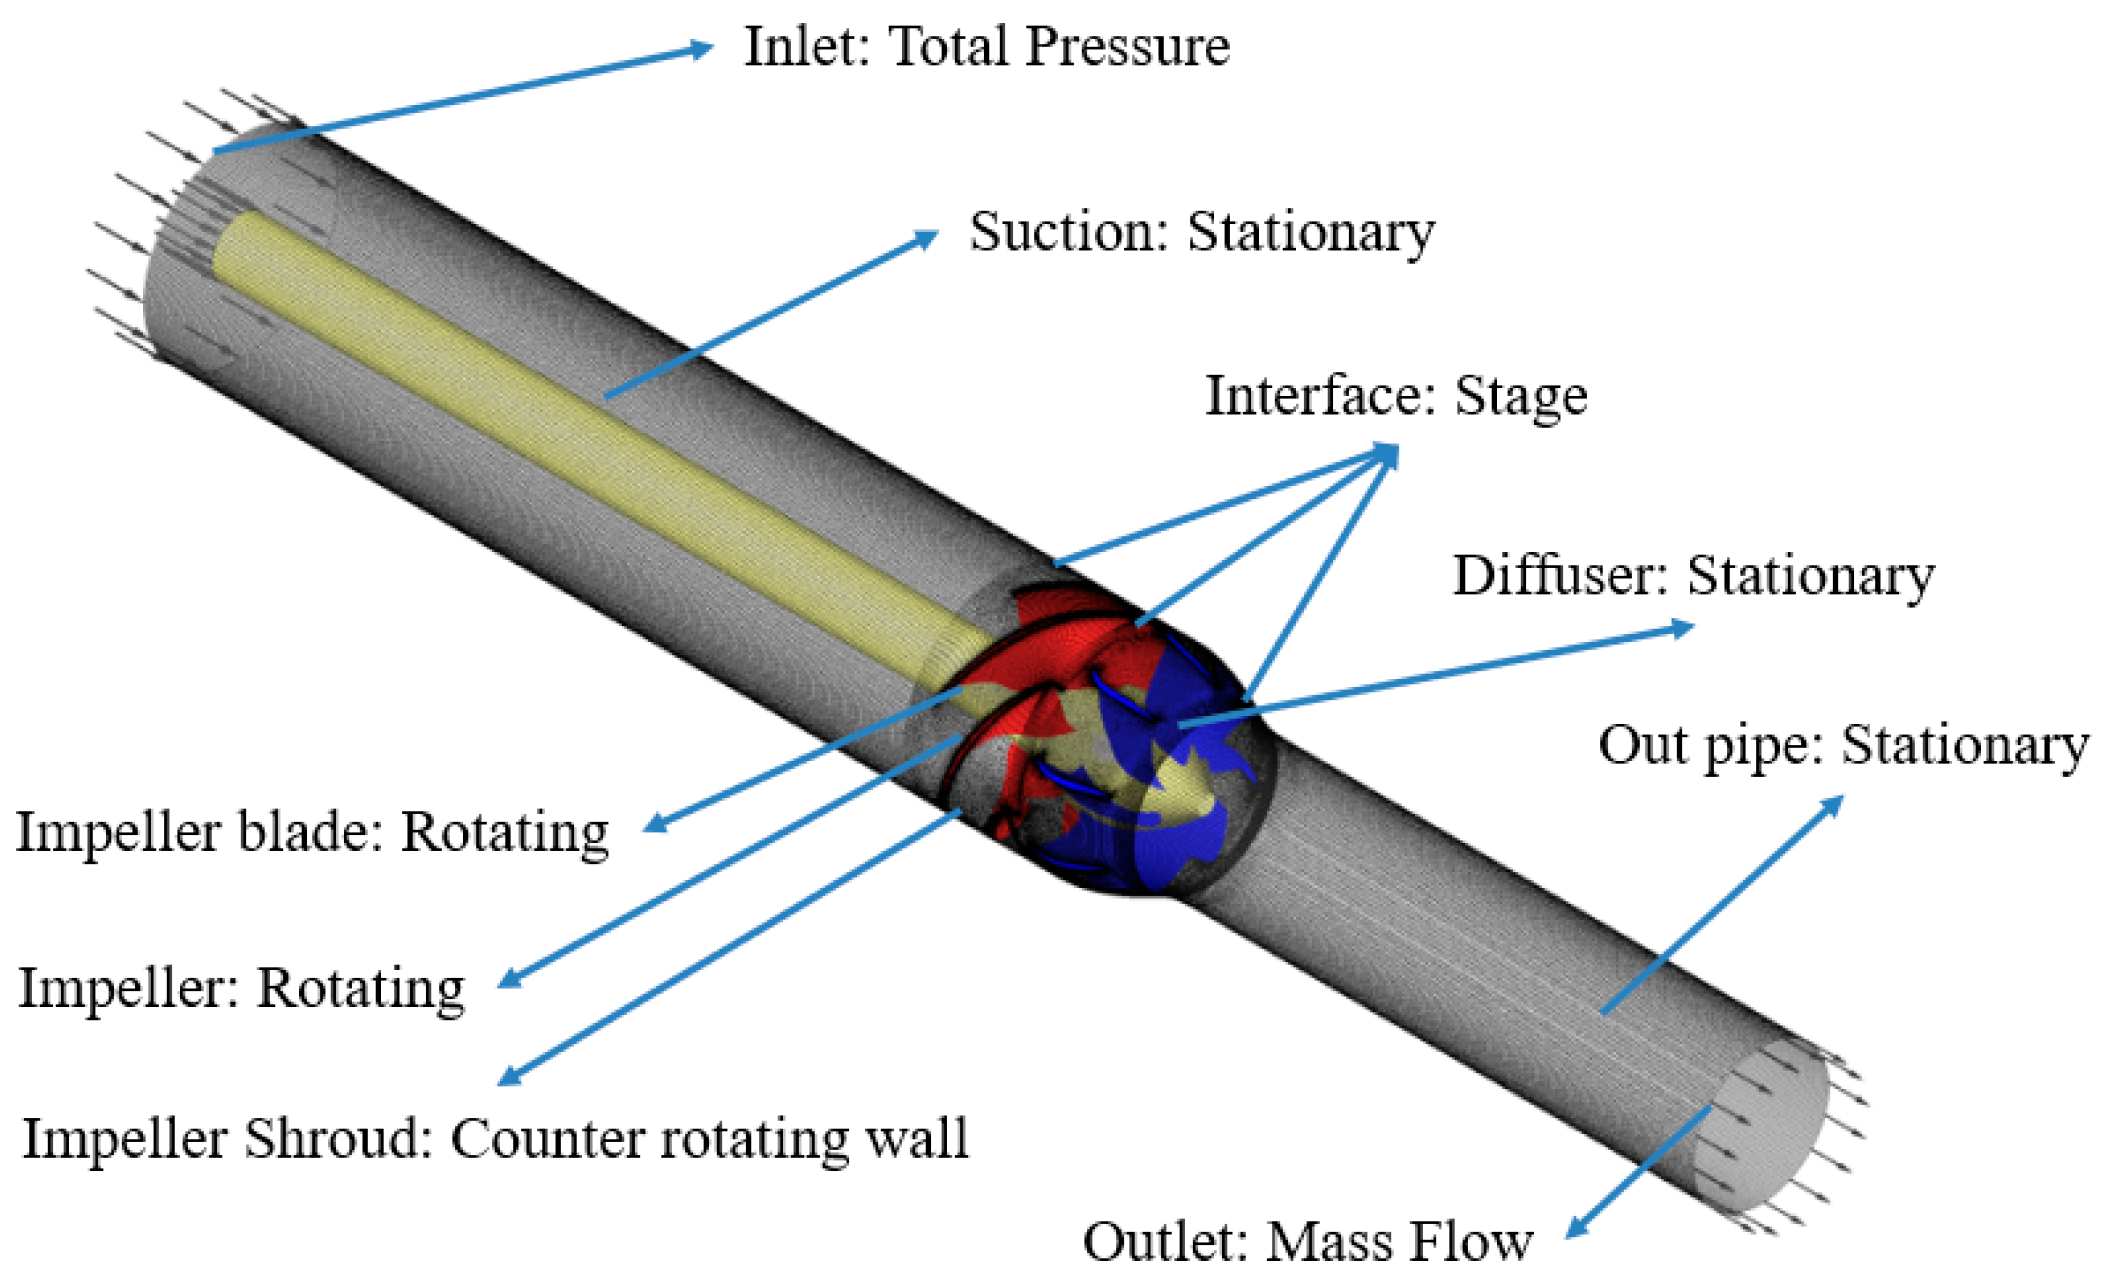
We used the commercial software ANSYS CFX 2021 R1 to calculate the three-dimensional cavitation flow of the mixed flow in the jet pump. The turbulence model uses the k-ε model. The cavitation model uses the ZGB model integrated in ANSYS CFX. The calculated liquid phase is 25 °C water, with a density of 997 kg/m3 and a dynamic viscosity of 8.899 × 10⁻⁴ kg·m−1·s−1. When cavitation occurs, the vapor phase uses the 25 °C water vapor, and its density is 0.02308 kg/m3, the dynamic viscosity is 9.8626 × 10⁻⁶ kg·m−1·s−1, and the saturated vapor pressure is set to 3169 Pa. The residual value is set such that when it is less than 10−5, the judgment result is convergence. We monitor the hydraulic head and efficiency until their values remain constant. At a certain inflow flow rate, the inlet boundary condition uses a pressure inlet and the inlet turbulence is set to Medium (intensity = 5%). The outlet boundary condition uses the mass outflow. The wall boundary conditions use no-slip walls. The impeller computational domain is set to rotate at 1450 r/min; the blades and hub are set to rotate; the rim wall speed is set to the Counter rotating wall; and the diffuser, suction, and outlet pipe are set to stationary. The interface between rotating and stationary parts is set to the Frozen Rotor Interface. The convection term format (Advection Scheme Option) is selected as High Resolution. The number of iteration steps is 3000. The specific boundary condition settings are shown in Figure 5.

2.6. Mesh Independence Verification

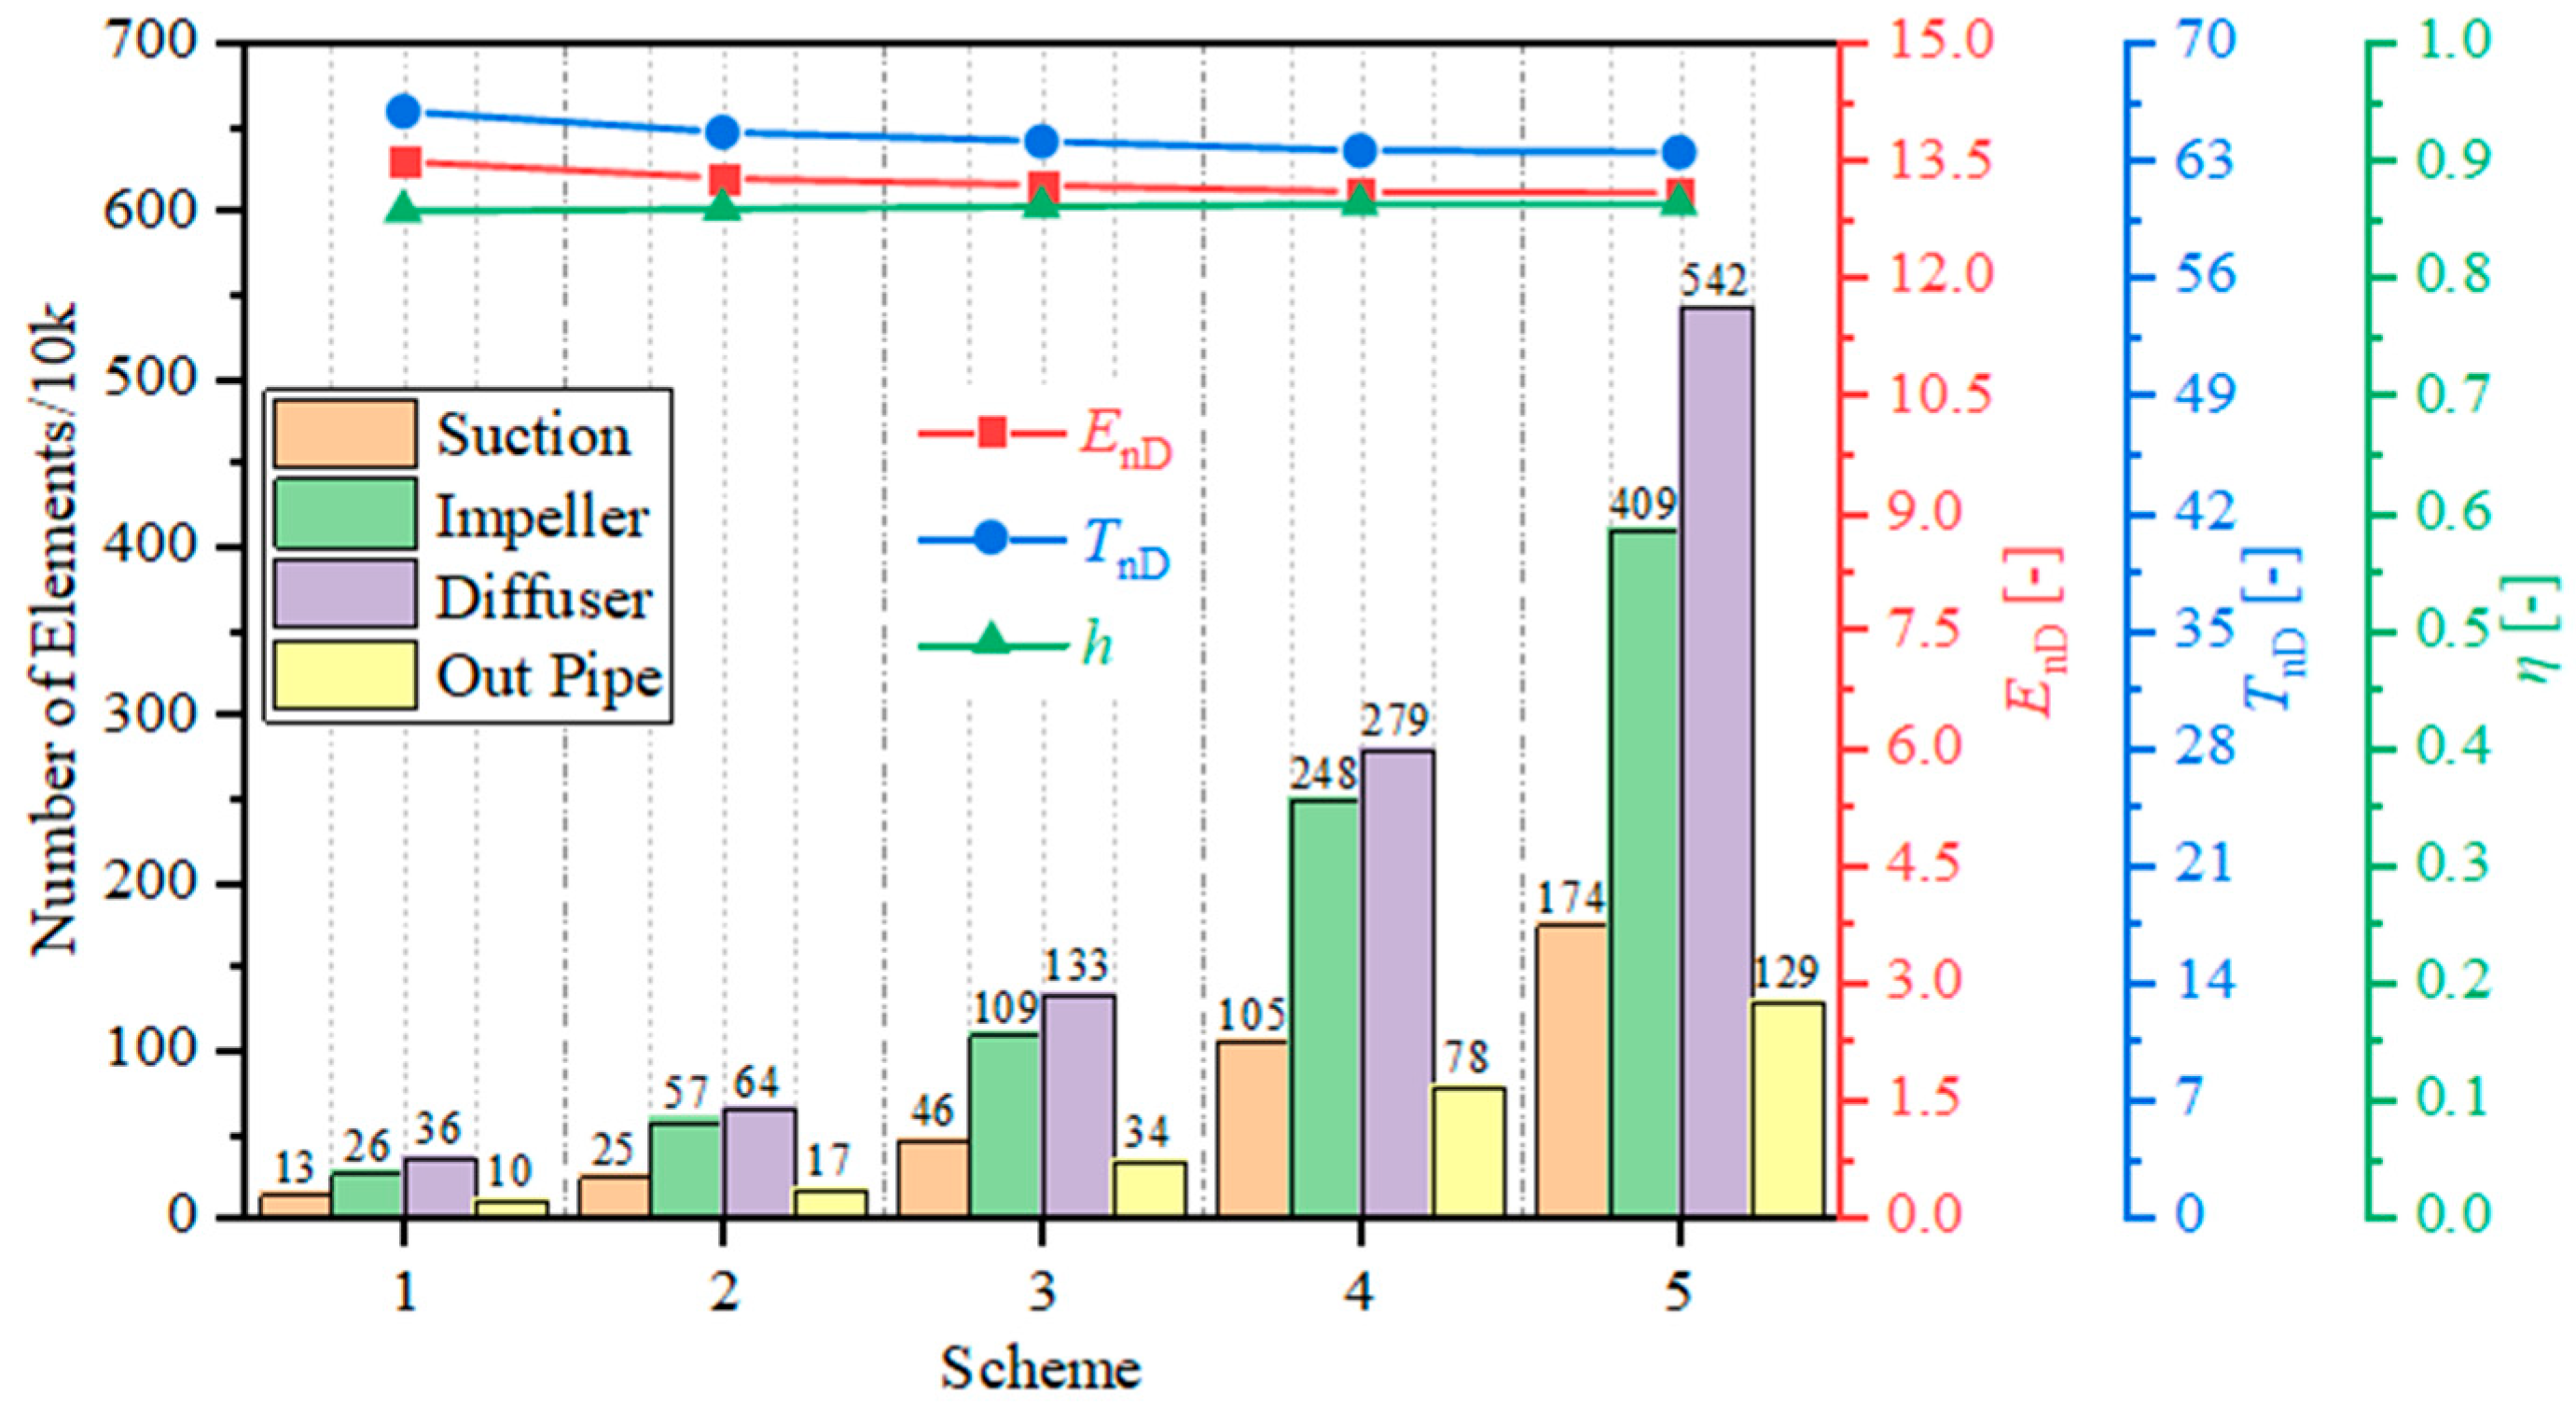
We keep the topological relationship and the height of the first layer of the wall unchanged and adjust the mesh density to generate five sets of mesh schemes for the mesh independence verification. The number of component meshes and the calculation results of each scheme are shown in Figure 6. It can be seen from the figure that as the mesh is continuously refined, the energy coefficient EnD, the torque coefficient TnD, and the efficiency η tend to be stable. The calculation results of Scheme 4 and Scheme 5 are almost identical. However, in order to capture the more detailed flow field structure as much as possible, we selected Scheme 5 for the calculation. The total number of meshes in it is approximately 12.54 million. The number of meshes for components such as the suction, impeller, diffuser, and outlet pipe are approximately 1.74 million, 4.09 million, 5.42 million, and 1.29 million, respectively.

3. Cavitation Experiment

Experimental Bench

The schematic diagram of the comprehensive performance standard test bench of the water jet propulsion pump is shown in Figure 7, and the diameter of the test circuit is DN300.
This experiment was conducted on the closed test bench of Jiangsu University, focusing on the model pump for the hydraulic performance experiment, the cavitation performance experiment, and the high-speed camera shooting. The experiment test system mainly consists of the cavitation tank, the vacuum pump, inlet valves, the test pump section, the electric motor, the booster pump, and the electromagnetic flowmeter. The pump product testing system developed by the TPA R&D Center of Jiangsu University was used for experimental data collection. The testing system has a measured power accuracy of 0.2%, a measured flow rate accuracy of 0.02%, and a pressure measurement accuracy of 0.02%. A high-speed camera, the i-SPEED 3 model from the British brand IX cameras (Rochford, UK), was used for shooting, with a frame rate of 2000 fps and a corresponding image resolution of 1280 × 1024. To observe the cavitation flow pattern in the impeller part of the water jet propulsion pump, the impeller shell is made of organic glass. To reduce the image distortion caused by light refraction, the impeller shell is designed with a circular inner part and a square outer part.
The cavitation test was conducted on a closed test bench. The speed-regulating motor was adjusted to the test rotational speed, and the flow rate was regulated to the test operating point. After the pump operated stably, the vacuum pump was started to evacuate the cavitation tank, gradually reducing the pressure at the pump inlet to induce cavitation inside the pump. The process of the pump head curve decreasing under different inlet pressures was recorded, and the corresponding inlet pressures of the pump under different operating conditions were determined according to the head curve. By controlling the vacuum pump to evacuate and adjusting the valves, the inlet pressure was adjusted to the inlet pressure corresponding to different cavitation stages at the current flow operating point, and the high-speed camera was turned on to capture the cavitation flow state inside the pump at different cavitation stages.
The core purpose of this experimental platform is to obtain the hydraulic performance curves of the water jet propulsion pump under different rotational speeds and flow rates. By measuring the critical net positive suction head, it evaluates the flow characteristics at different cavitation stages. Through high-speed photography, it reveals the internal flow mechanism under cavitation conditions, providing an experimental basis for the verification of numerical simulations and structural optimization.

4. Different Airfoil Schemes

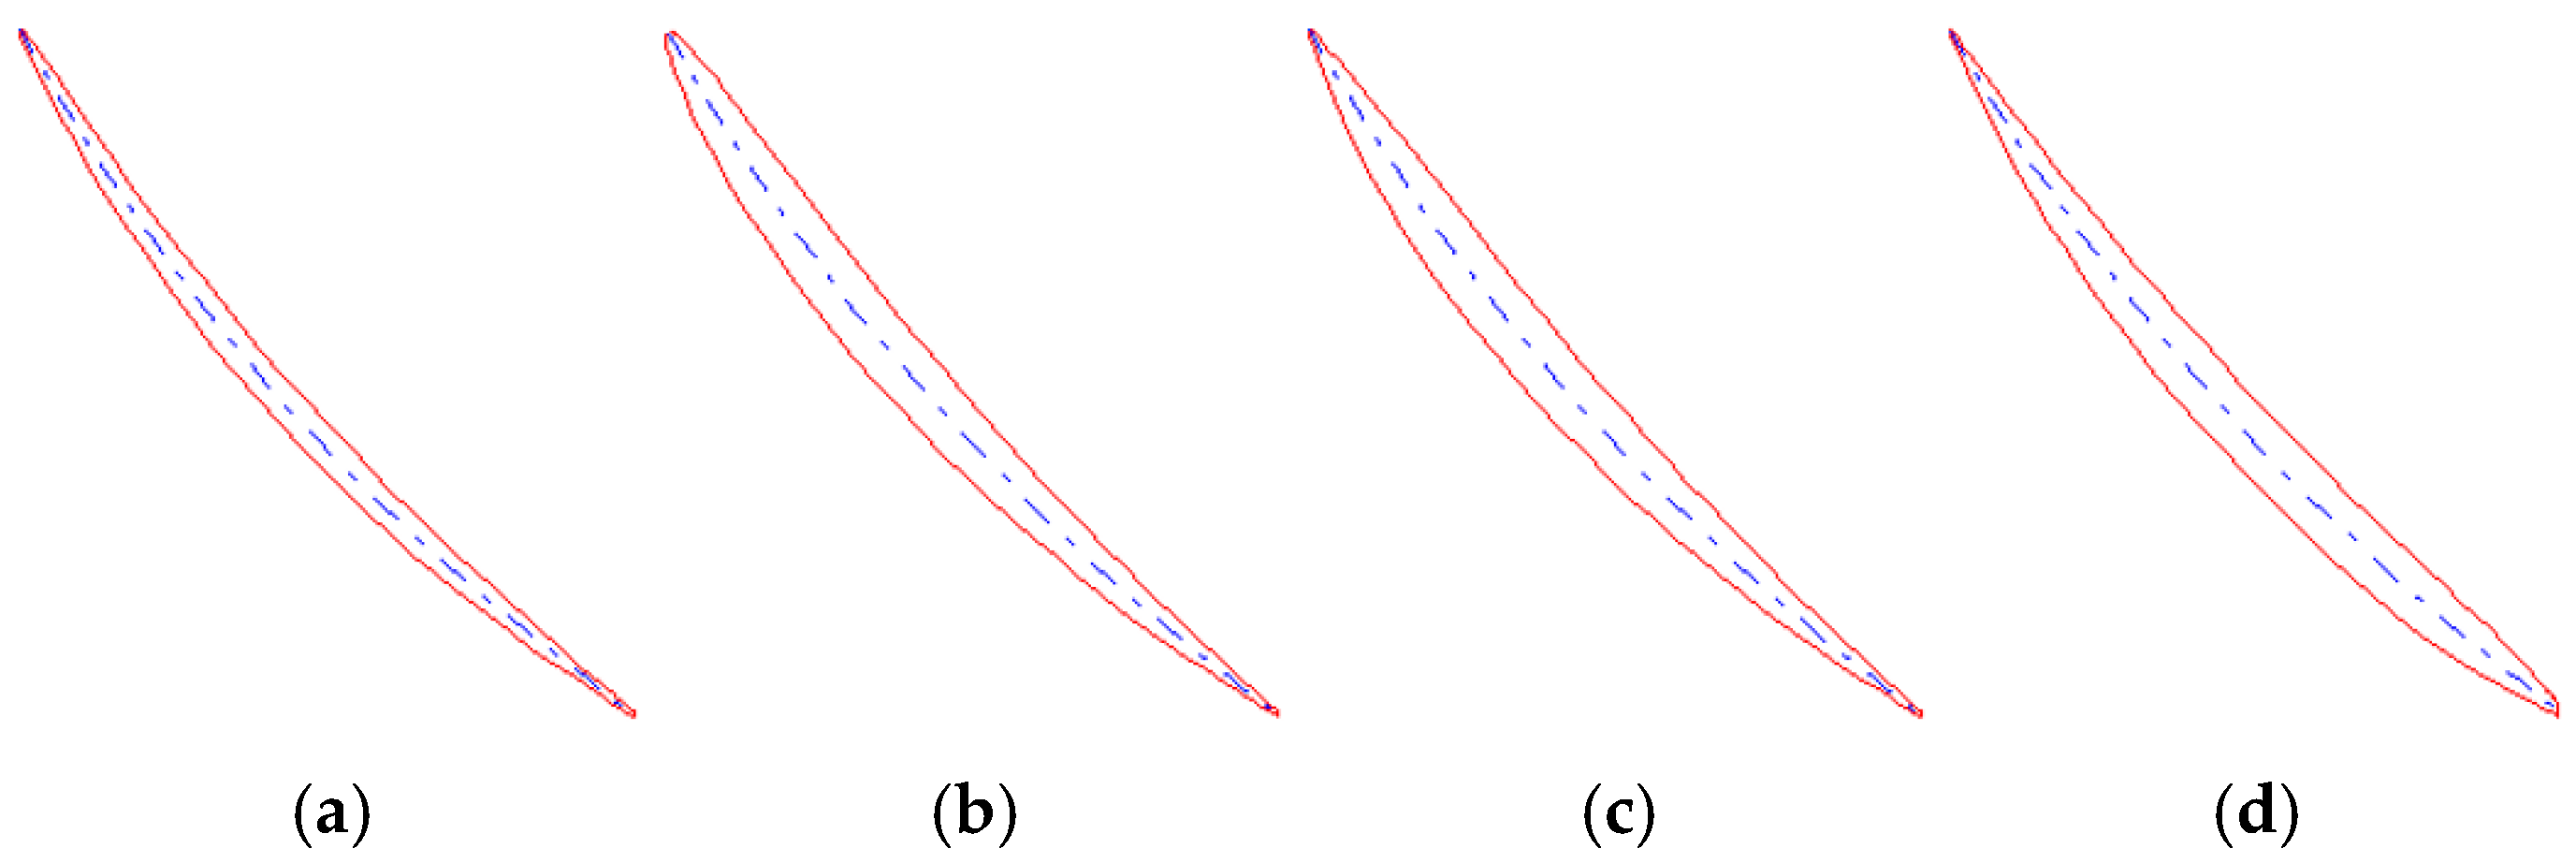
Parametric modifications involving varying airfoil thickness distributions along the spanwise direction were implemented based on the baseline OPT-19M design. Figure 8 illustrates the specific spanwise thickness distributions applied to the modified models.
Scheme 1: A spanwise-varying thickness distribution was implemented, transitioning linearly from the NACA0009 profile at the blade root to the NACA0004 profile at the blade tip.
Scheme 2: Similarly, a spanwise-varying thickness distribution was applied, transitioning from the NACA0009-13 profile at the root to the NACA0004-13 profile at the tip. These modified NACA profiles feature a maximum thickness located at 30% of the chord length and exhibit a reduced leading-edge thickness compared to the profiles in Scheme 1.
Scheme 3: Employing the same spanwise transition principle, this scheme utilizes profiles ranging from NACA0009-16 at the root to NACA0004-16 at the tip. The NACAxxxx-16 profiles are characterized by a maximum thickness position at 60% of the chord and possess a leading-edge thickness equivalent to that of the NACAxxxx-13 profiles used in Scheme 2.

5. Result Analysis

5.1. Cavitation Performance Test

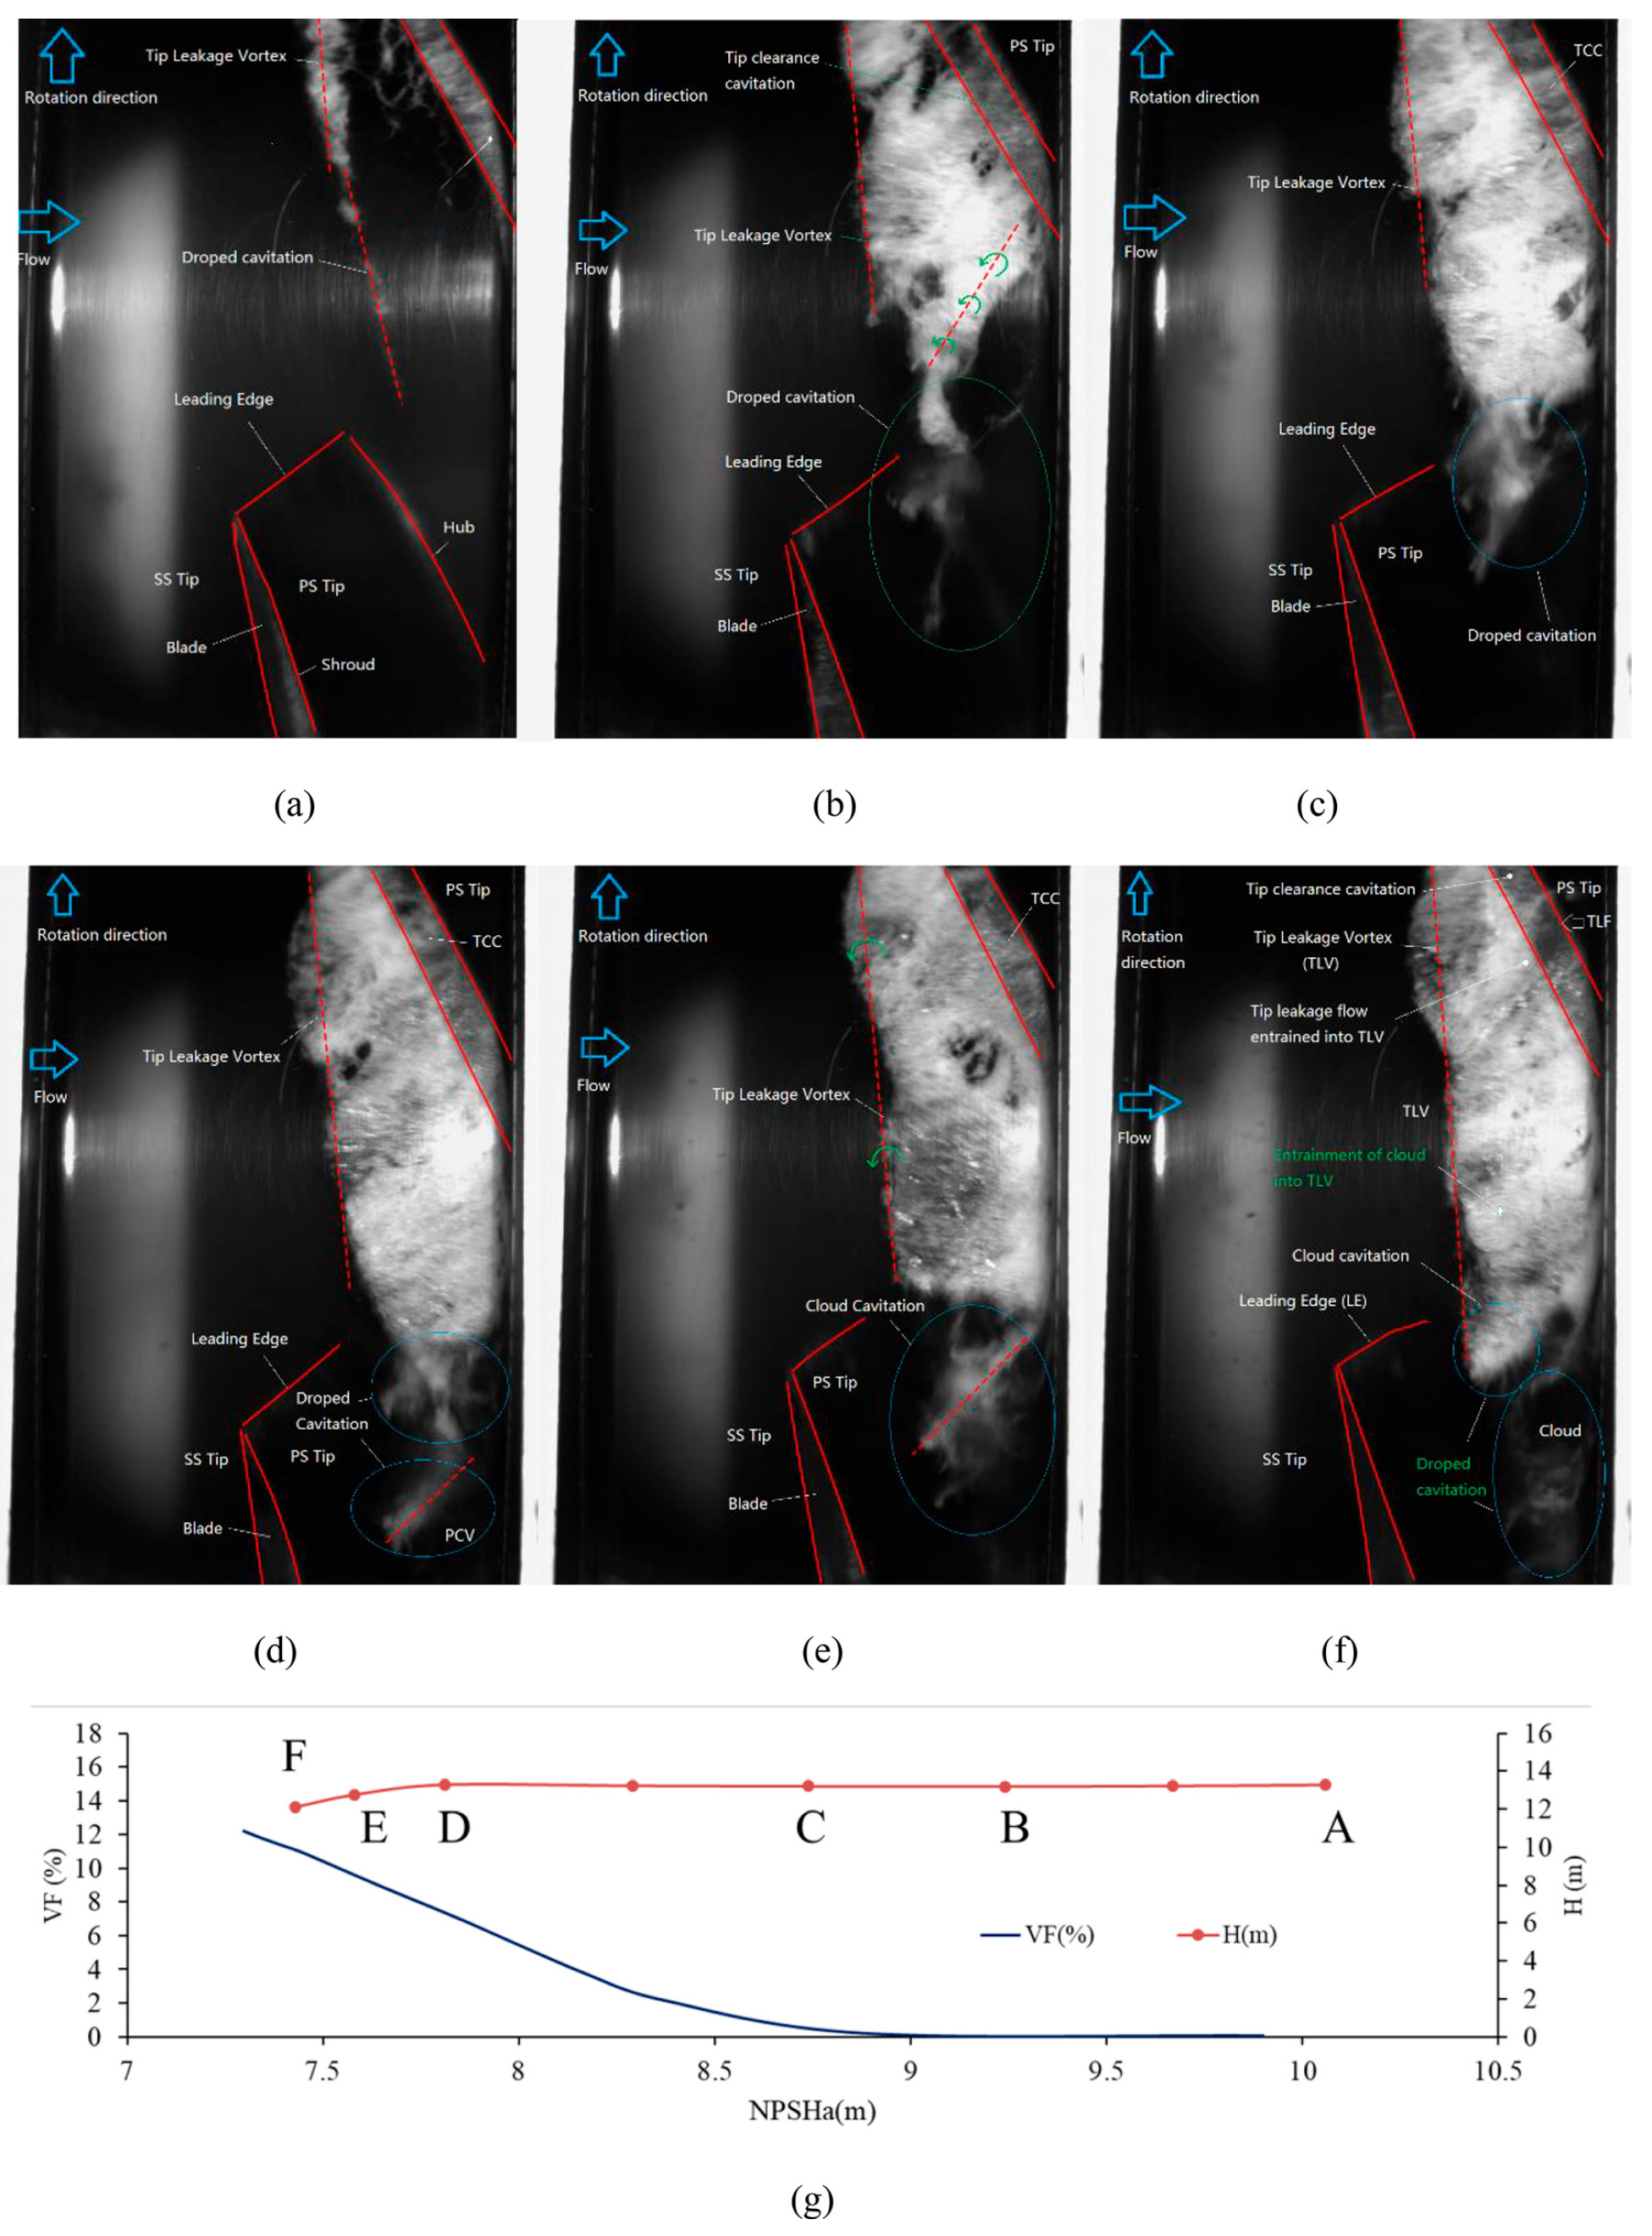
Regarding the cavitation performance test, which our team has already published in a related paper [2], Figure 9 illustrates experimentally observed cavitation structures within the water jet propulsion pump under the design conditions.

5.2. Cavitation Flow Analysis

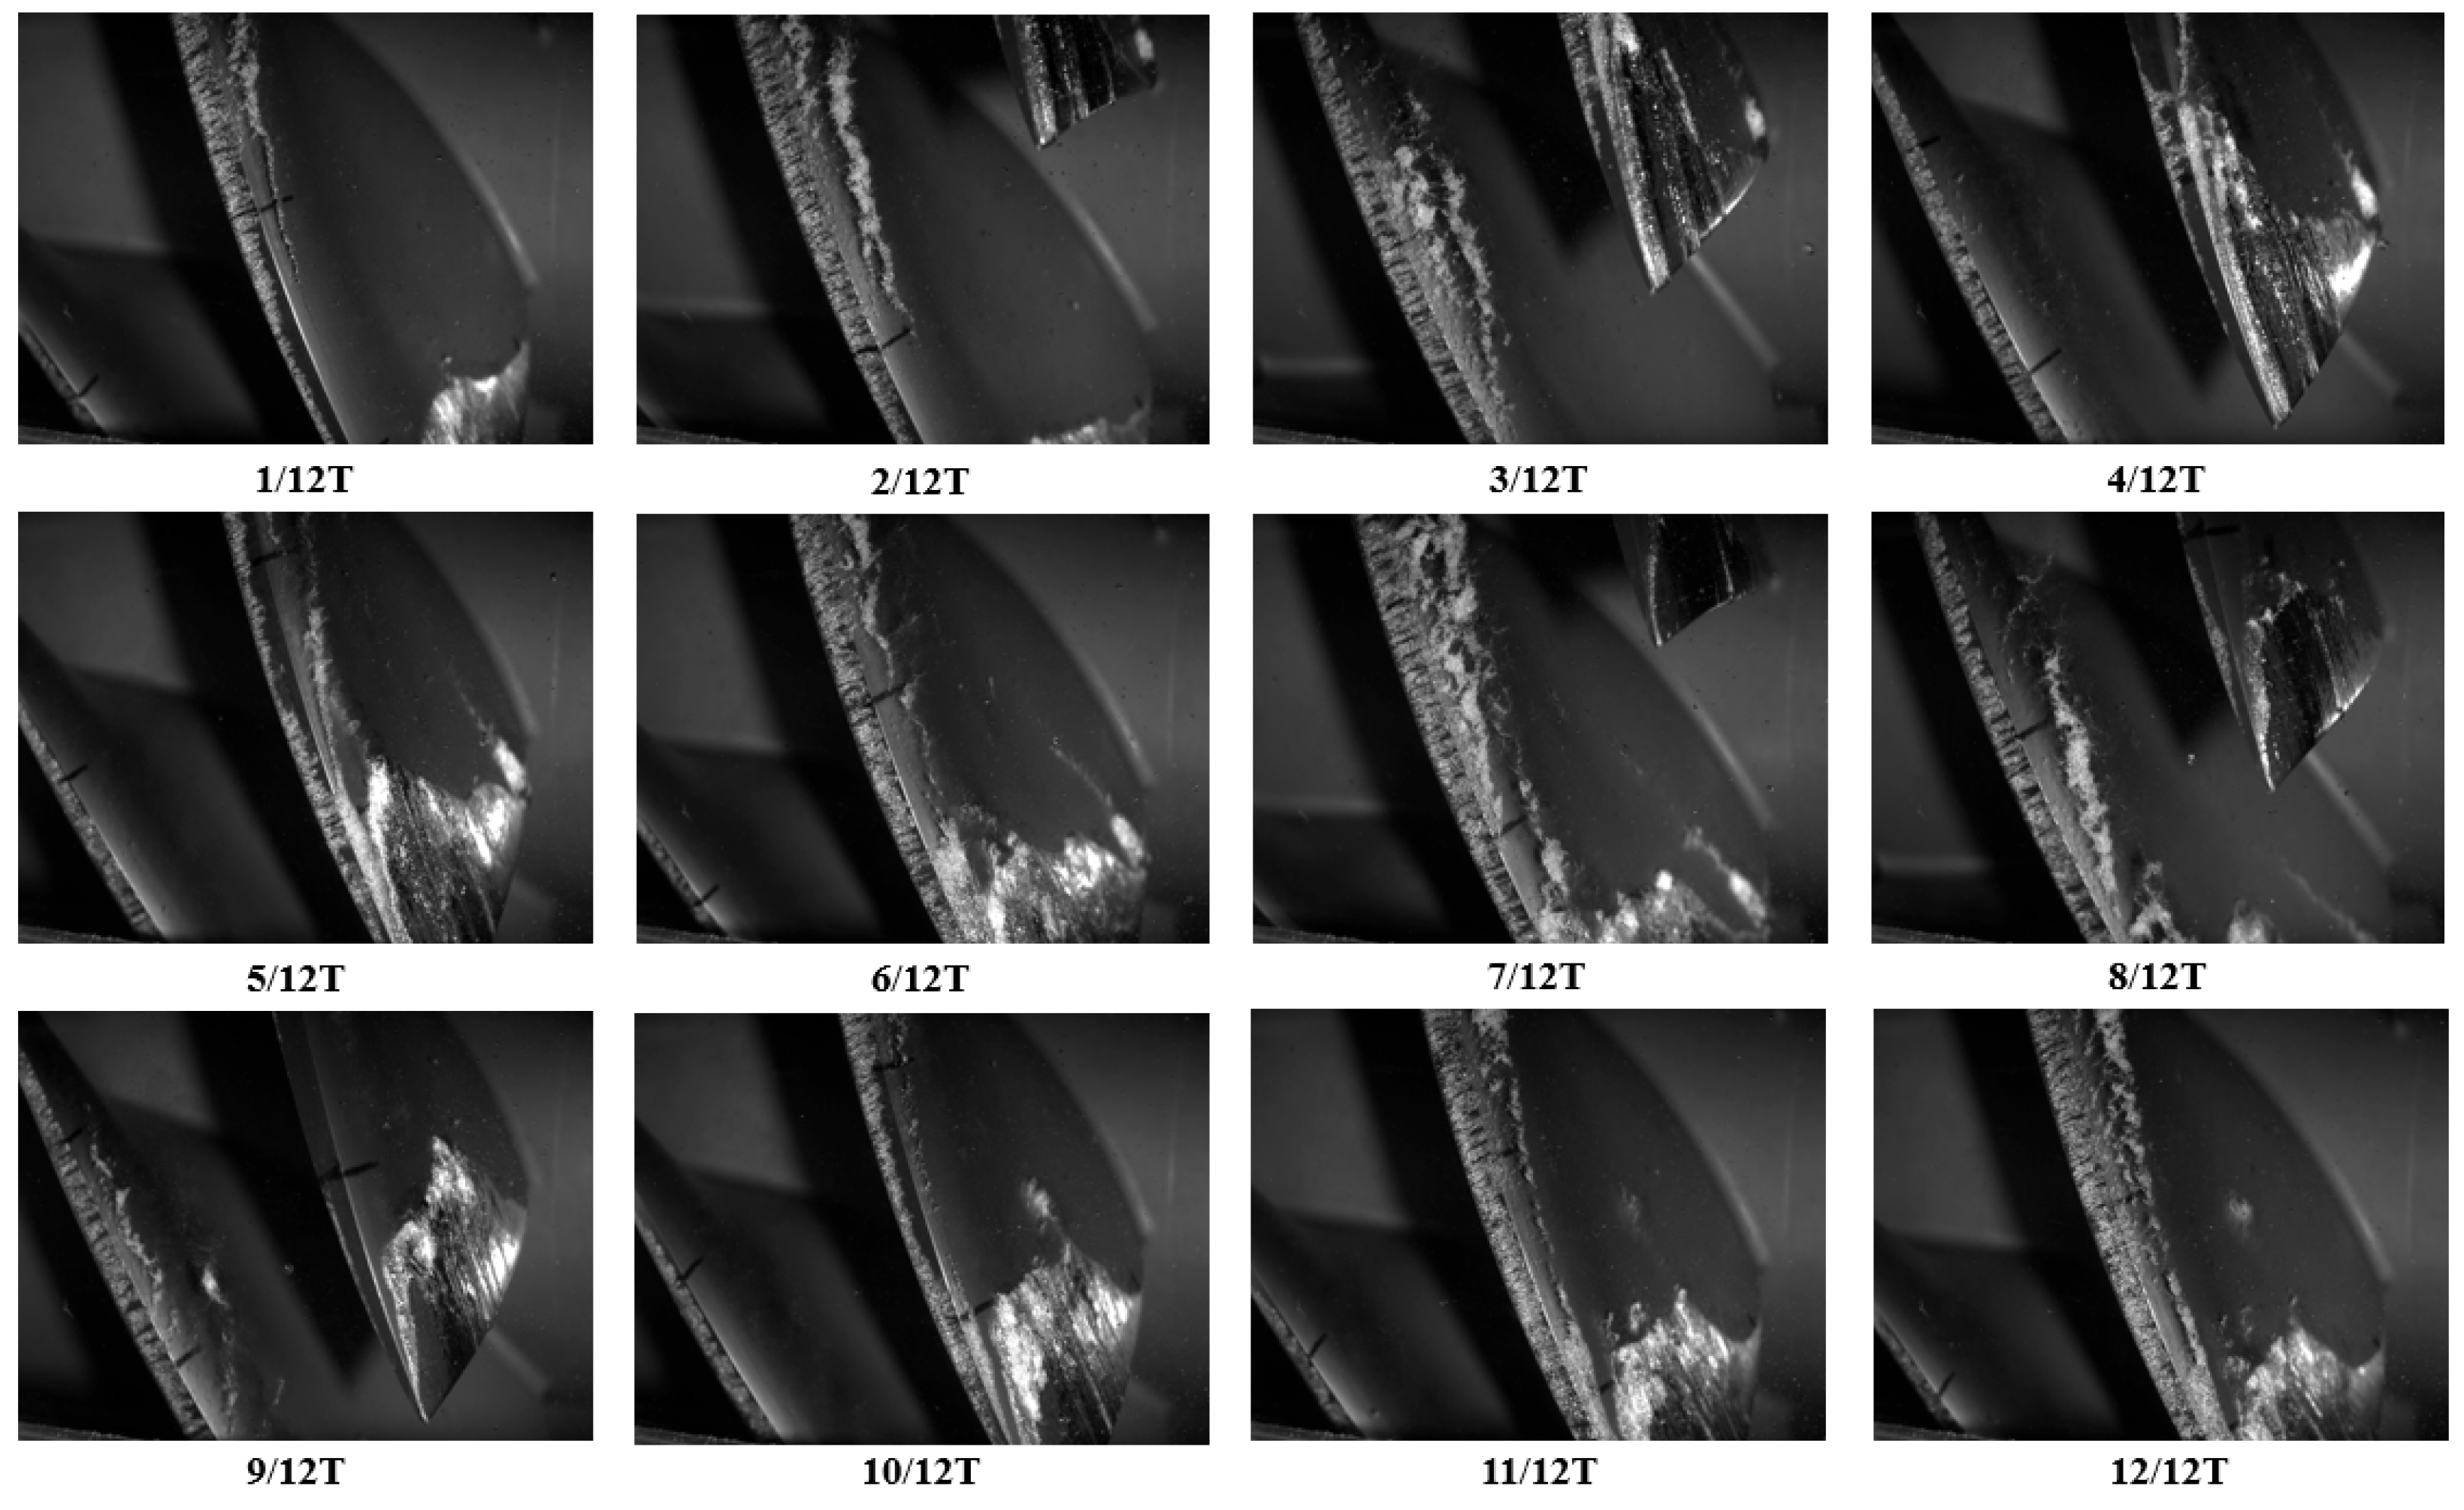
Figure 10 presents the visualization and evolution of the cavitation flow in the water jet propulsion pump (T/12 intervals). During the initial stage of cavitation development (t/T = 1/12 to 3/12), the tip clearance cavitation (TCC) was observed to initiate along the blade tip edge. The formation and rotation of the tip leakage vortex (TLV) create a low-pressure region within the tip clearance, triggering the nucleation of incipient cavitation bubbles. The suction surface of the blade appears as sheet-like and filament-like bright spots, generating sheet cavitation. The tip leakage vortex (TLV) entrains the sheet cavitation into the tip vortex band, forming tip leakage vortex entrained cavitation. During the cavitation development phase (t/T = 4/12 to 8/12), a triangular cloud cavitation emerges and evolves in the region adjacent to the blade tip leading edge suction surface and the interface of the tip leakage vortex (TLV). Opposite to the impeller rotation, vortex filaments near the blade tip extend tangentially and subsequently disintegrate. This behavior is consistent with the rotation of the tip leakage vortex (TLV) band, governed by the right-hand rule. There are also vortex filaments detached from the blade tip in the part of the blade suction surface close to the blade tip. During the cavitation shedding and interaction phase (t/T = 9/12 to 12/12), highly reflective regions characterized by cloud-like structures and transient, disintegrated flow patterns emerged in the inter-blade region. These patterns resulted from the intersection between the cloud cavitation shed from the preceding blade and the suction surface of the current blade. That is, the cavitation moves with the flow field, forming a cross-blade effect in the flow channel. Near the pressure surface of the blade, there are bright spots and vortex textures perpendicular to the blade surface, which are the perpendicular cavitation vortices (PCVs). The visualized cavitation flow in the water jet propulsion pump at different moments also reflects that the cavitation vortex system has a certain complexity.

5.3. Influence of Airfoil on Cavitation Performance

5.3.1. Original Model

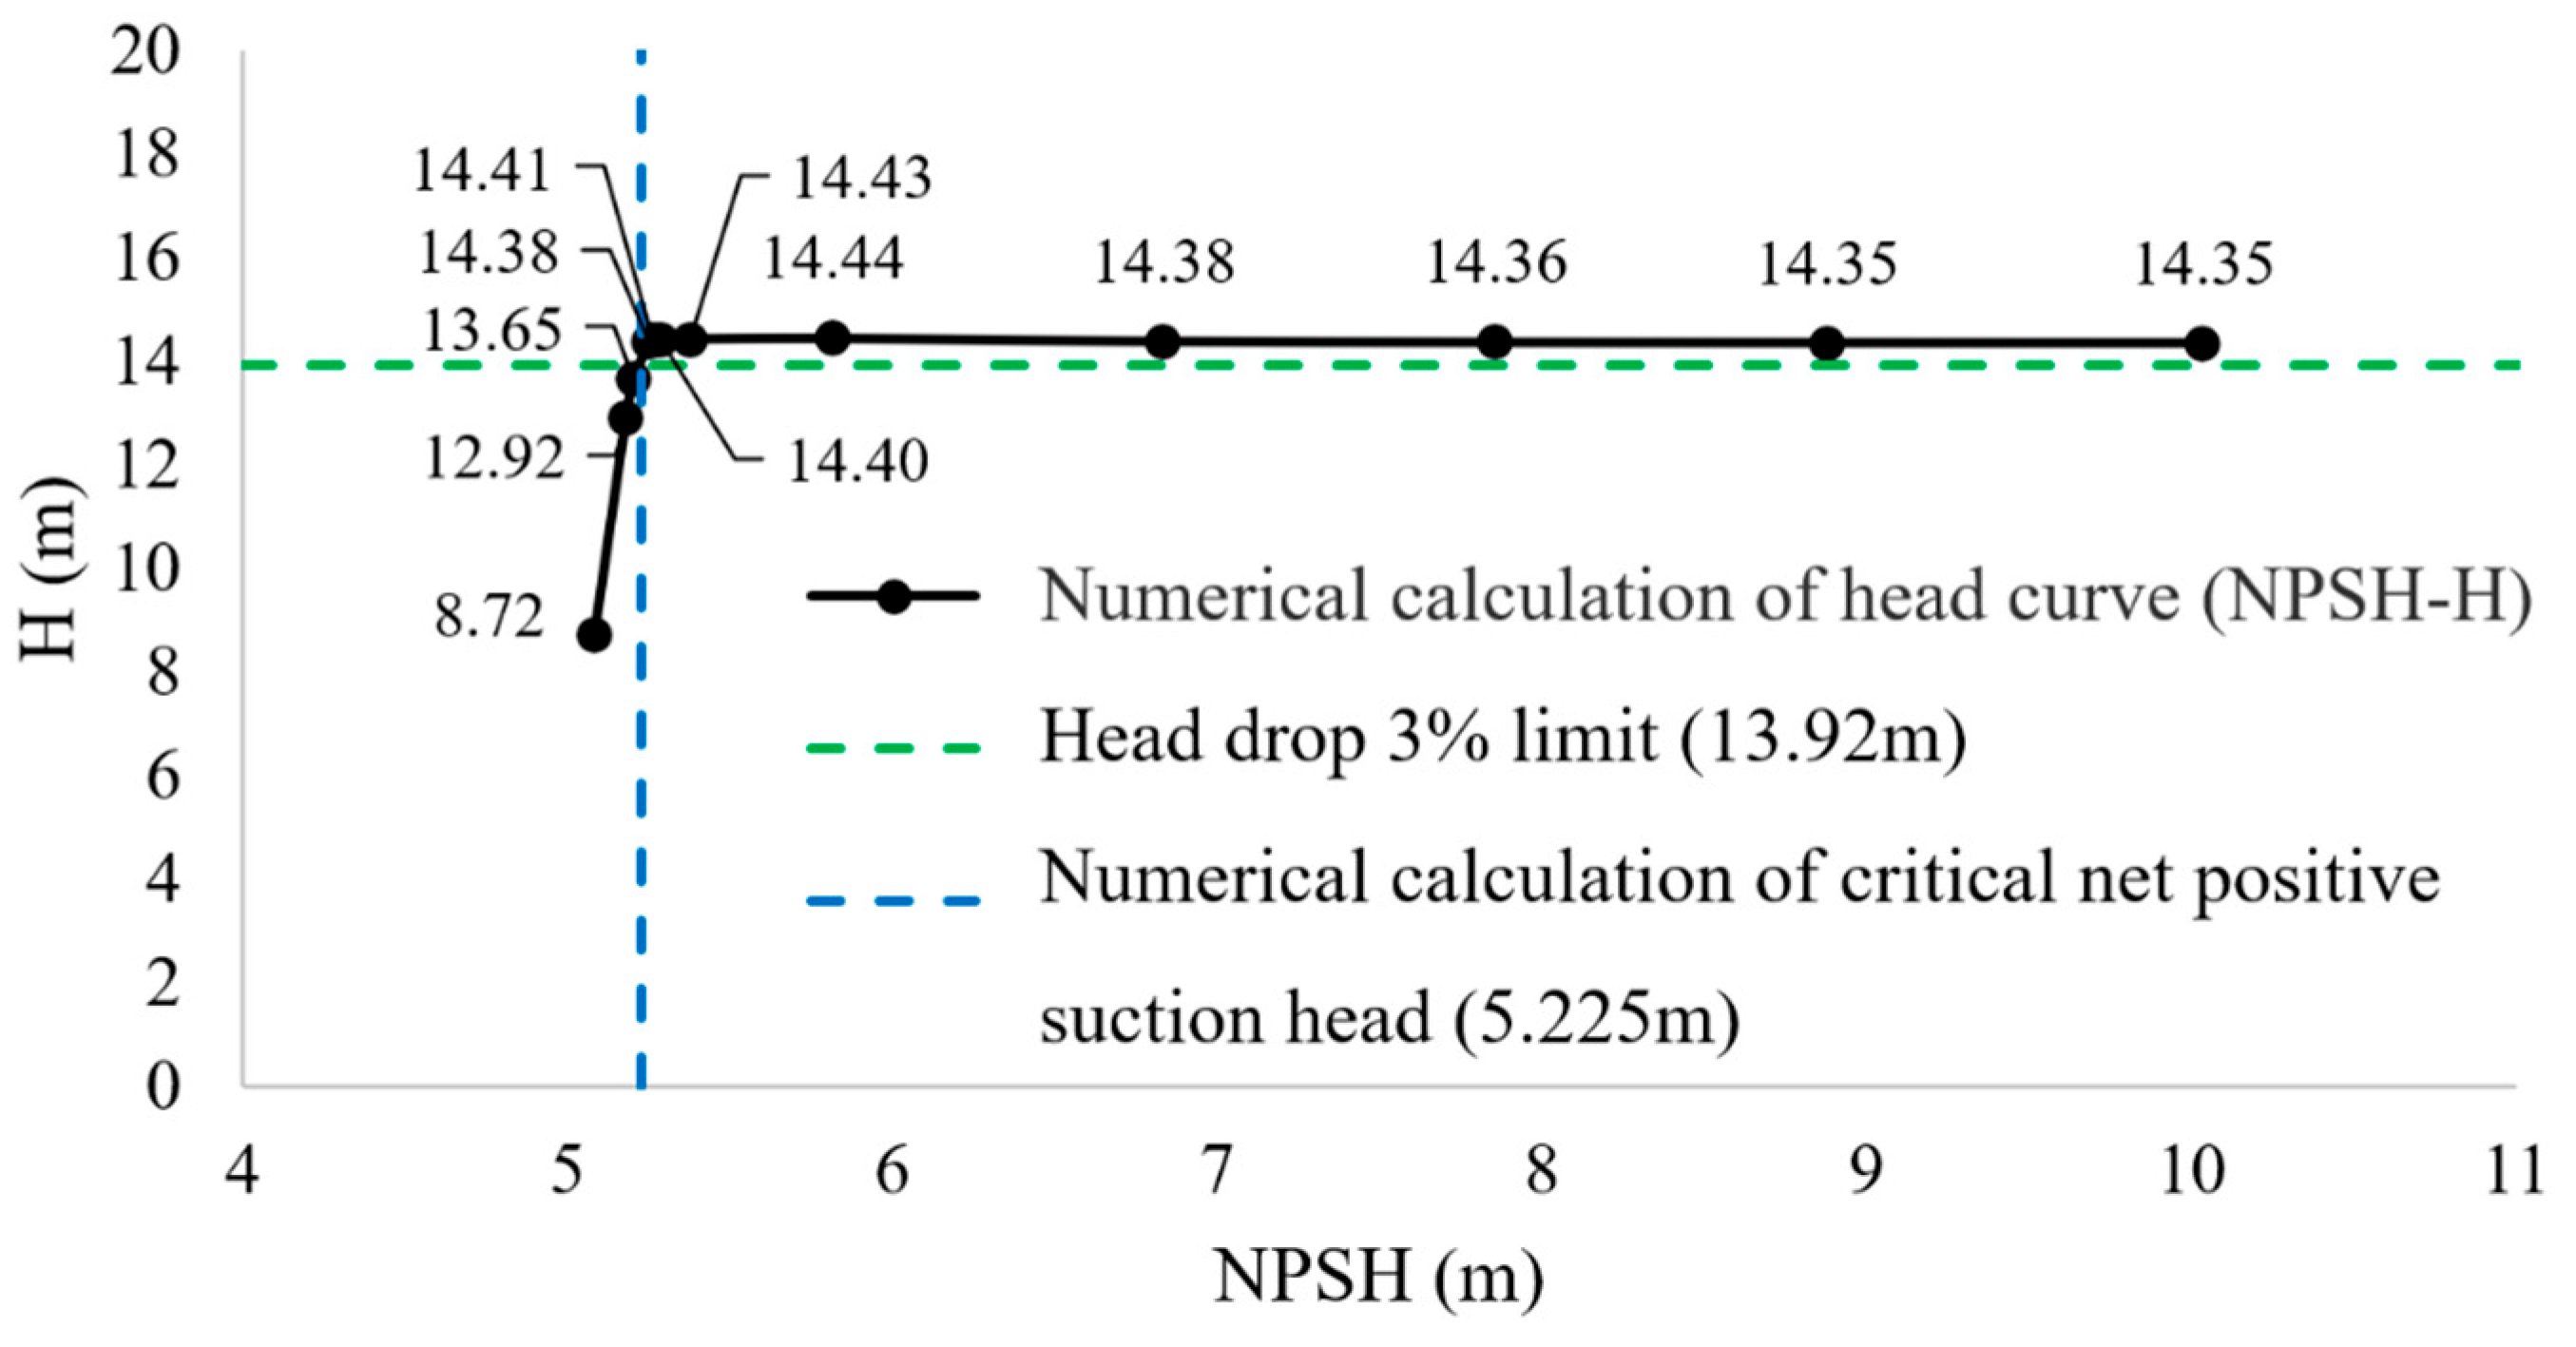
For the original model which has a non-standard airfoil thickness, by calculating the data such as the efficiency, head, and net positive suction head (NPSH) of the original model impeller under the inlet pressures, from 101,325 Pa down to 52,500 Pa, the calculation results under different inlet pressures are shown in Table 2. Based on these numerical calculation results, the cavitation performance curve is presented in Figure 11.
At the design point under an inlet pressure of 101,325 Pa, the baseline pump delivers a head of 14.35 m. With the decreasing inlet pressure, both the pump efficiency and head drop progressively. The critical 3% head drop threshold occurs at a head of 13.92 m, corresponding to an inlet pressure range from 54,000 Pa to 54,250 Pa. The intersection of the 3% head drop criterion and the NPSH-versus-head (NPSH-H) curve yields the required NPSH (NPSHr) of approximately 5.225 m. That is to say, for the original model impeller, the critical net positive suction head of the model pump is about 5.225 m.

5.3.2. NACA0009_0004 Airfoil

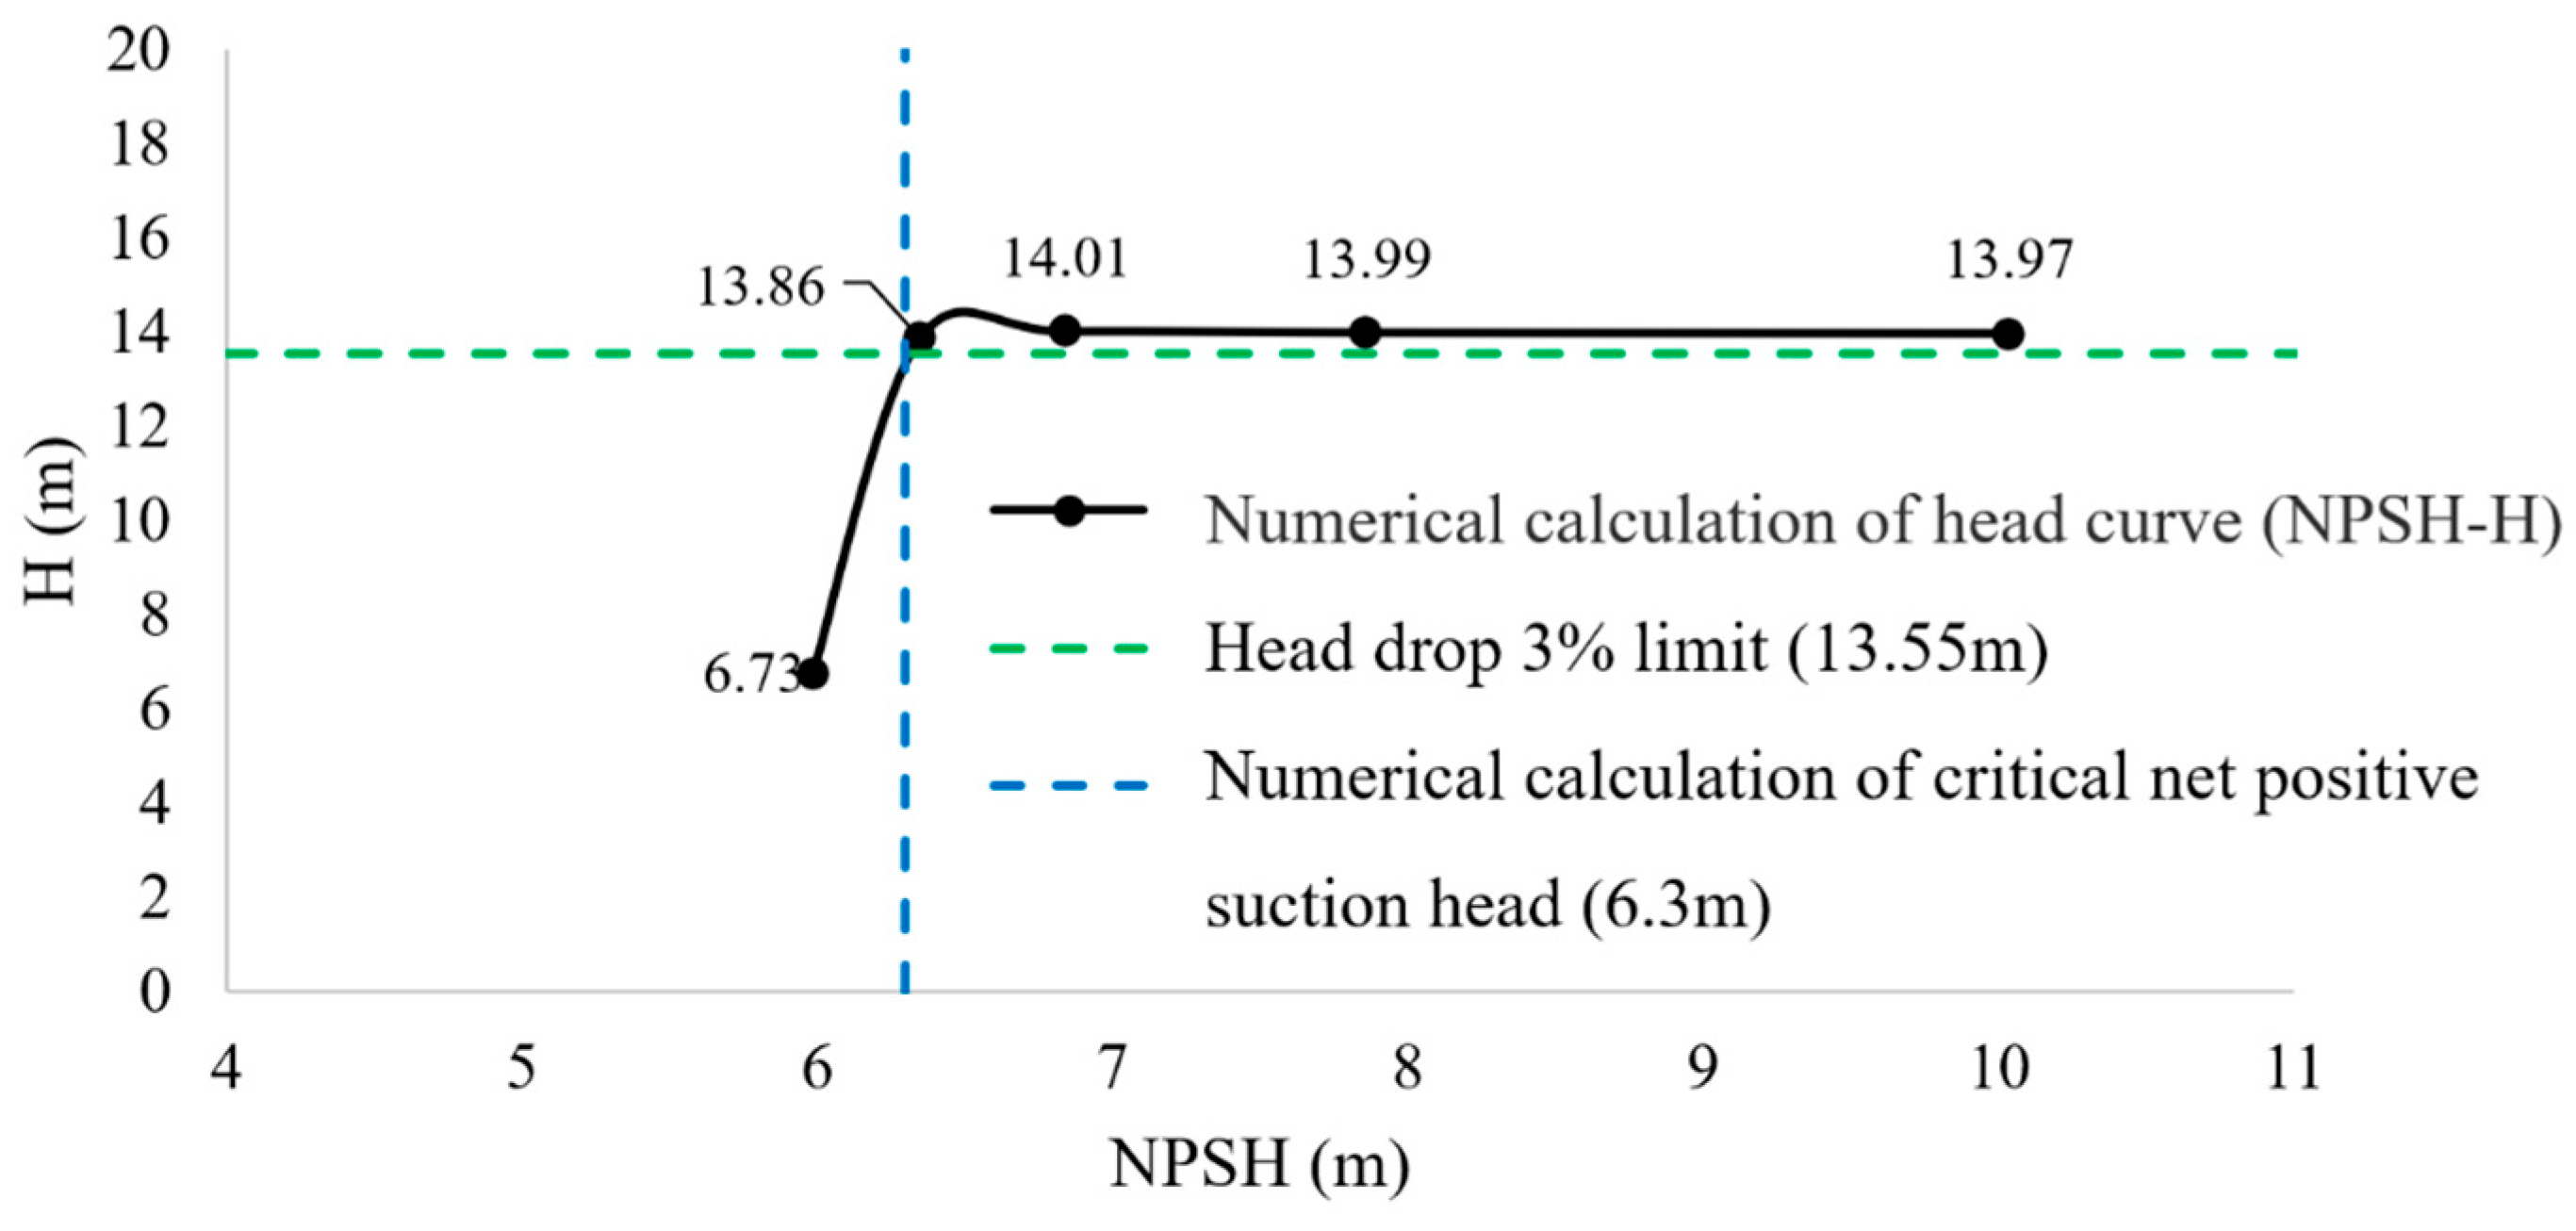
Scheme 1 implements a linear spanwise transition in the airfoil thicknesses, varying from the NACA0009 profile at the blade root to the NACA0004 profile at the blade tip. By calculating the data such as the efficiency, head, and net positive suction head (NPSH) of the original model impeller under the inlet pressures, from 101,325 Pa down to 60,000 Pa, the calculation results under different inlet pressures are shown in Table 3. According to the numerical calculation results, the cavitation performance curve is shown in Figure 12.
At the design point under 101,325 Pa, the modified impeller (Scheme 1) delivers a head of 13.97 m. As the inlet pressure decreases gradually, both the efficiency and the head decline progressively. For Scheme 1, the critical 3% head drop threshold occurs at a head of 13.55 m, corresponding to an inlet pressure range from 60,000 Pa to 65,000 Pa. For Scheme 1, the intersection of the 3% head drop criterion and the NPSH-versus-head (NPSH-H) curve yields the required NPSH (NPSHr) of approximately 6.3 m. That is to say, for the original model impeller, the critical net positive suction head of the model pump is about 6.3 m.

5.3.3. NACA0009-13_0004-13 Airfoil

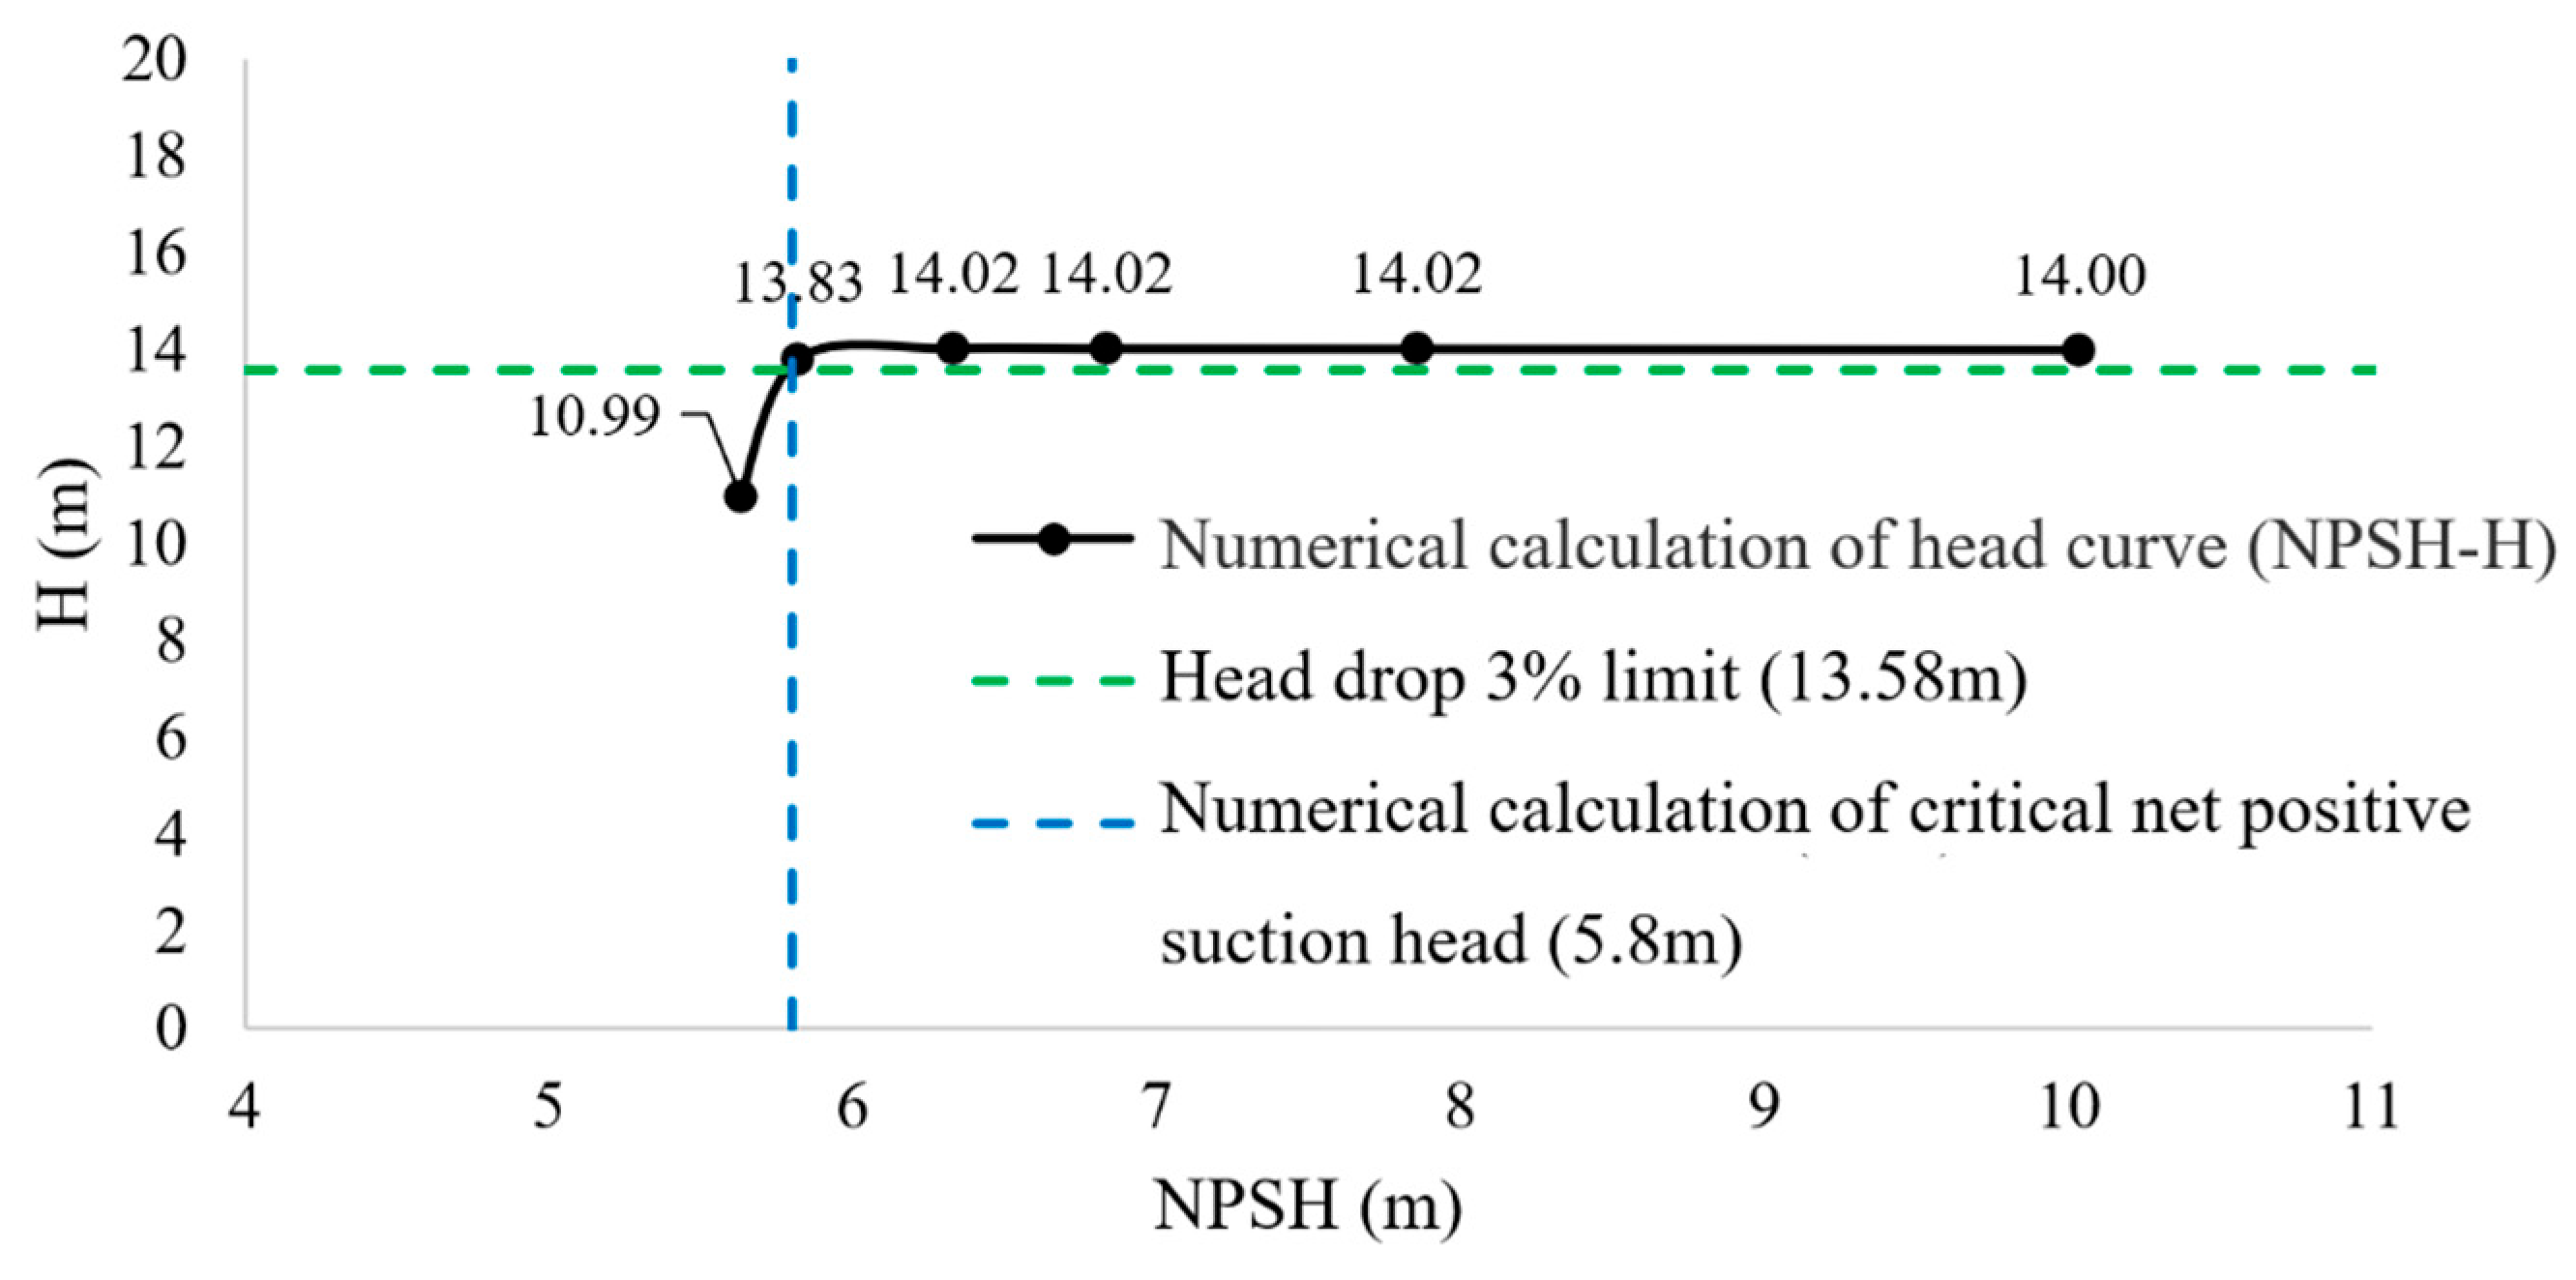
Scheme 2 implements a linear spanwise transition in airfoil thicknesses, utilizing profiles ranging from NACA0009-13 at the blade root to NACA0004-13 at the blade tip. The maximum thickness of this type of airfoil is located at 0.3 times the chord length, and the thickness of the leading edge is smaller than that in Scheme 1. By calculating the data such as the efficiency, head, and net positive suction head (NPSH) of the original model impeller under the inlet pressures, from 101,325 Pa down to 57,500 Pa, the calculation results under different inlet pressures are shown in Table 4. According to the numerical calculation results, the cavitation performance curve is shown in Figure 13.
At the design point under 101,325 Pa, the modified impeller (Scheme 2) delivers a head of 14.00 m. As the inlet pressure gradually decreases, both the efficiency and the head gradually decline. For Scheme 1, the critical 3% head drop threshold occurs at a head of 13.55 m, corresponding to an inlet pressure range from 57,500 Pa to 60,000 Pa. For Scheme 2, the intersection of the 3% head drop criterion and the NPSH-versus-head (NPSH-H) curve yields the required NPSH (NPSHr) of approximately 6.3 m. That is to say, for the original model impeller, the critical net positive suction head of the model pump is about 5.8 m.

5.3.4. NACA0009-16_0004-16 Airfoil

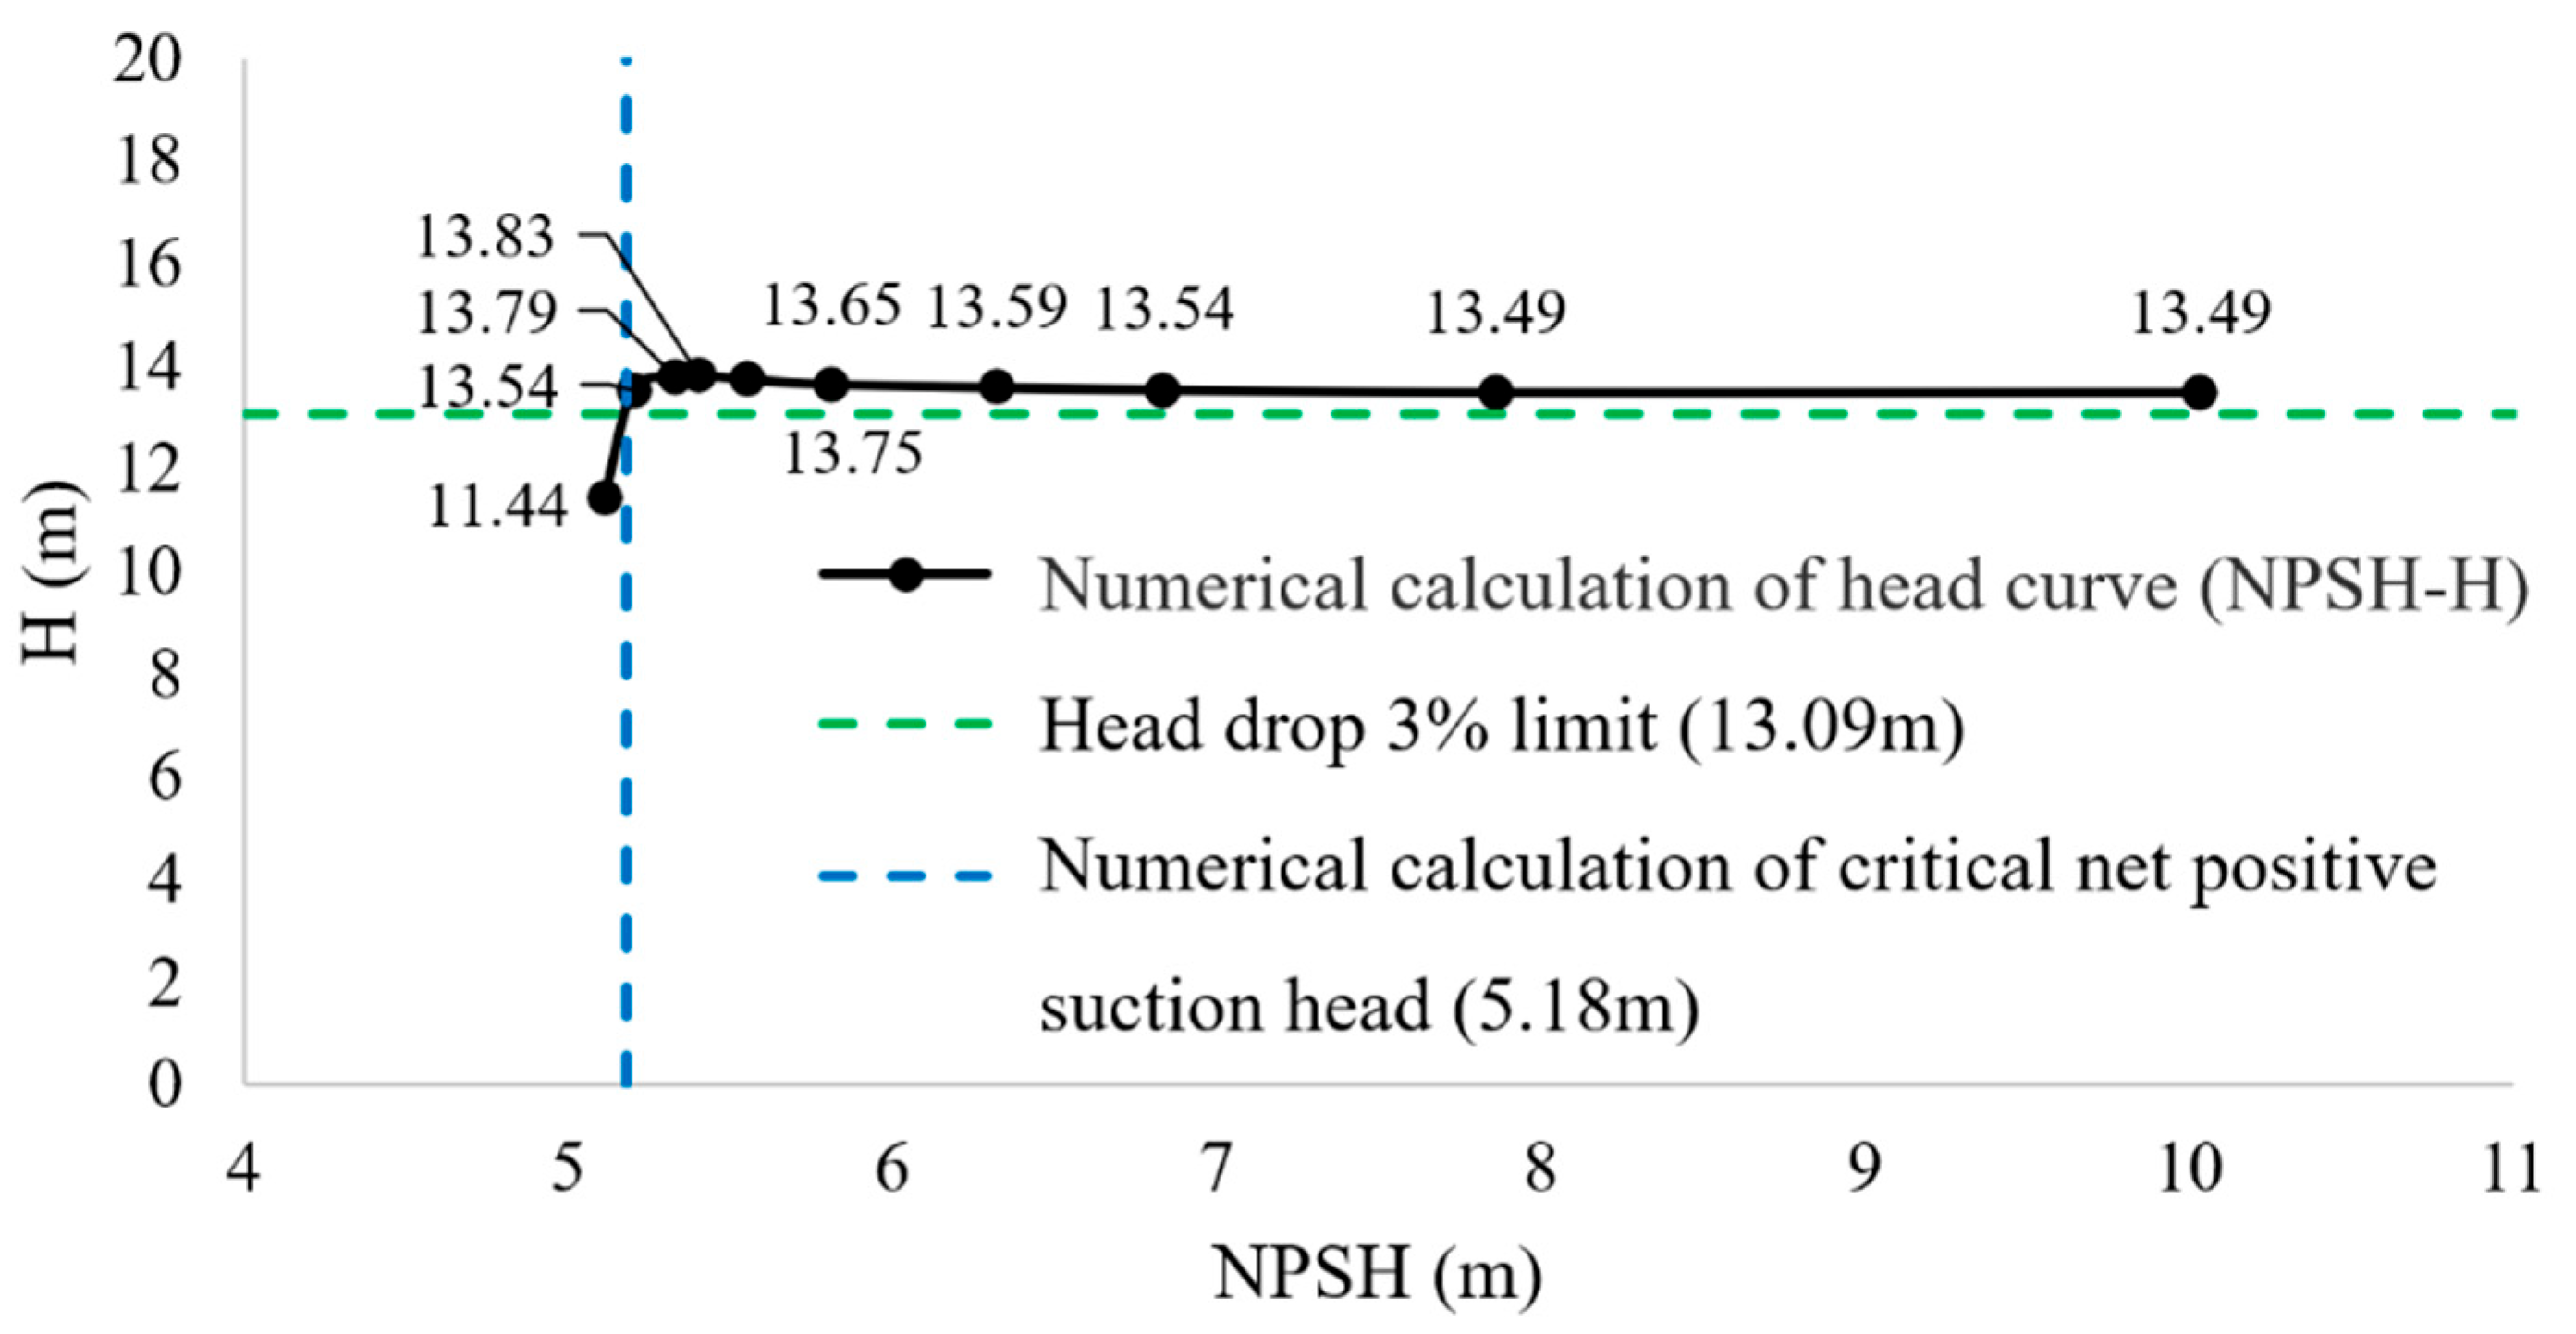
Scheme 3 implements a linear spanwise transition in airfoil thicknesses, utilizing profiles ranging from NACA0009-16 at the blade root to NACA0004-16 at the blade tip. The maximum thickness of this type of airfoil is located at 0.6 times the chord length, and the thickness of the leading edge is the same as that of Scheme 2. By calculating the data such as the efficiency, head, and net positive suction head (NPSH) of the original model impeller under the inlet pressures, from 101,325 Pa down to 53,000 Pa, the calculation results under different inlet pressures are shown in Table 5. According to the numerical calculation results, the cavitation performance curve is shown in Figure 14.
At the design point under 101,325 Pa, the modified impeller (Scheme 3) delivers a head of 13.49 m. As the inlet pressure gradually decreases, both the efficiency and the head gradually decline. For Scheme 1, the critical 3% head drop threshold occurs at a head of 13.55 m, corresponding to an inlet pressure range from 53,000 Pa to 54,000 Pa. For Scheme 3, the intersection of the 3% head drop criterion and the NPSH-versus-head (NPSH-H) curve yields the required NPSH (NPSHr) of approximately 6.3 m. That is to say, for the original model impeller, the critical net positive suction head of the model pump is about 5.18 m.

5.3.5. Summary of Cavitation Performance Curves Under Different Airfoil Schemes

The cavitation performance curves of the original model and the other three schemes are plotted together, as shown in Figure 15. As can be seen from Figure 15, under the design flow rate, Scheme 1 employs the NACA0009-0004 airfoil with a greater thickness near the leading edge, rendering the pump more susceptible to cavitation. The critical net positive suction head (NPSH) has increased by over 1 m relative to that of the original model. The key distinction between Scheme 2 and Scheme 3 is the differing positions of the airfoil’s maximum thickness. As shown in Figure 15, the increased thickness of the blade’s front section enhances the likelihood of cavitation. Reducing the thickness of the blade’s front end improves the cavitation performance.

5.4. Evolution of Cavitation Flow Structure in Pumps

The occurrence of cavitation in a water jet propulsion pump is closely related to the net positive suction head (NPSH, Ha). By changing the inlet pressure of the pump, that is, altering the Ha, the head of the pump will also change accordingly.
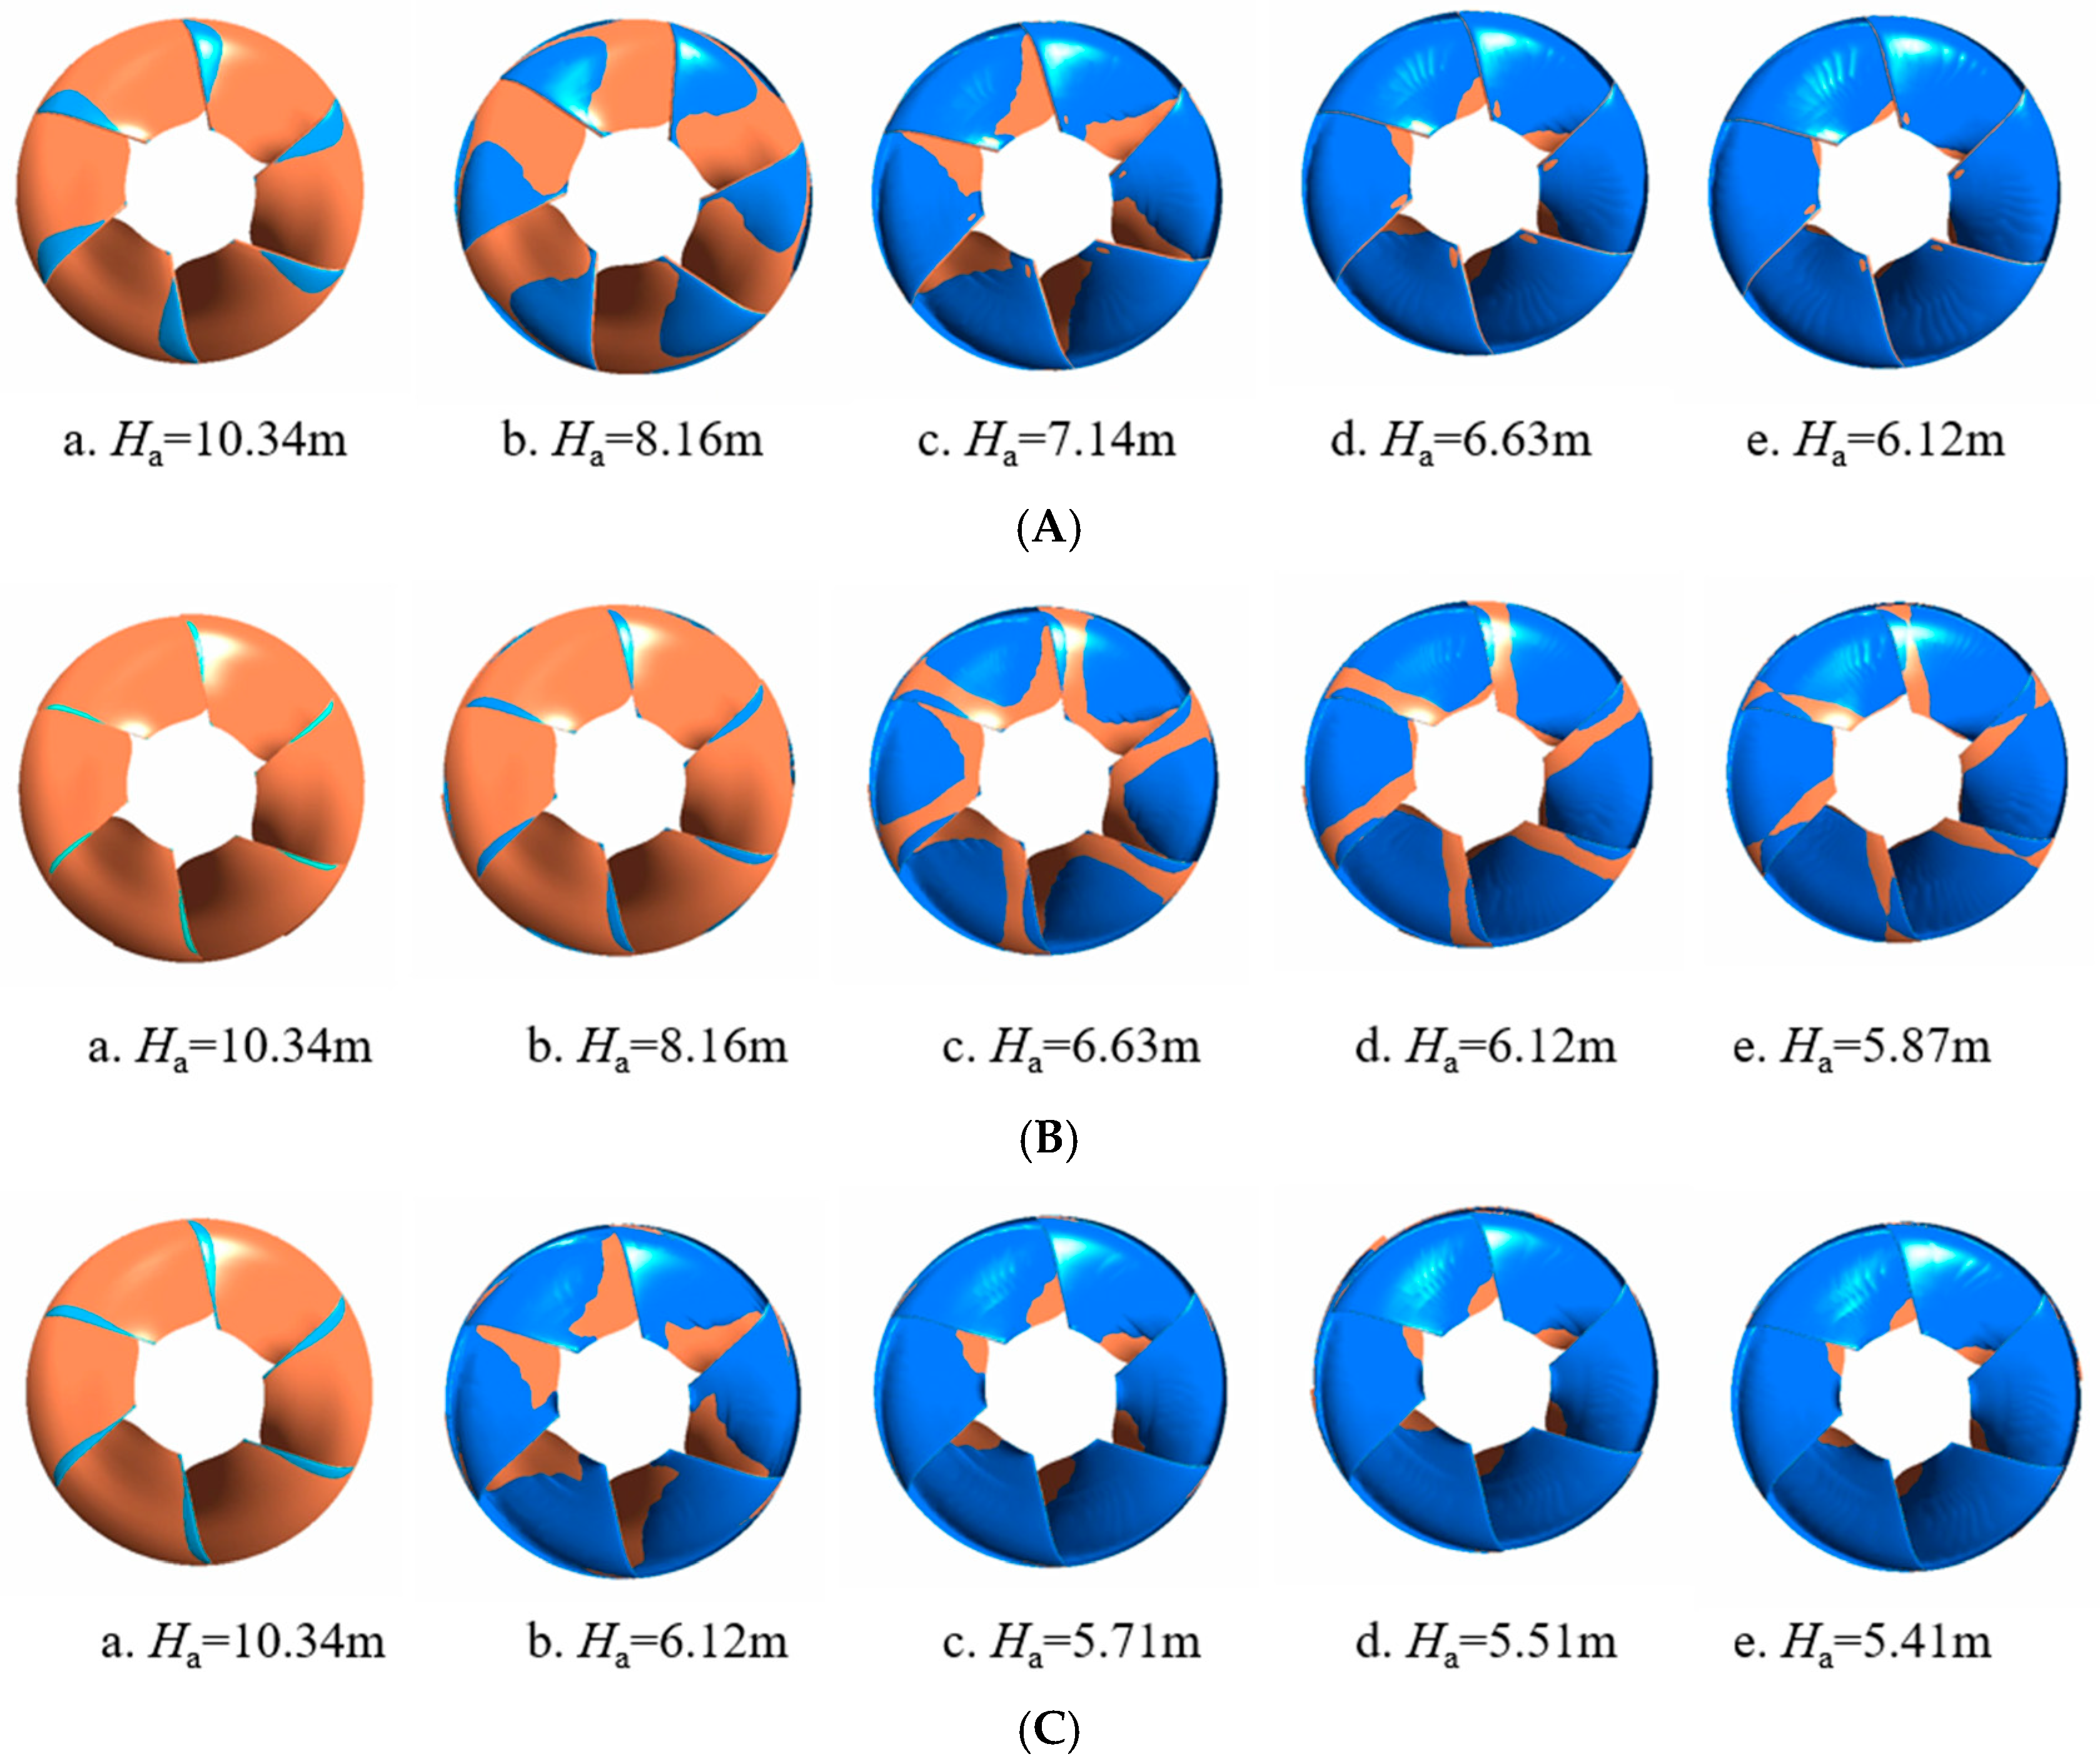
For blades with three different airfoil structures, varying Ha values result in different cavitation distributions on the blades. Figure 16 illustrates the cavitation region distributions of three airfoil configurations across different Ha values. As can be seen from Figure 16A, with the decrease in the Ha of the water jet propulsion pump, the cavitation area (that is, the area where the bubbles cover the blade) gradually increases. When Ha = 10.34 m, the cavitation phenomenon begins to occur on the blade. The cavitation is primarily distributed along the blade’s outer edge. At this point, the head of the water jet propulsion pump drops by less than 3%, exerting a relatively minor impact on the pump’s external characteristics. As the Ha decreases, the cavitation area expands continuously from the blade tip toward the blade outlet; radially, it extends toward the hub, eventually expanding rapidly to cover nearly the entire blade. When Ha = 6.12 m, the bubbles have almost wrapped around the entire blade. As shown in Figure 16B, at Ha = 10.34 m, a small number of bubbles start to form on the blade. At this stage, the pump head remains largely unchanged, indicating that these bubbles do not affect the fluid’s main flow. As the Ha decreases, the evolution of the cavitation area resembles that of the blade with the NACA0009_0004 airfoil structure, extending continuously toward the blade outlet and the hub. At Ha = 6.12 m, the cavitation area has extended to the vicinity of the blade outlet. As shown in Figure 16C, the cavitation area of the NACA0009-16_0004-16 airfoil structure exhibits a change pattern similar to that of the NACA0009_0004 airfoil structure. However, the key difference among the three airfoil structures is that upon reaching the critical net positive suction head, the cavitation regions near the three blade types differ. At Ha = 10.34 m, the NACA0009-13_0004-13 airfoil blade exhibits the fewest bubbles, followed by the NACA0009-16_0004-16 airfoil, with the NACA0009_0004 airfoil blade showing the most. The number of bubbles is not the primary factor affecting the pump performance. When the number of bubbles is small and insufficient to alter the main fluid flow within the impeller, changes in the pump head are negligible. However, if the quantity of bubbles is excessive, cavitation will have a significant impact on the pump.
Regarding the influence of the leading-edge thickness on cavitation, the leading-edge thickness of the NACA0009_0004 airfoil is greater than that of the NACA0009-13_0004-13 and NACA0009-16_0004-16 airfoils, and its critical NPSH (6.3 m) is significantly higher than those of the latter two (5.8 m and 5.18 m). A thicker leading edge will enhance the flow field disturbance at the blade inlet, causing an increase in the local flow velocity and a decrease in pressure, which makes it easier to reach the vaporization pressure of water, thereby triggering cavitation in advance. In contrast, a thinner leading edge (such as those of the latter two airfoils) can reduce the flow field disturbance and delay the inception of cavitation.
In terms of the influence of the position of the maximum thickness on cavitation expansion, the maximum thickness of the NACA0009-13_0004-13 airfoil is located at 0.3 times the chord length, while that of the NACA0009-16_0004-16 airfoil is at 0.6 times the chord length, and the latter has a lower critical NPSH. When the position of the maximum thickness is farther back (0.6 times the chord length), the structure of the middle and rear sections of the blade can provide stronger pressure support, inhibiting the radial expansion of the sheet cavitation toward the outlet; when the position is farther forward (0.3 times the chord length), the pressure maintenance capacity of the middle and rear sections of the blade is weaker, making it easier for cavitation to cover the entire blade.

5.5. Flow Analysis of Airfoils Cavitation

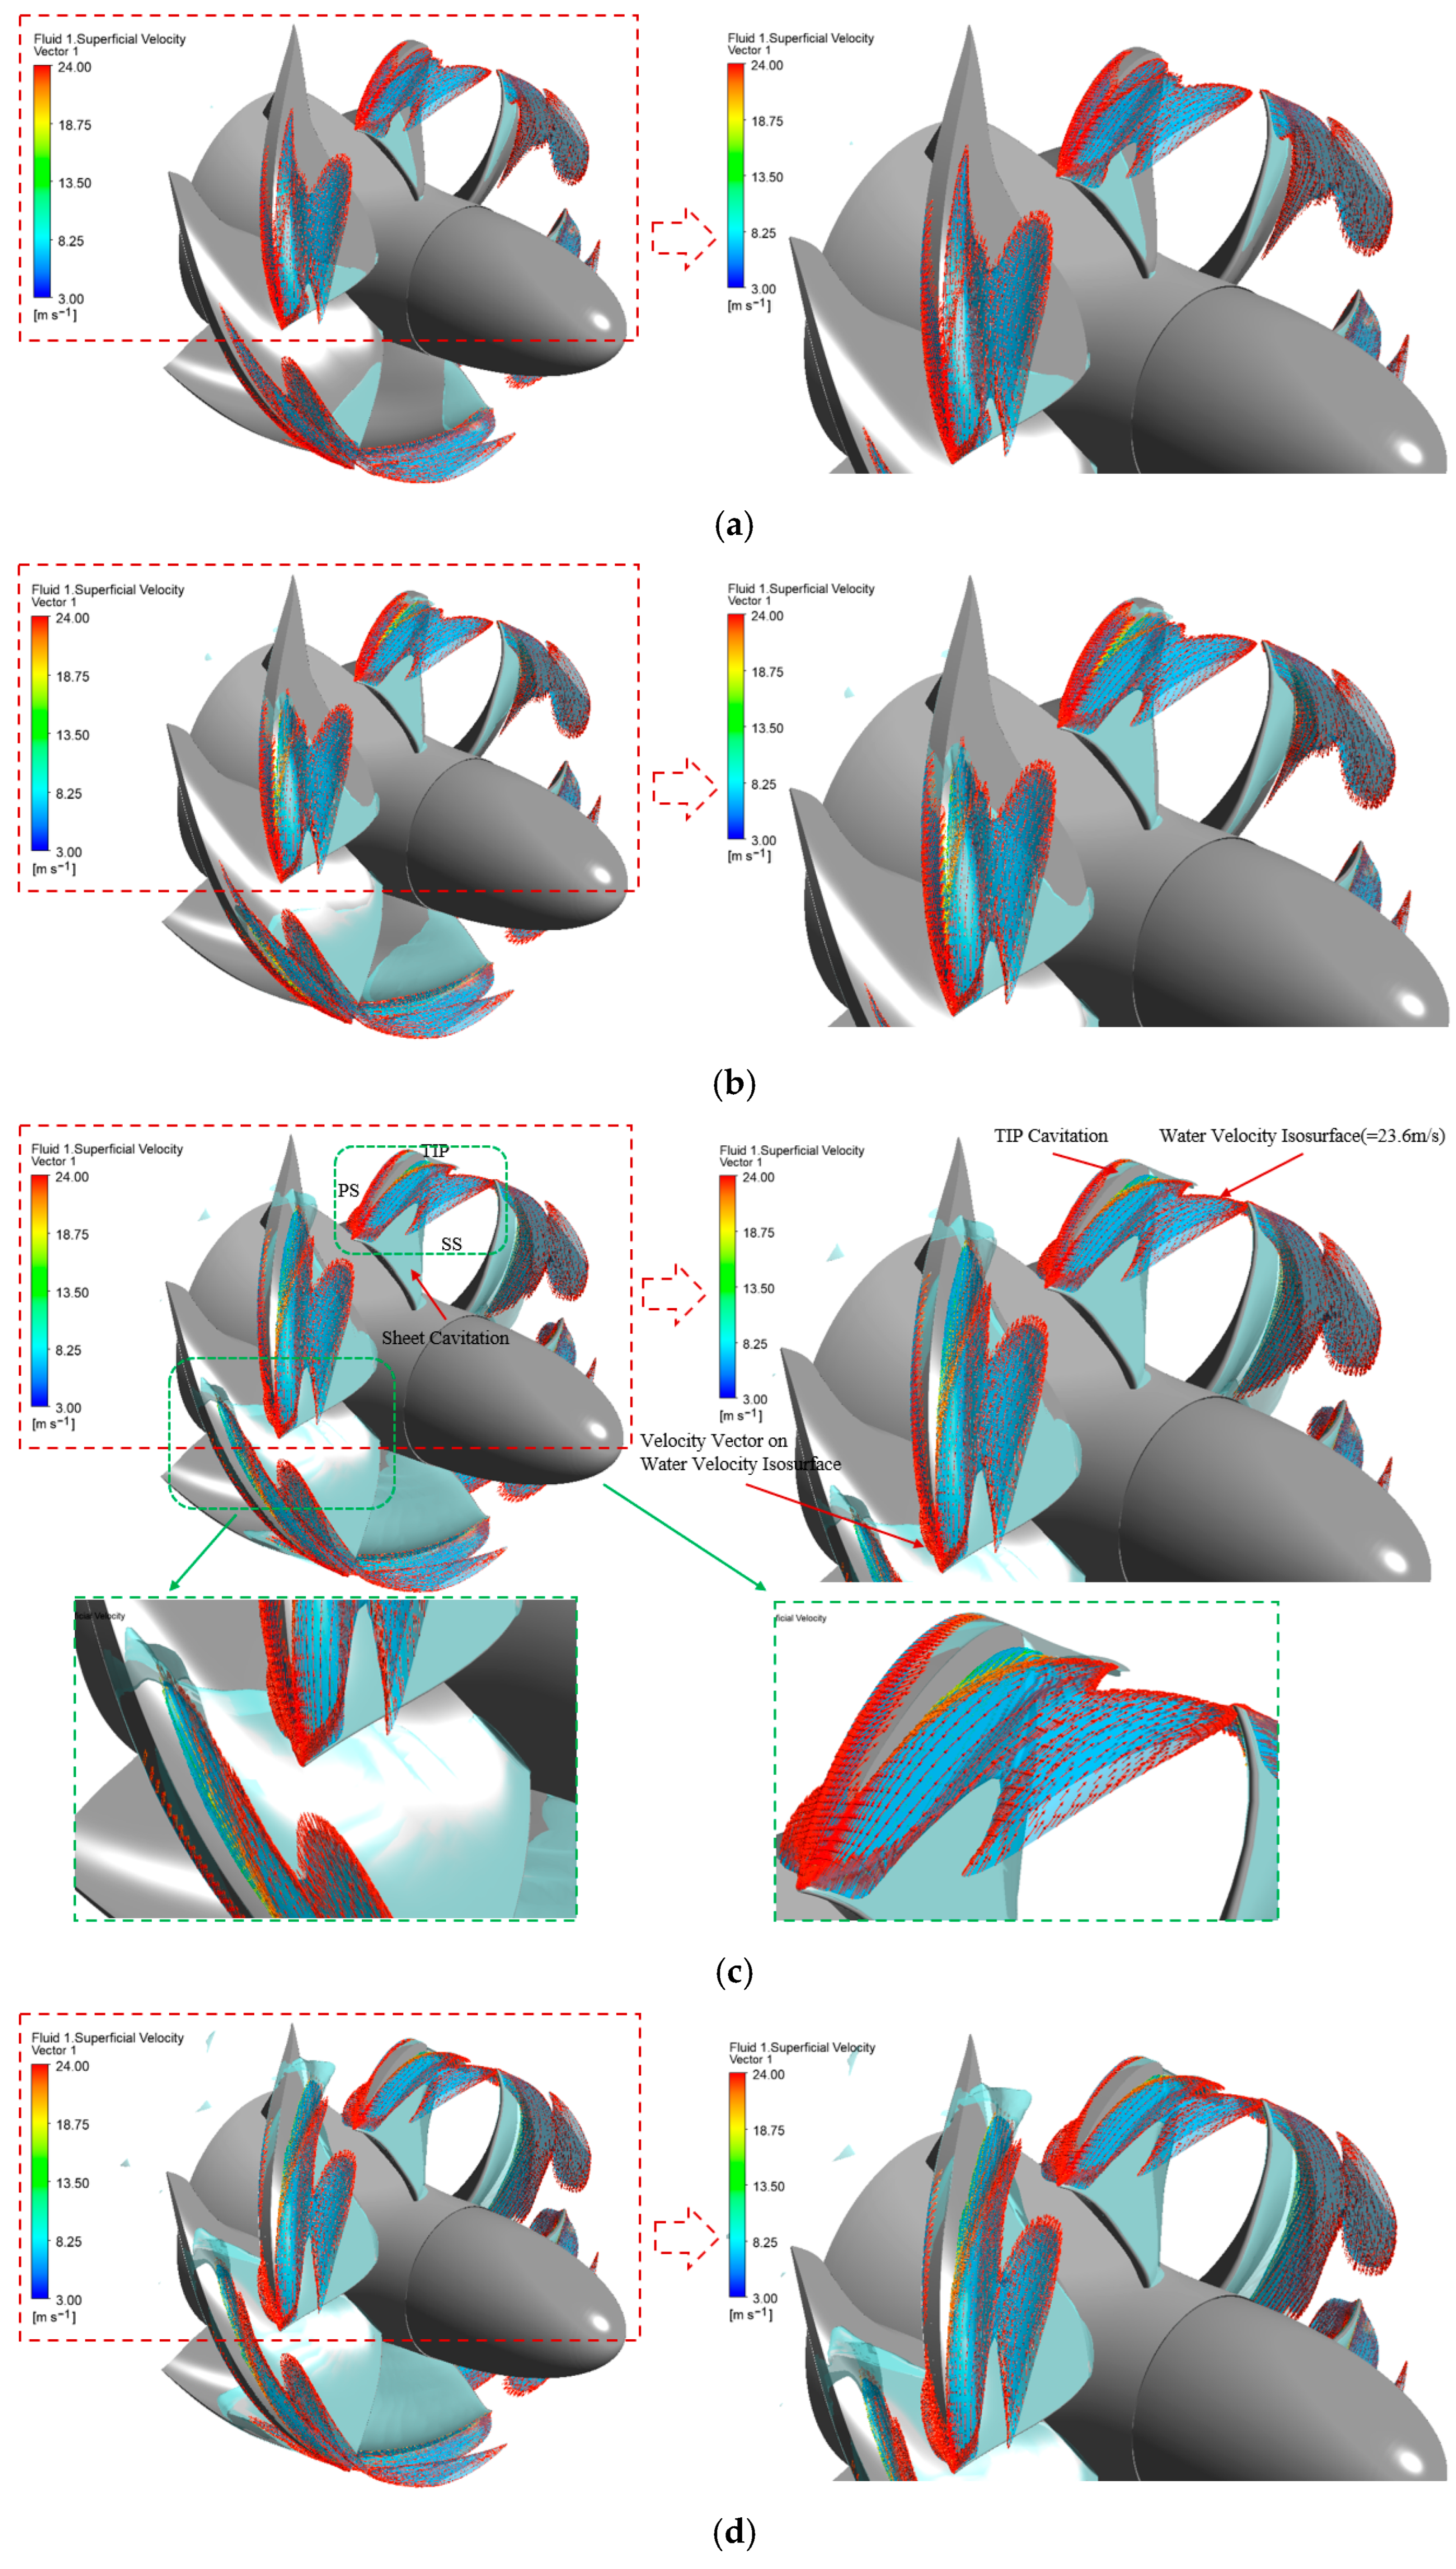
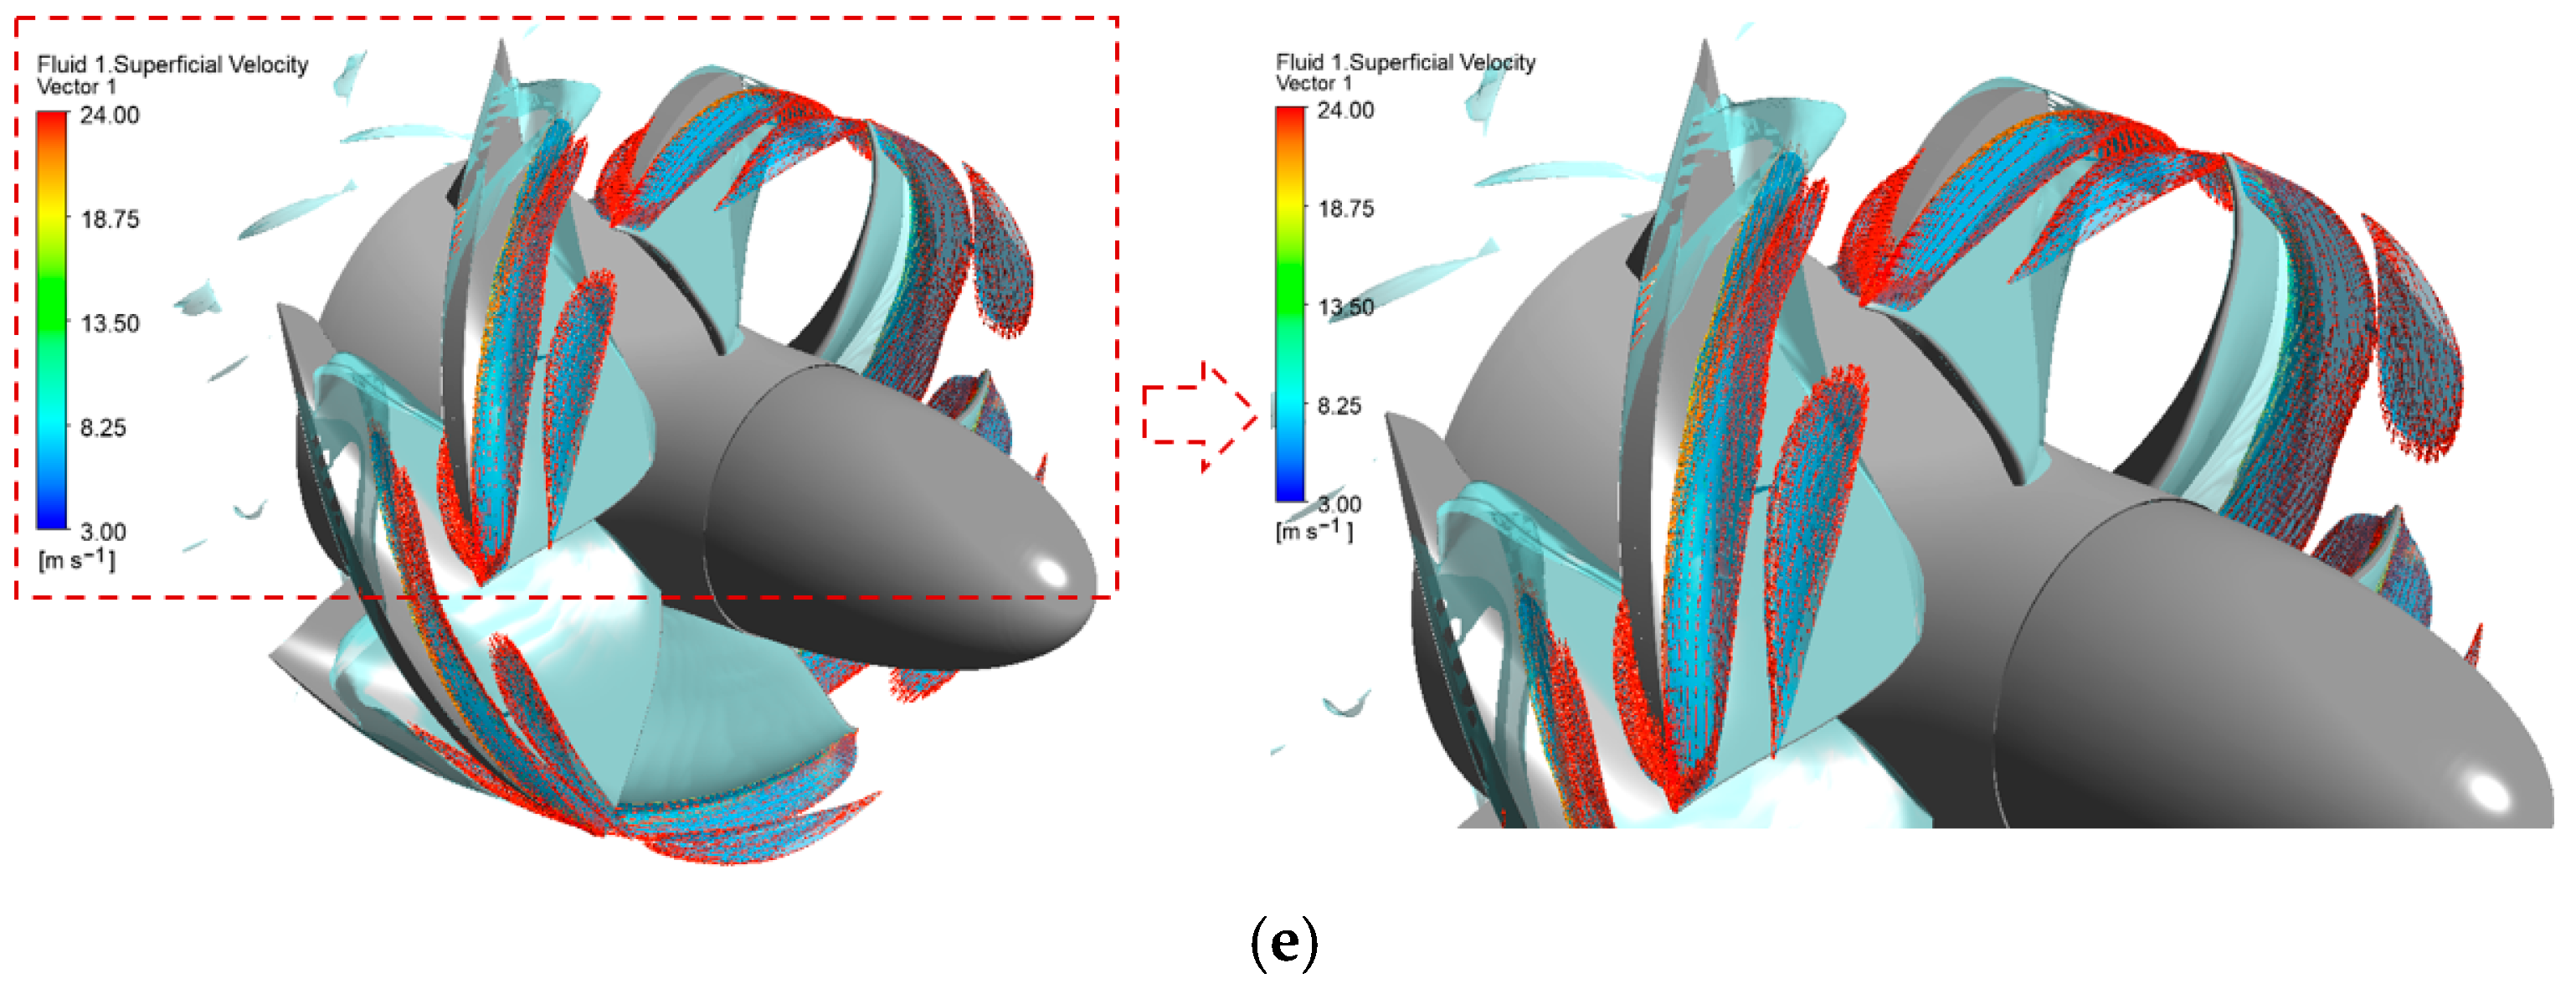
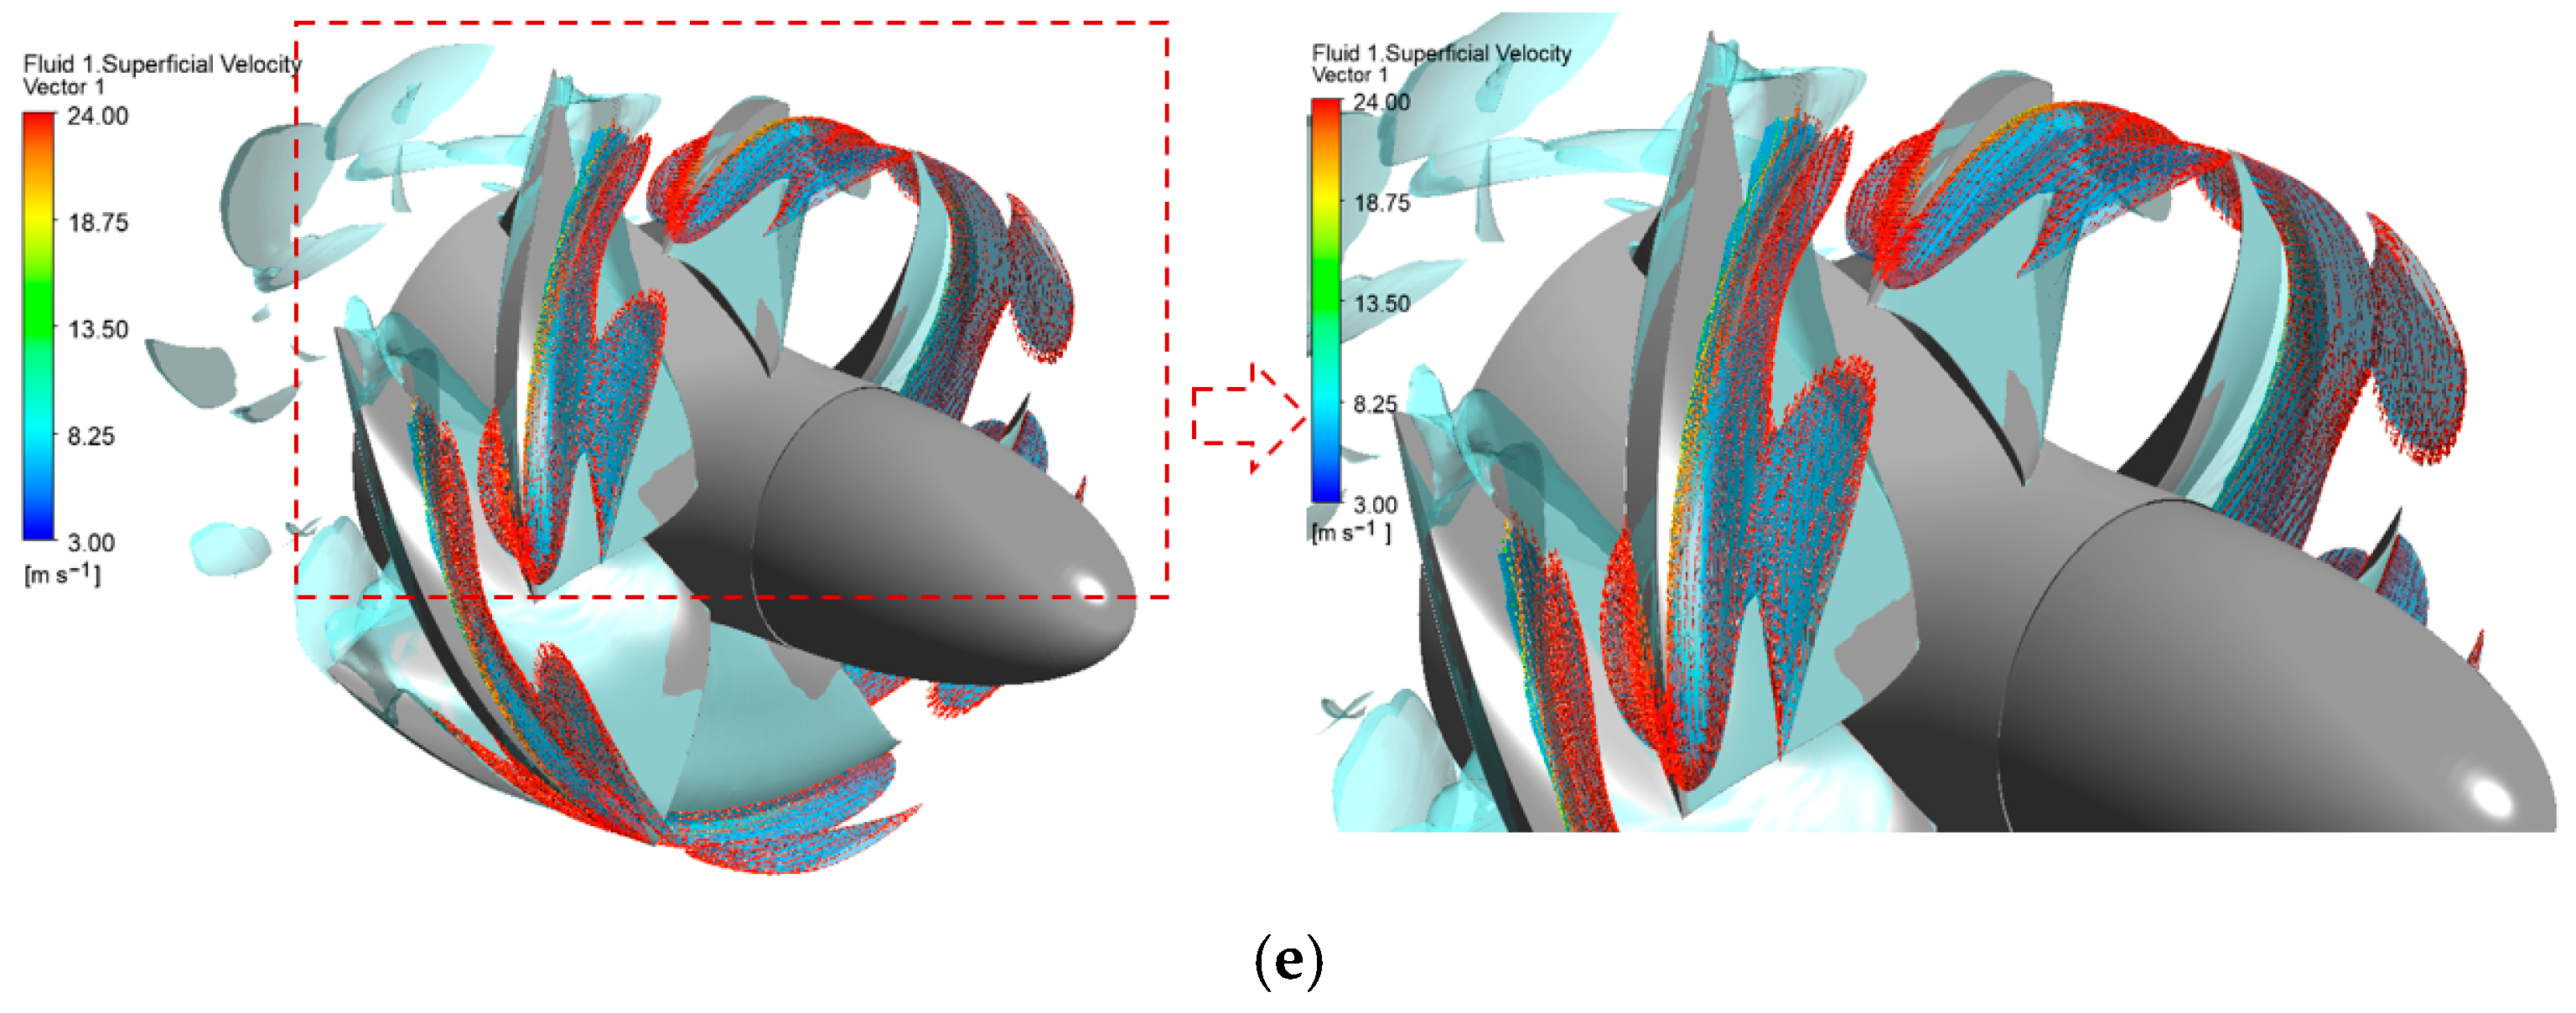
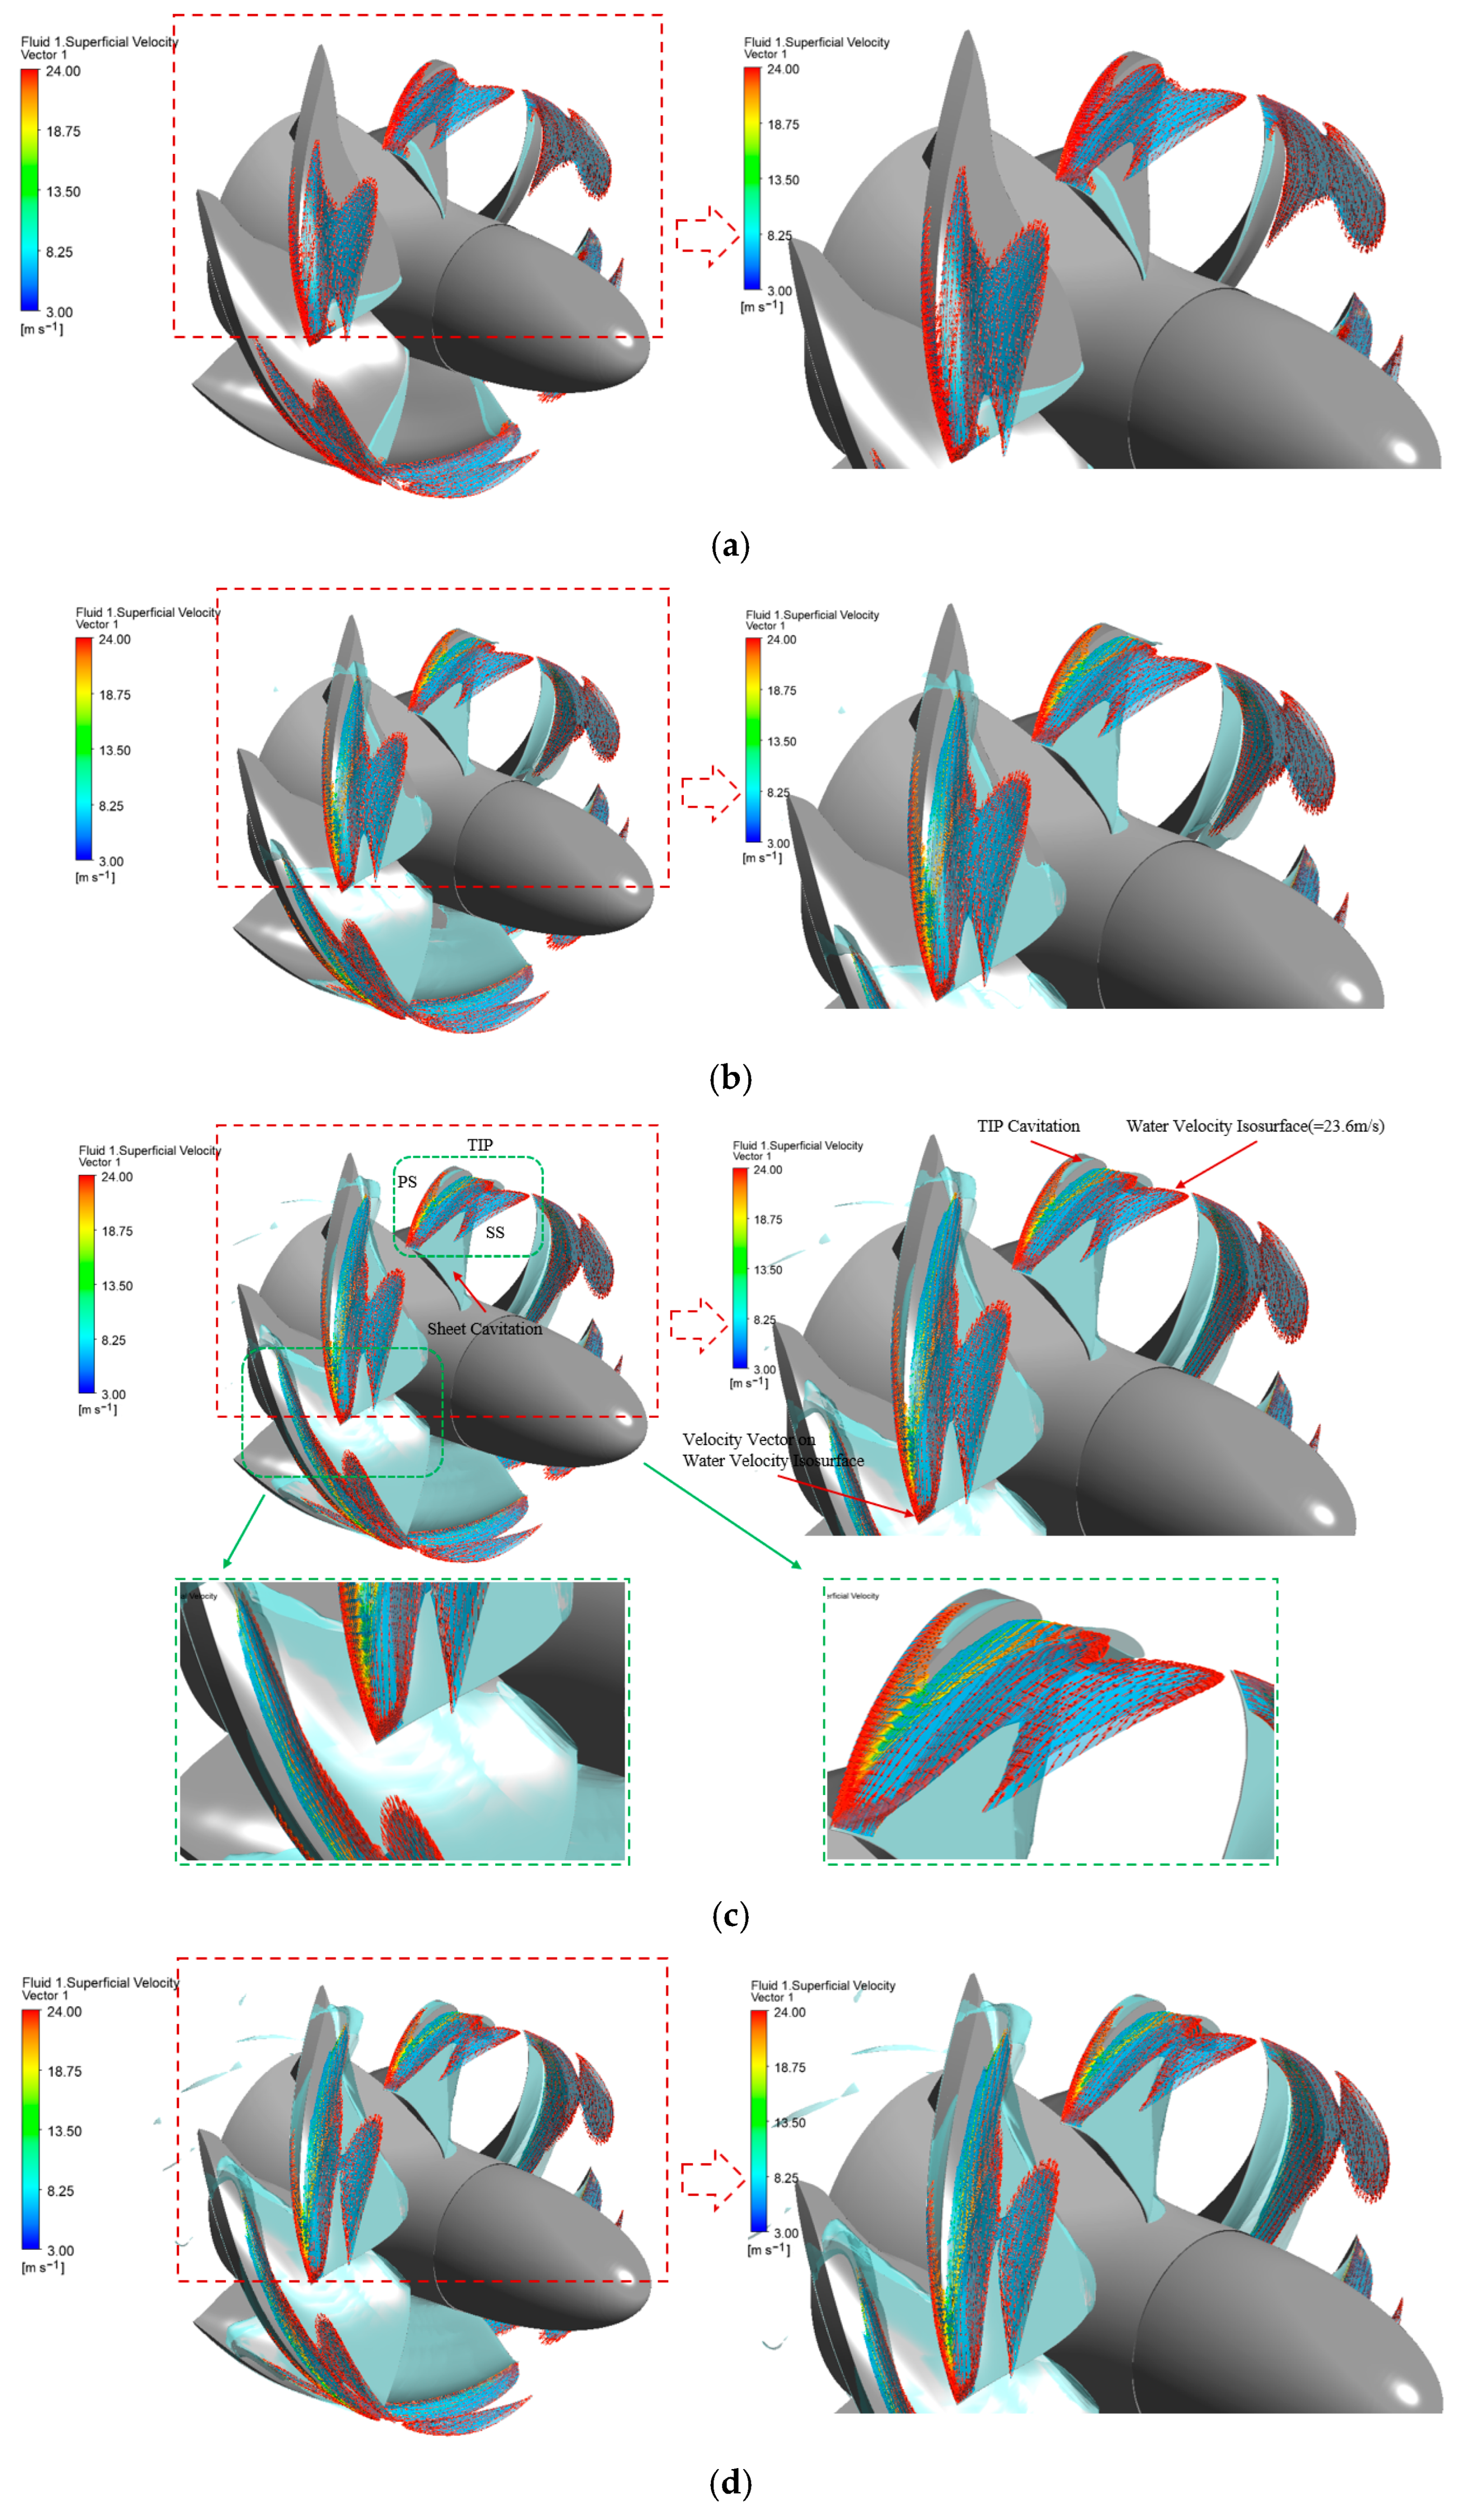
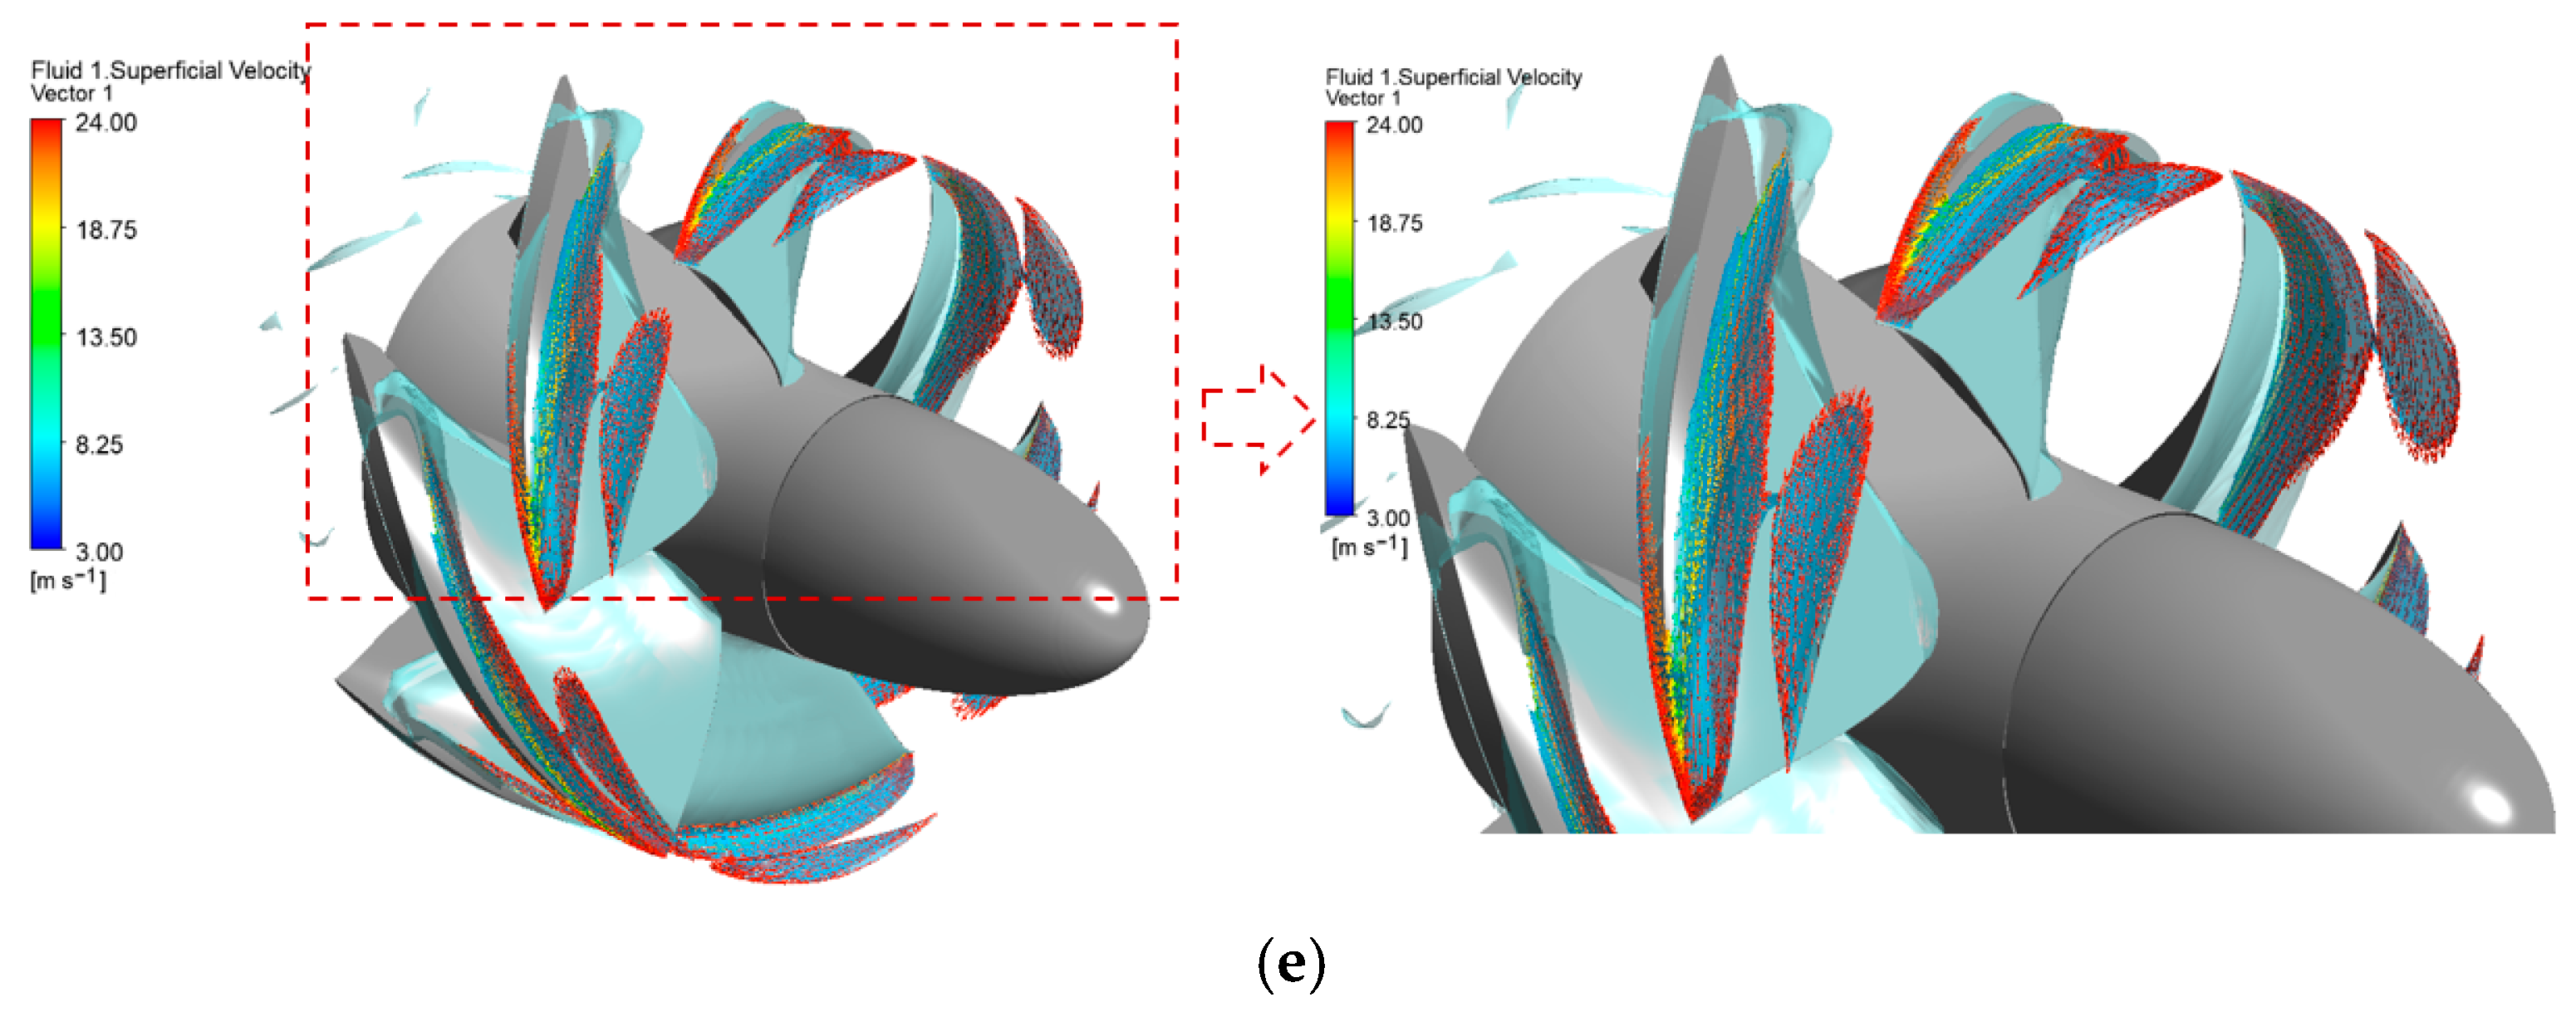
In order to further explore the flow characteristics of the suction surfaces of the NACA0009_0004 airfoil, the NACA0009-13_0004-13 airfoil, and the NACA0009-16_0004-16 airfoil under different cavitation conditions, this paper extracts the water velocity isosurface at 23.6 m/s and presents water velocity isosurfaces of three airfoils under different cavitation conditions, as shown in Figure 17, Figure 18 and Figure 19. Cavitation primarily comprises tip cavitation and sheet cavitation. As the value of the Ha of the water jet propulsion pump decreases from 10.34 m to 6.12 m, the cavitation intensity increases, and the cavitation zone expands. Sheet cavitation predominantly occurs on the suction surface due to the high flow velocity and low pressure. The sheet cavitation progresses continuously from the blade leading edge to the trailing edge, extending radially from the shroud to the hub, ultimately covering almost the full blade surface. Tip cavitation mostly occurs in the blade tip area, which is related to the high-speed and low-pressure environment at the blade tip. When the local pressure falls below the saturation vapor pressure of the water, cavitation initiates. The tip cavitation propagates along the impeller rotation direction within the blade passage. The direction of red velocity vectors on the water velocity isosurface indicates fluid flow trajectories near the blade surface. The vector distribution density correlates with the velocity gradient magnitude. The blade rotation and finite width causes a higher vector density in regions like the shroud and the blade tips. These observations suggest sharp velocity gradients, potentially indicating flow separation and complex vortex structures, consistent with the magnified views in Figure 17, Figure 18 and Figure 19. In addition, the cavitation area expansion correlates with increased low-flow velocity regions on the isosurface, indicating enhanced flow separation. The isosurface area contracts near the blade leading edge but expands at the trailing edge. This indicates that the cavitation development alters the flow field velocity distribution, inducing non-uniform blade loading that excites structural vibration and flow-induced noise. It will also erode the blade surface, reducing the impeller service life and compromising the hydrodynamic performance. However, the difference in cavitation among the three types of airfoils is that when the critical net positive suction head is reached, the cavitation areas near the three types of blades are different. At Ha = 10.34 m, the NACA0009-13_0004-13 airfoil exhibits minimal cavitation density, while the NACA0009-16_0004-16 airfoil shows moderate bubble formation, and the NACA0009_0004 airfoil demonstrates the highest vapor concentration. At Ha = 6.63 m, the cavitation on the blade of the NACA0009_0004 airfoil structure almost covers the entire blade. When Ha = 5.87 m, the cavitation on the blade of the NACA0009-13_0004-13 airfoil structure does still not cover the entire blade, but the degree of cavitation is the most severe.

5.6. Numerical Simulation Results and Experimental Comparison

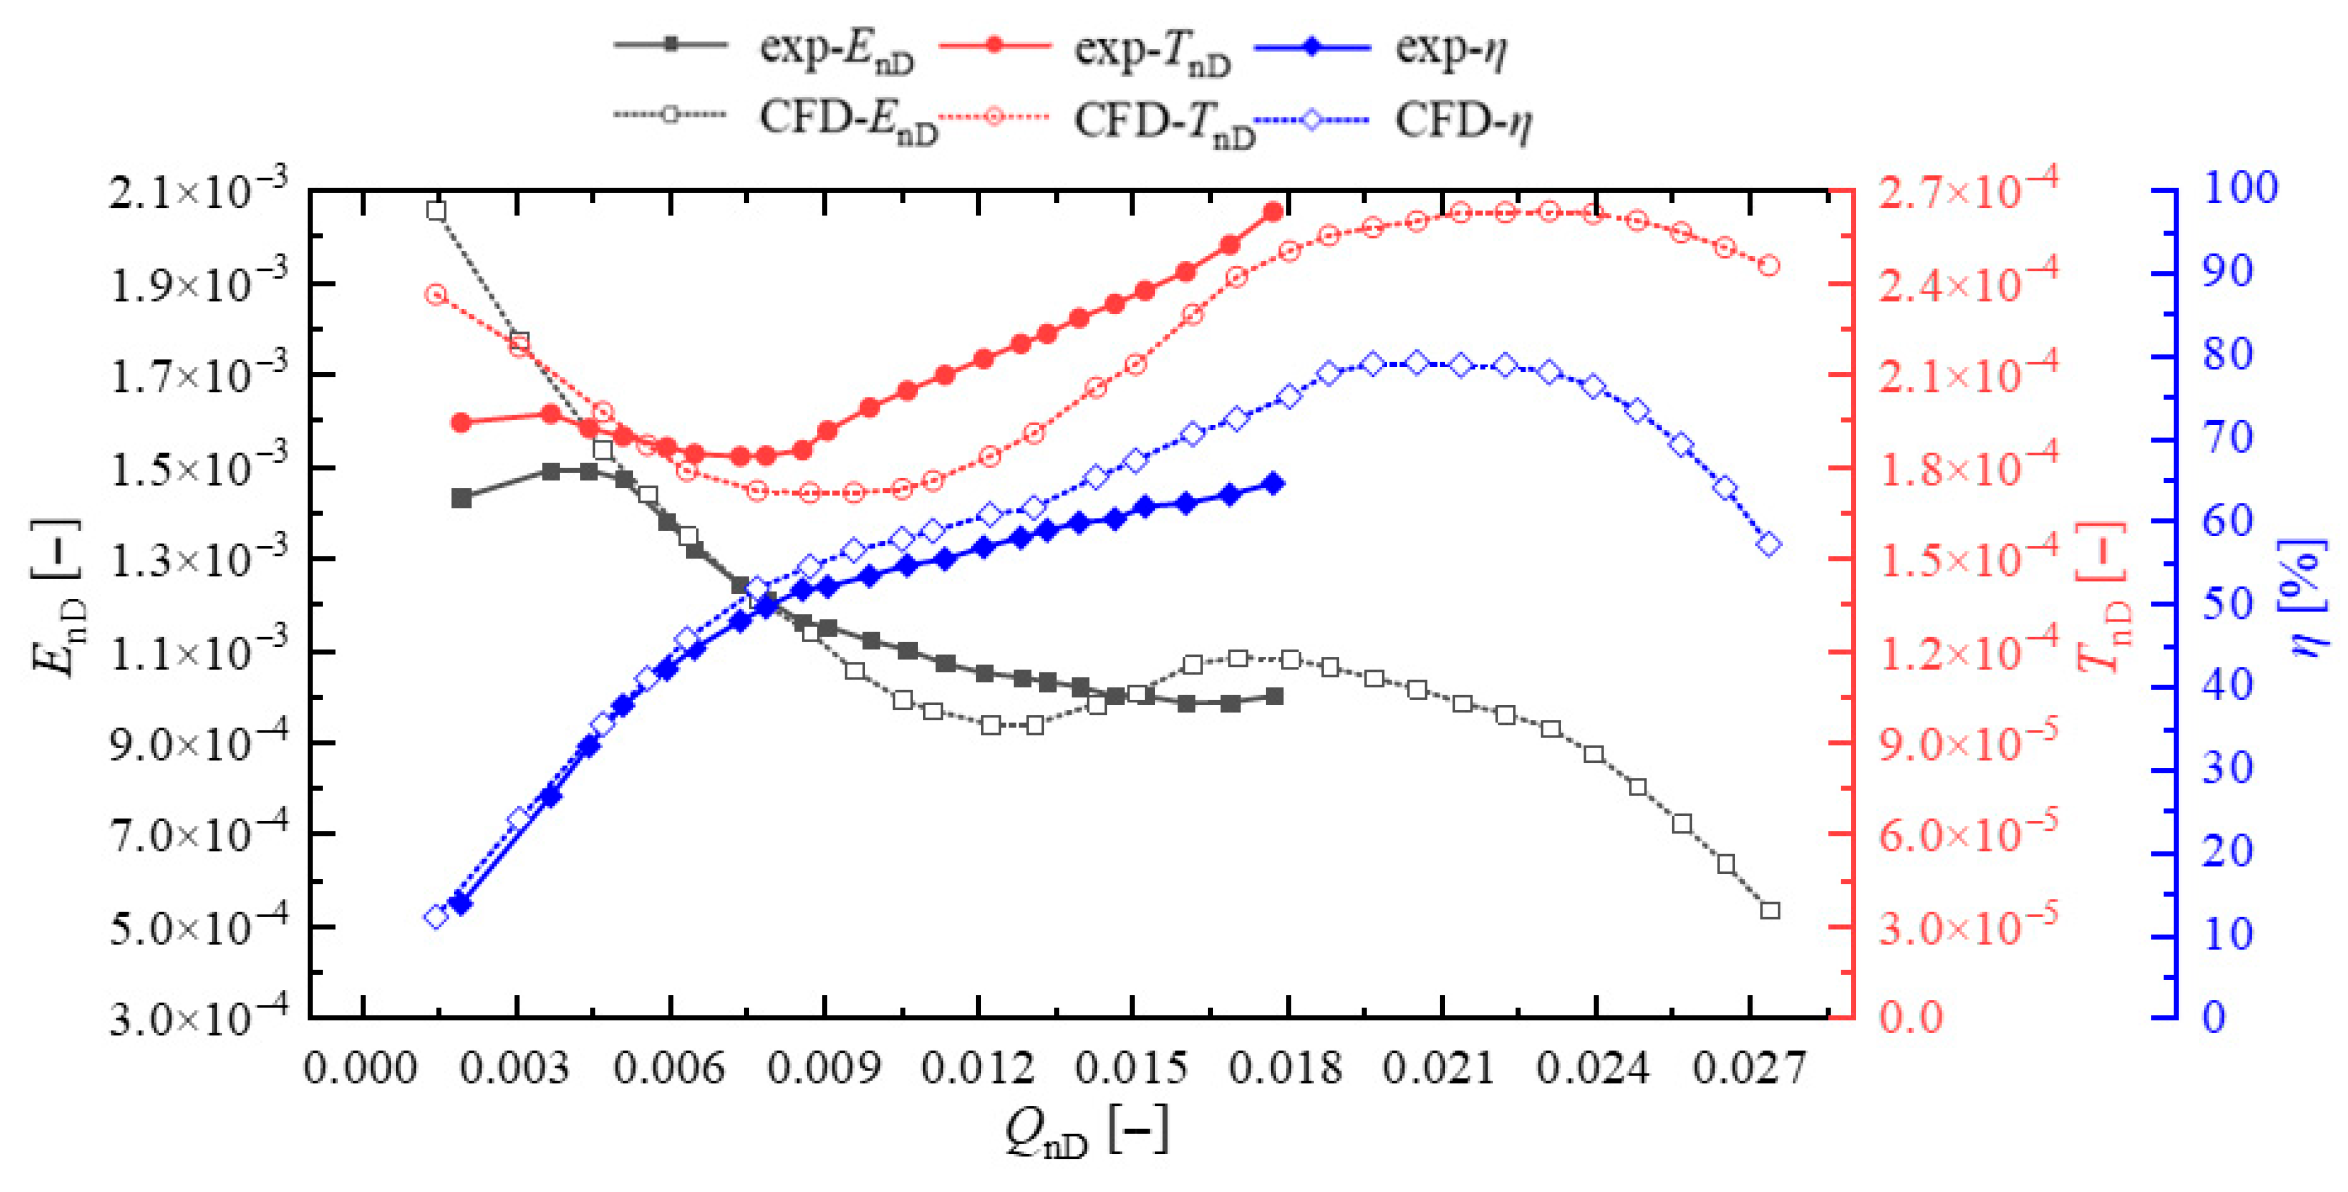
The numerical simulation of the speed model pump was carried out, and the results are dimensionless. The numerical simulation results were compared with the experimental data to verify the accuracy of the numerical simulation. The comparison results are shown in Figure 20. It can be seen from Figure 20 that when the flow coefficient QnD < 0.004, the deviation of the energy coefficient EnD is large. The energy coefficient obtained by the numerical simulation under the remaining flow conditions is consistent with the energy coefficient obtained by the test. The torque coefficient and efficiency obtained by the numerical simulation are consistent with the trend of the torque coefficient and efficiency obtained by the experiment.
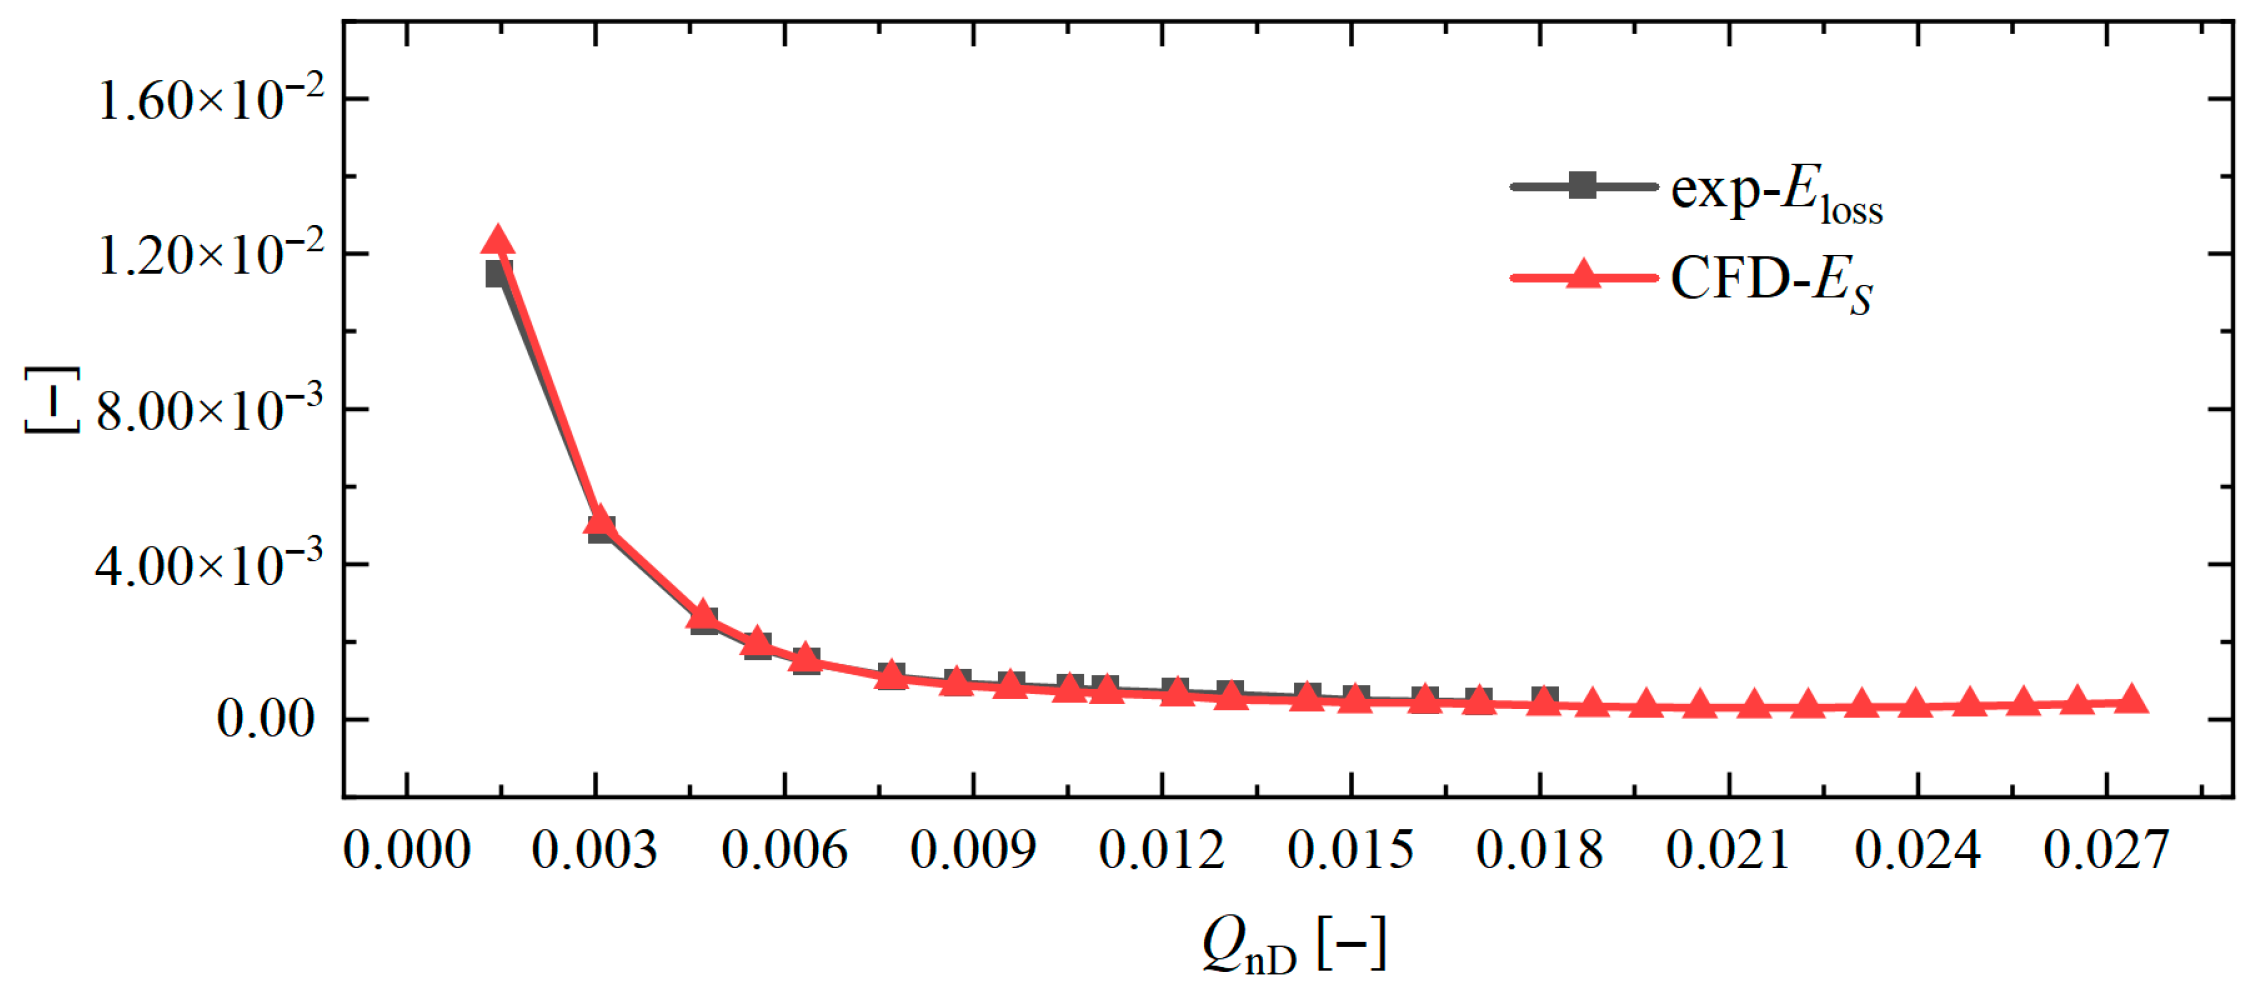
The variation laws of the flow loss and entropy generation inside the pump were compared using the entropy production analysis method. Figure 21 shows the comparison of the variation between the entropy production energy coefficient and the internal hydraulic loss energy coefficient of the pump under different flow conditions. As can be seen from Figure 21, the variation laws of the internal hydraulic loss energy coefficient and the entropy production energy coefficient of the pump are similar under different flow conditions. Under small flow conditions, the numerically simulated entropy production energy coefficient is slightly larger than the experimentally measured internal flow loss energy coefficient of the pump. As the flow rate gradually increases, the entropy production energy coefficient from the numerical simulation gradually becomes slightly smaller than the internal flow loss energy coefficient of the pump obtained from the experiment. However, the maximum deviation under all calculated flow conditions is less than 10%, indicating that the numerical simulation can effectively reflect the energy dissipation caused by cavitation and verifying the reliability of the entropy production theory.

6. Conclusions

This study evaluates the cavitation performance of the impellers in the water jet propulsion pump by comparatively analyzing three airfoils: NACA0009_0004, NACA0009-13_0004-13, and NACA0009-16_0004-16.
(1) We found that the NPSH required for the NACA0009-16_0004-16 airfoil is the smallest, which is 5.18 m. The number of bubbles on the blade and the bubble coverage area are the least, the stability is relatively good, and its cavitation resistance performance is the best. However, airfoil modifications alter both the cavitation behavior and hydraulic characteristics, requiring design trade-offs. Therefore, in practical applications, these two key performance indicators need to be comprehensively considered. That is, for cavitation resistance, Scheme 1 is preferentially selected, but the head loss needs to be accepted. For a comprehensive performance, Scheme 2 is preferentially selected. When the head loss is controlled, the cavitation resistance improves by 11%. This enhances the operational efficiency and stability.
(2) By extracting the water velocity isosurface of 23.6 m/s, we further investigated the flow characteristics of the suction surfaces of different airfoils at different cavitation conditions and found that cavitation mainly includes tip cavitation and sheet cavitation. As the cavitation intensifies, the sheet cavitation propagates axially from the blade tip to the blade outlet, while extending radially from the shroud to the hub. This progression eventually covers nearly the full blade surface. The TIP cavitation also expands tangentially in the direction of the impeller rotation. The vector distribution exhibits a higher concentration near the shroud and blade tips, where flow separation and complex vortex structures typically occur. The velocity isosurface contracts near the blade leading edge, while expanding adjacent to the trailing edge. This indicates that the development of cavitation has changed the velocity distribution of the flow field and has affected the performance of the impeller.
This study focuses on the influence of airfoil parameters on the cavitation performance of water jet propulsion pumps (a type of mixed-flow pump). The core conclusions are based on the cavitation characteristics and the effect of airfoil parameters on the flow field, which have a certain universality for other types of pumps and flow states. Other pump types, such as centrifugal pumps, axial-flow pumps, and pump-turbines, all have cavitation problems related to the blade airfoil design. Other flow states include those involving cavitation–vortex interactions.
This study provides clear guidance for engineering designs through the quantitative analysis of airfoil performance. In terms of airfoil selection, it considers either cavitation resistance or the balance among the head, efficiency, and cavitation performance. In terms of structural optimization, targeted measures can be taken, such as thickening the trailing edge of the blade, thinning the leading edge, and optimizing the tip clearance and shroud profile to reduce cavitation triggers. In terms of performance prediction, the correlation between airfoil parameters and cavitation characteristics provides a basis for performance evaluations in the preliminary design stage, reducing the reliance on full-scale tests and improving design efficiency.
Regarding the suggestions for the experimental follow-up, on the basis of the current research, follow-up experiments can further expand the range of operating conditions, carry out experiments on the influence of different material properties on the system, and design research schemes for multi-physics field coupling. For suggestions on practical implementation, optimizations can be made in energy field applications, chemical process intensification, and renewable energy system integration. Examples include thermal power plants, nuclear power plants, heat exchangers in chemical equipment, as well as renewable energy systems such as solar and wind energy systems.

Author Contributions

Data curation, Y.Z.; data curation, J.Z.; formal analysis, Y.Z.; writing—original draft preparation, Y.Z.; writing—original draft preparation, J.Z.; writing—review and editing, Y.Z.; writing—review and editing, Y.L.; writing—review and editing, C.W.; writing—review and editing, J.C.; writing—review and editing, Y.C.; Conceptualization, Y.L.; Methodology, Y.L.; Supervision, Y.L.; Visualization, Y.L.; Validation, J.Z. All authors have read and agreed to the published version of the manuscript.

Funding

This work was funded by the Natural Science Foundation of China (Grant No. 51906085, Grant U20A20292), the China Postdoctoral Science Foundation Funded Project (2023M733355, Grant No. 2019M651734), the Jiangsu University Youth Talent Development Program (2020), the Chunhui Program Cooperative Scientific Research Project of the Ministry of Education, and the Research Project of State Key Laboratory of Mechanical System and Vibration (Grant No. MSV202203).

Data Availability Statement

Data will be made available upon request.

Conflicts of Interest

Authors Churui Wan, Jianping Chen and Youlin Cai were employed by the company Marine Design and Research Institute of China. The remaining authors declare that the research was conducted in the absence of any commercial or financial relationships that could be construed as a potential conflict of interest.

References

  1. Jiao, W.; Wang, Y.; Cheng, L.; Zhao, H. Experimental study on thrust pulsation characteristics of water jet propulsion pump units. Ocean Eng. 2023, 284, 115079. [Google Scholar] [CrossRef]
  2. Long, Y. Study on the Hydraulic Optimization Design Method and Cavitation of Waterjet Pump. Ph.D. Thesis, Shanghai Jiao Tong University, Shanghai, China, 2018. (In Chinese). [Google Scholar]
  3. Long, Y.; Zhong, J.; Chen, Y.; Zhang, Y.; Wan, C.; Zhu, R. Numerical simulation of internal flow of built-up rudder of the waterjet assembly under different navigate states. Ship Sci. Technol. 2023, 45, 111–117. (In Chinese) [Google Scholar]
  4. Luo, X.; Li, Q.; Zhang, Z.; Zhang, J. Research on the underwater noise radiation of high pressure water jet propulsion. Ocean Eng. 2021, 219, 108438. [Google Scholar] [CrossRef]
  5. Jiao, W.; Chen, H.; Cheng, L.; Zhang, B.; Yang, Y.; Luo, C. Experimental study on flow evolution and pressure fluctuation characteristics of the underwater suction vortex of water jet propulsion pump unit in shallow water. Ocean Eng. 2022, 266, 112569. [Google Scholar] [CrossRef]
  6. Park, W.G.; Jang, J.H.; Chun, H.H.; Kim, M.C. Numerical flow and performance analysis of waterjet propulsion system. Ocean Eng. 2005, 32, 1740–1761. [Google Scholar] [CrossRef]
  7. Luo, X.; Ye, W.; Huang, R.; Wang, Y.; Du, T.; Huang, C. Numerical investigations of the energy performance and pressure fluctuations for a waterjet pump in a non-uniform inflow. Renew. Energy 2020, 153, 1042–1052. [Google Scholar] [CrossRef]
  8. Cao, P.; Wang, Y.; Kang, C.; Li, G.; Zhang, X. Investigation of the role of non-uniform suction flow in the performance of water-jet pump. Ocean Eng. 2017, 140, 258–269. [Google Scholar] [CrossRef]
  9. Lu, Y.; Wang, X.; Liu, H.; Zhou, F.; Tang, T.; Lai, X. Analysis of the impeller’s tip clearance size on the operating characteristics of the underwater vehicle with a new high-speed water jet propulsion pump. Ocean Eng. 2021, 236, 109524. [Google Scholar] [CrossRef]
  10. Ji, L.; Li, W.; Shi, W.; Tian, F.; Agarwal, R. Diagnosis of internal energy characteristics of mixed-flow pump within stall region based on entropy production analysis model. Int. Commun. Heat Mass Transf. 2020, 117, 104784. [Google Scholar] [CrossRef]
  11. Sun, Y.; Peng, H.; Liu, W.; Guo, J.; Guo, Y. Comparison of the hydrodynamic performance of front and rear-stator pump-jet propulsors in an oblique wake under the cavitation condition. Phys. Fluids 2022, 34, 1–17. [Google Scholar] [CrossRef]
  12. Huang, R.; Dai, Y.; Luo, X.; Wang, Y.; Huang, C. Multi-objective optimization of the flush-type intake duct for a waterjet propulsion system. Ocean Eng. 2019, 187, 106172. [Google Scholar] [CrossRef]
  13. Huang, R.F.; Zhai, Z.H.; Zhou, J.J.; Luo, X.W. Cavitating flow analysis and design optimization for a waterjet mixed flow pump. IOP Conf. Ser. Earth Environ. Sci. 2018, 163, 012073. [Google Scholar] [CrossRef]
  14. Tian, D.; Lu, R.; Zhu, H.; Liu, J.; Zhang, Y.; Wei, G.; Li, G.; Si, Q. Cavitation performance analysis and optimal design of the portable electric-driven axial flow pump. J. Phys. Conf. Ser. 2024, 2707, 012055. [Google Scholar] [CrossRef]
  15. Kunz, R.F.; Boger, D.A.; Stinebring, D.R.; Chyczewski, T.S.; Lindau, J.W.; Gibeling, H.J.; Venkateswaran, S.; Govindan, T.R. A preconditioned navier–stokes method for two-phase flows with application to cavitation prediction. Comput. Fluids 2000, 29, 849–875. [Google Scholar] [CrossRef]
  16. Merkle, C.; Feng, J.; Buelow, P. Computational Modeling of the Dynamics of Sheet Cavitation. In Proceedings of the 3rd International Symposium on Cavitation, Grenoble, France, 7–10 April 1998. [Google Scholar]
  17. Saito, Y. Numerical analysis of unsteady vaporous cavitating flow around a hydrofoil. J. Kyushu Univ. Health Welf. 2003, 12, 171–176. [Google Scholar]
  18. Singhal, A.K.; Athavale, M.M.; Li, H.; Jiang, Y. Mathematical basis and validation of the full cavitation model. J. Fluids Eng. 2002, 124, 617–624. [Google Scholar] [CrossRef]
  19. Gunter, H.; Sauer, J. Physical and numerical modeling of unsteady cavitation dynamics. In Proceedings of the Icmf-2001, International Conference on Multiphase Flow, New Orleans, LO, USA, 27 May–1 June 2001. [Google Scholar]
  20. Yuan, W.; Sauer, J.; Schnerr, G. Modeling and computation of unsteady cavitation flows in injection nozzles. Mécanique Ind. 2001, 2, 383–394. [Google Scholar] [CrossRef]
  21. Katz, J. Cavitation phenomena within regions of flow separation. J. Fluid Mech. 1984, 140, 397–436. [Google Scholar] [CrossRef]
  22. Laberteaux, K.R.; Ceccio, S.L.; Mastrocola, V.J.; Lowrance, J.L. High speed digital imaging of cavitating vortices. Exp. Fluids 1998, 24, 489–498. [Google Scholar] [CrossRef]
  23. Gehrer, A.; Benigni, H.; Jaberg, H.; Penninger, G. Dimensioning and simulation of process pumps. In Proceedings of the 2004 Pump Users International Forum, Karlsruhe, Germany, 29–30 September 2004; pp. 29–30. [Google Scholar]
  24. Xu, S.; Long, X.P.; Ji, B.; Li, G.B.; Song, T. Vortex dynamic characteristics of unsteady tip clearance cavitation in a waterjet pump determined with different vortex identification methods. J. Mech. Sci. Technol. 2019, 33, 5901–5912. [Google Scholar] [CrossRef]
  25. Han, C.Z.; Xu, S.; Cheng, H.Y.; Ji, B.; Zhang, Z.Y. LES method of the tip clearance vortex cavitation in a propelling pump with special emphasis on the cavitation-vortex interaction. J. Hydrodyn. 2020, 32, 1212–1216. [Google Scholar] [CrossRef]
  26. Tan, D.; Li, Y.; Wilkes, I.; Miorini, R.L.; Katz, J. Visualization and time-resolved particle image velocimetry measurements of the flow in the tip region of a subsonic compressor rotor. J. Turbomach. 2015, 137, 041007. [Google Scholar] [CrossRef]
  27. Long, Y.; An, C.; Zhu, R.; Chen, J. Research on hydrodynamics of high velocity regions in a water-jet pump based on experimental and numerical calculations at different cavitation conditions. Phys. Fluids 2021, 33, 045124. [Google Scholar] [CrossRef]
  28. Long, Y.; Feng, C.; Wang, L.; Wang, D.; Cai, Y.; Zhu, R. Experiment on cavitation flow in critical cavitation condition of water-jet propulsion pump. J. Beijing Univ. Aeronaut. Astronaut. 2019, 45, 1512–1518. (In Chinese) [Google Scholar]
  29. Long, Y.; Zhu, R.; Wang, D. A cavitation performance prediction method for pumps PART1-Proposal and feasibility. Nucl. Eng. Technol. 2020, 52, 2471–2478. [Google Scholar] [CrossRef]
  30. Long, Y.; Zhang, Y.; Chen, J. A cavitation performance prediction method for pumps: Part2-sensitivity and accuracy. Nucl. Eng. Technol. 2021, 53, 3612–3624. [Google Scholar] [CrossRef]
  31. Long, Y.; Zhang, M.; Zhou, Z.; Zhong, J.; An, C.; Chen, Y.; Wan, C.; Zhu, R. Research on cavitation wake vortex structures near the impeller tip of a water-jet pump. Energies 2023, 16, 1576. [Google Scholar] [CrossRef]
  32. Xu, S.; Xiong, Y.; Tang, F.; Li, G.; Long, X.; Ji, B.; Huang, R. The investigation on the flow characteristics during the continuous development of the tip leakage vortex cavitation in an axial pump-jet propulsion. Phys. Fluids 2024, 36, 055152. [Google Scholar] [CrossRef]
  33. Qiu, J.T.; Liu, T.Y.; Liu, X.Y.; Dai, Y.X.; Wang, Z.L.; Cai, Y.L. Experimental and numerical study on cavitation pulsating pressure of water-jet propulsion axial-flow pump. PLoS ONE 2024, 19, e0310167. [Google Scholar] [CrossRef] [PubMed]
  34. Xia, C.Z.; Cheng, L.; Shang, Y.N.; Zhou, J.R.; Yang, F.; Jin, Y. Numerical simulation on the cavitation of waterjet propulsion pump. IOP Conf. Ser. Mater. Sci. Eng. 2016, 129, 012011. [Google Scholar] [CrossRef]
  35. Gong, B.; Zhang, Z.; Feng, C.; Yin, J.; Li, N.; Wang, D. Experimental investigation of characteristics of tip leakage vortex cavitation-induced vibration of a pump. Ann. Nucl. Energy 2023, 192, 109935. [Google Scholar] [CrossRef]
  36. Xu, Z.; Lai, H. Comparison of Cavitation in Two Axial-Flow Water Jet Propulsion Pumps. Processes 2023, 11, 2137. [Google Scholar] [CrossRef]
  37. Huang, R.; Qiu, R.; Wang, Y.; Luo, X.; Zhang, W. Space-time frequency spectra analyses of the unsteady cavitating vortical flows inside a mixed-flow pump. Ocean Eng. 2021, 238, 109758. [Google Scholar] [CrossRef]
  38. Zheng, K.; Long, Y.; Xiang, Q.; Xu, C.; Chen, J.; Wang, D. Study on the experiment and numerical simulation of cavitation flow mechanisms at different flow rates in water-jet propulsion pumps. J. Phys. Conf. Ser. 2024, 2707, 012050. [Google Scholar]
  39. Husband, B.; Bu, M.; Evans, A.G.; Melvin, T. Investigation for the operation of an integrated peristaltic micropump. J. Micmmech. Mieroeng. 2004, 14, 64–69. [Google Scholar] [CrossRef]
  40. Tsunenofi, O.; Yoshiro, I. Comparison of surface damage caused by sliding wear and cavitation erosion on mechanical face seals. Trans. ASME 1987, 107, 200–205. [Google Scholar]
  41. Mishra, C. Investigation of Hydrodynamic Cavitation in Microfluidic System Micro Orifices and Microventuris; Rensselaer Polytechnic Institute: Troy, NY, USA, 2005. [Google Scholar]
  42. Zwaan, E.; Le Gac, S.; Tsuji, K.; Ohl, C.D. Controlled cavitation in microfluidic systems. Virtual J. Nanoscale Sci. Technol. 2007, 16, 2545011–2545014. [Google Scholar] [CrossRef] [PubMed]
  43. Shao, H. Investigation on Cavitation Inside Micro Channel; Zhejiang University: Hangzhou, China, 2012. [Google Scholar]
  44. Su, X.; Song, F.; Xie, W.; Chang, H.; Wang, L. Study on characteristics of internal flow field of water-jet pumps based on bionic airfoil. J. Harbin Univ. Commer. (Nat. Sci. Ed.) 2021, 37, 739–744. (In Chinese) [Google Scholar]
  45. Su, X.Z.; Li, W.J.; Xie, W.C.; Song, F.; Chang, H.Y. Cavitation characteristics of impeller of water jet propulsion pumps based on bionic airfoil. J. Qingdao Agric. Univ. (Ziran Kexueban) 2022, 39, 147–152. (In Chinese) [Google Scholar]
  46. Lu, J.; Zhou, D.; Wang, X.; Su, X.; Zhang, S. Biomimetic airfoil design and flow characteristics based on sturgeon. J. Harbin Univ. Commer. (Nat. Sci. Ed.) 2024, 40, 688–697. (In Chinese) [Google Scholar]
  47. Li, Q.; Xia, S. The impact of airfoil blade tip on the internal flow of small water-jet pumps. China Rural Water Hydropower 2018, 131–135, 139. (In Chinese) [Google Scholar]
  48. Hao, Z.R.; Li, C.; Ren, W.L.; Wang, Y.; Hua, Z.L.; Liu, G. Optimization design of water jet propulsion pump blade based on improved PSO algorithm. J. Drain. Irrig. Mach. Eng. (JDIME) 2020, 38, 566–570. (In Chinese) [Google Scholar]
  49. Menter, F.R. Improved two-equation k-omega turbulence models for aerodynamic flows. NASA Tech. Memo. 1992, 93, 103975. [Google Scholar]
  50. Menter, F.R. Two-equation eddy-viscosity turbulence models for engineering applications. AIAA J. 1994, 32, 1598–1605. [Google Scholar] [CrossRef]
  51. Menter, F.R.; Kuntz, M.; Langtry, R. Ten years of industrial experience with the SST turbulence model. Heat Mass Transf. 2003, 4, 625–632. [Google Scholar]
  52. Zwart, P.J.; Gerber, A.G.; Belamri, T. A two-phase flow model for predicting cavitation dynamics. In Proceedings of the 5th International Conference on Multiphase Flow, ICMF’04, Yokohama, Japan, 30 May–4 June 2004. [Google Scholar]
Figure 1. Schematic diagram of the water jet propulsion pump structure [2] ((a) core hydraulic components and (b) typical structure diagram).
Fluids 10 00227 g001
Figure 2. Experimental research for cavitation performance and optimization of water jet propulsion pumps [2,27,28,29,30,31].
Fluids 10 00227 g002
Figure 3. Numerical calculation model of water jet propulsion pump.
Fluids 10 00227 g003
Figure 4. Structured mesh detail with boundary layer refinement (total cells: 4.76 million).
Fluids 10 00227 g004
Figure 5. CFD calculation boundary condition settings.
Fluids 10 00227 g005
Figure 6. Mesh independence verification with different schemes.
Fluids 10 00227 g006
Figure 7. Schematic diagram of closed-circulation experimental system for the water jet propulsion pump.
Fluids 10 00227 g007
Figure 8. Blade shape at span = 0.5 under different schemes: (a) original model; (b) Scheme 1; (c) Scheme 2; and (d) Scheme 3.
Fluids 10 00227 g008
Figure 9. Experimental research of cavitation structures in design conditions in the water jet propulsion pump [2]. (a) NPSHa = 12.15 m; (b) NPSHa = 9.33 m; (c) NPSHa = 8.64 m; (d) NPSHa = 7.90 m; (e) NPSHa = 7.57 m; (f) NPSHa = 7.22 m; (g) The water jet propulsion pump cavitation curve at different condition, A. the initial cavitation condition; B. the inception cavitation condition; C. the cavitation development transition condition; D. the first critical cavitation condition; E. the critical cavitation condition; F. the cavitation breakdown condition.
Fluids 10 00227 g009
Figure 10. Visualization and evolution of cavitation flow in the water jet propulsion pump (T/12 intervals).
Fluids 10 00227 g010
Figure 11. Cavitation performance curve of the original model (critical NPSH = 5.225 m at 3% head drop).
Fluids 10 00227 g011
Figure 12. Cavitation performance curve of Scheme 1 (critical NPSH = 6.3 m at 3% head drop).
Fluids 10 00227 g012
Figure 13. Cavitation performance curve of Scheme 2 (critical NPSH = 5.8 m at 3% head drop).
Fluids 10 00227 g013
Figure 14. Cavitation performance curve of Scheme 3 (critical NPSH = 5.18 m at 3% head drop).
Fluids 10 00227 g014
Figure 15. Summary of cavitation performance curves under different airfoil schemes ((a) full-length curve and (b) local amplification curve).
Fluids 10 00227 g015
Figure 16. Distribution of cavitation regions of three airfoil configurations at different Ha values ((A) NACA0009_0004; (B) NACA0009-13_0004-13; and (C) NACA0009-16_0004-16).
Fluids 10 00227 g016
Figure 17. NACA0009_0004 airfoil velocity isosurface under different cavitation conditions ((a) Ha = 10.34 m; (b) Ha = 8.16 m; (c) Ha = 7.14 m; (d) Ha = 6.63 m; and (e) Ha = 6.12 m).
Fluids 10 00227 g017aFluids 10 00227 g017b
Figure 18. NACA0009-13_0004-13 airfoil velocity isosurface under different cavitation conditions ((a) Ha = 10.34m; (b) Ha = 8.16m; (c) Ha = 6.63m; (d) Ha = 6.12m; and (e) Ha = 5.87m).
Fluids 10 00227 g018aFluids 10 00227 g018b
Figure 19. NACA0009-16_0004-16 airfoil velocity isosurface under different cavitation conditions ((a) Ha = 10.34m; (b) Ha = 6.12m; (c) Ha = 5.71m; (d) Ha = 5.51m; and (e) Ha = 5.41m).
Fluids 10 00227 g019aFluids 10 00227 g019b
Figure 20. Comparison between experimental and numerical simulation results.
Fluids 10 00227 g020
Figure 21. Comparison of the variation laws of flow loss and entropy generation inside the pump.
Fluids 10 00227 g021
Table 1. Wall y+ values of each component.
ComponentWallMinimum Wall ValueMaximum Wall ValueAverage Wall ValueAverage Component Value
Inlet pipePipe wall1.08315.8824.1104.151
Deflector1.16817.7276.549
ImpellerHub0.0384.7392.0043.504
Blade0.05115.6734.212
Edge0.13110.2023.198
DiffuserHub0.0497.1502.0753.714
Blade0.04110.3304.035
Edge0.13110.2023.937
Outlet pipeShaft5.49512.7378.0007.518
Pipe wall5.3239.8577.368
Table 2. Numerical calculation results of the original model cavitation performance under different pressures.
CategoriesEFFH (m)HDP (%)NPSH (m)
101,3250.890614.350.0010.04
90,0000.891014.350.038.88
80,0000.891614.360.087.86
70,0000.891014.380.206.84
60,0000.881414.440.635.82
55,0000.839314.430.555.38
54,7500.835114.400.365.29
54,5000.835614.410.475.26
54,0000.810113.65−4.875.20
53,7500.795412.92−9.935.18
52,5000.67978.72−39.255.08
Table 3. Numerical calculation results of Scheme 1 cavitation performance under different pressures.
CategoriesEFFH (m)HDP (%)NPSH (m)
101,3250.885013.970.0010.04
80,0000.886213.990.127.86
70,0000.881014.010.296.84
65,0000.837113.86−0.806.34
60,0000.58266.73−51.845.98
Table 4. Numerical calculation results of Scheme 2 cavitation performance under different pressures.
CategoriesEFFH (m)HDP (%)NPSH (m)
101,3250.887714.000.0010.04
80,0000.888714.020.137.86
70,0000.888614.020.176.83
65,0000.881714.020.186.33
60,0000.820213.83−1.225.82
57,5000.756110.99−21.475.63
Table 5. Numerical calculation results of Scheme 3 cavitation performance under different pressures.
CategoriesEFFH (m)HDP (%)NPSH (m)
101,3250.883613.490.0010.04
80,0000.882813.49−0.017.86
70,0000.887013.540.386.84
65,0000.889413.590.716.32
60,0000.884713.651.185.81
57,5000.887013.751.895.55
56,0000.878513.832.515.40
55,0000.870913.792.215.33
54,0000.842313.540.395.20
53,0000.783311.44−15.195.12
Disclaimer/Publisher’s Note: The statements, opinions and data contained in all publications are solely those of the individual author(s) and contributor(s) and not of MDPI and/or the editor(s). MDPI and/or the editor(s) disclaim responsibility for any injury to people or property resulting from any ideas, methods, instructions or products referred to in the content.