Article

Laminar Pipe Flow Instability: A Theoretical-Experimental Perspective

1
LSTM-Erlangen, FAU Erlangen-Nuremberg, Cauerstraße 4, D-91058 Erlangen, Germany
2
Department of Aerodynamics and Fluid Mechanics, BTU Cottbus-Senftenberg, D-03046 Cottbus, Germany
*
Author to whom correspondence should be addressed.
Fluids 2025, 10(8), 216; https://doi.org/10.3390/fluids10080216
Submission received: 10 June 2025 / Revised: 21 July 2025 / Accepted: 7 August 2025 / Published: 18 August 2025
(This article belongs to the Section Turbulence)

Abstract

This paper revisits the theoretically predicted inherent stability of fully developed laminar pipe flow, which remains unconfirmed by experimental evidence. A recently developed theory of pipe-flow stability/instability addresses the gap between experimental observations and classical theoretical predictions by accounting for a parallel secondary flow through the pipe’s roughness layer that accompanies the main stream. This secondary flow alters the near-wall velocity profile in the rough-wall region, creating an inflection point that promotes shear-driven instabilities and triggers the laminar-to-turbulent transition. A stability factor S = D c / D is introduced, where D is the nominal pipe diameter and D c refers to the critical pipe diameter. The pipe flow remains laminar and stable for S > 1.0 , and becomes unstable for S < 1 . Various experimental findings are theoretically derived, and the laminar-to-turbulent transition is identified at S = 1.0 . Particular attention is paid to the dependence of flow transition on both pipe diameter and pipe length. Rather than relying on a critical Reynolds number R e c , this study proposes the critical pipe diameter D c as the key parameter governing the laminar pipe flow instability, where R e c refers here to the condition-dependent threshold at which laminar pipe flow becomes unstable and transition to turbulence occurs. The present analysis further suggests that instability arises only if the pipe length L exceeds a critical threshold L c , that is, L > L c . The theoretical treatment presented provides deeper physical insights into the onset of laminar pipe flow instability including the phenomenon of reverse transition. It also distinguishes between natural and forced flow transitions, providing a refined understanding of the transition process. Finally, suggestions for future experimental work are made to further validate or challenge this new theoretical perspective on pipe flow instability.

1. Introduction

Mechanical systems generally consist of components that have specific mechanical properties, including their natural frequencies. Oscillations of these components around their natural frequencies occur when they are excited. When resonance occurs, the system absorbs more energy from the driving force, leading to an increase in the oscillating amplitude. This can result in excessively violent motions, potentially causing partial failures of certain components of the system due to improper design or construction. Therefore, the natural frequencies of all components in a mechanical system must be carefully considered to ensure that the system’s driving elements do not resonate with the natural frequency of any part of the structure. If this frequency coupling is not taken into account, a “resonance disaster” can occur, leading to a complete system failure. Known examples of “resonance disasters” include seismic zone building failures, wind-induced bridge collapses, and/or vortex-induced failure of hydraulic structures of all kinds. A pipe flow test rig is a mechanical system consisting of several subcomponents, such as a high-pressure blower, plenum chamber, pipe contraction, pipe test section, pipe outlet into a laboratory, etc. The aim of the entire system can be to establish a fully developed laminar pipe flow to investigate its stability/instability and the transition to turbulence along the pipe test section. In order to maintain the property of the fully developed laminar pipe flow, it is essential to ensure that the natural frequencies of the facility components do not resonate with those of the actual pipe flow. The relevant natural frequencies for pipe flow are as follows:
  • Diffusion frequency: f D = ν / D 2 , where ν = the kinematic viscosity of fluid and D = the pipe diameter;
  • Convection frequency: f c = U ˜ / L , where U ˜ = the spatial mean velocity of the pipe flow and L = the pipe length;
  • Acoustic frequency: f a = c / L , where c = fluid speed of sound;
  • Exit vortex frequency: f e = S t U ˜ D , where S t = Strouhal number.
If the natural frequencies of pipe-test-rig components resonate with the frequencies of the pipe flow, “resonance instabilities” can destabilize the laminar pipe flow, triggering a transition to turbulence. This is analogous to resonance-driven failures, such as wind-induced bridge collapses, where the structure loses functionality. Similarly, resonance instabilities disrupt the pipe test-rig’s ability to maintain fully developed laminar flow, causing transition to turbulence. Irregularities in the pipe wall roughness introduce local disturbances into the flow field, resulting in unsteady near-wall motions characterized by dominant frequencies associated with vortex shedding and/or flow separation induced by the roughness elements. These frequencies can resonate with the natural instability modes of the laminar flow, thus destabilizing the mean velocity profile, particularly when an inflection point is present near the wall, as discussed by [1]. The Strouhal number defined above provides a dimensionless framework for describing how these frequencies scale with the flow velocity and the geometric characteristics of the roughness elements, such as their height, spacing, or shape.
To explore the above-mentioned hypothesis, the authors and some of their colleagues looked into the laminar-to-turbulent transition in pipe flows triggered by ring-type obstacles mounted on the interior wall surface at the pipe inlet, see, e.g., [2]. They demonstrated numerically that wall-mounted obstacles triggered turbulence when they induced ring-type vortex shedding. This is referred to as “forced transition”. Without such vortex shedding, the flow remains laminar, if not triggered by frequency resonances of the above given frequencies of the pipe flow itself. However, the flow studied by [2] remained laminar without the mentioned vortex shedding. Also, the shedding of vortices required a certain frequency to turn the flow to become turbulent, see [3].
Forced transition caused by “oscillations” of flows of test rig components, such as plenum chambers acting as Helmholtz resonators, was also explored by [3]. Their theoretical results were compared with available experimental data, showing good agreement. However, in the existing literature, when the transition of the fully developed laminar pipe flow is treated theoretically, no additional components of the pipe facility, other than the pipe section itself, are taken into account. Hence, the externally triggered, resonance transition cannot be treated theoretically in this way, i.e., “forced transition” cannot be treated by traditional linear instability considerations.
In most theoretical studies, it is assumed that the components of a “virtual test section” provide a parabolic velocity profile for linearized stability analysis. These treatments yield an inherent stability of laminar flows with first results being derived by Sexl and co-workers, e.g., see [4,5]. Later research, e.g., summarized by [6,7], confirmed these findings through the linear instability computations, see also [8,9,10]. Thus, from the existing literature, two distinct types of laminar flow instabilities are recognized:
  • Instability triggered by the flow through the test-rig components of the experimental setup, leading to the transition to turbulence = forced transition.
  • Instability inherent to the pipe flow itself, independent of any test section components = natural transition.
If the original pipe flow possesses a parabolic velocity profile, no “natural pipe flow transition” occurs when theoretically treated. The assumed parabolic velocity profile in pipe flow has no property to cause velocity oscillations to increase in the pipe. The experimentally observed instability must stem from a velocity profile that deviates from the standard parabolic shape, see [3,7]. This is demonstrated theoretically in the present paper, and thus, it is not surprising that the theoretically deduced flow stability, based on linear instability analysis, differs from experimental findings.
We shall begin our own stability considerations by looking, carefully, at the early research work of [11]. Noting that, Reynolds [11] reported experimental results, suggesting two different types of pipe flow transitions:
  • In their paper, in pages 970 and 971, Reynolds [11] reported results for laminar pipe flow transition in pipes with diameters D 1 = 6.15 mm and D 2 = 12.7 mm, both occurring at approximately similar critical Reynolds numbers: ( R e D 1 ) c 2073 and ( R e D 2 ) c 2278, respectively. These values are in close agreement with the critical Reynolds number R e c 2130, recently proposed by [3] and earlier by Fox et al. [12]. They reported two key findings: flow stability depends on both disturbance frequency and Reynolds number, and instability begins at a critical Reynolds number of about 2130 for the first azimuthal mode. Note that ( R e D ) c is defined as ( R e D ) c = U ˜ c · D / ν and R e c = U ˜ c · D c / ν , where U ˜ c is the critical velocity of the pipe flow and D c is the critical pipe diameter.
  • In Table 1, on page 954, Reynolds (1883) reported also, for one set of experiments, about critical velocities at which the steady flow motion breaks down for three different pipe diameters ( D 1 = 26.8 mm , D 2 = 15.27 mm , D 3 = 7.886 mm ), yielding average critical Reynolds numbers of ( R e D 1 ) c = 12 , 694 , ( R e D 2 ) c = 22 , 337 , ( R e D 3 ) c = 43 , 705 , respectively, i.e., the smaller the pipe diameters, the higher the critical Reynolds numbers.
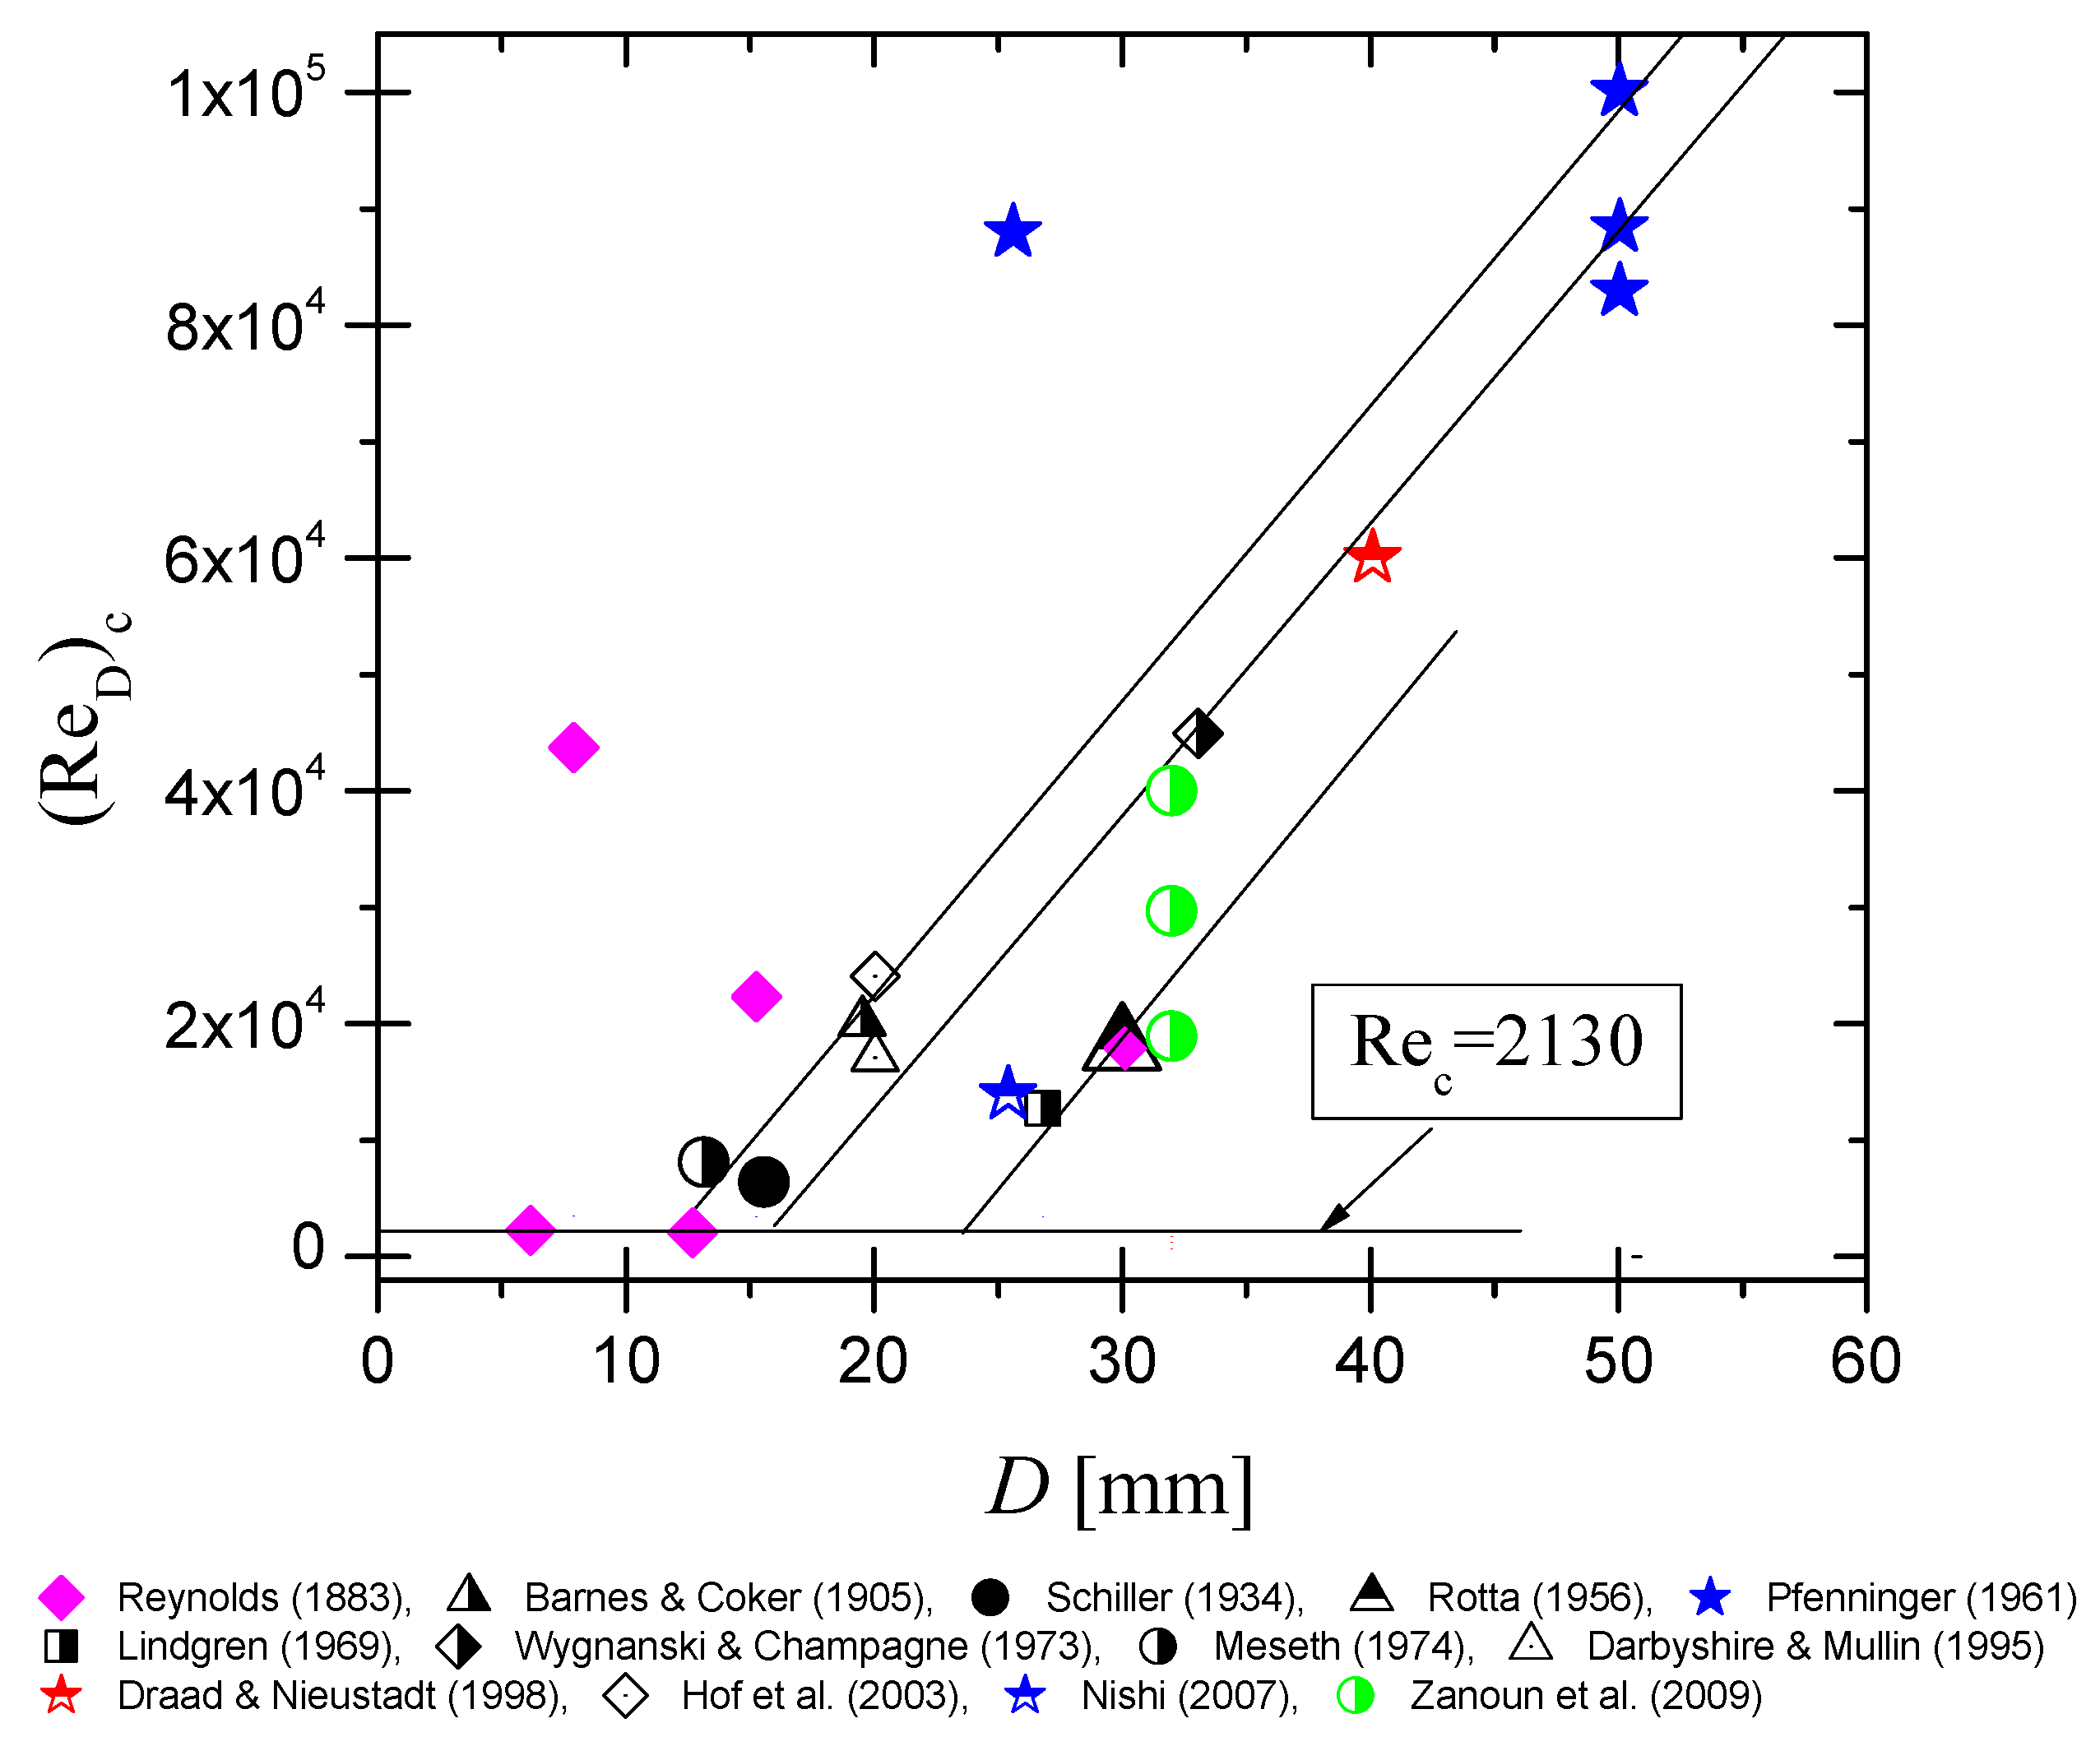
Later studies, such as those carried out by [13], indicated a relation between the critical Reynolds number of transition and the pipe diameter, ( R e D ) c = f ( D ) , as shown in Figure 1. This figure indicates that the larger the pipe diameter is, the higher the critical Reynolds number ( R e D ) c . This is different to the finding of [11], where he measured and reported in Table 1 in their paper the highest critical Reynolds number ( R e D ) c for their smallest pipe diameter, as summarized above. This discrepancy might be attributed to the pipe length effect, see [14,15,16]. In the same paper, as mentioned earlier, Reynolds [11] reported in Table III data from another set of experiments and for two pipe diameters, namely, D A = 6.15 mm & D B = 12.7 mm , obtaining for this set of experiments the same critical Reynolds number ( R e D ) c as reported above.
It is the aim of this paper to clarify the apparent discrepancies in the ( R e D ) c -dependence of the experimental data on the pipe diameter, i.e., ( R e D ) c = f ( D ) . For better explanations, theoretical considerations of [27] will be employed and extended. Experimental results will also be used to verify the theoretically deduced results of other pipe flow properties beyond ( R e D ) c = f ( D ) , e.g., the dependence of ( R e D ) c also on the pipe length L. A critical pipe length L c will be introduced, extending the theoretical derivations, suggesting that laminar pipe flows stay stable when the actual pipe length does not exceed the critical pipe length for similar inlet flow boundary conditions. Considering the theoretically based critical pipe diameter and critical pipe length in the analysis allows better understanding of the experimentally observed laminar-to-turbulent and turbulent-to-laminar transitions.
Additionally, the paper demonstrates that the apparent variations in the critical Reynolds number’s dependence on pipe diameter arise from presenting the same data in different ways. Therefore, it is a main objective of this paper to remedy the contradicting findings, as shown in Figure 1 and those already presented by [11]. As mentioned above, the inherent stability, found theoretically for laminar pipe flows with parabolic velocity profiles, resulted in high confusion in fluid mechanics. This finding contradicted extensive experimental results obtained since Reynolds’ [11] experiments. All subsequent investigations have resulted in the following fundamental knowledge for transitions in laminar pipe flows:
  • Experiments show that laminar pipe flows stay stable up to a critical Reynolds number.
  • Theoretical Investigations show that fully developed laminar pipe flows are inherently stable even for R e .
  • There are laminar pipe flow experiments available that show a stability dependence on the pipe diameter and the pipe length.
  • Regarding the diameter dependence, contradictory data are available: some show an increase of ( R e D ) c with D, see Figure 1, while others, e.g., Reynolds’ [11] experiments, indicate a decrease of ( R e D ) c with D.
  • Available experiments have shown that turbulent pipe flow can instantly become laminar, i.e., reverse transition occurs.
The present paper provides a physical explanation for all of the above observations regarding the onset of laminar pipe flow transitions. The paper is structured as follows:
  • A new theory, predicting the instability of fully developed laminar pipe flow, see [27], is applied to analyze the dependence of flow transition on pipe diameter and pipe length.
  • Comparisons are made with relevant experimental studies from the literature. To facilitate references, diagrams are presented alongside citations of the corresponding papers, eliminating the need for the reader to search for them separately.
  • Using the theoretical framework of [27], we analyze fully developed laminar pipe flow instability, yielding results that closely match experimental data from [12], yielding a critical Reynolds number of Re c = 2130. Fox et al. [12] introduced oscillatory disturbances at preferred frequencies to investigate how such excitations interacted with the natural frequencies of the pipe flow and influenced its stability.

2. Theoretical Treatments of Dependence of Pipe Flow Transition on Pipe Diameter and Length

2.1. General Remarks and Short Literature Survey

In the literature, numerous studies have addressed the laminar-to-turbulent transition in pipe flows through theoretical treatments of experimental observations, e.g., see summaries by [6,7,8,9]. Theoretical treatments, however, do not predict the pipe flow instabilities found experimentally. This is a fundamental problem, frequently stressed in fluid mechanics, which has existed since the pioneering work of [11]. However, no satisfactory theoretical solution had been provided until recently; see [27]. They proposed a theoretical treatment for the pipe flow transition triggered by obstacles and/or by plenum chambers of test rigs. The suggestions put forward in these papers indicate that the transition in pipe flow is triggered by resonances between the natural frequencies of test rig components and those of the pipe flow itself. This prompted [27] to develop a theoretical framework for the onset of pipe flow instability/transition, providing results that prove, qualitatively and partially quantitatively, available experimental results. This framework is used in this paper to validate both existing experimental findings available in the literature and experimental results of the present authors. In addition, results, available in the PhD theses of [13,28,29], all supervised by the first author of this paper, are also employed to demonstrate the “correctness” of the physics utilized in the present theoretical considerations.
It is clear from the existing literature, without any further questions, that the laminar fully developed flows in pipes, with completely smooth walls, are inherently stable for all Reynolds numbers, if the triggering disturbances are not high enough; see [4,5]. However, the existing literature claims that large-amplitude disturbances can turn the laminar pipe flows into a turbulent state. This is not the case for all large-amplitude disturbances and/or for all pipe diameters and pipe lengths. This extracted knowledge is deduced from the presented theoretical considerations and, e.g., the experimental data of Haddad [28]. The latter will also be used to verify this finding. Nevertheless, the major work carried out by the present authors aims to experimentally show and theoretically explain why the critical Reynolds number of the pipe flow transition can be either constant or dependent on both the pipe diameter and the pipe length.
We shall start out the authors’ own theoretical work with reference to [2,3,27]. For this purpose, a pipe test rig is considered with its major components being sketched in Figure 2. The theoretically considered test section in this paper consists of a “fluid container/laboratory” that can be operated under pressure condition if a pump for liquids or a blower for gases is used to drive the flow. A plenum chamber is a major component, usually employed in pipe flow test rigs, to condition the velocity profile and reduce unwanted velocity fluctuations, see [30]. Before the actual pipe flow test section, a triggering device might be integrated to turn the pipe flow from its laminar into its turbulent state. Lastly, in all open-return test rigs, the actual pipe exits its flow into a laboratory.
A test rig of this kind was employed by [2] where it was assumed that all upstream test components, before the actual triggering device, are used to provide the flow with an incoming parabolic laminar velocity profile. This profile was exposed to a ring type obstacle located at the front of the actual pipe test section. From there on, direct numerical flow computations were performed, yielding no laminar-to-turbulent transition for obstacles with heights below a “critical height” h c . For these obstacle heights, no vortex shedding was observed numerically. For a height of h > h c , the flow behind the obstacle showed vortices shedding from the obstacle and, for this reason, the flow turned turbulent. Due to limitation of the availability of CPU time, Durst et al. [2] only carried out two direct numerical simulations, one for a height h < h c and the other for h > h c . The flows, in both selected cases for numerical studies, stayed laminar for h < h c and turned turbulent for h > h c . From those numerical results, Durst [27] concluded that natural resonances/frequencies of components of the pipe flow test rig and the natural frequencies of the pipe flow itself are causing the transition. Applying this “resonance theory”, Durst et al. [3] derived a number of dependencies of the pipe flow transition on the length-to-diameter ratio L / D , the pipe diameter D, etc. However, no background theory was provided by [3]. The actual theory followed in [27] and is now available to be applied to explain, theoretically, different results known from the numerous experiments available in the literature. The present paper makes efforts in this direction, i.e., to explain the dependence of the critical Reynolds number on the pipe diameter, the pipe length and other pipe parameters like the roughness of the interior surface of the pipe wall. Extensive results on those dependencies exist in the literature, e.g., see Figure 1, and the authors themselves have experimental results that will be employed, yielding proofs of the deduced theoretical data.

2.2. Theory of Durst Revisited

2.2.1. Dependence on the Pipe Diameter

Durst [27] emphasized the necessity of accounting for wall roughness in the theoretical analysis of the onset of laminar pipe flow instability induced by the wall itself. He introduced a roughness layer of thickness δ (see Figure 2) and proposed that the flow within this layer behaves similarly to flow through a porous medium with spatially varying permeability k ( y ) . In this context, permeability characterizes the capacity of the pipe’s rough interior surface to permit fluid motion through its microstructure. This roughness layer acts, therefore, as a porous sublayer, enabling partial momentum exchange between the main flow and the near-wall region. The local permeability k ( y ) is defined using Darcy’s law as:
U p ( r ) = k ( y ) μ d P d z
where U p ( r ) = streamwise velocity in the porous medium [m/s], k ( y ) = local permeability of the porous medium [m2], μ = streamwise dynamic viscosity of fluid [Pa.s], and ( d P d z ) = pressure gradient needed to drive the flow [Pa/m]. For a linear perme- ability distribution:
k = k 0 1 y δ
where k 0 = maximum permeability of wall roughness. Durst [27] showed that the introduced, moderately, rough wall layer results in a slip flow with a velocity U 0 at the inner side of the roughness layer, i.e., at the location r = R , see Figure 2, where the y-coordinate starts at r = R and ends at r = R + δ , where R is the pipe radius. This yields for the “entire pipe flow” a velocity profile approximately described by:
U z ( r ) = R 2 4 μ 1 r R 2 d P d z + U 0
At the location r = R , where y = 0 and k = k 0 , we can write U z ( R ) , with sufficient accuracy for the present considerations, as follows:
U z ( R ) = U 0 = k 0 μ d P d z
Hence, the mean velocity profile for the entire/total flow in the pipe, i.e., Equation (3), including the rough wall layer can be re-written as:
U z ( r ) = R 2 4 μ 1 r R 2 + k 0 μ d P d z
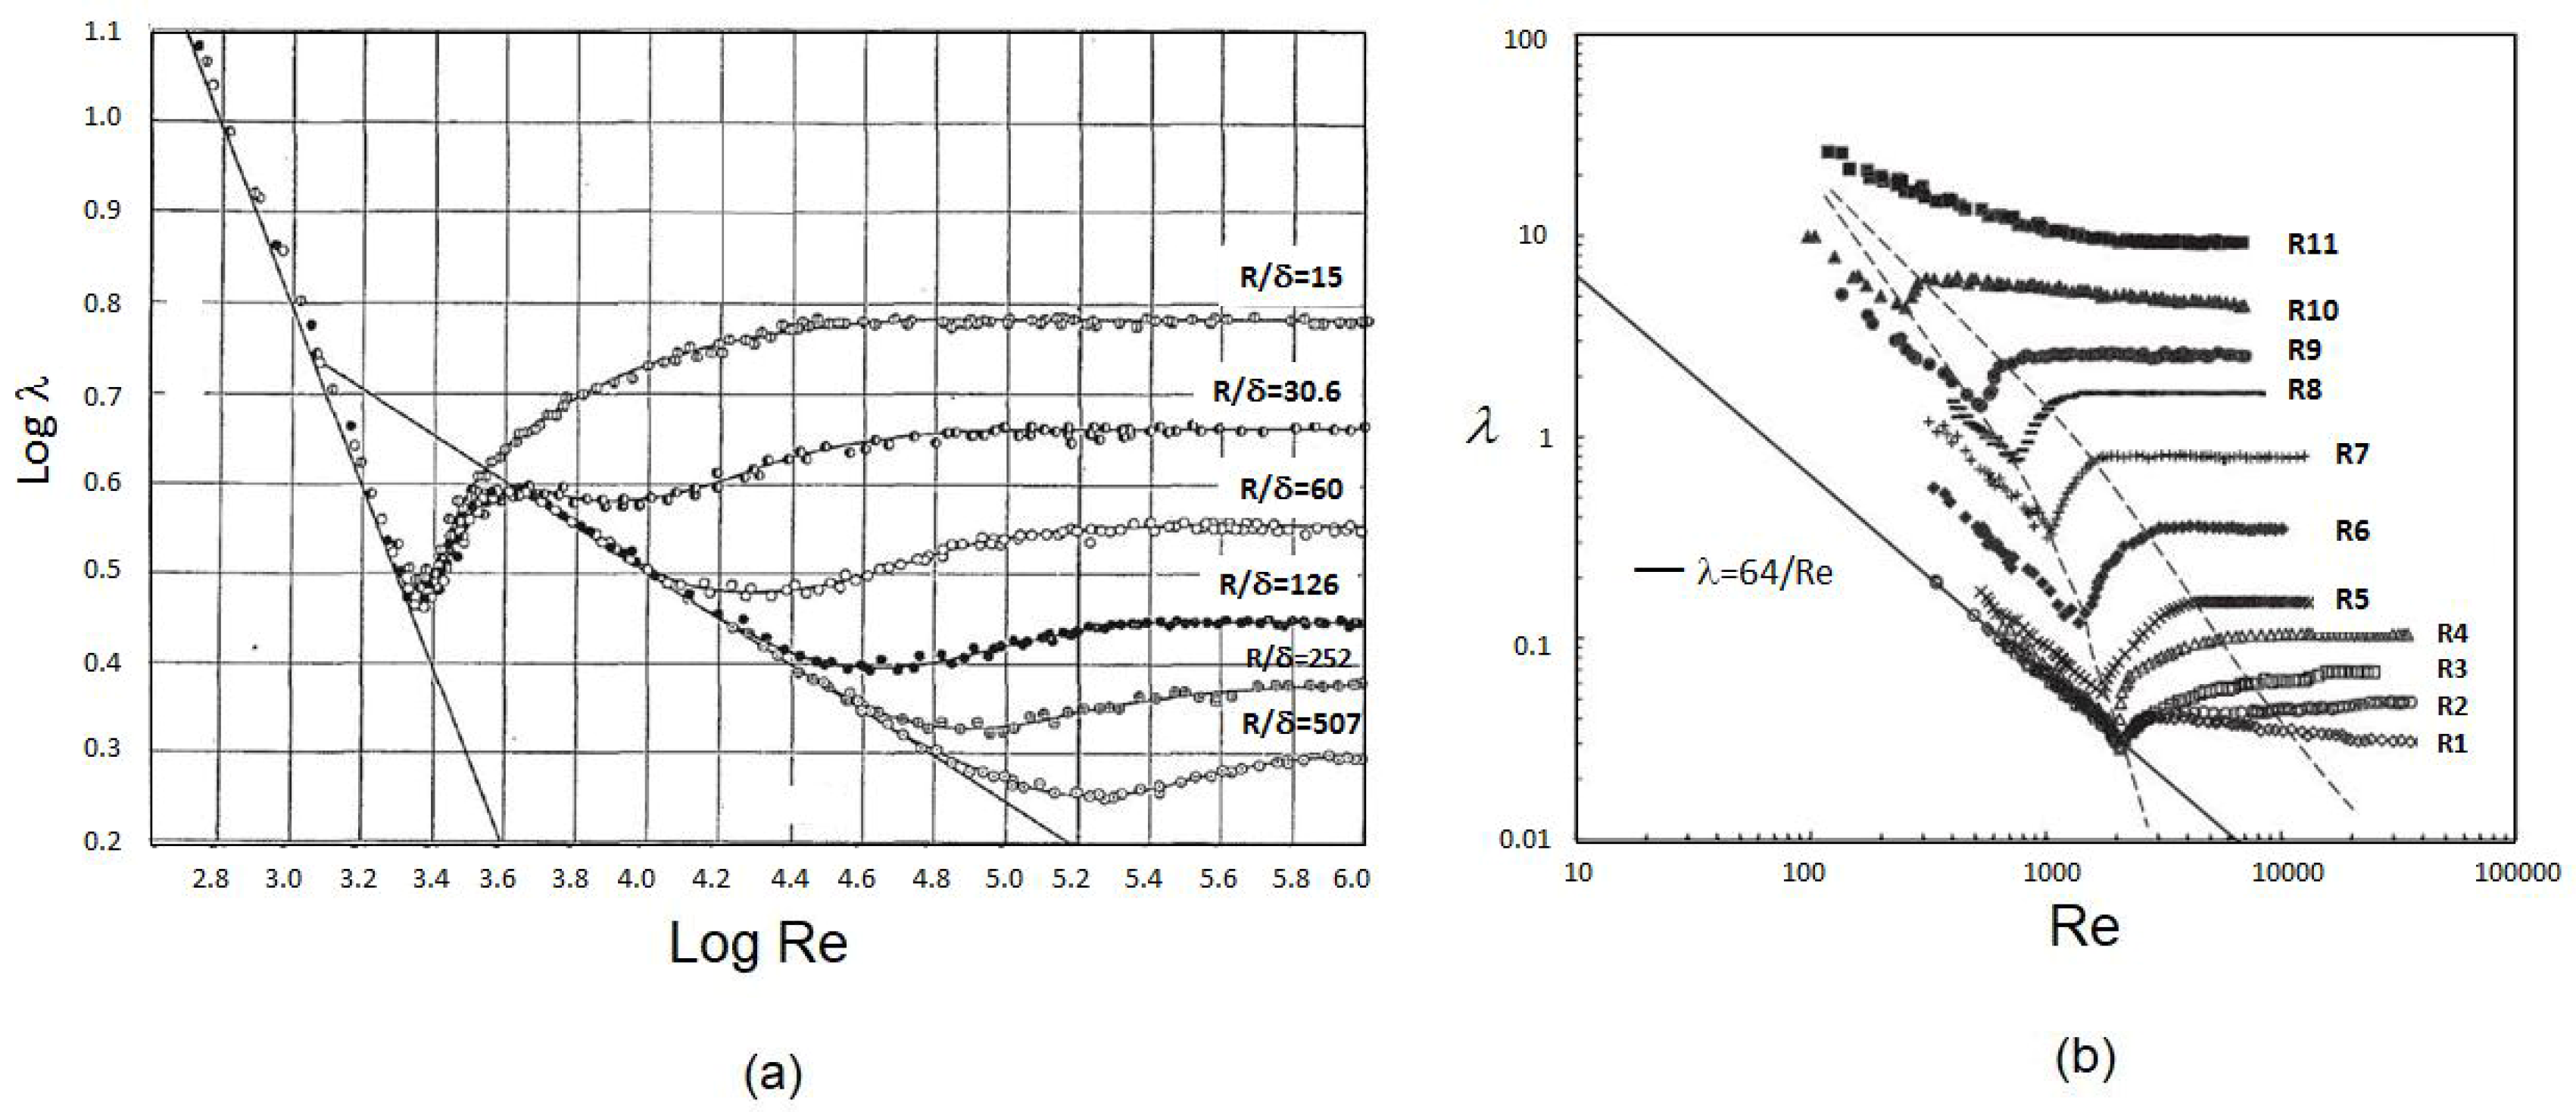
Experimental data on pipe flow, such as those from [31,32], confirm Durst’s [27] theory that flow within the wall layer influences the transition of laminar pipe flow and, consequently, the wall friction data. The flow resistance through the wall layer reduces the mean velocity of the main flow, which consequently results in an over-estimation of the laminar wall skin friction factor, as shown in Figure 3. The measured corresponding friction factor for laminar pipe flows was, therefore, slightly higher than the theoretically predicted skin friction, given by λ = 64 / R e . This apparent discrepancy arises from the exclusion of flow within the rough-wall layer in the theoretical considerations of the main flow. Corresponding data of Nikuradse’s data [33], shown in Figure 3a, and more recently from Huang et al. [34], in Figure 3b, confirm this behavior. For moderately rough walls, a small portion of the flow passes through the rough pipe layer, which is not accounted for when plotting the experimental data presented in Figure 3. As a result, the measured mean velocity is slightly lower than that calculated from the total mass flow rate, leading to higher values of the friction data. However, no discrepancy arises when using the actual velocity profile of the main flow to compute V ˙ m a i n . Thus, for moderately rough walls, we can express:
U ˜ m a i n = V ˙ m a i n ( π / 4 ) D 2 < V ˙ t o t a l ( π / 4 ) D 2 with V ˙ t o t a l = V ˙ m a i n + 1 2 U 0 · 2 π R δ
where V ˙ m a i n is the measured volume flow rate of the main flow outside the wall layer and V ˙ t o t a l is the volume flow rate of the entire/total flow. Hence, the claim is that:
λ e x p . = 4 τ w ( ρ / 2 ) U ˜ m a i n 2 > λ t h e o . 64 R e
which shifts the experimental laminar friction data above the theoretical line λ t h e o . 64 / R e . This behavior was observed in Nikuradse’s [33] data for the laminar flow regime, as depicted in Figure 3a. Those findings are also in basic agreement with the higher friction values obtained by Huang et al. [34], see Figure 3b, for pipe flow with very “rough walls”, presenting flow conditions similar to those derived by the present authors in Equation (7).
In general, flow inside the rough layer of the pipe wall, i.e., in the range R < r ( R + δ ) , can be expressed as:
U z ( y ) = k 0 μ 1 y δ d P d z
The gradient of the mean velocity distribution within the rough-layer is given by:
d U z ( y ) d y = k 0 μ 1 δ d P d z
At the wall-normal location r = R , the parabolic velocity distribution of the main flow has the following slope:
d U z ( r ) d r = 2 R 4 μ d P d z
Since both flow gradients are negative and ( d P / d z ) is also negative, this leads to flow in the positive streamwise direction. The actual flow can now be derived by matching the two slopes expressed by Equations (9) and (10) using the matched asymptotic method proposed by [35,36,37,38]. At the matching point, i.e., r = R and y = 0 , both velocity gradients d U z ( y ) / d y and d U z ( r ) / d r must be equal when the velocity profile is stable. This results in the introduction of a “critical pipe diameter”, entirely defined by the roughness properties of the pipe material:
D c = 4 k 0 δ
where
  • k 0 = maximum permeability at r = R [m2];
  • δ = thickness of roughness layer [m];
  • D c = critical pipe diameter [m].
  • This indicates that the stability of the pipe flow and, hence, the laminar-to-turbulent transition of pipe flow, is characterized by a critical pipe diameter D c , which is entirely defined by wall roughness properties only.
Furthermore, for certain roughness properties such as k 0 and δ as well as the pipe diameter D, the mean velocity distribution exhibits an inflection point close to the wall layer and it shows, therefore, an inherent instability as recently pointed out by [27]. He introduced a flow stability parameter “S” defined as follows:
S = 4 k 0 δ · 1 D = D c D ( stability factor )
S” was derived to examine the stability of the fully developed laminar pipe flows, which can be classified as: stable (when the stability parameter S > 1.0 , i.e., D < D c ), unstable (when the stability parameter S < 1.0 , i.e., D > D c ), and critical (when the stability parameter S = 1.0 , i.e., D = D c ). Noting that, when the slope of the velocity profile in the wall layer is steeper than the slope of the parabolic velocity profile of the main flow close to r = R , no inflection point exists and the laminar pipe flow stays stable. On the other hand, when the slope of velocity profile in the wall layer is smaller than the slope of the parabolic velocity profile of the main flow, at r R , an inflection point exists in the velocity profile and the flow becomes unstable.
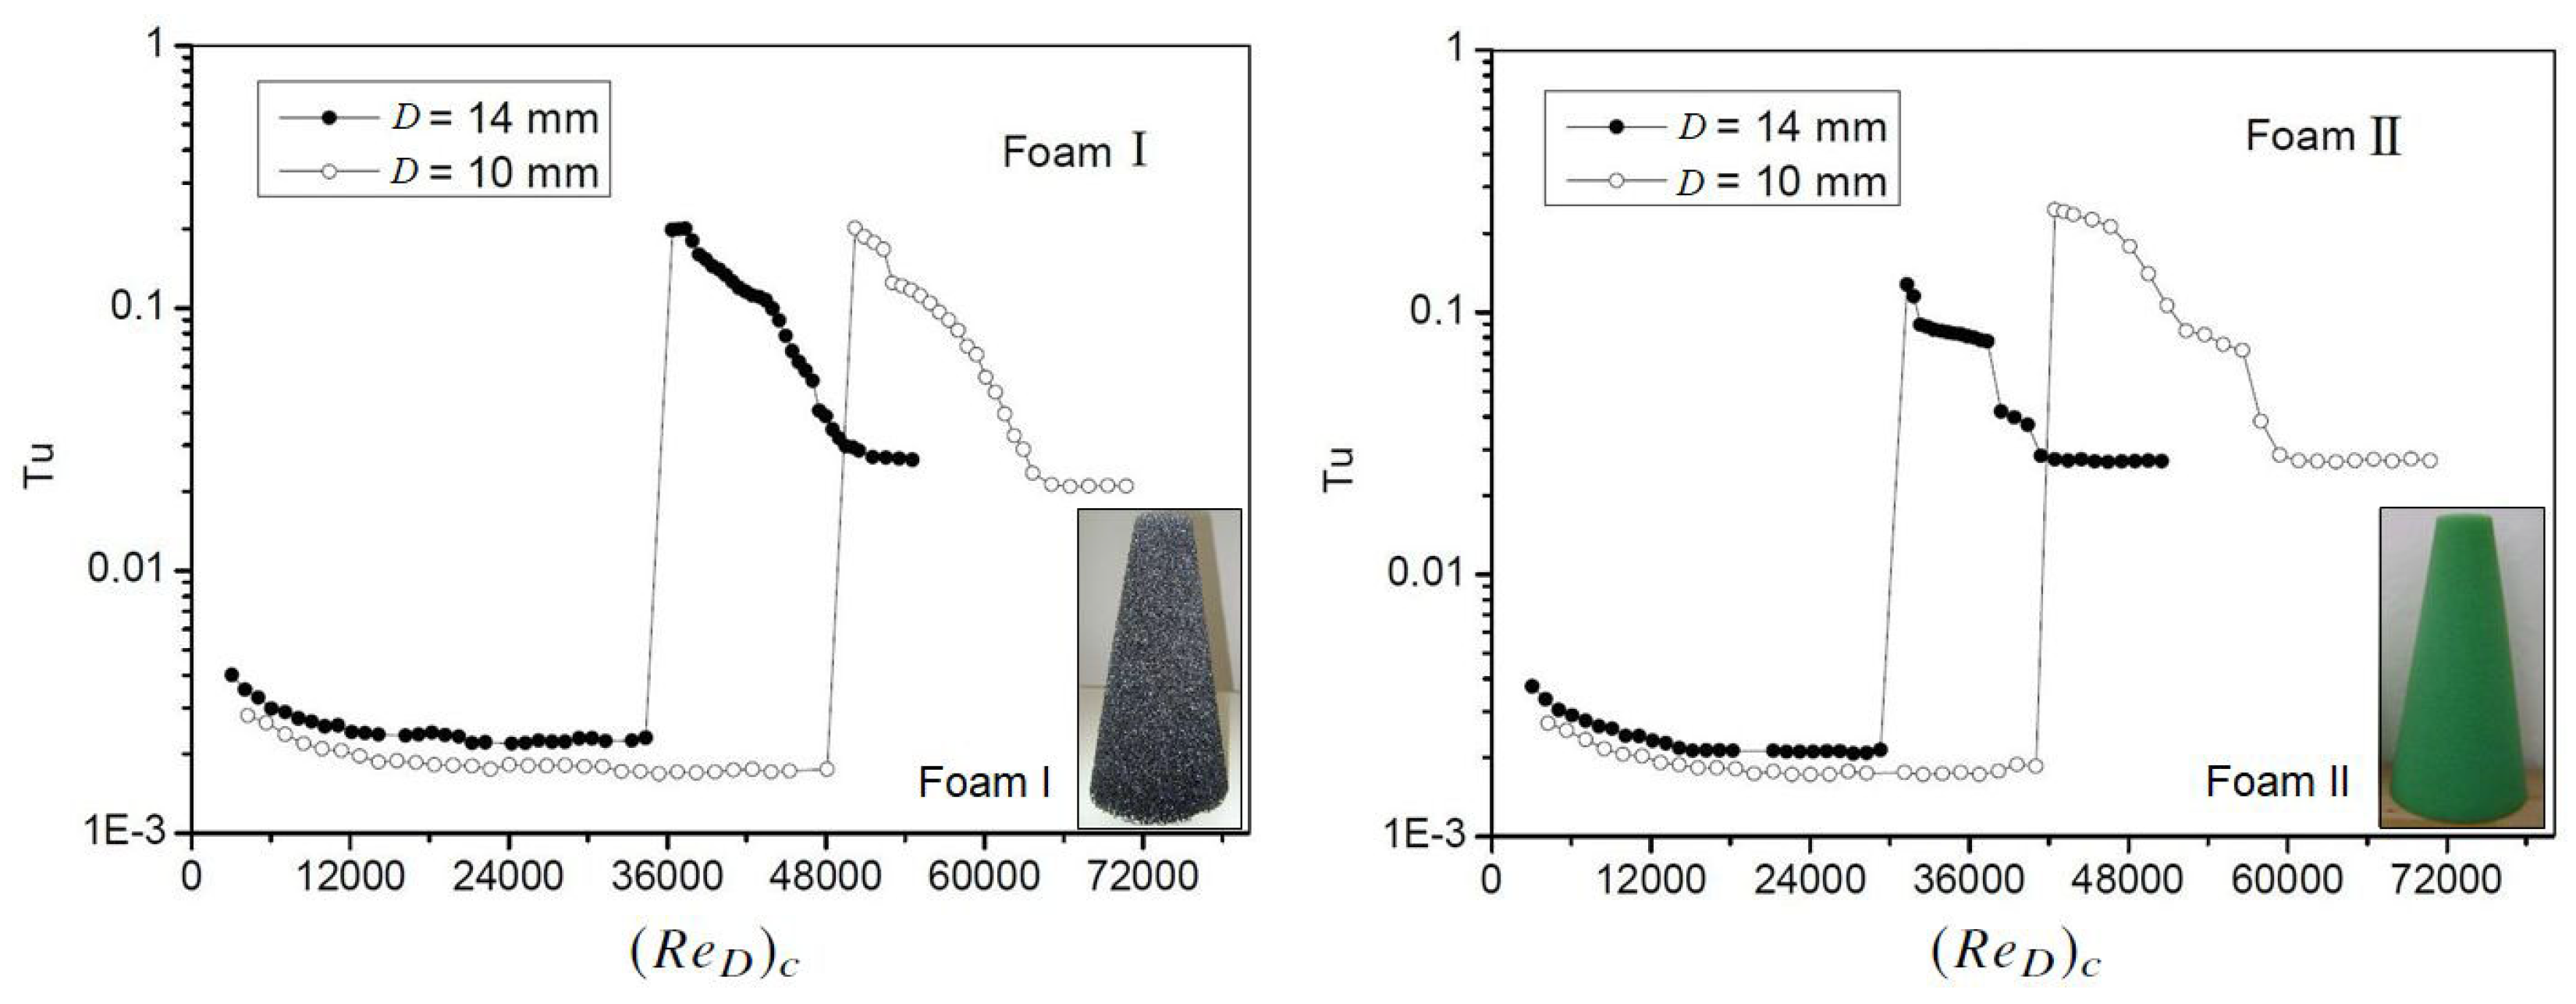
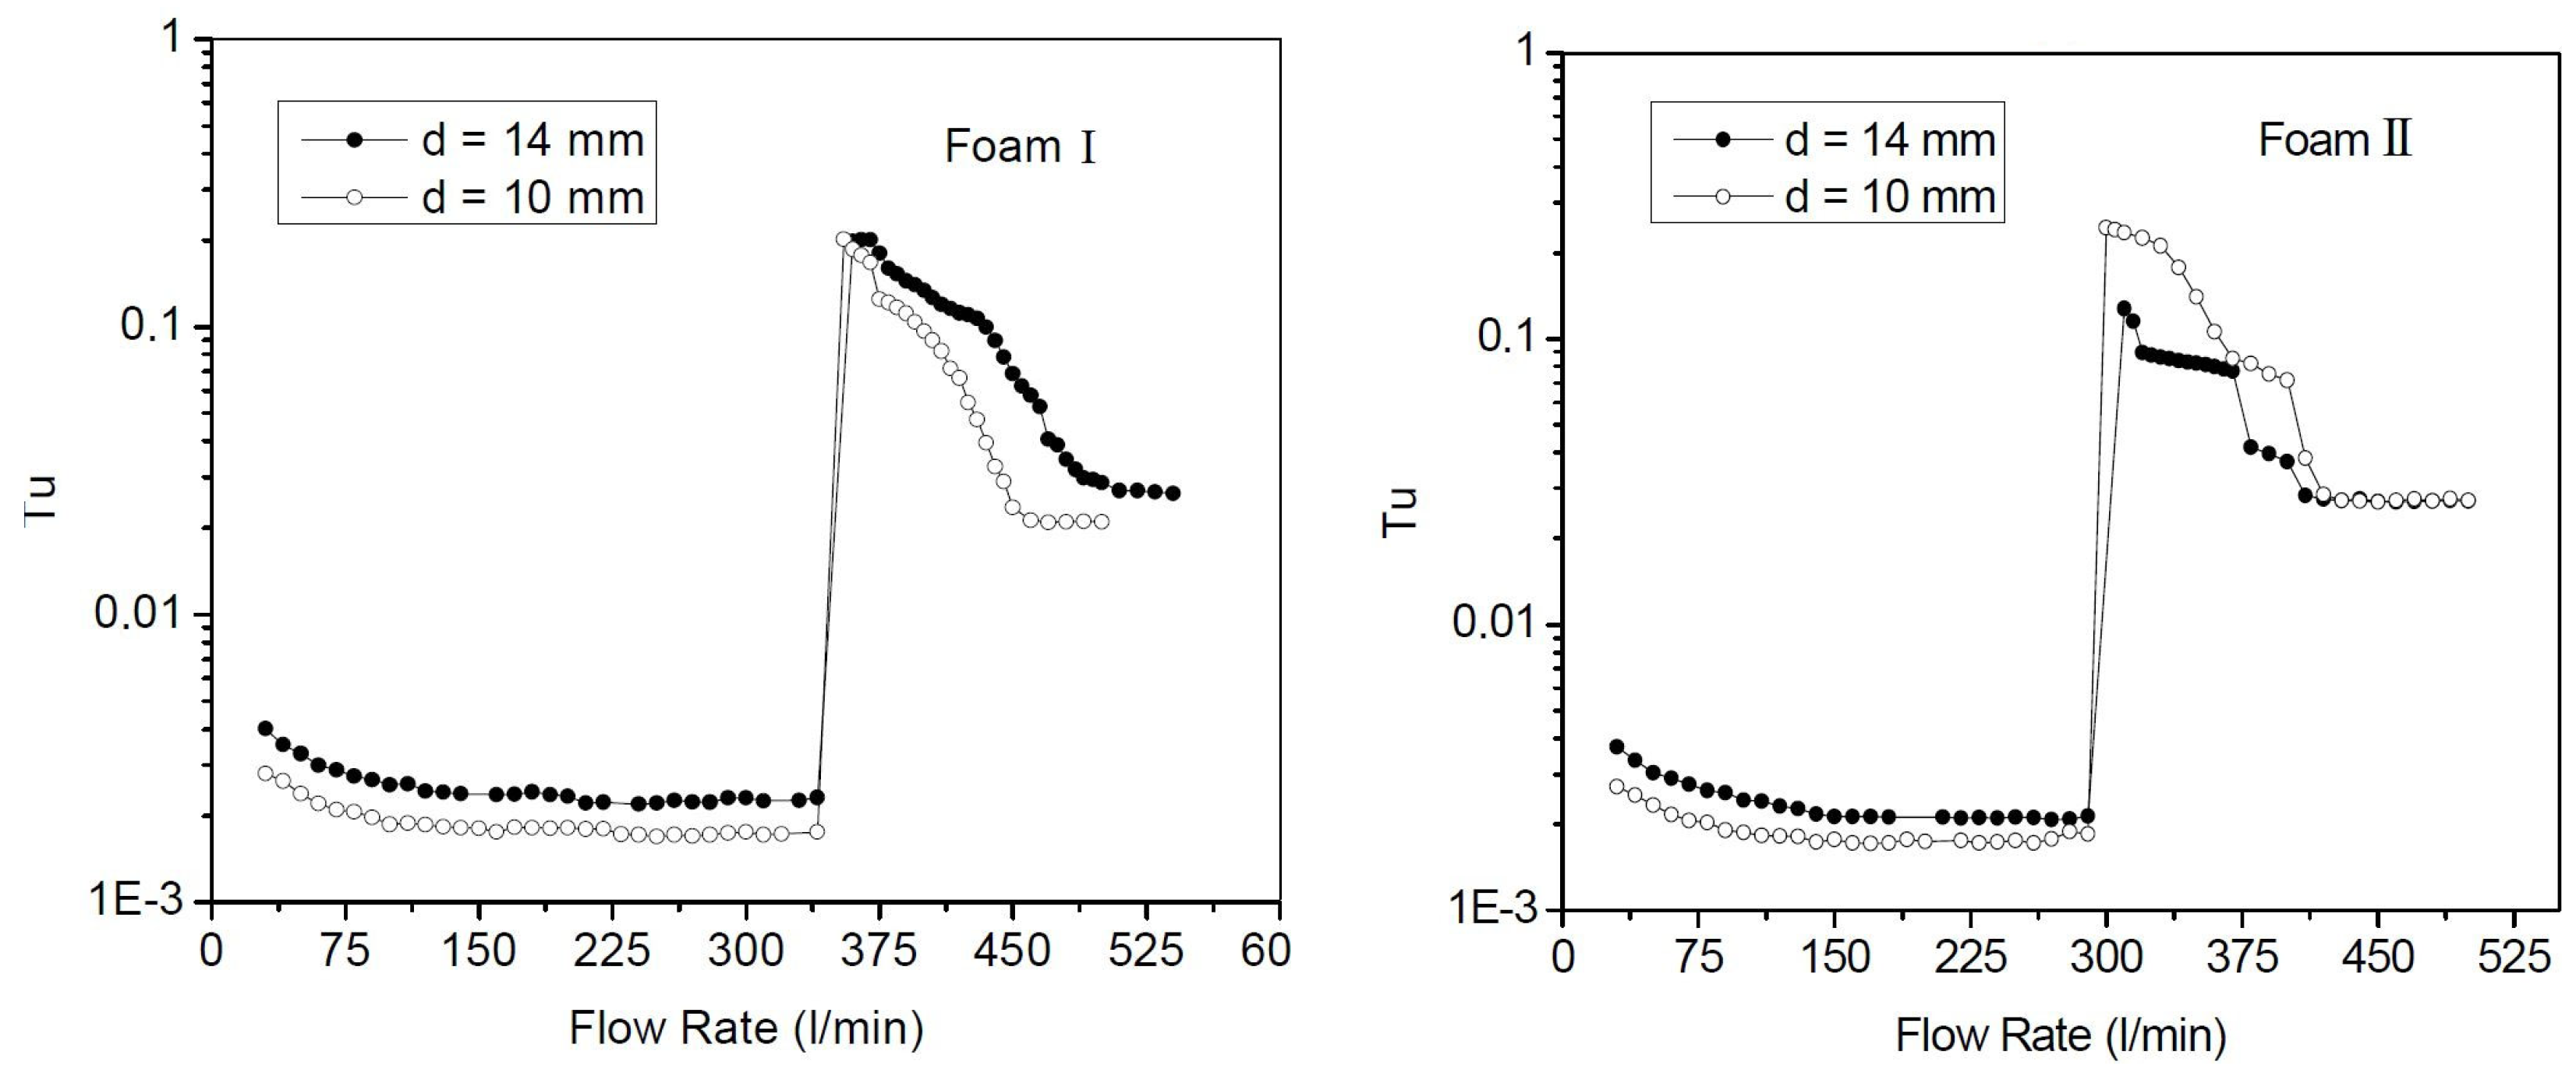
To verify the finding of Equation (11), Haddad [28] carried out experiments showing that the laminar pipe flow transition for pipe diameters D = 14 mm and D = 10 mm did not occur at the same critical Reynolds number ( R e D ) c , see Figure 4, but rather at the same mass flow rate, see Figure 5. In Figure 4, inserting open-pore foams into the diffuser section of the plenum chamber shifts the transition Reynolds number, but does not change the relative influence of the pipe diameter. Closer examination of Figure 4 shows that “finer pore foam” (Foam II: 1 mm pore size) leads to earlier transition—i.e., lower critical Reynolds numbers—than “coarser pore foam” (Foam II: 6 mm). Based on Equation (11), the critical Reynolds number for internally triggered transition is given as:
R e c = D c U ˜ c ν = 4 k 0 δ · U ˜ c ν = D c D · U c D ν = S · ( R e D ) c
The transition threshold in Figure 4 is indicated by a sharp rise in turbulence intensity ( T u ), i.e., occurs at higher R e -numbers. Transition is delayed in the smaller pipe: for D = 14 mm, it occurs near ( Re D ) c 34 , 000 , whereas for D = 10 mm, it is delayed until ( Re D ) c 48 , 000 . Thus, the smaller-diameter pipe maintains a laminar flow up to higher Reynolds numbers under comparable inlet conditions. This observation aligns with one set of results reported by [11], though it contrasts with those in Figure 1. Nonetheless, the experimental data of [28] are consistent with the established physics of pipe flow instability. This is driven by the plenum chamber of Haddad’s test rig which functions as a Helmholtz resonator, with a natural frequency described by:
f H =   2 π π R 2 V p l L = c 2 π L π R 2 L V p l
In Equation (14), f H = Helmhlotz frequency, c = speed of sound, R = pipe radius, L = the pipe length, and V p l = volume of the plenum chamber. As reported by [2,27], the instability of laminar, fully developed pipe flow occurs when this Helmholtz frequency f H coincides with the convective natural frequency of the pipe. Specifically, resonance occurs when f H = U ˜ c / L , where U ˜ c is the convection velocity. Substituting into Equation (13) yields:
n · U ˜ c L = c 2 π π · R 2 L V p l · L 2
where n is the number of standing wave modes in the pipe. Using the pipe volume V p i = π R 2 · L and diameter D = 2 R , the relationship can be recast in Reynolds number form as:
n · U ˜ c · D ν = c · D 2 π ν V p i V p l
where ν is the kinematic viscosity. Rearranging Equation (16) in terms of U ˜ c gives:
n · U ˜ c = c 2 π V p i V p l
From this, a proportional relationship is established between wave number n, convection velocity U ˜ c , and pipe volume V p i :
n 1 · ( U ˜ c ) 1 n 2 · ( U ˜ c ) 2 = ( V p i ) 1 ( V p i ) 2 = f H 1 f H 2
where subscripts 1 and 2 refer to configurations with pipe diameters D 1 = 14 mm and D 1 = 10 mm, respectively. This theoretical finding implies the following Reynolds number ratio:
( R e D ) c 1 ( R e D ) c 2 = 1.4
a finding confirmed by the experimental data of [28], as illustrated in Figure 4. This finding means that, for the same pipe materials ( k 0 = c o n s t . and δ = c o n s t . ), i.e., the same critical pipe diameter, the transition occurs for the same critical mean velocity unless the pipe length is changed, see, e.g., [16], as will be discussed in the next section. The results of [15,16,28] confirm this theoretical finding. Referring to Equation (11), we can also define the critical Reynolds number R e c in terms of the stability parameter as follows for externally triggered pipe flow transition:
R e c = D c D · U ˜ c D ν S · U ˜ c D ν = S · ( R e D ) c
where “ S = D c / D ” as defined refers to flow stability. It is given for externally triggered pipe flow by properties of test rig components, such as wall obstacle, plenum chamber, etc. In Equation (20), a Reynolds number is introduced: ( R e D ) c = U ˜ c D / ν , which differs from ( R e D ) = U ˜ D / ν .
To summarize, the above derivations for S 1.0 suggest that results, derived from the expression in Equation (20), hold the following information:
  • When D < D c , it yields a stability parameter S > 1.0 and transition occurs at constant Reynolds number R e c being given by Equation (20). This is in alignment with [27], who verified similar results shown in Figure 9 of their paper. As shown above, the laminar pipe flow remains stable for D < D c at all pipe lengths and Reynolds numbers.
  • For pipe diameters D = D c , i.e., S = 1 , the system reaches the critical case where laminar pipe flow becomes unstable, with the critical Reynolds number remaining constant at R e c = ( R e D ) c = 2130. [27] demonstrated that velocity profiles for S 1 have no inflection point, where S = 1 represents the lower limit for unstable laminar pipe flows.
  • When D > D c , it yields a stability parameter S < 1.0 and unstable laminar pipe flow. However, if L < L c , the laminar pipe flow remains stable, as experimentally verified and derived in Section 2.2.2. For pipe diameters D > D c , results are often presented as a function of the Reynolds number. However, they should be based on the critical velocity U ˜ c . Equation (20) relates ( R e D ) c to D and U ˜ c . Although Figure 6 suggests a linear dependence of ( R e D ) c on D, this is artificial, arising from normalizing the critical pipe diameter D c by the nominal diameter D, to yield ( R e D ) c .
Hence, the linear dependence of the laminar pipe flow transition results from a presentation of transition data as a function of ( Re D ) c . It is worth noting that controlling the stability of laminar pipe flow using the stability factor S has been shown, experimentally, to be sufficient for pipe lengths of L c / D 30 , as reported by Zanoun et al. [15] and later in Figure 9(top-left). When the pipe length becomes smaller than a critical length L c , which shows dependence on the critical pipe diameter D c , stable laminar pipe flows can also exist for S < 1.0 . Noting also that Fox et al. [12] measured an R e c -value of 2130 by exiting their laminar pipe flow by an azimuthal periodic disturbance. This means that direct frequency excitements of the flow are in agreement with the theoretical findings described in this paper.
Comparison with classical linear stability analyses, as initiated by [5] and summarized by [7], assume a fully developed parabolic velocity profile in pipe flows, which lacks an inflection point. According to Rayleigh’s inflection point theorem, such flows are inherently stable to infinitesimal disturbances. This explains the theoretical result that laminar pipe flow remains stable for all Reynolds numbers in classical treatments. In contrast, the present theory accounts for the existence of a secondary near-wall flow due to wall roughness. This modifies the velocity profile and introduces an inflection point near the wall when D > D c (that is, when the stability factor S = D c / D < 1 ). The presence of this inflection point is a well-known prerequisite for inviscid shear instabilities and acts as a trigger for laminar–turbulent transition. Hence, the proposed theory reconciles the classical paradox—experimentally observed transitions at finite Re despite theoretical stability—by demonstrating how roughness-induced inflection alters the flow’s linear stability properties.

2.2.2. Dependence on the Pipe Length

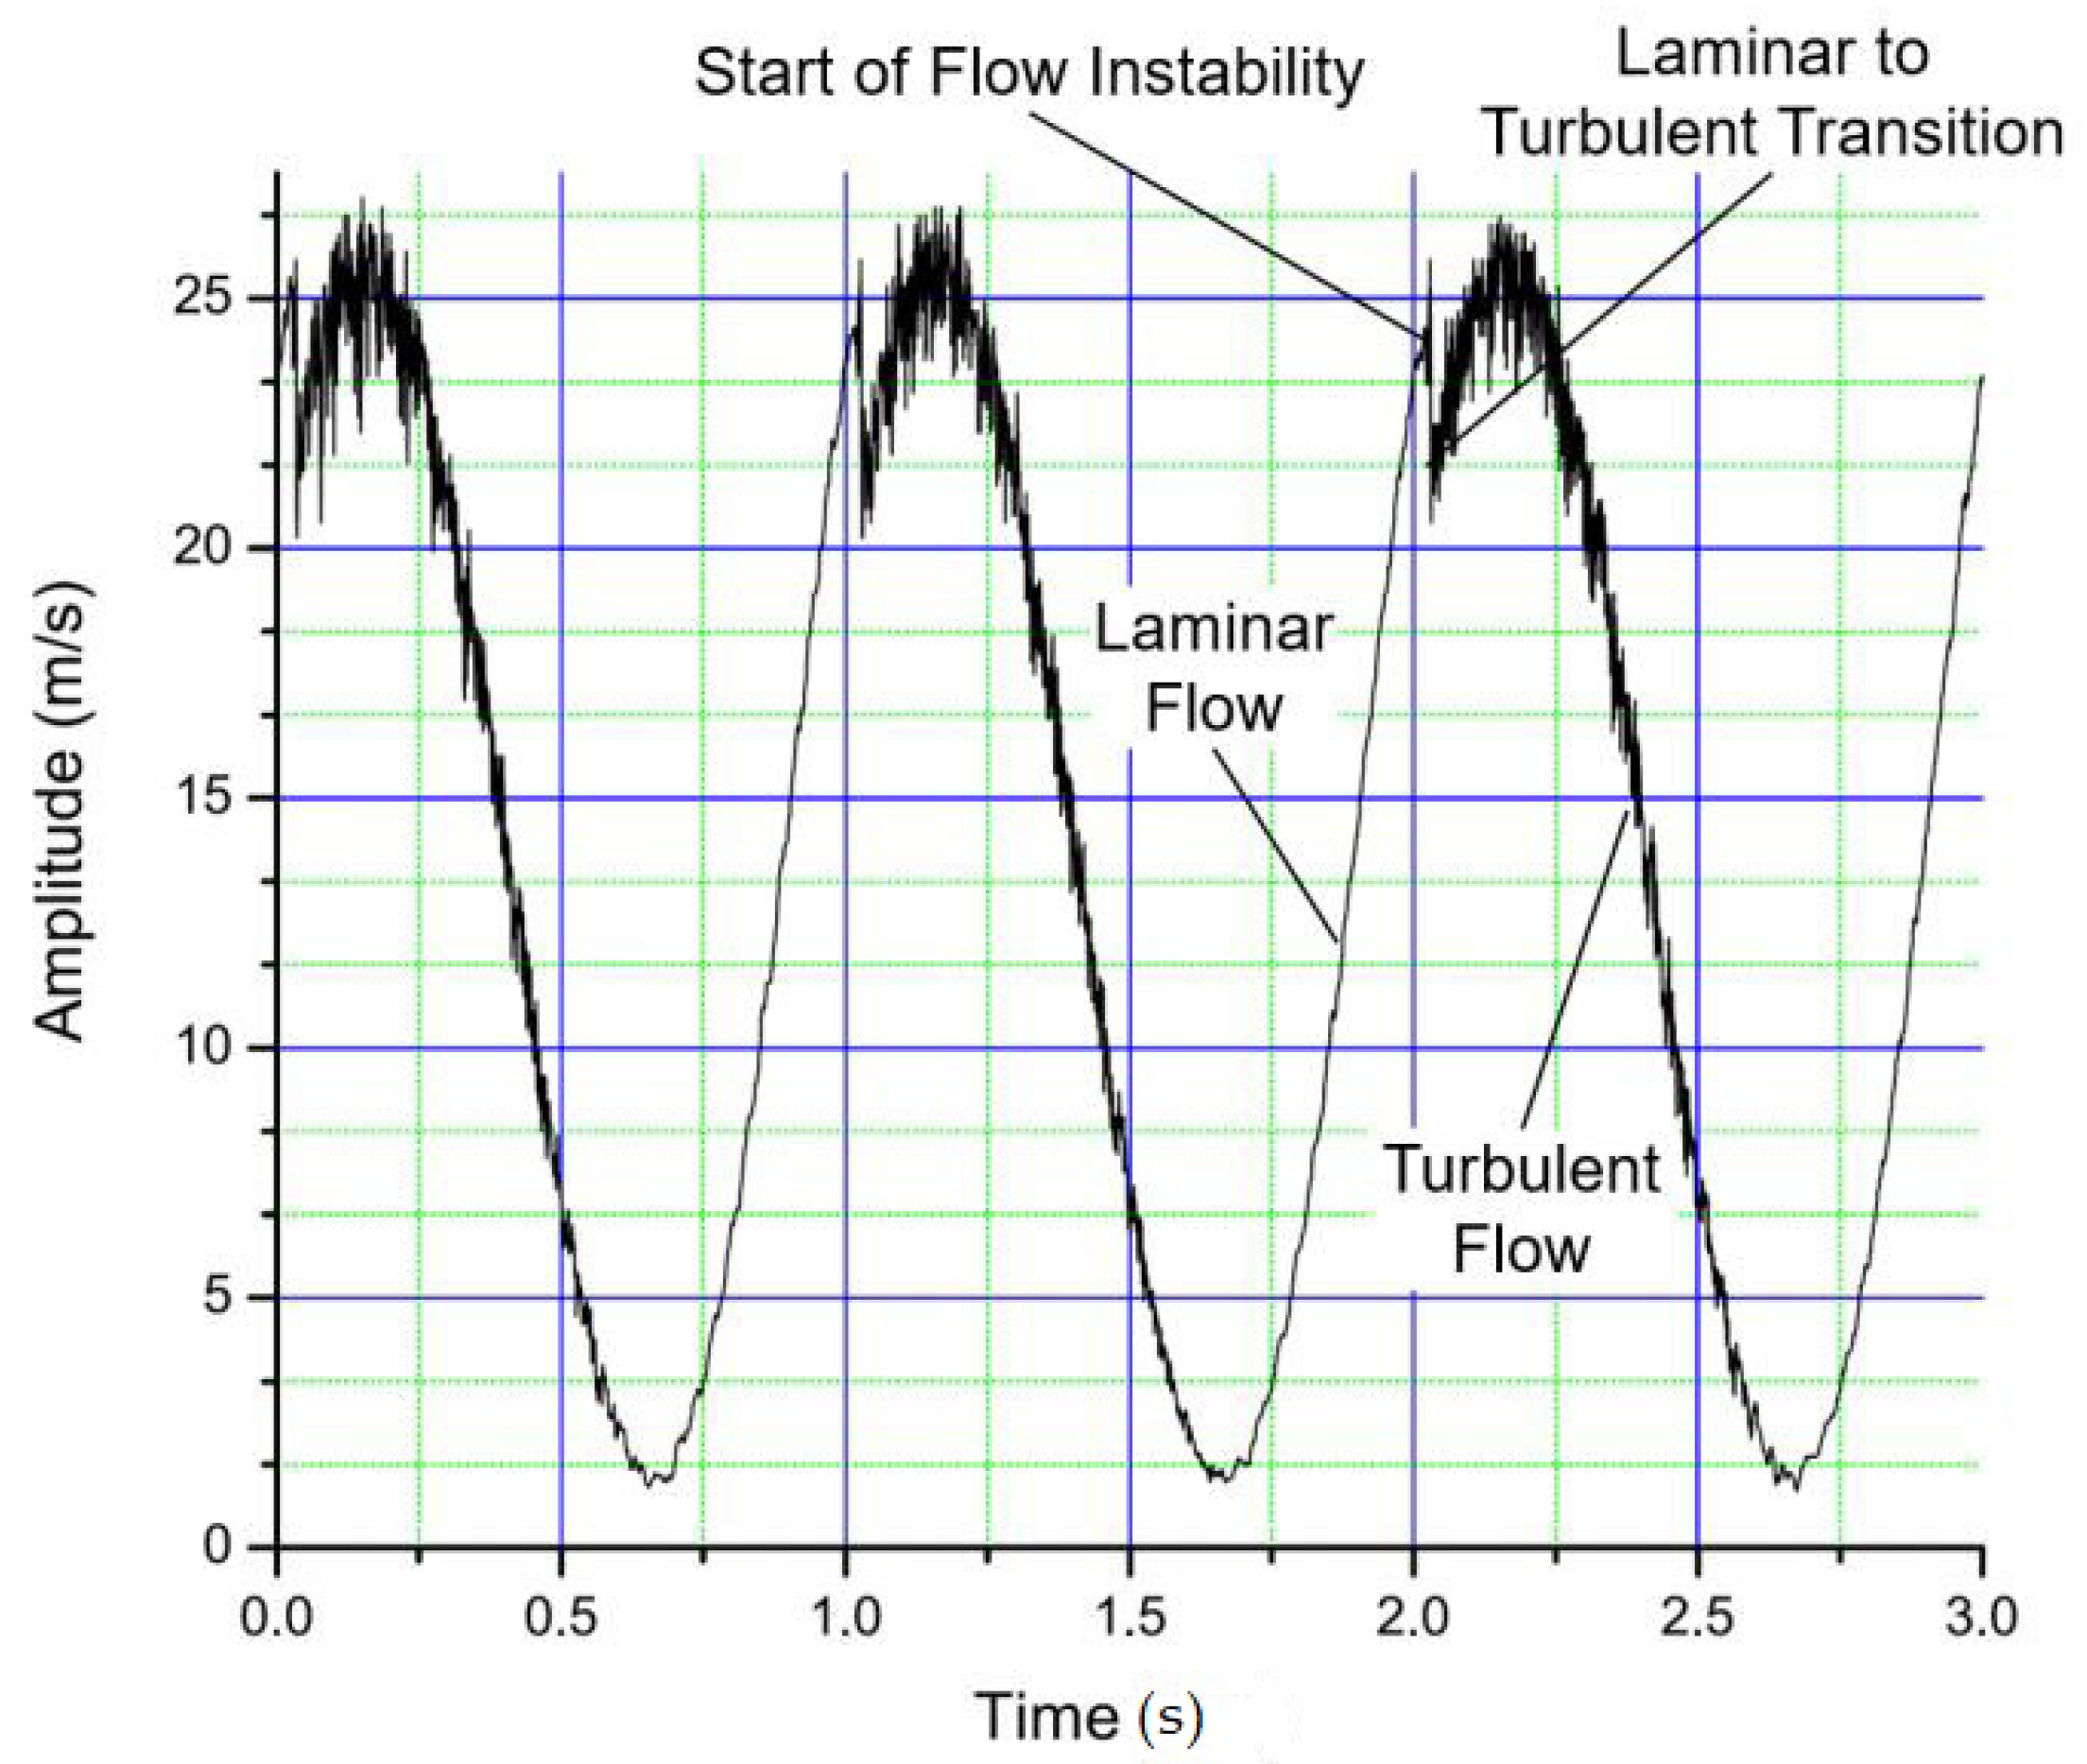
In addition to treating the dependence of laminar pipe flow stability/instabilities on the pipe diameter (Section 2.2.1), this section will address the dependence of laminar flow stability/instability on the pipe length. The earlier remarks made in Section 2.2.1, regarding flow instability dependence on pipe length L, are based on experimental results from the literature, such as those by [2], who demonstrated through experiments in which the flow rate of a pipe flow was varied sinusoidally, resulting in repeatable laminar-to-turbulent transitions along the pipe test section, see Figure 7. At the same critical velocity, the laminar flow turned into turbulent flow in highly repeatable manner, as the pipe diameter remained constant. This indicates that turbulence occurred at the same characteristic diffusion frequency ν / D 2 , yielding the same critical Reynolds number, as derived in Equation (13).
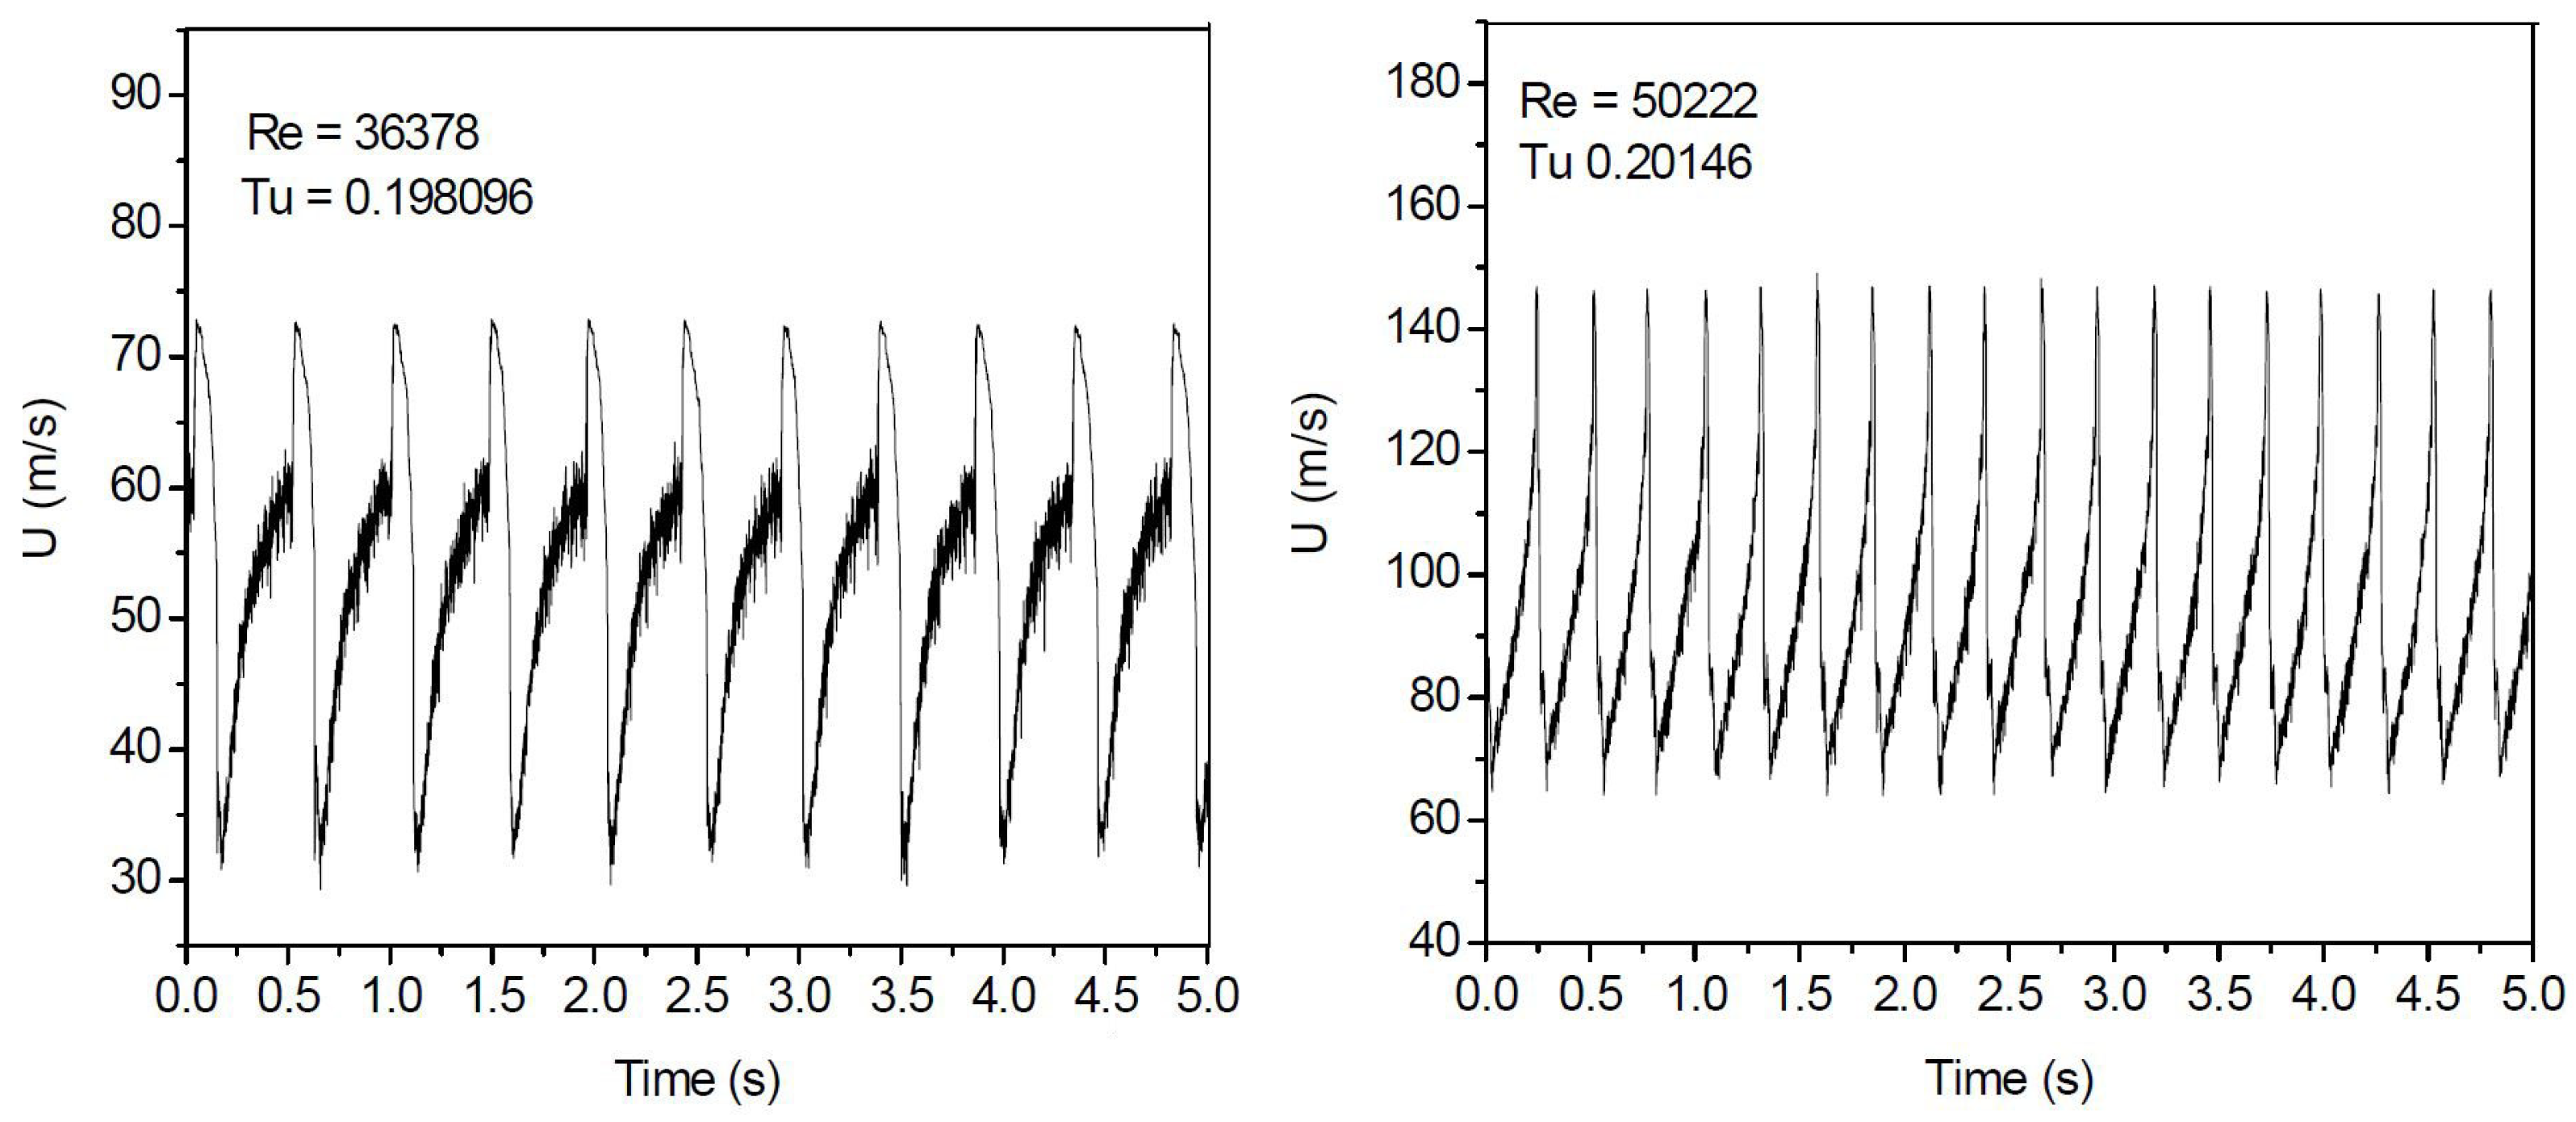
Regarding the reverse pipe flow transition, i.e., turbulent-to-laminar flow transition, Haddad [28] demonstrated that for sinusoidal mean velocity variations, with a frequency at 1 Hz, a highly repeatable forward and reverse flow transition occurs, as shown in Figure 8. This transition shows a dependence on the pipe length-to-diameter ratio when Figure 8(left) is compared with Figure 8(right). When the pipe length becomes sufficiently long for a given D to reach ( R e D ) c , the turbulent flow can revert to its laminar state, which does not occur at shorter pipe lengths. From these observations one could infer the following:
  • In addition to the convective flow in a pipe (flow with mass transport), wave motions (flows without mass transport) also influence the pipe flow transition.
  • For turbulent flow to exist at constant Reynolds numbers, it is necessary to have a pipe length larger than a critical length, see Figure 9.
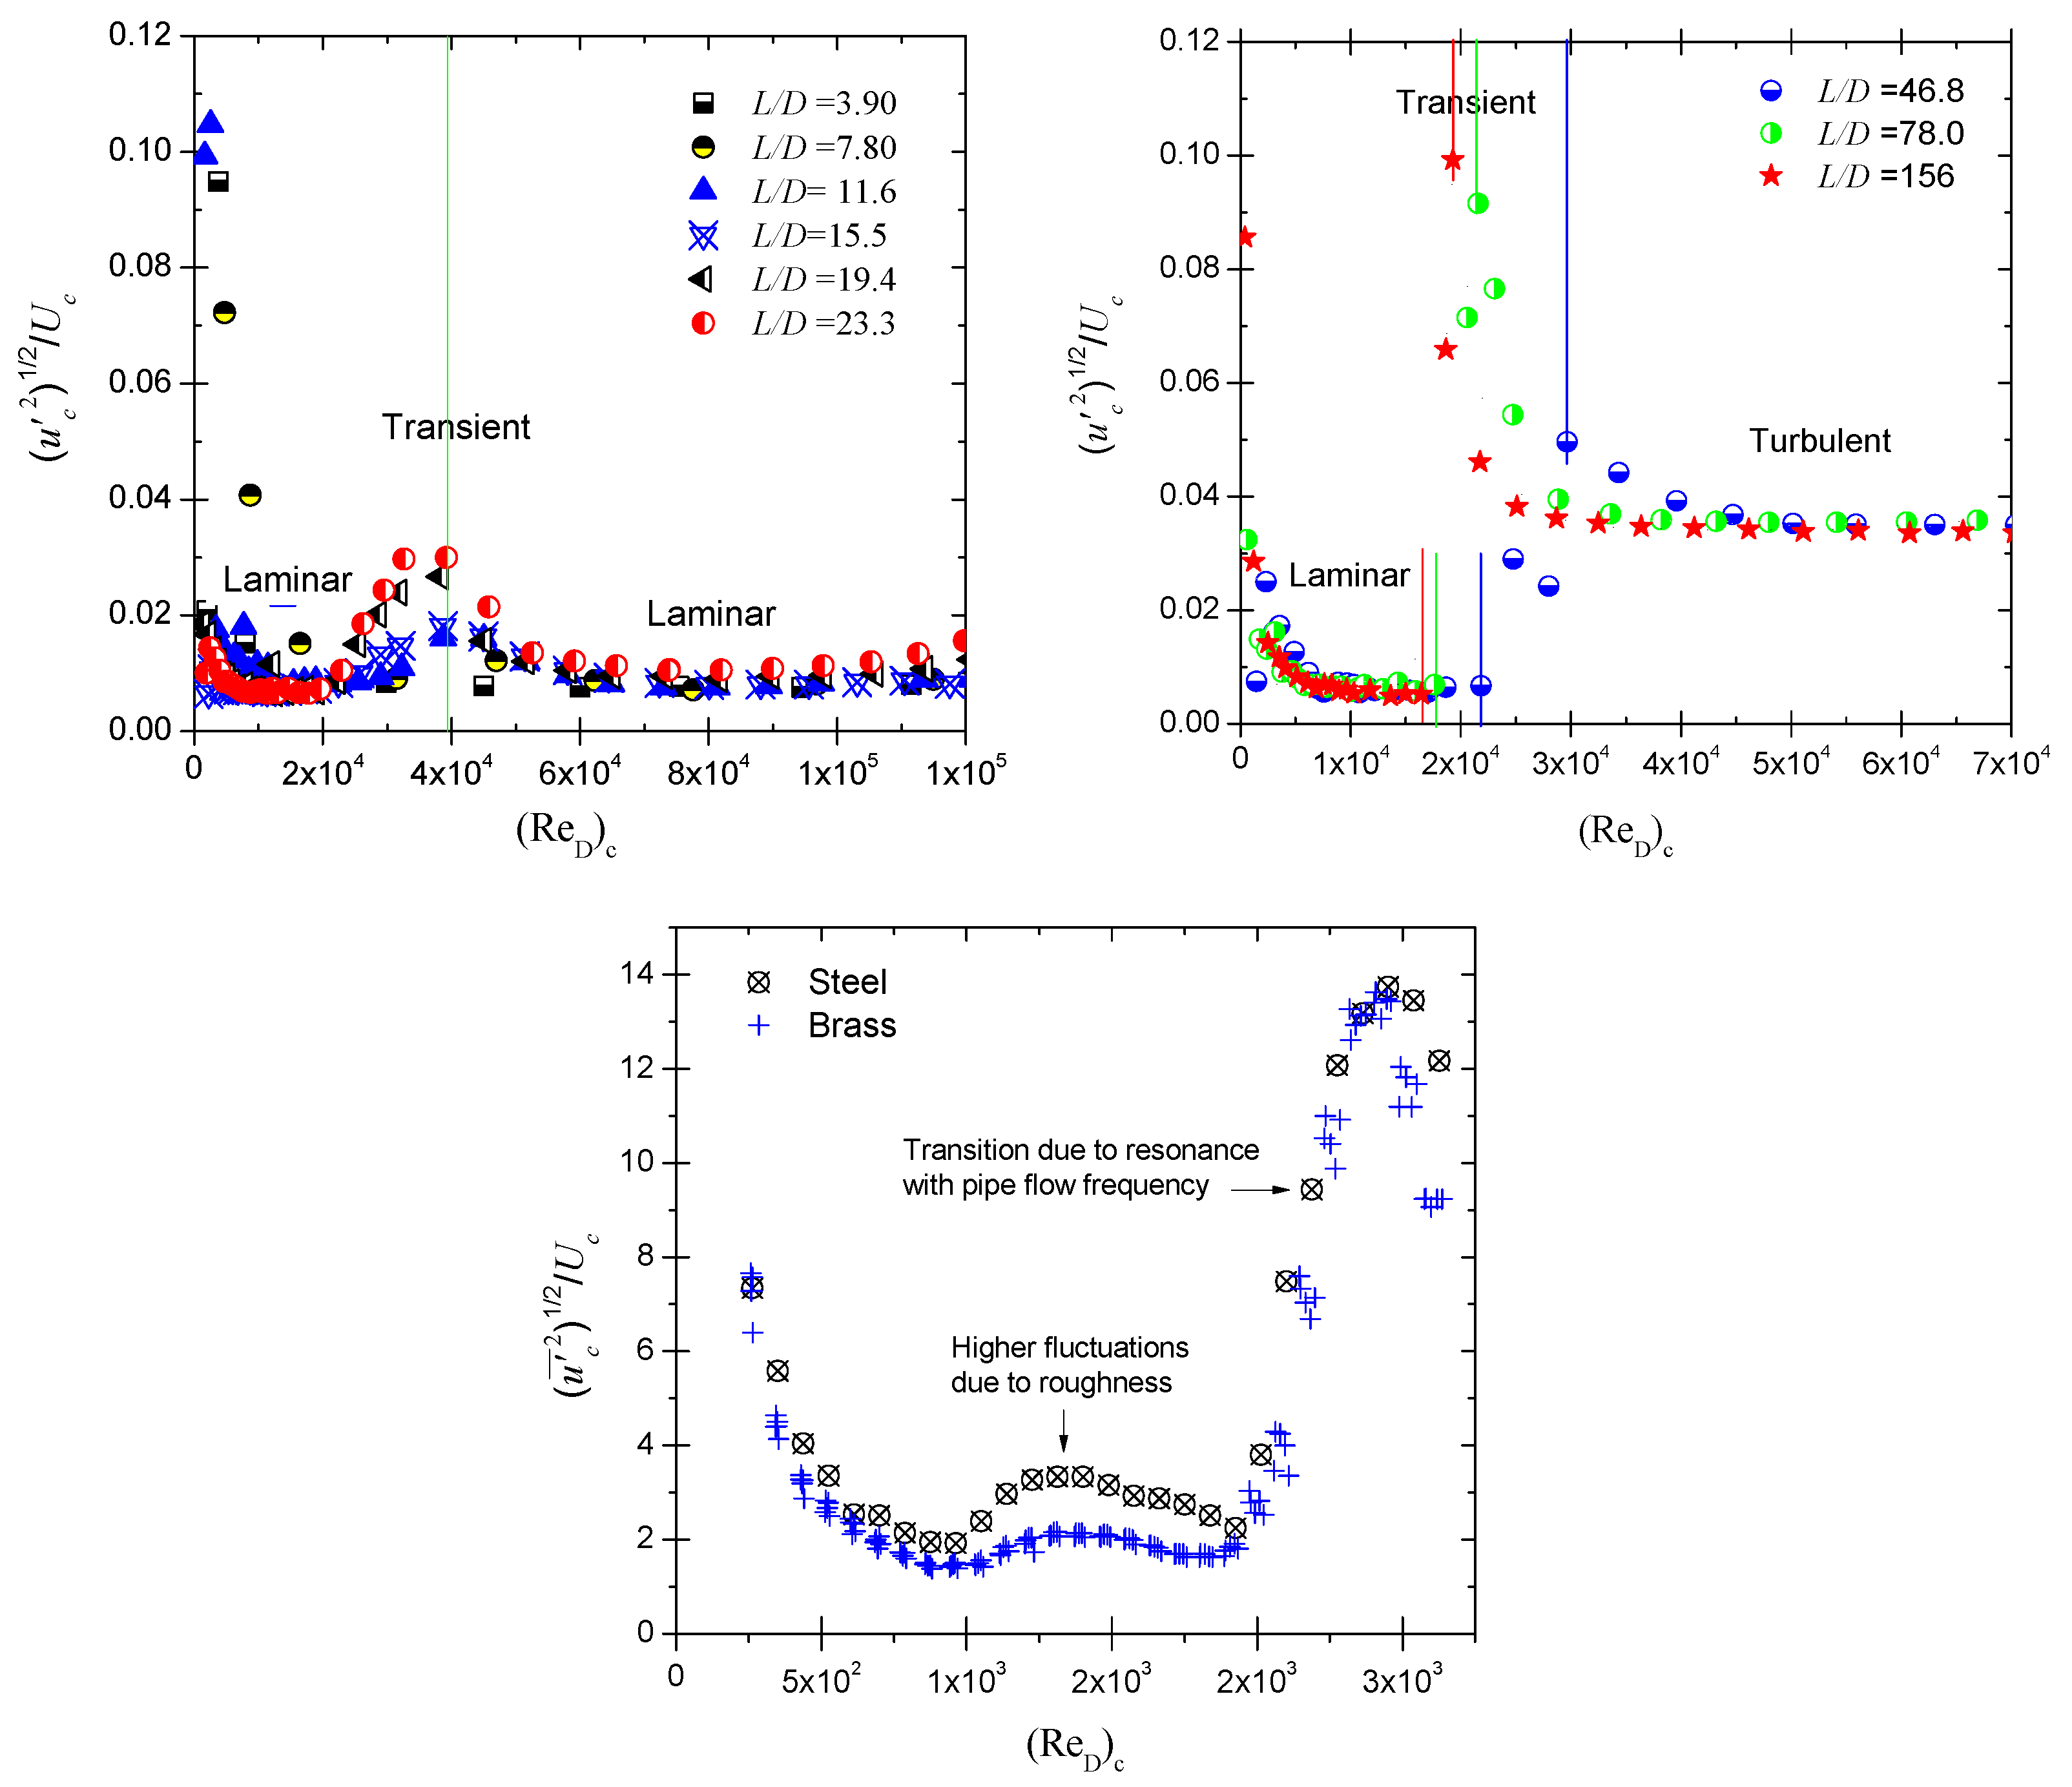
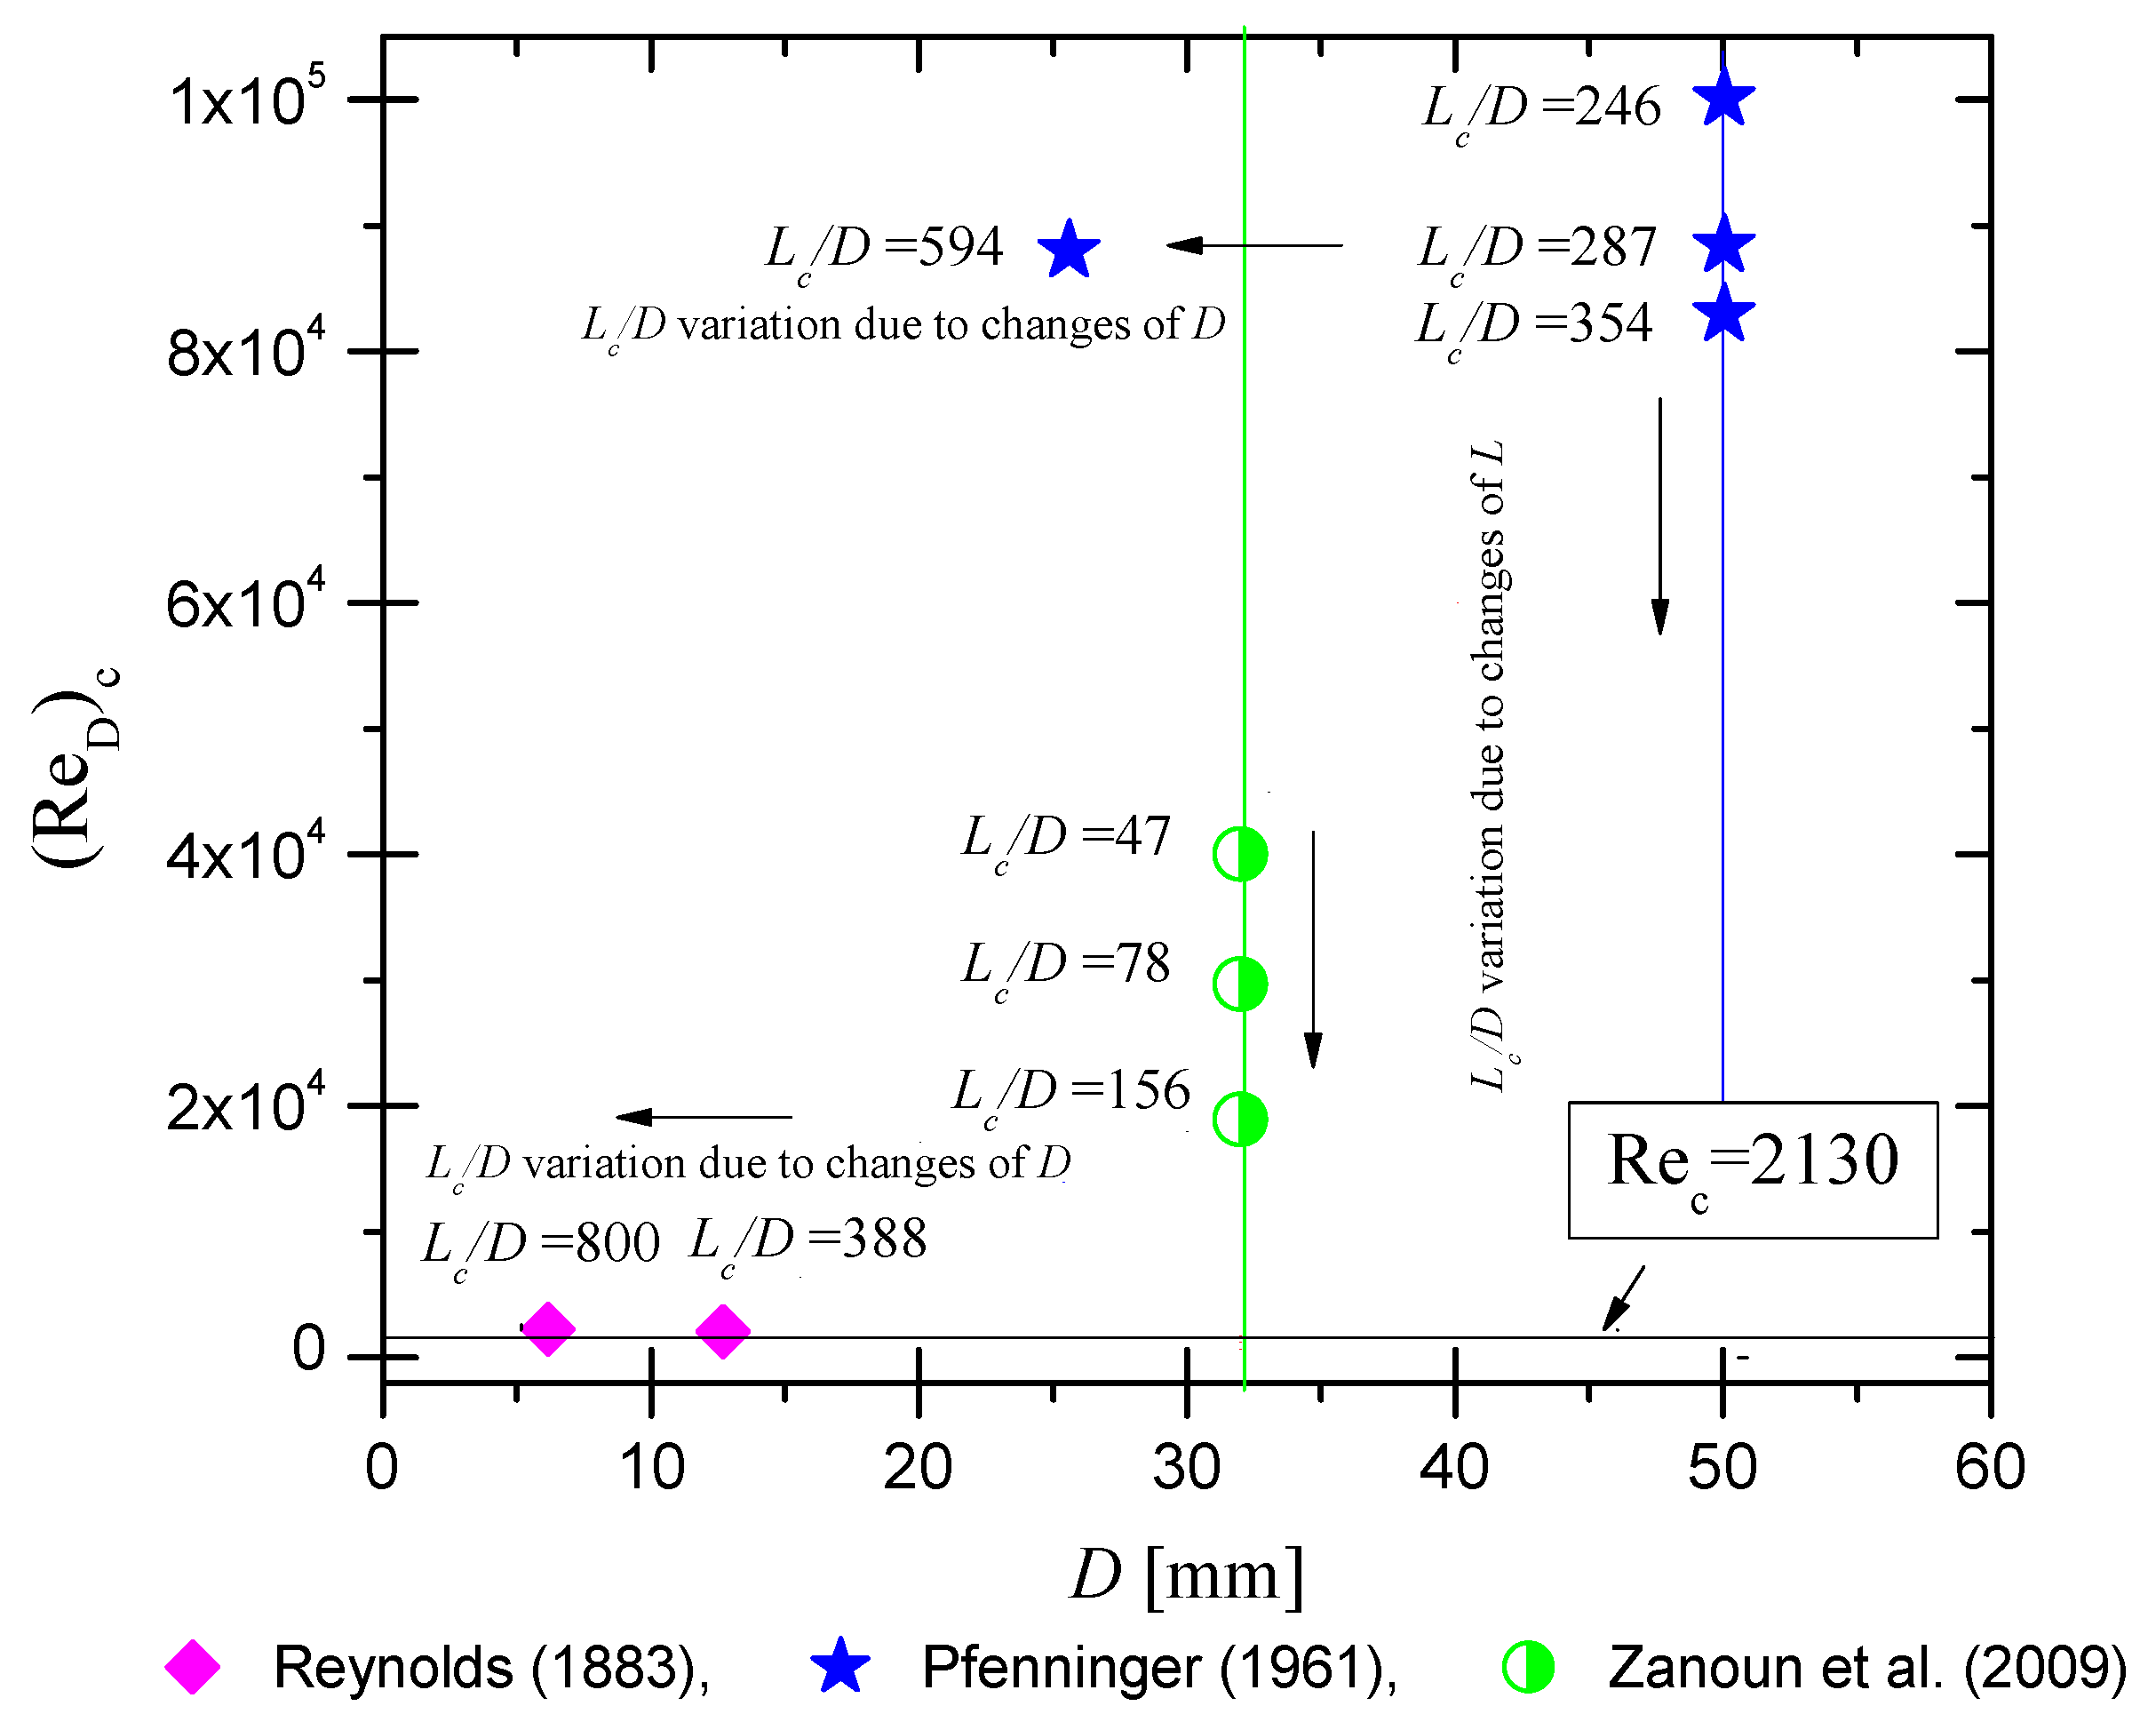
To summarize the findings so far, we can state that flow stability in a pipe flow requires a mean velocity profile that does not amplify disturbances entering the flow. This happens when S 1 , i.e., D D c . Figure 8 and Figure 9(top-left) consistently show that laminar flow is maintained when S < 1.0 and the pipe length is below the critical value L c . If the pipe length is not sufficiently long, a laminar-to-turbulent transition does not occur, as stated above. Therefore, in regions where the flow is turbulent, the pipe length must satisfy ( L / D ) > ( L c / D ) at a certain flow velocity, which is a velocity-dependent critical pipe length. This critical value shows a dependence of the critical Reynolds number ( R e D ) c on the pipe-length-to-diameter ratio L / D . Using a test rig similar to the one sketched in Figure 2, the requested critical length-to-diameter ratio L / D was found to decrease as the critical Reynolds number ( R e D ) c increases, comparing the three cases for L / D = 46.8 ( R e c 30 × 10 3 ), L / D = 78 ( R e c 22 × 10 3 ) and L / D = 156 ( R e c 20 × 10 3 ) in Figure 9(top-right). When the pipe length is shorter than a physically fixed critical length, the laminar pipe flows does not turn turbulent and flow fluctuations decay, i.e., the flow turned laminar, as indicated in Figure 9(top-left).
To further substantiate the theoretical findings, additional experimental data by [39] were incorporated, as shown in Figure 9(bottom). The experiments were conducted at LSTM-Erlangen, FAU Erlangen-Nuremberg, using two pipes of 20 mm diameter—one made of brass and the other of stainless steel—for pipe flow investigations. Technically, it is known that drawn pipes of brass possess wall roughness of δ = 1–2 μ m in height; see “Rohrrauhigkeit von Rohren, schweizer-fn.de” on the internet. The same information source suggests δ = 40–100 μ m as wall roughnesses for steel pipes. With this information available, laminar-to-turbulent transitions investigations were carried out by [39] for the brass-and the steel pipes, respectively, and the results are presented in Figure 9(bottom). This subplot figure shows that an increase in roughness does not drive the flow into its turbulent state but just increases the velocity fluctuations. Transition needs the resonance of frequencies, e.g., the driving frequency f d r i v e of the components of the pipe flow test rig:
f d r i v e = n ν D 2 = U ˜ L
and natural frequencies of the actual pipe flow, as proposed by [2]. Whatever the driving frequency is, Equation (21) suggests that stable laminar pipe flows can be sustained when the following relation holds:
L c D 1 n ( R e D ) c
Hence, the laminar pipe flows are not only stable for:
  • S 1.0 for all pipe lengths.
  • but also for:
  • S < 1.0 and for pipe lengths L < 1 n ( R e D ) c · D
  • At low Reynolds numbers, i.e., ( R e D ) < ( R e D ) c , the laminar flow turns turbulent if L > L c . On the other hand, as the pipe length is getting shorter than the critical length, i.e., L < L c , the flow turns back to its laminar state even for higher value of R e D , see Figure 9(top-left). This repeatability occurs at the same velocity that corresponds to the same Reynolds number, as Equation (22) suggests.
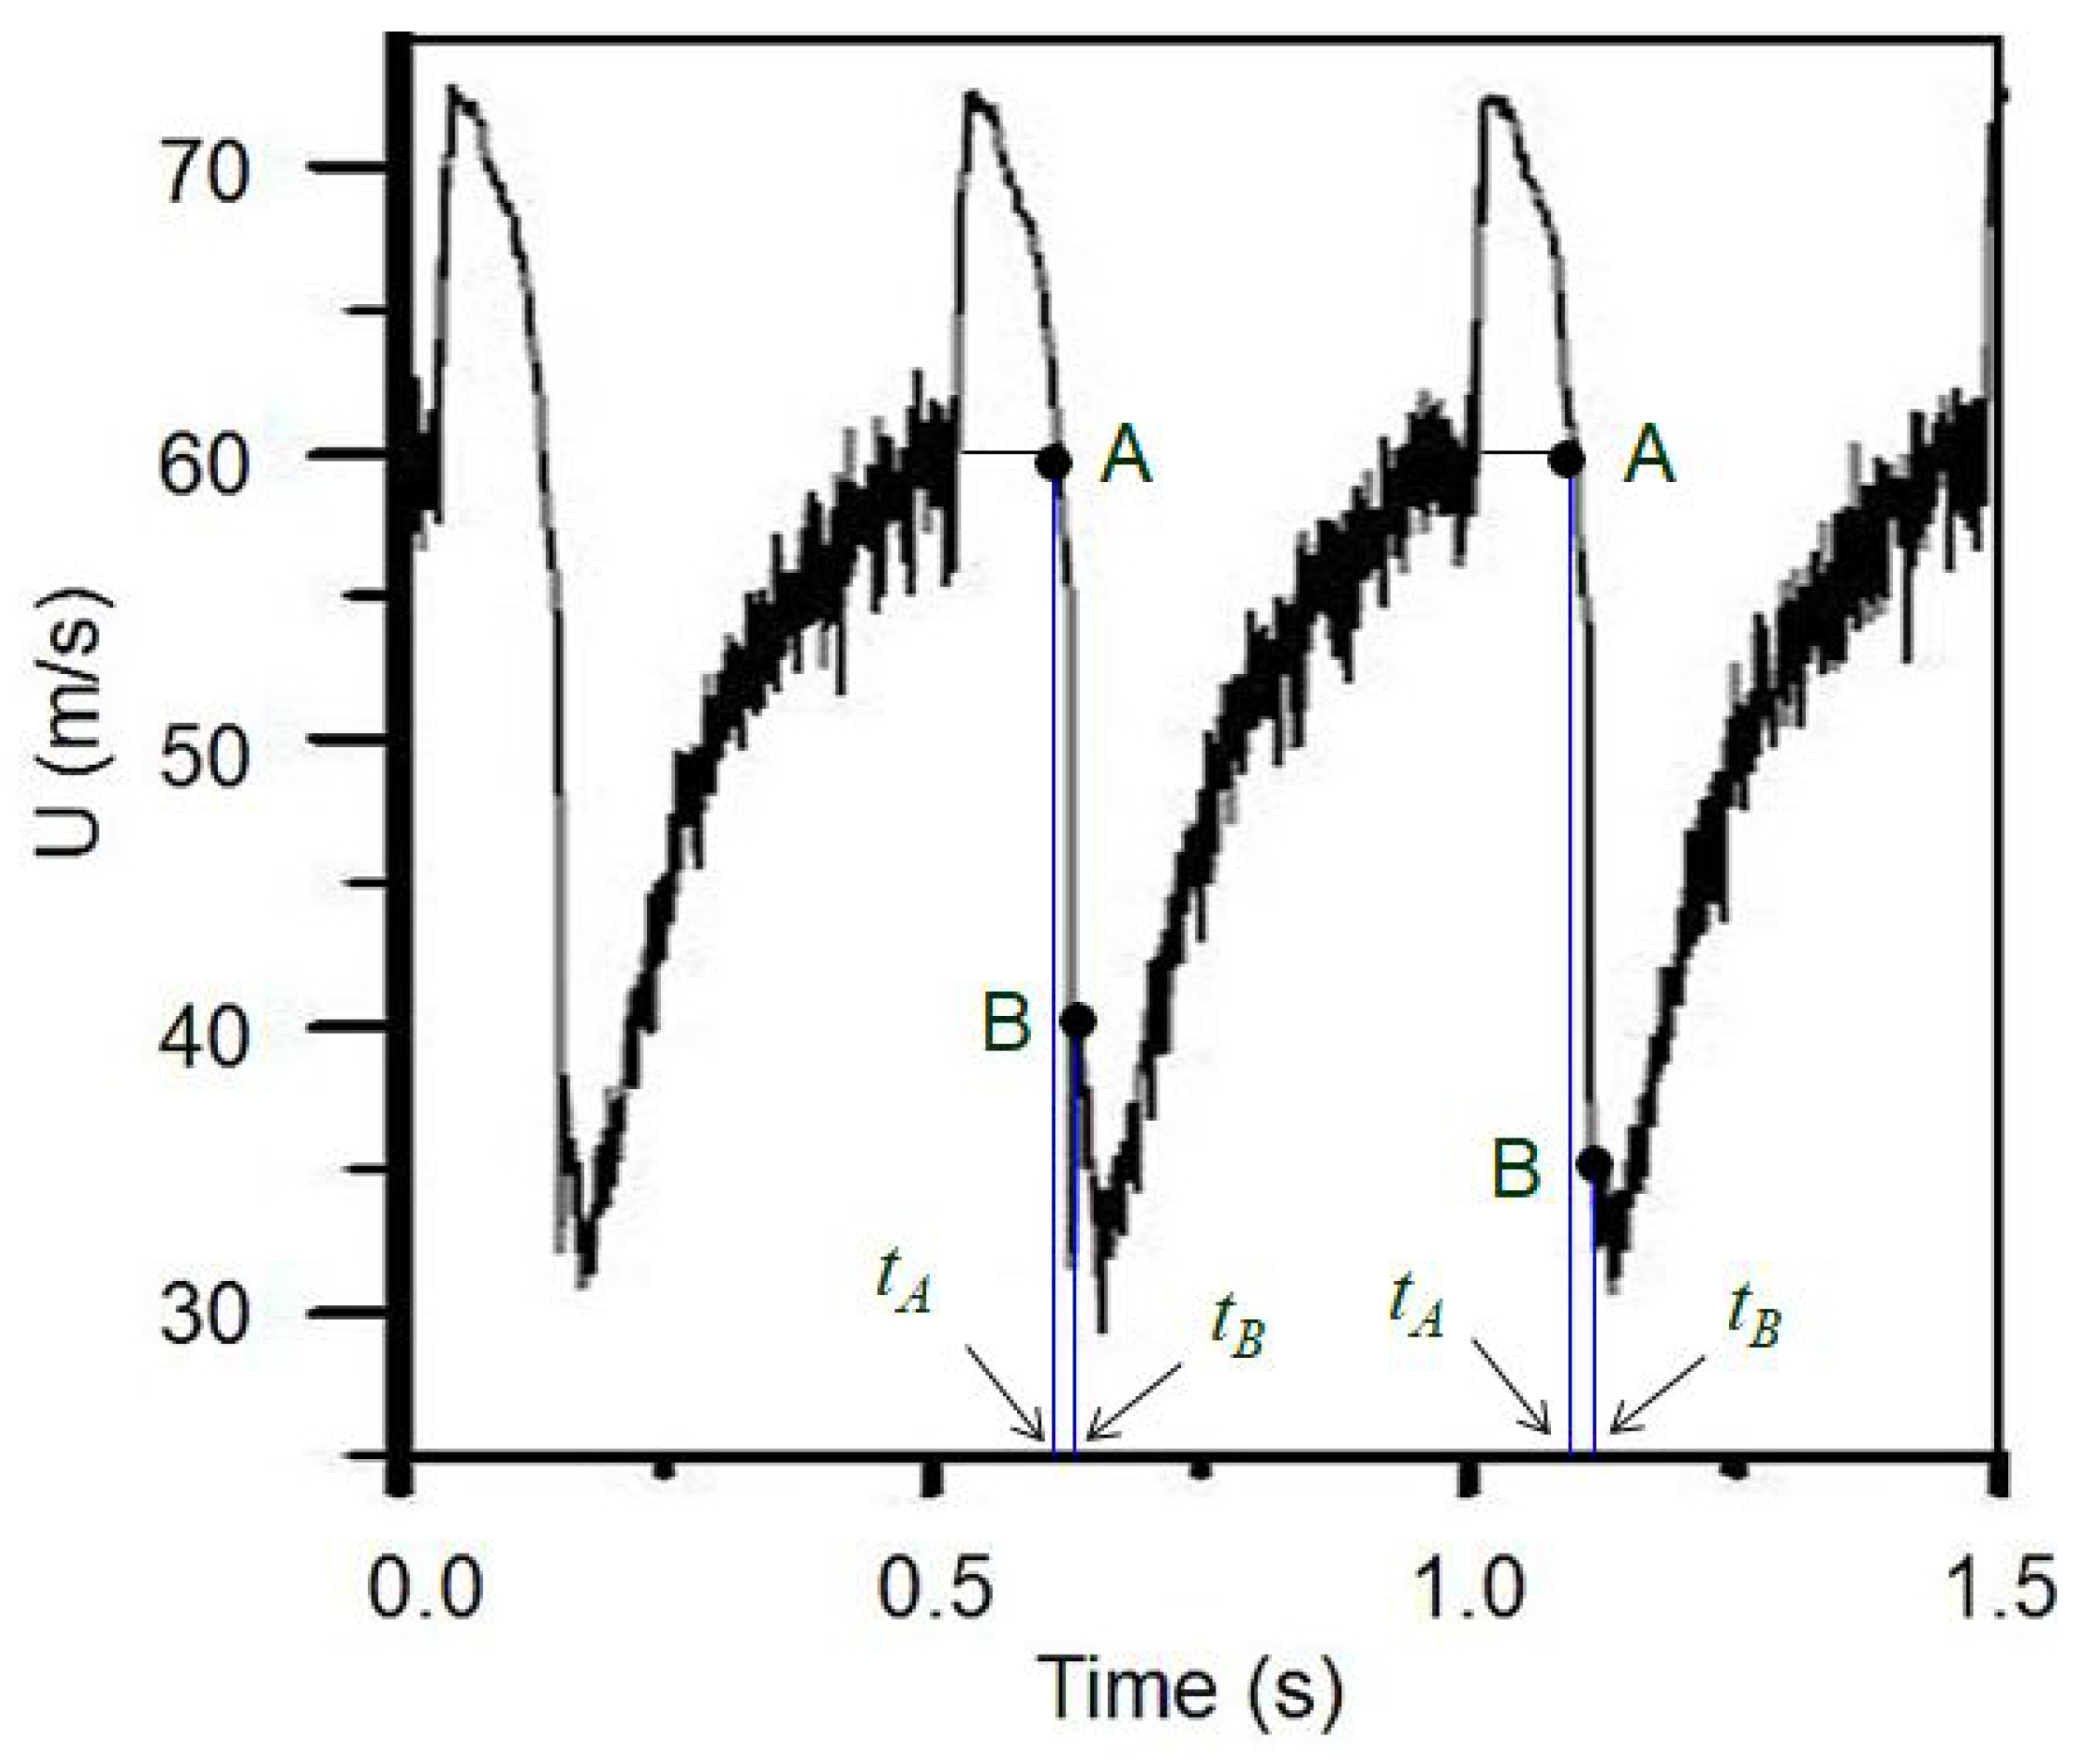
Furthermore, Figure 10 indicates flow at location A with high local mean velocity. One would, therefore, expect that the laminar flow turns turbulent when the velocity U A is reached, but this does not happen. The flow turns turbulent at a velocity U B . This is due to the fact that the flow transition from its laminar to the turbulent state happens somewhere inside the pipe and it takes the time Δ t = t B t A to reach the pipe end, where the turbulent state of the flow is detected. This finding requires more specific investigations of laminar-to-turbulent transitions in laminar pipe flows. A delayed recording of the turbulent-to-laminar transition is also seen in Figure 10. After observing the turbulent-to-laminar transition at a mean velocity of U ˜ 60 m/s, the axial velocity continues to increase, reaching U ˜ 72 m/s, which corresponds to the axial velocity of the parabolic laminar velocity profile. More detailed investigation of this part of the transitional process are needed and the second author is presently preparing for new sets of measurements.
One would re-arrange Equation (22) to yield the following relation:
( R e D ) c = n · L c / D
This relation suggests n = ( R e D ) c / ( L c / D ) = c o n s t . and we can check this for the following set of experimental results published by [11] in Table I:
  • Case 1: D = 0.0268 m, L = 5 ft = 1.524 m, ( R e D ) c = 12,694;
  • Case 2: D = 0.01527 m, L = 5 ft = 1.524 m, ( R e D ) c = 22,337;
  • Case 3: D = 0.007886 m, L = 5 ft = 1.524 m, ( R e D ) c = 43,705.
  • For all three cases of Reynolds’ experiments, the above considerations suggest that n should yield the same value for all three cases given above:
  • Case 1: ( L D ) 56.86 n = 12 , 694 / 56.86 223.25 ;
  • Case 2: ( L D ) 100 n = 22 , 337 / 100 223.37 ;
  • Case 3: ( L D ) 194 n = 43 , 705 / 194 225.28 .
  • The above calculated n-values are close enough to each other to confirm, experimentally, the relation expressed in Equation (23) by the experimental data of [11].
A closer look at the dependence of pipe flow transition on the pipe length, for one given pipe diameter of D = 32 mm, is provided by [15,16]. These studies explored the laminar-to-turbulent transition in pipe flow across 18 different pipe lengths, with some of their key findings presented earlier in Figure 9. Their results indicate that transition to turbulence occurs for a minimum pipe length of L / D 30 . This value is comparable to the minimum L / D -value of 40 suggested by [33] for the transition to fully developed turbulence. This requires, however, an in-depth analysis of the data of [15], taking the theoretical frame work of [27] into account. Work along this line is on its way, carried out by the present authors.

3. Other Resonance Conditions

In Section 2, a new stability factor S = D c / D was introduced as proposed by [27]. This factor is characterized by a critical diameter D c of the pipe, which is completely defined by the roughness properties of the wall. It predicts stable laminar pipe flows for S 1.0 and all pipe lengths L. This stability factor also implies that the laminar pipe flow stays stable for S < 1 with the length of the pipe L < L c . In connection with these findings, a question arose regarding the potential relationships that emerge when other frequency resonances, from components of the test section, coincide with the natural frequencies of the pipe flow. One such condition can arise when a test section is used that does not trigger the laminar pipe flow through an obstacle, as discussed by [2]. Suitable designs of plenum chambers can also be considered to avoid resonances due to the natural frequencies with laminar pipe flows. Another possible scenario occurs when the frequency of vortex shedding from the pipe flow, as it exits into the laboratory, resonates with the natural frequencies of the pipe, potentially driving oscillations. Based on the formulae for the natural frequencies of pipe flow exit vortices, the driving frequency of components of the pipe flow test rig can be expressed in terms of the Strouhal number as follows:
f d r i v e = S t U ˜ D = n ν D 2
Equation (24) can be re-written as follows:
S t = n 1 R e ( Strouhal number )
This relation shows that, for this resonance condition, the occurrence of laminar pipe flow instability, and therefore, laminar-to-turbulent transition, should occur for all pipe lengths. Hence, a different type of transition occurs than that treated in Section 2. As Equation (25) shows, this transition is dependent on the R e - and S t -numbers but not on the pipe length-to-diameter ratio. Other resonances are possible, e.g., see [2,3], who investigated pipe flow transition by wall mounted, ring-type obstacles and by plenum chambers, respectively. Durst and Al-Zoubi [1] referred to these ways of triggering pipe flow transition as” externally triggered,” to distinguish them from “internally triggered”, transition flow. The latter are triggered by wall roughness alone, as also treated in this paper. The above given considerations suggest that a pipe flow test rig with properties that yield the triggering by the frequency of the exit vortices of the pipe would not cause transition Reynolds numbers that are length dependent. Hence, only this finding shows that laminar-to-turbulent transition of pipe flow is likely to be more complex than conventionally presented. The entire subject needs to be revisited taking the results of [2,3,27] and also the results in this paper into account. It has long been surprising, at least to the present authors, that various methods described in the literature for triggering the laminar pipe flow all result in the same critical Reynolds number R e c . However, through the theoretical treatment provided in this paper, it becomes clear that it is not the triggering mechanism itself that defines the flow transition, but rather the resonance of the induced driving frequency and the natural frequency of the laminar pipe flow. This applies to both “external” and “internal” triggering of pipe flows, a conclusion that has been confirmed by the authors’ investigations, which are summarized in this paper.

4. Conclusions, Final Remarks, and Outlook

This study presents a theory-based solution to the long-standing paradox of the theoretically predicted inherent linear stability of fully developed laminar pipe flow, bridging the gap between classical predictions and experimental observations. Building on the theoretical framework of [27], the authors re-examined the flow’s stability and, unlike traditional approaches, derived a critical Reynolds number that aligns with experimental findings. The theoretically predicted value, R e c = 2130, is confirmed by the authors’ experimental data and also by the experimental findings of [12].
By accounting for a parallel flow within the pipe’s wall roughness layer, the analysis revealed a velocity profile with an inflection point near and within this region and introduces a so-called physically meaningful stability parameter S. The transition to turbulence is shown to occur at the critical threshold S = 1.0 . Beyond providing a predictive framework for flow transition, the theory supported by experiments identifies a fundamental instability mechanism, introduces geometry-dependent critical parameters–namely pipe length L c and diameter D c . It is shown that “externally triggered” and “internally triggered” pipe flows yielded the same critical Reynolds number, see Figure 11:
R e c = D c · U ˜ c ν = c o n s t . = 2 , 130
According to [27], a stability factor S = D c / D is introduced, where D c = 4 k 0 / δ . When D < D c ( S 1.0 ), it yields stable laminar pipe flow for all pipe lengths and the transition occurs at a constant Reynolds number R e c . On the other hand, for S < 1.0 , the laminar pipe flow shows the instability only if the considered pipe is longer than a critical length L c .
Results are also derived for the effect of the pipe length on the laminar pipe flow transition. The laminar pipe flow is shown to remain stable, despite S < 1 , when the pipe length is shorter than a critical length:
L < L c = 1 n ( R e D ) c · D
Thus, for a given pipe diameter D, the laminar pipe flow transition occurs when the following ( R e D ) c is reached:
( R e D ) c > n L D
This explains the results shown by [13] and re-plotted in a revisited version in Figure 6 of this paper. Additionally, Figure 11 presents a good summary of three reference experiments.
Various critical Reynolds numbers observed in Figure 11, obtained from the three reference experiments, may be attributed to differences in pipe diameter, pipe length-to-diameter ratio, and flow perturbations at the pipe inlet. However, further analysis is still progressing and will be given in a forthcoming publication by the present authors.
Moreover, the reverse transition, that is, the turbulent-to-laminar transition, shown in Figure 8, can also be explained in this way, i.e., the way suggested by [27]. Triggered pipe flows return to their laminar state, when their critical Reynolds number ( R e D ) c lies below a certain threshold value, i.e., R e c < ( R e D ) .
The internally triggered flow, i.e., triggered by the roughness of the pipe wall, receives, in this paper, some particular attention. Following the derivation of [27], a critical diameter D c = 4 k 0 / δ was defined, resulting in a critical velocity to be introduced:
U ˜ c = ν Re c · delta 4 k 0
for laminar pipe flow transition to occur for different pipe diameters, at the same mean velocity, as shown experimentally by [28]. He showed that the laminar pipe flow transition occurred at the same critical mass flow rate and not at the same critical Reynolds number ( R e D ) c values.
In this article, the authors have shown that the theoretical framework of [27] provides, for pipe flow instability and, hence, pipe flow transition, a solid basis for theoretically explaining and verifying known experimental findings related to pipe flow instability. The theory accounts for flow through the rough pipe wall, providing a physical basis for theoretically treating internally triggered flows. The conventional theoretical treatment of pipe flow instability must consider flow through the moderately rough wall layers to achieve agreement with the corresponding experimental data.
Additionally, from a practical point of view, the present results provide useful design guidelines for maintaining laminar pipe flow:
  • Ensure that the pipe diameter D is smaller than the critical diameter D c = 4 k 0 / δ based on the wall material and roughness properties.
  • For cases where D > D c , maintain the pipe length L below the critical length L c , given by L c = ( 1 / n ) · ( R e D ) c · D , to avoid transition.
  • Avoid resonance conditions between system components (e.g., plenum chambers) and the natural frequencies of the flow, which can promote instability even in otherwise stable configurations.
The above insights can guide the design of laminar flow systems, especially in microfluidics, precision flow control, or laboratory setups where turbulence is undesirable. A dedicated experimental test rig, with adjustable wall roughness and length, is under development. Similarly, numerical simulations that include porous sublayer modeling will be employed in a future work to further validate the theory.

Author Contributions

Formal analysis, F.D. and E.-S.Z.; Investigation, F.D. and E.-S.Z.; Data curation, F.D. and E.-S.Z.; Writing–review & editing, F.D. and E.-S.Z. All authors have read and agreed to the published version of the manuscript.

Funding

This research received no external funding.

Data Availability Statement

The data that support the findings of this study are available from the corresponding author, [E.-S. Zanoun], upon reasonable request.

Acknowledgments

Thanks to Jovan Jovanovic (LST-Erlangen) for granting permission to use his data. Appreciation is also extended to K. Haddad and K. Huang for their valuable data.

Conflicts of Interest

The authors declare that they have no known competing financial interests or personal relationships that could have appeared to influence the work reported in this paper.

References

  1. Durst, F.; Al-Zoubi, A. Numerical treatments of laminar-to-turbulent transitions of pipe flows with moderate rough walls. J. Phys. Fluids. 2024. under consideration for publication. [Google Scholar]
  2. Durst, F.; Breuer, M.; Ünsal, B.; Haddad, K. Laminar-to-turbulent transition of pipe flows triggered by wall-mounted, ring-type obstacles. J. Turbul. 2022, 23, 382. [Google Scholar] [CrossRef]
  3. Durst, F.; Biswas, G.; Haddad, K. Laminar to turbulent transitions of pipe flows by resonances of natural frequencies of components of test sections. J. Turbul. 2024, 25, 62–82. [Google Scholar] [CrossRef]
  4. Sexl, T.R. Zur Stabilitätfrage der Poiseuilischen und de Couette-Strömung. Irmalen Phys. 1927, 83, 835. [Google Scholar]
  5. Sexl, T.H.; Spielberg, K. Zum Stabilitätproblem der Poiseu Mromung Heta. Phys. Aust. 1958, 12, 9. [Google Scholar]
  6. Avila, M.; Barkley, D.; Hof, B. Transition to turbulence in pipe flow. Annu. Rev. Fluid Mech. 2023, 55, 575–602. [Google Scholar] [CrossRef]
  7. Schlichting, H.; Kestin, J. Boundary Layer Theory, 7th ed.; McGraw-Hill: New York, NY, USA, 1979. [Google Scholar]
  8. Kerswell, R.R. Recent progress in understanding the transition to turbulence in a pipe. Nonlinearity 2005, 18, R17. [Google Scholar] [CrossRef]
  9. Manneville, P. Transition to turbulence in wall bounded flows: Where do we stand. Mech. Eng. Rev. 2016, 3. [Google Scholar] [CrossRef]
  10. White, F.M. Viscous Fluid Flow, Section Transition to Turbulence, 3rd ed.; McGraw Hill: New York, NY, USA, 2009. [Google Scholar]
  11. Reynolds, O. An experimental investigation of the circumstances which determine whether the motion of water shall be direct of sinuous, and the law of resistance in parallel channels. Philos. Trans. R. Soc. Lond. Ser. A 1883, 174, 935–982. [Google Scholar]
  12. Fox, J.A.; Lessen, M.; Bhat, W.V. Experimental Investigation of the Stability of Hagen-Poiseuille Flow. Phys. Fluids 1968, 11, 1–4. [Google Scholar] [CrossRef]
  13. Nishi, M. Laminar-to-Turbulent Transition in Pipe Flow Through Puffs and Slugs. Ph.D. Thesis, University of Erlangen-Nuremberg, Erlangen, Germany, 2009. [Google Scholar]
  14. Selvam, K.; Öngüner, E.; Peixinho, J.; Zanoun, E.-S.; Egbers, C. Wall pressure in developing turbulent pipe flows. J. Fluids Eng. ASME 2018, 140, 081203. [Google Scholar] [CrossRef]
  15. Zanoun, E.-S.; Kito, M.; Egbers, C. A study on flow transition and development in circular and rectangular ducts. J. Fluids Eng. 2009, 131, 061204. [Google Scholar] [CrossRef]
  16. Zanoun, E.-S.; Egbers, C. Flow transition and development in pipe facilities. J. Eng. Appl. Sci. 2016, 63, 141–159. [Google Scholar]
  17. Barnes, H.T.; Coker, E.G. The flow of water through pipes—Experiments on streamline motion and the measurement of critical velocity. R. Soc. 1905, 3, 497–506. [Google Scholar] [CrossRef]
  18. Darbyshire, A.G.; Mullin, T. Transition to turbulence in constant-mass-flux pipe flow. J. Fluid Mech. 1995, 289, 83–114. [Google Scholar] [CrossRef]
  19. Draad, A.A.; Kuiken, G.D.C.; Nieuwstadt, F.T.M. Laminar–turbulent transition in pipe flow for Newtonian and Non- Newtonian fluids. J. Fluid Mech. 1998, 377, 267–312. [Google Scholar] [CrossRef]
  20. Hof, B.; Juel, A.; Mullin, T. Scaling of the turbulence transition threshold in a pipe. Phys. Rev. Lett. 2003, 91, 244502. [Google Scholar] [CrossRef]
  21. Lindgren, E.R. Propagation velocity of turbulent slugs and streaks in transition pipe flow. Phys. Fluids 1969, 12, 418–425. [Google Scholar] [CrossRef]
  22. Meseth, J. Experimentelle Untersuchung der Übergangszonen Zwischen Laminaren und Turbulenten Strömungsgebieten in Intermittenter Rohrströmung; Mitteilungen aus dem Max–Planck–Institut für Strömungsforschung und der Aerodynamischen Versuchsanstalt, Nr. 58; Max–Planck–Ges. z. Forderung d. Wiss., Max–Planck–Inst. f. Stromungsforschung: Gottingen, Germany, 1974; pp. 1–114. [Google Scholar]
  23. Pfeninger, W. Boundary layer suction experiments with laminar flow at high Reynolds numbers in the inlet length of a tube by various suction methods. In Boundary Layer and Flow Control; Lachman, G.V., Ed.; Pergamon Press: Oxford, UK, 1961; pp. 961–980. [Google Scholar]
  24. Rotta, J.C. Experimenteller Beitrag zur Entstehung turbulenter Ströung im Röhr. Ingeniieur-Arch. 1956, 24, 258–281. [Google Scholar] [CrossRef]
  25. Schiller, L. Neu berichte zur turbulenzentwicklung. Z. Angew.-Mathe-Matik Mech. (ZAMM) 1934, 14, 36–42. [Google Scholar] [CrossRef]
  26. Wygnanski, I.J.; Champagne, F.H. On Transition in a Pipe—Part 1: The Origin of Puffs and Slugs and the Flow in a Turbulent Slug. J. Fluid Mech. 1973, 59, 281–335. [Google Scholar] [CrossRef]
  27. Durst, F. Theoretical treatment of the instability of fully developed laminar pipe flow taking wall roughness into account. Phys. Fluids 2024, 36, 104109. [Google Scholar] [CrossRef]
  28. Haddad, K.E. Development of Special Flow Test Rigs and their Application for Pulsating and Transitional Flow Investigations. Ph.D. Thesis, Universität Erlangen Nürnberg, Erlangen, Germany, 2009. [Google Scholar]
  29. Ünsal, B. Time-Dependent Laminar, Transitional and Turbulent Pipe Flows. Ph.D. Thesis, University of Erlangen-Nuremberg, Erlangen, Germany, 2008. [Google Scholar]
  30. Zanoun, E.-S. Flow characteristics in low-speed wind tunnel contractions: Simulation and testing. AEJ-Alex. Eng. J. 2017, 57, 2265–2277. [Google Scholar] [CrossRef]
  31. McKeon, B.J.; Zagarola, M.V.; Smits, A.J. A new friction factor relationship for fully developed pipe flow. J. Fluid Mech. 2005, 538, 429–443. [Google Scholar] [CrossRef]
  32. Peixinho, J.; Mullin, T. Finite-amplitude thresholds for transition in pipe flow. J. Fluid Mech. 2007, 582, 169–178. [Google Scholar] [CrossRef]
  33. Nikuradse, J. Gesetzmssigkeiten der turbulenten Strömung in glatten Röhren, Forschungsh. Ver Deutsch. Ing. 1932, 356. [Google Scholar]
  34. Haung, K.; Wan, J.W.; Chen, C.X. Experimental investigation on friction factor in pipes with large roughness. Exp. Therm. Fluid Sci. 2013, 50, 147–153. [Google Scholar] [CrossRef]
  35. Churchill, S.W.; Usagi, R. A general expression for the correlation rates of transfer and other phenomena. AIChE J. Wol. 1972, 18, 1121–1128. [Google Scholar] [CrossRef]
  36. Millikan, C.M. A critical discussion of turbulent flows in channels and circular tubes. Int. Congr. Appl. Mech. 1938, 386–392. [Google Scholar]
  37. Tennekes, H. Outline of a second-order theory of turbulent pipe flow. AIAA J. 1968, 6, 1735. [Google Scholar] [CrossRef]
  38. Tennekes, H.; Lumley, J.L. A First Course in Turbulence; MIT Press: Cambridge, MA, USA, 1972. [Google Scholar]
  39. Jovanovic, J. (LSTM-Erlangen, FAU Erlangen-Nuremberg, Erlangen, Germany). Priviate communication, 2024.
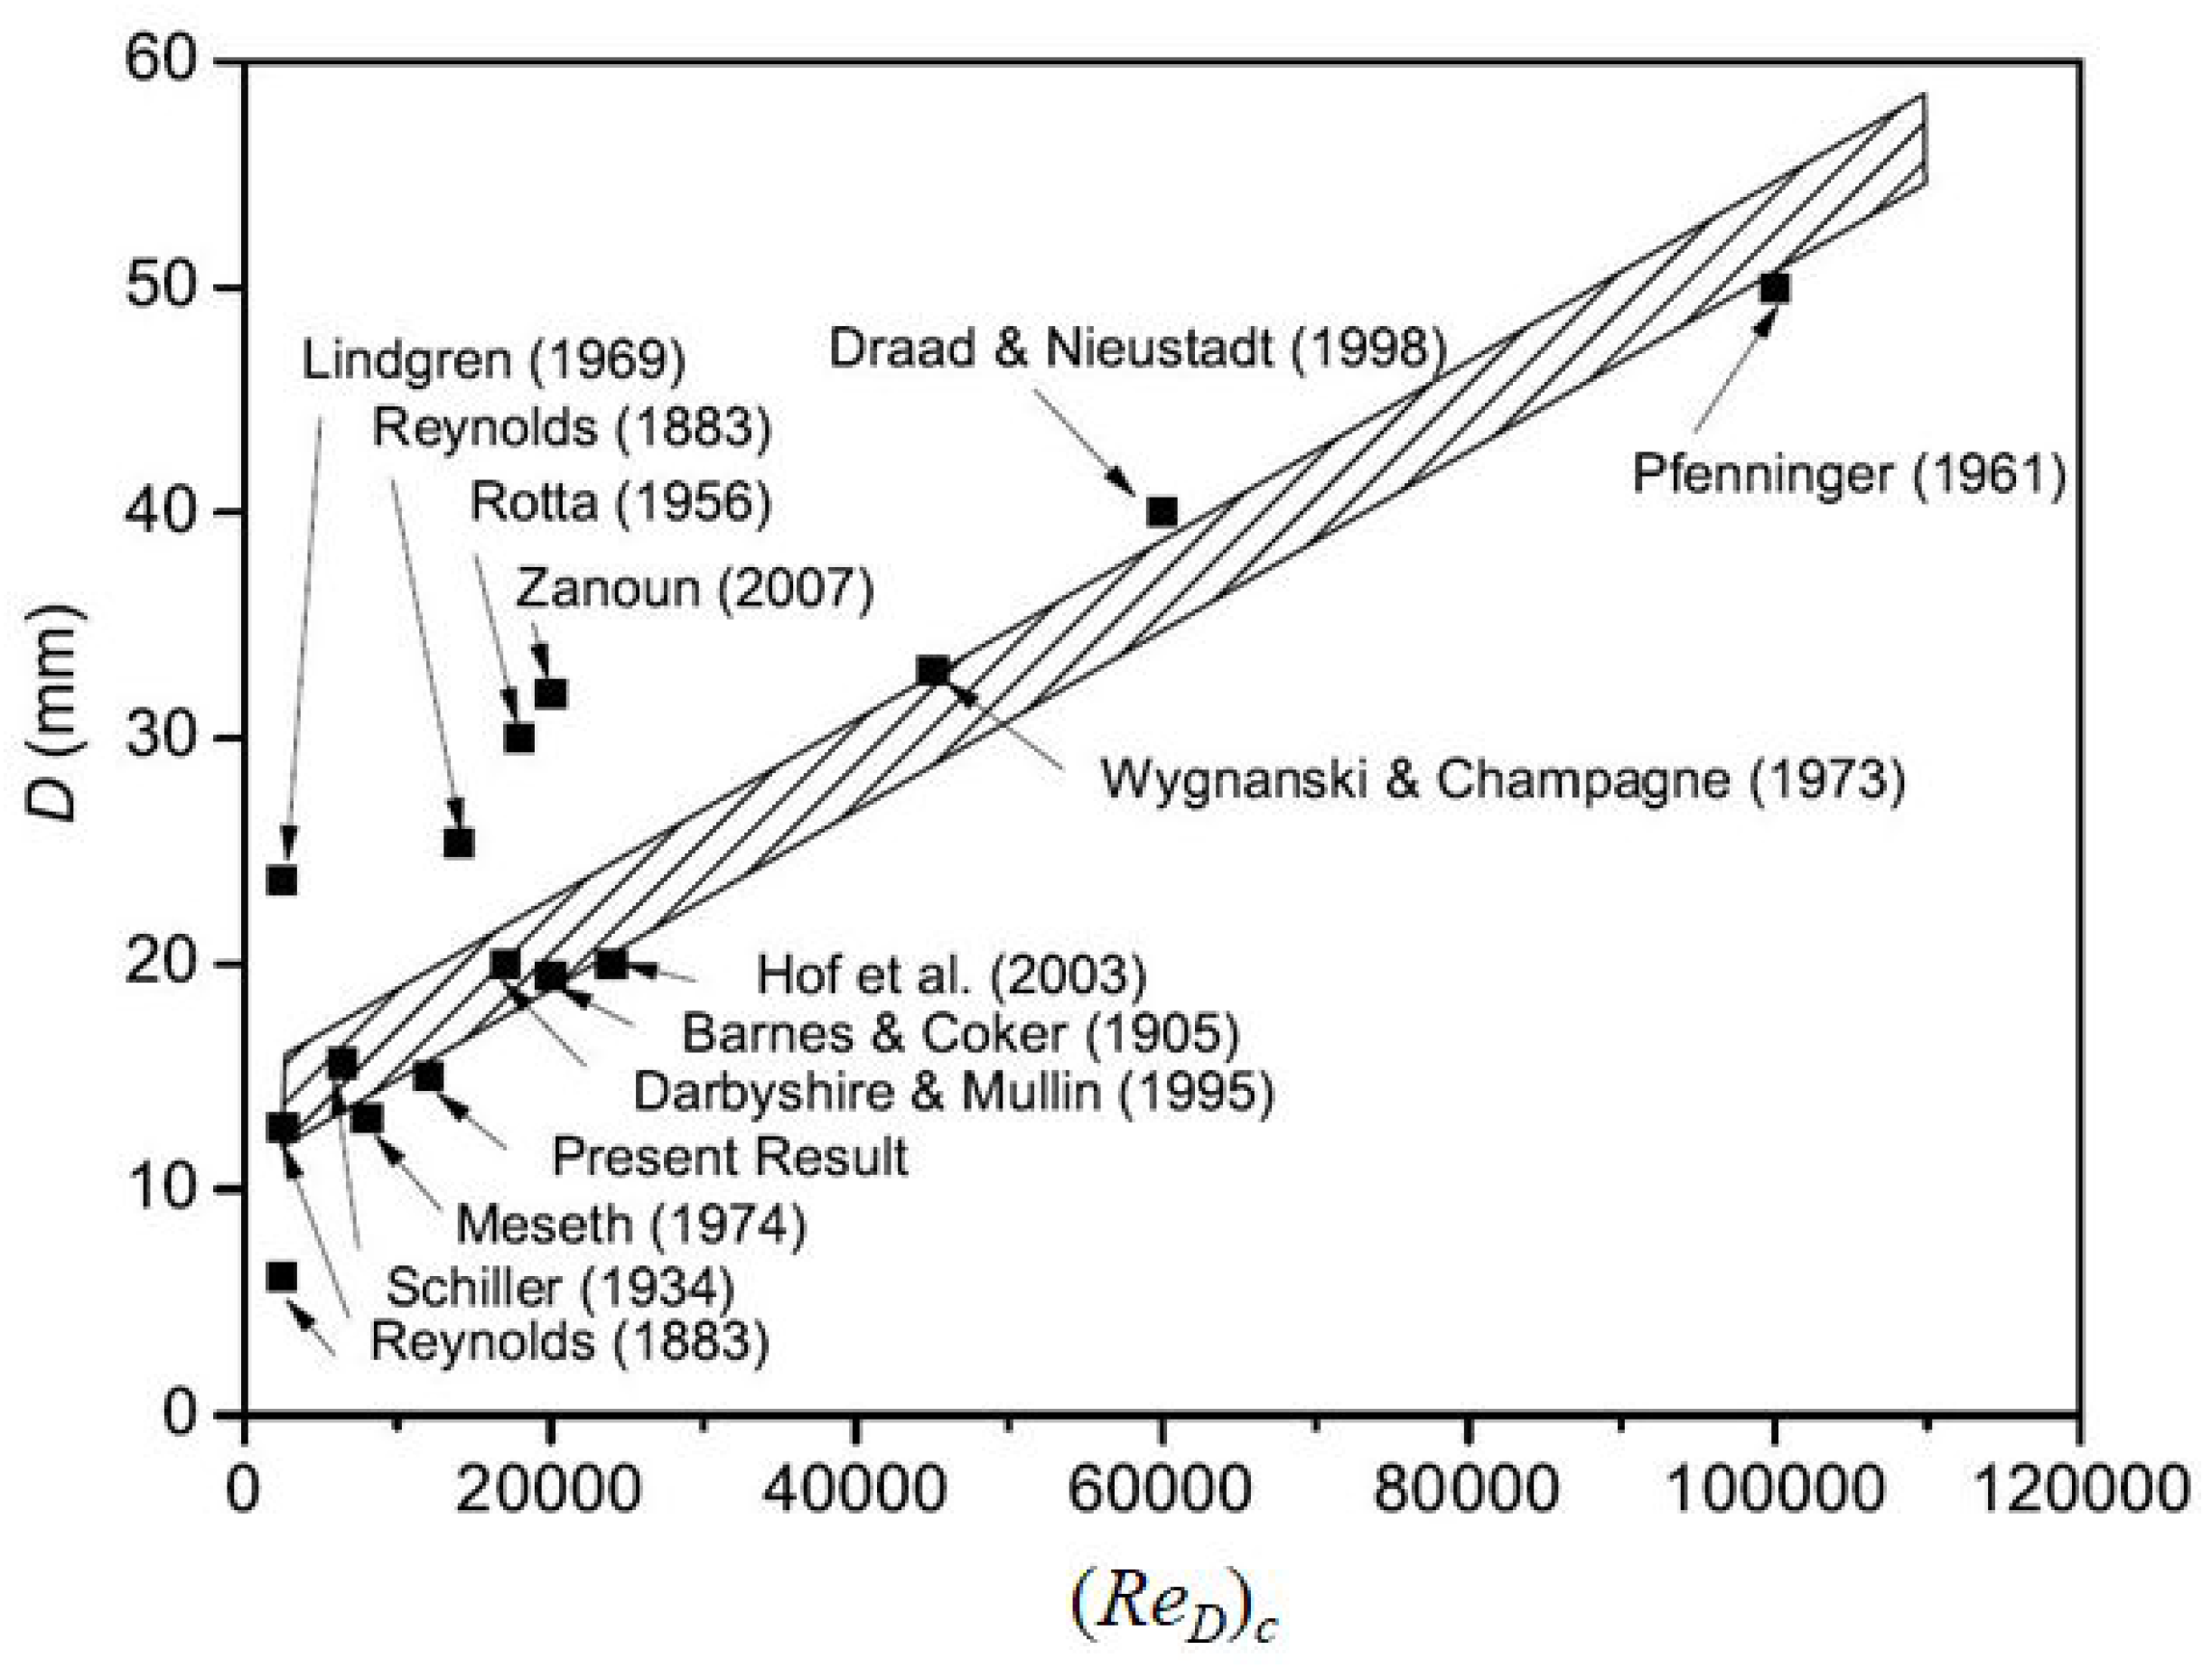
Figure 1. Dependence of the pipe diameter D on the critical Reynolds number ( R e D ) c ; data are deduced from available experiments, see [13] ([11,17,18,19,20,21,22,23,24,25,26]).
Fluids 10 00216 g001
Figure 2. (top) Pipe test rig with major components for theoretical investigations of the laminar-to-turbulent transition of pipe flows: D = pipe diameter, L = length of pipe test section, (bottom) Pipe geometry with a main flow region and a roughness layer at the pipe wall, R = pipe radius, y = wall-normal distance, δ = height of wall roughness.
Fluids 10 00216 g002
Figure 3. (a) Nikuradze’s friction factor measurements extracted from [7]. (b) Variation base flow friction factor λ with Reynolds number Re for various wall roughnesses R 3 (smooth)— R 11 (very rough) from Huang et al. [34].
Fluids 10 00216 g003
Figure 4. Centerline turbulence intensity, Tu, as a function of Reynolds number for two different pipe diameters and insertion/foam conditions in diffuser section of plenum chamber: (left) Foam I, = 280 mm, pore diameter = 6 mm; (right) Foam II, = 280 mm, pore diameter = 1 mm, extracted from [28].
Fluids 10 00216 g004
Figure 5. Centerline turbulence intensity, Tu, as a function of the flow rate for different pipe diameters and insertion/foam conditions, extracted from [28].
Fluids 10 00216 g005
Figure 6. Re-plotted transition critical Reynolds number of Nishi [13] extended by experimental data extracted from the literature. Lines show prediction according to Equation (20), [11,13,15,17,18,19,20,21,22,23,24,25,26].
Fluids 10 00216 g006
Figure 7. Laminar-to-turbulent transition for sinusoidal input velocity variations at 1 Hz, showing a high degree of repetition even for transitional flow, extracted from [27].
Fluids 10 00216 g007
Figure 8. Forward and reverse pipe flow for sinusoidal velocity variation at 1 Hz shows a high degree of repeatability even for flow transition, (left) D = 14 mm, ( L / D ) = 357 and (right) D = 10 mm, ( L / D ) = 500 , extracted from [28].
Fluids 10 00216 g008
Figure 9. Transition measurements by (top-left), (top-right) [15] and (bottom) [39], showing an increase of turbulence level and transition when resonance of frequencies occurs.
Fluids 10 00216 g009
Figure 10. Zoomed turbulent-to-laminar transition for sinusoidal velocity variation at 1 Hz for flow transition, extracted from [28].
Fluids 10 00216 g010
Figure 11. Summary of three reference experiments, showing pipe diameter and length effects on the transitional critical Reynolds number [11,15,23].
Fluids 10 00216 g011
Disclaimer/Publisher’s Note: The statements, opinions and data contained in all publications are solely those of the individual author(s) and contributor(s) and not of MDPI and/or the editor(s). MDPI and/or the editor(s) disclaim responsibility for any injury to people or property resulting from any ideas, methods, instructions or products referred to in the content.