

High-Salinity Fluid Downslope Flow on Regolith Layer Examined by Laboratory Experiment: Implications for Recurring Slope Lineae on Martian Surfaces


Abstract
1. Introduction
2. Methods
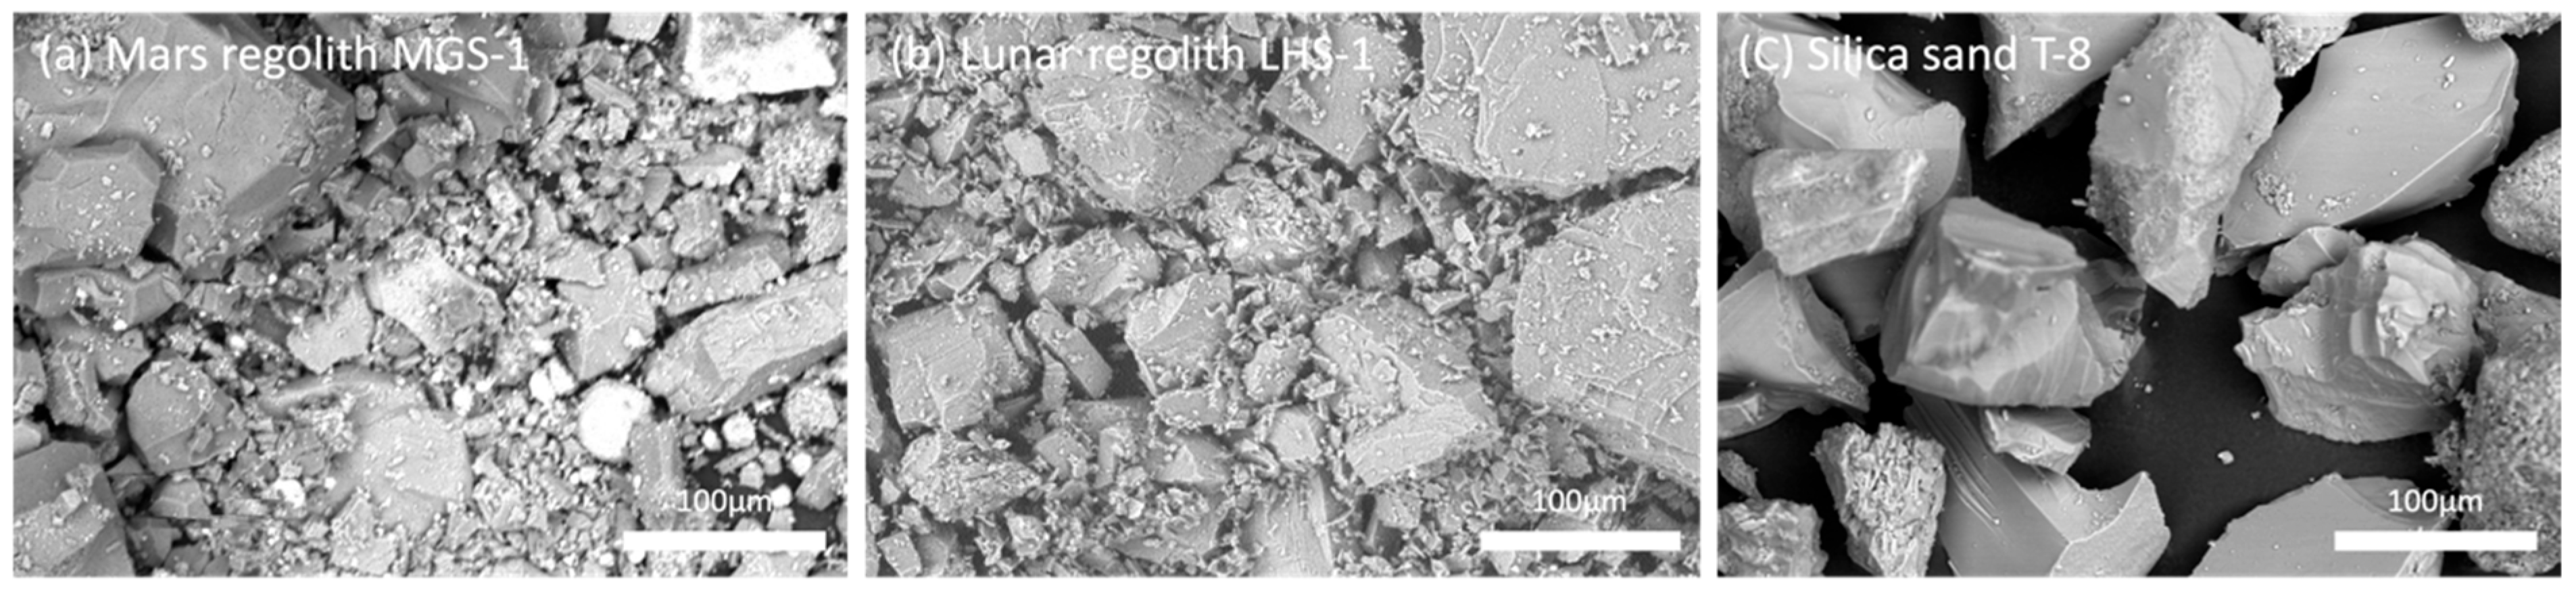
2.1. Materials
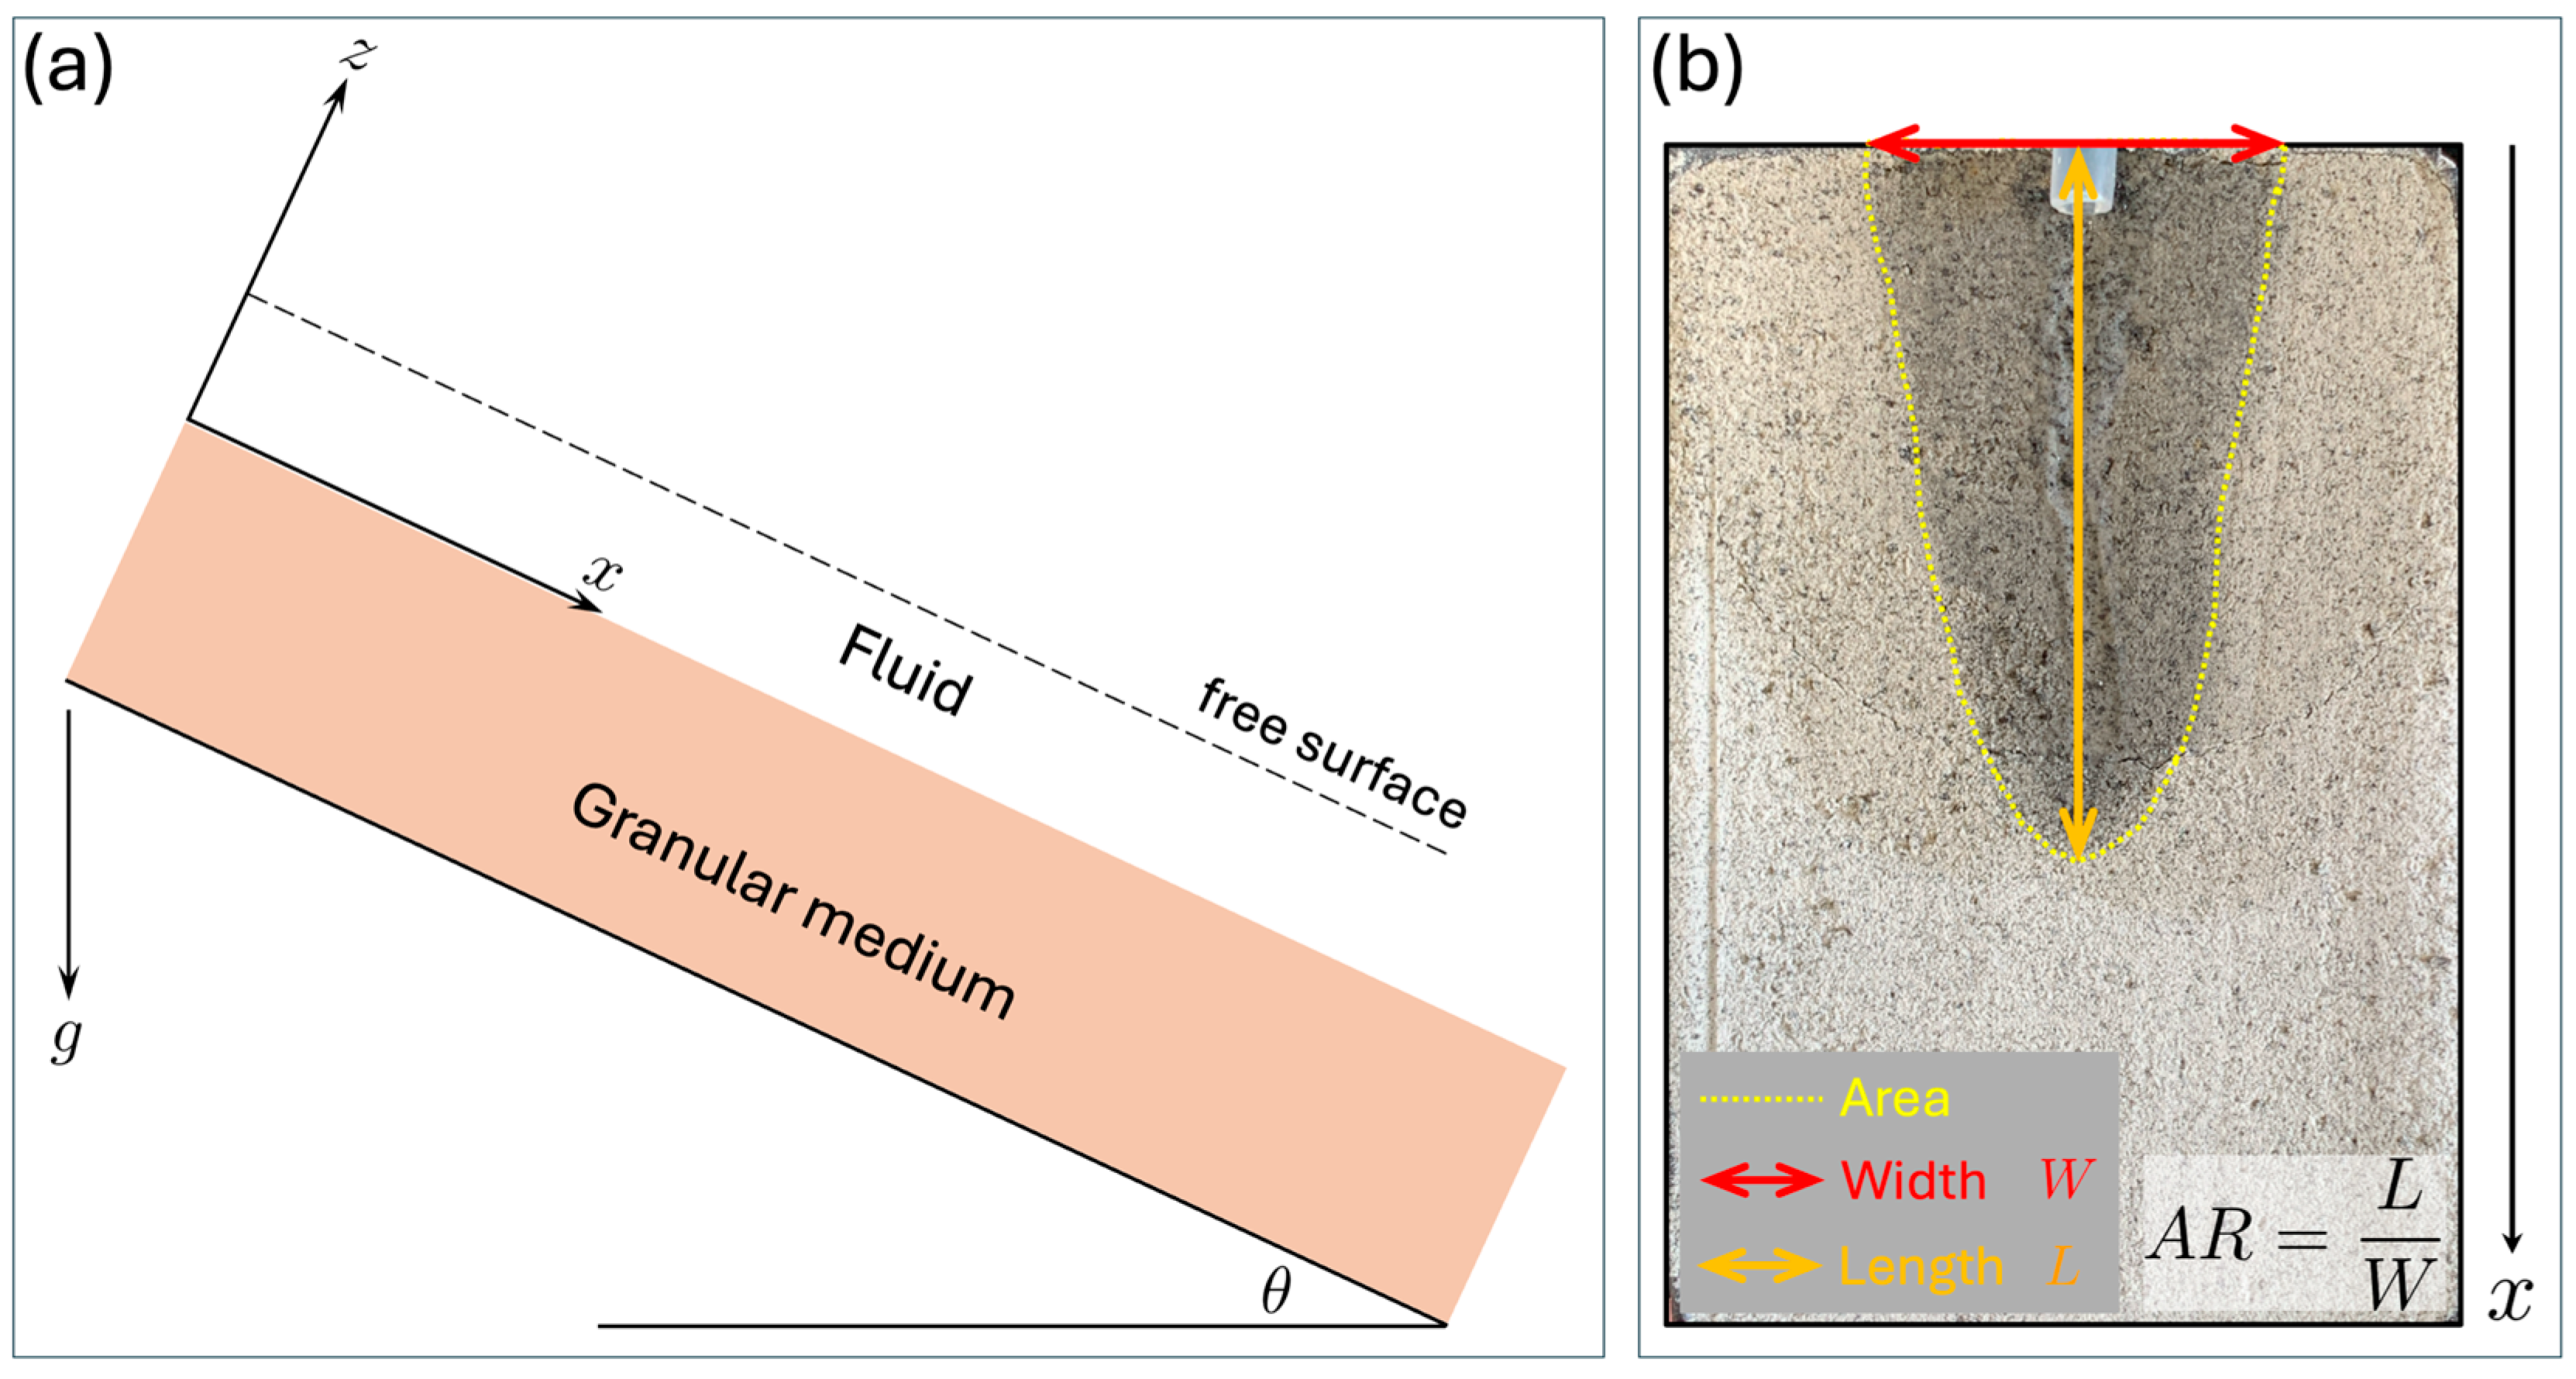
2.2. Experimental Setup
3. Results
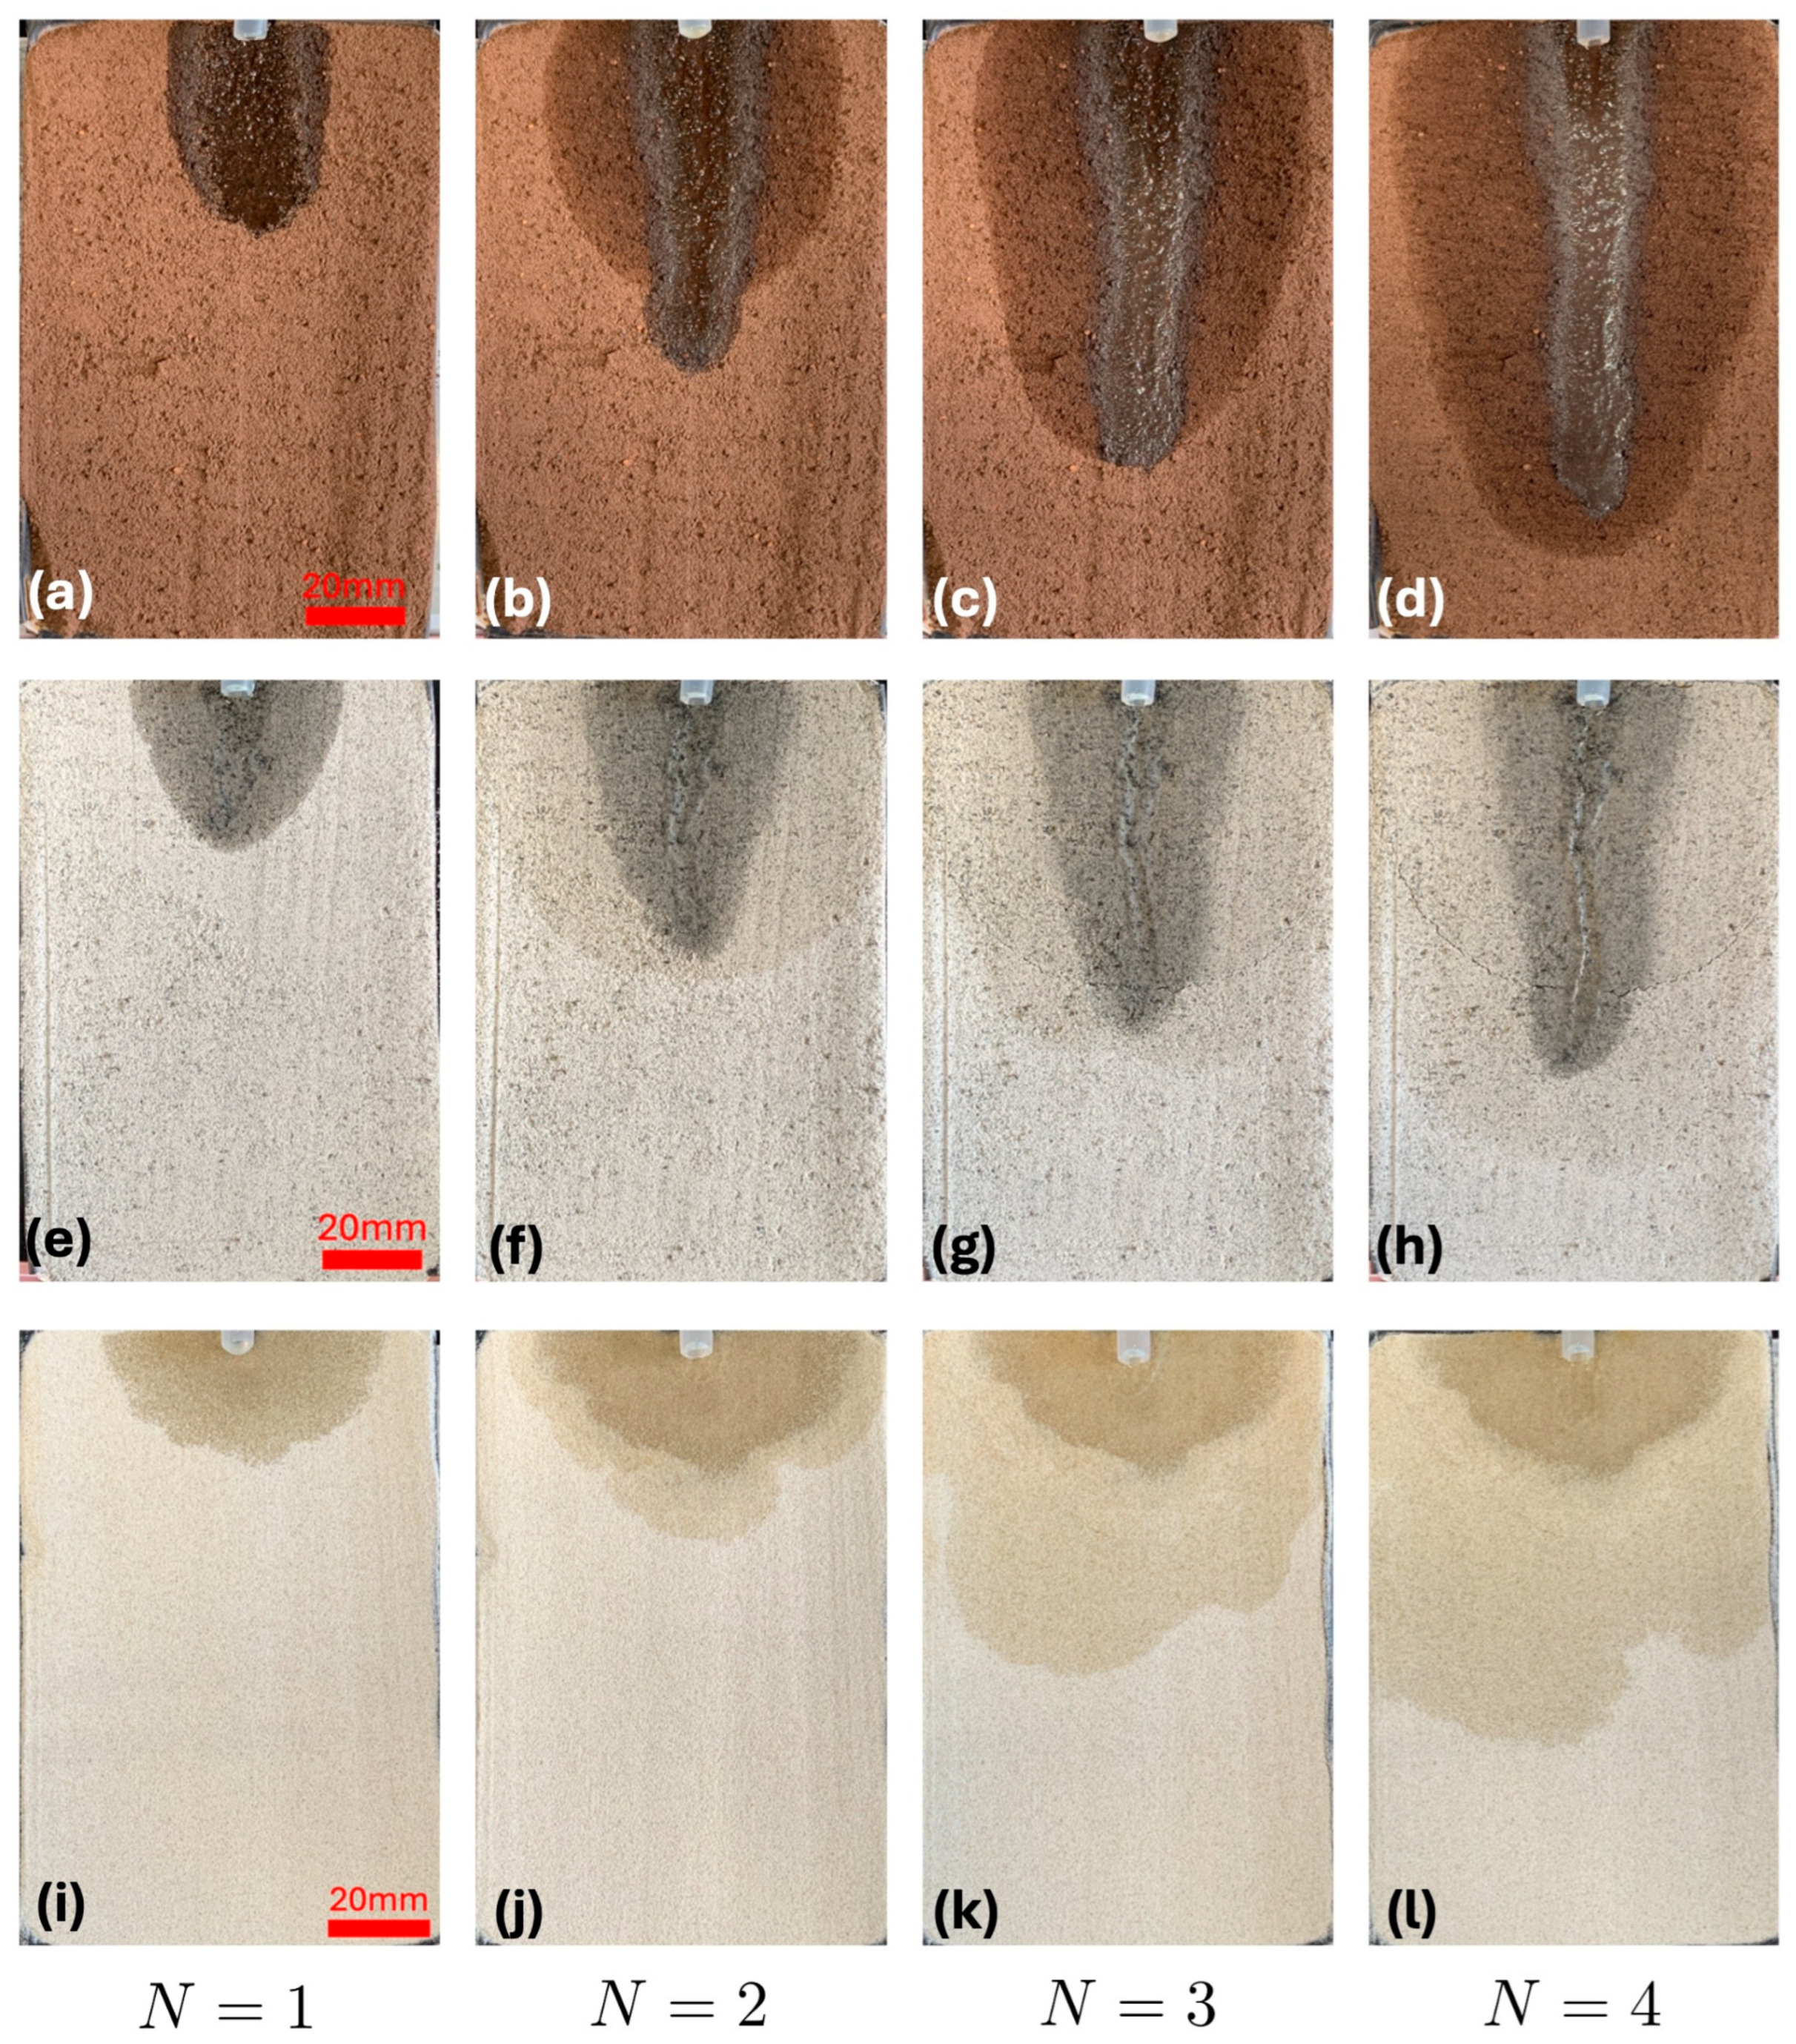
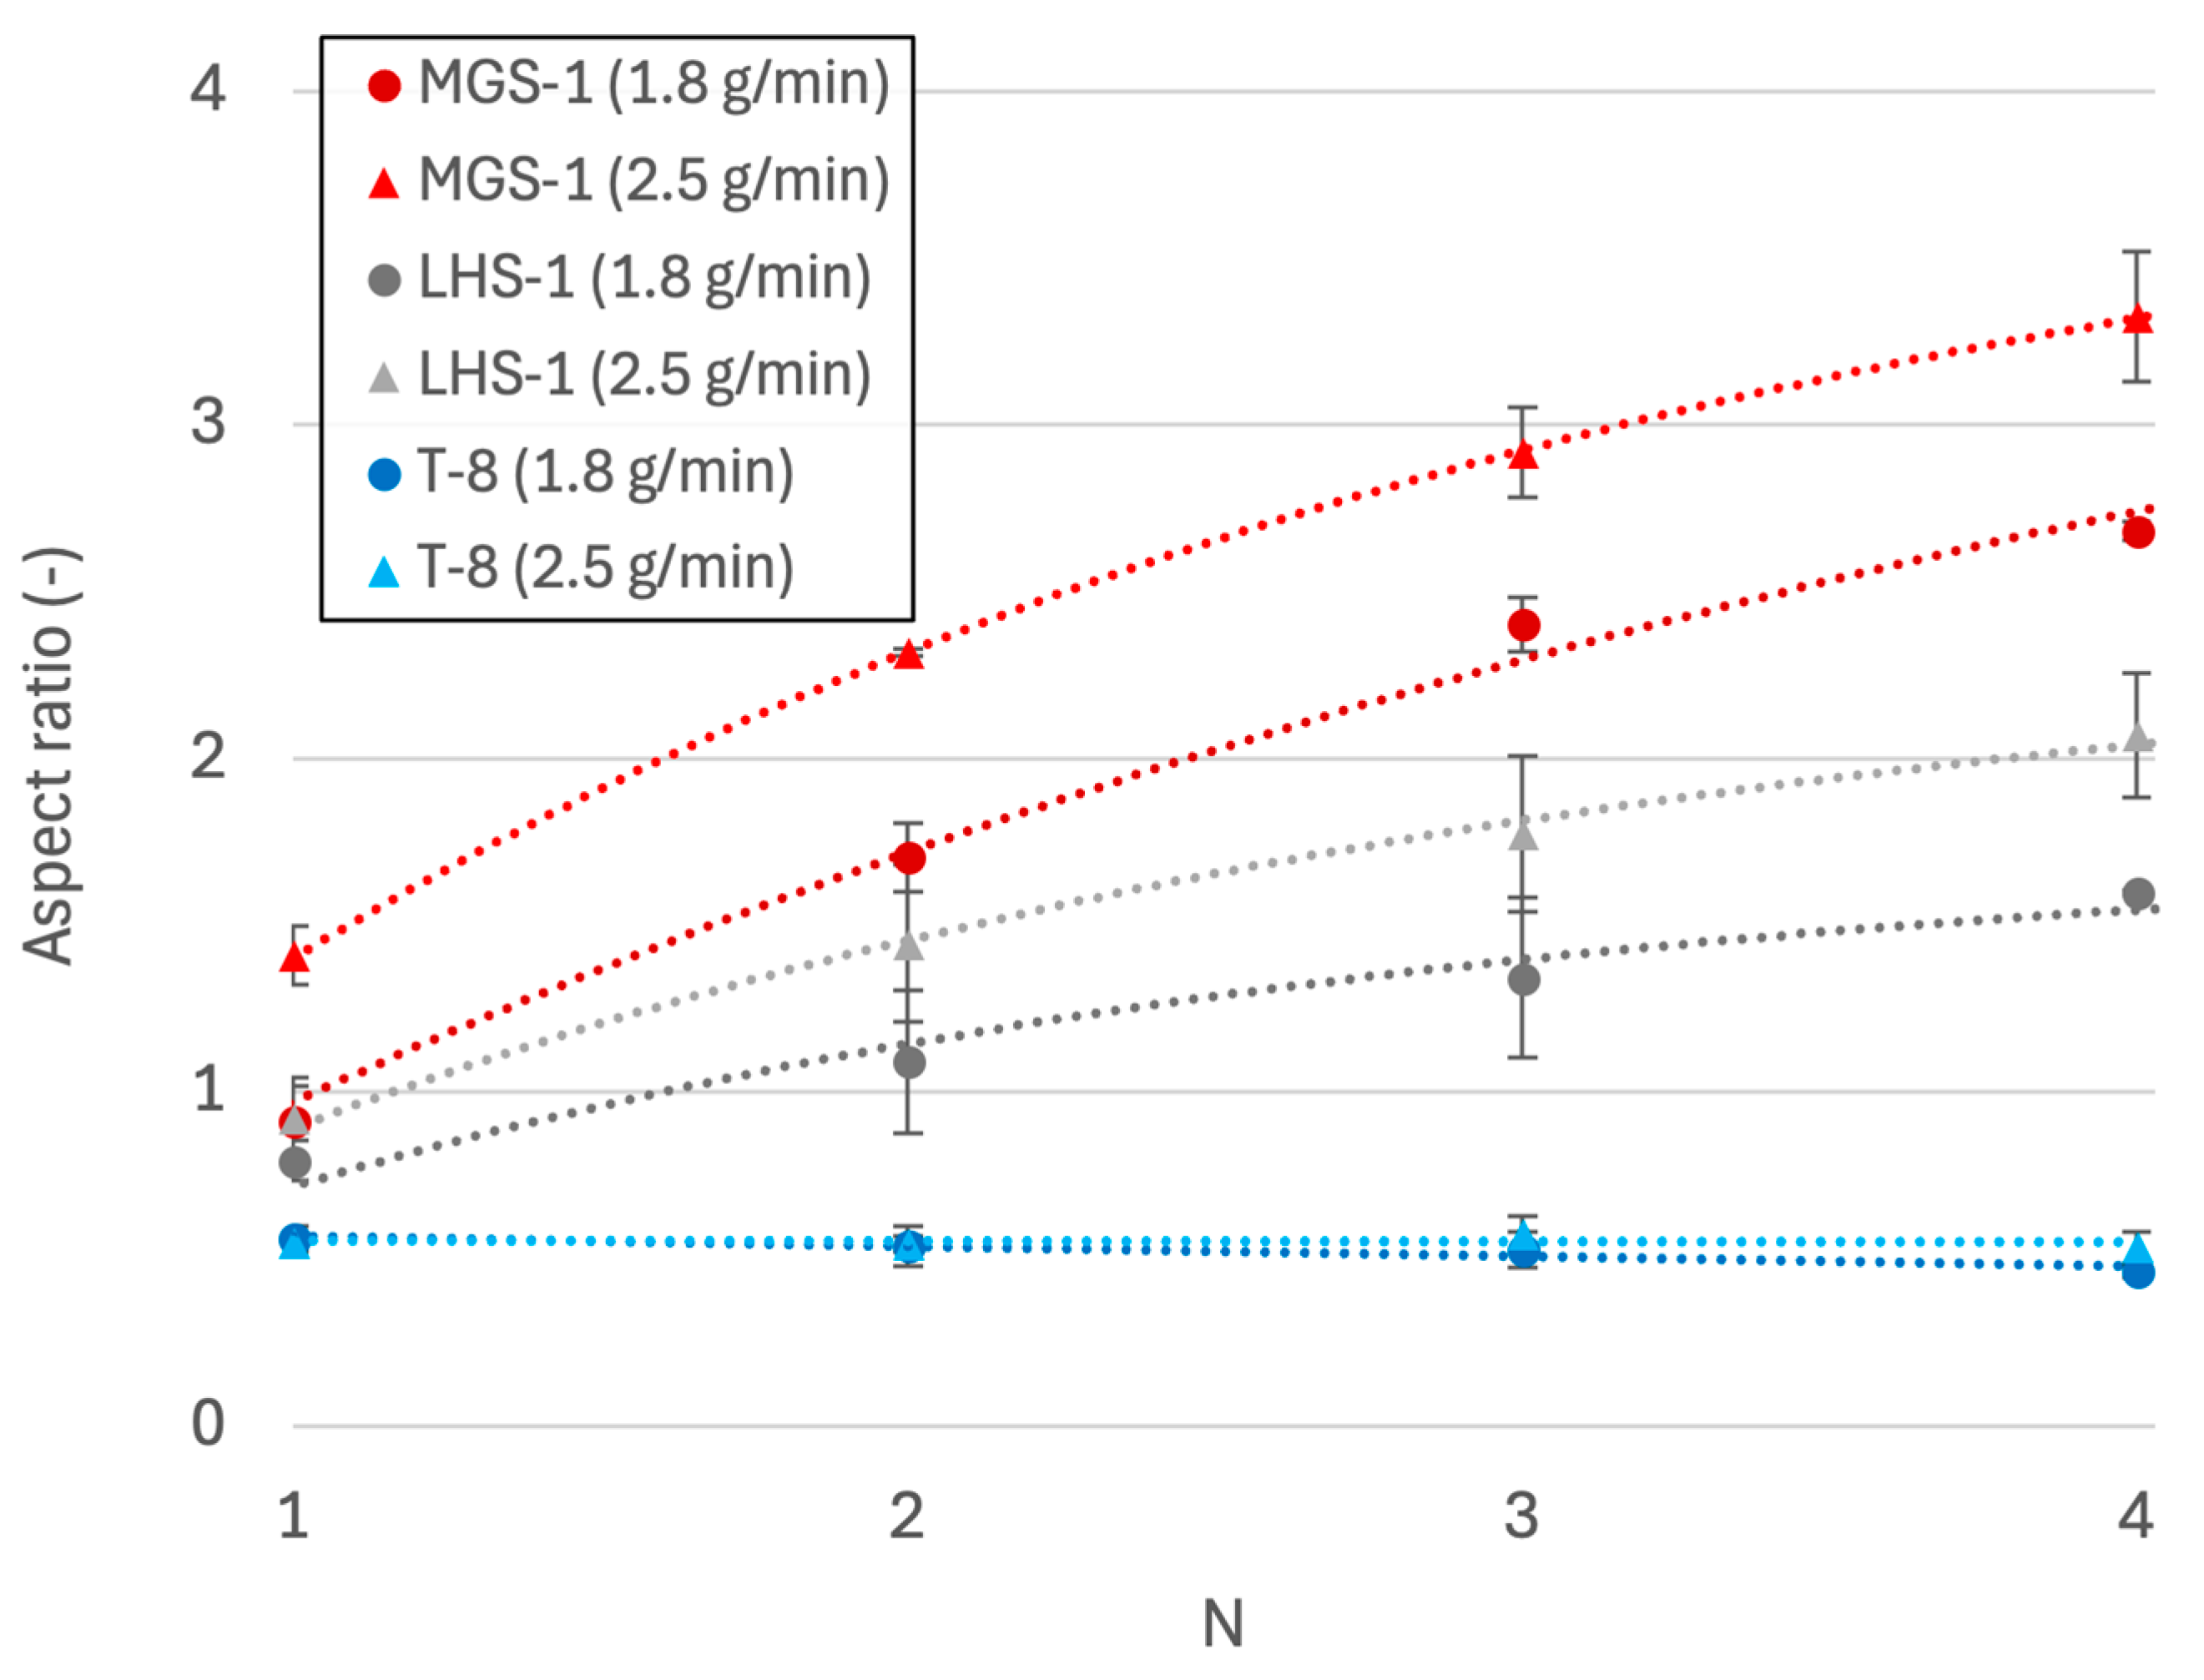
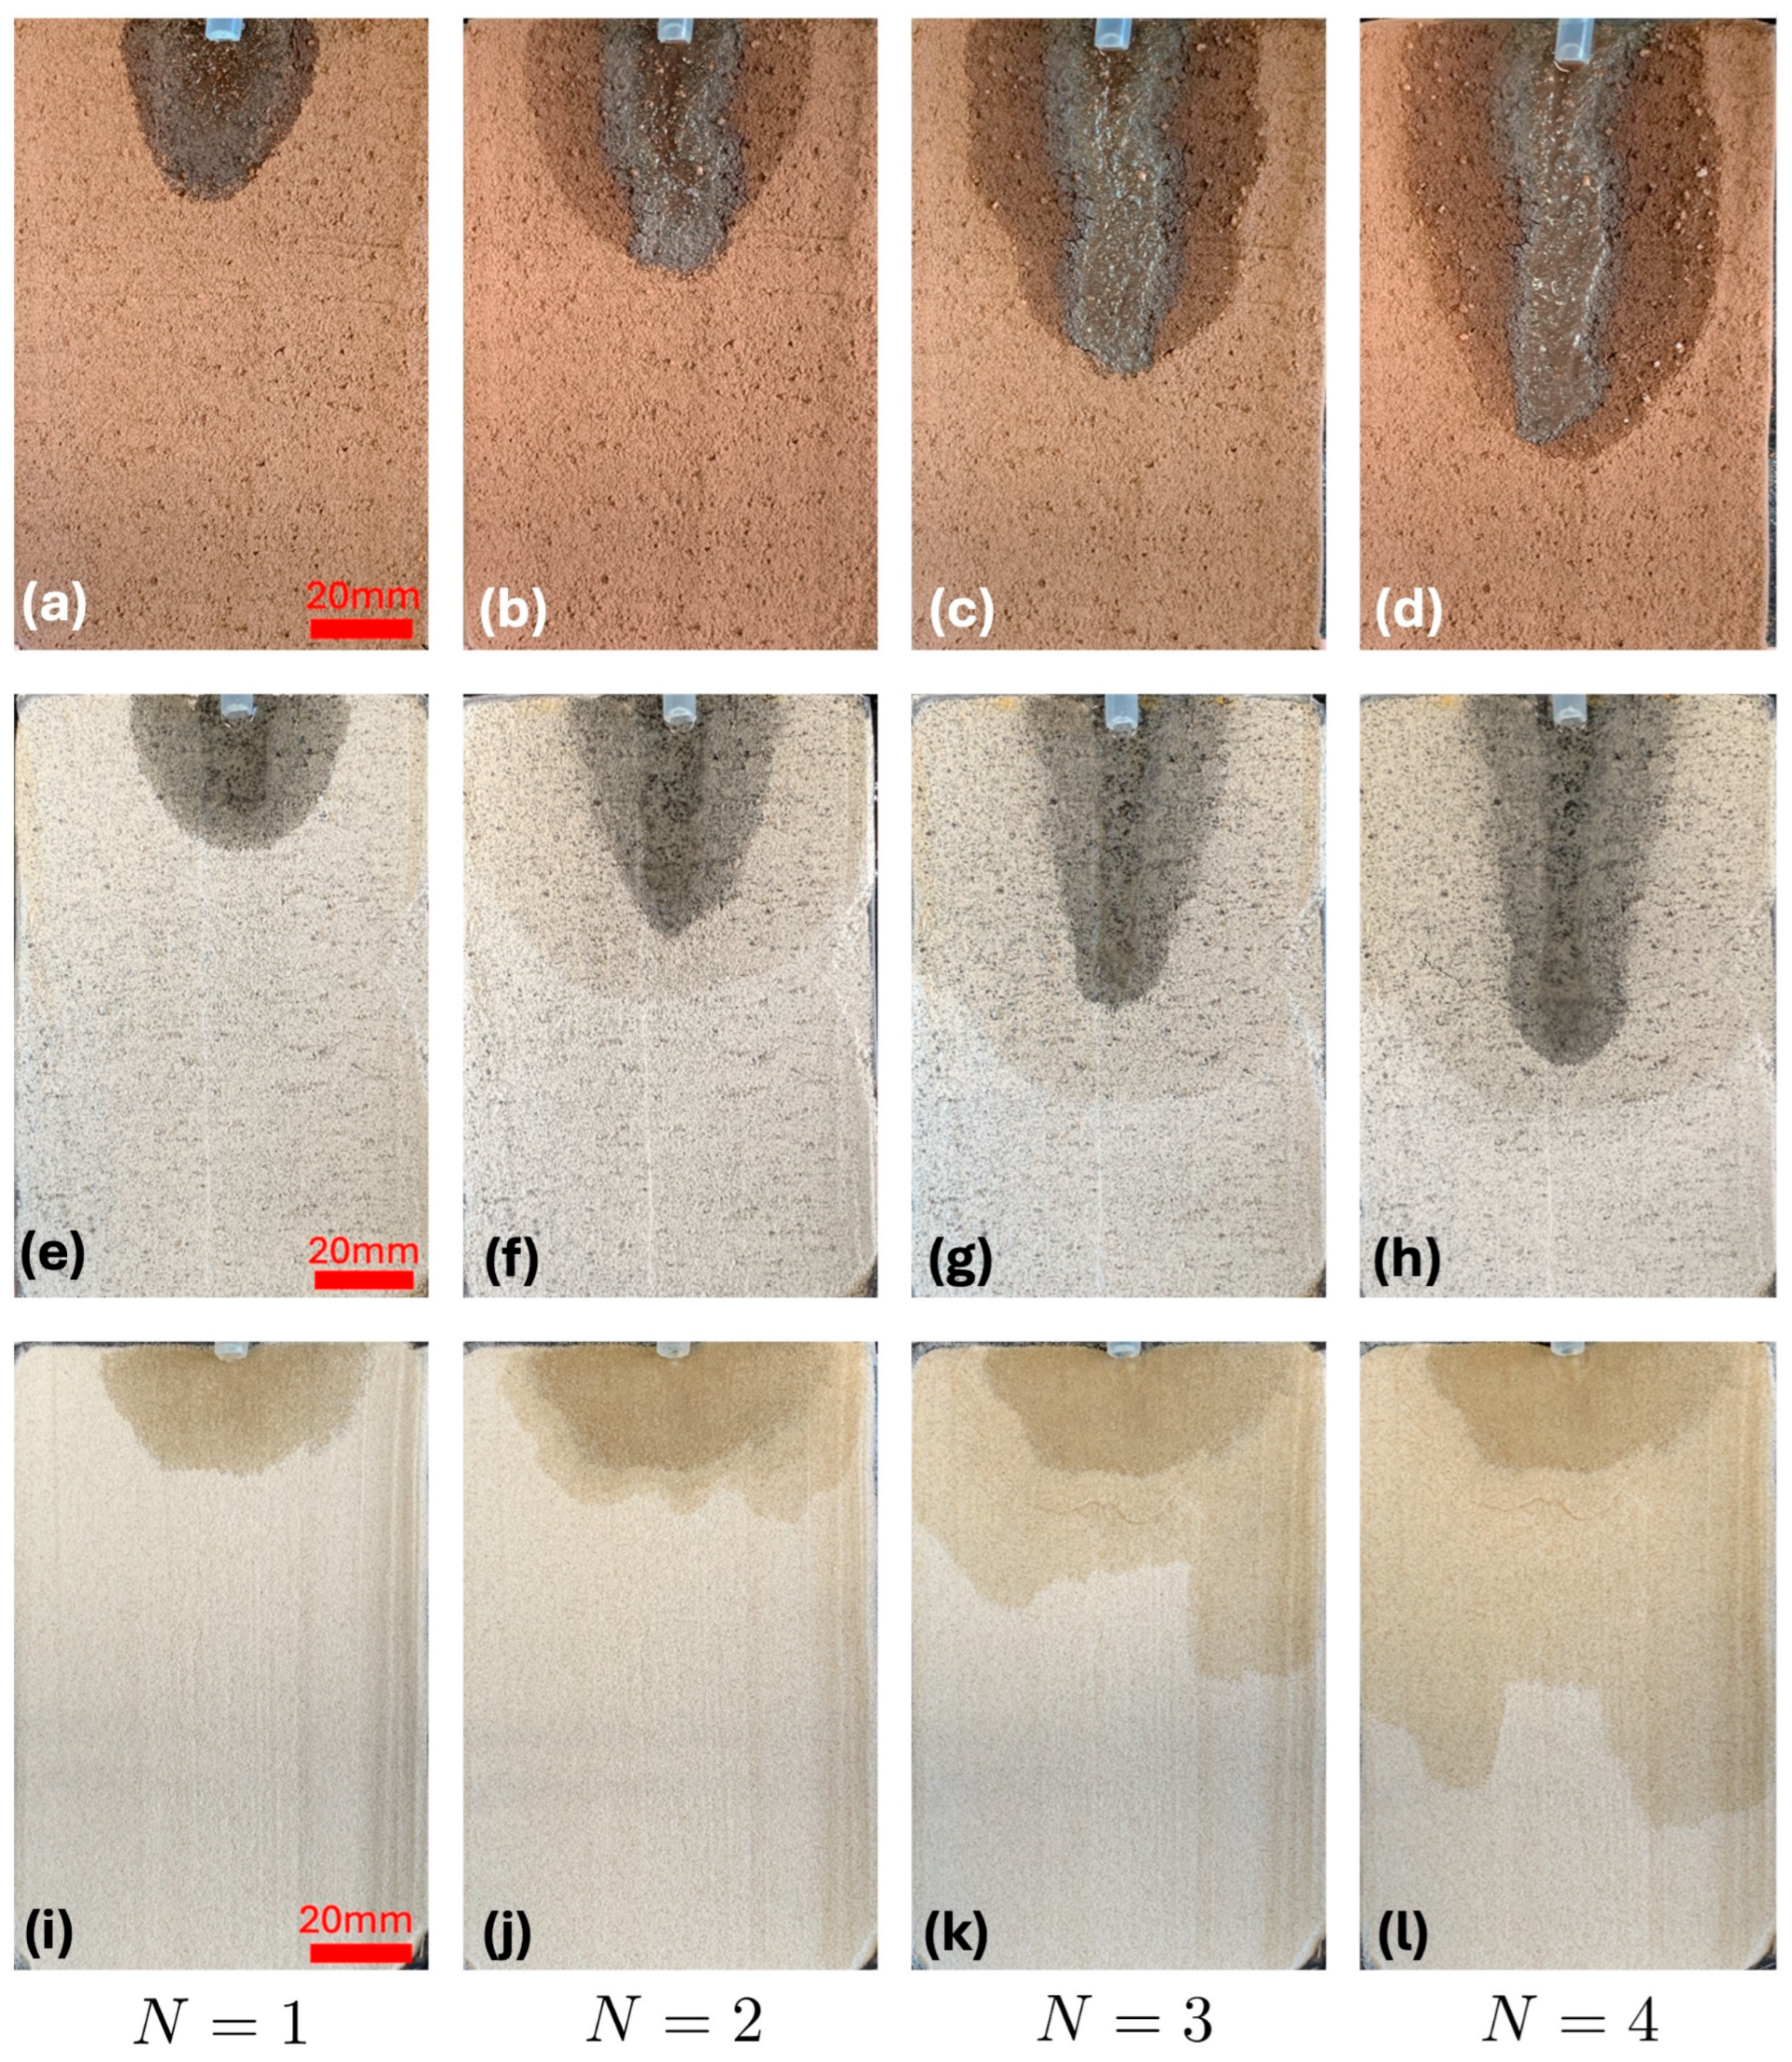
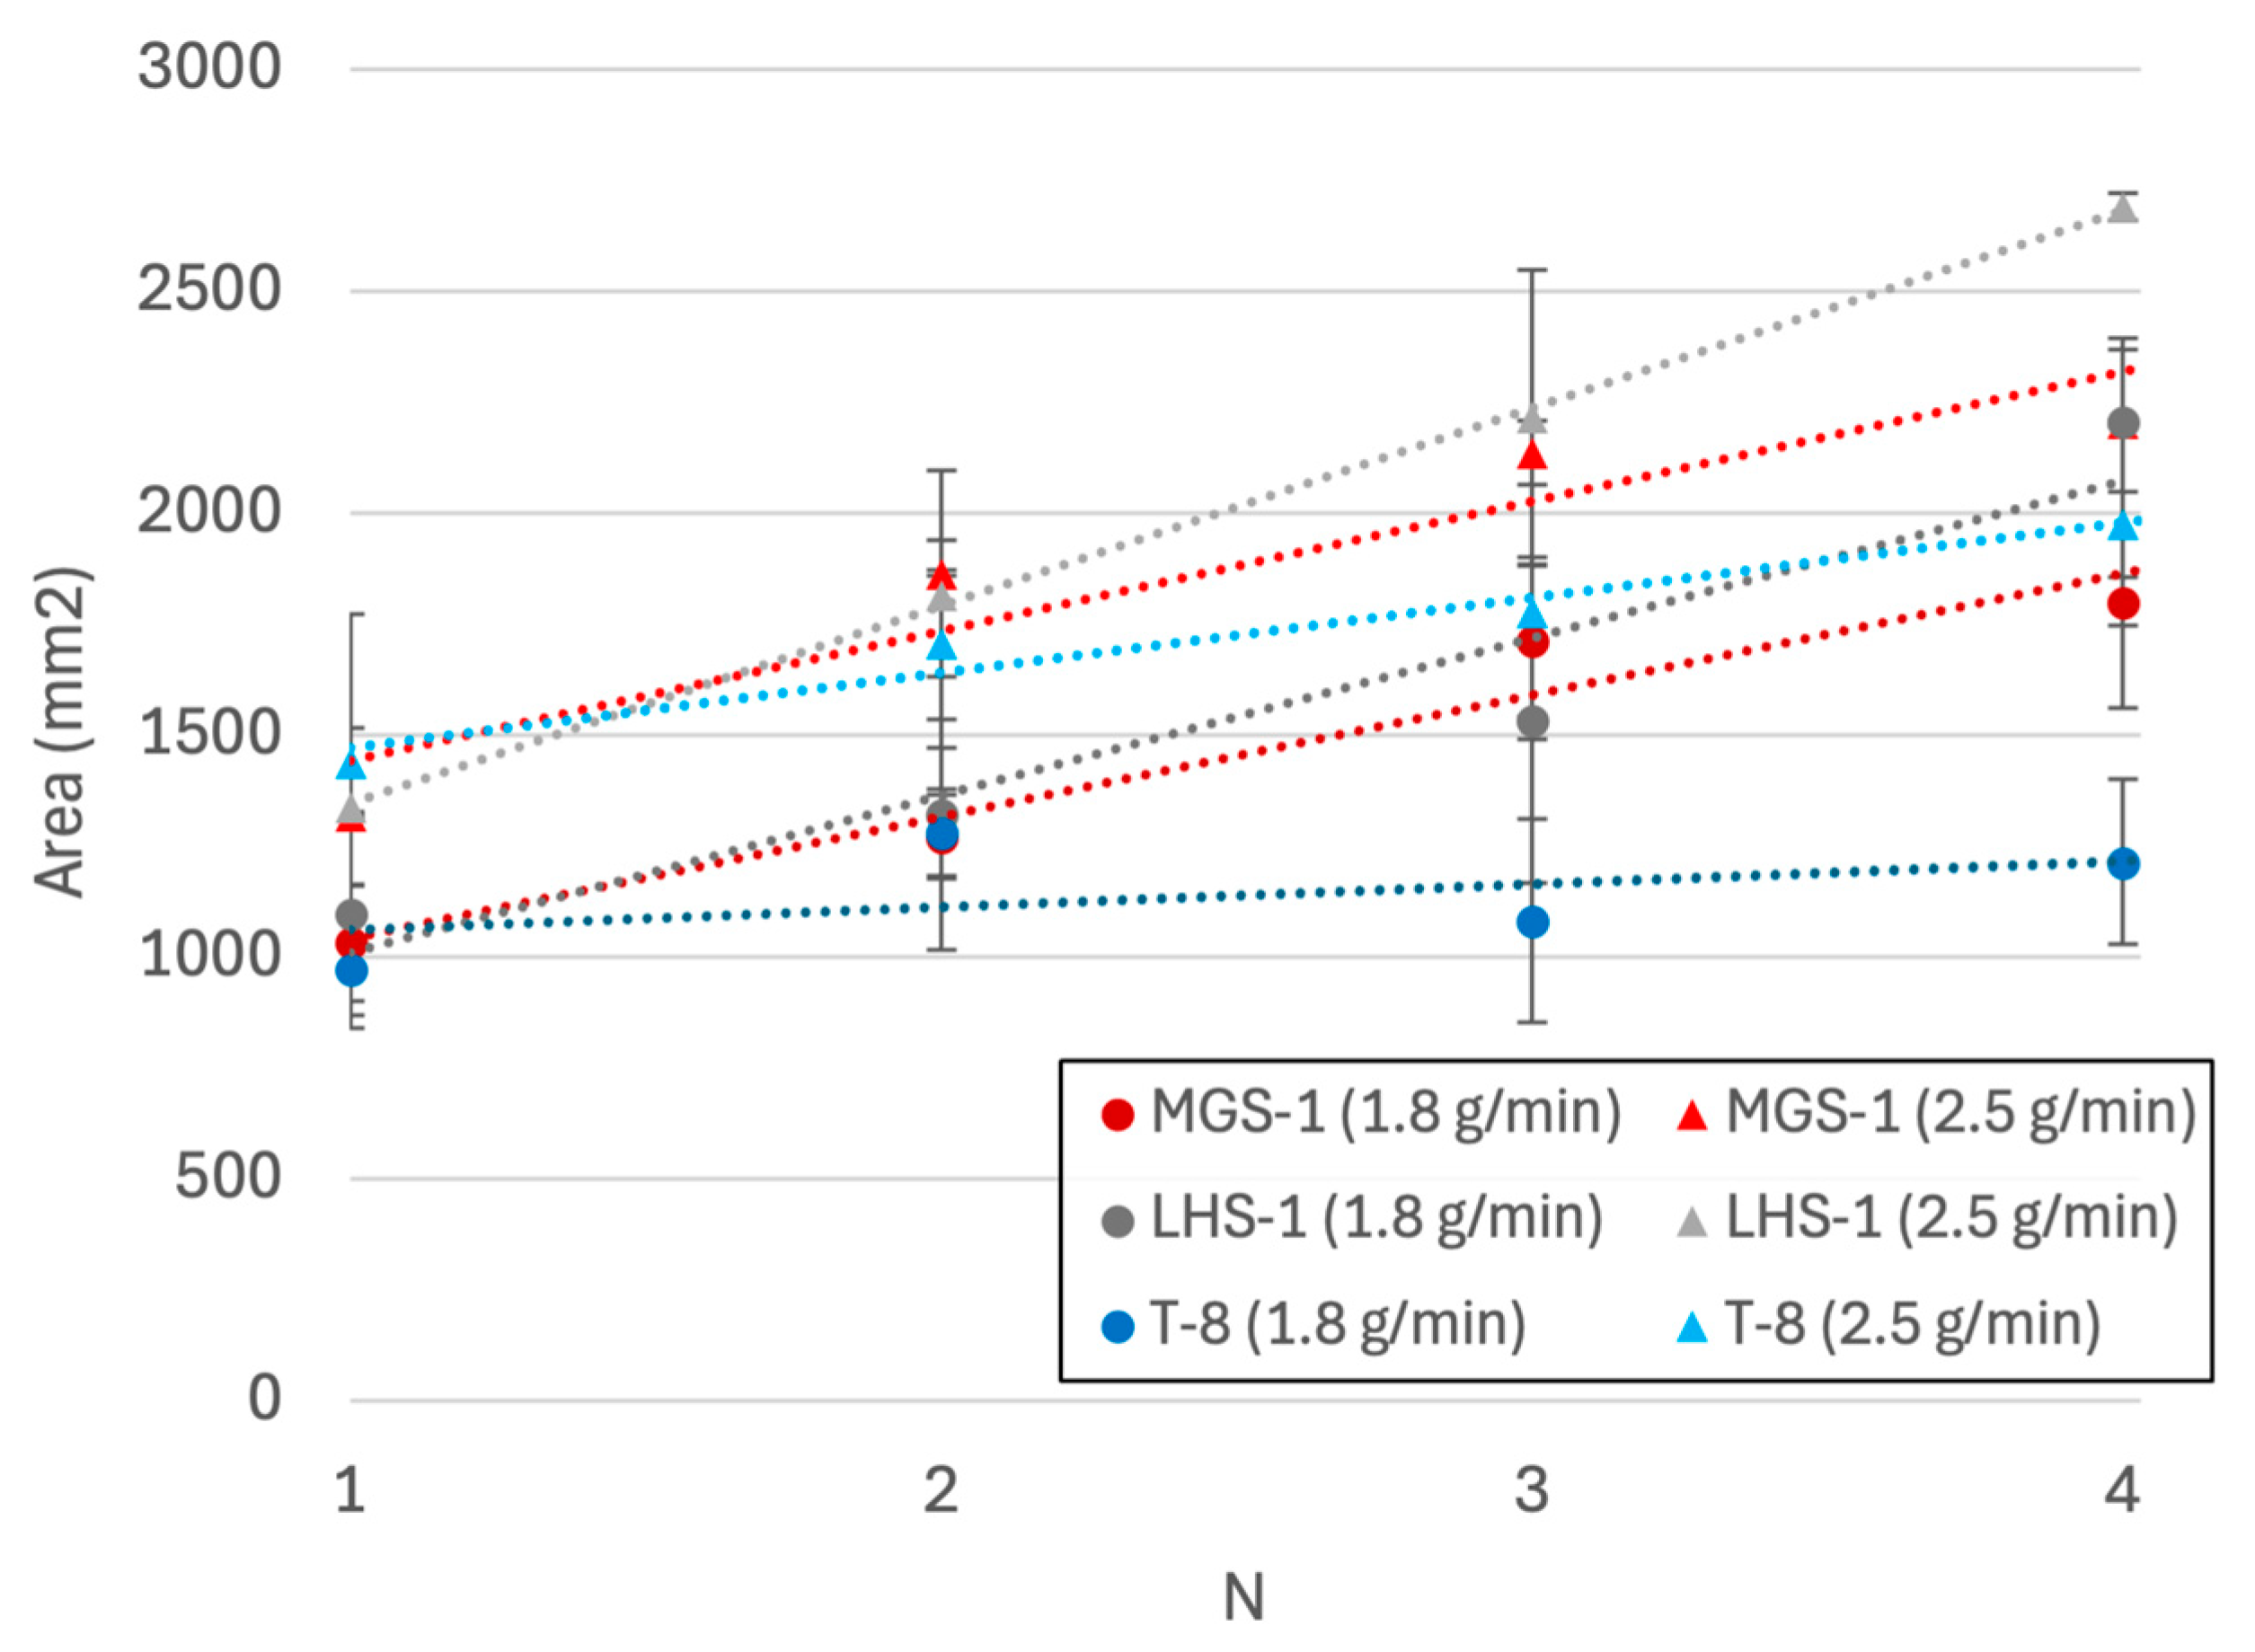
3.1. Flow Rates
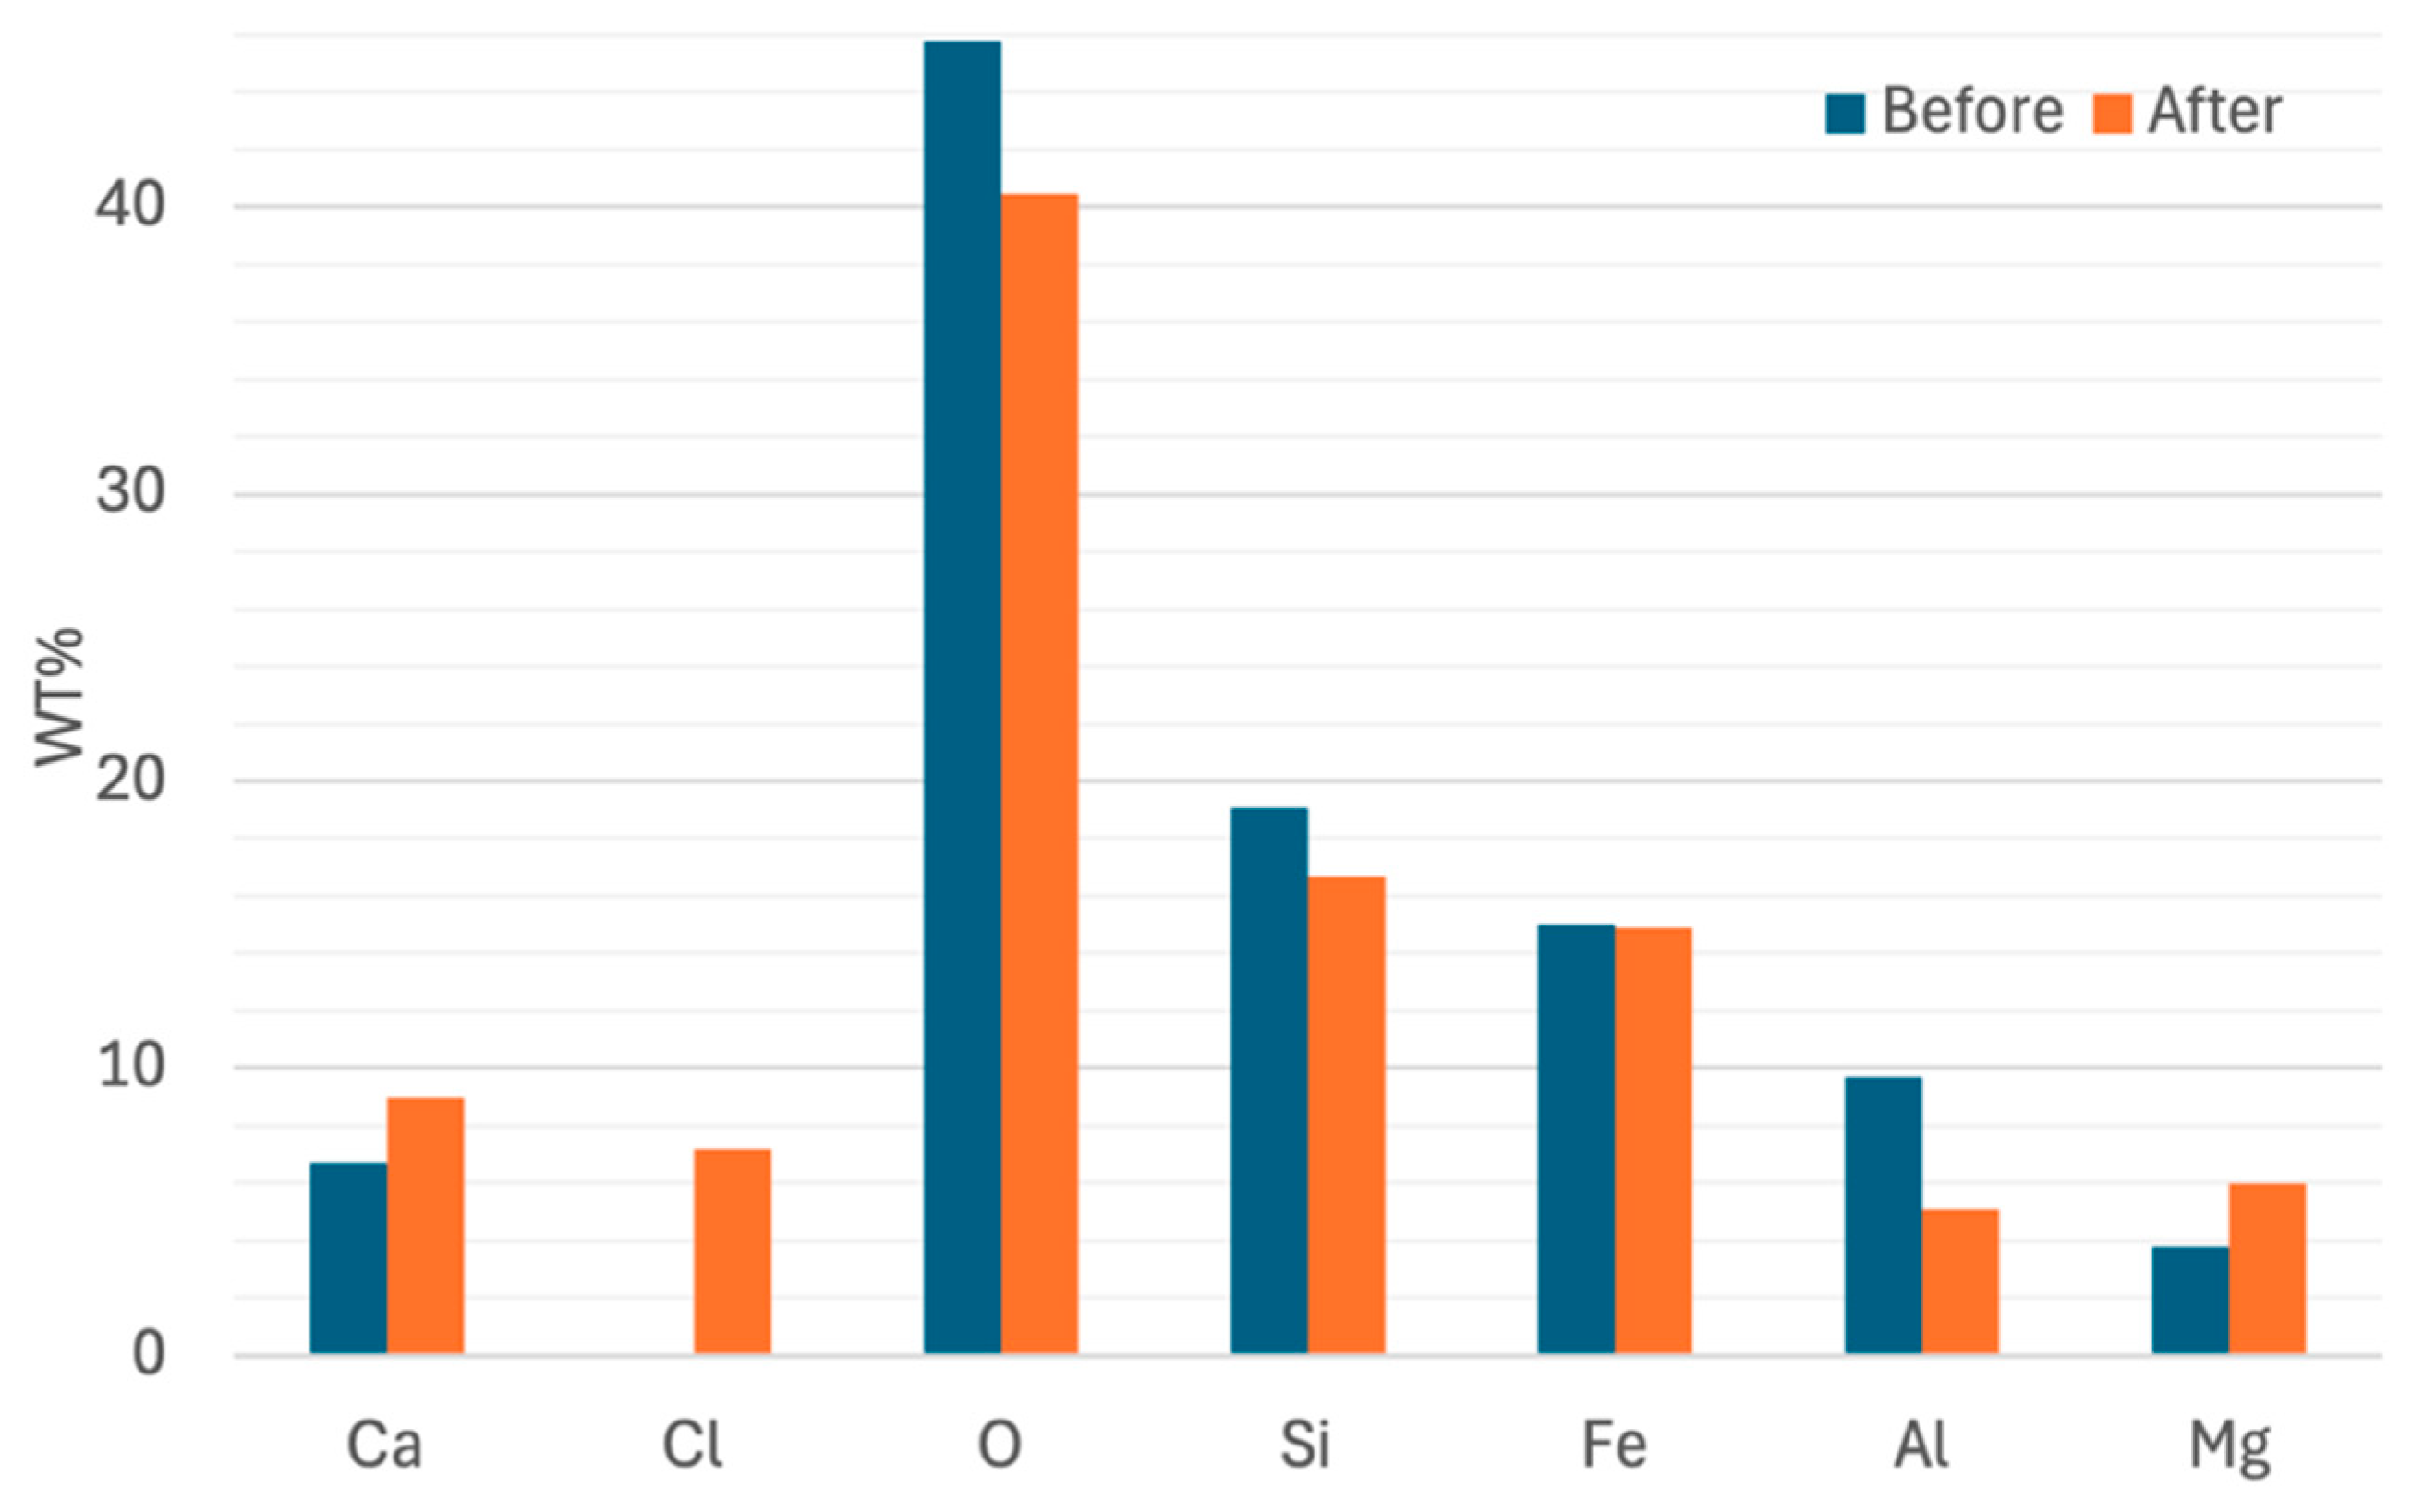
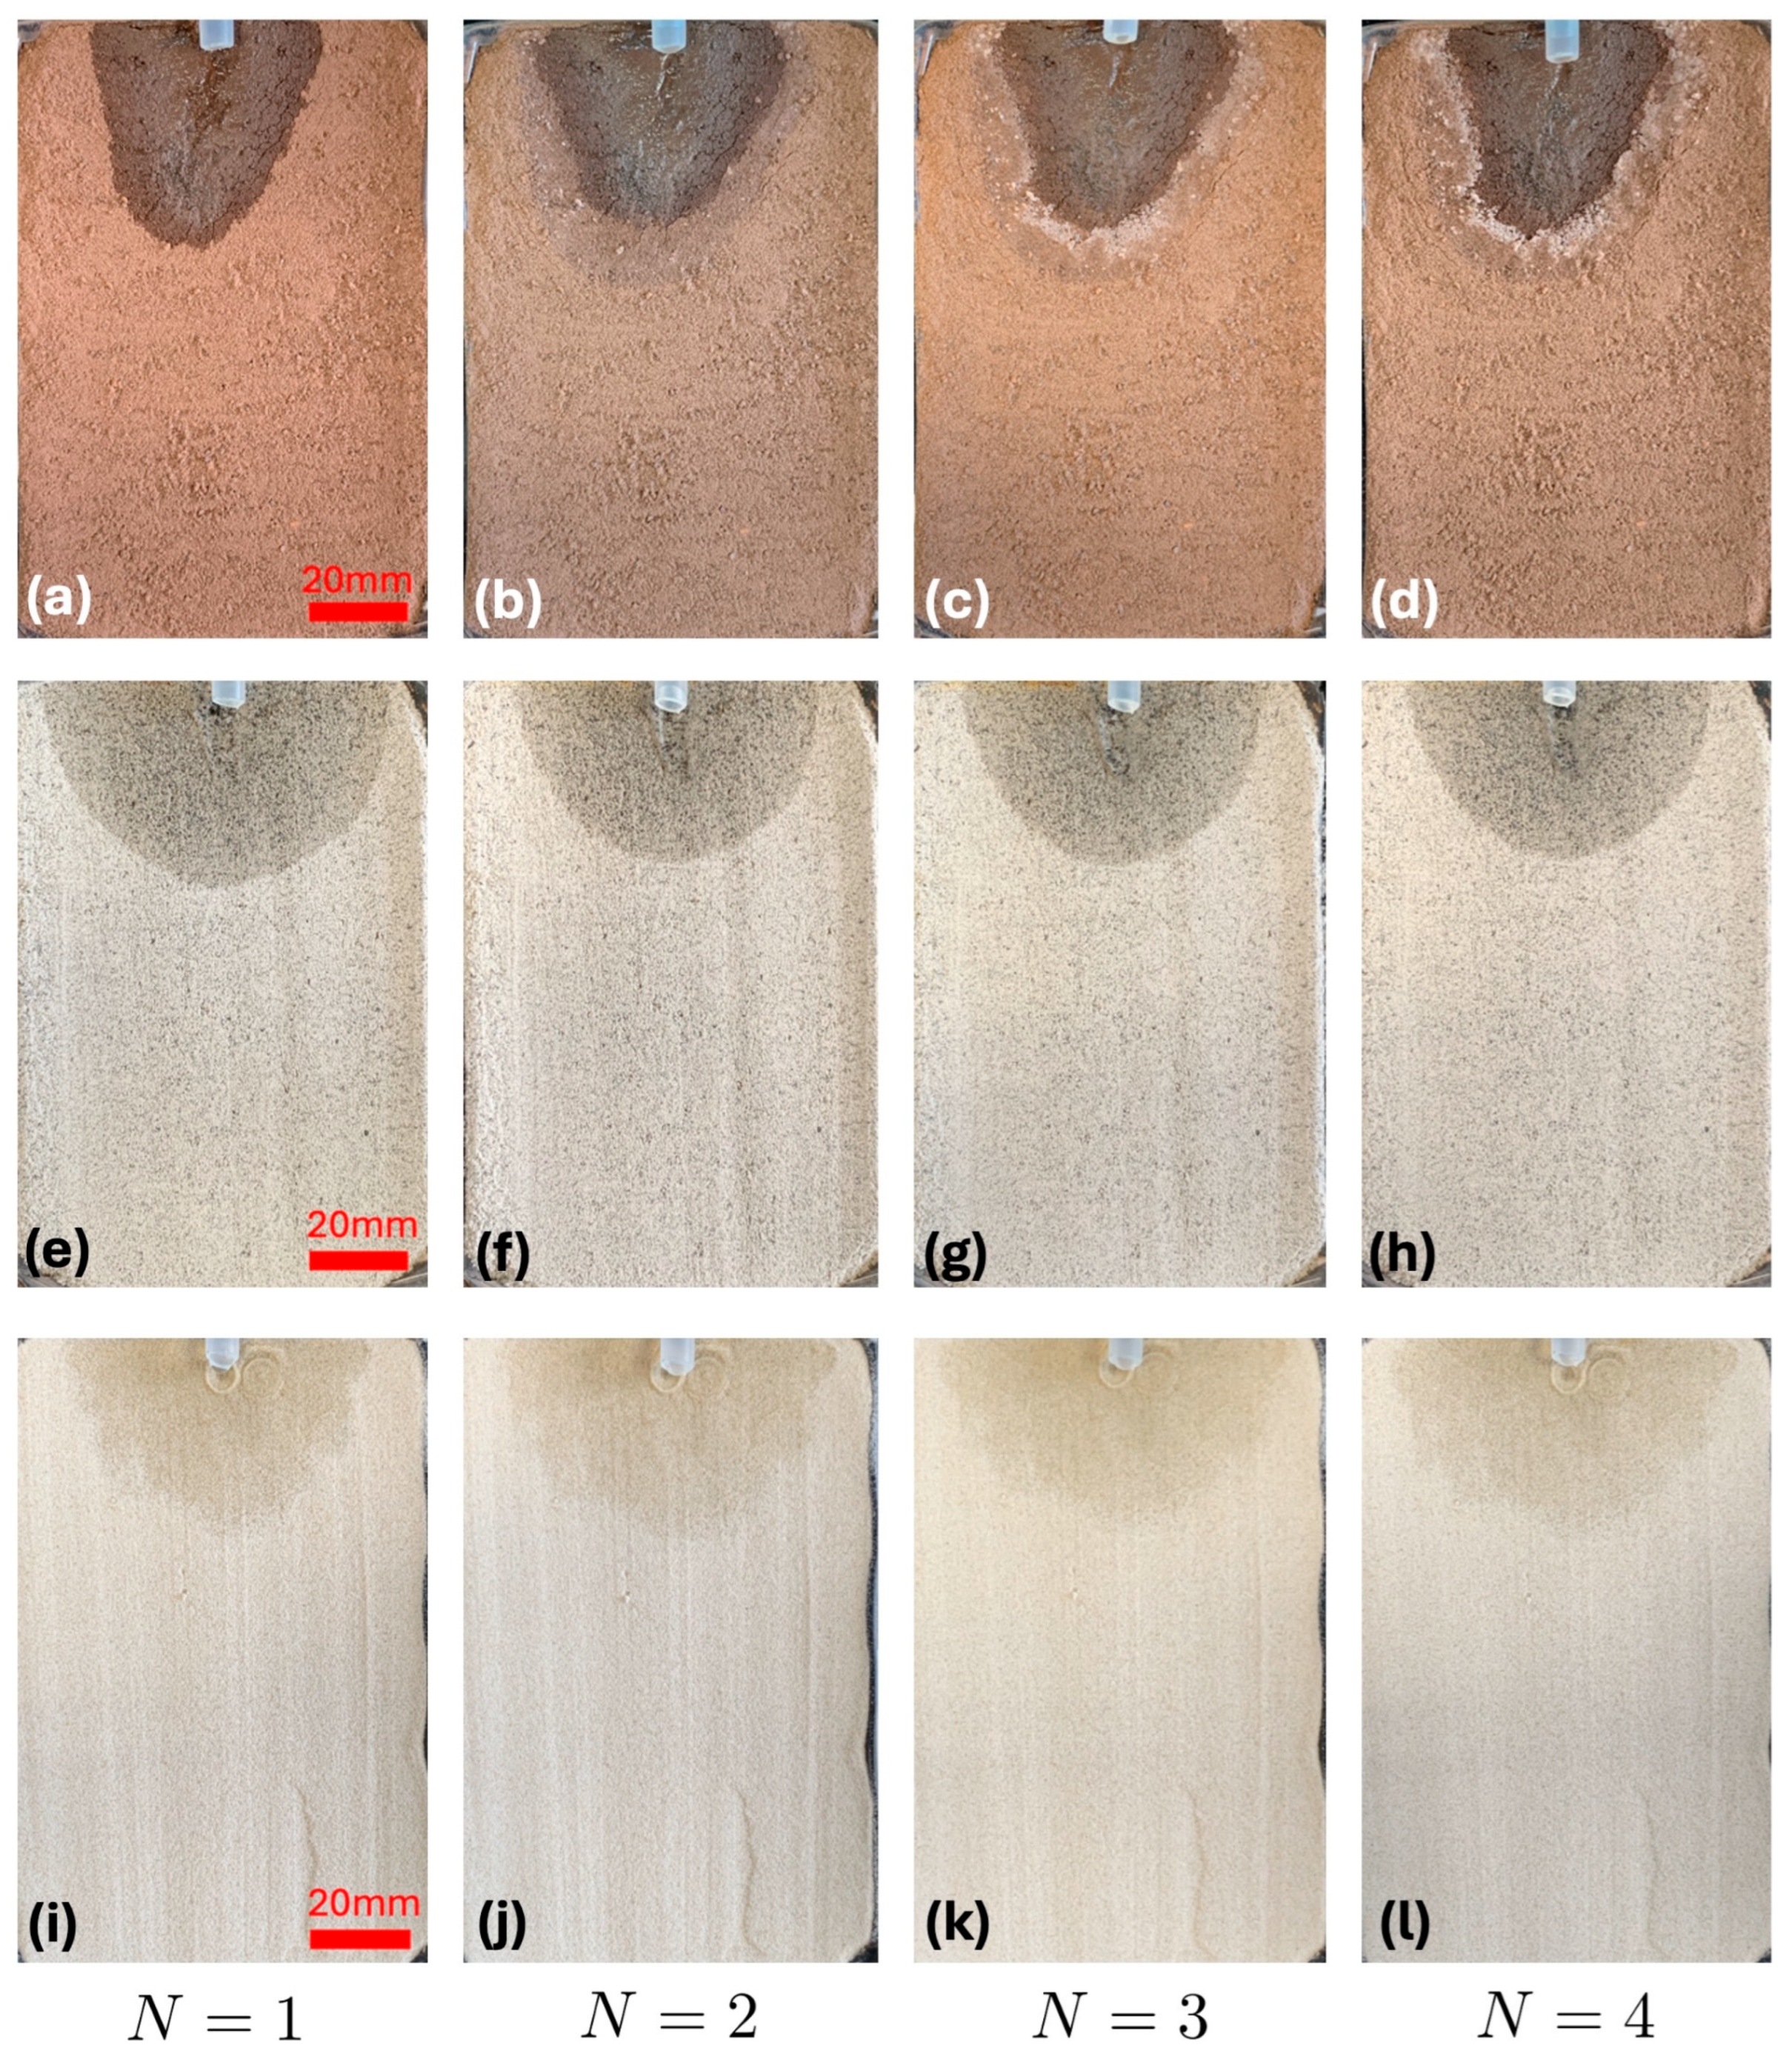
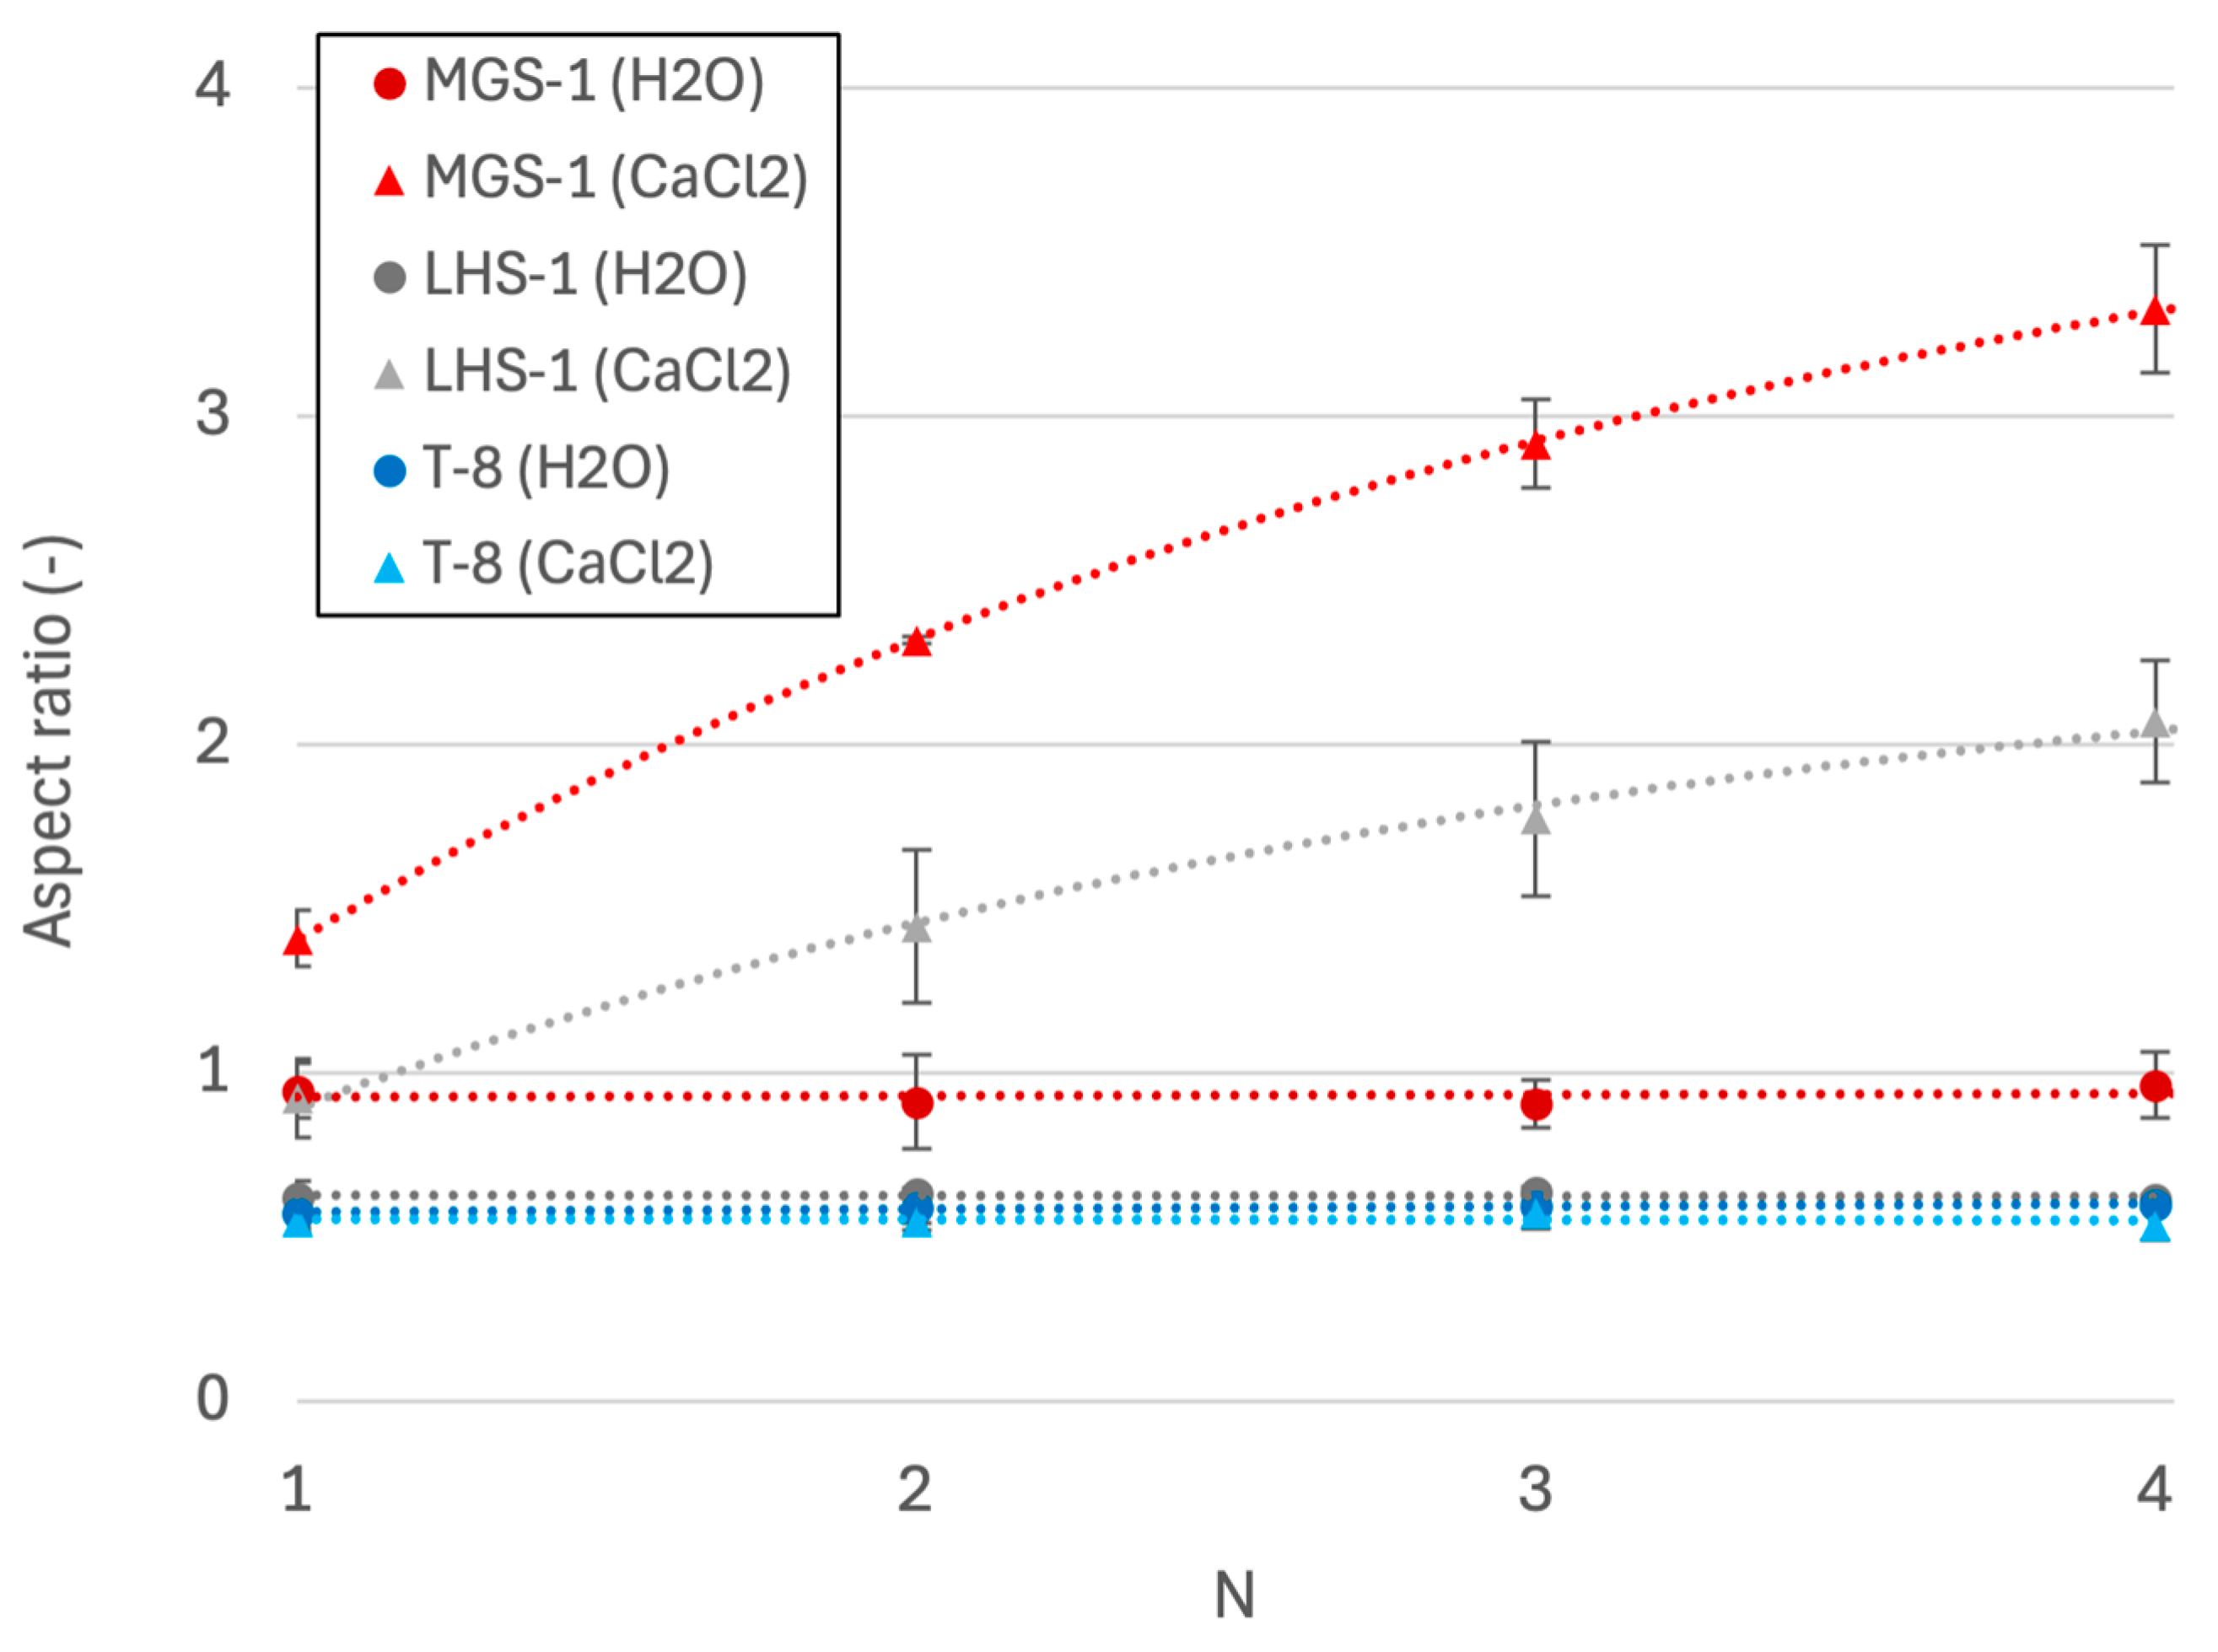
3.2. Fluids
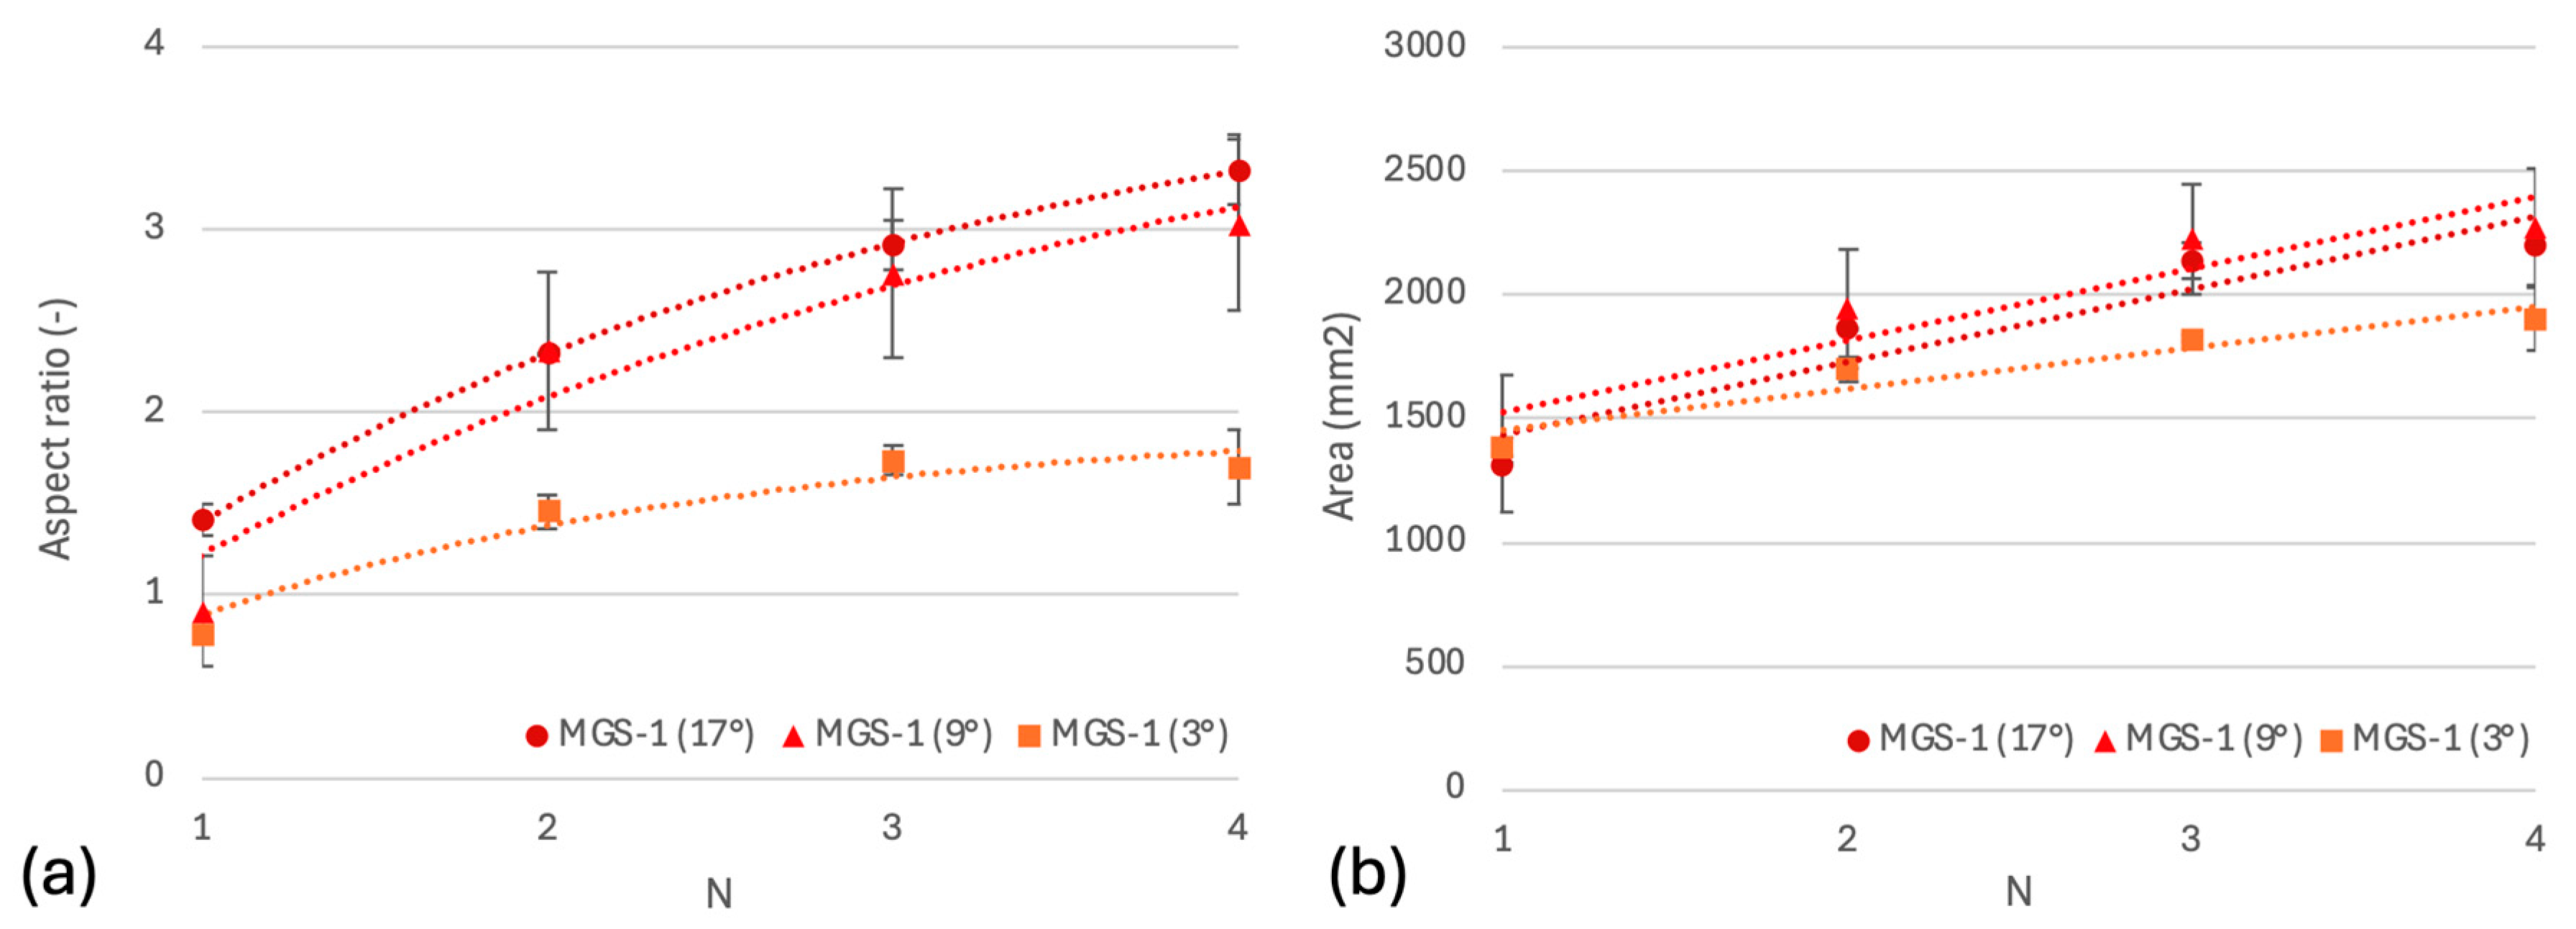
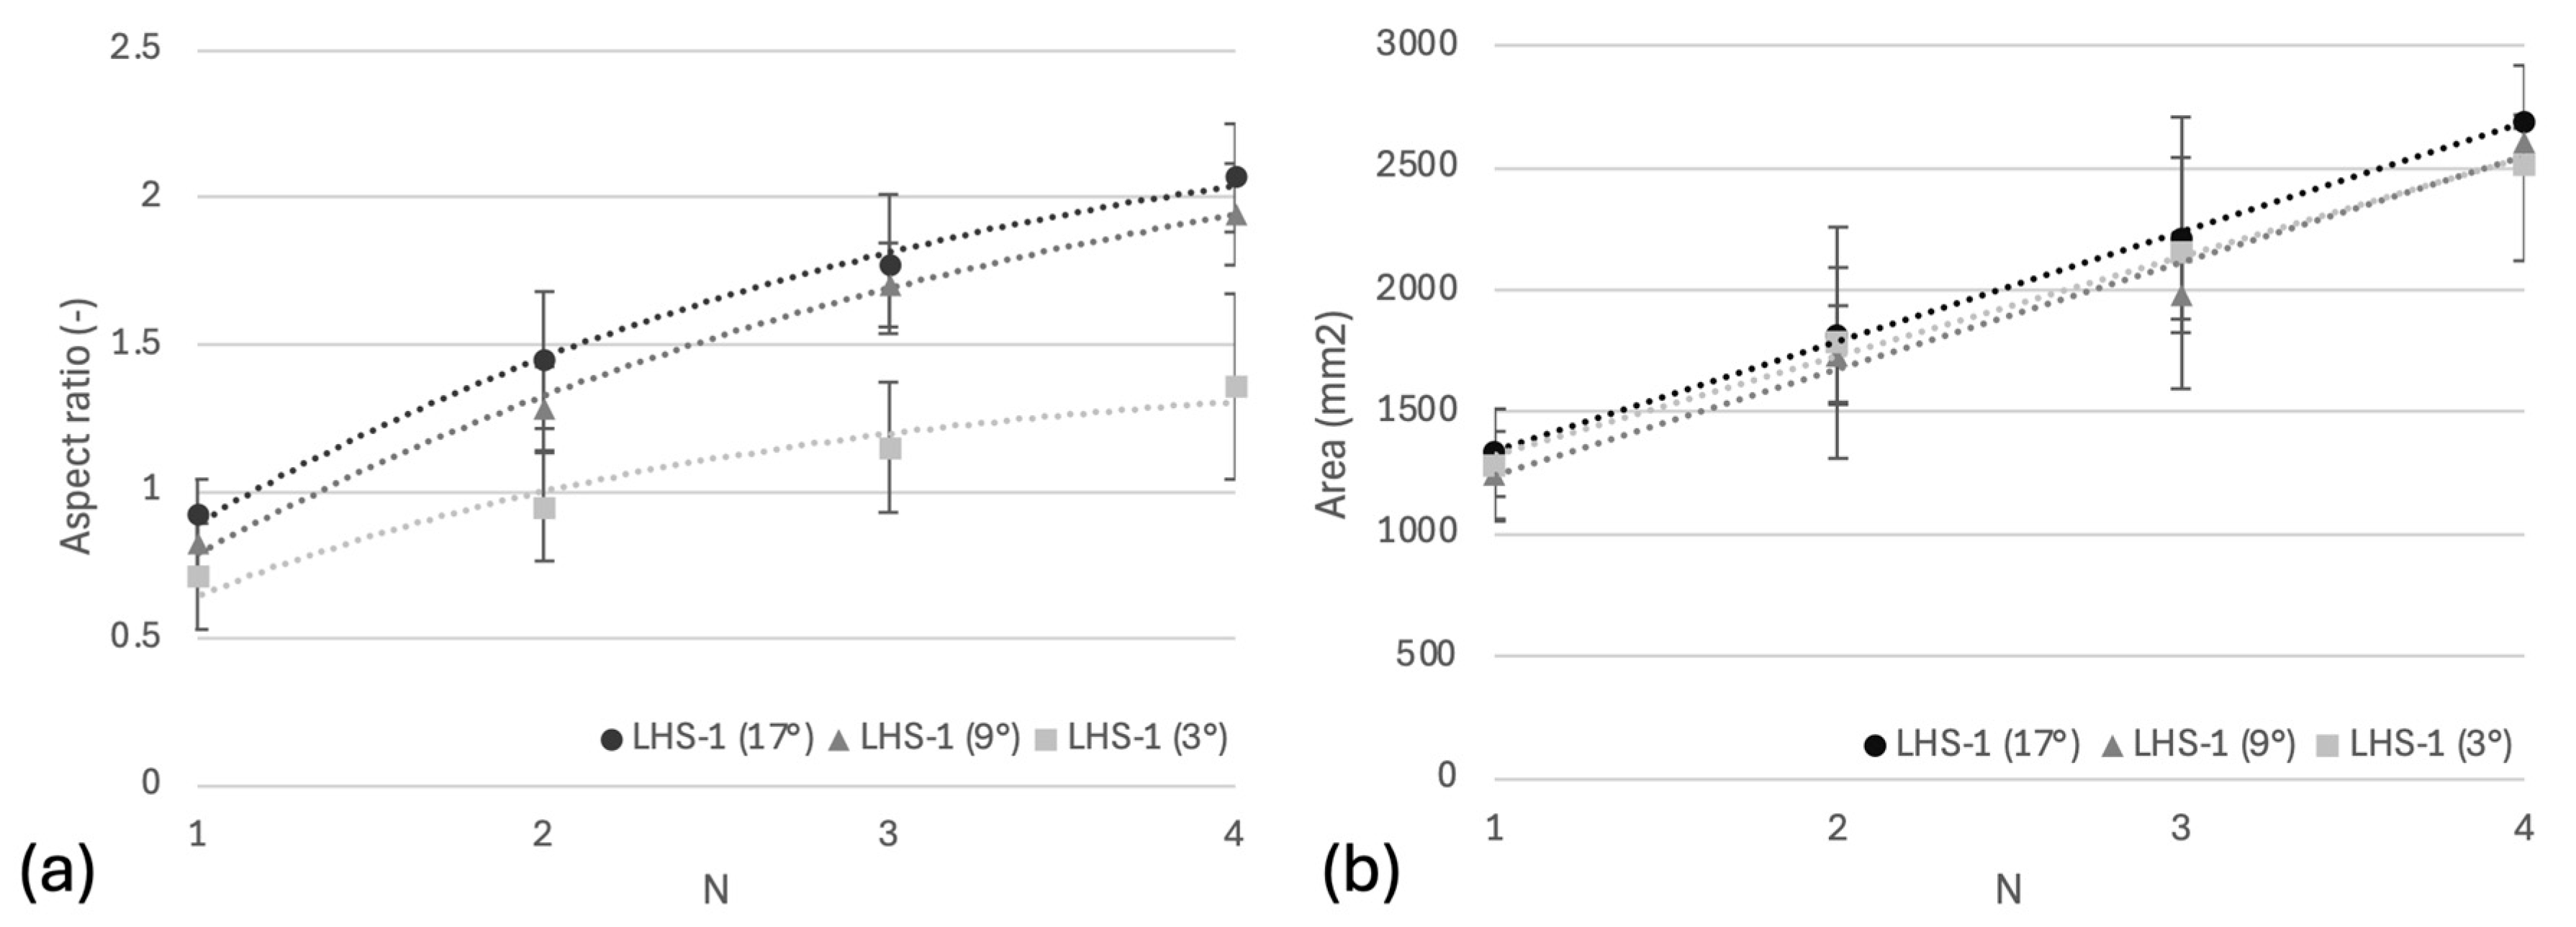
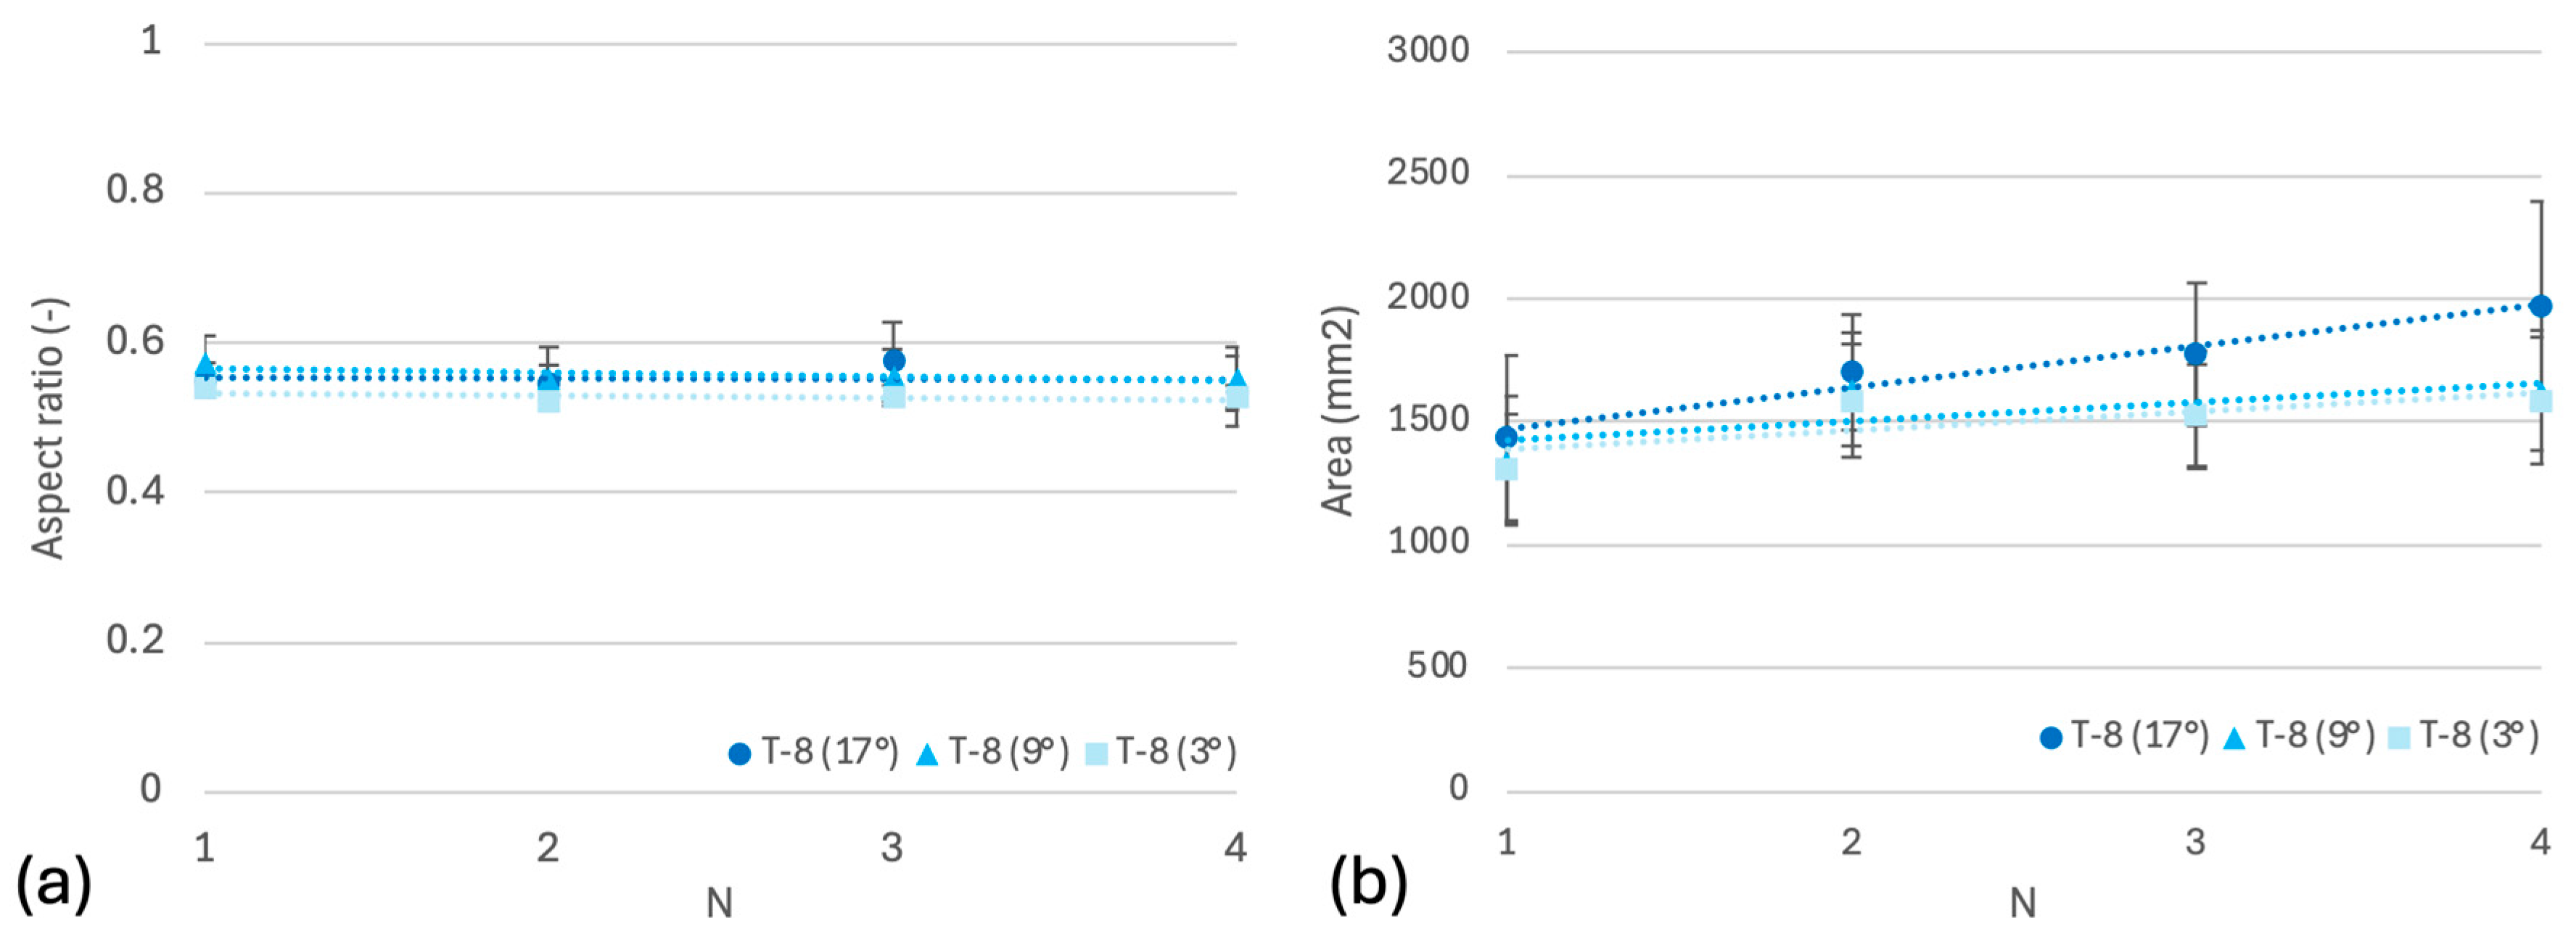
3.3. Inclinations
4. Discussion
4.1. Effect of Materials
4.1.1. Permeability of Studied Granular Materials
4.1.2. Beavers–Joseph (BJ) Boundary Condition
4.1.3. Type of Fluids
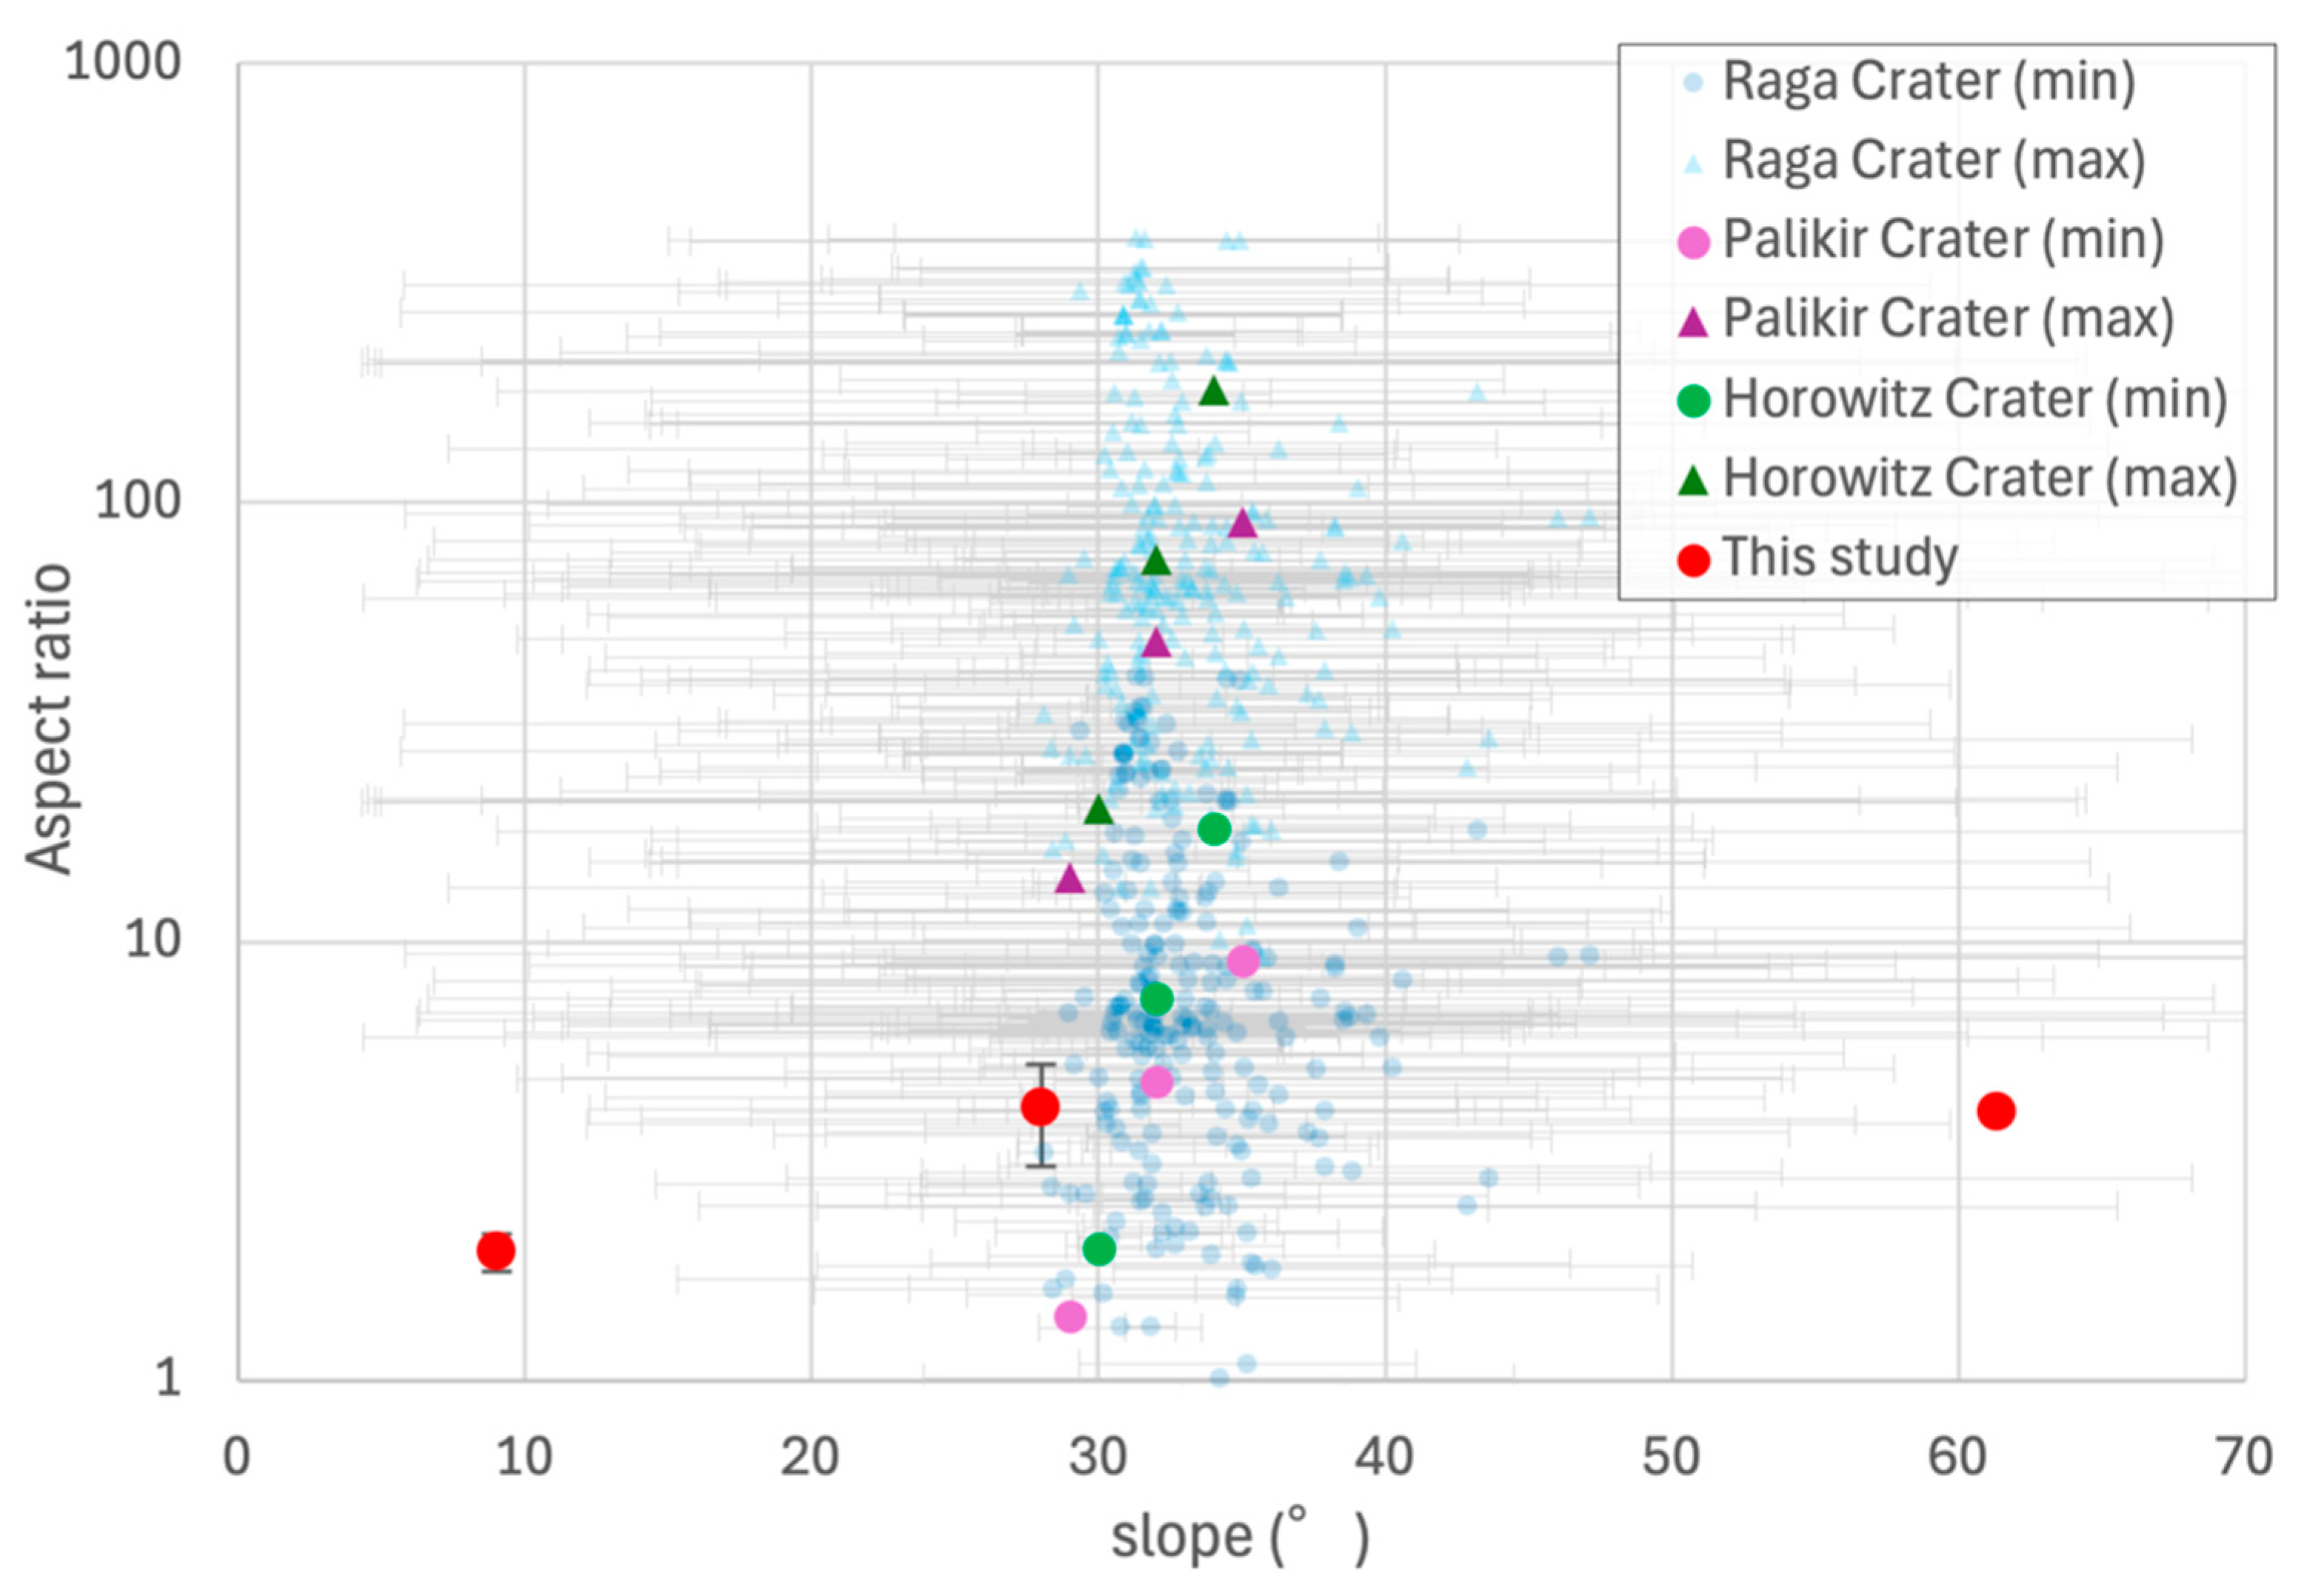
4.2. Implications for Actual RSL on the Martian Surface
5. Conclusions
- Although ARs of the fluid trace of pure water (H2O) were lower than 1.0, those of the high-salinity fluid trace reached greater than 4.0, indicating that pure water is incapable of forming RSL-like features.
- ARs of high-salinity fluid (CaCl2(aq)) trace on Martian regolith simulants are among the largest in the studied granular materials, including other regolith simulants and terrestrial fine sands.
- ARs of high-salinity fluid (CaCl2(aq)) trace well agree with the observations of actual RSL identified in Raga, Palikir, and Horowitz craters on Martian slopes.
- Martian regolith simulant represents the lowest permeability and Beavers–Joseph coefficient among the studied granular materials, highlighting the distinctive microstructure surfaces and interfacial location of Martian regolith. This encourages surface flow on the Martian regolith surface rather than Darcy flow within the regolith column, leading to a narrow and long-distance feature with high ARs of RSL identified on the Martian surface.
Supplementary Materials
Author Contributions
Funding
Data Availability Statement
Conflicts of Interest
References
- Mangold, N.; Kite, E.S.; Kleinhans, M.G.; Newsom, H.; Ansan, V.; Hauber, E.; Kraal, E.; Quantin, C.; Tanaka, K. The origin and timing of fluvial activity at Eberswalde crater, Mars. Icarus 2012, 220, 530–551. [Google Scholar] [CrossRef]
- de Quay, G.S.; Kite, E.S.; Mayer, D.P. Prolonged Fluvial Activity From Channel-Fan Systems on Mars. J. Geophys. Res. Planets 2019, 124, 3119–3139. [Google Scholar] [CrossRef]
- Galofre, A.G.; Bahia, R.S.; Jellinek, A.M.; Whipple, K.X.; Gallo, R. Did Martian valley networks substantially modify the landscape? Earth Planet. Sci. Lett. 2020, 547, 116482. [Google Scholar] [CrossRef]
- Mangold, N.; Gupta, S.; Gasnault, O.; Dromart, G.; Tarnas, J.D.; Sholes, S.F.; Horgan, B.; Quantin-Nataf, C.; Brown, A.J.; Le Mouélic, S.; et al. Perseverance rover reveals an ancient delta-lake system and flood deposits at Jezero crater, Mars. Science 2021, 374, 711–717. [Google Scholar] [CrossRef]
- Bibring, J.-P.; Langevin, Y.; Poulet, F.; Gendrin, A.; Gondet, B.; Berthé, M.; Soufflot, A.; Drossart, P.; Combes, M.; Bellucci, G.; et al. Perennial water ice identified in the south polar cap of Mars. Nature 2004, 428, 627–630. [Google Scholar] [CrossRef]
- Plaut, J.J.; Picardi, G.; Safaeinili, A.; Ivanov, A.B.; Milkovich, S.M.; Cicchetti, A.; Kofman, W.; Mouginot, J.; Farrell, W.M.; Phillips, R.J.; et al. Subsurface Radar Sounding of the South Polar Layered Deposits of Mars. Science 2007, 316, 92–95. [Google Scholar] [CrossRef]
- Orosei, R.; Lauro, S.E.; Pettinelli, E.; Cicchetti, A.; Coradini, M.; Cosciotti, B.; Di Paolo, F.; Flamini, E.; Mattei, E.; Pajola, M.; et al. Radar evidence of subglacial liquid water on Mars. Science 2018, 361, 490–493. [Google Scholar] [CrossRef]
- Kunimasu, T.; Sawayama, K.; Tsuji, T. Estimation of the mass fraction and distribution of ice in a lunar regolith simulant from seismic velocity. Icarus 2023, 406, 115725. [Google Scholar] [CrossRef]
- Ojha, L.; Wilhelm, M.B.; Murchie, S.L.; McEwen, A.S.; Wray, J.J.; Hanley, J.; Massé, M.; Chojnacki, M. Spectral evidence for hydrated salts in recurring slope lineae on Mars. Nat. Geosci. 2015, 8, 829–832. [Google Scholar] [CrossRef]
- Carter, J.; Riu, L.; Poulet, F.; Bibring, J.-P.; Langevin, Y.; Gondet, B. A Mars orbital catalog of aqueous alteration signatures (MOCAAS). Icarus 2023, 389, 115164. [Google Scholar] [CrossRef]
- Brass, G.W. Stability of brines on Mars. Icarus 1980, 42, 20–28. [Google Scholar] [CrossRef]
- Sears, D.W.G.; Chittenden, J.D. On laboratory simulation and the temperature dependence of the evaporation rate of brine on Mars. Geophys. Res. Lett. 2005, 32, L23203. [Google Scholar] [CrossRef]
- McEwen, S.; Ojha, L.; Dundas, C.M.; Mattson, S.S.; Byrne, S.; Wray, J.J.; Cull, S.C.; Murchie, S.L.; Thomas, N.; Gulick, V.C. Seasonal Flows on Warm Martian Slopes. Science 2011, 333, 740–743. [Google Scholar] [CrossRef]
- Martín-Torres, F.J.; Zorzano, M.-P.; Valentín-Serrano, P.; Harri, A.-M.; Genzer, M.; Kemppinen, O.; Rivera-Valentin, E.G.; Jun, I.; Wray, J.; Madsen, M.B.; et al. Transient liquid water and water activity at Gale crater on Mars. Nat. Geosci. 2015, 8, 357. [Google Scholar] [CrossRef]
- Zorzano, M.-P.; Mateo-Martí, E.; Prieto-Ballesteros, O.; Osuna, S.; Renno, N. Stability of liquid saline water on present day Mars. Geophys. Res. Lett. 2009, 36, L20201. [Google Scholar] [CrossRef]
- Gough, R.V.; Primm, K.M.; Rivera-Valentín, E.G.; Martínez, G.M.; Tolbert, M.A. Solid-solid hydration and dehydration of Mars-relevant chlorine salts: Implications for Gale Crater and RSL locations. Icarus 2019, 321, 1–13. [Google Scholar] [CrossRef]
- Nair, C.P.R.; Unnikrishnan, V. Stability of the Liquid Water Phase on Mars: A Thermodynamic Analysis Considering Martian Atmospheric Conditions and Perchlorate Brine Solutions. ACS Omega 2020, 5, 9391–9397. [Google Scholar] [CrossRef]
- Martín-Torres, J.; Zorzano, M.-P.; Soria-Salinas, Á.; Nazarious, M.I.; Konatham, S.; Mathanlal, T.; Ramachandran, A.V.; Ramírez-Luque, J.-A.; Mantas-Nakhai, R. The HABIT (HabitAbility: Brine Irradiation and Temperature) environmental instrument for the ExoMars 2022 Surface Platform. Planet. Space Sci. 2020, 190, 104968. [Google Scholar] [CrossRef]
- Simon, J.I.; Hickman-Lewis, K.; Cohen, B.A.; Mayhew, L.E.; Shuster, D.L.; Debaille, V.; Hausrath, E.M.; Weiss, B.P.; Bosak, T.; Zorzano, M.-P.; et al. Samples Collected From the Floor of Jezero Crater With the Mars 2020 Perseverance Rover. J. Geophys. Res. Planets 2023, 128, e2022JE007474. [Google Scholar] [CrossRef]
- Tebolt, M.; Levy, J.; Goudge, T.; Schorghofer, N. Slope, elevation, and thermal inertia trends of martian recurring slope lineae initiation and termination points: Multiple possible processes occurring on coarse, sandy slopes. Icarus 2020, 338, 113536. [Google Scholar] [CrossRef]
- Stillman, D.E.; Michaels, T.I.; Grimm, R.E. Characteristics of the numerous and widespread recurring slope lineae (RSL) in Valles Marineris, Mars. Icarus 2017, 285, 195–210. [Google Scholar] [CrossRef]
- Dundas, A.M.; McEwen, A.S.; Chojnacki, M.; Milazzo, M.P.; Byrne, S.; McElwaine, J.N.; Urso, A. Granular flows at recurring slope lineae on Mars indicate a limited role for liquid water. Nat. Geosci. 2017, 10, 903–907. [Google Scholar] [CrossRef]
- Vincendon, M.; Pilorget, C.; Carter, J.; Stcherbinine, A. Observational evidence for a dry dust-wind origin of Mars seasonal dark flows. Icarus 2019, 325, 115–127. [Google Scholar] [CrossRef]
- Stillman, D.E.; Bue, B.D.; Wagstaff, K.L.; Primm, K.M.; Michaels, T.I.; Grimm, R.E. Evaluation of wet and dry recurring slope lineae (RSL) formation mechanisms based on quantitative mapping of RSL in Garni Crater, Valles Marineris, Mars. Icarus 2020, 335, 113420. [Google Scholar] [CrossRef]
- Levy, J. Hydrological characteristics of recurrent slope lineae on Mars: Evidence for liquid flow through regolith and comparisons with Antarctic terrestrial analogs. Icarus 2012, 219, 1–4. [Google Scholar] [CrossRef]
- Strohbeck, P.; Eggenweiler, E.; Rybak, I. A Modification of the Beavers–Joseph Condition for Arbitrary Flows to the Fluid–porous Interface. Transp. Porous Media 2023, 147, 605–628. [Google Scholar] [CrossRef]
- Kakumani, C.; Rath, S.; Terzis, A. Effect of pore-structure on the Beavers-Joseph slip coefficient for a free-flow and porous medium interface. Phys. Fluids 2024, 36, 062113. [Google Scholar]
- Del Mastro, M.; Terzis, A. An experimental investigation of boundary layer over permeable interfaces in Hele-Shaw micromodels. Phys. Fluids 2024, 36, 112110. [Google Scholar]
- Karra, S.K.; Apte, S.V. Numerical investigation of turbulent flow over a randomly packed sediment bed using a variable porosity continuum model. Phys. Fluids 2024, 36, 115177. [Google Scholar] [CrossRef]
- Burt, D.M.; Knauth, L.P. Electrically conducting, Ca-rich brines, rather than water, expected in the Martian subsurface. J. Geophys. Res. Planets 2003, 108, 8026. [Google Scholar] [CrossRef]
- Möhlmann, D.; Thomsen, K. Properties of cryobrines on Mars. Icarus 2011, 212, 123–130. [Google Scholar] [CrossRef]
- Chevrier, V.F.; Rivera-Valentin, E.G. Formation of recurring slope lineae by liquid brines on present-day Mars. Geophys. Res. Lett. 2012, 39, L21202. [Google Scholar] [CrossRef]
- Gough, R.V.; Chevrier, V.F.; Tolbert, M.A. Formation of liquid water at low temperatures via the deliquescence of calcium chloride: Implications for Antarctica and Mars. Planet. Space Sci. 2016, 131, 79–87. [Google Scholar] [CrossRef]
- Toner, J.D.; Catling, D.C. Chlorate brines on Mars: Implications for the occurrence of liquid water and deliquescence. Earth Planet. Sci. Lett. 2018, 497, 161–168. [Google Scholar] [CrossRef]
- Ojha, L.; Wray, J.J.; Murchie, S.L.; McEwen, A.S.; Wolff, M.J.; Karunatillake, S. Spectral constraints on the formation mechanism of recurring slope lineae. Geophys. Res. Lett. 2013, 40, 5621–5626. [Google Scholar] [CrossRef]
- McEwen, A.S.; Dundas, C.M.; Mattson, S.S.; Toigo, A.D.; Ojha, L.; Wray, J.J.; Chojnacki, M.; Byrne, S.; Murchie, S.L.; Thomas, N. Recurring slope lineae in equatorial regions of Mars. Nat. Geosci. 2014, 7, 53–58. [Google Scholar] [CrossRef]
- Marion, G.M.; Kargel, J.S.; Catling, D.C. Modeling ferrous–ferric iron chemistry with application to martian surface geochemistry. Geochim. Cosmochim. Acta 2008, 72, 242–266. [Google Scholar] [CrossRef]
- Cannon, K.M.; Britt, D.T.; Smith, T.M.; Fritsche, R.F.; Batcheldor, D. Mars global simulant MGS-1: A Rocknest-based open standard for basaltic martian regolith simulants. Icarus 2019, 317, 470–478. [Google Scholar] [CrossRef]
- Long-Fox, J.M.; Landsman, Z.A.; Easter, P.B.; Millwater, C.A.; Britt, D.T. Geomechanical properties of lunar regolith simulants LHS-1 and LMS-1. Adv. Space Res. 2023, 71, 5400–5412. [Google Scholar] [CrossRef]
- Dotson, B.; Valencia, D.S.; Millwater, C.; Easter, P.; Long-Fox, J.; Britt, D.; Metzger, P. Cohesion and shear strength of compacted lunar and Martian regolith simulants. Icarus 2024, 411, 115943. [Google Scholar] [CrossRef]
- Ozaki, S.; Ishigami, G.; Otsuki, M.; Miyamoto, H.; Wada, K.; Watanabe, Y.; Nishino, T.; Kojima, H.; Soda, K.; Nakao, Y.; et al. Granular flow experiment using artificial gravity generator at International Space Station. npj Microgravity 2023, 9, 61. [Google Scholar] [CrossRef] [PubMed]
- Tabuchi, Y.; Kioka, A.; Yamada, Y. Water permeability of sunlit lunar highlands regolith using LHS-1 simulant. Acta Astronaut. 2023, 213, 344–354. [Google Scholar] [CrossRef]
- Carrier, W.D.; Olhoeft, G.R.; Mendell, W. Physical properties of the lunar surface. In Lunar Source Book: A User’s Guide to the Moon; Heiken, G.H., Vaniman, D.T., French, B.M., Eds.; Cambridge University Press: New York, NY, USA, 1991; pp. 530–552. [Google Scholar]
- Hayne, P.O.; Bandfield, J.L.; Siegler, M.A.; Vasavada, A.R.; Ghent, R.R.; Williams, J.-P.; Greenhagen, B.T.; Aharonson, O.; Elder, C.M.; Lucey, P.G.; et al. Global Regolith Thermophysical Properties of the Moon From the Diviner Lunar Radiometer Experiment. J. Geophys. Res. Planets 2017, 122, 2371–2400. [Google Scholar] [CrossRef]
- Fa, W. Bulk Density of the Lunar Regolith at the Chang’E-3 Landing Site as Estimated From Lunar Penetrating Radar. Earth Space Sci. 2020, 7, e2019EA000801. [Google Scholar] [CrossRef]
- Imamura, S.; Sekine, Y.; Maekawa, Y.; Kurokawa, H.; Sasaki, T. Effective formation of surface flow due to salt precipitation within soils upon repeated brine seepages on Mars. Icarus 2023, 396, 115500. [Google Scholar] [CrossRef]
- Zhou, M.; Fan, S.; Shi, R.; Yang, Y.; Li, J. Effect of gravity on the mechanical properties of lunar regolith tested using a low gravity simulation device. J. Terramech. 2015, 60, 11–22. [Google Scholar] [CrossRef]
- Schneider, C.A.; Rasband, W.S.; Eliceiri, K.W. NIH Image to ImageJ: 25 years of image analysis. Nat. Methods 2012, 9, 671–675. [Google Scholar] [CrossRef]
- Schindelin, J.; Arganda-Carreras, I.; Frise, E.; Kaynig, V.; Longair, M.; Pietzsch, T.; Preibisch, S.; Rueden, C.; Saalfeld, S.; Schmid, B.; et al. Fiji: An open-source platform for biological-image analysis. Nat. Methods 2012, 9, 676–682. [Google Scholar] [CrossRef]
- Ishii, T.; Kioka, A.; Huang, J.-J.S.; Tabuchi, Y.; Yamada, Y. Low-velocity impact response of lunar and Martian regolith simulants: Implications for lunar and Martian surface explorations. Phys. Fluids 2024, 36, 113318. [Google Scholar] [CrossRef]
- Ishii, T.; Kioka, A.; Huang, J.-J.S.; Tsuji, T.; Yamada, Y. Distinctive impact responses of extraterrestrial regolith simulants: Insights from crater morphology classification and granular dynamics through machine learning and x-ray computed tomography. Phys. Fluids 2025, 37, 023358. [Google Scholar] [CrossRef]
- Costa, A. Permeability-Porosity Relationship: A Reexamination of the Kozeny-Carman Equation Based on a Fractal Pore-Space Geometry Assumption. Geophys. Res. Lett. 2006, 33, L02318. [Google Scholar] [CrossRef]
- Chang, M.-H.; Chen, F.; Straughan, B. Instability of Poiseuille flow in a fluid overlying a porous layer. J. Fluid Mech. 2006, 564, 287–303. [Google Scholar] [CrossRef]
- Beavers, G.S.; Joseph, D.D. Boundary conditions at a naturally permeable wall. J. Fluid Mech. 1967, 30, 197–207. [Google Scholar] [CrossRef]
- Saffman, P.G. On the Boundary Condition at the Surface of a Porous Medium. Stud. Appl. Math. 1971, 50, 93–101. [Google Scholar] [CrossRef]
- Sahraoui, M.; Kaviany, M. Slip and no-slip velocity boundary conditions at interface of porous, plain media. Int. J. Heat Mass Transf. 1992, 35, 927–943. [Google Scholar] [CrossRef]
- Wahab, A.; Mahiuddin, S. Isentropic Compressibility and Viscosity of Aqueous and Methanolic Calcium Chloride Solutions. J. Chem. Eng. Data 2001, 46, 1457–1463. [Google Scholar] [CrossRef]
- Mason, D.P.; Scuderi, L.A. Interweaving recurring slope lineae on Mars: Do they support a wet hypothesis? Icarus 2024, 419, 115980. [Google Scholar] [CrossRef]

| Granular Material | Mean Grain Density (g/cm3) | Mean Diameter (μm) |
|---|---|---|
| MGS-1 | 3.23 a | 90 a |
| LHS-1 | 3.19 b | 90 b |
| T-8 | 2.78 c | 120 d |
| 1 | 0.464 | 0.448 | 0.966 |
| 2 | 0.433 | 0.415 | 0.958 |
| 3 | 0.422 | 0.403 | 0.956 |
| 4 | 0.405 | 0.394 | 0.971 |
Disclaimer/Publisher’s Note: The statements, opinions and data contained in all publications are solely those of the individual author(s) and contributor(s) and not of MDPI and/or the editor(s). MDPI and/or the editor(s) disclaim responsibility for any injury to people or property resulting from any ideas, methods, instructions or products referred to in the content. |
© 2025 by the authors. Licensee MDPI, Basel, Switzerland. This article is an open access article distributed under the terms and conditions of the Creative Commons Attribution (CC BY) license (https://creativecommons.org/licenses/by/4.0/).
Share and Cite
Tabuchi, Y.; Kioka, A.; Tsuji, T.; Yamada, Y. High-Salinity Fluid Downslope Flow on Regolith Layer Examined by Laboratory Experiment: Implications for Recurring Slope Lineae on Martian Surfaces. Fluids 2025, 10, 183. https://doi.org/10.3390/fluids10070183
Tabuchi Y, Kioka A, Tsuji T, Yamada Y. High-Salinity Fluid Downslope Flow on Regolith Layer Examined by Laboratory Experiment: Implications for Recurring Slope Lineae on Martian Surfaces. Fluids. 2025; 10(7):183. https://doi.org/10.3390/fluids10070183
Chicago/Turabian StyleTabuchi, Yoshiki, Arata Kioka, Takeshi Tsuji, and Yasuhiro Yamada. 2025. "High-Salinity Fluid Downslope Flow on Regolith Layer Examined by Laboratory Experiment: Implications for Recurring Slope Lineae on Martian Surfaces" Fluids 10, no. 7: 183. https://doi.org/10.3390/fluids10070183
APA StyleTabuchi, Y., Kioka, A., Tsuji, T., & Yamada, Y. (2025). High-Salinity Fluid Downslope Flow on Regolith Layer Examined by Laboratory Experiment: Implications for Recurring Slope Lineae on Martian Surfaces. Fluids, 10(7), 183. https://doi.org/10.3390/fluids10070183