Abstract
This study investigates the organized flow structures and turbulence quantities in a transitional oscillatory boundary-layer flow over a smooth bed using a DNS model set up by the open-source framework Nektar++ (v5.2.0). The present model was validated against the results of a previous study involving a bypass transition mechanism in the intermittently turbulent regime. To trigger the initial perturbations, a roughness element was placed on the bed and removed at the very moment a two-dimensional vortex tube, caused by an inflectional-point shear-layer instability, was observed on it. Then, the turbulent spots where the flow experienced intense fluctuations in an otherwise laminar boundary layer were identified from the bed shear-stress distribution on the bed, which served as a reliable indicator of turbulence. These flow features emerged as the first sign of the initiation of turbulence. Several measurement points were selected to follow the bed shear-stress variations and to observe the spatial and temporal development of turbulent spots at a low-wave Reynolds number, . Along with these observations, phase-resolved turbulence quantities were also investigated over successive half-cycles for the first time in the literature to understand how turbulence develops and spreads over the flow domain. The results show that the turbulence generated in the near-bed region becomes stronger in the deceleration stage due to the adverse pressure gradient and diffuses away from the bed during the subsequent phases of the developing oscillatory boundary-layer flow. The findings related to the turbulence quantities also indicate that the turbulence gradually evolves and spreads into the fluid domain in successive half-cycles.
1. Introduction
The orbital motion of water particles under a progressive wave in shallow waters becomes a straight line parallel to the bottom, i.e., oscillatory motion, at the sea bed. A new time-dependent boundary layer develops over the sea bed for each half-cycle of this motion, the oscillatory boundary layer (Figure 1), which has been investigated in much research. Of particular interest is the boundary-layer flow transition from laminar to turbulent. Kemp and Simons [1] showed that the oscillatory flow experiences high turbulence in the decelerating stage. In their DNS study, Vittori and Verzicco [2] observed similar results, which suggest that violent fluctuations in the velocity components appear toward the end of the accelerating phases and are maintained during the decelerating phases. According to Jensen et al. [3] and Lodahl et al. [4], the boundary-layer transition from laminar to turbulent occurs as a result of the combined effect of (1) a significant increase in the adverse pressure gradient near the wall prior to flow reversal, and (2) relatively low near-bed flow velocities [5], which leads to a favorable condition for the inception of turbulence.
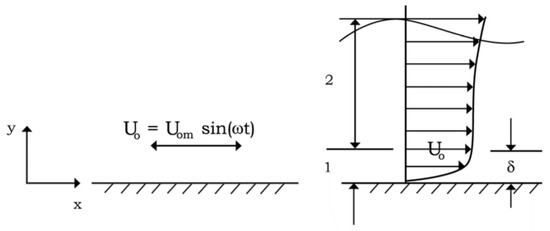
Figure 1.
Definition sketch: (1) wave boundary layer, and (2) free-stream region.
The oscillatory boundary layer developing over a hydraulically smooth bed is governed by the Reynolds number, which can be defined in terms of Stokes length (; see Equation (4)) as , where is the kinematic viscosity of the fluid, is the amplitude of the free-stream velocity of oscillatory flow (Equation (6)), and is the angular frequency (Equation (7)). It is noted that an asterisk is used hereafter to mark the dimensional quantities, whereas any variable without an asterisk refers to a dimensionless quantity. No turbulent flow structures are observed in oscillatory boundary layers where the Reynolds number is less than the critical value, i.e., , which corresponds to , in terms of the wave Reynolds number adopted in this study (see Equation (8)). The critical value may change depending on the disturbance level. For instance, although Sarpkaya [6] reported that the streaky feature of turbulence is first seen at around , Fredsøe et al. [7] showed that the laminar-to-turbulent transition could start even when if externally-generated turbulence was introduced into the flow.
The laminar-to-turbulent transition first occurs in the form of tiny turbulent patches close to the wall, called turbulent spots (manifesting as spikes in the wall shear-stress signal), typically just before the near-bed flow reversal [3,4,8]. Carstensen et al. [5] showed for the first time that the spikes in the bed shear-stress signal (and therefore in the near-bed velocity signal) are related to the turbulent spots. Turbulent spots were first noticed in Emmons’s [9] study, involving a water-table analogy to supersonic flow. Following that study, others have observed and investigated turbulent spots, such as Cantwell et al. [10] and Gad-el Hak et al. [11]. Their findings revealed that turbulent spots are isolated areas near the bed where the flow experiences intense oscillations in an otherwise laminar boundary-layer flow. These coherent structures disappear by the time the flow reverses inside the spots. Notably, these destroyed structures evolve into so-called background turbulence, thereby triggering the transition in the boundary layer during the following half-cycle of the oscillatory motion [7,12]. Another important observation in the literature is that the flow reversal is delayed inside the spot, occurring at a phase value of approximately (instead of , the typical flow reversal phase for a laminar case) because momentum-rich fluid from the outer flow constantly penetrates the near-bed flow due to turbulence inside the spot [5].
On the other hand, some research suggests that an inflectional-point shear-layer instability, i.e., the formation of vortex tubes, which are quasi-two-dimensional vortices that emerge when near the bed and extend in the transverse direction, may lead to turbulence [13,14]. Akhavan et al. [15] revealed that experimental studies do not agree with these predictions, since the flow becomes explosively unstable in the deceleration part, and considering that the critical Reynolds number for the instability caused by vortex tubes (∼85) is not in agreement with that related to laminar-to-turbulent transition (∼500). Given that the wave boundary-layer flow over a smooth bed is expected to become fully developed turbulent during phases corresponding to the inception of vortex tubes, the inflectional-point shear-layer instability concept inevitably fails [16].
The onset of the transition can be triggered by natural or artificial disturbances. The latter is used especially in experimental or numerical studies to control the relevant processes. While in Emmons’s [9] experiments, spots were generated naturally, Cantwell et al. [10] generated spots artificially in their experiments by touching the wall momentarily with a small rod. Similarly, Gad-el Hak et al. [11] and Browand and Plocher [17] artificially generated turbulent spots in their experiments by ejecting a fluid jet from a small hole. On the numerical side, Verzicco and Vittori [18] revealed that wall imperfections (i.e., wall waviness with a small amplitude) play a critical role in triggering the transition in oscillatory boundary layers. This approach was later employed in DNS simulations in the studies of, e.g., Vittori and Verzicco [2] and Costamagna et al. [12], who showed that the predicted turbulence quantities (such as bed shear stress and velocity fluctuations) agreed well with the experimental data. Ozdemir et al. [19] induced a self-sustaining transitional boundary-layer flow at , i.e., , using finite-amplitude initial perturbations. They observed that, in some cases, the flows with the largest initial perturbation amplitude returned to the laminar state, while those with smaller initial disturbances preserved their intermittently turbulent behavior. These findings demonstrated that initial perturbations, such as wall or numerical imperfections, are of fundamental importance in triggering the transition in DNS models.
The Reynolds-averaged flow parameters and turbulence quantities are of great importance for understanding turbulence behavior and quantifying turbulence-related physical processes such as mixing and sediment transport. Jonsson [20] was the first to measure the Reynolds-averaged velocity distributions under an oscillatory boundary layer and to empirically obtain the shear-stress distributions over a rough bed. Justesen and Fredsøe [21], Hagatun and Eidsvik [22], and Justesen [23] investigated the mean features and turbulence properties of oscillatory boundary-layer flows. In their experimental study, Hino et al. [24] presented significant data regarding turbulence quantities in reciprocating oscillatory boundary-layer flow over a smooth bed. They observed that turbulence quantities, such as turbulence intensity and Reynolds stresses, increase during the acceleration stage of the oscillatory flow, become maximal near the peak velocity, and rapidly decrease during the deceleration stage. While Sleath [25] focused on turbulent oscillatory flows for cases with a wide range of roughness values, Jensen et al. [3] studied both smooth and rough beds by conducting various experiments in which the Reynolds number varied from to . Sleath [25] demonstrated how bed roughness amplifies turbulence production. Jensen et al. [3] showed that turbulence is generated in the near-wall region and spreads over the depth when the flow reversal occurs.
The present paper investigates the flow features and turbulence quantities in an oscillatory boundary layer developing over a smooth bed with a low Reynolds number, (except for the validation case, where the wave Reynolds number was ), in which laminar-to-turbulent transition occurs. The objective of the paper is twofold: (1) to observe the general flow features and coherent structures during the transition to turbulence, and (2) to obtain the turbulence quantities for a low-Reynolds-number oscillatory flow as the turbulence develops. To this end, a DNS model set up in the open-source framework Nektar++ (v5.2.0) was utilized, as done by Xiong et al. [26]. The present model was first validated against the results of Xiong et al. [26], which involved a bypass transition mechanism in the intermittently turbulent regime. Following the same methodology as Xiong et al. [26], a temporary roughness element was placed on the bed to trigger the initial perturbations, and this element was removed at the instant a two-dimensional vortex tube, caused by an inflectional-point shear-layer instability, was observed on it. Then, the flow was simulated with high temporal and spatial resolution for the next four half-cycles, during which turbulent spots emerged and developed. The bed shear-stress distribution on the bed, which served as a reliable indicator of turbulence, was used to identify the turbulent spots. Several measurement points were selected to follow the bed shear-stress variations and to observe the spatial and temporal development of turbulent spots. Along with these observations, phase-resolved turbulence quantities were also investigated for the first time in the literature to understand how turbulence develops and spreads over the flow domain over successive half-cycles. Compared to phase-averaged or time-averaged analyses, a phase-resolved approach offers various advantages, including the ability to comprehensively capture the transitional processes and phase-dependent (i.e., time-dependent) mechanisms of turbulence generation, development, and breakdown. Moreover, it facilitates revealing the relationship (if any) between the flow parameters and coherent structures throughout the development of turbulence and provides insights into how turbulence and turbulence quantities vary over time under different flow conditions (e.g., different Reynolds numbers or bottom roughness). The findings are presented and interpreted in light of the studies in the literature on laminar-to-turbulent transition.
The remainder of this paper is structured as follows. The numerical methodology implemented in the DNS model is described in Section 2. The validation of the model results is presented in Section 3. The coherent flow structures, namely vortex tubes and turbulent spots, observed in the numerical model are described, and related findings are given in Section 4. Turbulence statistics are presented in Section 5, revealing how turbulence and turbulent flow structures are generated and evolve as the boundary-layer flow develops. Finally, this paper provides key conclusions in Section 6.
We note that the present study was conducted as part of collaborative work between BM SUMER Consultancy & Research and Professor Liang Cheng and Drs. Chengjiao Ren and Chengwang Xiong of the South China University of Technology’s Guangzhou International Campus. The present paper reports some early results of the aforementioned collaborative work. A final paper titled “Laminar-to-Turbulent Transition and the Onset of Turbulence in Oscillatory Boundary Layers”, authored by B.M. Sumer, V.S.O. Kirca, S. Baysal, L. Cheng, C. Ren, and C. Xiong, is presently under preparation.
2. Methodology
The governing equations for the oscillatory flow are the non-dimensional incompressible Navier–Stokes (N–S) equations
and the continuity equation
where p is the pressure, t is the time, and is the Reynolds number defined by
Here, the length scale denotes the Stokes length
Any variable without an asterisk refers to a dimensionless quantity, whereas an asterisk is used to mark the dimensional quantities. The last term on the right-hand side of Equation (1) represents the harmonic pressure gradient driving the oscillatory flow, where is the unit vector on the x-axis and is the three-dimensional velocity vector in the directions. It should be noted that x, y, and z denote the streamwise, vertical (wall-normal), and transverse directions in the Cartesian coordinate system. The above non-dimensional variables are defined as follows:
Here, is the density of the fluid, and is the amplitude of the free-stream velocity of the oscillatory flow, which is defined by
where is the angular frequency
where is the period of the oscillatory motion. The wave Reynolds number is defined by
Here, is the amplitude of the oscillatory motion obtained by
which was adopted as the characteristic length scale in the numerical model, i.e., . The characteristic velocity scale is, therefore, , which equals 1, where the dimensionless oscillatory flow period is . All the coordinates are given in terms of the wall unit, namely , where is the amplitude of the friction velocity and the subscript i denotes the i-component of the quantity under consideration unless otherwise stated, e.g., in Section 3.
To illustrate the coherent structures (such as vortex tubes and turbulent spots), the Q-criterion [27], which is extensively used in eddy identification, and the instantaneous contours of the vorticity vector were employed. The eddy within the specified region is distinguished by the positive second invariant of the velocity gradient tensor , which is defined by
where and S denote the vorticity and strain-rate tensors, which are the antisymmetric and symmetric parts of , respectively. A positive value of Q indicates that rotational effects dominate the strain effects within the flow field, which is a key criterion for identifying eddy structures.
The DNS model was set up using the extensively validated open-source Nektar++ framework. The governing equations were solved using a Fourier spectral/hp element method, namely IncNavierStokesSolver, embedded in Nektar++ [28]. This approach employs the spectral/hp element method for spatial discretization in the x–y plane, while a Fourier discretization is applied in the z-direction to accurately capture the three-dimensional (3D) characteristics of the flow [29]. Therefore, a two-dimensional (2D) computational mesh was defined. Following Xu et al. [30] and Xiong et al. [26], a hybrid mesh configuration was used in the simulations. While structured quadrilateral elements were adopted near the bed, unstructured triangular elements were defined in the far field. The distribution of h-type elements and the polynomial order employed for p-type refinement determine the 2D domain resolution, while the resolution in the transverse direction is dictated by the Fourier expansion order [26].
It should be noted that the SVV technique (spectral vanishing viscosity), which enhances the spectral viscosity and introduces controlled artificial dissipation to stabilize the numerical solution, was implemented for the Fourier modes corresponding to the highest of the wavenumber range (). Previous studies, such as Cook and Cabot [31], Xu and Pasquetti [32], and Kirby and Sherwin [33], have validated the SVV technique and demonstrated that it satisfies the entropy condition while preserving high spectral accuracy. This ensures that the numerical model solution remains stable and consistent, even for Fourier modes with the smallest scales of the flow. A velocity correction scheme, the Galerkin formulation, and the implicit-explicit (IMEX) time integration method were utilized in all simulations. For a comprehensive investigation and implementation of these methods within the Nektar++ framework, the reader is referred to Bolis [34].
Figure 2 shows a schematic illustration of the computational domain and the mesh around the roughness element. An isolated temporary roughness element with a height of and length of was placed at the center of the lower boundary (i.e., the bed) extending the entire width of the domain to trigger the initial perturbations. The shape function of the hump can be given in the following form [26,30]:
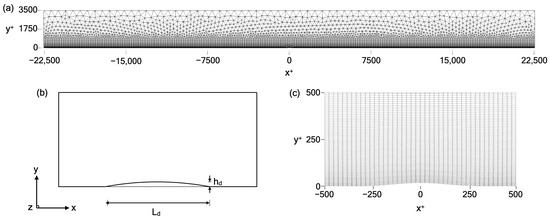
Figure 2.
(a) Two-dimensional description of the computational domain with a temporary roughness element adopted in the DNS model simulations; (b) close-up view of the temporary roughness element with a height of and a width of ; and (c) h-type mesh around the two-dimensional roughness element.
Here, again denotes the roughness height, represents the streamwise wavenumber of the most unstable disturbance for [35], and corresponds to the horizontal distance from the center point of the computational domain (or, in other words, the center point of the temporary roughness element). This hump was removed at the very moment a primary vortex tube appeared on it (namely, at a cutoff time of in all simulations, which was specified considering Xiong et al.’s [26] mapping approach for removing the temporary roughness element and convergence study of the cutoff time; readers may refer to this work for details) to ensure that the development of the observed coherent structure was not affected by the presence of the hump. It should also be noted that the LinearElasticSolver utility in Nektar++ was applied to generate a smoothly curved and refined roughness element, since it performs high-order mesh deformation step by step, leading to a higher resolution than a user-defined one. The height of the roughness element was taken as (i.e., ).
To resolve the spatial propagation of the coherent structures, the length (), height (), and breadth () of the computational domain were chosen as 45,000, 3500, and 900, respectively. The overall resolution was along the x-, y-, and z-directions, respectively, in terms of wall units. Furthermore, the timestep for the present model was set to between two successive outputs, which corresponds to 1000 outputs per wave period . This value is sufficient to identify and follow the coherent structures in the flow and to observe the temporal variation in the statistical quantities representing turbulent flows, i.e., the turbulence quantities, such as Reynolds stresses. To give a sense of how long a model timestep () is, for example, for s, ms.
The no-slip condition was introduced on the lower boundary (bed), while the slip boundary condition was applied to the upper boundary of the computational domain (which corresponds to the horizontal plane at the half-depth in an oscillating tunnel utilized by Jensen et al. [3] and Carstensen et al. [5]). A high-order Neumann pressure condition () was adopted for both the lower and upper boundaries, and a periodic boundary condition for the hydrodynamic properties of the flow, such as velocity and pressure, was applied to both the streamwise and transverse boundaries. Furthermore, the time-step () was carefully selected to prevent numerical instabilities by defining the Courant–Friedrichs–Lewy (CFL) stability criterion, which is defined in the present study as
where is the velocity magnitude in a cell and is the cell size in the direction of the velocity.
It should further be noted that, contrary to the real physical world, wall imperfections with small amplitudes are not included in a numerical domain solving Navier–Stokes equations, as stated by Vittori and Verzicco [2]; therefore, numerical imperfections are necessary to trigger turbulence in DNS models where the bed is hydraulically smooth. Hence, a random noise generation function, which is implemented as a Gaussian noise generator in Nektar++, was involved in the model to introduce infinitesimal perturbations (on the order of or smaller) into the system, thereby enhancing the transition. Gaussian noise refers to normally distributed random disturbances mathematically represented as , where is the mean and is the variance, which controls the magnitude of the noise. In the present model, Gaussian noise with a zero mean (i.e., ) and very small fluctuations was defined in a specific region inside the boundary layer as the initial velocity, which decays exponentially in the y-direction, e.g., .
3. Validation of the Model
The DNS model was validated against the results of Xiong et al. [26] by employing the same computational methods and model parameters as theirs. In their study, Xiong et al. [26] focused on the coherent structures and laminar-to-turbulent boundary-layer transition mechanism in the intermittently turbulent regime. The conversions of non-dimensional quantities and governing parameters between the present model and their model are given in Table 1. Xiong et al.’s [26] notations are also provided in this section (as well as in the relevant sections of this paper) to facilitate a clear and precise validation of the model.

Table 1.
Conversion of non-dimensional quantities and governing parameters.
The DNS model was utilized for several benchmark oscillatory flow cases by Xiong et al. [26], and it was shown that the model enables the investigation of the entire laminar-to-turbulent transition process, and therefore, all types of coherent-organized structures from the time they emerge to the instant they break down. However, since it would not be practical to discuss all the results of the validation models, for brevity, only the validation of model results for Cases 5 and 6 of Xiong et al. [26] are presented in this section.
The computational domain implemented in the validation study is schematically presented in Figure 2. The longitudinal, vertical, and transverse lengths of the computational domain were selected as , , and (in wall units, , , and , respectively) such that they were the same as those of Xiong et al. [26]. The overall resolution along the streamwise and vertical directions of the hp-refined mesh ( and ) and the number of Fourier modes along the transverse direction () were chosen as 560, 175, and 64, respectively. A temporary roughness element with a height of and (corresponding to and ) was defined at the lower boundary (bed) for Cases 5 and 6, respectively, to trigger the vortex tube formation. The Reynolds number was (), which is close to the critical value of the onset of turbulence (, or ), corresponding to the cases where the laminar-to-turbulent transition rarely occurred and therefore only the quasi-2D coherent structures, namely vortex tubes, emerged.
Figure 3a,b show a comparison between the results of the present model and those of Xiong et al. [26] obtained at two different times, namely and , corresponding to the time instants before and after the removal of the roughness element. The instantaneous contours of the normalized spanwise vorticity () reveal that the present model agreed well with the results in the reference study, except for very small differences due to the slight mismatch of the colormap. It can be concluded that the present DNS model simulated the physical process properly and captured the mechanism behind the initiation of organized structures, their development in the flow domain, and the laminar-to-turbulent transition process, given the good agreement between the results of the present model and those of Xiong et al. [26].
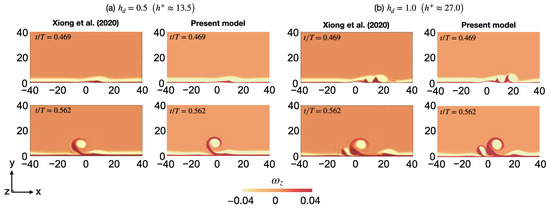
Figure 3.
Comparison of the instantaneous contours of the normalized spanwise vorticity obtained in Xiong et al. [26] (left) and the present study (right). The roughness height is (a) () and (b) (). Here, t is the time instant and is the wave period. It should be noted that the roughness element is removed at . (i.e., ). All the dimensions are given in Xiong et al.’s [26] notations.
In Figure 4, a visualization of a vortex tube right at the cutoff time is presented on the vertical surface (-plane) using the z-component of the vorticity vector (), while the normalized bed shear stress (, where indicates the magnitude of the maximum bed shear stress) induced by this vortex tube is also shown on the bed surface (-plane). The bed shear-stress visualization shows that the vortex tubes are well organized, two-dimensional flow structures that emerge near the bed within the boundary layer. The vortex tubes and their imprint on the bed shear-stress contours appear as transverse bands in the plan view, extending across the width of the flow, which agrees well with the observations in the literature.
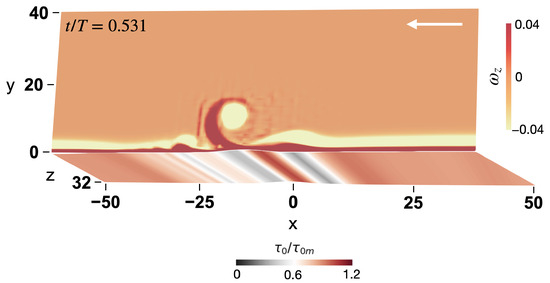
Figure 4.
-plane: instantaneous contours of the normalized spanwise vorticity at the cutoff time (corresponding to the phase of ); -plane: normalized bed shear stress. A temporary roughness element with a height of ( is placed on the bed at . , corresponding to . Flow from right to left. All the dimensions are given in Xiong et al.’s [26] notations.
4. Coherent Structures
Two different organized (coherent) flow structures were observed in the present DNS modeling study: (1) vortex tubes and (2) turbulent spots, in agreement with Carstensen et al. [5]. The latter authors were the first to report the presence of these flow structures in their oscillating-tunnel experiments, as mentioned in Section 1. Some distinguishing features of these flow structures are summarized in Table 2. It should be noted that the phase denotes the zero-upcrossing of the free-stream velocity signal. Hence, an entire oscillatory flow period is defined as two half-periods: the first half-period corresponding to –, and the following half-period corresponding to –.
Vortex tubes are quasi-two-dimensional vortices that occur near the bed due to inflectional-point shear-layer instability and extend in the transverse direction of the flow (see Figure 4). Carstensen et al. [5] reported that the wavelength () associated with vortex tubes, i.e., the distance between successive vortex tubes, is independent of the Reynolds number, and its mean value is
with a standard deviation of 0.31, in which
where is the Stokes length. Figure 5 shows that a series of vortex tubes appeared at , corresponding to into the next half-cycle. From the figure, the distance between successive vortex tubes was found to be –450, corresponding to the normalized wavelength –. These findings agree well with the results of Hayashi and Ohashi [36] and Carstensen et al. [5].
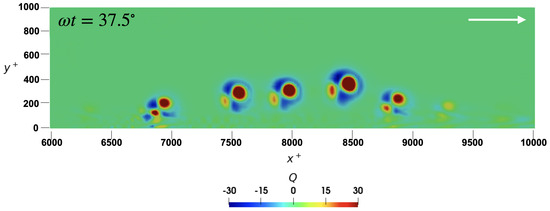
Figure 5.
Successive vortex tubes detected using the Q-criterion (see Equation (10)) at , corresponding to a phase value of ( into the next half-cycle). The arrow refers to the near-bed flow direction. .

Table 2.
Comparison of non-dimensional metrics associated with coherent structures: vortex tubes and turbulent spots. [a]: Sleath’s [37] experimental results. [b]: Carstensen et al.’s [5] oscillating-tunnel experiments. [c] Blondeaux and Vittori’s [38] numerical analysis. [d] Vittori and Verzicco’s [2] DNS model results. [e] Costamagna et al.’s [12] DNS model results. [f] Jensen et al.’s [3] oscillating-tunnel experiments. [g] Lodahl et al.’s [4] oscillating-tunnel experiments.
| Vortex Tubes | Turbulent Spots | Remarks | |
|---|---|---|---|
| Reynolds number | – | >1.5 | [a], [b] |
| Phase values emerge, * | 150–180 | 60–150 | [b], [c], [d], [e] |
| Phase values disappear, | 200–250 ** | approx. 170 *** | [b] |
| Bed shear-stress signal | kinks and dips | single or multiple spikes | [f], [g] |
* decreases with increasing Reynolds number. ** independent of Reynolds number. *** when the flow reverses inside the spot.
Turbulence, and therefore turbulent spots, first emerge when the Reynolds number exceeds the critical value (i.e., ). The phase value at which turbulent spots first emerge varies with the Reynolds number, e.g., any phases in the range of – where – [5], which become smaller and smaller as the Reynolds number increases. Turbulent spots are destroyed when the flow reverses inside the spots, i.e., at the phase [5], which is later than that of the flow outside the spot since the turbulence inside the spots delays the flow reversal, as explained above.
The bed shear stress () is a reliable indicator of turbulence, since a turbulent spot causes single or multiple spikes in the bed shear-stress signal, reaching up to 3–4 times the magnitude of the maximum bed shear stress [3,5]. Therefore, the bed shear-stress distribution on the bed, as well as the bed shear-stress signal at various locations (measurement points (MPs)), was investigated after a full period following the removal of the hump to ensure that the conditions initiating the laminar-to-turbulent transition were independent of the previous period. Figure 6 presents the normalized bed shear-stress contours, i.e., , where coherent structures can be seen, and Figure 7 shows the time series of the bed shear stress obtained at three different measurement points (MPs) selected along the centerline of the bed, i.e., , namely MP1, MP2, and MP3. The point MP1 was placed at 12,500 considering the locations where turbulent spots were observed (c.f. Figure 6), while MP3 was located at 19,000 based on the observations of vortex tubes in the computational domain. MP2 was placed at 15,000, where no flow structures were identified, to serve as a reference bed shear-stress signal in the case of laminar flow and to facilitate comparison with the variations induced by the coherent structures in the bed shear-stress signals at MP1 and MP3.
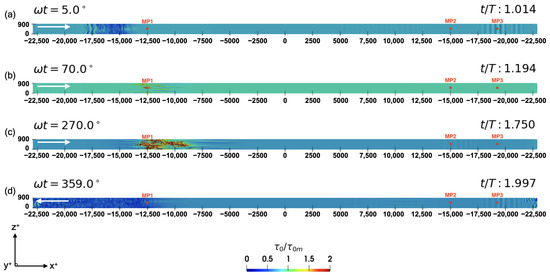
Figure 6.
Bed shear-stress contour plots of the developing oscillatory flow during the next period after the temporary hump is removed, shown at different time steps. MP1, MP2, and MP3 denote the measurement points. MP2 is placed in a region of the flow domain where no flow structures are present during the oscillatory flow period, while MP1 and MP3 are selected considering the points over which turbulent spots and vortex tubes pass, respectively. . Arrows denote the free-stream flow direction. The near-bed flow direction is from right to left.

Figure 7.
Time series of the normalized bed shear stress (i.e., ). Blue solid line: MP1 measurements. Black dashed line: MP2 measurements. Red solid line: MP3 measurements. . The arrows refer to the time instant presented in Figure 6.
Figure 6a shows the bed shear-stress contour plot after the free-stream flow reversal, i.e., into the second oscillatory flow period. It can be seen that vortex tubes passing over MP3 induced spanwise-alternating bands with slight oscillations in the bed shear-stress signal, as marked in Figure 7. In Figure 6b, spatially intermittent streaky features of the turbulence can be seen around MP1. As seen in Figure 7, these structures induced kinks and dips in the bed shear-stress signal with a magnitude of –. At a phase value of , an arrowhead-shaped turbulent spot, which first appeared at an earlier phase of about , can be seen between 13,000 and in Figure 6c. As marked in Figure 7, it can be seen that the magnitude of the spikes induced by the spot reached values 5– times larger than the amplitude of the bed shear stress in the laminar case ().
Finally, Figure 6d depicts the bed shear-stress contour plot at the instant just before the free-stream flow reversal. Despite the slight oscillations observed around MP3, the bed shear-stress signal resembled the laminar flow (Figure 7). It should further be noted that in the first half-period, the phase lead of the bed shear stress relative to the free-stream velocity () appeared to be equal to , i.e., the near-bed flow reversal occurred at at all the measurement points. This was not an unexpected result because the boundary-layer flow was still laminar, except for the small portion of the half-period when some streaky features of turbulence appeared. However, in the second half-period, the phase lead around MP1 decreased to , and even down to in the third half-period, due to the near-bed turbulent flow, which was facilitated by the mixing of higher-momentum fluid from the outer flow [16]. This is yet another indication of turbulence taking over the boundary layer as the flow developed.
Figure 8 shows the close-up contour plots of the normalized bed shear stress, i.e., , for , capturing the development of a turbulent spot during the fourth half-cycle of the simulation. Three probes, indicated by P1, P2, and P3, were placed at locations selected based on the trajectory of the turbulent spot. As in the earlier contour plots, the distances in Figure 8 are given in terms of the wall units, . The flow direction is from right to left in the free stream and near the bed. Figure 8a shows the early stage of a turbulent spot (i.e., twisting and turning motion induced by the longitudinal streaks), while in Figure 8b, a more mature arrowhead-shaped turbulent spot can be seen at a phase value of about (i.e., after the flow reversal), and the flow state where the turbulence developed further can be seen in Figure 8c.
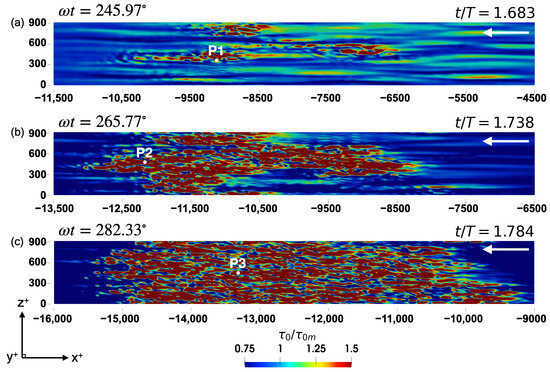
Figure 8.
Bed shear-stress contour plots of developing turbulent spots during the third half-cycle of the flow after the temporary hump is removed: (a) early stage of a turbulent spot; (b,c) the turbulent spots grow in size and shape. . The free-stream flow direction from right to left is marked in the figure.
In Figure 9, the time series of the bed shear stress obtained from the probes indicated in Figure 8 is presented. As seen in Figure 9a, the magnitude of the spikes in the bed shear-stress signal generated by the “young” turbulent spot reached almost 3 times the amplitude of the bed shear stress (), increasing to 4–5 times in Figure 9b,c as the spot became more mature. It can also be seen that the flow reversal was delayed due to the developing turbulence, i.e., the phase lead between the bed shear stress and the free-stream velocity decreased to with the transition, which agrees well with the findings given above and the experimental observations of Carstensen et al. [5] and many others.
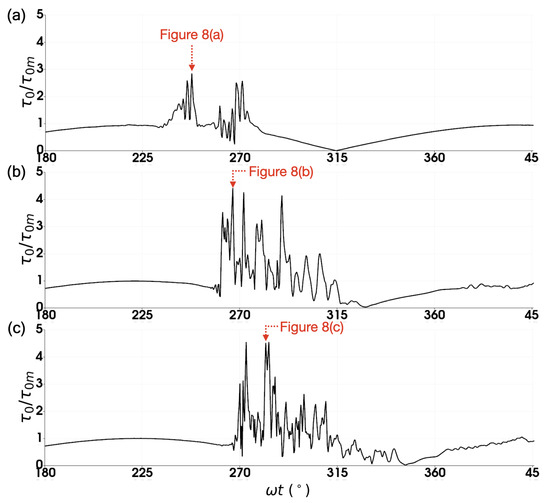
Figure 9.
(a–c) Time series of the bed shear stress corresponding to the passage of the flow structures over the probe locations illustrated in Figure 8. . The arrows refer to the time instant presented in the previous figure.
To investigate the influence of turbulent spots on the bed shear stress, the streamwise variations in the bed shear stress along the centerline of the contour plots (i.e., the x-coordinate range at ) for different phase values depicted in Figure 8 are presented in Figure 10. The figure indicates that turbulent spots can cause abrupt changes in the bed shear stress, reaching 4–5 times the maximum bed shear stress (), even during the early phases of the oscillatory motion (e.g., after the free-stream flow reversal, which corresponds to in the figure). This indicates that the flow was turbulent and experienced violent fluctuations within these flow structures; otherwise, the boundary-layer flow remained laminar, consistent with the definition. Furthermore, it is evident in Figure 9 and Figure 10 that turbulence does not develop uniformly in the transverse z-direction at a fixed streamwise x location. For instance, at a given time instant, abrupt changes were seen in the bed shear-stress signal at P1 located at , whereas no such fluctuations were observed at . Such spatially intermittent turbulent behavior suggests that experimental results obtained using fixed probes may not always be able to detect these turbulent coherent structures clearly. Therefore, DNS modeling can serve as a useful, complementary, and tailored tool to study these flow structures, as demonstrated in the present study. Figure 10 further reveals that the number, size, and severity of turbulent structures tend to increase with the development of the boundary-layer flow, resulting in multiple oscillations with higher shear-stress values, as expected.
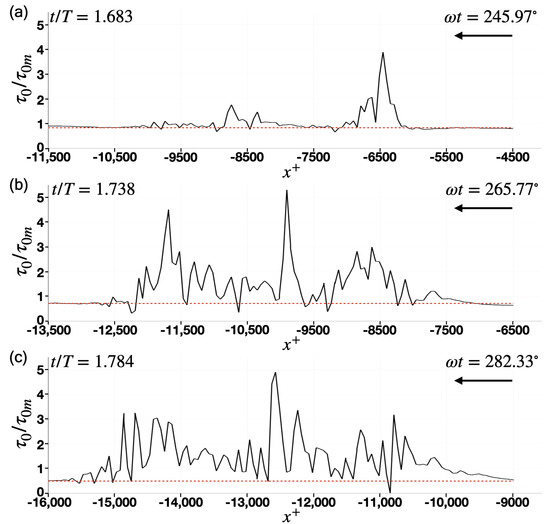
Figure 10.
Streamwise variations (spatial variations within the range) of the bed shear stress along (e.g., centerline of the computational domain) for the phase values presented in Figure 8. The horizontal dashed lines denote the far-field normalized bed shear-stress value. . The free-stream flow direction is from right to left, as marked with an arrow on each figure.
5. Turbulence Quantities
As discussed above, the velocity “measurements” in the present DNS model were performed at sampling intervals of , i.e., , corresponding to ms, for a flow period of s.
To obtain the turbulence quantities in oscillatory boundary-layer flows, ensemble averaging is typically used (see, for example, Jensen et al. [3]). Sleath [25] recommended that the total number of ensembles required for consistent statistics be at least . However, obtaining such long simulations for period-based ensemble averaging (i.e., reaching 50 half-cycles) using a DNS model with a sufficiently high resolution and a large computational domain is not computationally realistic. Although the findings obtained from five half-cycles of oscillatory flow simulation (four half-cycles, in each of which a new boundary layer develops, excluding the first half-cycle due to the temporary roughness element) can be used to investigate the laminar-to-turbulent transition process and the evolution of the coherent flow structures, the turbulence quantities derived from ensembles may not be reliable. Alternatively, spatially averaged turbulence quantities (quantities averaged over the entire streamwise and transverse directions, x and z, as a function of the phase, , and the wall-normal coordinate, y) were utilized in this study. A similar approach was also employed by Ozdemir et al. [19]. The spatially averaged value of a hydrodynamic quantity, for example, the Reynolds-averaged streamwise velocity, , can be defined as
where and are the number of uniformly spaced grid points along the x- and z-directions, respectively. By extension, the root-mean-square (r.m.s.) value of the fluctuating velocity in the streamwise direction, i.e., , is calculated as
Figure 11 presents the mean velocity profiles as a function of the phase values for the third half-cycle of the oscillatory flow after the removal of the temporary roughness element. Hino et al.’s [24] experimental results for (the triangles), along with the results for obtained in Spalart and Baldwin’s [39] DNS model work and Jensen et al.’s [3] experimental study, were used for comparison with the current data. The analytical solution of the laminar oscillatory flow velocity profile is also shown in the figure, which was obtained as [40]
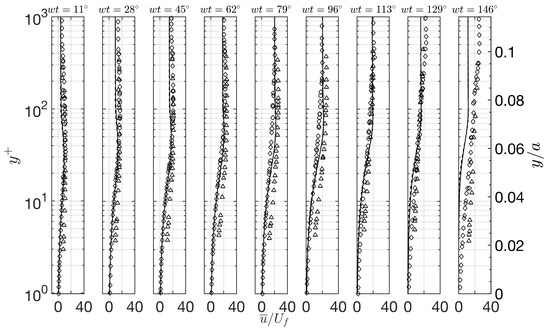
Figure 11.
Distribution of the mean streamwise velocity normalized with an inner-flow parameter at different phases. The third half-cycle after removing the temporary roughness element. Solid lines, , the present DNS model. ◯, , Jensen et al.’s [3] experiments, Test 6; ⬦, , Spalart and Baldwin’s [39] DNS model; △, , Hino et al.’s [24] experiments; Dashed lines, laminar solution.
It can be seen that the model results are in good agreement with the data from the reference studies. However, it should be noted that the oscillatory flow mostly remained laminar in the present study, since the Reynolds number was so close to the critical value. Therefore, the spatially averaged turbulence quantities show the entire domain where the oscillatory flow was intermittently turbulent, which led to discrepancies between the present model and the data shown in Figure 11. Even though, for brevity, they were not provided here, the model results also showed that the phase lead decreased with the developing oscillatory flow due to the laminar-to-turbulent transition. For example, at a phase value of , the profile obtained for the first half-period was close to the laminar solution, whereas almost no negative spatially averaged streamwise velocity magnitude was observed during the fourth half-cycle (the flow had not yet reversed). These findings, which are in agreement with the data reported in the literature (e.g., Lodahl et al. [4] and Jensen et al. [3]), can be attributed to the increasing turbulence intensities as the flow continued, i.e., a higher number of turbulent structures near the bed, which enhanced the momentum exchange between the near-bed flow and momentum-rich upper-layer flow.
Figure 12 shows the distribution of the spatially averaged r.m.s. values of the fluctuating streamwise velocity at different phases. For brevity, only the results for the third half-period after the removal of the temporary roughness element are given here. The vertical distance from the bed is given in terms of wall units, i.e., (right axis), and is normalized with the amplitude of the oscillatory flow a (left axis). The figure shows the generation and evolution of turbulence, phase by phase. Turbulence first emerged close to the bed at a phase of approximately , manifesting as an emerging local maximum close to the bed, and diffused away from the bed at further phases as the boundary layer developed. A more uniform distribution of turbulence along the vertical direction observed in earlier phases of the oscillatory flow can be linked to the residual turbulence from the previous cycle (background turbulence), which affected the subsequent half-cycle. In the same figure, three different data from Jensen et al. [3] and Spalart and Baldwin [39] for , along with Hino et al. [24] for , are also plotted. The comparison shows that the order of magnitude of the turbulence obtained in the present study was not significantly different from that of other works. The discrepancy between the present model solution and those obtained by the other studies at around – can be attributed to the fact that the turbulence regime of the flow condition was quite different, especially at these phases of the oscillatory flow for a relatively low Reynolds number, . For example, turbulent spots emerged at around when , while they appeared in any phase at – for – [5]. It is evident that turbulence was present in a wider range of phases and that it can reach greater distances from the wall in the high-Reynolds-number oscillatory boundary layer.
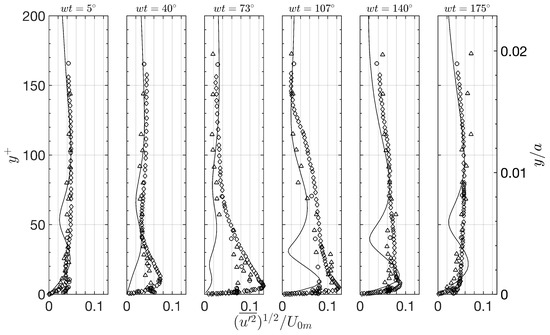
Figure 12.
Distribution of the root-mean-square (r.m.s.) values of the fluctuating velocity in the streamwise direction. The third half-cycle after the removal of the temporary roughness element. Solid lines, , the present DNS model. ◯, , Jensen et al.’s [3] experiments, Test 6; ⬦, , Spalart and Baldwin’s [39] DNS model; △, , Hino et al.’s [24] experiments.
Another potential reason for the discrepancy between the model results and the data reported in the literature, specifically those given by Hino et al. [24] for the Reynolds number relatively close to what was defined in the present study, might be related to the averaging method used to present the turbulence quantities. In this work, as explained above, spatial averaging was employed; therefore, the results given here also include data obtained at laminar regions. Consequently, the present model captures turbulence quantities near the bed with high accuracy at phases before and after the flow reversal (e.g., –, where corresponds to after the flow reversal in oscillatory boundary-layer flows), as well as the those observed far from the bed at all phases. However, as expected, the near-bed measurements for the early phases of the oscillatory flow, when turbulence was developing, naturally differ (albeit not radically) from the values reported in the literature.
As a result, the model represents the near-wall (boundary layer) flow both immediately before and after the flow reversal (e.g., between 105° and 185°; in an oscillatory flow, 185° corresponds to 5°) with high accuracy, as well as the flow characteristics in regions farther from the bed across all phase angles. However, the observation that the turbulence parameters obtained near the bed during the early phase angles of oscillatory flow—when turbulence has just begun to develop—are slightly lower (albeit of the same order of magnitude) than the values reported in the literature is a reasonable outcome.
6. Conclusions
This study investigated the coherent flow structures that emerge in, and the turbulence characteristics of a transitional regime oscillatory boundary-layer flow () over a smooth bed by employing direct numerical simulation (DNS) modeling. The Nektar++ open-source framework was utilized to solve the governing equations. A temporary roughness element on the bed was used to trigger the laminar-to-turbulent transition and was removed at the very moment a vortex tube emerged on it. The model was validated against the results of Xiong et al. [26] carried out for , during which a bypass transition was observed. Once validated, the initiation of turbulence and, therefore, the emergence and development of coherent flow structures (vortex tubes and turbulent spots) were simulated in the model, whereby their spatial and temporal evolution was investigated. The bed shear stress was considered a reliable indicator and a means of distinguishing the coherent flow structures, since the magnitudes of the bed shear-stress variations caused by these flow structures are sharply recognizable.
Additionally, the mean and turbulence quantities, such as mean velocities and Reynolds stresses, were obtained via spatial averaging to understand how turbulence is generated, sustained, and diffused in a transitional (low Reynolds number) oscillatory boundary layer. This information is particularly useful for quantifying the turbulence parameters and predicting turbulence-related processes such as sediment transport, mixing, or energy dissipation. The evolution of turbulence in the oscillatory boundary-layer flow at a low Reynolds number was investigated in a phase-resolved manner as the flow progressed cycle by cycle. The main conclusions of the present study are summarized as follows:
- (a)
- The results showed that coherent structures can be clearly identified using the present DNS method, where these structures can be traced and observed.
- (b)
- Two kinds of coherent structures, namely vortex tubes and turbulent spots, were observed in the simulated oscillatory boundary-layer flow at the transitional regime, in agreement with Carstensen et al.’s [5] observations. The bed shear-stress distribution was used to detect and distinguish the flow structures, and it was shown to be a reliable indicator of the transition to turbulence, as reported previously by Jensen et al. [3].
- (c)
- Vortex tubes were characterized as two-dimensional vortices that cause significantly smaller kinks and dips in the bed shear-stress signal than those caused by turbulent spots. The distance between successive vortex tubes, i.e., wavelength, remained practically constant. The findings showed that the present model satisfactorily captured the vortex tube generation process and its features, e.g., the phase value at which they emerged or the mean value of the normalized wavelength.
- (d)
- Turbulent spots emerged as tiny turbulent patches and evolved into arrowhead-shaped isolated areas where the flow showed turbulent behavior. These flow structures caused single or multiple spikes in the bed shear-stress signal. It was seen that the present model successfully simulated the entire process, from the onset of spots to their destruction. The measurements obtained at different measurement points indicated that the imprint of these coherent structures is a single or a series of spikes with a magnitude reaching up to 4–5 times that of the maximum bed shear stress, which agrees with the data in the literature.
- (e)
- It was seen that the phase lead of the bed shear stress to the free-stream velocity, , decreased as the turbulence in the boundary-layer flow developed, given that the momentum exchange increased with increasing turbulence. During the first half-period of the simulation following the removal of the temporary roughness element, although some turbulent structures appeared in some regions of the flow domain, turbulence faded away, and boundary-layer flow remained mostly laminar. Therefore, the phase lead remained at , a value characteristic of a laminar oscillatory boundary layer. However, as expected, the phase lead decreased to – during the following half-cycles with increased levels of turbulence, since the upper layers of the flow with momentum-rich fluids continuously supply the near-bed flow.
- (f)
- Profiles of the mean velocity () and turbulence quantities at different phases were obtained. It was observed that flow close to the bed responded to the adverse pressure gradient earlier than the free-stream flow. Moreover, the observed magnitude of the reversed flow decreased at a given phase value, e.g., –, with the developing oscillatory boundary layer due to the increasing turbulence, leading to delays in the flow reversal. The findings showed that the turbulence generated in the near-bed region became stronger in the deceleration stage due to the adverse pressure gradient and diffused away from the bed at further phases of the oscillatory motion. The more uniformly distributed turbulence quantities observed in earlier phases of oscillatory flow can be attributed to the residual turbulence from the coherent structures broken down in the previous half-cycle (background turbulence) as the boundary layer progressed into the next half-cycle. It can also be concluded that the oscillatory flow remained laminar during the acceleration stage at low Reynolds-number values (i.e., close to the critical Reynolds number), as inferred from the notably low turbulence quantities in the near-bed region. The laminar-to-turbulence transition, however, occurred during the deceleration stage, for instance, at around , as a result of the adverse pressure gradient.
- (g)
- A comparison of profiles with those obtained by Jensen et al. [3] and Spalart and Baldwin [39] for oscillatory boundary layers with a higher Reynolds number (), along with Hino et al.’s [24] experimental results for , showed that the order of magnitude of the turbulence near the bed in both cases was very close. However, the turbulence near the wall was notably smaller for the earlier phases of the oscillatory flow motion in the present case, given that the Reynolds number was small (), and turbulence could not “emerge” at these phases, which is in agreement with the results of Carstensen et al. [5].
Author Contributions
Conceptualization, S.B. and V.S.O.K.; methodology, S.B. and V.S.O.K.; software, S.B.; validation, S.B.; data curation, S.B. and V.S.O.K.; visualization, S.B.; resources, V.S.O.K.; funding acquisition, V.S.O.K.; writing—original draft preparation, S.B.; writing—review and editing, V.S.O.K.; supervision, V.S.O.K. All authors have read and agreed to the published version of the manuscript.
Funding
This work was funded by the Scientific and Technological Research Council of Turkiye (TUBITAK) through the project titled “Qualitative and Quantitative Investigation of Laminar-to-Turbulent Transition in Steady and Unsteady Boundary Layers” under grant No. 122M024.
Data Availability Statement
The original contributions presented in this study are included in the article. Further inquiries can be directed to the corresponding author.
Acknowledgments
The authors would like to express their gratitude to B. Mutlu Sumer for initiating the core idea of this work and for his continuous support, valuable feedback, and supervision throughout the entire process, including the preparation of this manuscript. The authors also gratefully acknowledge Liang Cheng, Chengjiao Ren, and Chengwang Xiong for sharing their DNS expertise and for their ongoing collaboration.
Conflicts of Interest
Author V. S. Ozgur Kirca was employed by the company BM SUMER Consultancy & Research. The remaining authors declare that the research was conducted in the absence of any commercial or financial relationships that could be construed as a potential conflict of interest.
References
- Kemp, P.; Simons, R. The interaction between waves and a turbulent current: Waves propagating with the current. J. Fluid Mech. 1982, 116, 227–250. [Google Scholar] [CrossRef]
- Vittori, G.; Verzicco, R. Direct simulation of transition in an oscillatory boundary layer. J. Fluid Mech. 1998, 371, 207–232. [Google Scholar] [CrossRef]
- Jensen, B.L.; Sumer, B.M.; Fredsøe, J. Turbulent oscillatory boundary layers at high Reynolds numbers. J. Fluid Mech. 1989, 206, 265–297. [Google Scholar] [CrossRef]
- Lodahl, C.; Sumer, B.M.; Fredsøe, J. Turbulent combined oscillatory flow and current in a pipe. J. Fluid Mech. 1998, 373, 313–348. [Google Scholar] [CrossRef]
- Carstensen, S.; Sumer, B.M.; Fredsøe, J. Coherent structures in wave boundary layers. Part 1. Oscillatory motion. J. Fluid Mech. 2010, 646, 169–206. [Google Scholar] [CrossRef]
- Sarpkaya, T. Coherent structures in oscillatory boundary layers. J. Fluid Mech. 1993, 253, 105–140. [Google Scholar] [CrossRef]
- Fredsøe, J.; Sumer, B.M.; Kozakiewicz, A.; Chua, L.H.; Deigaard, R. Effect of externally generated turbulence on wave boundary layer. Coast. Eng. 2003, 49, 155–183. [Google Scholar] [CrossRef]
- Hino, M.; Sawamoto, M.; Takasu, S. Experiments on transition to turbulence in an oscillatory pipe flow. J. Fluid Mech. 1976, 75, 193–207. [Google Scholar] [CrossRef]
- Emmons, H.W. The Laminar-Turbulent Transition in a Boundary Layer-Part I. J. Aeronaut. Sci. 1951, 18, 490–498. [Google Scholar] [CrossRef]
- Cantwell, B.; Coles, D.; Dimotakis, P. Structure and Entrainment in the plane of symmetry of a turbulent spot. J. Fluid Mech. 1978, 87, 641–672. [Google Scholar] [CrossRef]
- Gad-el Hak, M.; Riley, J.; Blackwelder, R. On the growth of turbulent regions in laminar boundary layers. J. Fluid Mech. 1981, 110, 73–95. [Google Scholar] [CrossRef]
- Costamagna, P.; Vittori, G.; Blondeaux, P. Coherent structures in oscillatory boundary layers. J. Fluid Mech. 2003, 474, 1–33. [Google Scholar] [CrossRef]
- Foster, D.; Holman, R.; Beach, R. Sediment suspension events and shear instabilities in the bottom boundary layer. Coastal Dynamics 1994, 712–726. [Google Scholar]
- Foster, D. Dynamics of the Near Shore Wave Bottom Boundary Layer. Ph.D. Thesis, Oregon State University, Corvallis, OR, USA, 1997. [Google Scholar]
- Akhavan, R.; Kamm, R.; Shapiro, A. An investigation of transition to turbulence in bounded oscillatory Stokes flows Part 2. Numerical simulations. J. Fluid Mech. 1991, 225, 423–444. [Google Scholar] [CrossRef]
- Sumer, B.M.; Fuhrman, D.R. Turbulence in Coastal and Civil Engineering; World Scientific: Singapore, 2020. [Google Scholar] [CrossRef]
- Browand, F.; Plocher, D. Image processing for sediment transport. In Proceedings of the 21st World Congress, International Association for Hydraulic Research, Melbourne, Australia, 19–23 August 1985; pp. 19–23. [Google Scholar]
- Verzicco, R.; Vittori, G. Direct simulation of transition in Stokes boundary layers. Phys. Fluids 1996, 8, 1341–1343. [Google Scholar] [CrossRef]
- Ozdemir, C.E.; Hsu, T.J.; Balachandar, S. Direct numerical simulations of transition and turbulence in smooth-walled Stokes boundary layer. Phys. Fluids 2014, 26, 045108. [Google Scholar] [CrossRef]
- Jonsson, I.G. Measurements in the turbulent wave boundary layer. In Proceedings of the 10th IAHR World Congress, London, UK, 1–5 September 1963; Volume 1, pp. 85–92. [Google Scholar]
- Justesen, P.; Fredsøe, J. Distribution of Turbulence and Suspended Sediment in the Wave Boundary Layer; Prog. Rep. 62; Institute of Hydrodynamic and Hydraulic Engineering, Technical University of Denmark: Lyngby, Denmark, 1985. [Google Scholar]
- Hagatun, K.; Eidsvik, K.J. Oscillating turbulent boundary layer with suspended sediments. J. Geophys. Res. Ocean. 1986, 91, 13045–13055. [Google Scholar] [CrossRef]
- Justesen, P. Turbulent Wave Boundary Layers; Series Paper 41; Institute of Hydrodynamic and Hydraulic Engineering, Technical University of Denmark: Lyngby, Denmark, 1987. [Google Scholar]
- Hino, M.; Kashiwayanagi, M.; Nakayama, A.; Hara, T. Experiments on the turbulence statistics and the structure of a reciprocating oscillatory flow. J. Fluid Mech. 1983, 131, 363–400. [Google Scholar] [CrossRef]
- Sleath, J. Turbulent oscillatory flow over rough beds. J. Fluid Mech. 1987, 182, 369–409. [Google Scholar] [CrossRef]
- Xiong, C.; Qi, X.; Gao, A.; Xu, H.; Ren, C.; Cheng, L. The bypass transition mechanism of the Stokes boundary layer in the intermittently turbulent regime. J. Fluid Mech. 2020, 896, A4. [Google Scholar] [CrossRef]
- Jeong, J.; Hussain, F. On the identification of a vortex. J. Fluid Mech. 1995, 285, 69–94. [Google Scholar] [CrossRef]
- Cantwell, C.D.; Moxey, D.; Comerford, A.; Bolis, A.; Rocco, G.; Mengaldo, G.; De Grazia, D.; Yakovlev, S.; Lombard, J.E.; Ekelschot, D.; et al. Nektar++: An open-source spectral/hp element framework. Comput. Phys. Commun. 2015, 192, 205–219. [Google Scholar] [CrossRef]
- Karniadakis, G. Spectral element-Fourier methods for incompressible turbulent flows. Comput. Methods Appl. Mech. Eng. 1990, 80, 367–380. [Google Scholar] [CrossRef]
- Xu, H.; Sherwin, S.J.; Hall, P.; Wu, X. The Behaviour of Tollmien–Schlichting Waves Undergoing Small-Scale Localised Distortions. J. Fluid Mech. 2016, 792, 499–525. [Google Scholar] [CrossRef][Green Version]
- Cook, A.W.; Cabot, W.H. A high-wavenumber viscosity for high-resolution numerical methods. J. Comput. Phys. 2004, 195, 594–601. [Google Scholar] [CrossRef]
- Xu, C.; Pasquetti, R. Stabilized spectral element computations of high Reynolds number incompressible flows. J. Comput. Phys. 2004, 196, 680–704. [Google Scholar] [CrossRef]
- Kirby, R.M.; Sherwin, S.J. Stabilisation of Spectral/Hp Element Methods Through Spectral Vanishing Viscosity: Application to Fluid Mechanics Modelling. Comput. Methods Appl. Mech. Eng. 2006, 195, 3128–3144. [Google Scholar] [CrossRef]
- Bolis, A. Fourier Spectral/hp Element Method: Investigation of Time-Stepping and Parallelisation Strategies. Ph.D. Thesis, Imperial College London, London, UK, 2013. [Google Scholar]
- Blennerhassett, P.; Bassom, A.P. The linear stability of high-frequency oscillatory flow in a channel. J. Fluid Mech. 2006, 556, 1–25. [Google Scholar] [CrossRef]
- Hayashi, T.; Ohashi, M. A dynamical and visual study on the oscillatory turbulent boundary layer. In Turbulent Shear Flows 3: Proceedings of the Third International Symposium on Turbulent Shear Flows, The University of California, Davis, CA, USA, 9–11 September 1981; Springer: Berlin/Heidelberg, Germany, 1982; pp. 18–33. [Google Scholar]
- Sleath, J.F. Sea Bed Mechanics; John Wiley and Sons Inc.: New York, NY, USA, 1984. [Google Scholar]
- Blondeaux, P.; Vittori, G. Wall imperfections as a triggering mechanism for Stokes-layer transition. J. Fluid Mech. 1994, 264, 107–135. [Google Scholar] [CrossRef]
- Spalart, P.R.; Baldwin, B.S. Direct Simulation of a Turbulent Oscillating Boundary Layer; Technical Report; NASA Technical Memorandum, 8940; AMES Research Center: Moffett Field, CA, USA, 1987. [Google Scholar]
- Batchelor, G.K. An Introduction to Fluid Dynamics; Cambridge Mathematical Library, Cambridge University Press: Cambridge, UK, 1967. [Google Scholar]
Disclaimer/Publisher’s Note: The statements, opinions and data contained in all publications are solely those of the individual author(s) and contributor(s) and not of MDPI and/or the editor(s). MDPI and/or the editor(s) disclaim responsibility for any injury to people or property resulting from any ideas, methods, instructions or products referred to in the content. |
© 2025 by the authors. Licensee MDPI, Basel, Switzerland. This article is an open access article distributed under the terms and conditions of the Creative Commons Attribution (CC BY) license (https://creativecommons.org/licenses/by/4.0/).