Abstract
In this work, experimental results on the generation of acoustic contributions during the discharge process of different granular materials from both vertical and inclined silos are presented. The experiments show that the generation of acoustic emissions associated with the “silo music” phenomenon occurs not only in vertical silos but also in inclined ones. The acoustic signals produced during the silo discharge process are recorded and analysed in both time and frequency domains. The frequency analysis focuses on low frequencies near the lower auditory threshold of 20 Hz, demonstrating that the spectral components of the acoustic signals are related to the mass flow rate and the discharge velocity of the granular material.
1. Introduction
Observations in industrial activities and laboratory experiments during the discharge process of granular materials in silos have demonstrated the presence of two well-known physical phenomena closely related to each other: silo music and silo quake. On many occasions, the support structure of a silo may suffer irreversible damage by the influence of mechanical vibrations generated by the silo quake. Silo quake vibrations are often accompanied by strong dynamic pulsations that induce sound waves in the hearing range from 20 Hz to 20 kHz [1]. These sound waves are associated with resonant frequencies that cause the emergence of the classical booming sound, called silo music. Silo music is considered noise pollution, causing disturbing effects in humans and animal species living in the surroundings near the silo activity area.
Most of the works in the literature have presented data of experimental results for the generation of acoustic contributions during the discharge process of confined granular materials from vertical silos due to gravitational outflow. It is accepted that the main physical cause of this acoustic phenomenon is the slip/stick motion and its interaction with the bulk solids, giving rise to the variable friction between the surface of the container and the granular material [2,3,4,5,6,7,8,9]. Recent developments have expanded this understanding by addressing inclined silo discharges [10], stress fluctuations via the discrete element method (DEM) [11,12], and the role of inserts in modifying flow regimes [13]. Non-local continuum models have also been explored [14]. Different techniques have been implemented to understand the silo music phenomenon (sometimes called silo booming). For example, the electrical capacitance tomography technique has been successful in locating and measuring the transition zone of the cylindrical and converging flow, the dynamic changes of the bulk density and the influence of the strong dynamic pulsations inside the granular material when silo music is occurring in the discharge process of the silo [9,15,16].
The silo music phenomenon is undoubtedly related to strong dynamic effects that connect vibrations of the silo structure with the characteristic booming sound. In addition, the measurements of wall accelerations and the recording of acoustic signals have been used to determine mechanical effects, such as the mode shapes of the silo structure [8]. In [2,17], other important achievements of the silo music phenomenon have been reported. These experiments have demonstrated that the flow of granular materials in a pipe with a low Mach number is linearly unstable in the presence of acoustic wave propagations. Also, it was observed that the emergence of slip/stick motion is due to friction hysteresis. A notable assertion is that the exponential amplification of waves propagates in the opposite direction of the granular material flow.
The mass flow rate during the discharge of granular material through an orifice of diameter D at the silo bottom is described by the Hagen–Beverloo law , where is the bulk density of the granular material and g is gravitational acceleration. An example of the use of this expression is its ability to measure and control granular flows in industrial activities. The effectiveness, accuracy, and variations of the expression have been reported in some interesting works, such as in [18,19,20,21,22,23,24,25,26,27]. The historical works about the study of the flow of confined granular materials through orifices, written by Beverloo and Hagen, can be consulted in [28,29]. More advanced versions of the mass flow rate based on differential equations are given in [30,31].
The expression for shows a strong dependence on the diameter D, which can be understood in terms of the pressure distribution within the silo. The Janssen model describes how vertical pressure in a silo filled with granular material does not increase linearly with depth, as it does in liquids, but instead reaches a limiting value due to the friction between the material and the silo walls. This friction redirects part of the vertical load to the walls, resulting in a non-linear pressure distribution [32,33,34,35,36,37,38,39]. This principle is applied to explain sand flow in silos and hourglasses, where wall friction limits the vertical pressure at the bottom, preventing it from increasing indefinitely with the height of the sand column [40,41,42]. As a result, the sand flows at a relatively constant rate through the aperture D, maintaining steady flow conditions [19,37].
As a significant theoretical insight, the Janssen model for the pressure distribution in vertical silos proves relevant for describing the propagation of elastic waves in granular media associated with the silo music phenomenon. To understand the amplification mechanism of acoustic waves, the wave equation governing elastic wave propagation during granular flow in the silo includes a non-conservative term. This term incorporates a characteristic length scale that emerges from the Janssen model [2,17,35,37].
In this work, we present novel experimental results on the silo music phenomenon observed in a short, narrow cylindrical silo. The silo, arranged in both vertical and inclined configurations, is filled with various granular materials and subsequently discharged through a bottom outlet, occasionally producing acoustic emissions. To investigate these acoustic contributions, the experiments were conducted inside an acoustic isolation chamber, where sound sensors and a data acquisition system were used to capture the emitted sounds. The recorded signals were analysed in both the time and frequency domains, with particular attention given to low-frequency components.
The motivation behind this study is to experimentally demonstrate that the silo music phenomenon is not exclusive to the discharge of vertically oriented silos. In fact, acoustic emissions are frequently observed during the discharge of granular materials from inclined silos as well.
This paper is organised as follows: In Section 2, we establish the experimental setup for the silo music phenomenon. Also, the characteristics of the granular materials and the silo used in the experiments are presented. Section 3 is devoted to the analysis in the time and frequency domains of the acoustic contributions of the silo music phenomenon. The mass flow rate and the discharge velocity of the granular materials are discussed in Section 4. In Section 5, we discuss the apparent relation of the low-frequency components of acoustic contributions with the mass flow rate and discharge velocity of the granular material for vertical and inclined silos. Finally, in Section 6, conclusions of this work are given.
2. Experimental Setup
2.1. Characteristics of the Experiment
To take measurements of the acoustic contributions of the silo music phenomenon, a series of experiments were conducted inside an acoustic isolation chamber. The interior of the chamber was climate-controlled, maintaining values of temperature and relative humidity: T = ± , = 33 ± . The aim of the chamber is to avoid external noises and reduce the effects of ground vibrations on the experiments. The experimental apparatus consists of a silo mounted on a steel ring support stand with test tube clamps (see Figure 1). This technique was implemented to maintain vertical and inclined positions during the discharge process, restricting lateral motion and vertical displacement.
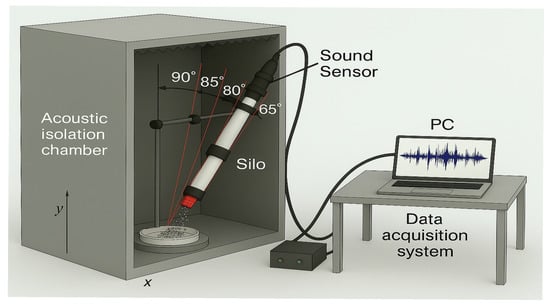
Figure 1.
Disposition scheme of the experimental apparatus.
A short cylindrical glass tube was used as a silo. The top of the silo is an open edge with an external diameter = 4.5 ± 0.1 cm and an internal diameter = 3.6 ± 0.1 cm. The bottom has a central circular outlet of diameter D (0.8 cm). Other physical attributes of the silo are its length (L = 46.5 cm), its wall thickness (0.9 ± 0.01 cm), and its natural frequency , as shown in Table 1.

Table 1.
Silo properties used in experiments.
To conduct the experiments, it was required to fill the silo with different granular materials. The filling was performed in a vertical position from the open top, ensuring that the bottom outlet was sealed until the beginning of the controlled discharge process. As a consequence of the filling procedure, a granular material column, denoted as , was formed inside the silo with cylindrical geometry. During the filling process, an air column = 2 cm was left over the like-membrane structure formed by the granular material surface (see Figure 2). is similar to the air column in an open-end/closed-end resonator tube of wavelength = 4 L, whose fundamental frequency is given by = /, where L is the tube length and is the sound speed in air with a value of 343 m/s at . For the case of the inclined silo experiments, the filling of the silo was performed vertically and then tilted before the discharge procedure.
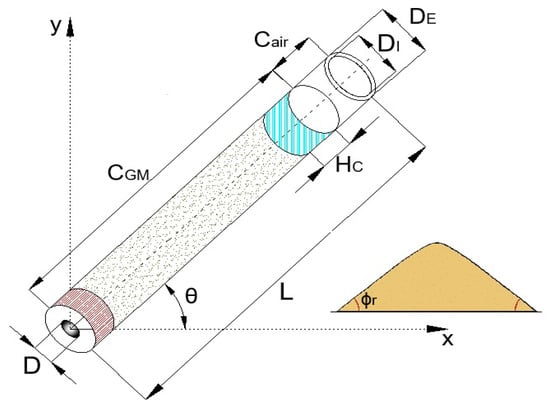
Figure 2.
Representation of the silo properties and the angle of repose of the granular material.
The first series of experiments were performed with the silo in a vertical position, with = , for different granular materials. When the seal in the silo bottom outlet was removed, the granular material began to flow through the outlet, generating the appearance of acoustic contributions. These contributions were measured via a sound sensor, recording signals in the time domain. The sound sensor was placed above the air column over the open top of the silo. The subsequent series of experiments were performed with a different inclination angle of the silo. We call this the inclined silo music phenomenon, which was studied experimentally here for first time. The discharge of granular materials for the inclined silo music phenomenon was performed in the interval ≤ ≤ with discrete decrements of = 5°, ranging from the positive y-axis to the positive x-axis. In Section 3, the acoustic contributions in the time domain and frequency domain are analysed. This approach is consistent with the methodologies reported by Wang et al. [38] and Yang et al. [43], where wall normal stresses were monitored during silo discharge.
2.2. Granular Materials
Ideal dry, cohesionless granular materials can be defined as a collection of spherical particles with the same average diameter. This definition corresponds to monodispersive granular materials, for example, glass spheres. However, natural granular materials and most of granular materials used in the industry are assembles of particles with different sizes and forms; they are referred to as polidispersive granular materials [1,37,44,45,46,47]. By applying techniques of granulometry, it is possible to measure the size distribution in a collection of grains [37,44,48].
To conduct the experiments of this work, we used four granular materials, labelled as Beach Sand, Sugar (granulated sugar), Silica Sand I, and Silica Sand II (Figure 3). Beach Sand and Sugar are angulated grains, and Silica Sand I and II are rounded grains. Their physical properties, such as the mean diameter (mm) (Figure 4), the bulk density (), the angle of repose in degrees, and the friction coefficient , are shown in Table 2.
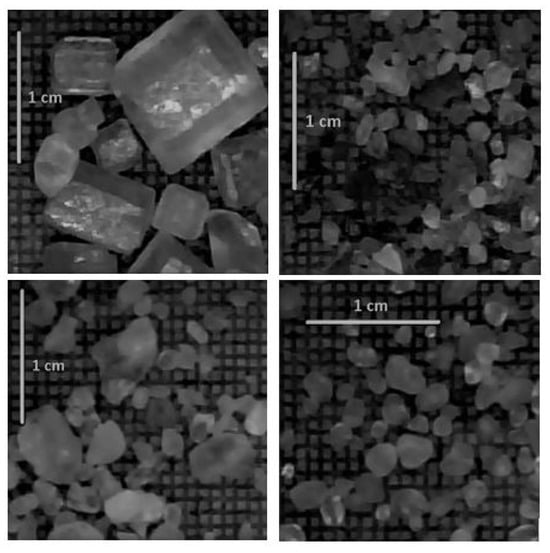
Figure 3.
Particle shape micrographs for samples of Sugar (up-left), Beach sand (up-right), Silica sand I (down-left), Silica sand II (down-right).
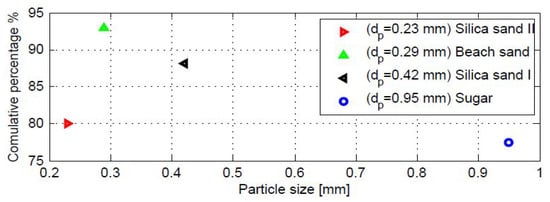
Figure 4.
Mean grain diameters given by the cumulative frequency distribution expressed in percentage terms.
Table 2.
Granular material properties.
3. Acoustic Contributions
3.1. Time Analysis
This study focuses on the acoustic contributions of the inclined silo music phenomenon. To record the sound signals, a Pasco Model CI-6506B sound sensor (PASCO Scientific, Roseville, CA, USA) was used. Its frequency response, ranging from 20 Hz to 7200 Hz, ensures good performance at low frequencies. In each experiment, an acoustic time signal was obtained during the granular material discharge from either a vertical or inclined silo, using a fixed sampling frequency of 100 Hz, which satisfies the minimum sampling condition to capture the signal accurately.
The recorded signals represent discrete voltage variations interpretable as time-domain sound signals, denoted as , which consist of noise and acoustic contributions . The signal is divided into three sections: reflects the initial noise with low amplitude and no significant frequency components; captures the acoustic contributions of the phenomenon; and consists of noise resuming after the acoustic event until the end of the discharge. These changes in amplitude are illustrated in Figure 5.
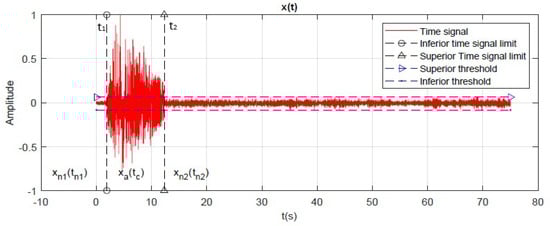
Figure 5.
The acquired raw data of the signal for Silica Sand II with (Vertical silo discharge process).
The total discharge time is given by . The series contains the acoustic contributions of the vertical and inclined silo music phenomena. The time-based analysis establishes clear thresholds and allows for the identification of the beginning and end of the acoustic event within the overall discharge noise.
The critical time is defined as , where indicates the beginning of acoustic contributions and is the time when the acoustic contributions are no longer present. According to this analysis, contains acoustic and noise contributions during the total flow process and can be written as a concatenated series as follows:
3.2. Frequency Domain
The analysis of signals in the time domain is necessary to determinate characteristics such as amplitudes and experimental times of the acoustic contributions. However, the time analysis is not enough to know the frequency components of the acoustic contributions. The acoustic signal is a discrete sequence with a quasi-periodicity pattern. In order to find the frequencies the Fast Fourier Transform (FFT) algorithm is applied [3,49,50].
The plots presented in Figure 6 illustrate the frequency components of the time-domain acoustic signal recorded during the vertical and inclined silo discharge process for Silica Sand II with and . The resulting spectra highlight the acoustic complexity and richness of the phenomenon. Given the sampling frequency , the identifiable frequency range is limited to between 20 Hz and 50 Hz. Within this range, it is possible to distinguish fundamental frequencies, harmonics, and dominant frequency (Fd) components. For plots in Figure 6, the vertical silo’s Fd = 29.05 Hz; the inclined silo () with the same material has an Fd of 47.65 Hz.
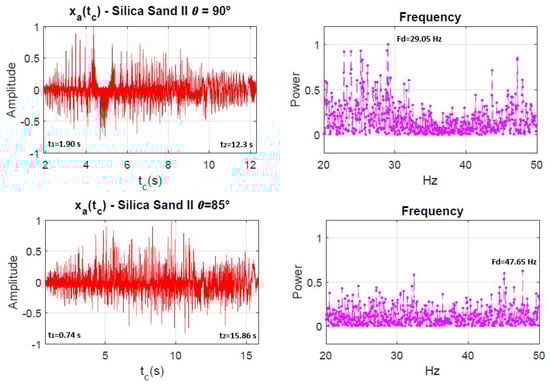
Figure 6.
Left column: Signals of the acoustic contributions in time. Right column: Power spectra showing the low frequency components of .
The frequency-domain analysis allowed us to identify the dominant frequencies present in each acoustic contribution during the silo discharge process for both vertical and inclined configurations. As shown in Figure 7, the behaviour of the dominant frequencies is examined with respect to the inclination angle of the silo. The results indicate a notable proximity among the dominant frequencies across different inclination cases. The experimentally measured dominant frequencies are found within the interval .
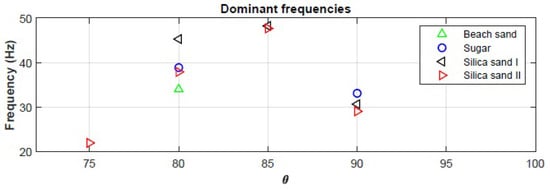
Figure 7.
Main dominant frequency values of the acoustic contributions during the silo music phenomenon for four granular materials.
Dominant frequencies are defined only for the inclined and vertical silo discharge processes in which acoustic contributions are present. As illustrated in Figure 7, dominant frequencies are absent in certain experimental cases involving Sugar and Beach Sand, as well as in some instances with Silica Sand I. In these cases, it is not possible to calculate meaningful frequency values due to the presence of a prolonged hiss sound during the discharge process. This hiss resembles white noise. White noise is characterised by a flat frequency spectrum, meaning it contains all frequencies within a certain range with equal power or intensity, as shown in Figure 8. For this reason, the data and corresponding plots from these specific experiments are considered not relevant for the frequency analysis. Relevant results are those obtained from experiments exhibiting non-flat frequency spectra. Figure 6, Figure A1, and Figure A2 present the experiments deemed significant for the purposes of this work.
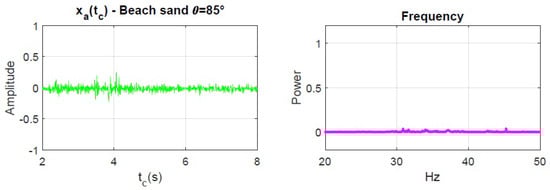
Figure 8.
Left: Signal with no acoustic contributions in time. Right: Flat spectrum of the discharge noise.
4. Critical Height
The mass flow rate of granular materials, which is associated with the bottom outflow due to gravity, through circular orifices of diameter D in vertical silos is given by the expression
where is the bulk density and g is the gravitational acceleration. To survey the effect of the silo angle inclination on , its component must be considered as
The validity of Equation (3) is guaranteed by the following condition: D > ([22,23,27]). By knowing the value of , it is possible to find the discharge velocity of the granular material through the bottom orifice D ([2,51]) by applying the following expression:
where A corresponds to the area of the silo outlet with diameter D [52]. These simple expressions provide relevant information about the behaviour of granular materials flowing through the bottom outlet of a silo. For the granular materials described in Section 2.2, we can compute numerical values for Equations (3) and (4) to observe the behaviour of and under the influence of the gravity component due to . It is important to note, that an improved expression for mass flow can be considered in inclined hoppers with variable open exit holes [53].
In Figure 9(left), for every granular material, the maximum value of is for the vertical silo. When the silo is inclined and approaches , the value of also decreases. In addition, consulting the values for in Table 2, a low value of implies a low value of , as it is observed for Sugar. Meanwhile, Silica Sand I and Beach Sand behave similarly due to their similar value. The value of for Silica Sand II is the highest. In the plot of Figure 9(right), different values for are observed. As a simple conclusion, has the higher values for a silo oriented vertically. Under the effect of , the values of decrease according to the decrease in .
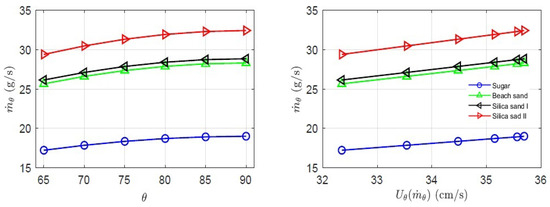
Figure 9.
Left: Values of for granular materials described in Table 2 with reference of the inclination angle . Right: Values of and its relation with .
The critical height, , is defined as the region within the silo where acoustic contributions occur. An experimental methodology for identifying this region involves video and image analysis. While there is no doubt regarding the effectiveness of these techniques, they require a significant amount of time to produce the necessary results. A faster alternative for estimating critical heights involves the use of empirical expressions based on the mass flow rate , discharge velocity , and the time markers and . We propose some empirical expressions for the rapid estimation of critical heights. This approach is based on the characteristics of the acoustic time-domain signals acquired during the silo discharge phenomenon and classical signal processing analysis [3,49,50,54].
The length of the critical height is determined as the difference , where represents the height at which the acoustic contributions of the silo music begin, and corresponds to the height at which these contributions end. and are obtained by
The silo music phenomenon does not occur throughout the entire discharge process of duration t. According to the methodology described in Section 3, the value of the critical time can be readily determined (see Table A1). In Equation (5), is an empirical constant determined by the authors in the analysis process of the time series. Table 3 presents the values for and .
Table 3.
Critical times and critical heights of relevant experiments.
5. Discussion
Experiments demonstrated the generation of acoustic emissions during discharge flows in both vertical and inclined silos using four different granular materials. The granular material Silica Sand II consistently exhibited acoustic contributions across different values of . From the spectra of Silica Sand II (see Figure 6 and Appendix A), frequency contributions associated with silo music can be observed between 20 Hz and 50 Hz. The dominant frequency (Fd) is identified as the component exhibiting the maximum amplitude. Although these dominant frequencies are plotted in Figure 7, no significant conclusions can be drawn from this analysis alone. The spectra display a large number of harmonics and do not provide sufficient information regarding the relationship between the acoustic phenomenon and the granular material. Nonetheless, a direct relationship is hypothesised between the acoustic emissions, the grain flow through the silo outlet, and the physical characteristics of the grains.
Figure 10(left) presents the relationship between the spectra of Silica Sand II and both the mass flow rate and discharge velocity as functions of . As previously noted, the spectra exhibit a large number of components, even at low frequencies. To facilitate the analysis, the amplitude values of the spectra were normalised, allowing for the identification of relevant harmonics based on an imposed threshold value.
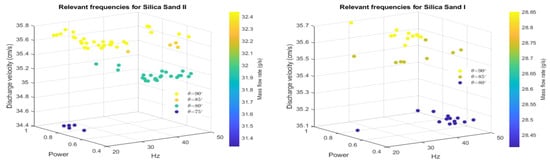
Figure 10.
Relevant frequencies (harmonics) of the silo music phenomenon and its relation with rate and . Left: Silica sand II. Right: Silica Sand I.
Relevant harmonics are defined as those with amplitudes exceeding a threshold value of 0.5. In Figure 10(left), yellow dots represent the harmonics associated with the acoustic contributions during vertical discharge. As observed, a significant number of low-frequency components are present between 20 Hz and 33 Hz, with fewer harmonics appearing near 50 Hz. Orange dots correspond to the significant harmonics for the inclined silo at , where the components are concentrated around 50 Hz, and virtually no harmonics with amplitudes greater than 0.5 are detected below 40 Hz. Cyan dots represent the harmonics for the inclined silo at , a case that contrasts with the vertical discharge: the relevant components are distributed between 35 Hz and 50 Hz, indicating an attenuation of lower-frequency components. Finally, blue dots highlight that low-frequency components near the auditory threshold are amplified for an inclined angle .
Silica Sand I consistently generated acoustic contributions across the experimental set. Similar observations and remarks apply to this granular material, with the exception of the experiments conducted with the inclined silo at . Yellow dots represent the frequency components associated with the vertical discharge. Blue dots correspond to the acoustic components for the inclined silo at . Sage green dots illustrate the components distributed between 20 Hz and 50 Hz for the inclined silo at . Figure 11 illustrates this reasoning more clearly.
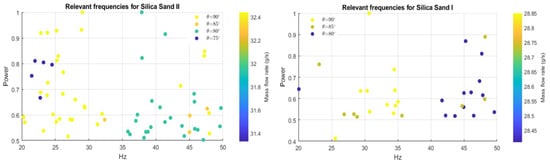
Figure 11.
Harmonic distribution of the silo music phenomenon and its relation with . Left: Silica Sand II. Right: Silica Sand I.
In Figure 10 (left: Silica Sand II), the colour bar represents the mass flow rate () calculated using Expression (3), while the z-axis shows the discharge velocity () values. From Figure 9, it can be observed that both and reach their highest values during discharge from the vertical silo. This indicates that, in the case of vertical silo discharge—which corresponds to the highest mass flow rate and discharge velocity among the set of experiments—the phenomenon promotes the appearance of frequency components near 20 Hz in the acoustic contributions. When the silo is tilted according to the imposed value of , both and decrease, leading to an increase in the discharge time , as shown in Table A1. The graph also shows that during the inclined silo discharge, when acoustic waves are generated, some low-frequency components with a higher amplitude appear close to 20 Hz (). In other cases (), these components shift away from this value. A similar behaviour is observed for Silica Sand I.
As a result, it is evident that the frequency components associated with the silo music phenomenon are attenuated as the mass flow rate and discharge velocity decrease, in accordance with a discharge process that depends on . When approaches , the flow ceases; consequently, no acoustic components are generated. A notable observation can be made regarding the values of and (Table A1). Similar to the behaviour observed for , it would be expected that and increase. However, experimental results show that the critical times and heights exhibit arbitrary values. This highlights the complexity involved in the analysis of the silo music phenomenon through frequency analysis.
6. Conclusions
This study confirms the existence and characteristics of the “silo music” phenomenon during granular discharge, not only in vertical silos but also in inclined ones. Through systematic experimental analysis using four different granular materials and a range of inclination angles, it was demonstrated that low-frequency acoustic emissions—particularly between 20 Hz and 50 Hz—are consistently generated under specific flow conditions. The results reveal that these acoustic signals are strongly influenced by the discharge velocity and mass flow rate, both of which vary with the inclination angle () and the physical properties of the granular media. Silica Sand II, in particular, exhibited the most robust acoustic signatures, attributed to its high bulk density, low repose angle, and small particle diameter.
Frequency-domain analysis showed that decreasing the inclination angle attenuates the acoustic components and shifts the dominant frequencies, while time-domain measurements enabled a quantitative estimation of the critical heights associated with acoustic activity. The proposed empirical relations for discharge velocity, critical height, and critical time were validated through close agreement with experimental observations.
Overall, this study provides new insights into the acoustic behavior of granular flows during inclined silo discharge. The findings have implications for silo design, noise mitigation strategies, and the broader understanding of frictional instabilities in confined granular systems. Future work should focus on developing predictive models that integrate Janssen-based stress distributions with nonlinear wave propagation theories to fully characterize the complex nature of acoustic emissions in inclined silos.
Author Contributions
Conceptualization, J.R.H.-J. and D.A.S.H.; methodology, J.R.H.-J. and A.M.; validation, A.M., A.L.-V. and D.A.S.H.; formal analysis, J.R.H.-J., A.L.-V. and D.A.S.H.; investigation, J.R.H.-J., D.A.S.H. and A.M.; resources, J.R.H.-J.; data curation, J.R.H.-J. and D.A.S.H.; writing—original draft preparation, D.A.S.H.; writing—review and editing, J.R.H.-J., D.A.S.H. and A.M.; visualization, J.R.H.-J., A.L.-V. and D.A.S.H.; supervision, A.M.; project administration, A.L.-V.; funding acquisition, A.L.-V. and D.A.S.H.; All authors have read and agreed to the published version of the manuscript.
Funding
This research received no external funding.
Institutional Review Board Statement
Not applicable.
Informed Consent Statement
Not applicable.
Data Availability Statement
The data presented in this study can be made available from the corresponding author upon request. The data are not publicly available as we do not have a publicly accessible repository.
Acknowledgments
The authors would like to thank the Instituto Politécnico Nacional (IPN) and the Tecnológico Nacional de México (TecNM) for their institutional support in carrying out this work. In particular, we acknowledge the use of experimental infrastructure and the academic backing provided by both institutions. This study would not have been possible without their strong commitment to scientific and technological research.
Conflicts of Interest
The authors declare no conflicts of interest.
Appendix A. Time Signals and Spectra
In this section, plots of the acoustic contributions over time for the relevant discharge processes of the silo with different values of and various granular materials are presented. Analysis of these signals yields the values of and (right column). Frequency spectra displaying the fundamental frequencies are obtained using the FFT algorithm (left column).
Previous plots show the behaviour of the acoustic contributions of the silo music phenomenon in the time domain and frequency domain. The appearance of the acoustic contributions are not given for all granular materials, including all values of for the inclined silo. The interval of values was established as ≤ ≤ . However, during the experiment, when , and was being approached, no silo music phenomenon was present, and the time signals and spectra formed as shown in Figure 8. Consequently, relevant results for the silo music phenomenon for vertical and inclined silos filled with different granular materials were present for = , , , and . For = , the silo music phenomenon was present during the silo discharge process for Silica Sand II, Silica Sand I and Sugar. For the tilted silo at = , the silo music phenomenon was present during the discharge of Silica Sand I and Silica Sand II. The silo music phenomenon was present for the silo discharge process of Silica Sand II, Silica Sand I and Sugar for = , as in the case for = .
However, particular attention must be paid to the appearance of acoustic contributions for the discharge of Beach Sand. This result is included due to the fact that it was an atypical behaviour in the set of experiments for this angle of inclination. For this specific case, the acoustic contributions of the silo music phenomenon were present in the second half of the total duration time of the discharge process.
Finally, for the silo discharge process at = , only Silica Sand II showed acoustic contributions. More experiments were conducted for = , , and ; however, no silo music phenomenon was seen. Relevant numerical results were obtained with a single treatment of the recorded signals by applying signal processing.
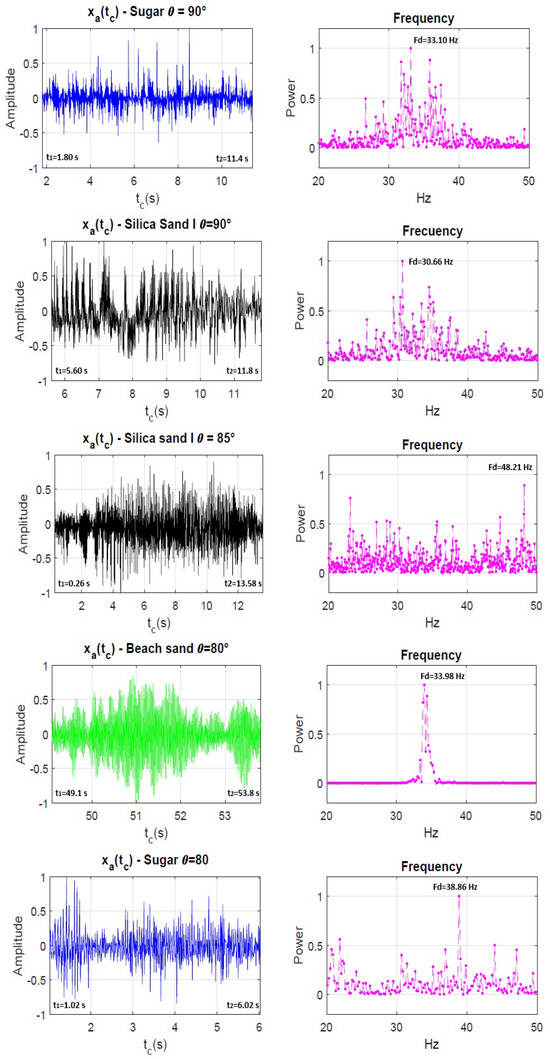
Figure A1.
Left column: Signals of the acoustic contributions in time. Right column: Power spectra showing the low frequency components of .
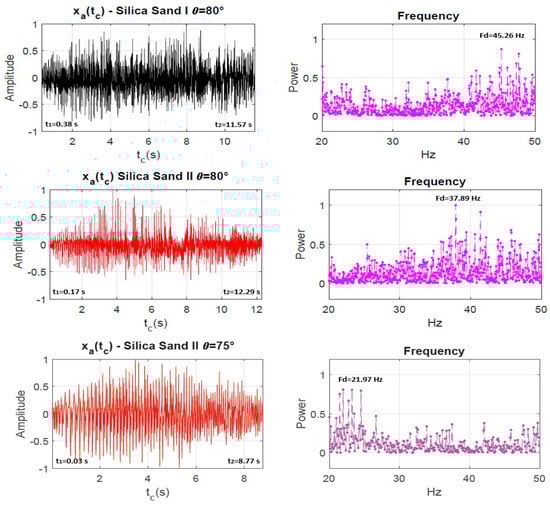
Figure A2.
Left column: Signals of the acoustic contributions in time. Right column: Power spectra showing the low frequency components of .
Appendix B. Some Notations
Table A1 presents the values of various experimental parameters. The variable denotes the total discharge time for the vertical and inclined silo experiments. and correspond to the onset and conclusion times of the acoustic contributions recorded during each experiment. and represent the heights at which the silo music phenomenon is observed, calculated according to Expression (5). The values of , , and are determined from the raw acoustic time signals associated with the phenomenon.
Table A1.
Values of times and heights for the silo discharge process at different values of .
Table A1.
Values of times and heights for the silo discharge process at different values of .
| Granular Material | (s) | (s) | (s) | (cm) | (cm) |
|---|---|---|---|---|---|
| 75.02 | 1.80 | 11.4 | 43.42 | 37.71 | |
| 74.46 | 5.60 | 11.8 | 41.16 | 37.48 | |
| 75.01 | 1.90 | 12.3 | 43.36 | 37.18 | |
| 75.23 | 0.26 | 13.58 | 44.34 | 36.45 | |
| 75.35 | 0.74 | 15.86 | 44.06 | 35.10 | |
| * | 75.70 | 49.1 | 53.8 | 15.73 | 12.98 |
| 76.09 | 1.02 | 6.02 | 43.90 | 40.97 | |
| 76.14 | 0.38 | 11.57 | 44.27 | 37.72 | |
| 76.15 | 0.17 | 12.29 | 44.40 | 37.30 | |
| 77.62 | 0.03 | 8.77 | 44.48 | 39.46 |
* See Appendix A.
Appendix C. Estimated Times
The trustworthiness and accuracy of Expression (2) is guaranteed due to the fact that the value of can be recovered by the following expression:
where is the estimated time, whose numerical value must be . is obtained using (A1). The numerical value of is obtained by the difference = .
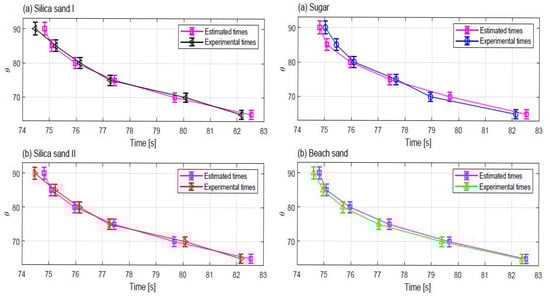
Figure A3.
Right: Comparison of experimental times t with estimated times for vertical and tilted silo discharge process for (a) Silica Sand I and (b) Silica sand II. Left: Comparison of experimental times t with estimated times for vertical and tilted silo discharge process for (a) Sugar and (b) Beach sand materials.
In Figure A3, it can be observed the closeness of the estimated times and experimental times t. These results prove the validity of the empirical relations proposed in this work.
References
- Schulze, D. Powders and Bulk Solids: Behavior, Characterization, Storage and Flow; Springer: Berlin/Heidelberg, Germany, 2008. [Google Scholar]
- Bonneau, L.; Catelin-Jullien, T.; Andreotti, B. Friction-induced amplification of acoustic waves in a low Mach number granular flow. Phys. Rev. E 2010, 82, 011309. [Google Scholar] [CrossRef] [PubMed]
- Buick, J.M.; Chavez-Sagarnaga, J.; Zhong, Z.; Ooi, J.Y.; Pankaj; Campbell, D.M.; Greated, C.A. Investigation of silo Honking: Slip-Stick excitation and wall vibration. J. Eng. Mech. 2005, 131, 299–307. [Google Scholar] [CrossRef]
- Dhoriyani, M.L.; Jonnalagadda, K.K.; Kikatla, R.K.; Kesava Rao, K. Silo music: Sound emission during the flow of granular materials through tubes. Powder Technol. 2006, 167, 55–71. [Google Scholar] [CrossRef]
- Muite, B.K.; Quinn, S.F.; Sundaresan, S.; Kesava Rao, K. Silo music and silo quake: Granular flow-induced vibration. Powder Technol. 2004, 145, 190–202. [Google Scholar] [CrossRef]
- Niedostatkiewicz, M.; Tejchman, J. Experimental and theoretical studies of resonance effects during confined flow in silos. TASK Q. 2003, 7, 595–610. [Google Scholar]
- Warburton, K.; Porte, E.; Vriend, N. Slip-stick excitation and travelling waves excite silo honking. EPJ Web Conf. 2017, 140, 10009. [Google Scholar] [CrossRef]
- Wilde, K.; Rucka, M.; Tejchman, J. Silo music—Mechanism of dynamic flow and structure interaction. Powder Technol. 2008, 186, 113–129. [Google Scholar] [CrossRef]
- Wilde, K.; Tejchman, J.; Rucka, M.; Niedostatkiewicz, M. Experimental and theoretical investigations of silo music. Powder Technol. 2010, 198, 38–48. [Google Scholar] [CrossRef]
- Hernández-Juárez, J.R.; Serrano, D.A.; López-Villa, A.; Medina, A. Acoustic radiation patterns of the silo music phenomenon. EPJ Web Conf. 2021, 249, 03018. [Google Scholar] [CrossRef]
- Zhang, D.; Liu, L.; Yuan, J.; Zhang, D. Fluctuation of particles during funnel flow discharge from flat-bottomed silos. AIChE J. 2021, 68, e17414. [Google Scholar] [CrossRef]
- Zhang, D.; Lu, Y.; Lv, C.; Liu, L.; Yuan, J. Flow behavior of granular material during funnel and mixed flow discharges: A comparative analysis. Powder Technol. 2022, 396, 127–138. [Google Scholar] [CrossRef]
- Zhang, D.; Lu, Y.; Yuan, J. Why the presence of insert above the outlet can enhance silo discharge: A tentative answer. Powder Technol. 2023, 421, 118384. [Google Scholar] [CrossRef]
- Kamrin, K. Non-locality in Granular Flow: Phenomenology and Modeling Approaches. Front. Phys. 2019, 7, 116. [Google Scholar] [CrossRef]
- Grudzien, K.; Chaniecki, Z.; Romanowski, A.; Niedostatkiewicz, M.; Sankowski, D. ECT Image analysis methods for shear zone measurements during silo discharging process. Chin. J. Chem. Eng. 2012, 20, 337–345. [Google Scholar] [CrossRef]
- Grudzien, K.; Romanowski, A.; Chaniecki, Z.; Niedostatkiewicz, M.; Sankowski, D. Description of the silo flow and bulk solid pulsation detection using ECT. Flow Meas. Instrum. 2010, 21, 198–206. [Google Scholar] [CrossRef]
- Andreotti, B. Sonic sands. Rep. Prog. Phys. 2012, 75, 24. [Google Scholar] [CrossRef]
- Rao, K.K.; Nott, P.R. An Introduction to Granular Flow; Cambridge University Press: Cambridge, UK, 2008. [Google Scholar]
- Aguirre, M.A.; Grande, J.G.; Calvo, A.; Pugnaloni, L.A.; Géminard, J.-C. Granular flow through an aperture: Pressure and flow rate are independent. Phys. Rev. E Stat. Nonlin. Soft. Matter. Phys. 2011, 83, 061305. [Google Scholar] [CrossRef]
- Choi, J.; Kudrolli, A.; Bazant, M.Z. Velocity profile of granular flows inside silos and hoppers. J. Phys. Condens. Matter. 2005, 17, S2533–S2548. [Google Scholar] [CrossRef]
- Maiti, R.; Das, G.; Das, P.K. Granular drainage from a quasi-2D rectangular silo through two orifices symmetrically and asymmetrically placed at the bottom. Phys. Fluids 2017, 29, 103303. [Google Scholar] [CrossRef]
- Mankoc, C.; Janda, A.; Arévalo, R.; Pastor, J.M.; Zuriguel, I.; Garcimartín, A.; Maza, D. The flow rate of granular materials through an orifice. Granul. Matter. 2007, 9, 407–414. [Google Scholar] [CrossRef]
- Medina, A.; Serrano, D.A.; Gutiérrez, G.J. On the mass flow rate from silo with lateral exit holes. Rev. Mex. Fis. 2013, 59, 287–291. [Google Scholar]
- Medina, A.; Cabrera, D.; López-Villa, A.; Pliego, M. Discharge rates of dry granular material from bins with lateral exit holes. Powder Technol. 2014, 253, 470–475. [Google Scholar] [CrossRef]
- Serrano, D.A.; Medina, A.; Chavarria, G.R.; Pliego, M.; Klapp, J. Mass flow rate of granular material flowing from tilted bins. Powder Technol. 2015, 286, 438–443. [Google Scholar] [CrossRef]
- Serrano, D.A.; Ruiz-Chavarria, G.; Pliego, M.; Vargas, C.A. On the validity of the Hagen and Beverloo formulas for grains discharge through thin sidewalls of bins. Rev. Mex. Fis. 2019, 65, 139–147. [Google Scholar] [CrossRef]
- Serrano, D.A.; Sanchez-Silva, F.; Klapp, J.; Medina, A. The Hagen-Beverloo law for outflow of granular solids from holes on side walls. Rev. Mex. Fis. 2015, 61, 207–210. [Google Scholar]
- Beverloo, W.A.; Leniger, H.A.; van de Velde, J. The flow of granular solids through orifices. Chem. Eng. Sci. 1961, 15, 260–269. [Google Scholar] [CrossRef]
- Tighe, B.P.; Sperl, M. Pressure and motion of dry sand: Translation of Hagen’s paper from 1852. Granul. Matter 2007, 9, 141–144. [Google Scholar] [CrossRef]
- Madrid, M.A.; Darias, J.R.; Pugnaloni, L.A. A differential equation for the flow rate during silo discharge: Beyond the Beverloo rule. EPJ Web Conf. 2017, 140, 03041. [Google Scholar] [CrossRef]
- Darias, J.R.; Madrid, M.A.; Pugnaloni, L.A. Differential equation for the flow rate of discharging silos based on energy balance. Phys. Rev. E 2020, 101, 052905. [Google Scholar] [CrossRef]
- Sperl, M. Experiments on corn pressure in silo cells—Translation and comment of Janssen’s paper from 1895. Granul. Matter. 2006, 8, 59–65. [Google Scholar] [CrossRef]
- Walters, J.K. A theoretical analysis of stresses in silos with vertical walls. Chem. Eng. Sci. 1973, 28, 13–21. [Google Scholar] [CrossRef]
- Nedderman, R.M. Statics and Kinematics of Granular Materials; Cambridge University Press: Cambridge, UK, 1992. [Google Scholar]
- Boutreux, T.; Raphaël, E.; de Gennes, P.G. Propagation of a pressure step in a granular material: The role of wall friction. Phys. Rev. E 1997, 55, 5759–5773. [Google Scholar] [CrossRef]
- de Gennes, P.G. Granular matter: A tentative view. Rev. Mod. Phys. 1999, 71, S374–S382. [Google Scholar] [CrossRef]
- Andreotti, B.; Forterre, Y.; Pouliquen, O. Granular Media: Between Fluid and Solid; Cambridge University Press: Cambridge, UK, 2013. [Google Scholar]
- Wang, X.; Lianga, C.; Guoa, X.; Chen, Y.; Liua, D.; Ma, J.; Chen, X.; An, H. Experimental study on the dynamic characteristics of wall normal stresses during silo discharge. Powder Technol. 2020, 363, 509–518. [Google Scholar] [CrossRef]
- Dyck, G.; Rogers, A.; Paliwal, J. A Review of Analytical Methods for Calculating Static Pressures in Bulk Solids Storage Structures. KONA Powder Part J. 2024, 41, 108–122. [Google Scholar] [CrossRef]
- Balmer, R.T. The Operation of Sand Clocks and Their Medieval Development. Tech. and Cult. 1978, 19, 615–632. [Google Scholar] [CrossRef]
- Sack, A.; Pöschel, T. Weight of an hourglass–Theory and experiment in quantitative comparison. Am. J. Phys. 2017, 85, 98–107. [Google Scholar] [CrossRef]
- Pongó, T.; Stiga, V.; Török, J.; Lévay, S.; Szabo, B.; Stannarius, R.; Cruz Hidalgo, R.; Börzsönyi. Flow in an hourglass: Particle friction and stiffness matter. New J. Phys. 2021, 23, 023001. [Google Scholar] [CrossRef]
- Yang, X.; Liu, Z.; Liu, L. DEM investigation on the dynamic characteristics of wall normal stress and particle flow during silo discharge. Powder Technol. 2024; in press. [Google Scholar] [CrossRef]
- Breard, E.C.P.; Dufek, J.; Fullard, L.; Carrara, A. The basal friction coefficient of granular flows with and without excess pore pressure: Implications for pyroclastic density currents, water-rich debris flows, and rock and submarine avalanches. JGR Solid Earth 2020, 125, 22. [Google Scholar] [CrossRef]
- Duran, J. Sands, Powders, and Grains; Springer: New York, NY, USA, 1999. [Google Scholar]
- Goldhirsch, I.; Goldenberg, C. Stress in Dense Granular Materials. In The Physics of Granular Media; WILEY-VCH Verlag GmbH and Co. KGaA: Weinheim, Germany, 2004. [Google Scholar] [CrossRef]
- Wieghardt, K. Experiments in granular flow. Annu. Rev. Fluid Mech. 1975, 7, 89–114. [Google Scholar] [CrossRef]
- Lumay, G.; Boschini, F.; Traina, K.; Bontempi, S.; Remy, J.-C.; Cloots, R.; Vandewalle, N. Measuring the flowing properties of powders and grains. Powder Technol. 2012, 224, 19–27. [Google Scholar] [CrossRef]
- Harcarik, T.; Bocko, J.; Maslakova, K. Frequency Analysis of Acoustic Signal using the Fast Fourier Transformation in MATLAB. Procedia Eng. 2012, 48, 199–204. [Google Scholar] [CrossRef]
- Hernández-Juárez, J.; López-Villa, A.; Serrano, D.A.; Medina, A. Measurement of the sound pressure level during the discharge process of a tilted silo. In Proceedings of the 2017 CHILEAN Conference on Electrical, Electronics Engineering, Information and Communication Technologies (CHILECON), Pucon, Chile, 18–20 October 2017; pp. 1–6. [Google Scholar]
- Zhou, Y.; Lagrée, P.-Y.; Popinet, S.; Ruyer, P.; Aussillous, P. Experiments on, and discrete and continuum simulations of, the discharge of granular media from silos with a lateral orifice. J. Fluid Mech. 2017, 289, 459–485. [Google Scholar] [CrossRef]
- Serrano, D.A.; Sánchez-Silva, F.; Klapp, J.; Tamayo, P.; Medina, A.; Domínguez, G. Trajectories of Water and Sand Jets. In Recent Advances in Fluid Dynamics with Environmental Applications; Environmental Science and Engineering; Springer: Berlin/Heidelberg, Germany, 2016. [Google Scholar] [CrossRef]
- Sheldon, H.G.; Douglas, J.D. Granular discharge and clogging for tilted hoppers. Granul. Matter. 2010, 12, 579–585. [Google Scholar] [CrossRef]
- Howard, I. Vibration signal processing using MATLAB. Acoust. Aust. 1995, 23, 9–13. [Google Scholar]
Disclaimer/Publisher’s Note: The statements, opinions and data contained in all publications are solely those of the individual author(s) and contributor(s) and not of MDPI and/or the editor(s). MDPI and/or the editor(s) disclaim responsibility for any injury to people or property resulting from any ideas, methods, instructions or products referred to in the content. |
© 2025 by the authors. Licensee MDPI, Basel, Switzerland. This article is an open access article distributed under the terms and conditions of the Creative Commons Attribution (CC BY) license (https://creativecommons.org/licenses/by/4.0/).