Abstract
Grains stored in silos and pellets for injection molding deteriorate in quality due to increased moisture in the particles when exposed to air for a long period of time, so it is necessary to reduce the moisture in the particles through the mixing process. However, few studies have conducted parallel experiments and simulations to understand the behavior of particles depending on their moisture content. In this study, mixing experiments were conducted using superabsorbent polymer (SAP) beads that expand depending on the moisture content, and the interparticle friction coefficient and interface friction coefficient required for simulation were derived. As a result, it was found that moisture generates an adhesive force that causes interparticle cohesion, and as the moisture content increases further, the particles adhere to the vessel wall due to the adhesive force. In addition, particles with high moisture content (e.g., 90%) showed faster mixing behavior similar to dry particles, as indicated by the Lacey Mixing Index (LMI), while low moisture particles (e.g., 60%) showed the slowest mixing. It is expected that the mixing characteristics of particles depending on the moisture content can be understood and will be useful for the design of horizontal shaft mixers.
1. Introduction
Mixing and drying of particles are critical processes in various industrial sectors, including pharmaceuticals, chemicals, and food production. When grains stored in silos and pellets for injection molding are exposed to air and their moisture content rises, not only do grains spoil, but the quality of injection products also deteriorates. Additionally, during the drying process, particles that have absorbed moisture tend to aggregate or adhere to surfaces due to the increased adhesive and cohesive forces unlike their dry counterparts. Therefore, it is essential to undertake research that addresses the influence of moisture during the mixing and drying processes of such particles.
Traditionally, research on the drying processes of small particles has predominantly relied on experimental methods due to the substantial computational demands involved [1]. However, advancements in computing technology have now facilitated the simulation of these processes as well. Discrete element modeling (DEM), a numerical method for analyzing particle behavior, performs calculations that account for the interactions between particles and between particles and surrounding structures. DEM has been employed to study the mixing characteristics of both dry and cohesive particles. M. Halidian et al. examined the impact of liquids by quantifying cohesion using the bond number, which is defined as the ratio of van der Waals forces to particle weight, but did not consider the properties of the liquids [2,3]. P. Y. Liu et al. adjusted the surface tension value when the liquid involved was water to study its effects on the mixing of cohesive particles [4]. Xin, J et al. assessed the mixing index in relation to mixing speed when particles were dry versus when the liquid was water or honey [5,6]. R.R. Zhu et al. utilized the liquid bridge theory to express cohesion and examined the effect of changes in the volume of the liquid contained within particles [7]. Notably, these studies conducted their analysis without accompanying experimental validation. Y. Wang et al. conducted research utilizing both experimental and analytical methods; however, their studies involved the behavior of particles in a rotating drum rather than a conventional mixer, serving primarily to verify analytical accuracy [7,8].
However, the mixing characteristics in a mixer show different aspects depending on the shape of the ribbon blade, making it essential to apply an actual mixer model to conduct experiments and analysis. In this study, assuming the drying process of wet particles, the particle behavior characteristics according to the moisture content were investigated by experiments and analysis. The particle interaction force varied depending on the moisture content, and to quantify this, preliminary experiments were conducted to measure the friction coefficient, and the liquid bridge model was applied in DEM analysis. The changes in particle height and distribution were visually observed on the drying vessel wall. These analysis results were compared with experimental data to confirm the validity of the analysis model and results. In addition, the Lacey Mixing Index (LMI) was calculated for further analysis, which indicates the degree of mixing, and the particle resistance and load of the agitator rotation motor were measured, allowing the effects of moisture content-related mixing characteristics on the mixer to be understood.
2. Materials and Methods
2.1. Experimental Setup and Particle Description
To analyze the particle movement due to moisture content, superabsorbent polymer (SAP) was used in the experiment. As SAP absorbs more moisture, the particles become larger, and the moisture on the particle surface also increases, causing changes in the adhesive and cohesive forces of the particles that affect the particle movement. The experimental device, the horizontal shaft mixer, is shown in Figure 1. Arduino was used as the controller of the device, and the blade rotation speed was set to 15 rpm via a potentiometer. The particle mixing process was implemented by applying double ribbon blades, as shown in Figure 2, and the vessel was made of transparent acrylic material to allow the particle movement to be observed. In the double blades, the outer blade moves the particles to the left and the inner blade moves to the right, which can facilitate particle mixing. Table 1 shows the dimensions of the acrylic vessel and double ribbon blades of the horizontal shaft mixer in detail.
SAPs, Ningbo GoodWell Mechatronics, Ningbo, China, were selected as experimental particles. SAPs are advantageous for maintaining consistent moisture content because they absorb water up to dozens of times their own weight and retain it even under pressure. When the particle size and crosslinking density are uniform, they also exhibit consistent water absorption behavior [9]. Three sizes of SAPs with initial diameters of 1.5, 2, and 2.5 mm were used; these expanded to approximately 4 mm upon water absorption. For comparison purposes with the particles containing moisture, acrylic beads with a diameter of 4 mm in a dry state without moisture were also used.

Table 1.
Geometric parameters in experiment and simulation.
Table 1.
Geometric parameters in experiment and simulation.
| Parameter | Value | Unit |
|---|---|---|
| Vessel diameter, | 109 | mm |
| Vessel length, | 170 | mm |
| Vessel Height, | 150 | mm |
| Blade pitch, | 66 | mm |
| Blade width, | 10.5 | mm |
| Outer ribbon blade diameter, | 104 | mm |
| Inner ribbon blade diameter, | 70 | mm |

Figure 1.
Horizontal shaft mixer equipped with double ribbon blades used in experiments.
Figure 1.
Horizontal shaft mixer equipped with double ribbon blades used in experiments.
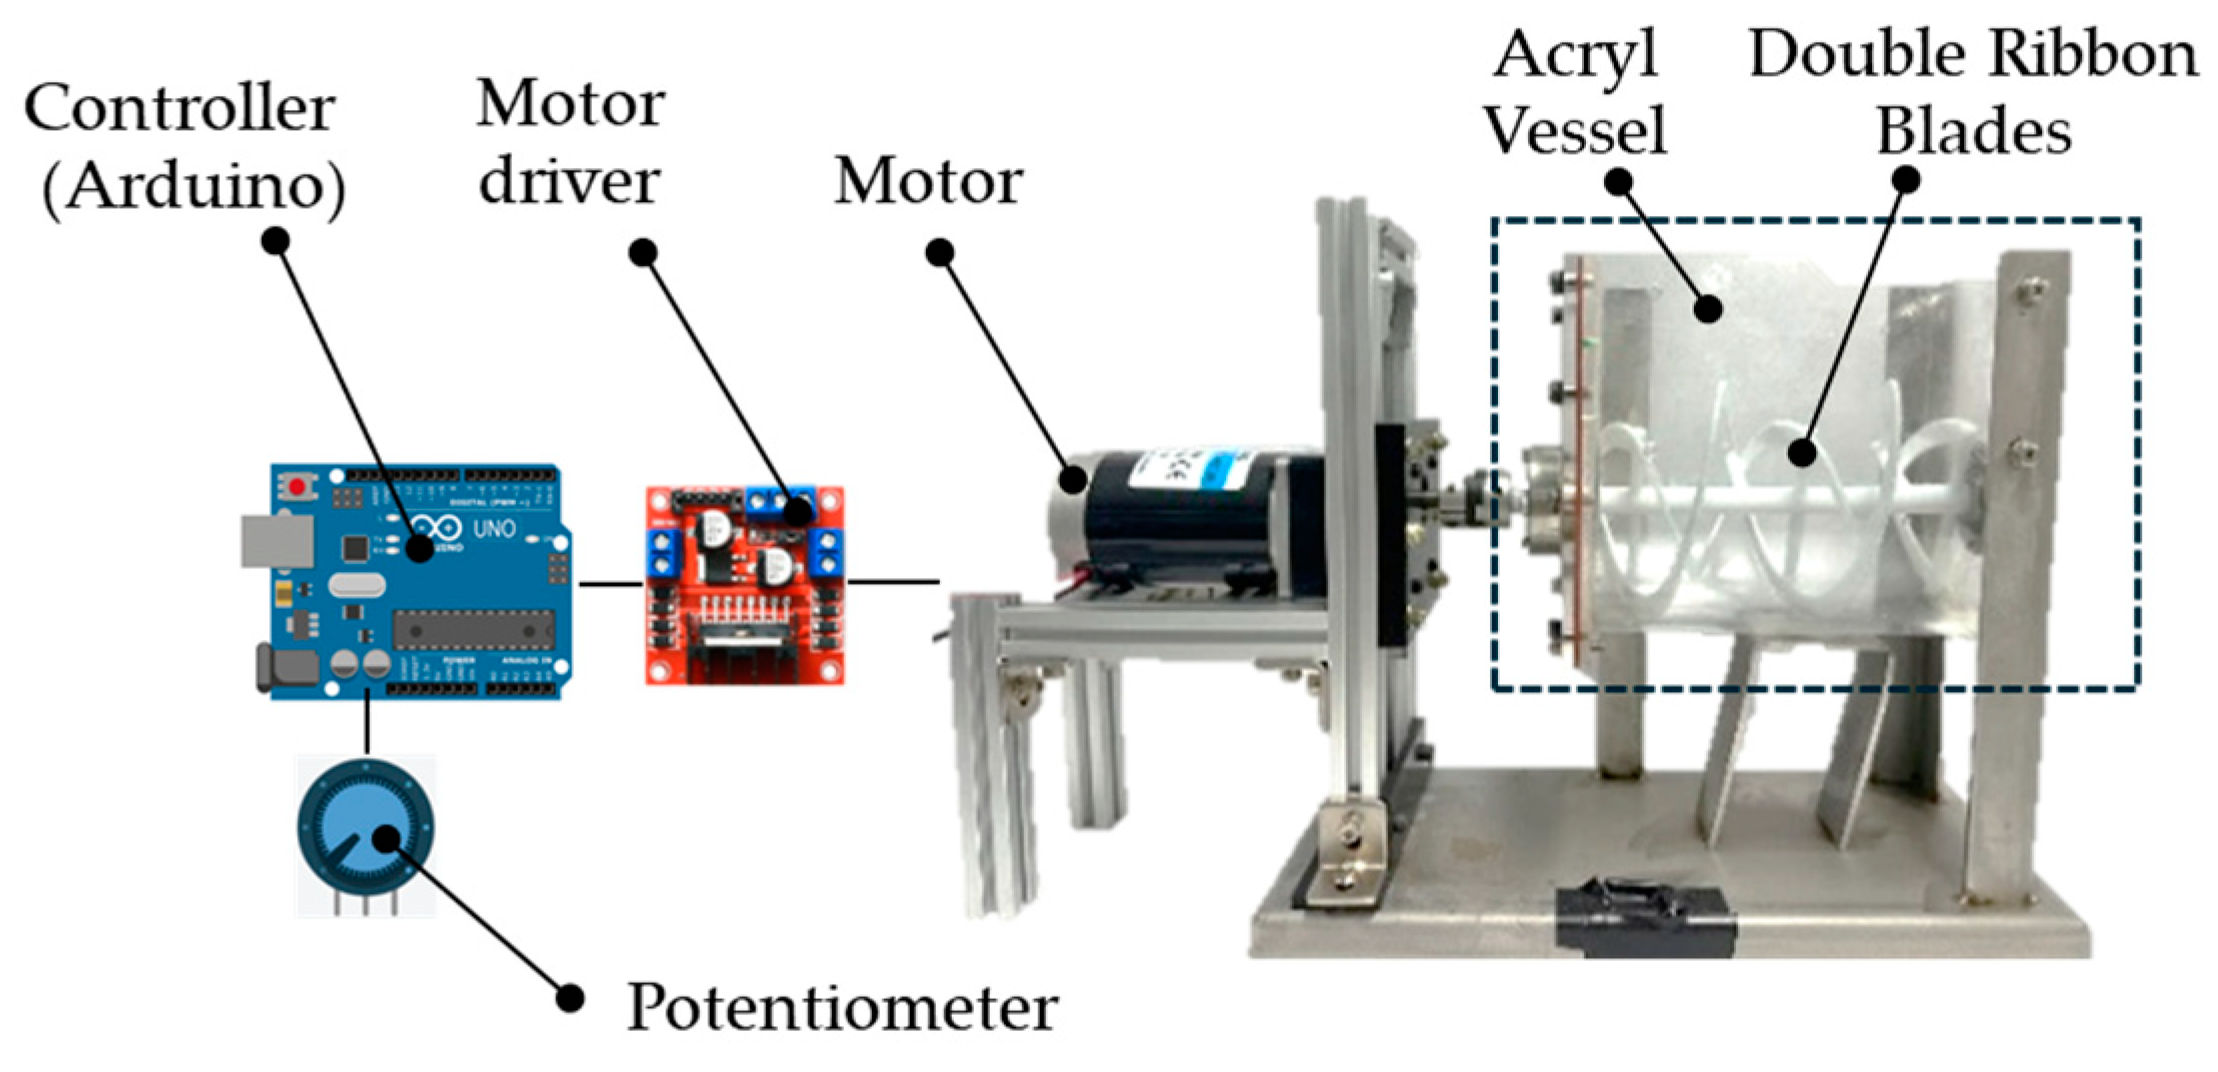
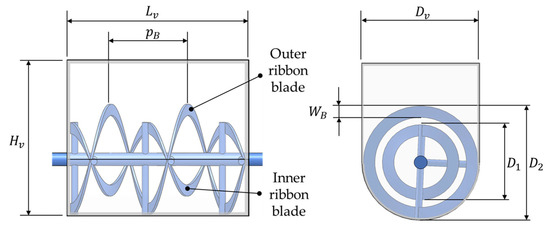
Figure 2.
Geometry configuration of the double ribbon blades and the acryl vessel in a horizontal shaft mixer.
Figure 2.
Geometry configuration of the double ribbon blades and the acryl vessel in a horizontal shaft mixer.
The weight of each SAP in the initial dry state without moisture is represented by, and the weight of moisture absorbed is represented by, . The moisture content ( was calculated using Equation (1).
Additionally, the diameter and standard deviation of each SAP in the initial dry state without moisture are represented by and , and the diameter and standard deviation after absorbing moisture are represented by and . The weight was measured using an electronic balance, and the particle diameter was measured using image processing. As shown in Table 2, SAPs with an initial diameter of 1.5 mm absorb water until they reach a diameter of 4 mm. In experiments and DEM simulations, accurately modeling the interactions between particles is crucial. These interactions are predominantly influenced by the particles’ shape, deformation, and surface condition. Indeed, in wet granular materials, moisture induces capillary cohesion via surface tension and suction (Laplace–Young), increasing the angle of repose (AOR) and yield shear stress at low moisture, while at high moisture the formation of continuous liquid films reduces cohesion and introduces lubrication effects [10]. Therefore, to ensure accurate analysis for SAPs, which follow the same moisture-dependent interfacial physics, it is essential to calibrate the variables by experimentally determining the friction coefficients.
Table 2.
Four types of particles used in the mixing experiment: three types of SAPs particles and acrylic beads.
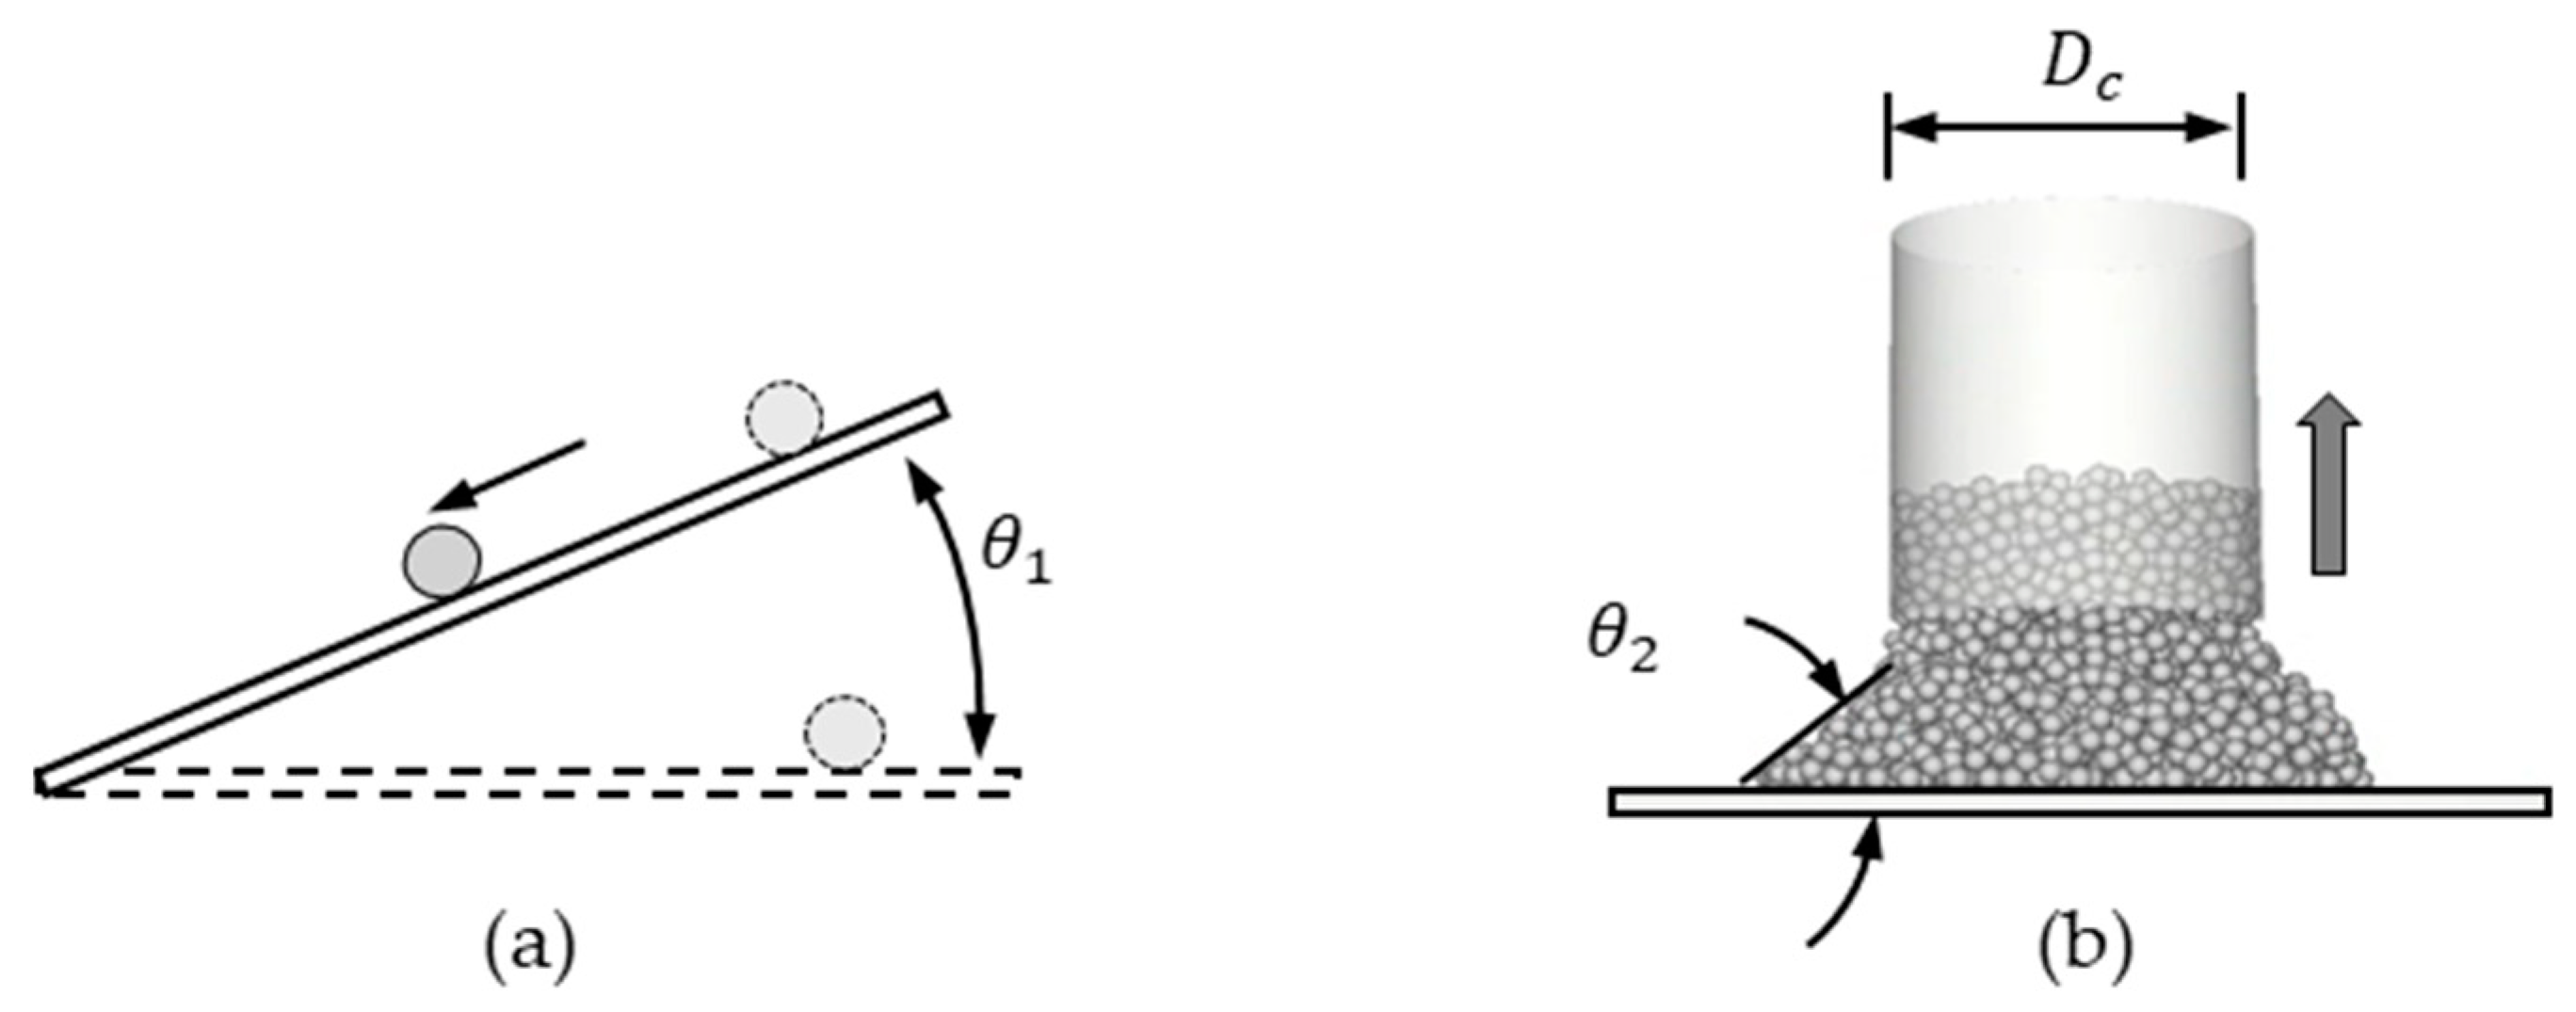
The surface friction coefficient of particles was determined experimentally using an inclined surface setup as depicted in Figure 3a. The slope of the inclined surface was adjusted to initiate particle movement, and the static friction coefficient was measured through the angle of friction (AOF, ), which is the angle at which the particle first begins to move. The friction coefficient between particles was measured using the lifting cylinder method, as illustrated in Figure 3b. This was determined through the AOR (), which represents the stable condition of particles at an optimal angle. The AOR is indicative of the friction between particles and is influenced by their shape and adhesive forces [11,12]. While the diameter of the cylinder () does not affect the AOR, the rising speed does due to the shear effect with the wall. Consequently, the rising speed was set to approximately 10 mm/s, akin to a mixing speed of 15 rpm [13]. Table 3 lists the AOF and AOR values obtained from the experiments. Both and were experimentally determined by measuring the AOF and the AOR, respectively.
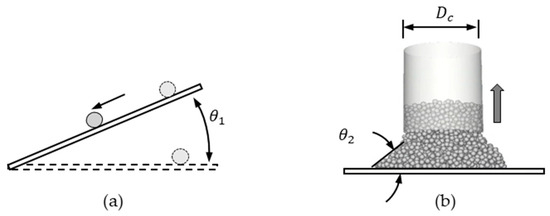
Figure 3.
Sketch for measuring friction coefficient: (a) particle to boundary (b) particle to particle.
Table 3.
Experimentally measured friction coefficients.
2.2. DEM Model
In terms of simulation, DEM adheres to Newton’s second law, as expressed in Equations (2) and (3):
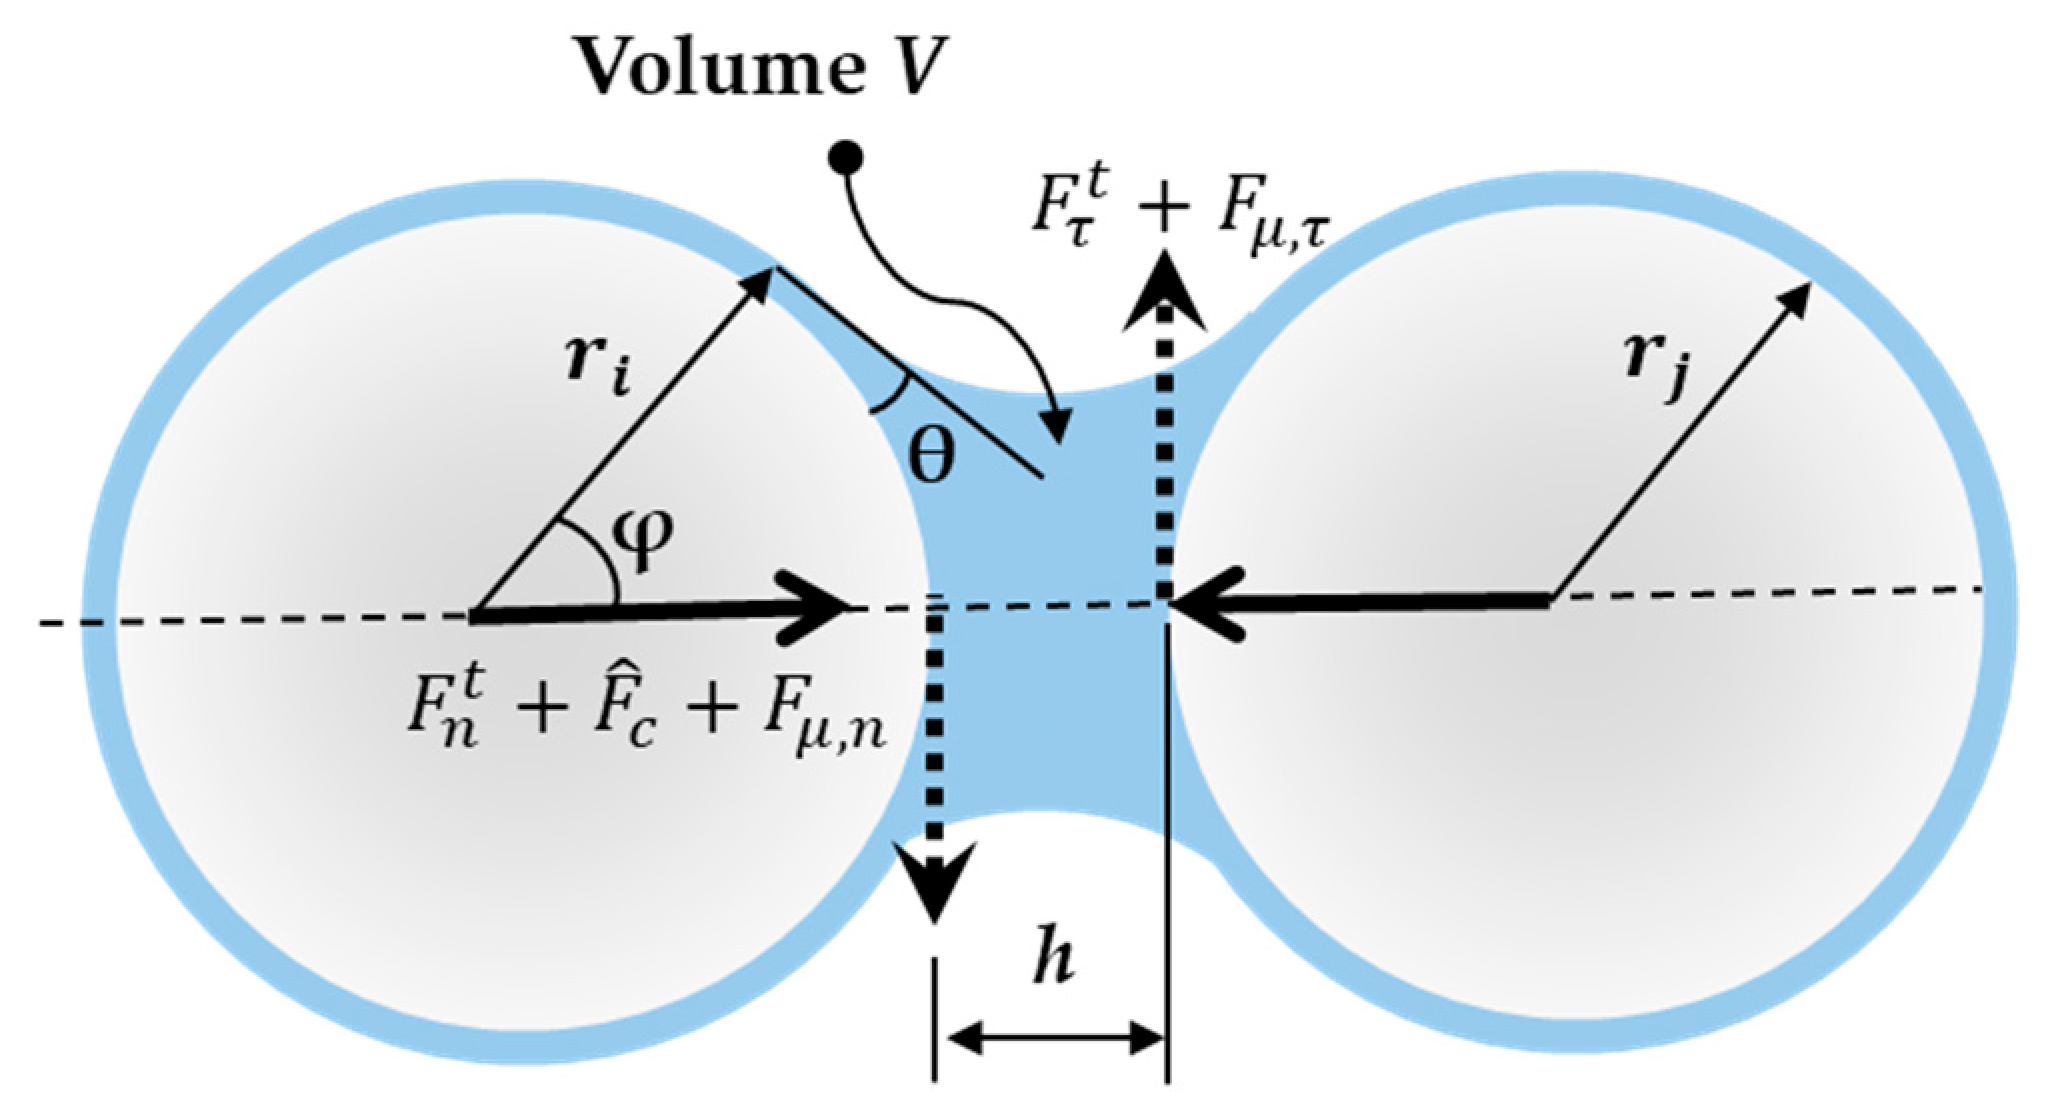
F represents the acting force, M is the acting moment, m denotes the mass of the particle, v is the velocity of the particle, I represents the moment of inertia, ω is the angular velocity, and t denotes time. The net force acting on a particle includes both the body force (gravity) and surface forces (contact force, adhesive and cohesive forces) which occur during the collision process. These forces are essential for accurately predicting the dynamic behavior of the particle. The contact force consists of normal and tangential components, related to the degree of overlap and sliding at the point of contact, respectively. The liquid bridge model was used to describe adhesion and cohesion. This model assumes that capillary force and viscous force are generated by the presence of liquid when the particles are close to each other, forming a virtual liquid film between the particles.
The normal force was calculated using the hysteretic linear spring model, which was proposed by Walton and Braun. This model is capable of simulating changes in energy without being affected by the simulation time [14]. The calculation of the normal force follows Equation (4).
The subscript n represents the normal direction. is the normal force at the time, is the degree of overlap, and and are the contact intensities during loading and unloading, respectively. The parameter λ adjusts the total force to zero when the overlap is reduced to zero. As the degree of overlap increases at the point of contact between particles, the normal force also increases. and are defined by Equation (5), where is the Young’s modulus, is the radius of the particle, and is the restitution coefficient. The restitution coefficient is determined appropriately based on the surface condition of the particles.
The tangential force calculation applied in this study used a linear spring and Coulomb limit model modified from the Hertz–Mindlin contact theory and applied in many DEM analyses [15,16,17]. This model treats the tangential force as an elastic friction force and ensures that it does not exceed Coulomb’s limit. The calculation of this force, incorporating Coulomb’s limit, follows Equation (6).
The subscript τ represents the tangential direction and the subscript e denotes elastic friction. is the tangential force at the time, is the calculated tangential force, is the friction coefficient, is the contact force at the time, and represents Coulomb’s limit. When first exceeds , sliding is assumed to occur. If not, sliding does not occur.
When the particle surface exhibits viscosity or the particle is not perfectly spherical, rolling resistance ( is applied to account for these physical characteristics [18]. Rolling resistance introduces a moment that opposes the rotational motion of the particle, allowing the modeling of non-sphericity or surface irregularities. In this study, is calculated using Equation (7) and is a value dependent on the contact normal force (.
The subscript r represents rolling resistance. is the rolling resistance coefficient, is the particle rolling radius, where is the vector joining the centroid of the particle and the contact point, and is the particle angular velocity vector.
To account for cohesive or adhesive interactions between particles, the liquid bridge model was applied. While this model was originally intended to describe the forces arising from visible liquid films formed between particles, it has also been widely used to represent cohesive behavior under low-moisture conditions where such films are not visibly apparent [19].
Mikami et al. defined the liquid bridge force as the sum of the contact force and the capillary force, which acts only in the normal direction [20]. This force is quantified using the Laplace–Young equation, presented as Equation (8). Through regression analysis, the capillary force can be modeled in terms of the liquid volume and the separation distance, as shown in Equation (9).
The subscript c represents the capillary force. φ denotes the charging angle, θ is the contact angle, is the radius of the particle, is the pressure difference, γ is the surface tension, is the geometric mean radius of the particle, and is h/r, which is the ratio of the separation distance (h) to the radius (r). Coefficients A, B, and C are defined by the volume and contact angle of the liquid, as detailed in Table 4. is equal to , representing the liquid volume in the form of a bridge, where is the product of the liquid volume and the bridge volume fraction (f) determined by the bridge geometry. If the liquid bridge geometry is concave and the liquid volume is modest, this model is appropriate as it mirrors the conditions observed in the actual experimental results [21].
Table 4.
Parameters of capillary force.
The viscous force, derived from the lubrication theory proposed by Nase et al., influences the relative motion between particles [22]. Unlike the capillary force, it includes forces in both the normal and tangential directions and is governed by Equations (10) and (11), respectively.
The coefficient represents the viscosity of the liquid. denotes the equivalent radius, calculated as the sum of the reciprocals of the radii. is the relative velocity, and is the dimensionless relative radius, defined as .
All forces acting on the particles can be represented as shown in Figure 4.
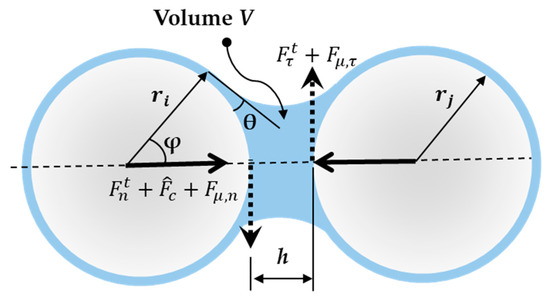
Figure 4.
Representation of normal and tangential forces in particle-to-particle model.
2.3. Mixing Index, LMI (Lacey Mixing Index)
The mixing index, a concept developed by Lacey based on statistical analysis [23], segments the zone into sampling boxes. The index is computed using Equation (12), which relies on the standard deviation, variance, and coefficient of variation of the sampled components.
In analyses utilizing particles of two colors, represents the variance of each color, is the variance observed when the components are completely unmixed, and is the variance when fully mixed. An LMI value closer to zero indicates a separate condition, while a value closer to one signifies complete mixing. Generally, an LMI value of 0.7 or higher is indicative of complete mixing. While the LMI is specifically applicable to particles in two colors, it has shown the highest accuracy for the ribbon blade mixer when compared with other commonly used mixing indices such as those proposed by Lacey, Kramer, Beaudry, and Valentin [24,25].
2.4. Analysis Model
Experiments and analyses targeted a horizontal shaft mixer, using a specially fabricated small mixer, as illustrated in Figure 2. The DEM software program Rocky 2023 R1 was employed for analysis. In DEM simulations, a reduced effective modulus is used to reflect bulk particle behavior. The bulk Young’s modulus is typically 1/10 to 1/1000 of the actual value. Sekizkardes reported a Young’s modulus of 26 ± 2 MPa for SAP [26], and 2.5 MPa (1/10) was used in this study. The properties of the mixing vessel (made of acrylic material) and the particles (SAP) are listed in Table 5. The subscripts p and v represent properties associated with the particle and vessel respectively. The initial volume fill of the particles was approximately 50%, with half of the ribbon blades submerged. During mixing, the rate of mixture in the axial direction was lower than in the vertical direction. Particles were placed horizontally to assess the impact of the blades, which move the particles in both directions [27]. The properties of the liquid, represented by water, are detailed in Table 6.
Table 5.
Dimensional values of material properties.
Table 6.
Properties of the liquid.
3. Results and Discussion
3.1. AOR Test
Given that the liquid bridge model simulates a virtual water film, the weight of water used in computations differs from the actual amount added to the SAP. Therefore, calculations were made under the assumption that while the weight of the liquid film remained constant, the volume forming the liquid bridge varied.
Figure 5 presents the results of the AOR tests and analyses based on parameters from Table 3. As a result of the DEM simulation, the AOR values were measured as 11.3°, 24.3°, and 34.7°, respectively, at 90% (1.5 mm), 80% (2 mm), and 60% (2.5 mm), which was similar to the experimental results.
The differences between the simulation results and the experimental results were all within 15%, showing good quantitative agreement. In the case of the 1.5 mm (90%) particles, the experimental results appeared slightly higher, which is likely due to particle retention on the cylinder wall after contact, leading to an effective increase in the friction coefficient. The detailed factor values are provided in Table 7. Notably, dry acrylic beads exhibited the smallest AOR as depicted in Figure 5d. This is attributed to the nature of SAP, which as it absorbs more water, approaches a saturated state, thereby reducing the adhesive force between the particles.
Table 7.
Dimensional values of simulation parameters in the DEM model for each particle.
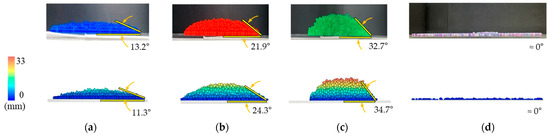
Figure 5.
Angle of repose (AOR) test—Experimental and analytical results for each particle: (a) 90% (1.5 mm), (b) 80% (2 mm), (c) 60% (2.5 mm), and (d) dry (4 mm).
Figure 5.
Angle of repose (AOR) test—Experimental and analytical results for each particle: (a) 90% (1.5 mm), (b) 80% (2 mm), (c) 60% (2.5 mm), and (d) dry (4 mm).

3.2. Mixing Test
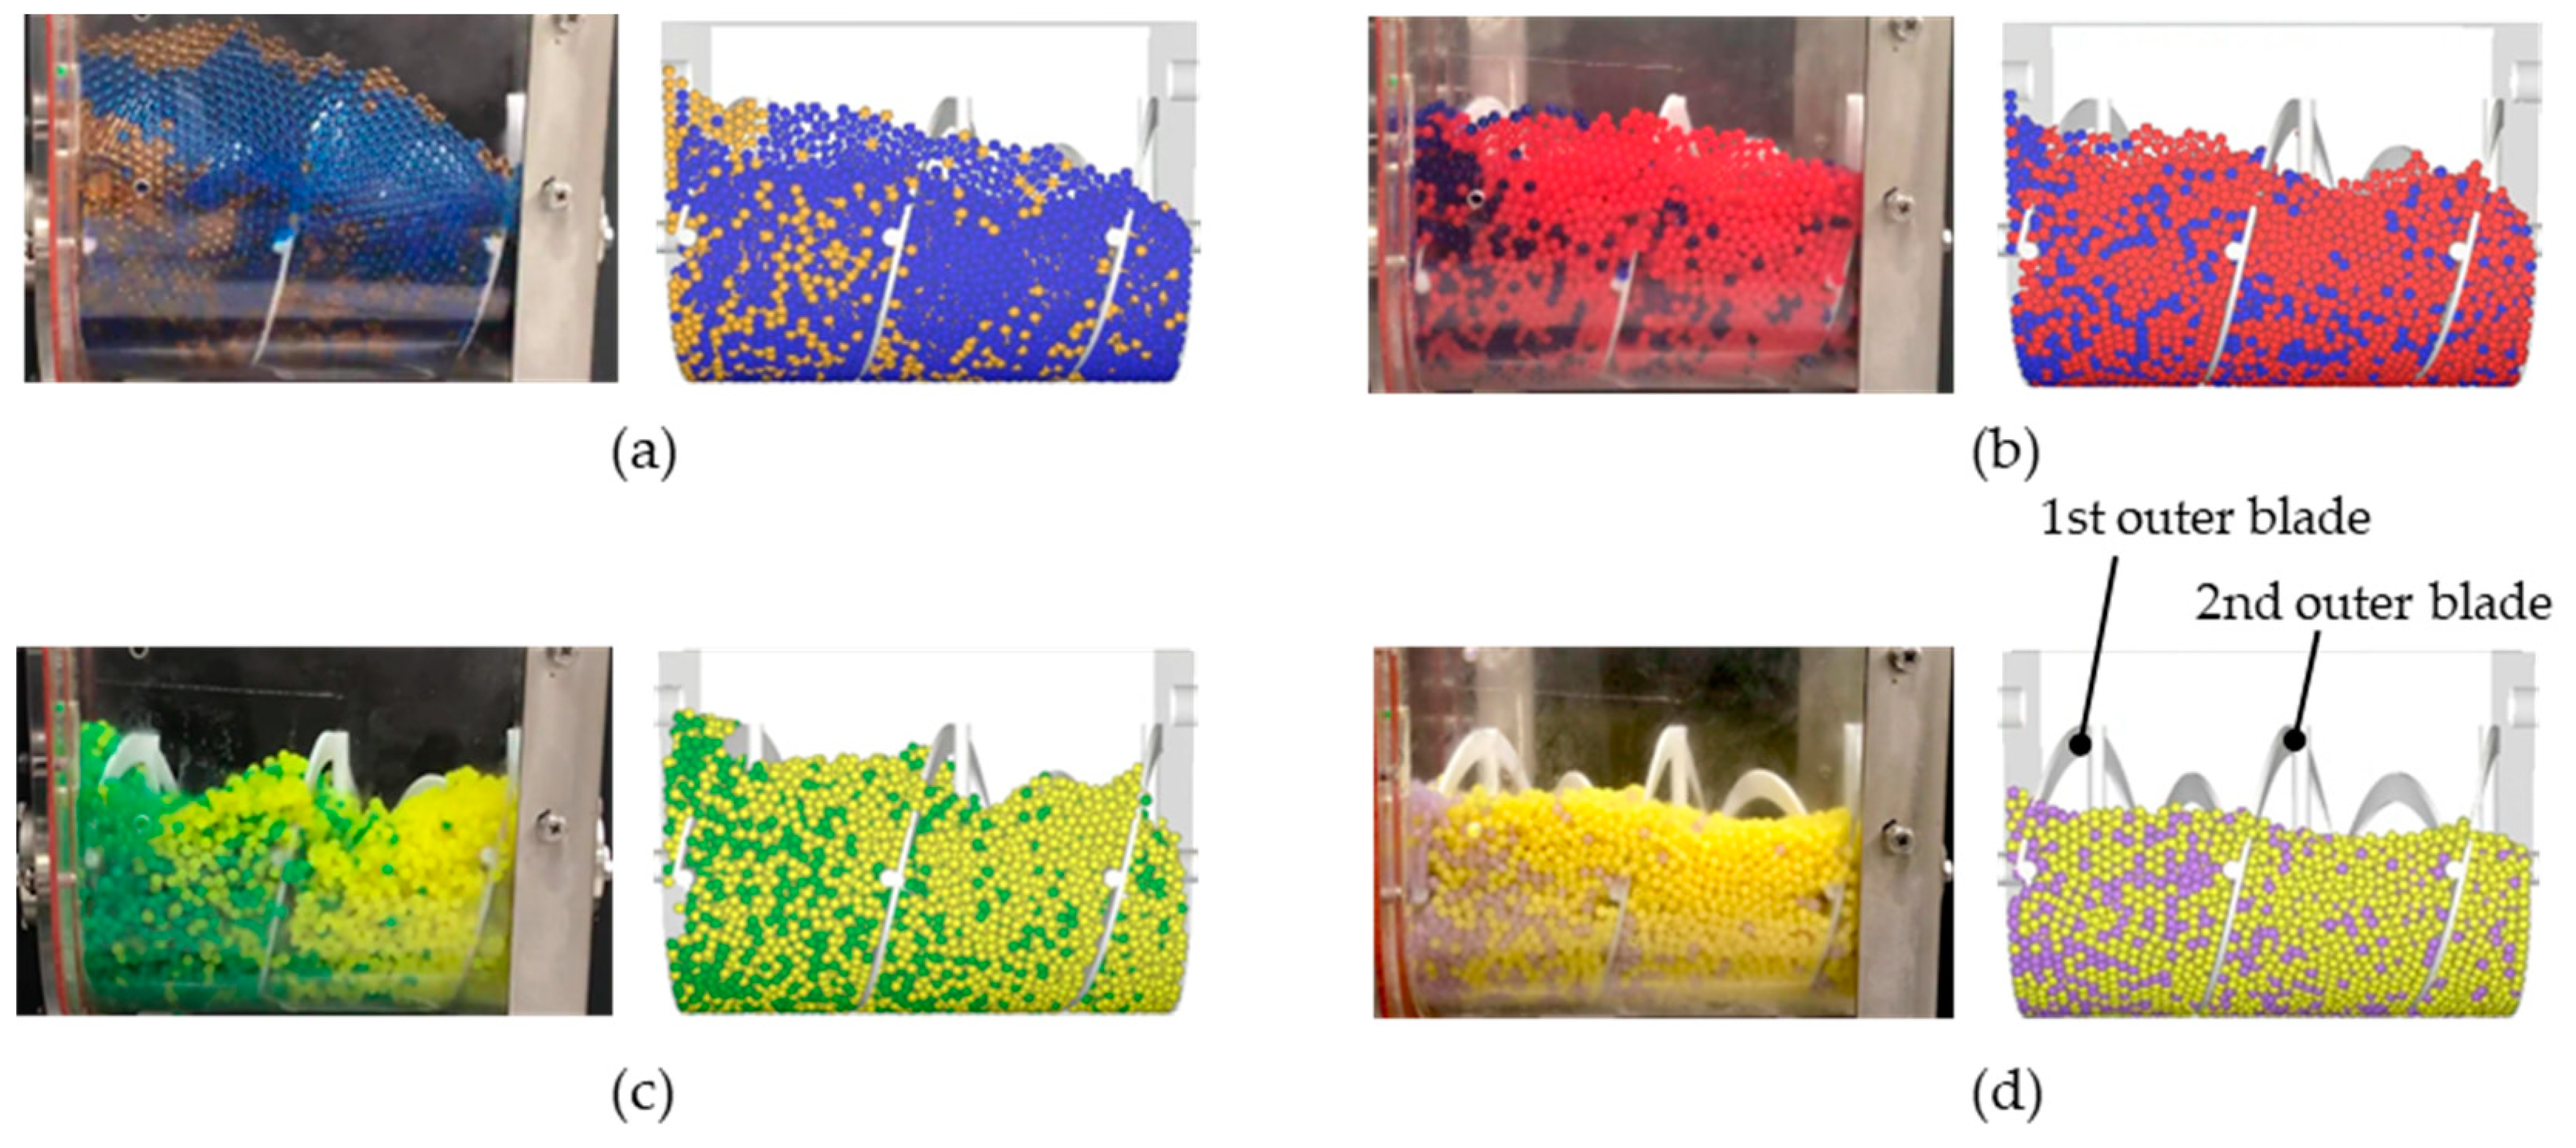
To investigate the mixing characteristics of particles that vary with moisture content, experiments were conducted using approximately 15,000 particles. Figure 6 shows the particle distribution on the side view of the mixer, and, as can be seen in Figure 6a, particles with the highest moisture content of 90% (1.5 mm) are stacked along the side wall. This is the result of liquid bridge formation due to sufficient moisture [10]. On the other hand, as the moisture content decreases, unfavorable conditions for liquid bridge formation occur, and the particles tend not to distribute along the wall.
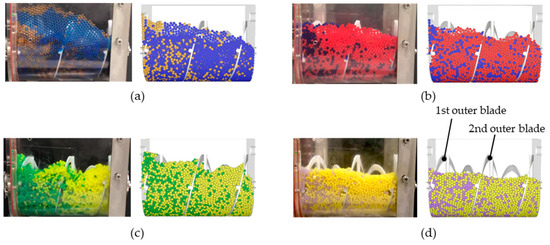
Figure 6.
Particle mixing experiments and analysis results at the front of the mixing tub after the fourth revolution: (a) 90% (1.5 mm), (b) 80% (2 mm), (c) 60% (2.5 mm), and (d) dry (4 mm).
Figure 7 shows the particle distribution when looking at the cross-section view of the vessel from the middle point of the mixer. In the case of 60% (2.5 mm), which has low moisture content, particles are distributed inner side of the vessel than on the sidewall, and as moisture content increases, particles are distributed on the sidewall of the vessel. In addition, in the cases of dry (4 mm) and 90% (1.5 mm), particles are evenly distributed across the vessel cross-section. However, in the cases of 60% (2.5 mm) and 80% (2 mm), particles are distributed in clusters around the rotation axis of the blade, which can be seen as a result of applying a large friction coefficient, as shown in Table 3.
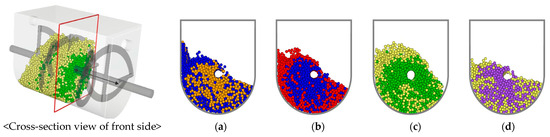
Figure 7.
Particle distribution at the cross-section view of the vessel from the middle point of the mixer: (a) 90% (1.5 mm), (b) 80% (2 mm), (c) 60% (2.5 mm), and (d) dry (4 mm).
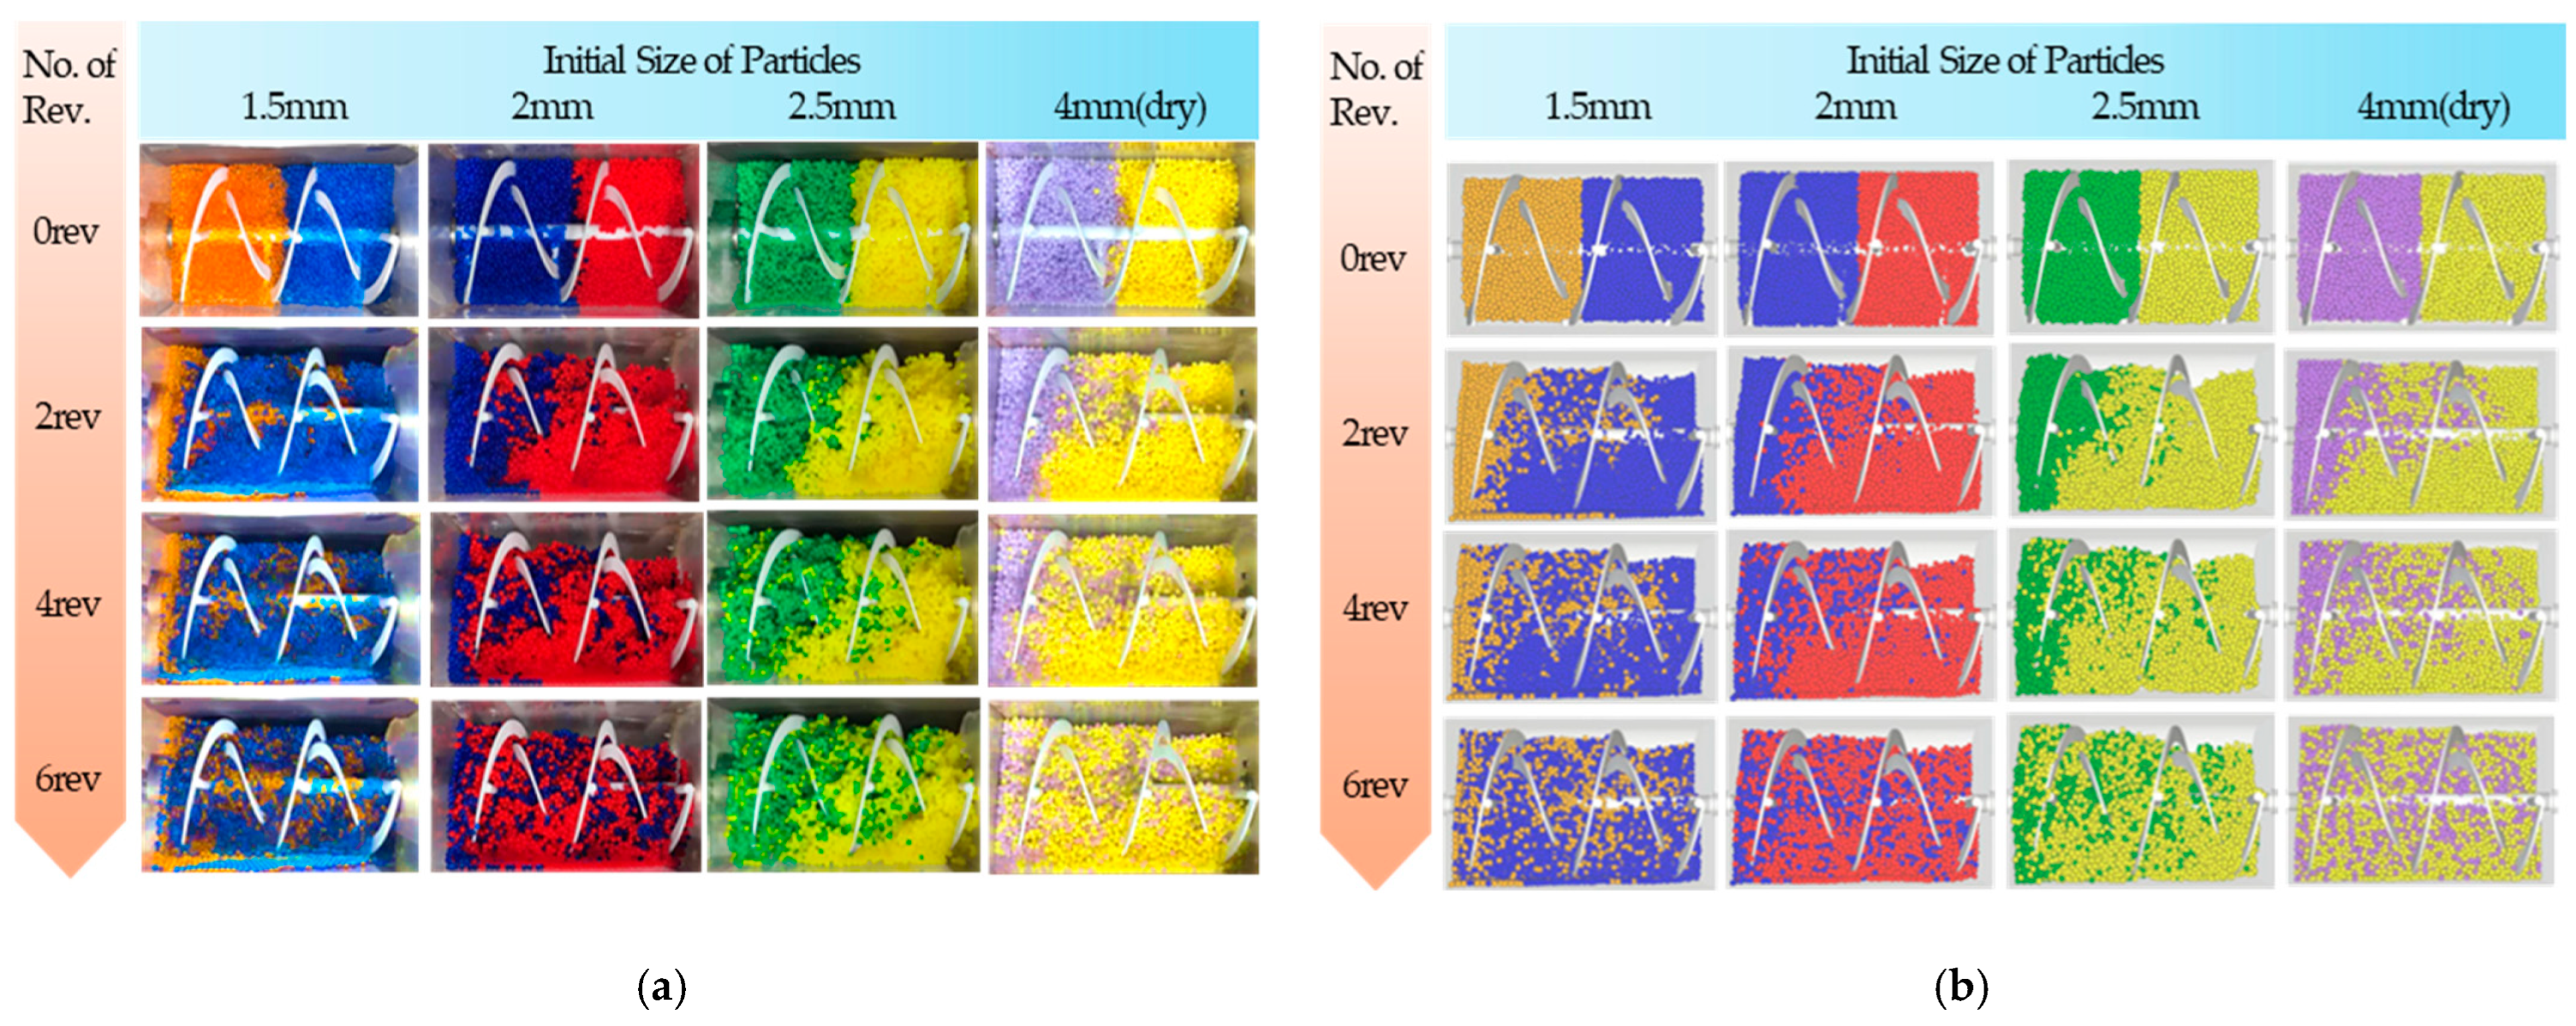
Figure 8 shows a planar observation of particle movement during two rotations of the mixing blade. By comparing the experimental and simulation results, particle traces were investigated based on the particles initially located on the left. After the second rotation (2 rotations), the 90% (1.5 mm) and dry (4 mm) particles completely passed the 90% (1.5 mm) and dry (4 mm) particles began to pass the second outer blade and reach the opposite wall, while the 80% (2 mm) and 60% (2.5 mm) particles passed through the second outer blade in larger amounts. At the 6th rotation (6 rotations), all particles reached the opposite wall. The 90% (1.5 mm) and dry (4 mm) particles showed a well-mixed distribution, but the 80% (2 mm) and 60% (2.5 mm) particles were still distributed on the first outer blade. This pattern of particle movement was consistently observed in both the experiment and simulation results.
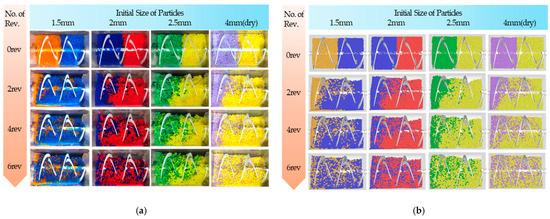
Figure 8.
Particle behavior according to the revolution at the top: (a) Experiment results by particle type. (b) Simulation results by particle type.
The forces acting on particles during mixing were analyzed through simulation. As shown in Figure 9, the normal force, tangential force, and adhesive force were individually measured, and their sum was calculated as the total force for comparison. As a result, the total force was highest under 60% (2.5 mm), reaching 0.051 N, and lowest under 90% (1.5 mm), at 0.022 N. Among the forces acting on the particles, the primary force was identified as the normal force. For SAP particles containing moisture, all three types of forces increased as the moisture content decreased. In the case of dry (4 mm), the normal force was found to be greater than for 90% (1.5 mm), whereas the tangential and adhesive forces were relatively small.
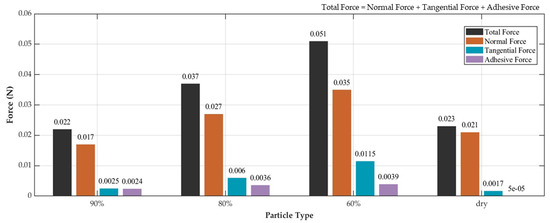
Figure 9.
Total and component forces for particle types.
Figure 10 shows the maximum, minimum, average, and dispersion of the overall particle translational velocity for each particle type. Similar to the results of the study on the correlation between dispersion and mixing performance [6], this study also confirmed that the dispersion was largest in the order of dry (4 mm), 90% (1.5 mm), 80% (2 mm), and 60% (2.5 mm). In addition, the velocity fluctuation range followed the same order.
Figure 11 illustrates the Lacey Mixing Index (LMI) depending on the particle type. This shows the change when the mixer was operated at 15 rpm for 50 s. The time required for the LMI to reach a value of 0.7 was shortest for the dry (4 mm) particles at 19.38 s and longest for the 60% (2.5 mm) particles at 29.34 s. The 90% (1.5 mm) and 80% (2 mm) particles reached this value at 22.38 s and 23.73 s, respectively. These results demonstrate that the mixing rate varied.
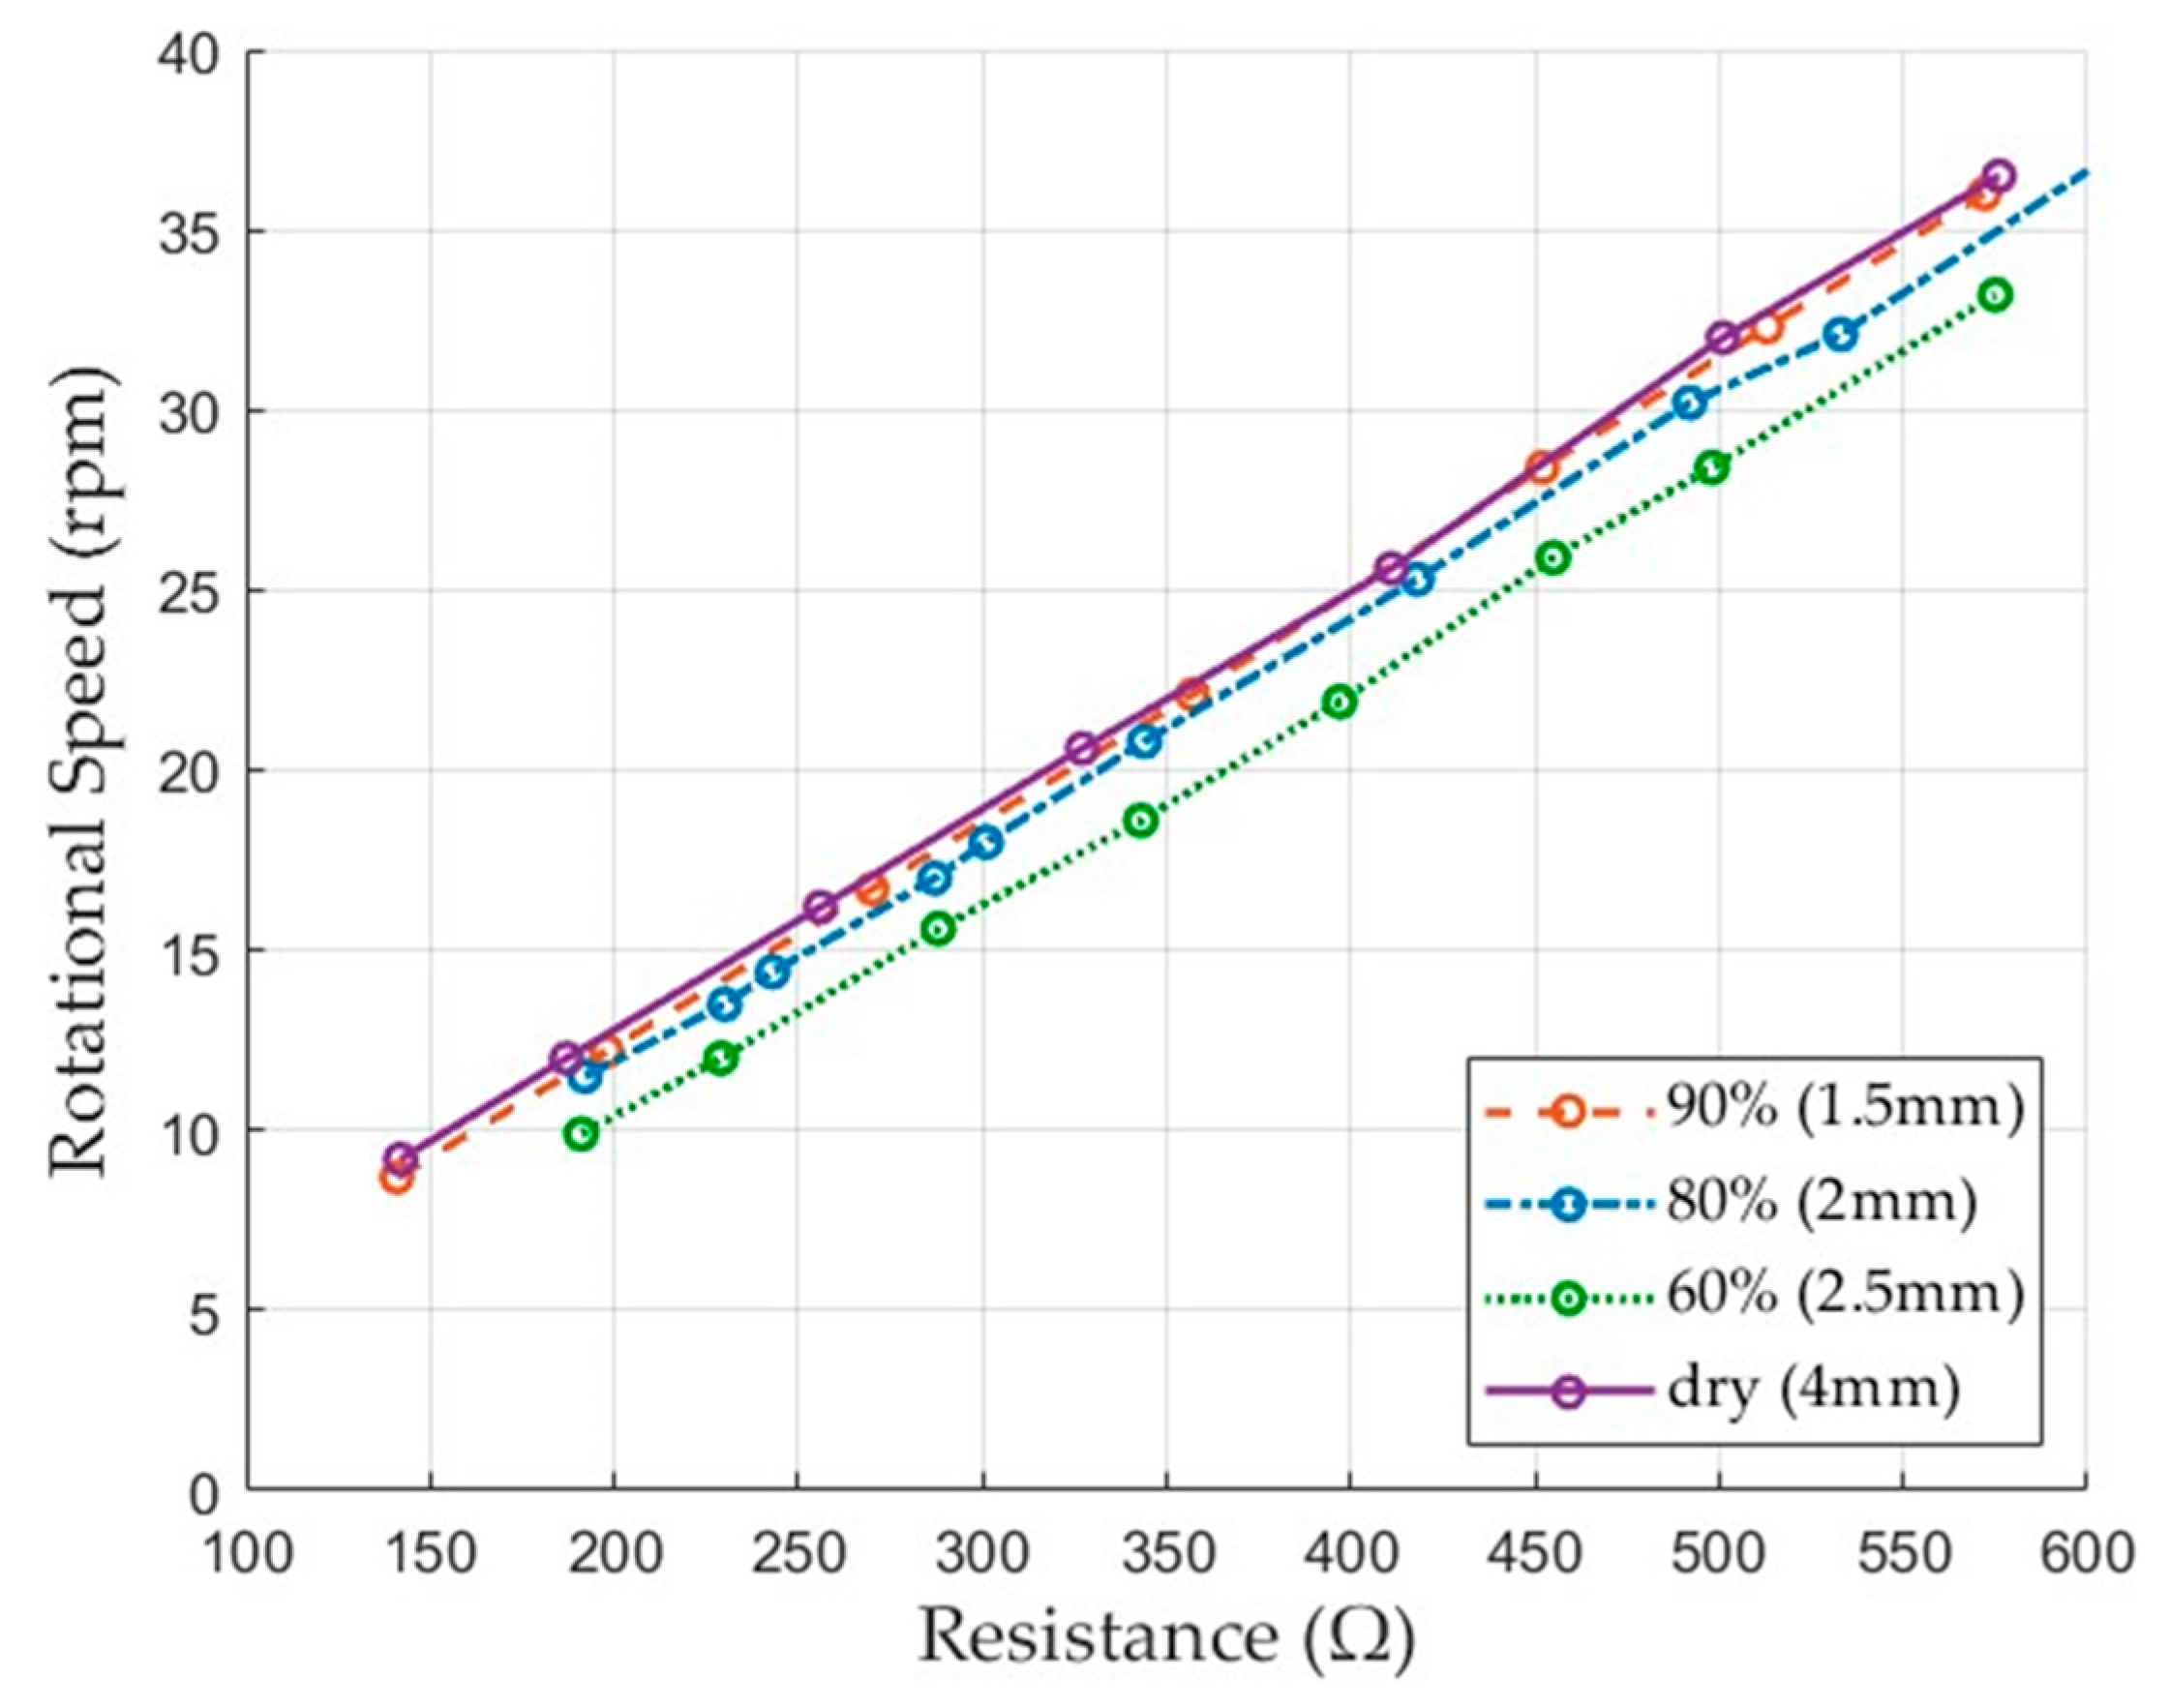
The experimental mixer used in this study was designed to control the motor current required for blade rotation through a variable resistor, allowing indirect measurement of rotational resistance depending on particle behavior. Figure 12 presents the rotational resistance values for each particle type. The dry (4 mm) and 90% (1.5 mm) particles exhibited similar resistance levels, while the 80% (2 mm) particles showed a slightly higher value. The 60% (2.5 mm) particles displayed the highest resistance among all cases. This result indicates that a decrease in moisture content leads to an increase in cohesion, which in turn increases the resistance to blade rotation. These differences in resistance suggest that variations in particle properties, especially due to moisture, have a significant effect on mixing performance.
The simulation and experimental results revealed consistent trends regarding the effect of particle moisture content on mixing behavior. The total forces acting on particles increased with decreasing moisture content, with the 60% (2.5 mm) particles exhibiting the highest values. This reflects the characteristics of wet granules and is interpreted as moisture increasing the cohesion between particles at low moisture content, which increases contact and friction between particles during the mixing process. In contrast, the total force for dry (4 mm) and 90% (1.5 mm) particles was lower, indicating relatively less cohesive interaction. The measured motor rotational load in the experiment also supports this trend. The motor load for blade rotation was the largest at 60% (2.5 mm), indicating that the cohesive force not only hinders the movement of individual particles but also acts as a large load on the blade rotation.
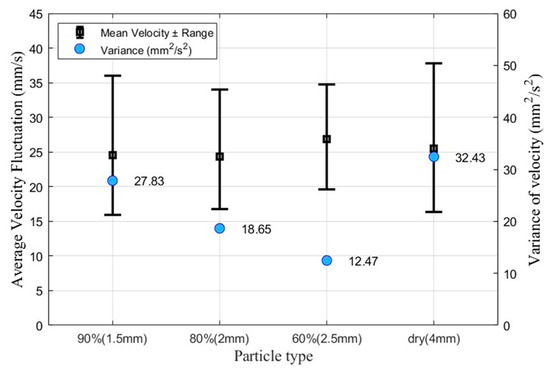
Figure 10.
Analysis results of translational velocity fluctuation according to particle type.
Figure 10.
Analysis results of translational velocity fluctuation according to particle type.
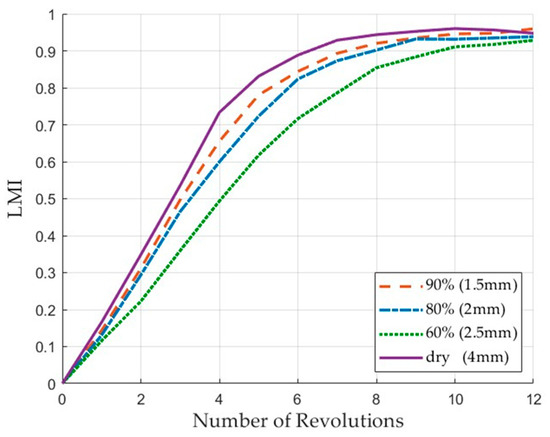
Figure 11.
Evolution of the Lacey Mixing Index with revolutions.
Figure 11.
Evolution of the Lacey Mixing Index with revolutions.

Figure 12.
Required resistance for motor operation at different RPMs.
Figure 12.
Required resistance for motor operation at different RPMs.
The particle velocity analysis results showed that the smaller the total force acting on the particle, the greater the velocity fluctuation range. In particular, dry (4 mm) particles showed the largest velocity fluctuation range, and both the maximum velocity and velocity dispersion were also the largest. These results confirmed that dry (4 mm) particles reached the target threshold faster than other particles by increasing the slope of the Lacey Mixing Index (LMI).
In summary, particles with low cohesion and high mobility tended to mix faster, but local behaviors such as particle-to-wall adhesion also had a significant impact on overall mixing performance.
4. Conclusions
In this study, the mixing behavior of particles with different moisture contents was analyzed through DEM analysis. The interparticle friction coefficient and the friction coefficient with the boundary were experimentally obtained and applied to the DEM analysis to confirm the significance of the analysis. Based on this, the following conclusions were drawn from the study.
- (1)
- Among the forces acting on the particles, the main force was confirmed to be the normal force, which was the largest in 60% (2.5 mm) cases. In the case of dry (4 mm), the normal force was slightly larger than in 90% (1.5 mm), but the tangential force and adhesive force were relatively small, so it was confirmed that the mixing speed was faster.
- (2)
- The mixing of particles (LMI) progresses faster as the moving speed of the particles increases, and the mixing characteristics improve as the deviation between the maximum and minimum moving speeds increases.
- (3)
- The rotational load applied to the motor of the experimental mixer was the largest at 60% (2.5 mm), and the load was smaller at 90% (1.5 mm) due to the decrease in tangential and adhesive forces caused by the formation of a moisture film. In addition, dry (4 mm) and 90% (1.5 mm) particles showed similar resistance levels because the total force applied to the particles was similar in magnitude.
- (4)
- As a result of conducting a mixing experiment using SAP, whose friction characteristics change according to moisture content, 90% (1.5 mm) particles with the highest moisture content were piled along the side wall. In the case of 60% (2.5 mm), they were distributed more inside the container in the form of clusters rather than along the side wall. It was confirmed that the distribution patterns of dry (4 mm) and 90% (1.5 mm) were similar. This confirmed that the change in friction coefficient according to the amount of moisture greatly affects the characteristics of mixing.
This study investigated the variation in particle mixing characteristics with moisture content. We expect that it will be helpful for the design of mixing and drying processes in various industries, including pharmaceutical, chemical, and food production in the future.
Author Contributions
Investigation, M.S.; writing—original draft preparation, K.K.; writing—review and supervision, M.S. and K.K. All authors have read and agreed to the published version of the manuscript.
Funding
This research was supported by the Korea Institute for Advancement of Technology (KIAT) grant funded by the Korea Government (MOTIE) “RS-2024-00409639, HRD Program for Industrial Innovation” and the Gyeonggi-do Regional Cooperation Research Center (GRRC) project “GRRC TU Korea 2020-B01, Multi-material processing technology innovation research center”.
Data Availability Statement
Additional data that support the findings of this study are available on request from the corresponding author.
Conflicts of Interest
The authors declare that there is no conflict of interest. The sponsors had no role in the design, execution, interpretation, or writing of the study.
Abbreviations
| Normal force at the time | |
| Degree of overlap | |
| Loading contact stiffness | |
| Unloading contact stiffness | |
| Dimensionless small constant | |
| E | Young’s modulus |
| r | Particle radius |
| ε | Restitution coefficient |
| Tangential force at the time | |
| Friction coefficient | |
| Coulomb’s limit | |
| rolling resistance | |
| Rolling resistance coefficient | |
| Capillary force | |
| Filling angle | |
| θ | Contact angle |
| Surface tension | |
| h | Separation distance |
| Volume of the liquid contained in the bridge | |
| Liquid absolute viscosity | |
| Equivalent radius | |
| Relative velocity | |
| Dimensionless equivalent radius |
References
- Chou, S.H.; Hsiau, S.S. Experimental analysis of the dynamic properties of wet granular matter in a rotating drum. J. Powder Technol. 2011, 214, 491–499. [Google Scholar] [CrossRef]
- Chandratilleke, G.R.; Dong, K.J.; Shen, Y.S. DEM study of the effect of blade-support spokes on mixing performance in a ribbon mixer. J. Powder Technol. 2018, 326, 123–136. [Google Scholar] [CrossRef]
- Halidan, M.; Chandratilleke, G.R.; Dong, K.J.; Yu, A.B. Mixing performance of ribbon mixers: Effects of operational parameters. J. Powder Technol. 2018, 325, 92–106. [Google Scholar] [CrossRef]
- Liu, P.Y.; Yang, R.Y.; Yu, A.B. DEM study of the transverse mixing of wet particles in rotating drums. J. Chem. Eng. Sci. 2013, 86, 99–107. [Google Scholar] [CrossRef]
- Jin, X.; Wang, S.; Shen, Y. DEM study of mixing behaviours of cohesive particles in a U-shaped ribbon mixer. J. Powder Technol. 2022, 399, 117097. [Google Scholar] [CrossRef]
- Gao, W.; Liu, L.; Liao, Z.; Chen, S.; Zang, M.; Tan, Y. Discrete element analysis of the particle mixing performance in a ribbon mixer with a double U-shaped vessel. Granul. Matter 2019, 21, 12. [Google Scholar] [CrossRef]
- Zhu, R.R.; Zhu, W.B.; Xing, L.C.; Sun, Q.Q. DEM simulation on particle mixing in dry and wet particles spouted bed. J. Powder Technol. 2011, 210, 73–81. [Google Scholar] [CrossRef]
- Wang, Y.; Xu, J.; He, S.; Liu, S.; Zhou, Z. Numerical simulation of particle mixing and granulation performance in rotating drums during the iron ore sintering process. J. Powder Technol. 2023, 429, 118890. [Google Scholar] [CrossRef]
- Kim, J.; Park, S.; Lee, D. Hygral behavior of superabsorbent polymers with various particle sizes and cross-linking densities. Polymers 2017, 9, 600. [Google Scholar] [CrossRef]
- Mitarai, N.; Nori, F. Wet Granular Materials. Adv. Phys. 2006, 55, 1–45. [Google Scholar] [CrossRef]
- Datta, P.; Faroughi, S.A. Angle of repose for superquadric particles: Investigating the effects of shape parameters. J. Comput. Geotech. 2024, 165, 105918. [Google Scholar] [CrossRef]
- Eidevag, T.; Thomson, E.S.; Kallin, D.; Casselgren, J.; Rasmuson, A. Angle of repose of snow: An experimental study on cohesive properties. J. Cold Reg. Sci. Technol. 2022, 194, 103470. [Google Scholar] [CrossRef]
- Oessler, T.; Katterfeld, A. Scaling of the angle of repose test and its influence on the calibration of DEM parameters using upscaled particles. J. Powder Technol. 2018, 330, 58–66. [Google Scholar] [CrossRef]
- Walton, O.R.; Braun, R.L. Viscosity, granular-temperature, and stress calculations for shearing assemblies of inelastic, frictional disks. J. Rheol. 1986, 30, 948–980. [Google Scholar] [CrossRef]
- Młynarczyk, P.; Brewczyński, D. Main Problems Using DEM Modeling to Evaluate the Loose Soil Collection by Conceptual Machine as a Background for Future Extraterrestrial Regolith Harvesting DEM Models. Micromachines 2021, 12, 1404. [Google Scholar] [CrossRef]
- Syed, Z.; Tekeste, M.; White, D. A coupled sliding and rolling friction model for DEM calibration. J. Terramech. 2017, 72, 9–20. [Google Scholar] [CrossRef]
- Gallego, E.; Fuentes, J.M.; Wiącek, J.; Villar, J.R.; Ayuga, F. DEM analysis of the flow and friction of spherical particles in steel silos with corrugated walls. Powder Technol. 2019, 355, 425–437. [Google Scholar] [CrossRef]
- Ai, J.; Chen, J.F.; Rotter, J.M.; Ooi, J.Y. Assessment of Rolling Resistance Models in Discrete Element Simulations. Powder Technol. 2011, 206, 269–282. [Google Scholar] [CrossRef]
- Mukherjee, S.; Thornton, C.; Adams, M.J. DEM based computational model to predict moisture induced cohesion in pharmaceutical powders. Pharmaceutics 2017, 9, 35. [Google Scholar] [CrossRef]
- Mikami, T.; Kamiya, H.; Horio, M. Numerical simulation of cohesive powder behavior in a fluidized bed. J. Chem. Eng. Sci. 1998, 53, 1927–1940. [Google Scholar] [CrossRef]
- Xiao, F.; Jing, J.; Kuang, S.; Yang, L.; Yu, A. Capillary forces on wet particles with a liquid bridge transition from convex to concave. J. Powder Technol. 2020, 363, 59–73. [Google Scholar] [CrossRef]
- Nase, S.T.; Vargas, W.L.; Abatan, A.A.; McCarthy, J.J. Discrete characterization tools for cohesive granular material. J. Powder Technol. 2001, 116, 214–223. [Google Scholar] [CrossRef]
- Lacey, P.M.C. Development in theory of particle mixing. J. Appl. Chem. 1954, 4, 257–268. [Google Scholar] [CrossRef]
- Wen, Y.; Liu, M.; Liu, B.; Shao, Y. Comparative study on the characterization method of particle mixing index using DEM method. J. Procedia Eng. 2015, 102, 1630–1642. [Google Scholar] [CrossRef]
- Jin, X.; Chandratilleke, G.R.; Wang, S.; Shen, Y. DEM investigation of mixing indices in a ribbon mixer. J. Particuology 2022, 60, 37–47. [Google Scholar] [CrossRef]
- Sekizkardes, B.; Su, E.; Okay, O. Mechanically Strong Superabsorbent Terpolymer Hydrogels Based on AMPS via Hydrogen-Bonding Interactions. ACS Appl. Polym. Mater. 2023, 5, 2043–2050. [Google Scholar] [CrossRef]
- Basinskas, G.; Sakai, M. Numerical study of the mixing efficiency of a ribbon mixer using the discrete element method. J. Powder Technol. 2016, 287, 380–394. [Google Scholar] [CrossRef]


Disclaimer/Publisher’s Note: The statements, opinions and data contained in all publications are solely those of the individual author(s) and contributor(s) and not of MDPI and/or the editor(s). MDPI and/or the editor(s) disclaim responsibility for any injury to people or property resulting from any ideas, methods, instructions or products referred to in the content. |
© 2025 by the authors. Licensee MDPI, Basel, Switzerland. This article is an open access article distributed under the terms and conditions of the Creative Commons Attribution (CC BY) license (https://creativecommons.org/licenses/by/4.0/).