Abstract
This study investigates the flow dynamics and damage characteristics of liquid level control valves in direct coal liquefaction processes. The primary failure mechanisms are identified as eccentric jet-induced unilateral wall damage, cavitation erosion, and solid particle erosive wear. A numerical simulation framework was developed to analyze the effects of varying spool angles (72°, 90°, 98°, 105°, and 120°) on flow stability, cavitation dynamics, and erosion patterns. The key findings include the following: A spool angle of 90° achieves the most uniform pressure distribution and minimizes eccentric jet phenomena. Spool geometry modifications exhibit a negligible influence on cavitation characteristics. Reduced wear rates are observed at smaller spool angles (72° and 90°), with the lowest particle-induced erosion occurring at 90°. There is a certain correlation between the particle residence time and the wear of the valve core wall, which is illustrated in the shorter residence times that are correlated with accelerated material degradation. The optimal spool angle of 90° simultaneously mitigates eccentric jet effects, cavitation, and erosive wear. This research provides novel insights for predictive failure analysis and the structural optimization of control valves in high-pressure multi-phase flow systems.
1. Introduction
The control valves used in the coal liquefaction process are widely used in power plants and petrochemical and coal chemical energy conversion devices because of their simple structure and because they do not easily leak or clog [1,2,3,4]. These control valves are suitable for working environments with a high pressure difference and a viscous fluid medium [5]. However, in practical engineering applications, due to the structure of the control valve and the strict industrial control during service, the valve core head is often affected by the high-speed gas–liquid–solid flow [6]. In addition, the asymmetry of the valve structure will cause the eccentric jet phenomenon and impact the wall of the valve seat. At the same time, because there is a throttling part between the valve core and the seat, the liquid phase will change when the fluid passes through it, resulting in cavitation and cavitation erosion [7]. Cavitation, multi-phase flow erosion, and eccentric jets will lead to serious damage to the valve, resulting in a great impact on the life of the valve and even resulting in safety accidents. Therefore, it is of great significance to study the failure characteristics of level control valves.
Currently, the primary research on erosion wear in solid-bearing multi-phase flow within control valves includes the following: Kant [8] introduced a coupled computational method that integrates CFD with particle tracking models, alongside the Finnie and Oka erosion models, to predict pipeline wear in CSP systems. This study explored the relationship between erosion rate and depth, as well as the inclined length and angle of pipelines, providing valuable insights for pipeline design. Prashan et al. [9] utilized the ANSYS Discrete Element Model (DEM) to identify the valve locations most susceptible to corrosion due to alumina particle impact under varying pressure drops and valve closing angles. Their findings indicated that particle velocity and impact angle significantly influence wear, particularly at the top of the valve, with butterfly valves experiencing more severe wear at smaller closing angles. Zhang et al. [10] investigated cavitation wear in the V-shaped ball valves used in coal chemical industries, validating their structural optimization model through numerical simulations and experimental testing. The optimized design redirects upstream erosion to flanges, reducing direct erosion on seats and flanges while minimizing gas–liquid phase changes and inhibiting internal valve cavitation, thereby extending the valve’s service life. Based on the E/CRC wear model, Li et al. [11] considered the collision probability between particles and walls, introducing a particle collision probability model to numerically analyze the relationship between the spool opening and particle impact angle. They also examined the microscopic morphology of the spool’s metering edge and experimentally measured wear values using SEM, demonstrating that the model can accurately predict wear under fluid–structure coupling conditions. Fu et al. [12] conducted experimental research on high-speed laser cladding 3533-00 Fe-based cemented carbide coatings, analyzing the phase composition, microstructure, micro hardness, and wear and corrosion resistance. Their work provided theoretical guidance for enhancing wear and corrosion resistance in nuclear power valves. Yang et al. [13] combined numerical simulation with experimental research to study the erosion characteristics of fracturing pipeline materials, considering the effects of impact angle, velocity, and wall stress on erosion wear. They found that microdefect sizes in the erosion zone increased with applied stress under high-pressure operation, leading to more severe erosion wear. Jin et al. [14] employed CFD-DEM coupled with numerical simulations to investigate wear conditions in black water angle valve components under different particle shapes, analyzing how particle shape affected the distribution within the valve and the main factors influencing the wear distribution. Ren et al. [15] developed an energy loss failure mechanism model incorporating valve port pressure difference and flow rate, which was validated through experiments. This method effectively addressed the limitations of vibration sensors in diagnosing aviation hydraulic systems, improving the accuracy and stability of fault diagnosis. Novak et al. [16] measured particle-induced wear on hydraulic pumps under varying concentration conditions using a hydraulic test bench, studying various wear mechanisms on shell surfaces and finding a linear relationship between pressure drop and leakage flow.
Yang et al. [17] simulated the internal multi-phase flow field of an eccentric butterfly valve and studied the influence of pressure drops on the mass flow rate and flow coefficient. Based on the Schnerr–Sauer cavitation model, the relationships between valve pressure and flow parameters and the cavitation characteristics of valves with different opening conditions were studied. Based on LES and ZGB cavitation models, Chen et al. [18] established a micro channel numerical simulation prediction method for injector control valves and verified the accuracy of the established numerical simulation method for control valve prediction by designing visualization experiments. The research results provided guidance for the simulation analysis and design of injector control ball valves. Xu et al. [19] used the LES model to study the evolution of the cavity vortex structure of the control valve under different opening and structural parameters, and analyzed the instability of the flow through mechanical energy pulsation. The results showed that reducing the opening of the valve increased the influence range of the cavity vortex structure, and that the cavitation would be more intense. Therefore, it is recommended to avoid small openings and maximize the effective flow area of the flow channel within the allowable range. This can extend the service life of the valve. Qian et al. [20] studied the cavitation dynamics evolution process during the opening and closing of an inclined ball valve of a rocket engine system by using dynamic grid and UDF technology. The results showed that the axial force of the whole disc first increased and then decreased with time during cavitation evolution. The unbalanced pressure distribution at the bottom of the disc was detrimental to the response of the disc at its maximum displacement. This work is of great significance to cavitation control and the structural design of liquid hydrogen inclined ball valves. Zhang et al. [21] proposed a quantitative method to evaluate the neat volume fraction in cavitation images by experimental void fraction, which could achieve the rapid and accurate characterization of cavitation. The results showed that the void fraction effectively represented the change in steam volume fraction under different conditions. The cavitation number had an important effect on the ratio of the concave jet area to the cavitation collapse area. Zhao et al. [22] studied the effect of cavitation on sleeve regulating valves. By defining the factors affecting the cavitation of the resistance coefficient, a formula for calculating the resistance coefficient of a sleeve regulating valve was put forward. The results showed that when the fluid flowed forward, the degree of cavitation increased, as did the energy loss. In counter-flow, the effect of cavitation on the resistance coefficient was related to the opening of the valve and the number of throttling windows. This work is of great significance to the optimization and design of sleeve regulating valves and piping systems.
In this study, the flow, cavitation, and particle wear characteristics inside the valve are thoroughly investigated. Using the multi-physics coupling analysis method, the performance evolution law of the valve under different working conditions is revealed. In view of the shortcomings of existing studies, which are mostly limited to single-characteristic analyses, and the lack of systematic optimization schemes, in this paper, an innovative structural optimization scheme based on different spool angles is proposed, which effectively improves the valve’s flow efficiency, cavitation inhibition ability, and anti-wear performance. The results provide a practical theoretical basis and technical support for the design and selection of valves in engineering practice.
Key insights include the following: eccentric jet phenomena are minimized at a spool angle of 90°, achieving optimal flow symmetry; the cavitation intensity remains largely insensitive to spool angle variations; and a reduced particle residence time exacerbates the wear severity due to the higher impact frequencies. These computational findings provide critical guidance for failure prediction and valve design optimization, enabling the mitigation of spool-related failure mechanisms and the extension of the operational lifespan under extreme multi-phase flow conditions.
2. Research Object
2.1. Process Modeling
The liquid level control valve studied in this paper is applied to the direct coal liquefaction process shown in Figure 1. The oil–coal slurry produced by the hydrocracking reaction in the first and second reactors is separated by the intake liquid of the high-temperature and high-pressure separator (HTHPS) and the high-temperature and medium-pressure separator (HTMPS), and then transported to the atmospheric pressure tower for the subsequent reaction. The level control valve is located between these two separators (red box in Figure 1), and its role is to isolate and adjust the liquid level of the high-temperature and high-pressure separator (HTHPS). The medium passing through the valve is mainly liquefied oil and solid pulverized coal particles. The inlet pressure of the valve is 18.0 MPa and the outlet pressure is 3.02 MPa. The physical property parameters of the other fluid media are shown in Table 1. Because the regulator is in a high-temperature and high-pressure environment, cavitation and wear easily occur.
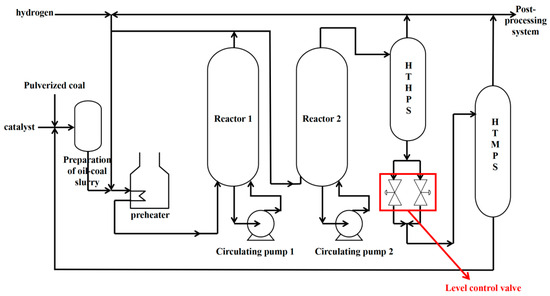
Figure 1.
Valve position and operating environment.

Table 1.
Physical parameters of control valve internal fluid medium.
2.2. Valve Structure
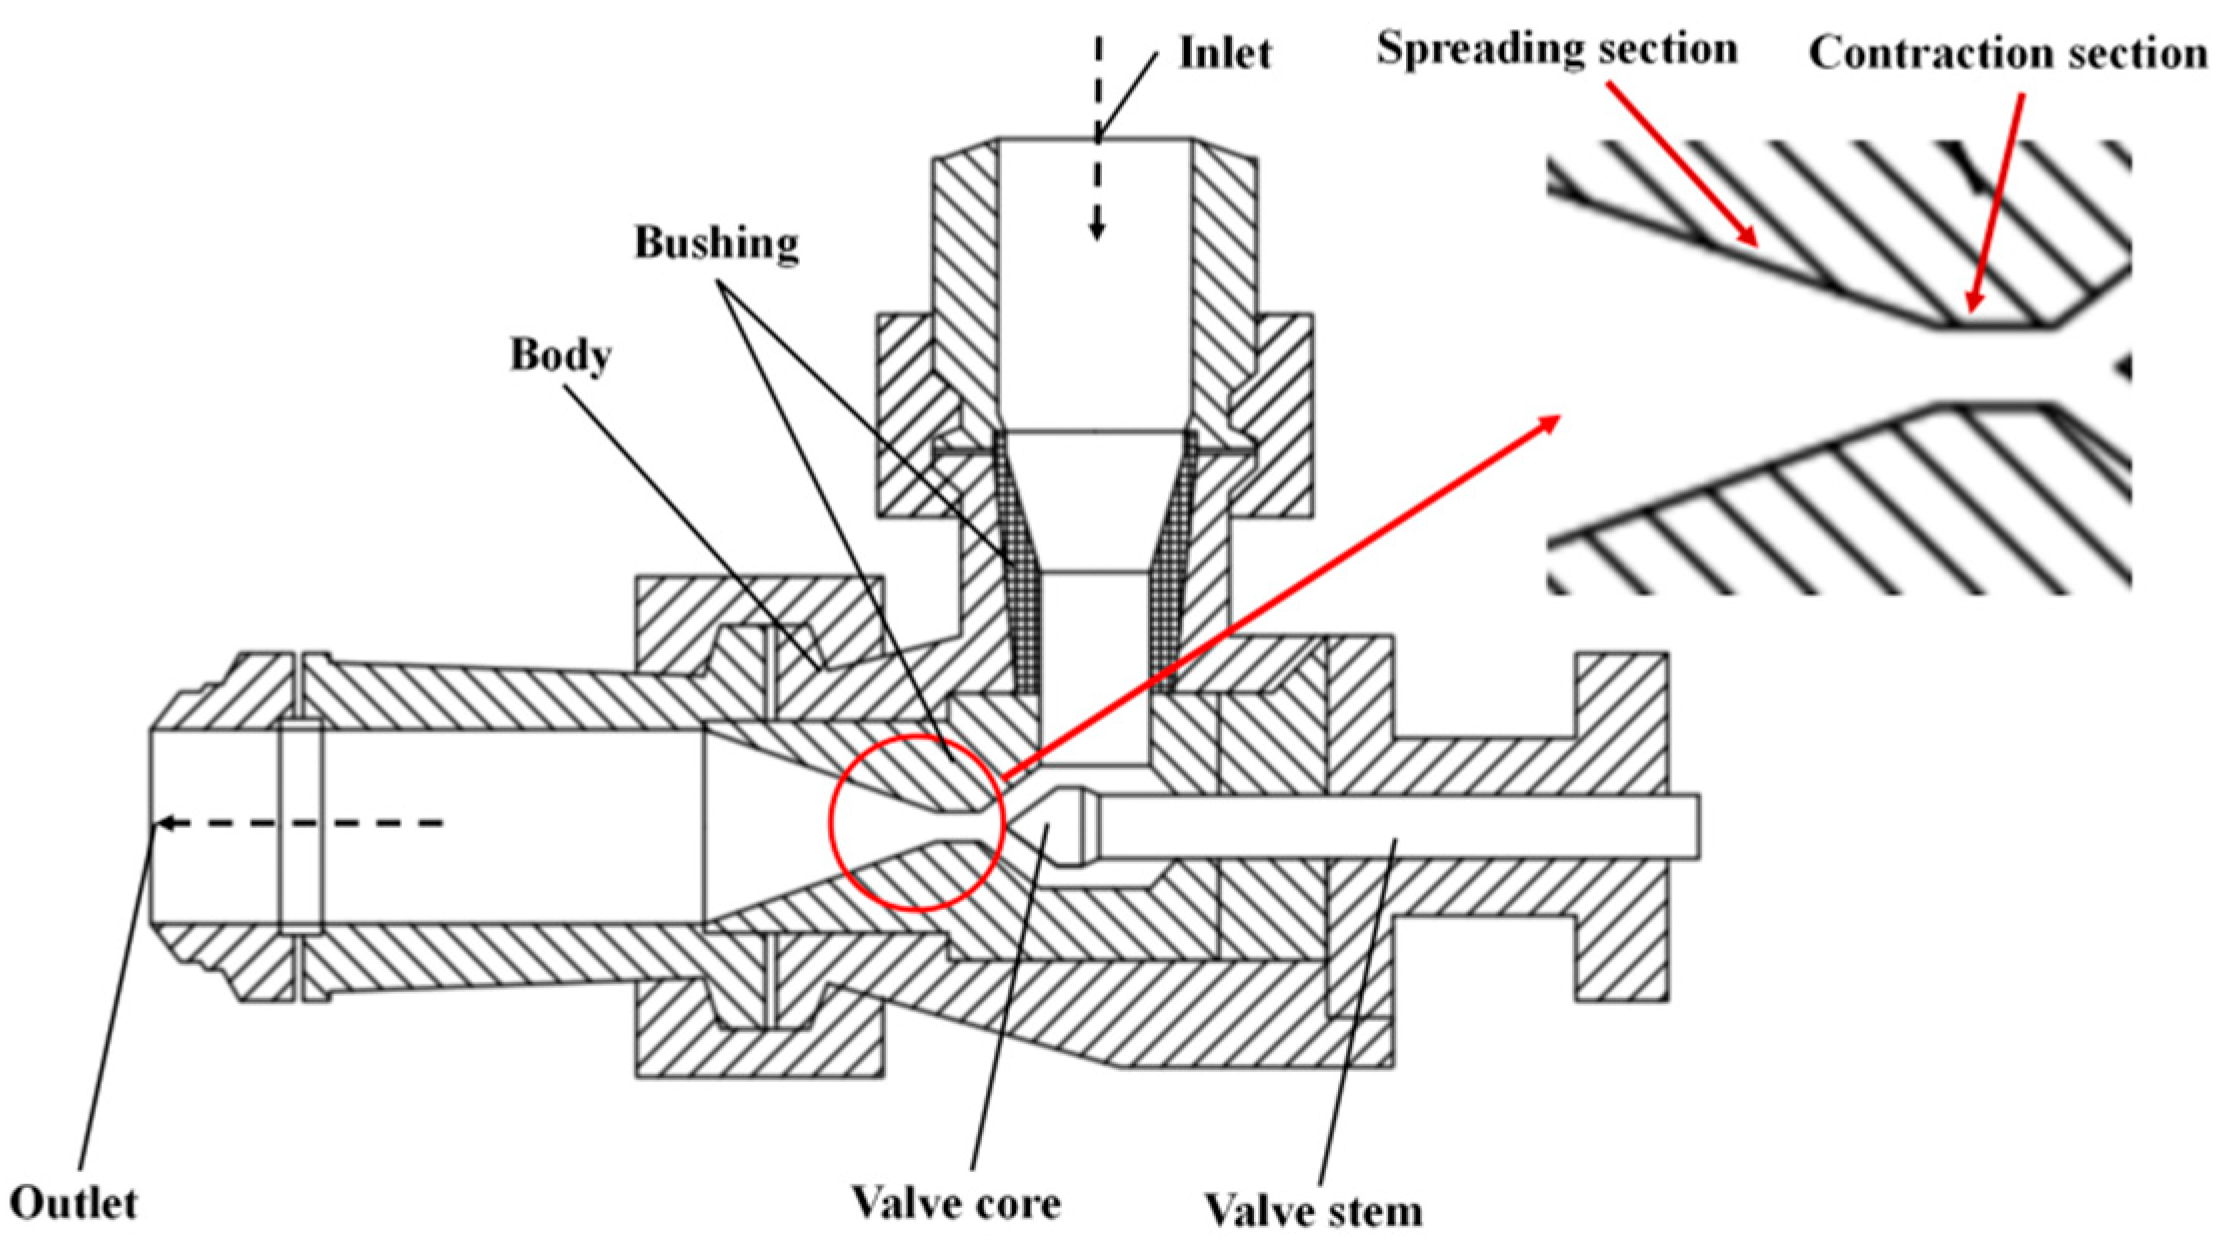
Figure 2 shows the structural diagram of the regulating valve. The valve is a conical angle valve, and mainly includes a valve stem, a seat, a bushing, a valve core, a valve body, and other components. The valve stem is used to connect the spool, and the opening can be adjusted by moving the valve stem. The seat and the spool are engaged components that can cut off the flow when the regulator is completely closed. The bushing is used to protect the valve from damage; however, in actual applications, the spool and the lower part of the bushing are often damaged due to the bias of the flow and the throttling part of the seat and the spool [23,24]. WC is the raw material used in the production of the valve seat and bushing, and 316L stainless steel is the raw material of the spool and stem. WC and an adhesive containing Co are coated on the spool surface via high-speed oxygen fuel. The thickness of the WC-Co coating is 500 μm and its chemical composition is shown in Table 2.
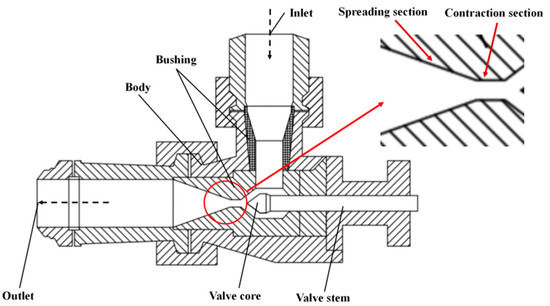
Figure 2.
Structural diagram of a level control valve.
Table 2.
Formation and material properties of WC-Co.
2.3. Failure Description
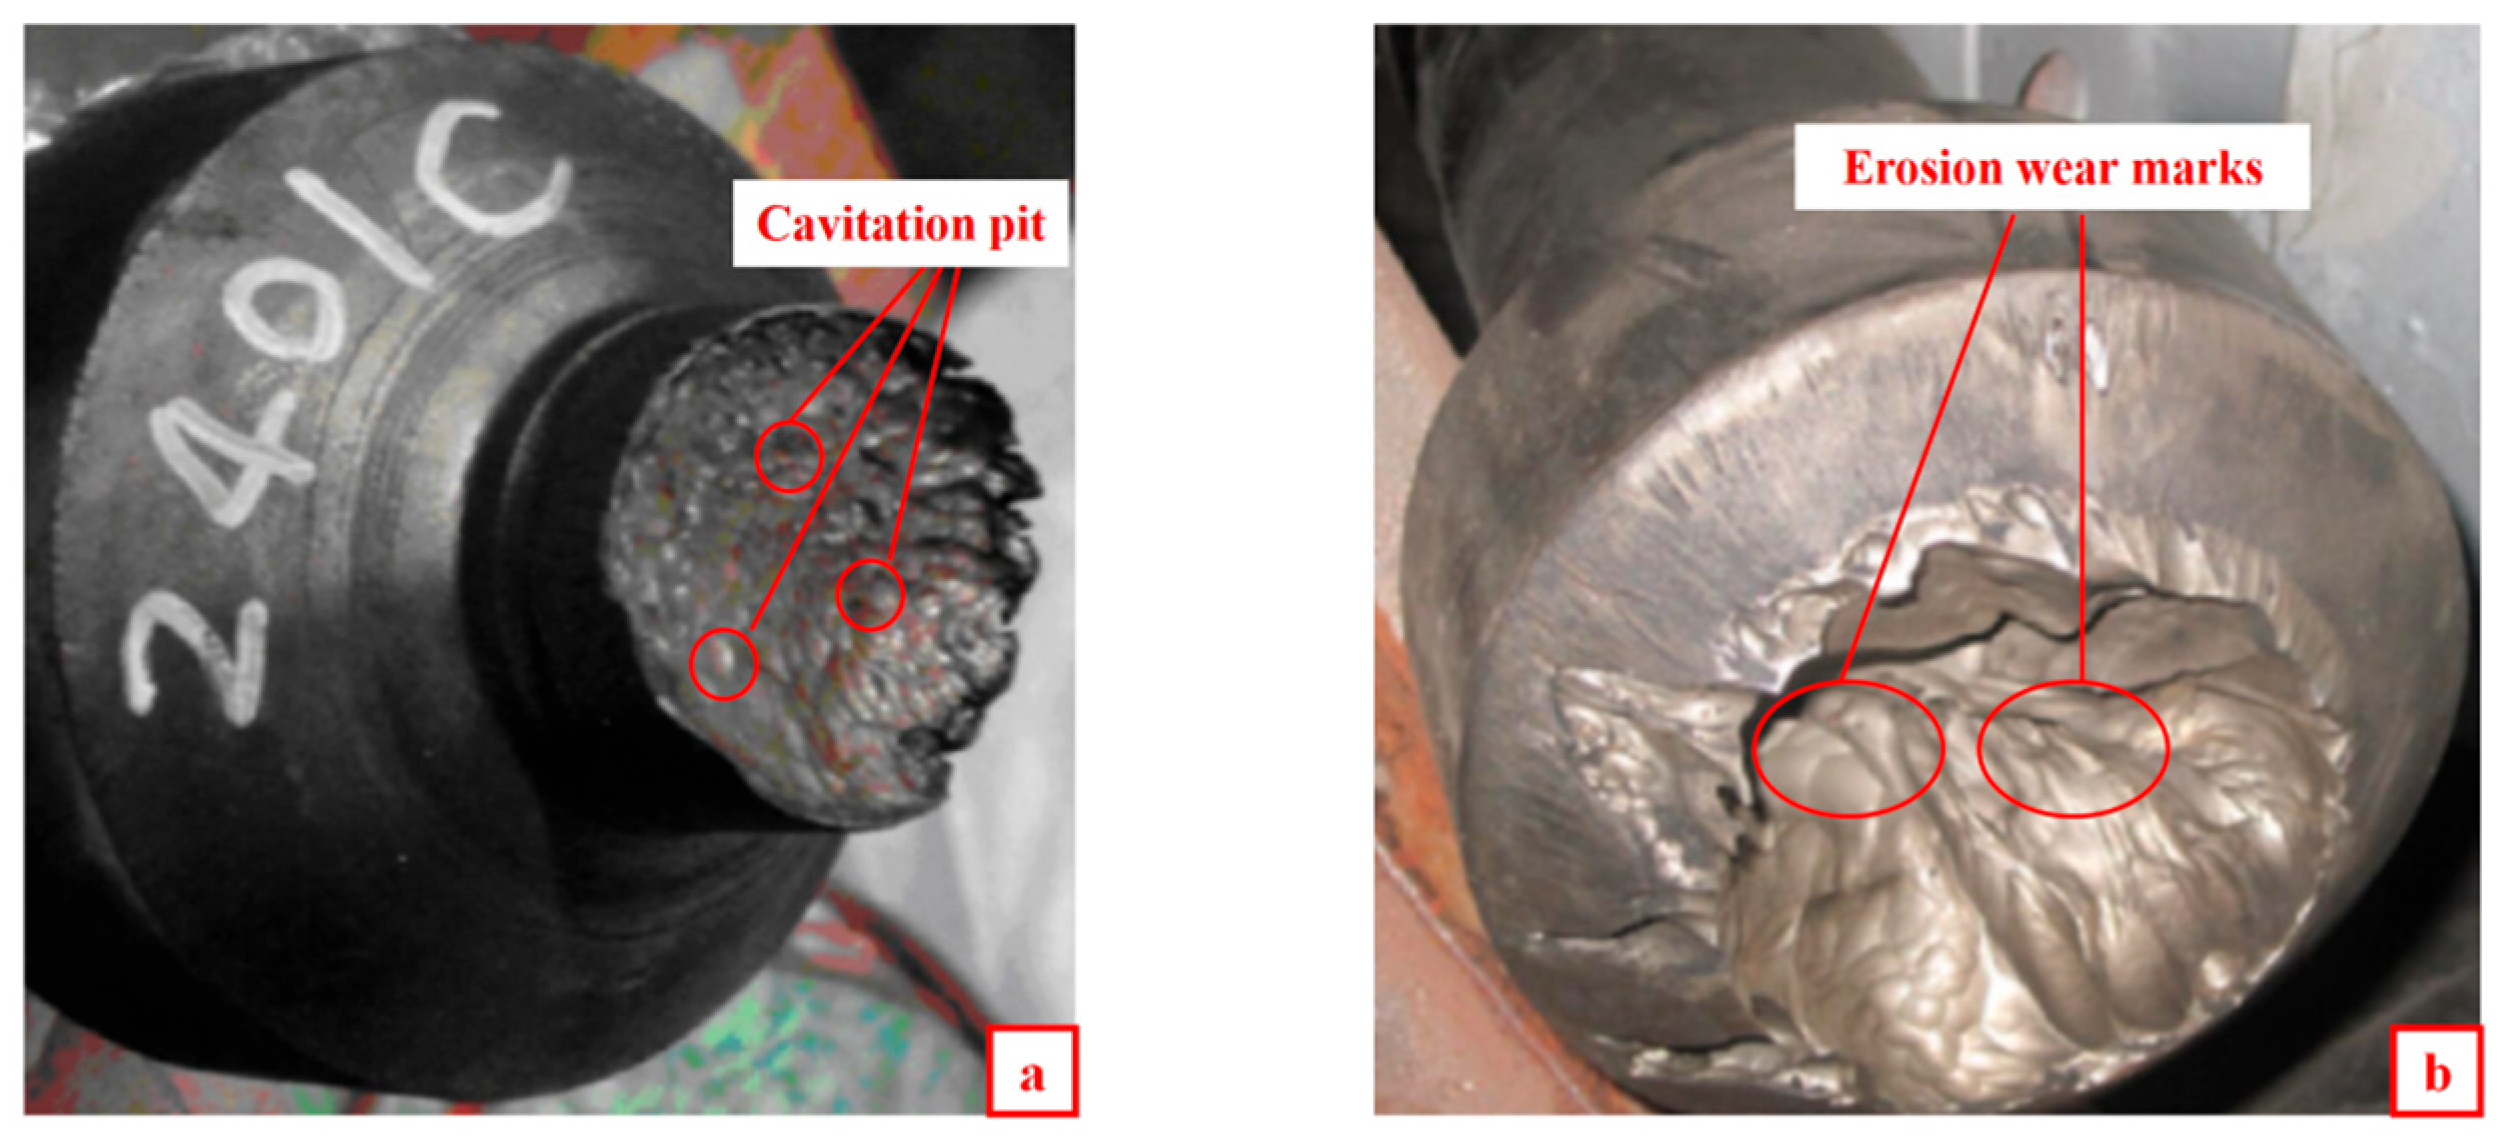
Due to the harsh service environment of the level control valve, the difference between the valve’s inlet and outlet pressure is very large, the solid particle concentration is high, the oil–coal slurry fluid medium flowing through the valve core is fast, and it can easily undergo phase changes, forming a high-speed three-phase gas–liquid–solid flow between the valve core seat. Therefore, the causes of valve damage and failure may be chemical corrosion due to corrosive media, cavitation, or solid particle wear. The causes of valve failure are further analyzed below. When the liquid medium flows through the throttling part of the fluid machinery, the pressure will drop rapidly. When the pressure is lower than the saturated steam pressure, the gas–liquid phase will change, resulting in a large number of bubbles. When the air bubble collapses, a high-temperature, high-speed jet and shock wave will be produced. Damage is caused to the material, which is called cavitation damage [25]. As shown in Section 2.2 ‘Valve Structure’, there is a throttling area between the valve core and the seat, which meets the conditions for cavitation. Combined with the valve damage morphology shown in Figure 3a, cavitation pits are present at the valve core [26]. Therefore, as also shown in the analysis of the valve structure and damage morphology, cavitation is one of the causes of valve damage.

Figure 3.
Appearance of damage to the valve core. (a) Cavitation pit morphology. (b) Erosion wear morphology.
Combined with the properties of the fluid medium flowing through the liquid level control valve, the causes of valve damage are further analyzed. The medium flowing through the control valve is mainly high-temperature coal-liquefied oil. It is mainly composed of different hydrocarbon substances, and its chemical composition is tested and analyzed. The test results are shown in Table 3.
Table 3.
Chemical components of fluid media.
An analysis of the chemical composition of the fluid medium flowing through the control valve shows that the percentage of heavy distillate inside the control valve is as high as 93.7%. The total amount of NH3, CO2, H2S, and other corrosive components is less than 1%; thus, the corrosiveness of the fluid medium is weak, and the WC-Co coating and 316L stainless steel material have good anti-corrosion properties [27,28]. Therefore, the effect of chemical corrosion damage on the valve is not considered in this paper.
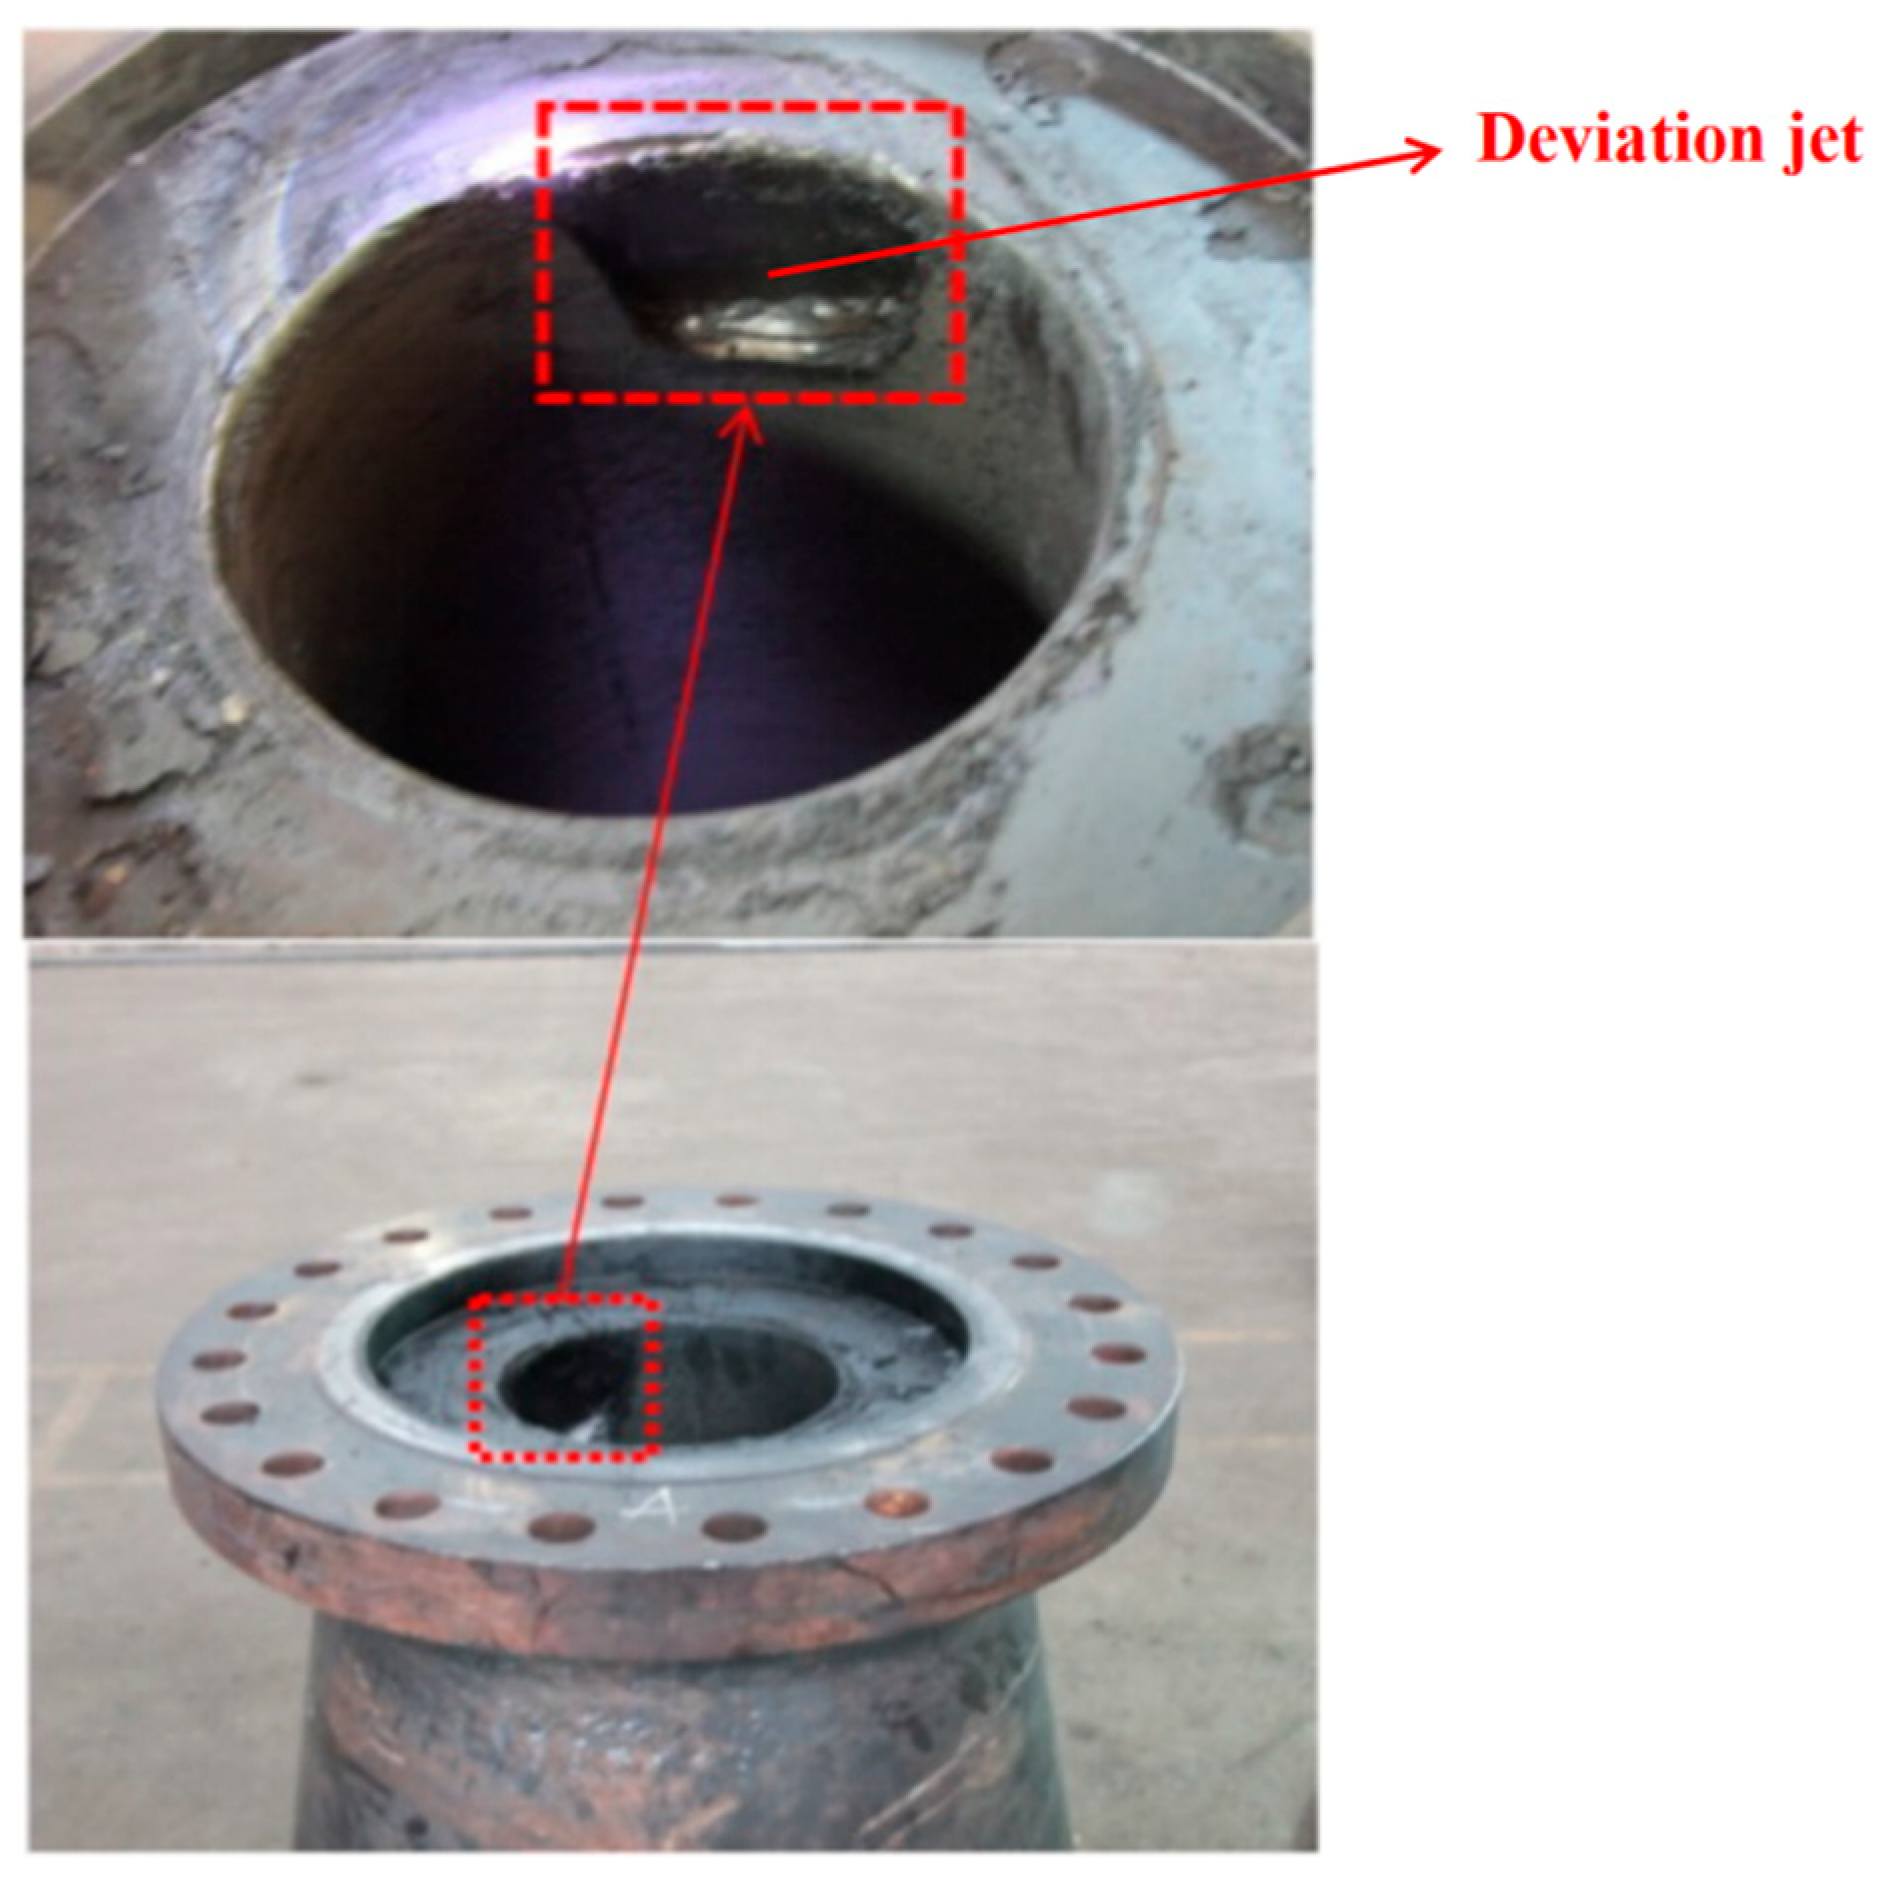
Figure 4 shows the damage morphology of the downstream bushing of the valve. It shows that the bushing exhibits clear erosion and wear marks only on one side. It was initially speculated that the structure of the control valve causes a 90° change in the flow channel. As a result, one side of the bushing is seriously damaged.
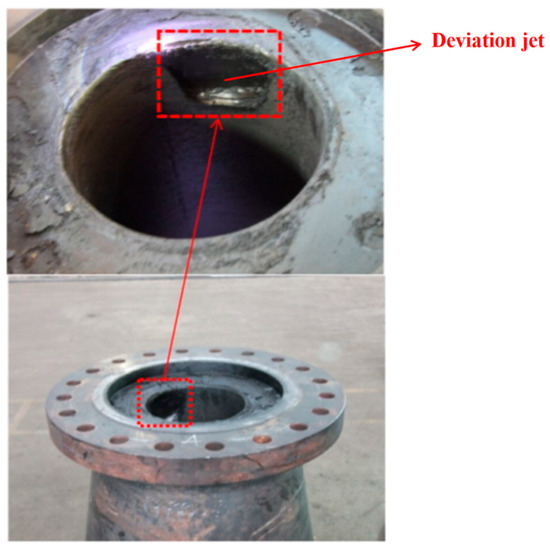
Figure 4.
Valve bushing deflection damage appearance.
3. Numerical Method
3.1. Control Equation
The continuity conservation equation of the mixed phase can be expressed by the following formula:
The two-phase gas–liquid fluid is regarded as a continuous medium, and the density of the mixed phase can be expressed by the following formula:
In this formula, ρv represents the density of the gas phase, ρl represents the density of the liquid phase, αv is the gas phase volume fraction, and αl is the liquid phase volume fraction, where αl = 1 − αv is the velocity vector of the mixed phase.
Ignoring the relative slip velocity between the gas phase and the liquid phase and the action of the volume force, the momentum equation of the mixed phase can be expressed by the following formula:
where represents the reaction force of the continuous phase acting on the discrete phase particles per unit volume.
In this paper, a VOF multi-phase flow model is used to trace the interface of the two gas and liquid phases. The VOF model is suitable for layered flow or free surface flow, which have relatively similar characteristics to those of the fluid medium studied in this paper. This flow can be described by the following equation:
The volume fraction of the main phase is computed according to the following constraint:
The RNGk-ε turbulence model was used to carry out relevant numerical simulation studies, and the turbulent viscosity was modified taking into account the mean change rate of the main stream over time. The model is described by the following formulae:
In these formulae, Gk represents the turbulent kinetic energy generated due to the average velocity gradient. Gb represents the turbulent kinetic energy caused by the buoyancy influence. YM represents the contribution of fluctuating expansion in compressible turbulence to the total dissipation rate. αk and αε represent the reciprocal of the effective Prandt number k and ε, respectively, and C1ε and C2ε are the custom source terms and are constants. Generally, their values are as follows: C1ε = 1.44 and C2ε = 1.9.
3.2. Cavitation Model
Ignoring the relative slip velocity and volume force between the bubble and the liquid phase, the Rayleigh–Plesset equation can be expressed by the following formula [29]:
The Schnerr–Sauer cavitation model can be described by the following formula [30]:
In this formula, RB represents the bubble radius, P represents the pressure around the bubble, PB represents the pressure inside the bubble, and PV represents the saturation pressure. The vapor phase volume fraction αv represents the number of bubbles per unit volume of liquid:
The bubble radius is described by the following equation:
3.3. Particle Motion Model
Based on the conservation equations of particle forces, the particle trajectories are calculated within the Lagrangian framework. The particle motion equations are described by the following formula:
In this equation, represents the drag force of particles per mass, the second term in Equation (12) represents the pressure source term, and represents other forces (these forces are not considered in the current study).
3.4. Wear Model
In this study, the impact rebound recovery coefficient model proposed by Forder et al. [31] is adopted to study the collision process between particles and walls. In this model, the normal phase component and tangential component are functions of the impact angle, and the expression is as follows:
The particle wear model adopted in this study is described by the following formula:
where E is the wall wear rate per unit area, md is the mass of the eroded particles, dp is the particle diameter, C(dp) is a function of the particle size, is the particle incidence angle, is a function of the impact angle, v is the impact velocity, b(v) is the impact velocity exponent, and Aface is the computed area of erosion on the wall. These values are related to the particle data and the particle and target characteristics. Considering the above description of the valve surface material and coating, in this paper, the values were constant and chosen by referring to the results of the high-temperature erosion wear test of a sample of Co-adhesive-coated WC on the impact surface of pulverized coal particles. A value of 2.3 was used [32].
3.5. Grid Division and Model Validation
3.5.1. Meshing and Independence Verification
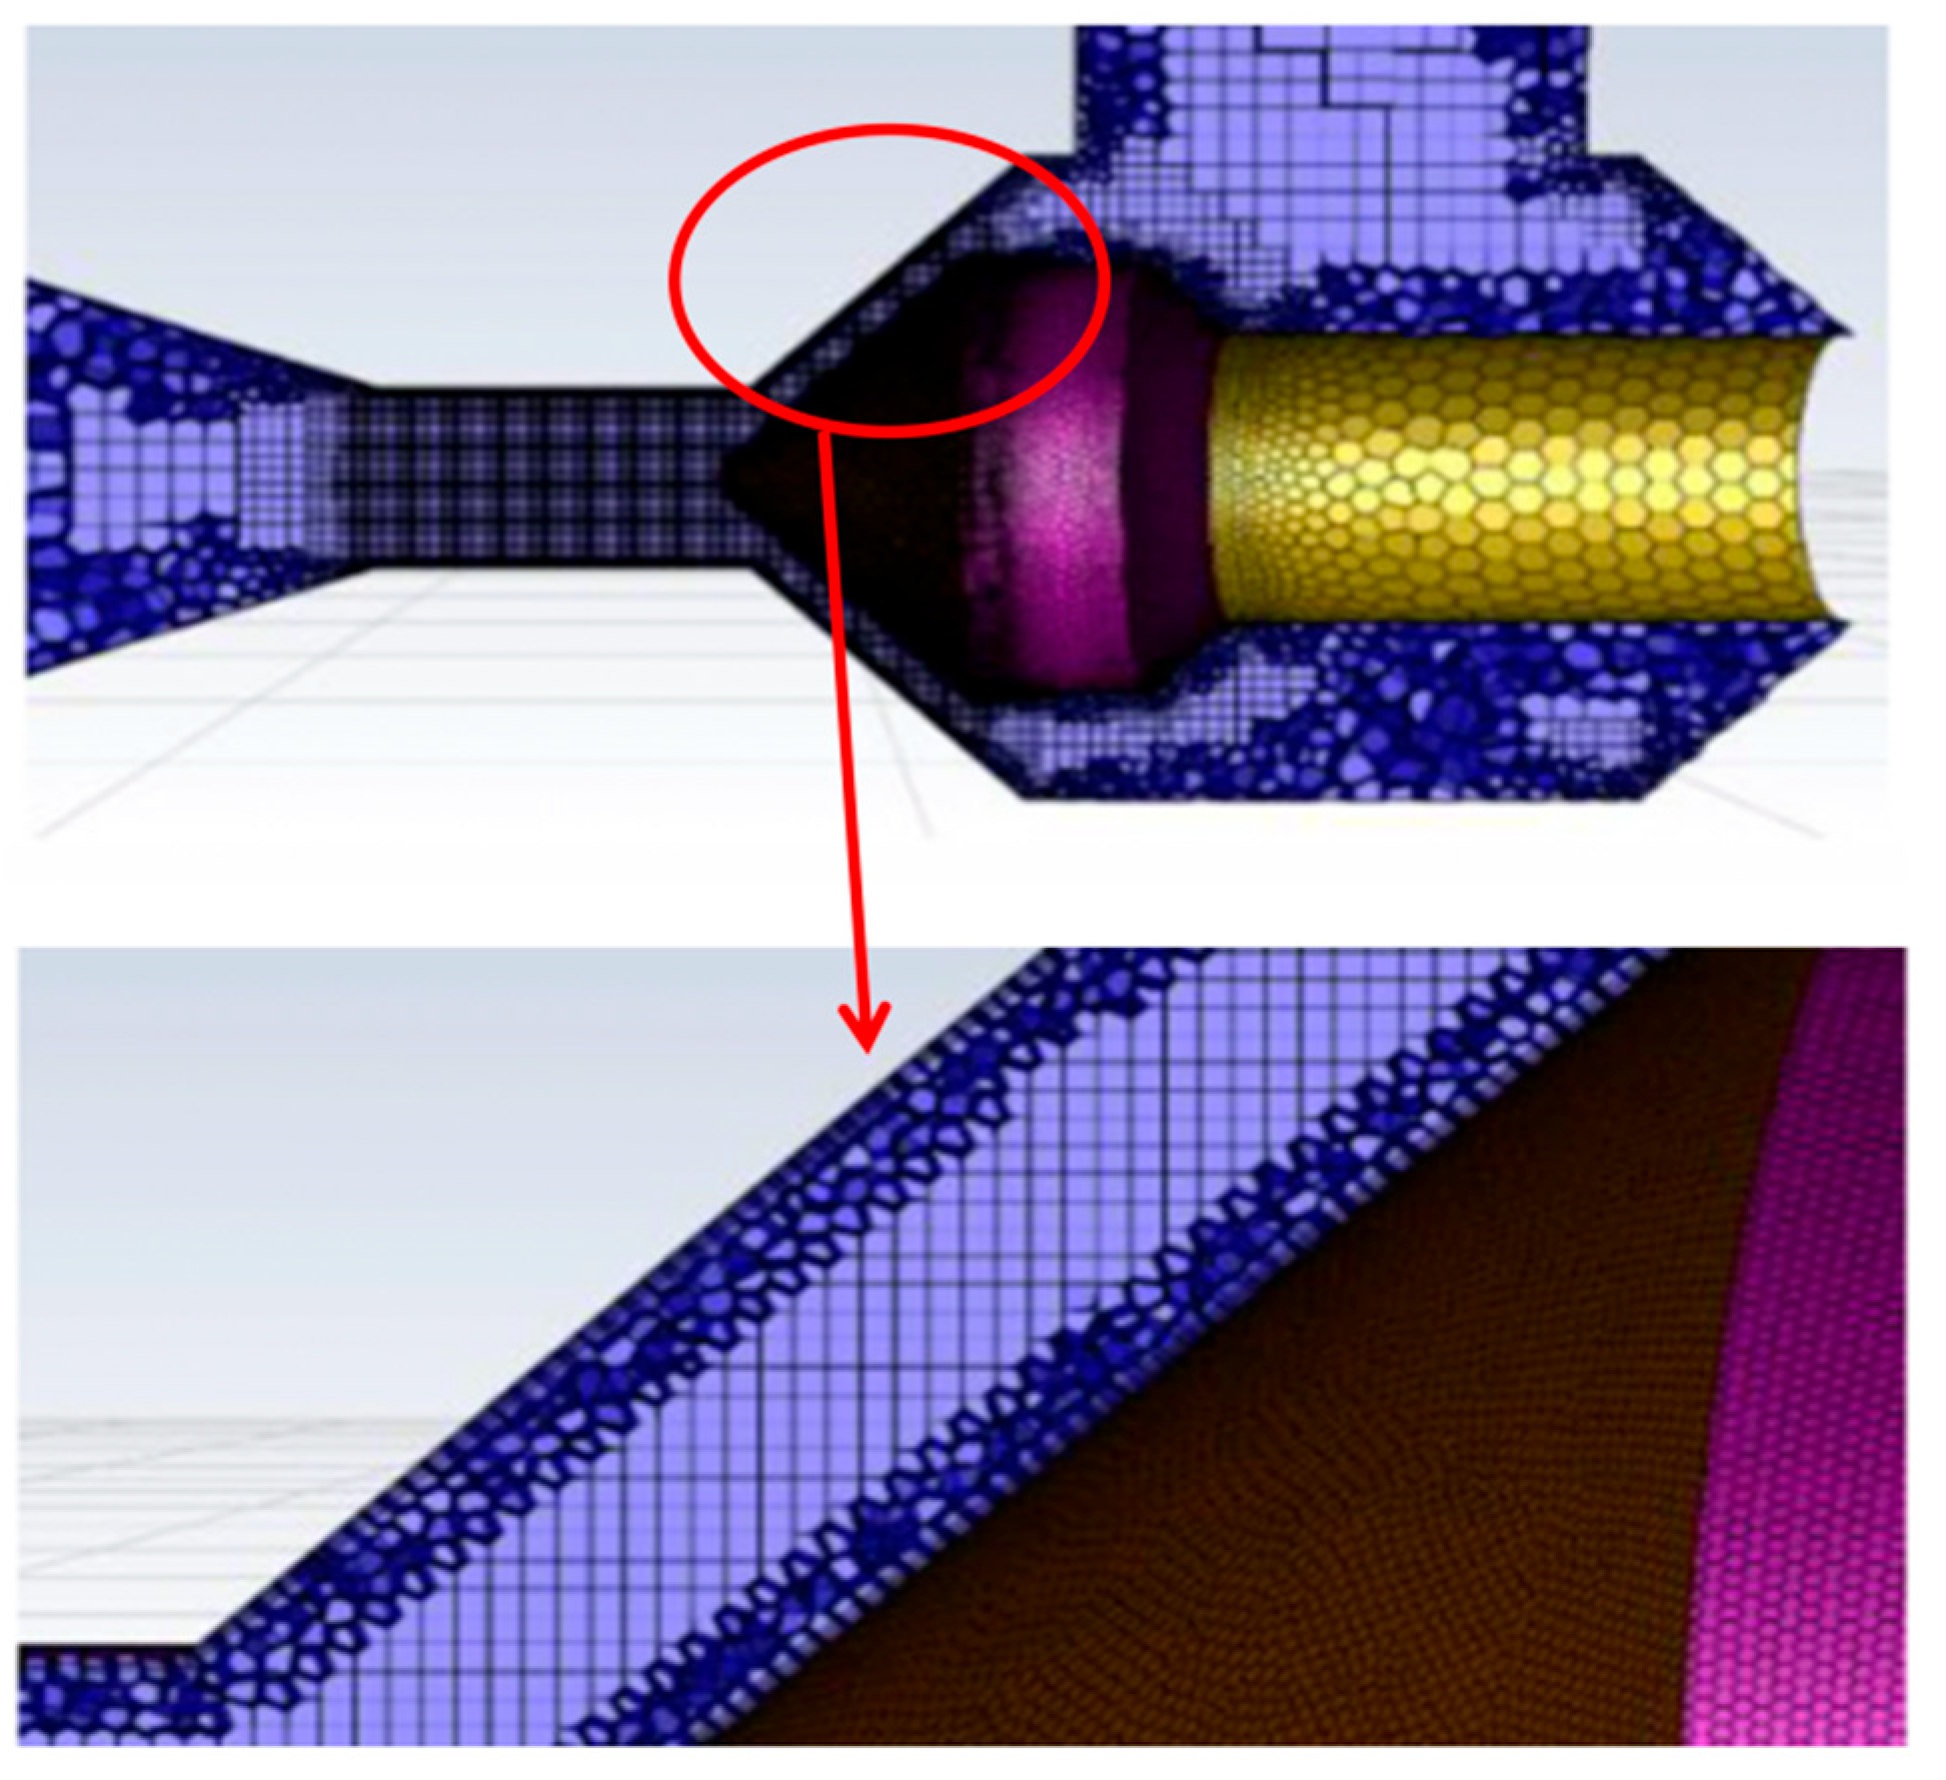
The entire valve was discretized using an unstructured mesh, where the external region was partitioned with a honeycomb-like structure, while the internal region was meshed with hexahedral elements. To accurately capture the intricate flow variations in the throttling region, local mesh refinement was applied to the gap between the valve core and the wall, as well as the downstream contraction section of the valve core. The mesh configuration is illustrated in Figure 5.

Figure 5.
Meshing and local encryption.
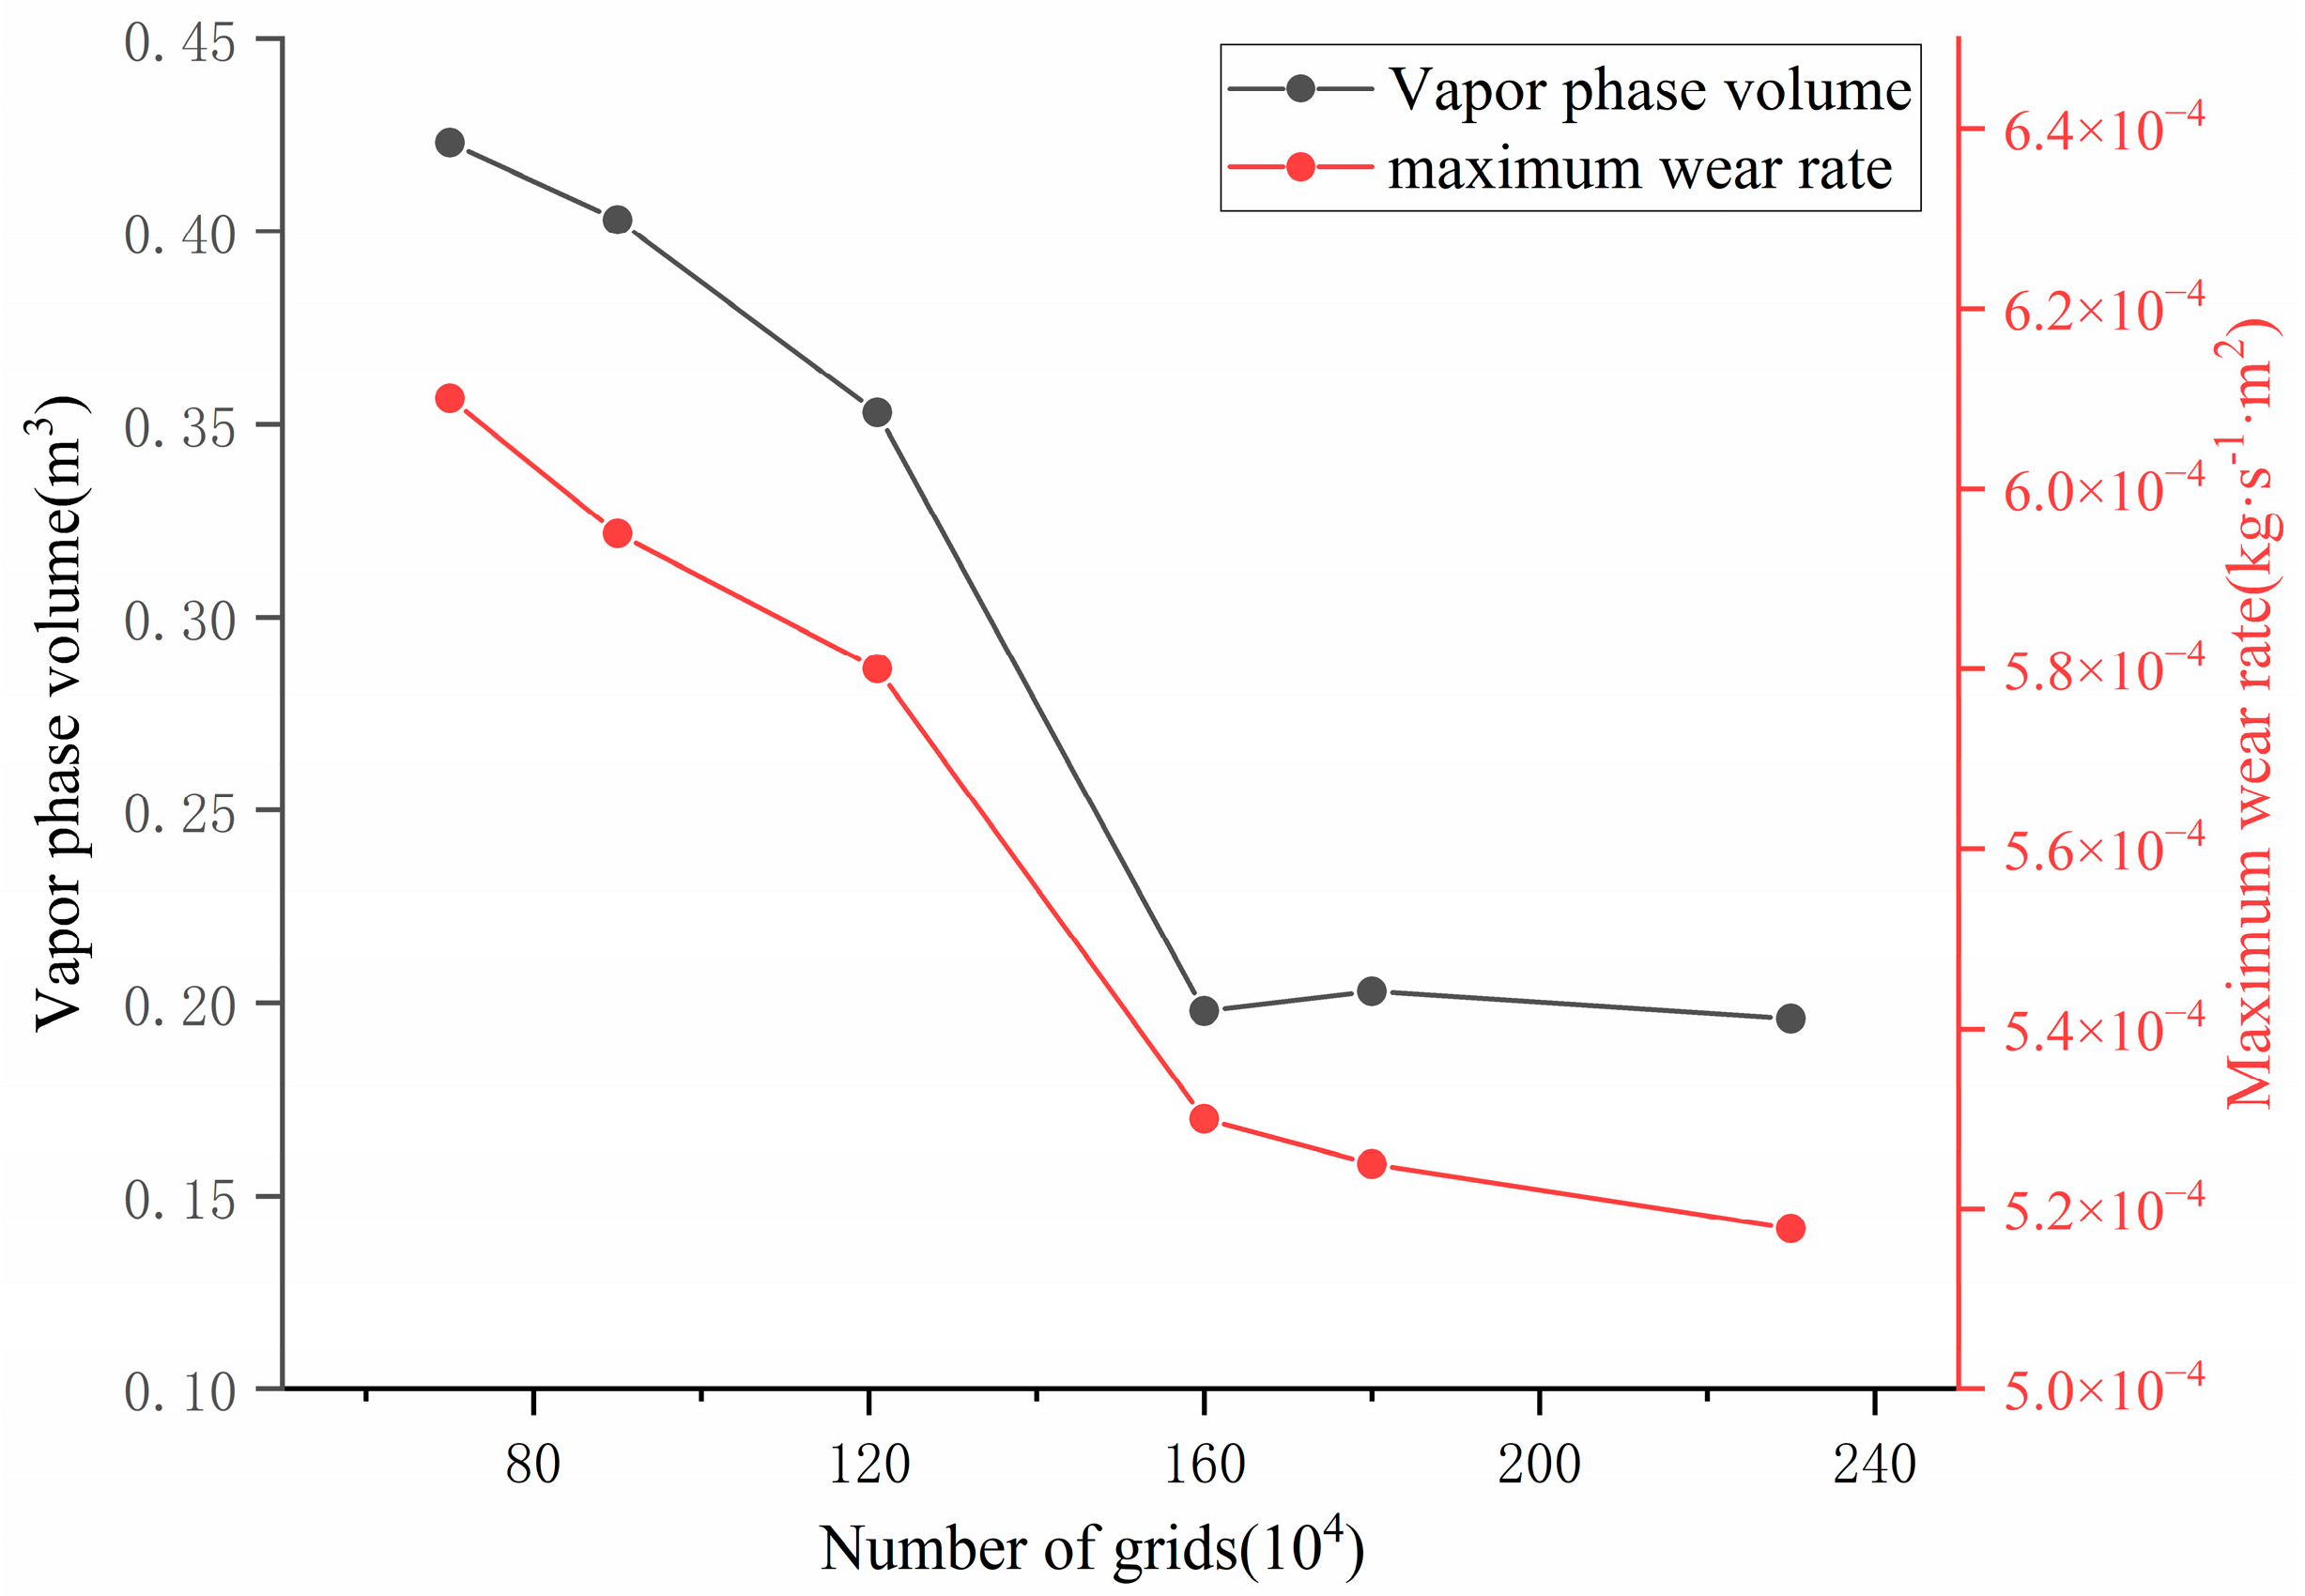
The grid independence verification is illustrated in Figure 6. The gas phase volume inside the valve and the maximum wear rate on the valve core surface were calculated for different mesh sizes. The results demonstrate that when the number of mesh elements is less than 1 million, the predicted gas phase volume fraction and wear rate exhibit low accuracy and consistency, with significant variations. However, when the number of mesh elements exceeds 1.6 million, the variations in the gas phase volume fraction and wear rate become minimal and stabilize. Therefore, to ensure both accuracy and computational efficiency, a mesh size of 1.75 million elements was selected for subsequent calculations.

Figure 6.
Grid independence verification.
In the simulation of the internal flow characteristics of the hydraulic control valve, the inlet and outlet of the fluid were defined as the pressure inlet and the pressure outlet, respectively, and the temperature of both were set to the same value of 415 °C. It is worth noting that since this study focused on the flow characteristics, the change in temperature was not taken into account in the calculation, and it was assumed to be constant. With respect to wall boundary conditions, the spool and seat surfaces were set to have no slip boundary conditions. The PISO algorithm was used to couple pressure and speed. To accurately capture the physics of the cavitation flow, the QUICK scheme was used to discretize the pressure, momentum, turbulent kinetic energy, turbulent diffusion rate, and volume fraction.
3.5.2. Model Verification
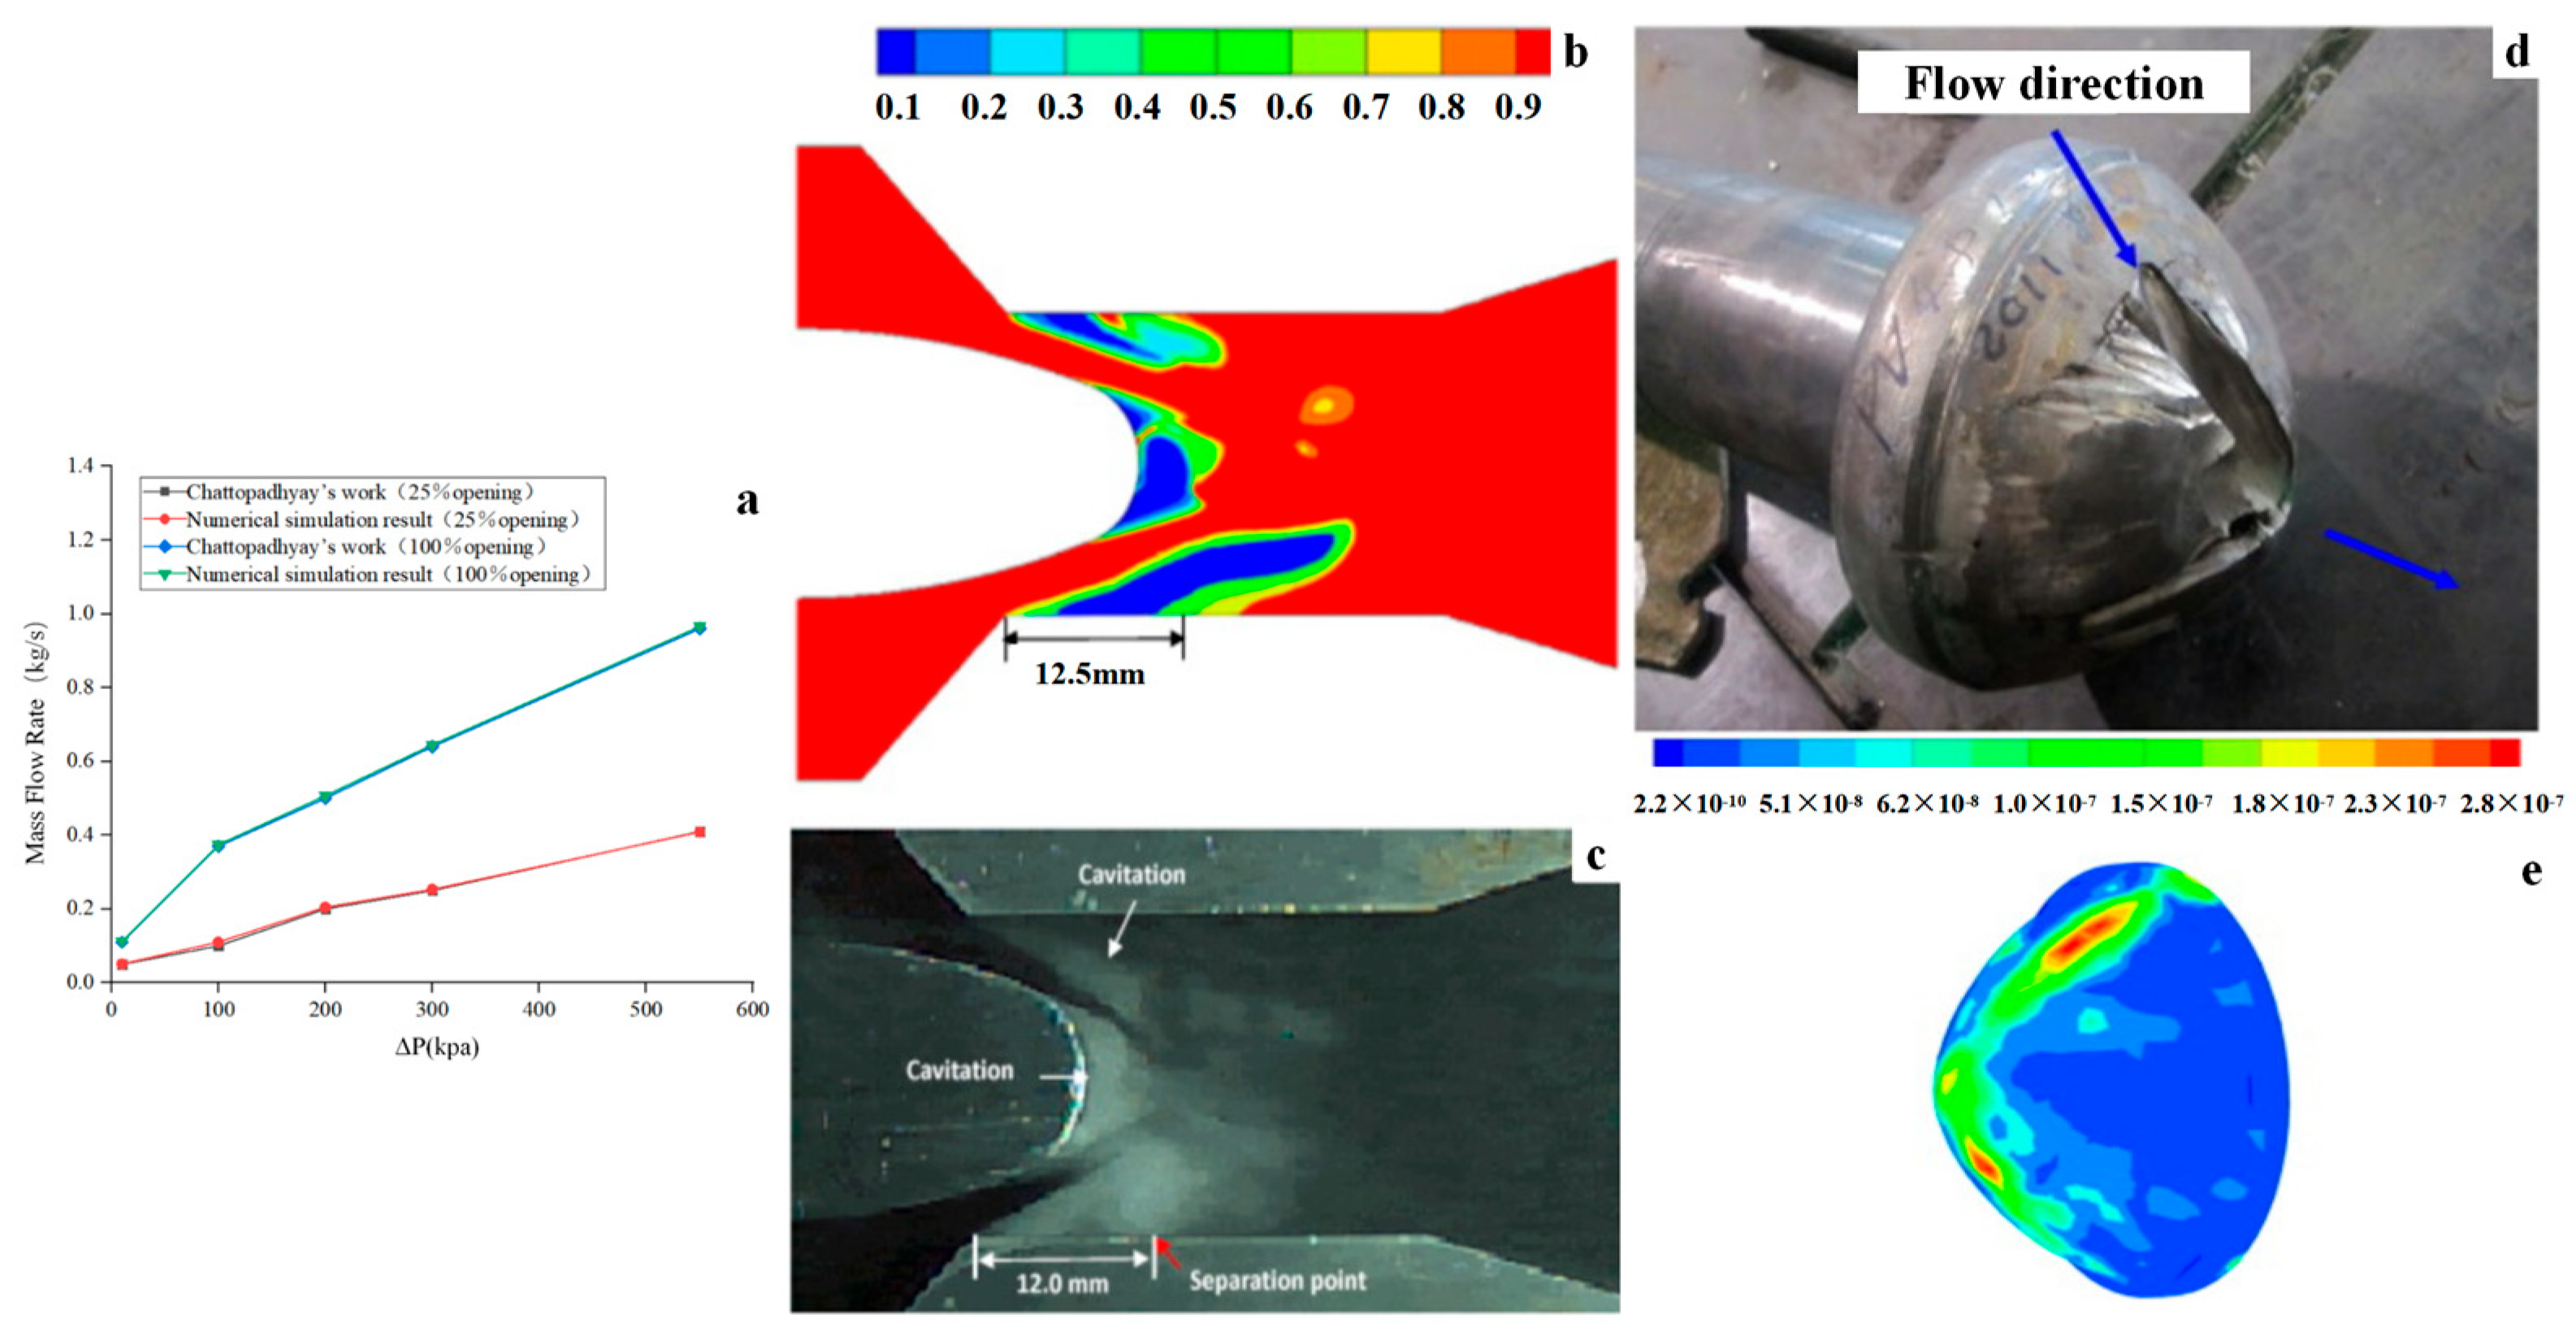
In order to verify the reliability of the numerical model established in this study for simulating flow characteristics, the experimental data of H. Chattopadhyay [33] regarding the flow field in a sliding control valve were selected for comparison. The valve in the above study was a needle-type regulating valve, and its structure was highly similar to the conical regulating valve featured in this study. Using the numerical simulation prediction method carried out through the above model, the flow characteristics of both the valve in the above study and the regulating valve were numerically simulated and analyzed under different inlet and outlet pressure conditions, as shown in Figure 7a. In order to ensure the comprehensiveness and representativeness of the verification process, the mass flow rates of the valve under different inlet and outlet pressure differences and under two typical opening conditions of 25% and 100% were selected for comparative analysis. The results of the numerical simulation method established in this study are in good agreement with Chattopadhyay’s experimental data in the pressure difference range of 10 KPa–550 KPa. By contrast, it can be seen that the difference between the calculated and experimental values of the flow characteristics under each working condition is less than 4%, which fully verifies the accuracy of the numerical model.

Figure 7.
Model verification results. (a) Flow characteristics verification results. (b) Cavitation numerical simulation results. (c) Cavitation experiment results. (d) Actual appearance of spool wear. (e) Numerical simulation results of spool wear.
In our previous study, we verified the accuracy of the cavitation and wear models in the valve calculation. The verification results of the cavitation model are shown in Figure 7b,c. The numerical simulation results show that the cavitation phenomenon is mainly concentrated at the top of the spool head and the inlet area of the seat, which is highly consistent with the experimental observation results. In addition, the experimental results showed that the cavitation presented an asymmetric phenomenon on the upper and lower walls of the valve seat, which was also confirmed in the numerical simulation. The simulation results also successfully captured the dynamic evolution process of the cavitation cloud, including complex phenomena such as the shedding and separation of the cavitation cloud. In order to quantitatively evaluate the accuracy of the numerical model, a comparative analysis of key geometric features was performed in this study. The measured gap was 12.5 mm, while the gap determined in the numerical simulation was 12.0 mm. The relative error between the two was only 4% [34], showing that the choice of cavitation model was reasonable.
Figure 7e shows our previous research on the wear of a decompression feed valve. The calculation results show that the areas on the spool surface with the most severe wear—2–3 orders higher on average than the other parts—are located on the upper and lower sides facing the inlet direction. However, Figure 7d shows the actual damage morphology of the valve core. This figure shows that the surface of the valve core has clear particle erosion traces, and that material loss near the center area of the valve core is very severe, forming a deep groove. By contrast, it can be seen that the actual failure appearance of the valve core is not very consistent with the numerical prediction results, which verifies the reliability of particle erosion wear calculations [35].
4. Analysis of Calculation Results
Changing the valve spool structure has a certain impact on the flow path of the valve. After consulting the valve manufacturers and investigating the regulating valves for the coal liquefaction process, we learned that there are a wide range of valve spool angles during design and production. According to the adjustment characteristics of the valve during actual operation, five valve spool angles that do not affect flow regulation are studied in this paper: 72°, 90°, 98°, 105°, and 120°. These spool angles encompass acute, right, and obtuse angles, ensuring the accuracy and comprehensiveness of the study. According to the above numerical simulation method, the flow, empty air, and particle wear characteristics of the valve are simulated.
4.1. Flow Analysis Under Different Spool Structures
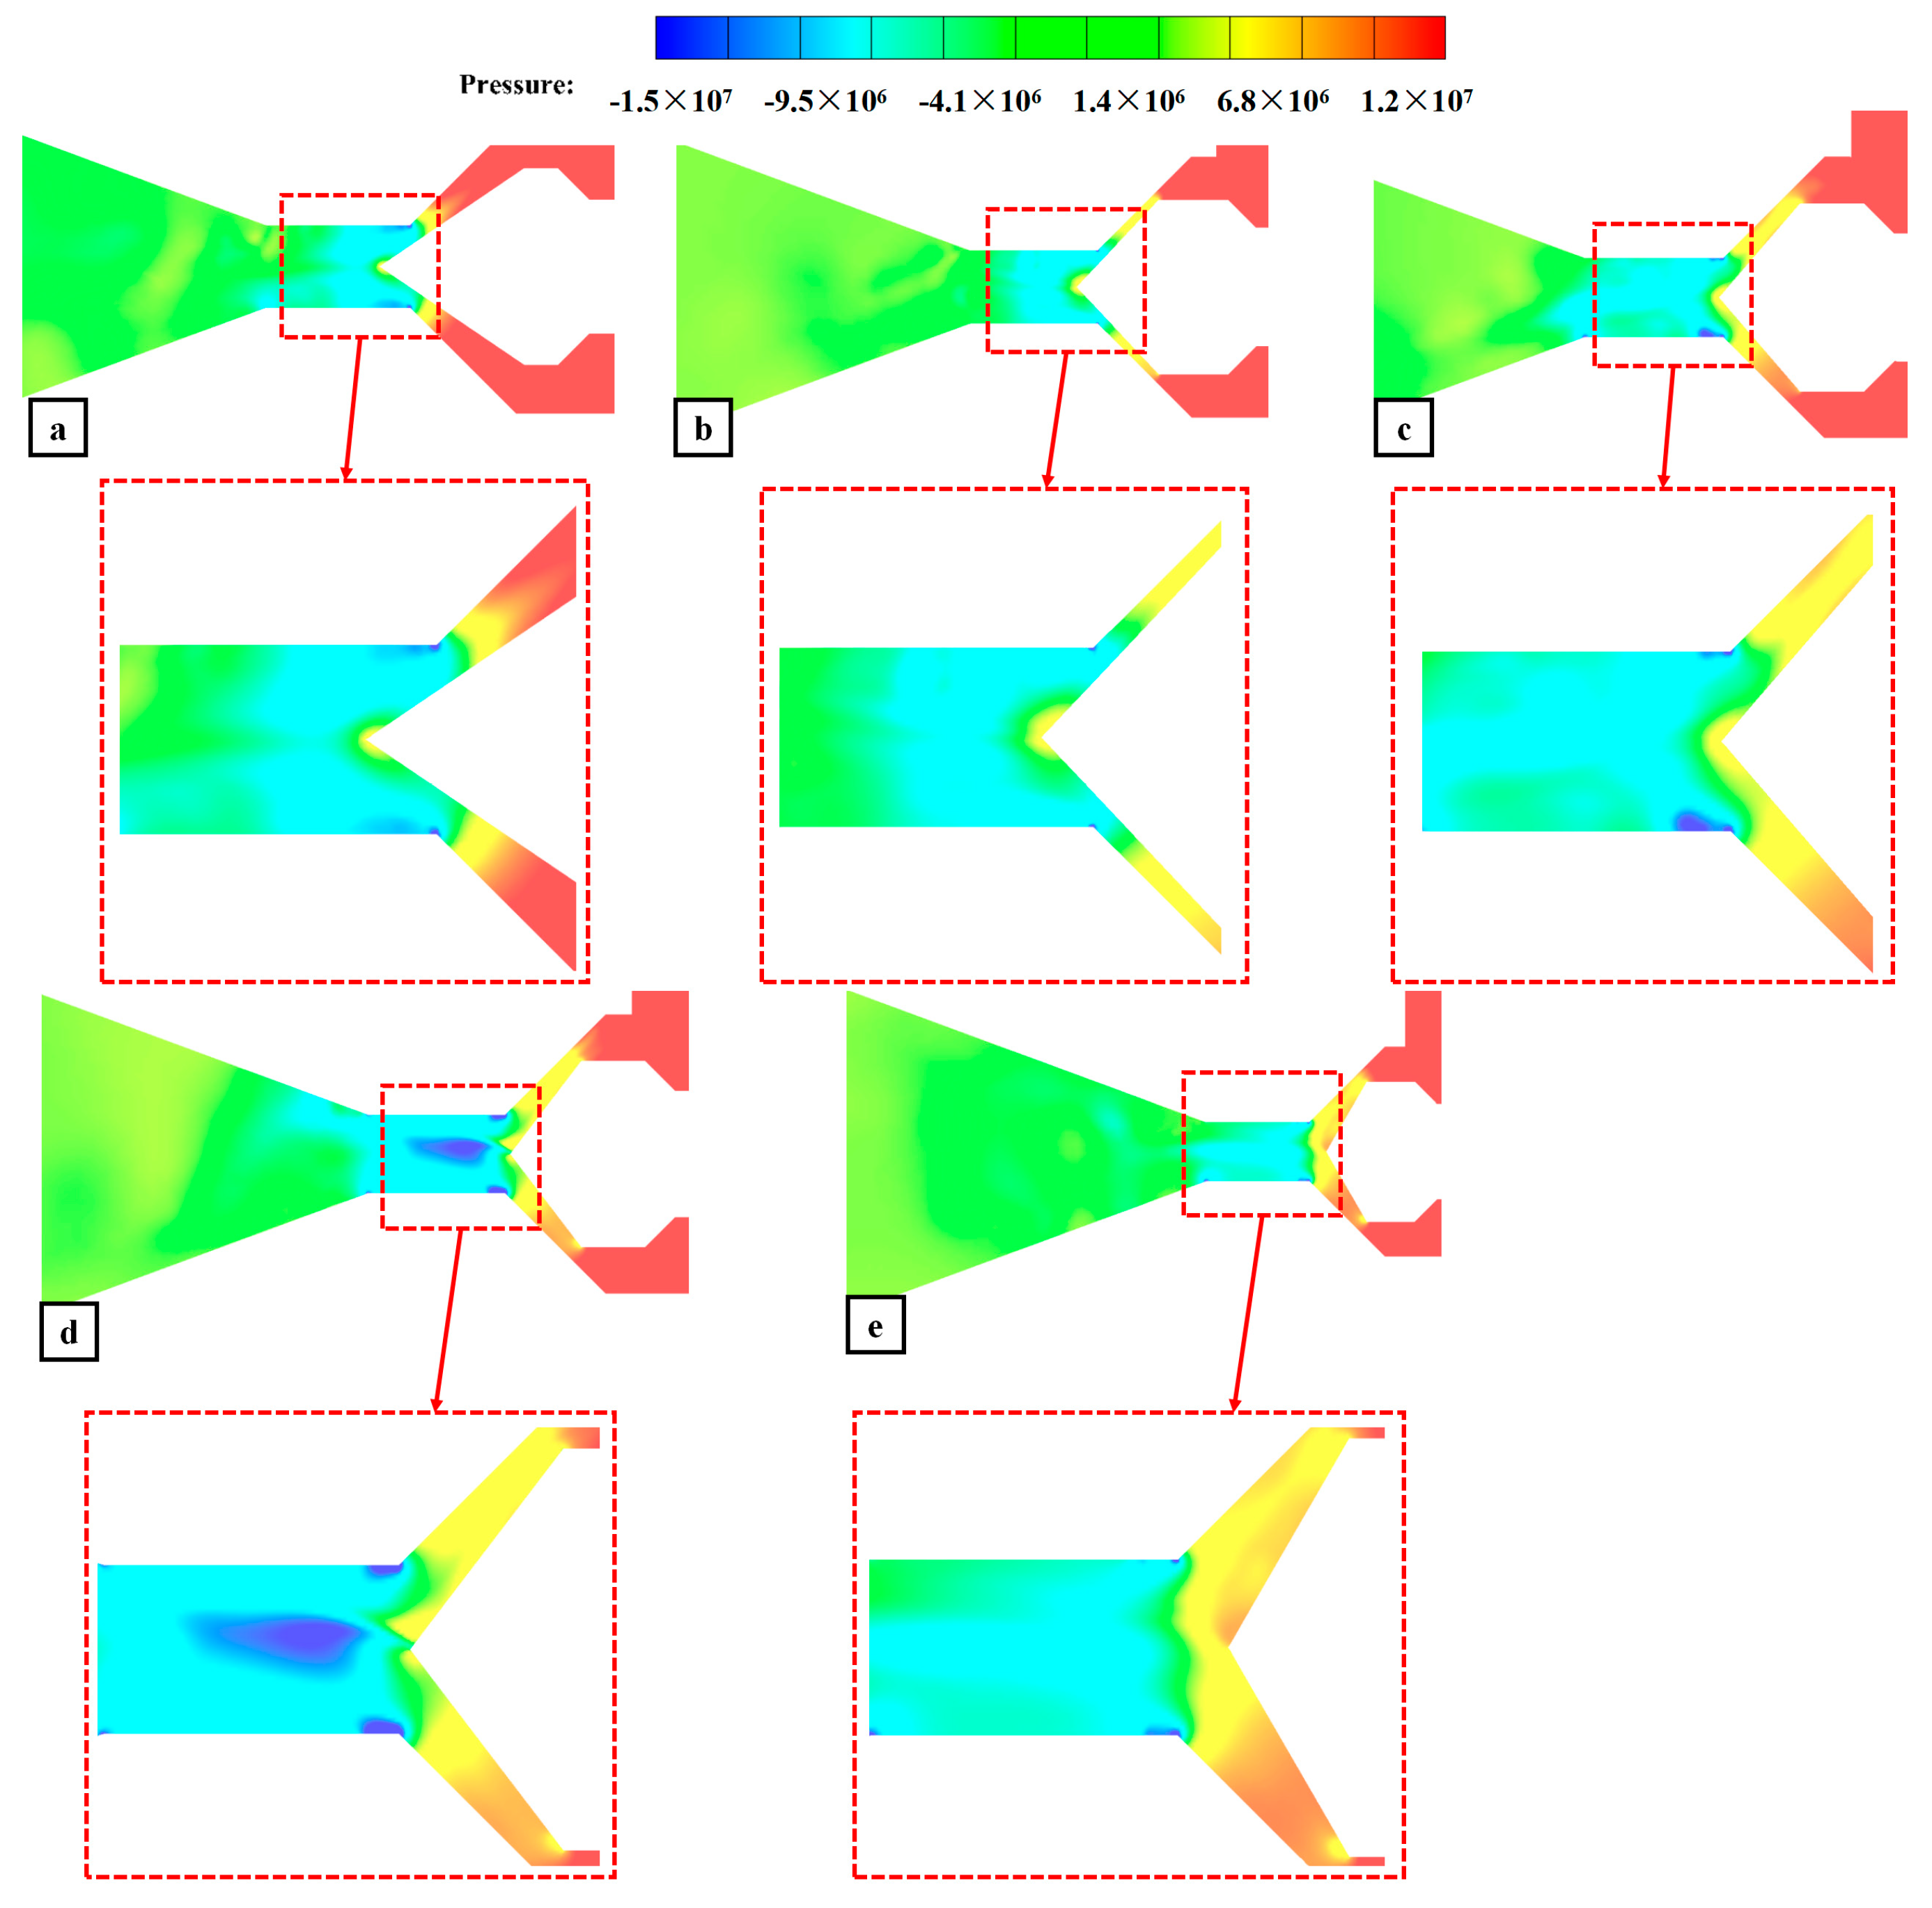
The pressure field in the valve can reflect the flow characteristics of the flow field, which are an important indicator of flow stability. Figure 8 shows the pressure distribution cloud diagram of the valve with different XY spool angles. The structure between the spool and the seat will produce a throttling effect. When the fluid enters the downstream straight pipe section from the throttling section, the flow area increases and the pressure rises rapidly. As can be seen in Figure 8b, when the spool angle is 90°, the pressure downstream of the spool and the gap between the spool and the seat is more uniform, and the pressure near both sides of the wall is more uniform than that of the other two structures. The local bias flow in the valve can be effectively inhibited and the valve flow is more stable under this structural condition.
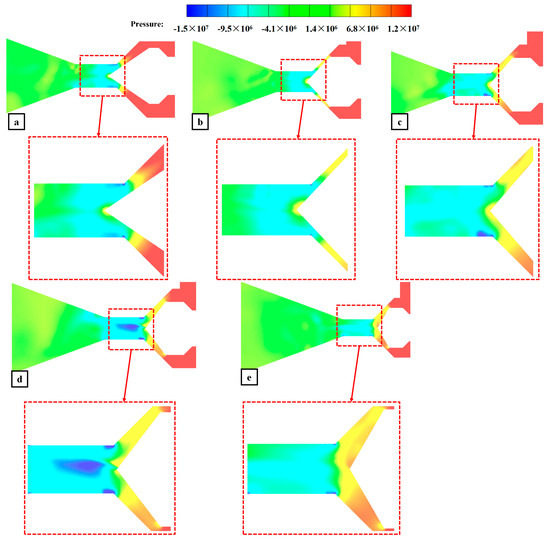
Figure 8.
Pressure distribution cloud maps under different spool structures ((a) 72°, (b) 90°, (c) 98°, (d) 105°, (e) 120°).
The velocity distribution can reflect the flow state of the fluid inside the valve and is also an important parameter for predicting valve damage. Therefore, the velocity distribution under several spool structure conditions is analyzed. Figure 9 shows the velocity distribution on the XY plane for different spool structures. The calculation results show that when the spool angle is 72° (Figure 9a), the flow rate of fluid flowing through the downstream of the spool is larger. The flow rate of the fluid near the downstream shrinkage section at the top of the spool and at the gap between the spool and the seat is 280 m/s to 350 m/s, and there are two large high-speed flow areas. The flow rate of the downstream expansion section of the valve is 120–190 m/s, and there is no clear bias phenomenon in the downstream expansion section under this structural condition. When the spool angle is 90°, the flow rate near the top downstream contraction area of the spool and at the gap between the spool and the seat is 180 m/s to 220 m/s, and the flow rate of the downstream expansion section of the valve is 80 m/s to 120 m/s. Compared with the valve core angle of 72°, the flow rate of all parts of the valve is significantly reduced, but at this time, a bias phenomenon begins to appear in the valve expansion section. The high-speed flow of the downstream expansion section of the valve is concentrated in the lower side wall of the valve, while the upper side wall features a large area of low-speed flow.

Figure 9.
Velocity distribution in the meridian plane of the angle valve with different spool shapes ((a) 72°, (b) 90°, (c) 98°, (d) 105°, (e) 120°).
When the spool angle is 98°, the flow rate at the gap between the spool and the seat is 140–180 m/s, and the flow rate in the downstream contraction area of the valve is 200–260 m/s. The flow rate of the downstream expansion section is 100–220 m/s. At this time, the flow velocity increases compared to the two structures with angles of 72°and 90°, and it can be seen from Figure 9c that under this spool structure, a more evident bias phenomenon occurs in the valve expansion section. The flow velocity near the lower wall of the expansion section is much higher than that on the upper wall of the expansion section. The speed of the lower wall of the valve expansion section is 170–200 m/s. The impact of high-speed fluid on the lower wall of the expansion section is more intense.
When the spool angle is 105°, the flow rate at the valve gap is 100–160 m/s, the flow rate of the downstream flow contraction section of the spool is 240–260 m/s, and the flow rate of the downstream expansion section of the valve is 100–220 m/s. The drift of the downstream expansion section of the valve at this time is compared with that of the valve core structure of a 98° angle. It can be concluded that when the spool angle is 105°, the flow rate at the lower wall of the downstream expansion section of the valve is significantly reduced, the bias phenomenon is also alleviated, and the impact on the lower wall is weakened. When the spool angle is increased to 120°, the flow rates at the gap between the spool and the seat and at the downstream contraction section of the valve are close to those at a spool angle of 105°. However, the flow characteristics in the downstream expansion section of the valve change. When the spool angle is 120°, the bias phenomenon in the expansion section is significantly weakened, and the flow rates between the upper and lower wall of the valve are relatively similar.
In order to further study the flow and bias characteristics in the contraction and expansion sections, four planes (x1–x4) are intercepted, and the flow rate and velocity field uniformity for different spool structures and different parts of the valve are analyzed. The influence of different spool structures on the flow uniformity of the control valve is further analyzed. Figure 10 shows the selected locations of the four sections. Sections x1 and x2 mainly allow for the study of the flow characteristics of the valve expansion section, and sections x3 and x4 mainly allow for the study of the flow characteristics near the spool and the downstream contraction section of the spool.

Figure 10.
Four analysis planes perpendicular to the valve stem.
Figure 11 shows the velocity field of the four sections (x1–x4) when the spool angle is 72°. At this angle, the fluid flows through section x4 in the spool’s downstream contraction section. The velocity at the right wall is generally less than the velocity at the left wall. However, at this time, the high-speed fluid is concentrated in the central area of the valve, and there is no bias phenomenon. When the fluid continues to flow through section x3, the overall flow rate decreases at this time, and there is a high-speed flow area at the center of this section. At this point, a bias phenomenon begins to appear. The flow rate near the right wall of the valve is much greater than that at the left wall. However, comprehensive analysis shows that the velocity near the wall is low at this time. High-speed fluid is still mainly concentrated in the center area of the valve, and the bias phenomenon in the contraction section is not very clear. As the fluid continues to flow downstream to the valve expansion section (cross-sections x1 and x2), the flow area increases. In section x2, flow deviation clearly begins to appear. The high-speed fluid begins to deviate from the downward wall. At this time, the fluid flow may appear unstable, and there are large vortices near the wall. In cross-section x1, the flow velocity decreases further. At this time, the bias phenomenon begins to develop near the left wall, and most of the flow in the area on the right side has a lower velocity. When the spool angle is 72°, the overall flow rate in the valve is higher, and there is a clearer bias phenomenon in the expansion section, which will cause more serious erosion and wear on the unilateral wall of the valve. Thus, the structure is not suitable for the long-term safe operation of the valve.

Figure 11.
Velocity distribution of four sections at a 72° spool angle.
Figure 12 shows the velocity field cloud images of the four sections (x1–x4) inside the valve when the spool angle is 90°. When the fluid flows through sections x3–x4 of the valve downstream contraction section, the valve velocity field distribution is similar to that when the spool angle is 72°, and the high-speed fluid is distributed in the circular direction, but the flow rate at this time is reduced compared to the spool angle of 72°. At this time, the low-speed area is mainly distributed near both sides of the wall. When the fluid flows through sections x1–x2 of the valve expansion section, the velocity is more evenly distributed around the circumference, and only a small part of the bias flow appears on the wall near the wall at the end of the valve expansion section (section x2). In addition, the flow in section x1 is almost uniformly distributed, and there is no clear high-speed flow area. This calculation shows that when the spool angle is 90°, the internal flow rate of the valve is reduced, and the eccentric jet is also mitigated compared to the structure with a spool angle of 72°.
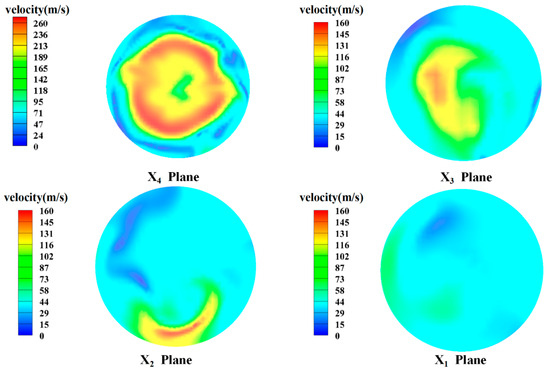
Figure 12.
Velocity distribution of four sections at a 90° spool angle.
Figure 13 shows the velocity field cloud images of the four sections (x1–x4) inside the valve when the spool angle is further increased to 98°. In the downstream contraction section of the valve core (sections x3–x4), the low-flow-rate area is reduced; in section x4, the fluid at the center of the valve moves at a high speed. When flowing through section x3, the high-speed-flow area is mainly concentrated at the left wall of the valve contraction section, and at this time, the eccentric jet is also more severe. The velocity near the wall is greater than 200 m/s. This means that the impact on the wall of the valve core is more severe at this time. In sections x1–x2 of the expansion section of the valve, the low-speed area in the valve increases and the flow rate of the valve decreases. However, near the left wall of section x2, the flow rate is still higher than that of other structures. This shows that under these conditions, the eccentric jet of the valve is more severe, which is not conducive to the continuous operation of the valve.
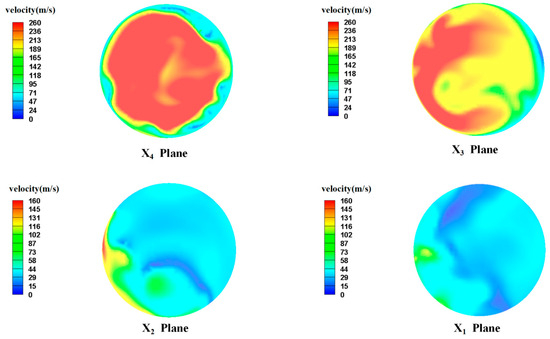
Figure 13.
Velocity distribution of four sections at a 98° spool angle.
Figure 14 shows the velocity field cloud images of the four sections (x1–x4) inside the valve when the spool angle is increased to 105°. At this time, the flow characteristics of sections x3 and x4 in the downstream contraction section of the valve core are similar to those when the cone angle of the valve core is 98°. In section x4, the high-speed flowing fluid is mainly concentrated in the central area, while in section x3, the high-speed-flow area is dispersed near the upper and lower walls, which indicates that the drift phenomenon at the back end of the downstream contraction section of the valve is more severe. The high-speed fluid is concentrated near the wall of the contraction section. The impact of the high-speed fluid on the wall’s surface is relatively strong. When the fluid flows through the downstream expansion section of the valve (cross-sections x1–x2), there is a significant bias phenomenon at the left wall of the valve expansion section. At this time, the area with a higher fluid velocity is mainly concentrated at the left wall of the valve expansion section. From the comprehensive analysis of the four cross-sections, we can see that under the conditions of this spool structure, the high-speed fluid is mainly concentrated at the wall of the valve, which can easily cause erosion wear failure in the valve.
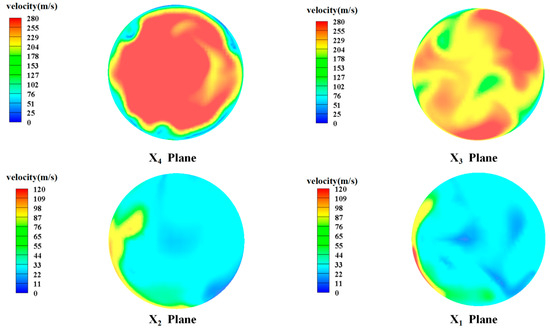
Figure 14.
Velocity distribution of four sections at a 105° spool angle.
Figure 15 shows the velocity field cloud images of the four sections (x1–x4) when the spool angle is 120°. In section x4, the high-speed flow area of the other four spool structures is mainly concentrated in the central area, while in section x4, under the condition of the 120° spool structure, the area of the high-speed flow area reaches its maximum compared to the other structures, and the high-speed flow area begins to approach the wall. In section x3, the high-speed flow area almost covers the entire section, and the overall flow rate in this section is larger. In addition, at this time, the valve drift phenomenon is also more severe. When the fluid is in the downstream expansion section of the valve (cross-sections x1–x2), its flow velocity is low at this time, and there is no clear bias phenomenon. However, in the flow velocity cloud diagrams of cross-sections x1 and x2 in Figure 9e and Figure 12, it can be seen that a large vortex appears in the valve expansion section under this structure. The head of the spool is surrounded by high-speed fluid and there is a reflux phenomenon. These phenomena will cause serious damage to the valve core and bushing parts, which is not conducive to the stable operation of the valve.
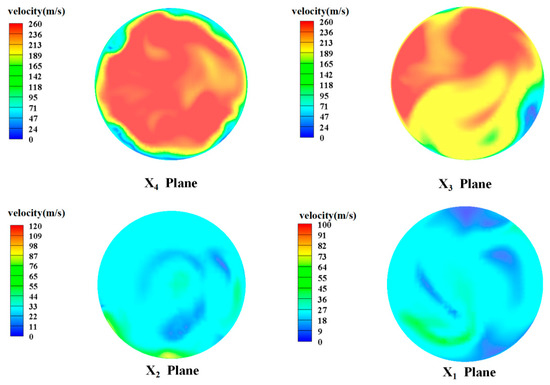
Figure 15.
Velocity distribution of four sections at a 120° spool angle.
To sum up, after a comprehensive comparison of several structures, we observe that when the spool angle is 72°and 90°, there is no clear bias phenomenon in the downstream contraction and expansion sections of the valve spool. However, when the spool angle is 72°, the flow speed of the fluid in each part of the valve is much higher than that when the spool angle is 90°. When the spool angle is 98°, 105°, and 120°, high-speed fluid migration to the wall of the valve is observed, alongside reflux, eddy current, and other conditions that are not conducive to the long-term stable operation of this valve. When the spool angle is 90°, the flow inside the valve is more uniform and there is no clear bias phenomenon. By using this structure, erosion wear damage to the valve can be reduced and it can be ensured that the valve has a long service life.
In order to study the influence of flow stability in the valve under different spool structure conditions, monitoring lines (monitoring line no. 1 on the upper side and monitoring line no. 2 on the lower side) are set along section A of the valve expansion section, section B of the valve spool downstream contraction section, and section C of the valve spool seat gap near the symmetrical wall surface. The position of the monitoring line is shown in Figure 16.
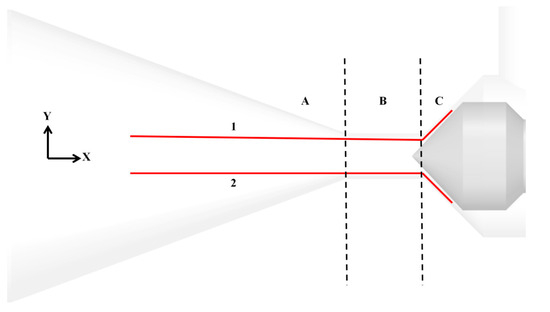
Figure 16.
Distribution diagram of pressure monitoring lines (1, 2 are the positions of the two monitoring lines respectively, and A, B, and C are three different pressure monitoring areas).
Figure 17 and Figure 18 show the pressure distribution at the upper and lower monitoring lines of the valve under different spool structures. When the working fluid enters the retracted part of the valve seat, the speed increases and the pressure decreases due to a reduction in the flow area. When approaching the top position of the downstream of the spool, the pressure drops to the lowest value and the velocity reaches its maximum. When the fluid flows through the downstream contraction section of the spool and the rear end diffusion section, the flow area increases, the pressure gradually increases, and then the area is stabilized. From the comparative analysis of the pressure fluctuations in Figure 17 and Figure 18, it can be seen that when the spool angle is 98°, 105°, and 120°, the pressure fluctuation at monitoring line no. 2 is more severe than that at monitoring line no. 1, indicating that there is an intense eccentric jet phenomenon near the lower side wall of the valve.

Figure 17.
Pressure distribution of monitoring line no. 1 (A, B, and C are three different pressure monitoring areas).
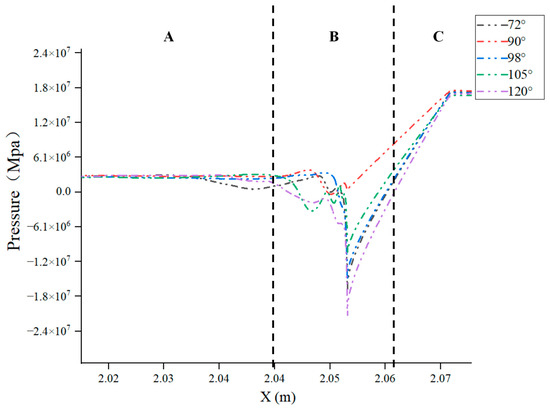
Figure 18.
Pressure distribution of monitoring line no. 2 (A, B, and C are three different pressure monitoring areas).
In contrast, when the spool structure is at 90°, the pressure fluctuations on both sides of the monitoring line are the smallest. When the spool angle is 90°, there is only a slight pressure fluctuation on both sides of the monitoring line from the downstream of the spool to the valve expansion section. Under this structural condition, only a slight shunt occurs on both sides of the valve. The high-speed fluid is mainly concentrated in the center of the valve, the flow under this structure is more stable, and erosion wear failure does not easily occur in the valve.
Through the calculation and analysis of flow characteristics under different spool structures, it is found that the pressure distribution on both sides of the valve wall is more uniform when the spool structure is at 90°, while the flow rate near the wall of the downstream contraction section of the valve core is low, and the eccentric jet phenomenon does not occur in the expansion section of the valve core. Combined with the pressure distribution at the monitoring line near the wall on both sides, it can be observed that the amplitude of pressure fluctuations near the wall on both sides of the valve is small. The high-speed fluid flow is mainly concentrated in the center area of the valve. Therefore, a stable flow of high-speed fluid is realized in the valve at a spool angle of 90°. At the same time, the serious phenomenon of damage to the valve side wall caused by eccentric jets is effectively reduced.
4.2. Cavitation Analysis Under Different Spool Structures
When the fluid flows through the throttling part of the valve, a phase change occurs, resulting in a large number of air bubbles, and the high-speed jet and shock wave generated when the cavity collapses will cause damage. Cavitation is also one of the important causes of valve damage. The cavitation of valves under different spool structure conditions is discussed below. In this study, the degree of cavitation is mainly reflected through the gas phase volume fraction and the volume of the gas phase in different areas of the valve. The higher the gas phase volume fraction and the larger the gas phase volume value, the more serious the cavitation phenomenon in the valve.
Figure 19 shows the gas phase volume fraction distribution cloud diagrams of the downstream contraction section and the front end of the expansion section of the valve under different spool structures. Due to the different spool structures, the flow channel structure in the valve changes accordingly. When the spool angle is 72° and 90°, the gas phase volume fraction near the wall of the downstream contraction section of the spool is higher, at about 0.6–1, but when the spool angle is 90°, the cavitation area is larger. When the spool angle is greater than 90°, the volume fraction near the wall of the downstream contraction section of the spool is reduced to 0.2–0.5. The cavitation conditions of the expansion section under five different spool structures are also compared, and the gas phase volume fraction near the wall of the downstream expansion section of the spool is lower, with a value in the range of 0.6–1. The cavitation region of the expansion section is similar in structure. Via an analysis of the gas phase volume fraction of the five spool structures, it is shown that the cavitation area of the downstream contraction section of the spool is slightly larger than that of the other four structures when the spool angle is 90°. The change in spool structure has no significant effect on the cavitation area or the volume fraction of the gas phase.
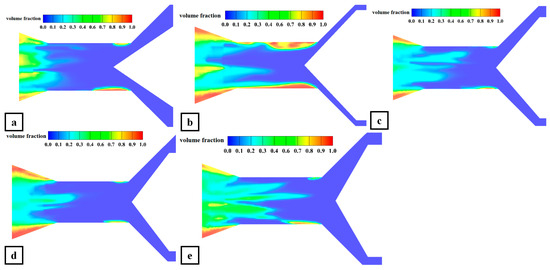
Figure 19.
Cloud images of gas phase volume fractions in valves under different spool structures ((a) 72°, (b) 90°, (c) 98°, (d) 105°, (e) 120°).
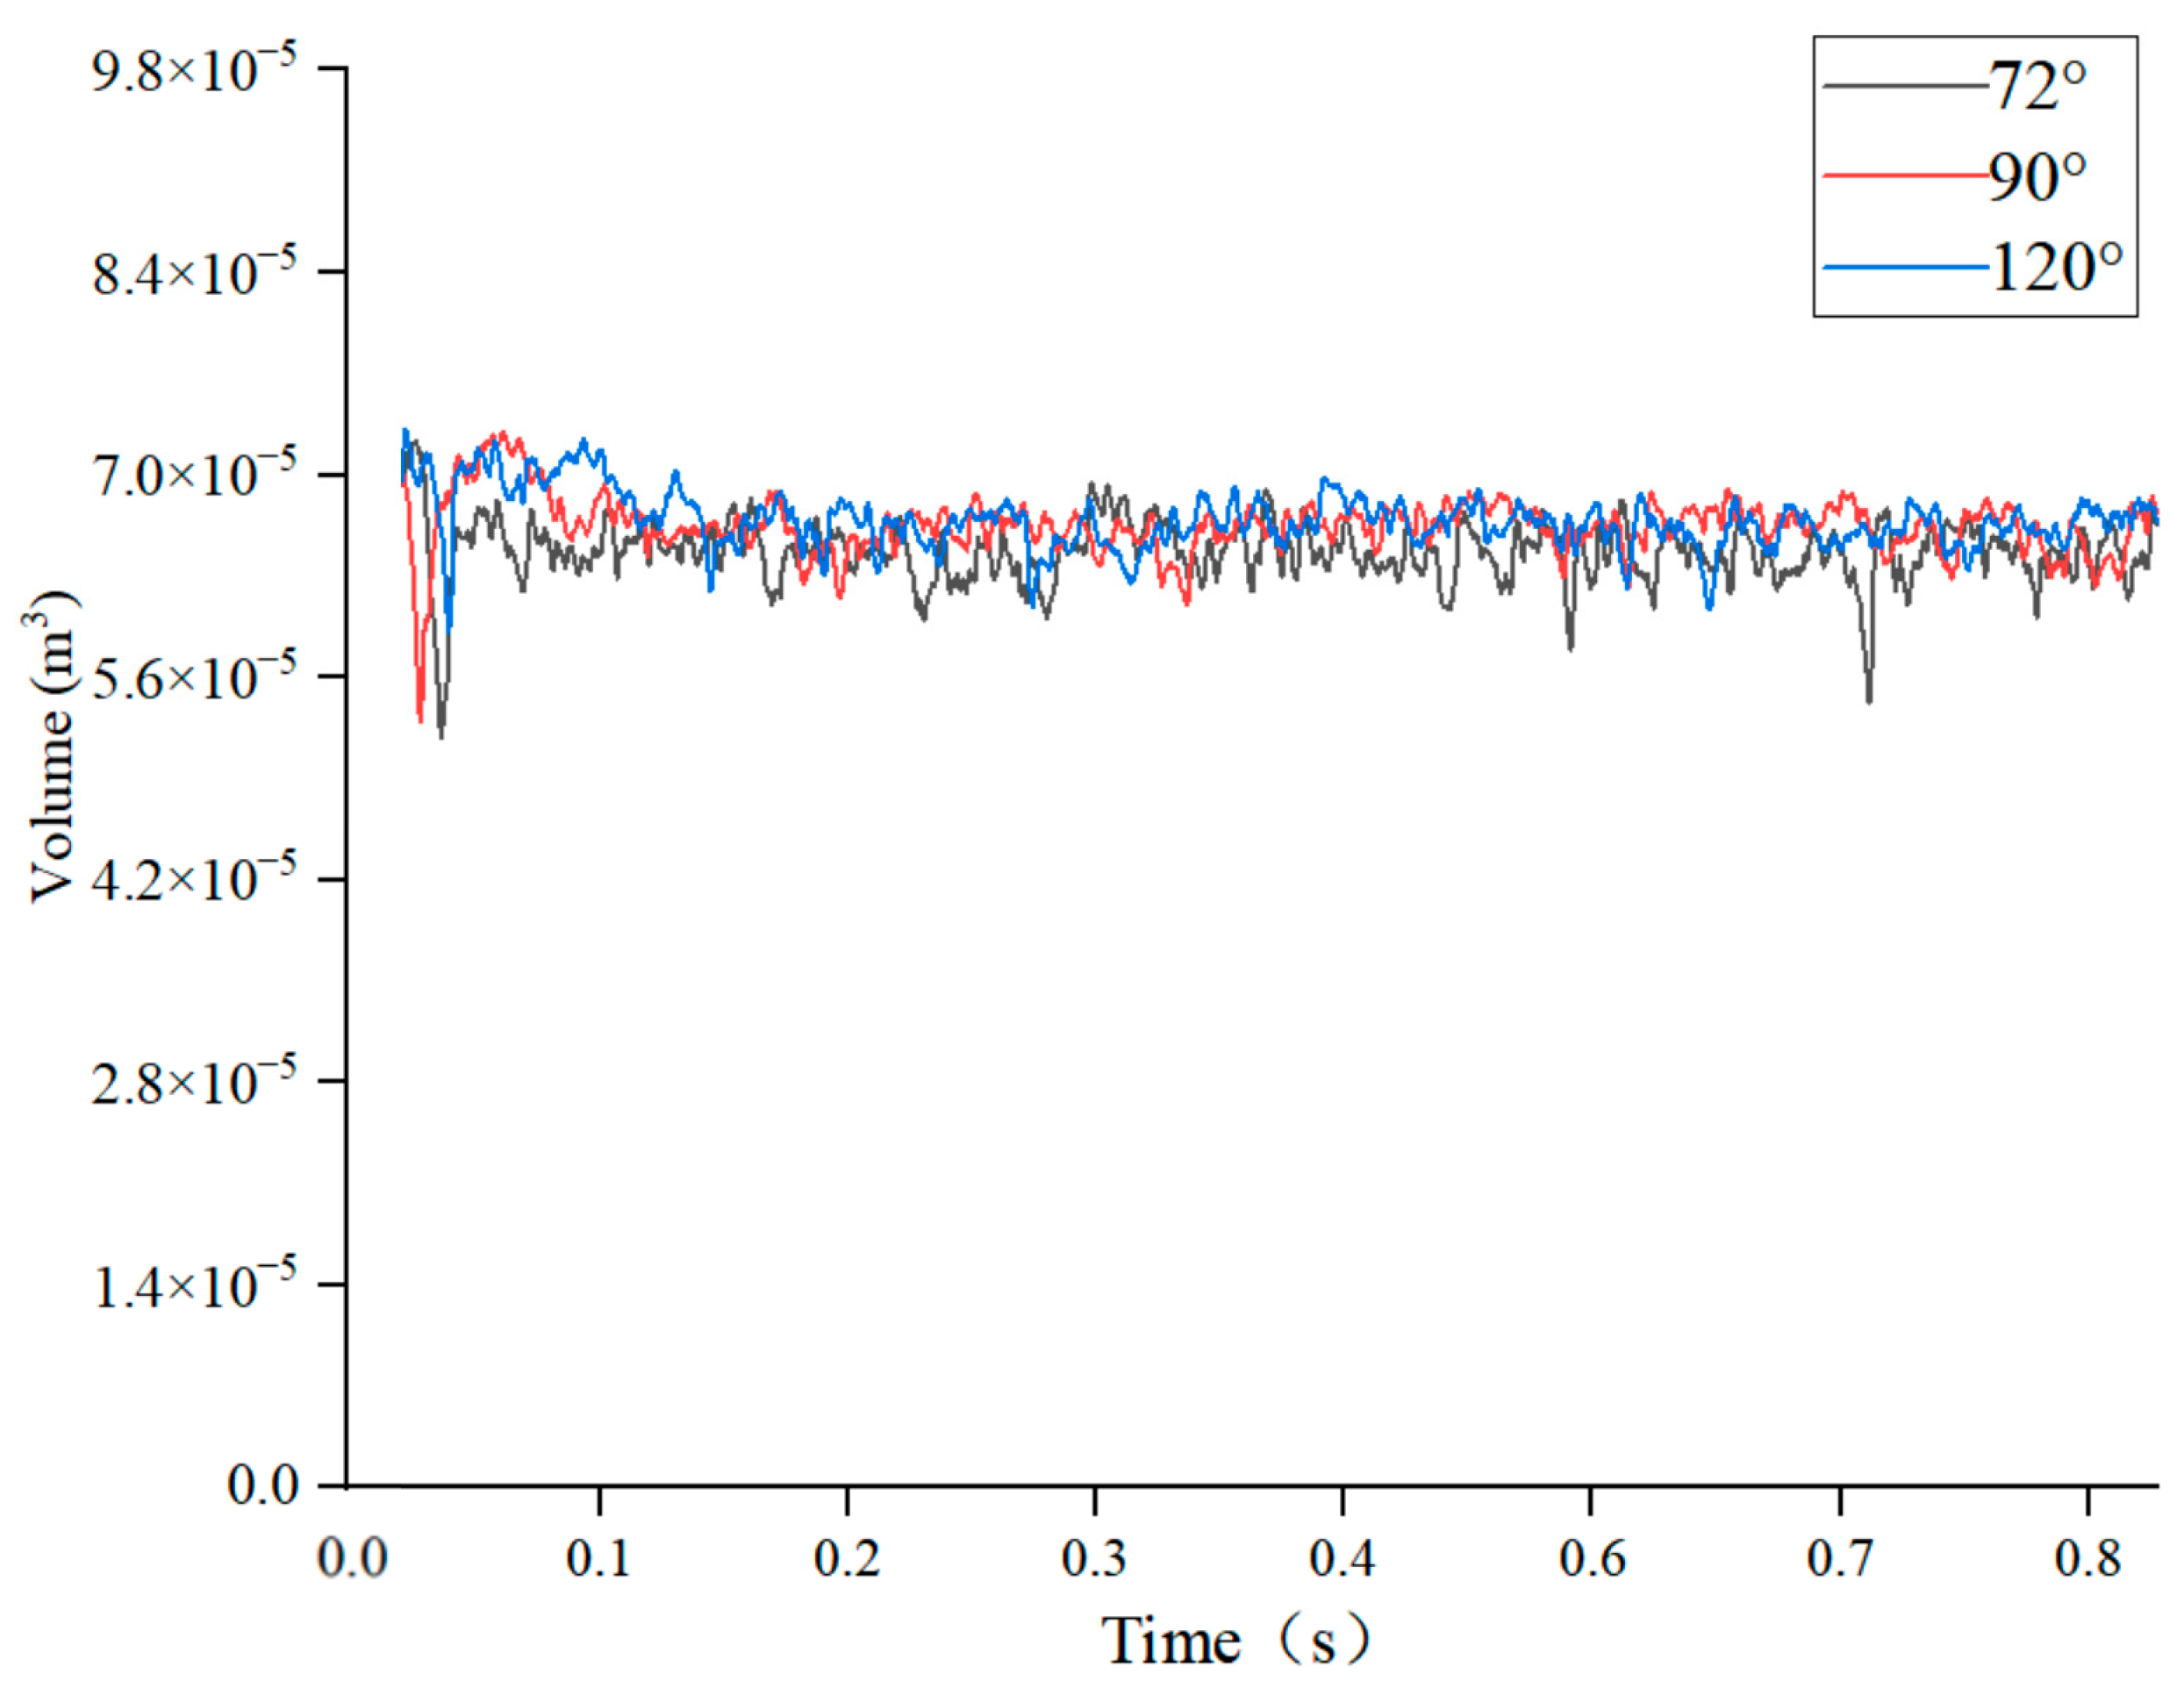
The volume of the gas phase in the valve is also an important parameter to reflect the severity of cavitation in the valve. Using this volume, the cavitation characteristics of the valve under different spool structures are analyzed. Figure 20 shows the change in the volume of the gas phase in valves with spool angles of 72°, 90°, and 120° with time. The volume of the gas phase of the valve peaks for a very short period of time and then fluctuates within a certain range; it also changes very little with the change in spool structure, and this change is negligible.
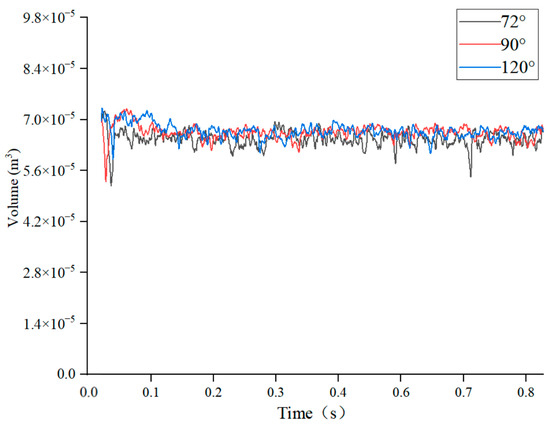
Figure 20.
Change in the volume of the gas phase in the valve with time.
Based on the cloud map of the gas phase volume fraction near the valve wall and the change in gas phase volume in the valve over time, it can be observed that these values do not change significantly when the valve core structure changes.
The turbulence intensity in the flow field can effectively reflect the stability and cavitation characteristics of the internal flow in the angle valve. Regions with higher turbulent kinetic energy also indicate greater energy dissipation within the fluid. At the same time, the turbulence intensity also has a certain influence on the cavitation phenomenon, and a region with a large turbulence intensity indicates that the flow in this region is more chaotic, and that the cavitation phenomenon is more intense. The following is a further analysis of the cavitation characteristics and flow stability in the valve, considering the turbulent kinetic energy of the valve core wall, the downstream contraction section of the valve core, and the valve expansion section.
Figure 21 compares the turbulent kinetic energy intensity of the valve core wall, the downstream contraction section of the valve core, and the valve expansion section at different spool angles. It can be seen from Figure 21a that the peak turbulent kinetic energy near the wall of the downstream contraction section of the valve core is 600–700 m2/s2. The turbulent kinetic energy at the wall of the valve core is similar to that in the downstream contraction section, and a higher turbulent kinetic energy area appears in the expansion section, indicating that the flow in the valve is relatively chaotic at this time. According to Figure 21b, when the valve core angle is 90°, the peak turbulent kinetic energy at the valve core wall and the downstream contraction section of the valve core decreases to 400–500 m2/s2, and this energy is more evenly distributed on both sides of the valve expansion section. This energy is not high, indicating that the flow in the valve is relatively stable at this time. As shown in Figure 21c, when the angle of the valve core increases to 98°, the highly turbulent dynamic region near the wall of the valve core increases significantly. At the same time, it can be seen that the turbulent kinetic energy at the lower side wall surface of the expansion section of the valve is significantly higher than that at the upper side wall surface, indicating that the flow in the valve is unstable and that the eccentric jet phenomenon in the valve is more severe. As can be seen from Figure 21d,e, when the angle of the valve core increases to 105°, the peak turbulent kinetic energy at the wall surface of the valve core and the downstream expansion section of the valve reaches 1000 m2/s2. The flow in the valve is relatively chaotic and the turbulent kinetic energy on both sides of the expansion section is high. When the spool angle is 120°, the high-turbulent-kinetic-energy area near the spool wall and in the expansion section is further expanded, and the flow is more chaotic.
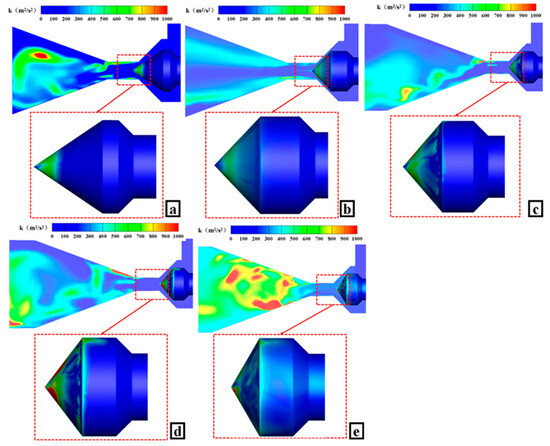
Figure 21.
Turbulent kinetic energy distribution at different spool angles ((a) 72°, (b) 90°, (c) 98°, (d) 105°, (e) 120°).
When the spool angle is 90°, the turbulent kinetic energy near the wall inside the valve is low and the flow is more stable, which means that damage and failure caused by an unstable flow inside the valve can be reduced.
To sum up, when the spool structure changes, neither the cavitation region nor the volume of the gas phase changes significantly. However, when the spool angle is 90°, the turbulent kinetic energy in the valve is low and the distribution is more uniform, indicating that the cavitation phenomenon in the valve is not severe, and that the flow is relatively stable when the spool angle is 90°.
4.3. Wear Analysis Under Different Spool Structure Conditions and Process Parameters
When the spool structure changes, the characteristics of the particles in the gap of the spool seat will change greatly due to the change in the flow path structure, and the valve will be subjected to different wear conditions. Therefore, the wear characteristics under several different spool angles are analyzed. In this section, the maximum wear rate of the valve under different spool structures is calculated and compared, and the maximum wear rate on the transverse and inclined walls of the valve core under different spool structures is studied.
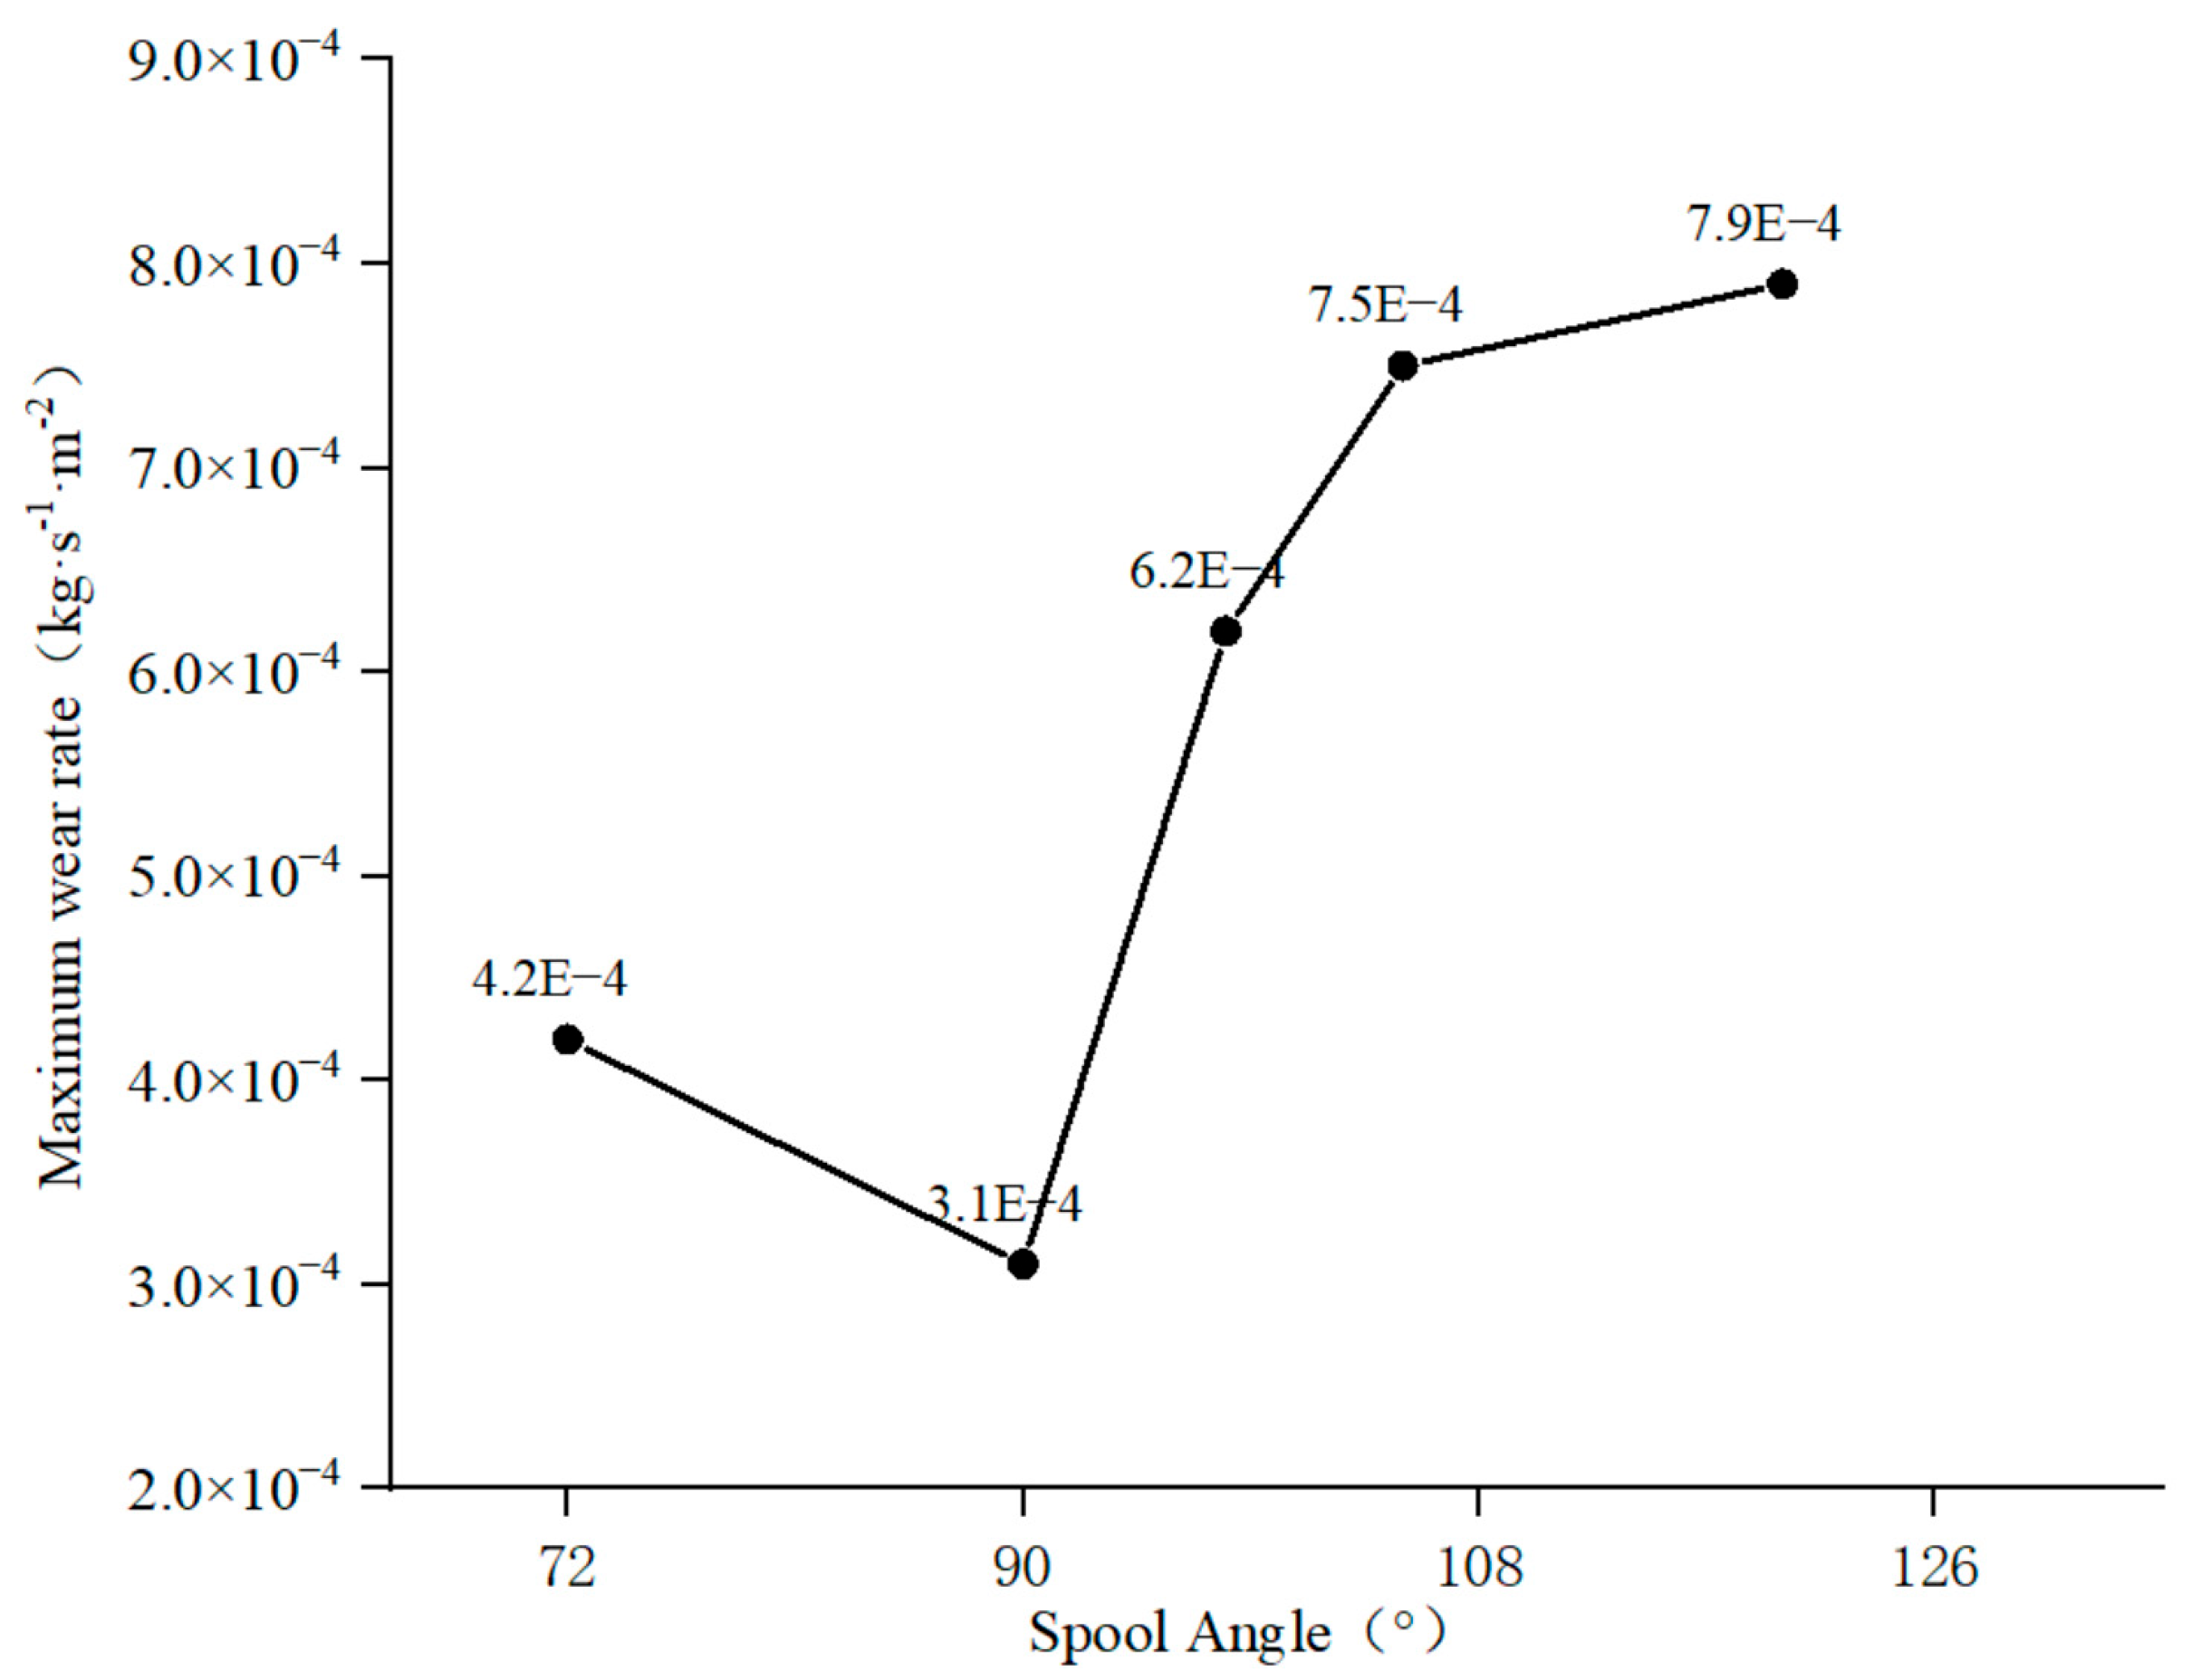
Figure 22 shows the maximum wear rate inside the valve under different spool angles. The calculation results show that when the spool angle is 72° and 90°, the maximum wear rate inside the valve is 3.4 × 10⁻⁴ kg·s1·m−2 and 3.1 × 10⁻⁴ kg·s1·m−2, respectively. When the spool angle is greater than 98°, the maximum wear rate is 3.4 × 10⁻⁴ kg·s1·m−2. At this time, the maximum wear rate in the valve increases by 5.3 × 10⁻⁴ kg·s1·m−2, and continues to increase with the increase in the spool angle.
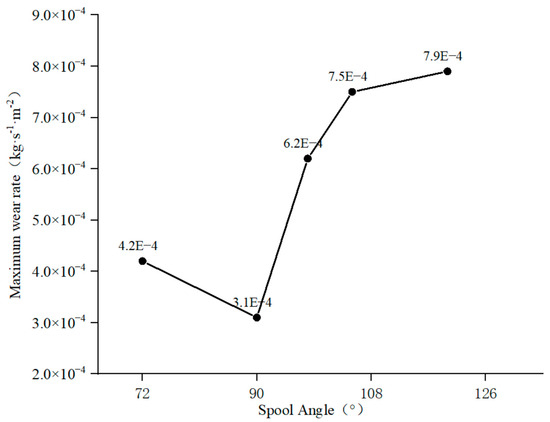
Figure 22.
Maximum wear rate in the valve under different spool structures.
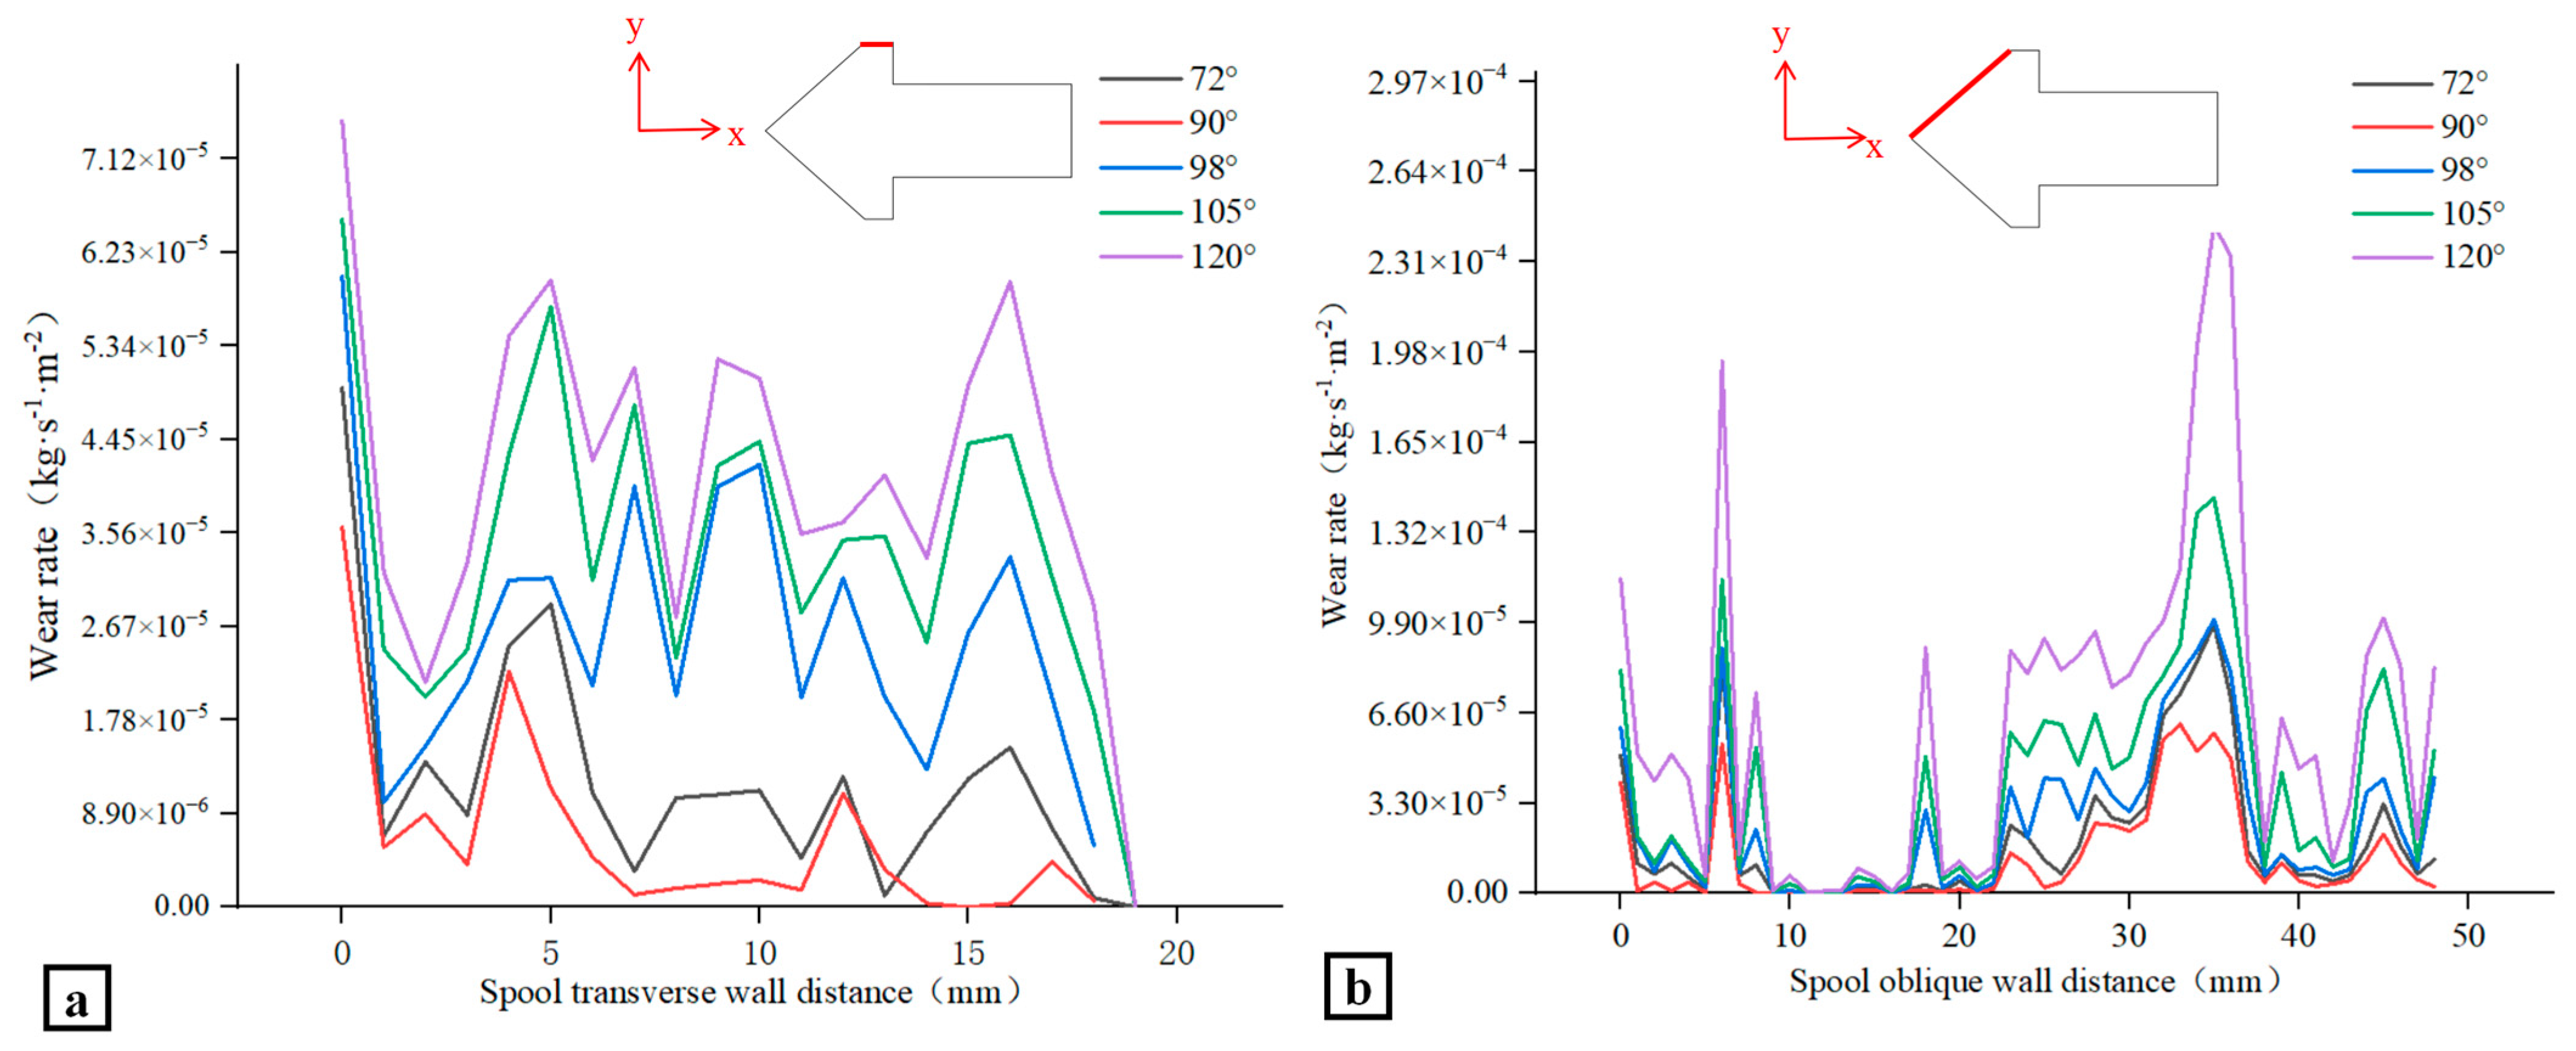
Figure 23 shows the wear rate values at different positions on the two wall surfaces of the valve core at different spool angles. Figure 23a shows the values at different positions on the horizontal wall surface of the valve core. The wear rate on the horizontal wall is small overall, and the area at high risk of wear is evenly distributed at the top of the wall’s surface, at 5 mm, 10 mm, and 15 mm from the apex of the wall. Similar to the value of the maximum wear rate mentioned above, the overall wear rate of the wall at 72° and 90° is lower than that at 98°, 105°, and 120°. When the spool angle is 90°, the wear rate of the transverse wall is the lowest. Figure 23b shows the wear rate on the inclined wall of the spool. At this time, the top of the spool and the locations 5 mm, 20 mm, and 25 mm away from the top of the spool exhibit higher wear values. On the inclined wall of the spool, 10–20 mm from the top of the spool, the overall wear rate of the valve is low, and at the same spool angle of 90°, the wear rate at the inclined wall is the lowest.

Figure 23.
Values of wear rates at different parts of the two walls of the valve ((a) horizontal wall of the valve core, (b) spool inclined wall).
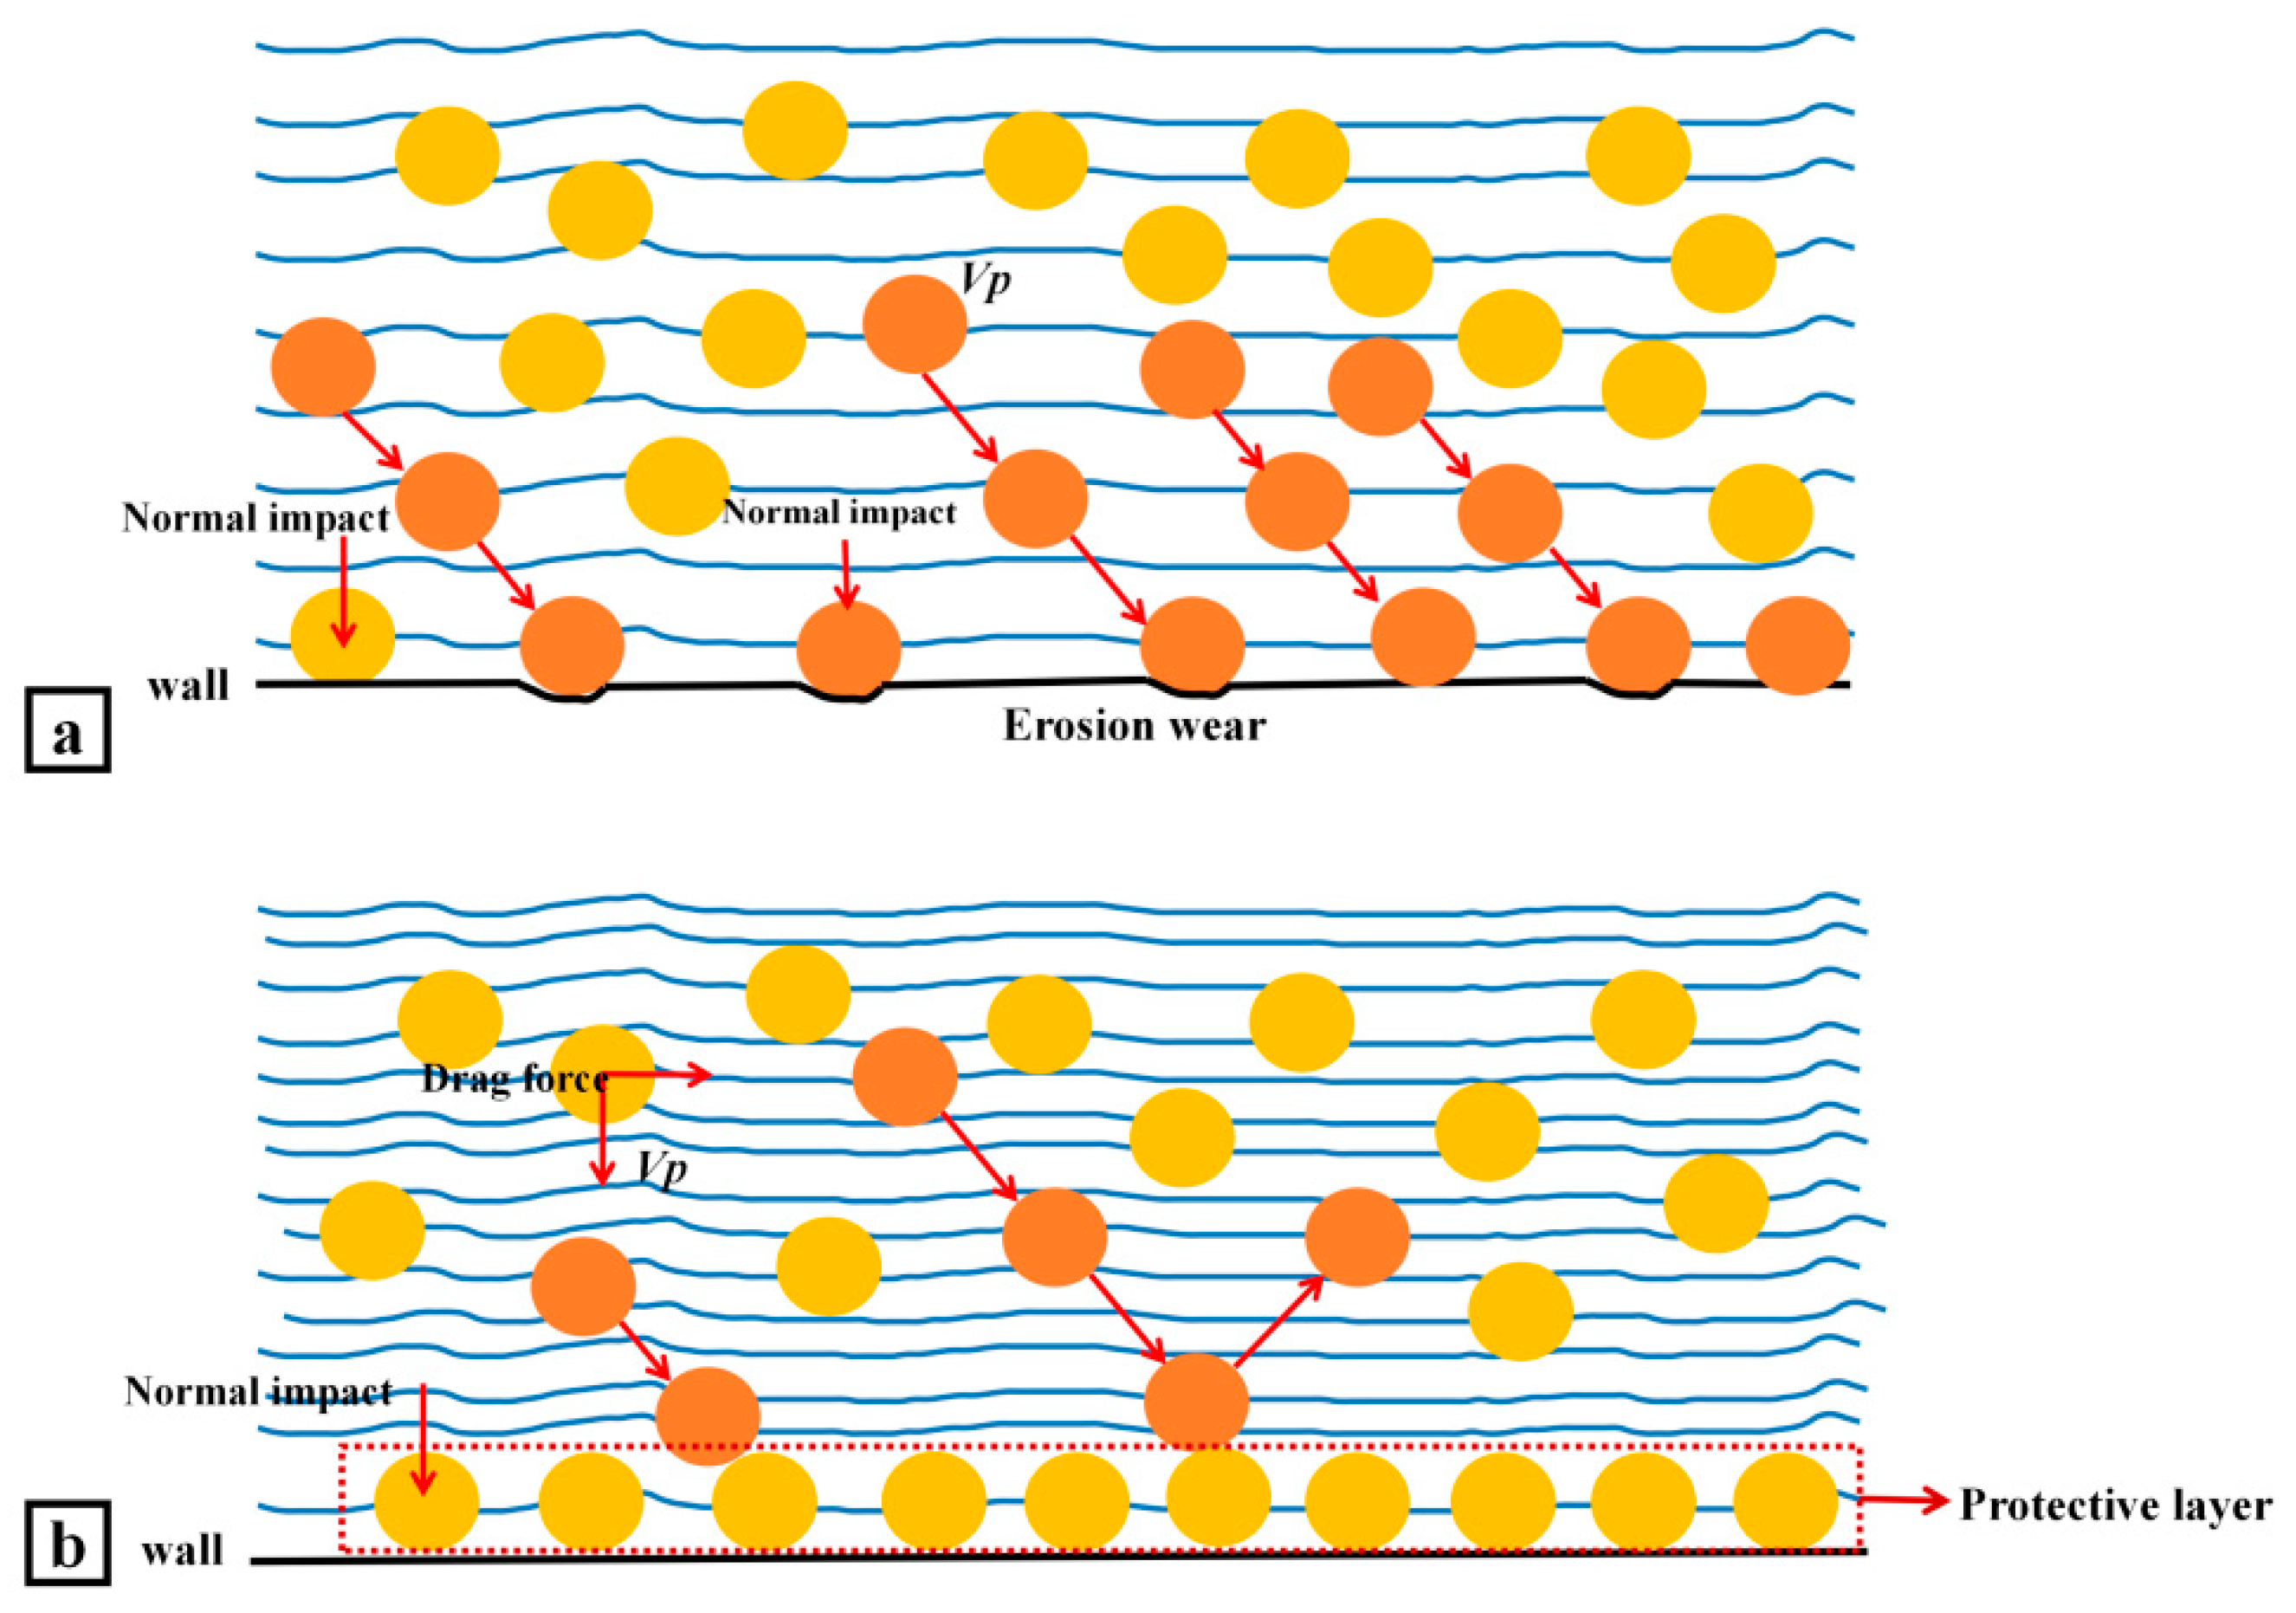
Based on the above analysis of the maximum wear rate in the valve and the wear rate at different locations of the two wall surfaces of the valve core, it can be concluded that the wear on the inclined wall of the valve is more severe than that on the transverse wall. When the valve core angle is 90°, the valve will suffer the lowest particle erosion wear damage; the greater the valve core angle is over 90°, the more severe the valve erosion wear will be. The influence of the particle residence time at the valve core wall on wall wear is preliminarily analyzed. Two hypotheses are proposed: the longer the particles stay at the wall of the valve core, the stronger the direct erosion and wear effect will be, as shown in Figure 24a, and the other is that when the particles stay on the wall of the valve core for a certain amount of time, they will form a protective film on the wall, in which case collisions between particles will increase and the direct effect of particles on the wall will decrease, as shown in Figure 24b.
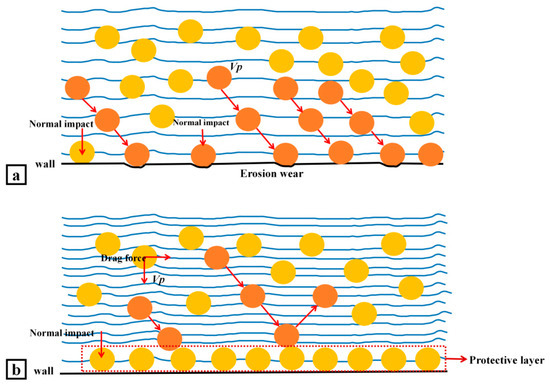
Figure 24.
Schematic diagram of the effect of particle residence time on the wall of the valve core. (a) Promoting effect of particle residence time on valve core wall wear. (b) Restraining effect of particle residence time on wall wear of valve core.
Figure 25 shows the residence time of particles at different parts of the inclined wall of the valve core under different spool structure conditions. It can be seen that when the spool angle is 90°, the particle residence time at the spool wall is the longest, followed by that at 72°, 98°, and 105°. When the spool angle is 120°, the residence time at the spool wall is the shortest. It can be concluded from these results that when the valve core structure changes, both the particle residence time and the wear effect on the valve core wall will also change. Moreover, the longer the particles stay at the valve core wall, the lower the particle wear effect on the valve will be, which is consistent with the diagram in Figure 23b.
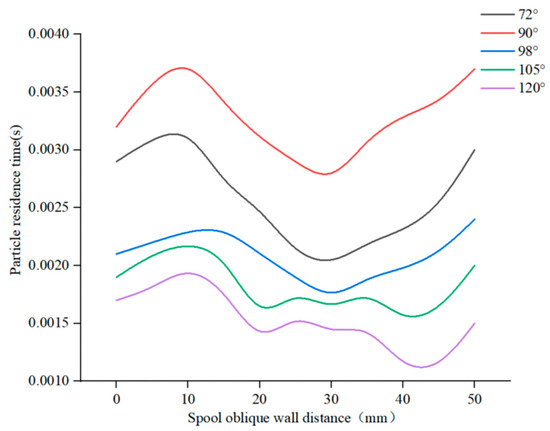
Figure 25.
Residence times of particles in different positions on the valve core wall.
Next, the inlet pressure of the valve is changed to alter the inlet and outlet pressure difference inside the valve. The relationship between particle residence time and the wear rate of the valve core wall is further studied. Figure 26a shows the wear rate of the valve core on the inclined wall under the conditions of a fixed valve core angle of 90° and a valve inlet pressure of 18 MPa–15 MPa. The greater the inlet pressure and pressure difference between the inlet and outlet of the valve, the greater the wear rate and the more severe the wear at the valve core wall. Figure 26b shows the length of times that particles stay at the valve core wall at different inlet and outlet pressure differences. It can be seen that when the valve inlet pressure is 18 MPa, the particles stay on the valve core wall for the shortest time and the valve wear rate is the largest; when the valve inlet pressure is 15 MPa, the particles stay on the valve core wall for the longest time and the valve wear rate is the smallest.

Figure 26.
Wear rates and particle residence times of valve core wall under different valve inlet pressure conditions ((a) spool wear rate, (b) particle residence time).
Figure 27 shows the valve core wall wear rate and the residence time of particles at the valve core wall when the mass flow rate of particles in the valve is changed. It can be seen from Figure 26a that when the mass flow rate of particles increases from 0.001 kg to 0.003 kg/s, the wear rate on the valve core wall keeps increasing. However, when the particle mass flow rate further increases to 0.004 kg/s and 0/005 kg/s, the wear rate on the wall of the valve core decreases, indicating that the critical value for the change in wall wear rate with the change in particle mass flow rate appears at a flow rate of 0.003 kg/s, at which point the wall wear rate is the largest. Figure 27b shows the residence time of particles on the wall of the valve core under different particle mass flow conditions. When the particle mass flow rate is 0.003 kg/s, the residence time of particles on the wall of the valve core is the shortest. When the particle mass flow rate is 0.001 kg/s, the particle retention time on the valve core wall is the longest, and the wear rate changes with the particle mass flow rate in the following order: 0.003 kg/s > 0.005 kg/s > 0.004 kg/s > 0.002 kg/s > 0.001 kg/s. The residence time of particles on the valve core wall changes in the order of 0.001 kg/s > 0.002 kg/s > 0.004 kg/s > 0.005 kg/s > 0.003 kg/s. This indicates that the longer the particles stay on the wall of the valve core, the lower the particle wear of the valve.
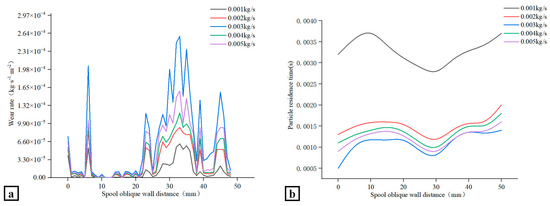
Figure 27.
Spool wall wear rate and particle residence time under different particle mass flow conditions ((a) spool wear rate, (b) particle residence time).
Based on the above comparisons of valve core structure conditions and the comparison between the valve core wall wear rate and the particle residence time at the valve core wall under different working conditions, it can be concluded that the longer the particle residence time on valve core wall, the lower the particle wear on this wall. Similarly to the principle shown in Figure 24b, particles form a protective layer on the surface of the spool. This increases the interaction between particles [36] and reduces the direct impact of particles on the valve core wall, thereby reducing particle wear at this wall.
5. Conclusions
By studying the operating conditions, structural characteristics, and macro damage morphology of the valve, as well as the physical characteristics of the medium flowing through the valve, its failure mechanism is analyzed. The main causes of damage to the valve core and the downstream bushing material, which then lead to valve failure, are unilateral wall damage caused by the eccentric jet phenomenon in the downstream shrinkage section of the valve core, and valve core wall damage caused by cavitation and particle wear.
The influence of the spool structure on the eccentric jet is clear. The drift phenomenon in the downstream contraction and expansion sections of the valve spool is analyzed, as well as the distributions of the velocity and pressure fields. The results show that when the spool angle is 72° or 90°, the high-speed fluid downstream of the spool is mainly concentrated in the center, and the eccentric jet phenomenon does not occur. However, when the spool angle is 72°, the flow speed of the fluid in the valve is greater than that when the spool angle is 90°. When the spool angle is 98°, 105°, or 120°, the high-speed fluid begins to shift significantly toward the lower wall of the valve. Under these spool conditions, the eccentric jet phenomenon of the valve is more severe. Therefore, a spool angle of 90° is beneficial to suppress the eccentric jet phenomenon of high-speed fluid in the downstream bushing of the valve. A change in spool angle will not significantly affect the cavitation characteristics in the valve.
Cavitation and particle wear under different spool structures are analyzed, and the results show that there are no clear changes in the cavitation area and the gas phase volume of the valve under different spool structures; thus, a change in spool structure will not significantly affect cavitation in the valve. When the spool angle is 72° or 90°, the wear rate in each part of the spool is lower and, therefore, the valve is subjected to less wear.
By comparing the eccentric jet, cavitation, and particle wear values of the valve under different spool structures, it can be concluded that when the spool angle is 90°, the high-speed fluid downstream of the spool is mainly concentrated in the center, and there is no clear bias phenomenon. At this time, cavitation wear and solid particle wear in the valve are alleviated. Therefore, a spool angle of 90° can effectively reduce the damage and failure caused by the eccentric jet phenomenon and the cavitation and solid wear of the valve, and can extend the valve’s service life.
When comparing the valve core wall wear rate and the residence time of particles on the valve core wall at different valve core angles, different valve inlet pressures and particle mass flow rates are observed. It is concluded that the wear rate of the valve core wall has a certain relationship with the residence time of particles at this location. Specifically, the longer the particle residence time, the lower the particle wear.
Author Contributions
H.J.: Project administration, Resources, Funding acquisition. H.A.: Writing—original draft, Writing—review & editing, Visualization, Investigation. X.L.: Supervision, Writing—review & editing. C.W.: Supervision, Writing—review & editing. All authors have read and agreed to the published version of the manuscript.
Funding
This work is supported by the National Key Research and Development Program of China (No. 2023YFC3010501), and The National Natural Science Foundation of China (No. 52176048).
Data Availability Statement
The original contributions presented in this study are included in the article. Further inquiries can be directed to the corresponding author.
Conflicts of Interest
The authors declare no conflict of interest.
References
- Liu, S.; Gan, D.; Han, Z.; Huang, Z.; Li, Q.; Zhang, J. Modeling study of the energy separation effect of a control valve structure on a vortex tube. Case Stud. Therm. Eng. 2024, 61, 104828. [Google Scholar]
- Moghaddam, A.; Kutschelis, B.; Holz, F.; Skoda, R. Experiments and three-dimensional flow simulations on twin-screw pumps operated as control valves for energy recovery. Energy 2024, 306, 132400. [Google Scholar]
- Xu, X.; Bi, J.; Fang, L.; Li, A.; Wang, Z.; Li, Q. Experimental and numerical study on the quasi-periodic pulsation characteristics of cavitation flow in a control valve. J. Taiwan Inst. Chem. Eng. 2025, 167, 105911. [Google Scholar]
- Jin, H.; Xu, Z.; Liu, X.; Wang, C. Study of rheological vibration of high-pressure differential string multistage control valve. Flow Meas. Instrum. 2025, 104, 102906. [Google Scholar] [CrossRef]
- Li, H.; Lu, H.; Li, Q. Numerical investigations of the influences of valve spool structure on the eccentric jet flow characteristic in high-pressure angle valves. Energy 2024, 298, 131378. [Google Scholar] [CrossRef]
- Saraswat, A.; Fraile, A.; Gedupudi, S.; Bhattacharyay, R.; Chaudhuri, P. A comprehensive review of experimental and numerical studies on liquid metal-gas two-phase flows and associated measurement challenges. Ann. Nucl. Energy 2025, 213, 111104. [Google Scholar]
- Kant, K.; Pitchumani, R. Analysis and mitigation of erosion wear of transfer ducts in a falling particle CSP system. Wear 2025, 562–563, 205619. [Google Scholar]
- Perera, P.; Hayward, K.; Guzzomi, F.; Vafadar, A. Erosion wear characterisation of an open Ductile Iron butterfly valve subjected to Aluminium Oxide particle slurry flow. Tribol. Int. 2024, 191, 109199. [Google Scholar]
- Zhang, W.; Huang, W.; Lin, H. Anti-wear and anti-cavitation structure optimization of V-type regulating ball valve in the coal chemical industry. Flow Meas. Instrum. 2025, 101, 102756. [Google Scholar]
- Li, D.; Liu, X.; Liao, H.; Bing, L.; Hou, P.; Nie, R.; Jiao, Z. A prediction model of fluid–solid erosion wear in hydraulic spool valve orifice. Wear 2024, 540–541, 205235. [Google Scholar]
- Fu, J.; Gui, W.; Qin, J.; Lin, J.; Ren, X.; Luan, B. High-speed laser-clad 3533-00 Fe-based cemented carbide coatings on nuclear power valve sealing surface to enhanced wear and corrosion resistance. Surf. Coat. Technol. 2024, 480, 130594. [Google Scholar]
- Yang, S.Q.; Fan, J.C.; Liu, M.T.; Li, D.N.; Li, J.L.; Han, L.H.; Wang, J.J.; Yang, S.Y.; Dai, S.W.; Zhang, L.B. Research on the solid particle erosion wear of pipe steel for hydraulic fracturing based on experiments and numerical simulations. Pet. Sci. 2024, 21, 2779–2792. [Google Scholar]
- Jin, H.; He, J.; Wang, C.; Liu, X. Influence of particle shape on erosive wear in liquid-solid two-phase flow of blackwater angle valves. Powder Technol. 2024, 448, 120320. [Google Scholar]
- Ren, J.; Zhao, B.; Quan, L.; Lan, Y.; Li, Y.; Hao, Y. Research on proportional valve spool wear diagnostic method hybrid-driven by the valve port energy loss mechanism model and data. Mech. Syst. Signal Process. 2024, 219, 111606. [Google Scholar]
- Novak, N.; Trajkovski, A.; Polajnar, M.; Kalin, M.; Majdič, F. Wear of hydraulic pump with real particles and medium test dust. Wear 2023, 532–533, 205101. [Google Scholar]
- Yang, X.; Lü, Y.; Xu, L.; Ma, Y.; Chen, R.; Zhao, X. Numerical investigation on cavitation erosion and evolution of choked flow in a tri-eccentric butterfly valve. Flow Meas. Instrum. 2024, 100, 102725. [Google Scholar]
- Chen, P.; Liu, Z.; Xu, R.; Liu, J. Comparative investigation and test verification of cavitation and turbulence models of injector control ball valve. Int. J. Heat Fluid Flow 2024, 109, 109557. [Google Scholar]
- Xu, X.; Wang, Y.; Fang, L.; Wang, Z.; Li, Y. Numerical study on cavity-vortex evolution in cavitation flow in nuclear control valves with different openings and structural parameters. Ann. Nucl. Energy 2025, 211, 110880. [Google Scholar]
- Qian, J.Y.; Liu, C.; Qiu, C.; Li, W.Q.; Chen, D.Y. Liquid hydrogen cavitation analysis inside an oblique globe valve. Flow Meas. Instrum. 2024, 97, 102599. [Google Scholar]
- Zhang, Y.; Li, B.; Liu, X.; Kiong, N.S.; Wu, S.; Ma, X.; Han, R. Experimental study on quantitative characterization of cavitation internal structure based on the distribution of void fraction in pressure relief valve. Measurement 2024, 230, 114510. [Google Scholar]
- Zhao, L.; Wu, J.Y.; Jin, Z.J.; Qian, J.Y. Cavitation effect on flow resistance of sleeve regulating valve. Flow Meas. Instrum. 2022, 88, 102259. [Google Scholar]
- Jin, H.; Zheng, Z.; Ou, G.; Zhang, L.; Rao, J.; Shu, G.; Wang, C. Failure analysis of a high pressure differential regulating valve in coal liquefaction. Eng. Fail. Anal. 2015, 55, 115–130. [Google Scholar] [CrossRef]
- Ou, G.; Ouyang, P.; Zheng, Z.; Jin, H.; Bie, K.; Wang, C. Investigation on failure process and structural improvement of a high-pressure coal water slurry valve. Eng. Fail. Anal. 2019, 96, 1–17. [Google Scholar]
- Mousmoulis, G.; Kassanos, I.; Anagnostopoulos, I. Chapter 5—Study and Detection of Cavitation in Centrifugal Pumps. In Cavitation and Bubble Dynamics; Koukouvinis, P., Gavaises, M., Eds.; Academic Press: Cambridge, MA, USA, 2021; pp. 133–171. [Google Scholar]
- Omran Osman, O.; Ahmed, S.M. Understanding surface morphology changes in stainless steel through stepwise cavitation erosion: A comprehensive study. Eng. Fail. Anal. 2025, 167, 109017. [Google Scholar]
- Sun, Q.; Xie, F.; Zhu, M.; Wang, L.; Wang, D.; Wu, M. Analysis of stress corrosion cracking failure of 316L stainless steel flow promoter string in the aggressive oilfield environment. Eng. Fail. Anal. 2025, 167, 109087. [Google Scholar]
- Guo, M.; Gao, Z.; Song, J.; Liu, Z.; Wu, Z.; Lv, C.; Hu, W. The effect of coordinated deformation on the microstructure and corrosion performance of 316L stainless steel/20# carbon steel composite pipes during hot compression. Mater. Lett. 2024, 377, 137374. [Google Scholar]
- Chen, H.; Feng, Z.; Mei, G.; Tan, W.; Zhu, G. The role of lead-bismuth eutectic temperature in affecting fretting corrosion of 316L stainless steel. Wear 2025, 572–573, 205997. [Google Scholar] [CrossRef]
- Hong, Y.; Li, M.; He, X.; Xing, J.T. Energy flow investigations of Rayleigh-Plesset equation for cavitation simulations. Ocean. Eng. 2024, 306, 118072. [Google Scholar] [CrossRef]
- De Giorgi, M.G.; Fontanarosa, D.; Ficarella, A. Characterization of unsteady cavitating flow regimes around a hydrofoil, based on an extended Schnerr–Sauer model coupled with a nucleation model. Int. J. Multiph. Flow 2019, 115, 158–180. [Google Scholar]
- Forder, A.; Thew, M.; Harrison, D. A numerical investigation of solid particle erosion experienced within oilfield control valves. Wear 1998, 216, 184–193. [Google Scholar]
- Divakar, M.; Agarwal, V.K.; Singh, S.N. Effect of the material surface hardness on the erosion of AISI316. Wear 2005, 259, 110–117. [Google Scholar]
- Chattopadhyay, H.; Kundu, A.; Saha, B.K.; Gangopadhyay, T. Analysis of flow structure inside a spool type pressure regulating valve. Energy Convers. Manag. 2012, 53, 196–204. [Google Scholar]
- Zheng, Z.; Ou, G.; Ye, H.; Zhang, L.; Wang, C.; Jin, H.; Shu, G. Investigation on failure process and structural optimization of a high pressure letdown valve. Eng. Fail. Anal. 2016, 66, 223–239. [Google Scholar]
- Zheng, Z.; Ou, G.; Yi, Y.; Shu, G.; Jin, H.; Wang, C.; Ye, H. A combined numerical-experiment investigation on the failure of a pressure relief valve in coal liquefaction. Eng. Fail. Anal. 2016, 60, 326–340. [Google Scholar]
- Fan, Z.; Liu, D.; Liang, C.; Chen, X. Numerical simulation of collision dynamics between a dry particle and a liquid-coated wet particle. Powder Technol. 2024, 434, 119308. [Google Scholar]


Disclaimer/Publisher’s Note: The statements, opinions and data contained in all publications are solely those of the individual author(s) and contributor(s) and not of MDPI and/or the editor(s). MDPI and/or the editor(s) disclaim responsibility for any injury to people or property resulting from any ideas, methods, instructions or products referred to in the content. |
© 2025 by the authors. Licensee MDPI, Basel, Switzerland. This article is an open access article distributed under the terms and conditions of the Creative Commons Attribution (CC BY) license (https://creativecommons.org/licenses/by/4.0/).