Article

Optimising Air Change Rates: A CFD Study on Mitigating Pathogen Transmission in Aircraft Cabins

Department of Mechanical, Manufacturing and Mechatronics Engineering, School of Engineering, RMIT University, Melbourne, VIC 3000, Australia
*
Author to whom correspondence should be addressed.
Fluids 2025, 10(3), 74; https://doi.org/10.3390/fluids10030074
Submission received: 24 January 2025 / Revised: 17 March 2025 / Accepted: 18 March 2025 / Published: 20 March 2025
(This article belongs to the Special Issue CFD Applications in Environmental Engineering)

Abstract

:
Amid the COVID-19 pandemic, understanding airborne pathogen transmission within confined spaces became critically important. The release of infectious aerosols through activities such as breathing, speaking, and coughing poses significant health risks, especially in confined spaces like airplane cabins. This study addresses gaps in the research by evaluating the impact of air changes per hour (ACH) on pathogen transmission in an aircraft cabin using computational fluid dynamics (CFD) simulations. A detailed computer-aided design (CAD) model representing half of a four-row section of a Boeing 737 cabin was developed, utilising symmetry boundary conditions to optimise the computational resources while maintaining accuracy. Using ANSYS Fluent 2024, four scenarios were simulated at ACH rates of 15, 20, 25, and 30, with 4 µm pathogens injected into the cabin from a single infector. Airflow patterns and pathogen residence times were analysed for each case. The results indicate that ACH 15 presents the highest risk of pathogen transmission, while increasing the ACH to 20 significantly reduces this risk, with diminishing returns observed beyond ACH 20. Thus, this study underscores the importance of balancing ventilation efficiency, energy consumption, and passenger comfort. The findings provide valuable insights into optimising the ventilation systems to mitigate the airborne transmission in aircraft cabins. Future research should explore higher ACH rates, validate their impact, and conduct a comprehensive optimisation study to further improve the infection control measures.

1. Introduction

Airborne infectious diseases in the 21st century is having unprecedented effects on health and the economy. With globalisation increasing the rate of trade, overpopulation, and climate change affecting the climate patterns of disease-carrying vectors, the threat of highly infectious airborne diseases poses a huge risk to global health (Fernstrom and Goldblatt, 2013 [1]). Given the continuous growth of air travel, concerns about disease transmission onboard aeroplanes are increasingly significant. In confined aeroplane cabins, the risk of airborne infectious disease transmission is heightened due to the high occupant density and confined volume. Activities like breathing, speaking, coughing, and sneezing expel infectious aerosols that linger in the air. Prolonged exposure to airborne pathogens can lead to disease outbreaks among passengers and crew.
The COVID-19 pandemic proved how quickly viruses can spread. In the first year of the COVID-19 pandemic, the estimated global death toll from COVID-19 was approximately 1.8 million officially reported deaths. However, the World Health Organization (WHO) estimates that the true number of excess deaths attributable to the pandemic, including those indirectly caused by the pandemic’s impact on health services, was at least 3 million in 2020. Given the demonstrated ease with which COVID-19 spreads in enclosed spaces, improving the ventilation is crucial in mitigating airborne transmission and enhancing public health safety. For instance, an analysis of a choir practice event in Skagit Valley, Washington, with poor ventilation revealed that 86% of the attendees were infected within two hours (Chandler, 2021 [2]). As global air travel remains a pivotal mode of transportation, ensuring passenger safety and mitigating the risk of infectious disease spread has become a paramount concern. Aircraft cabins present a unique set of challenges due to their high occupant density, reduced partial pressure of oxygen, and limited space. Traditional ventilation systems must balance the need for passenger comfort with stringent safety standards to prevent the spread of airborne diseases.
To address the complex challenges of airborne pathogen transmission in aeroplane cabins, advanced CFD simulations are increasingly employed. CFD allows for the detailed analysis of airflow patterns and the behaviour of respiratory particles under various ventilation scenarios. By simulating different ventilation strategies, such as inlet nozzle design, design conditions like inlet temperature, and air change rates, researchers can identify the potential hotspots where pathogens might accumulate and assess the effectiveness of ventilation strategies in mitigating the spread of infectious diseases. One critical aspect of using CFD in evaluating pathogen transmission is the ability to model both the macroscopic airflow and the microscopic particle dynamics (Rajendran et al., 2023 [3]). This dual approach enables a comprehensive analysis of how respiratory particles, ranging from large droplets to small aerosols, behave within the confined space of an aeroplane cabin. For instance, Eulerian models are typically used to simulate the continuous airflow, while Lagrangian models track the discrete particles. This combination provides insights into how ventilation systems can be optimised to ensure that fresh air is efficiently distributed, and contaminants are quickly removed from the breathing zone of passengers (Lin et al., 2005 [4]). Recent studies have demonstrated the effectiveness of CFD simulations in optimising ventilation designs. For example, by adjusting the position and flow rate of air diffusers, it is possible to create airflow patterns that minimise the concentration of airborne pathogens at passengers’ head level and reduce the risk of cross-contamination among passengers. These findings underscore the importance of integrating advanced simulation tools in the design and operation of aircraft ventilation systems. By leveraging CFD, airlines can develop evidence-based strategies to enhance the cabin air quality, ultimately improving passenger safety and reducing the likelihood of disease transmission during flights. This study aimed to improve the understanding of pathogen transmission in aircraft, with a particular focus on optimising the air change rate to reduce the pathogen residence time and stagnation in passenger breathing zones. The findings indicate that an ACH of 15 poses the highest risk of pathogen transmission among the rates tested. However, increasing the rate to 20 significantly mitigates this risk. Beyond 20, further increases show diminishing returns, with only marginal improvements observed as the rate approaches 30.

2. Materials and Methods

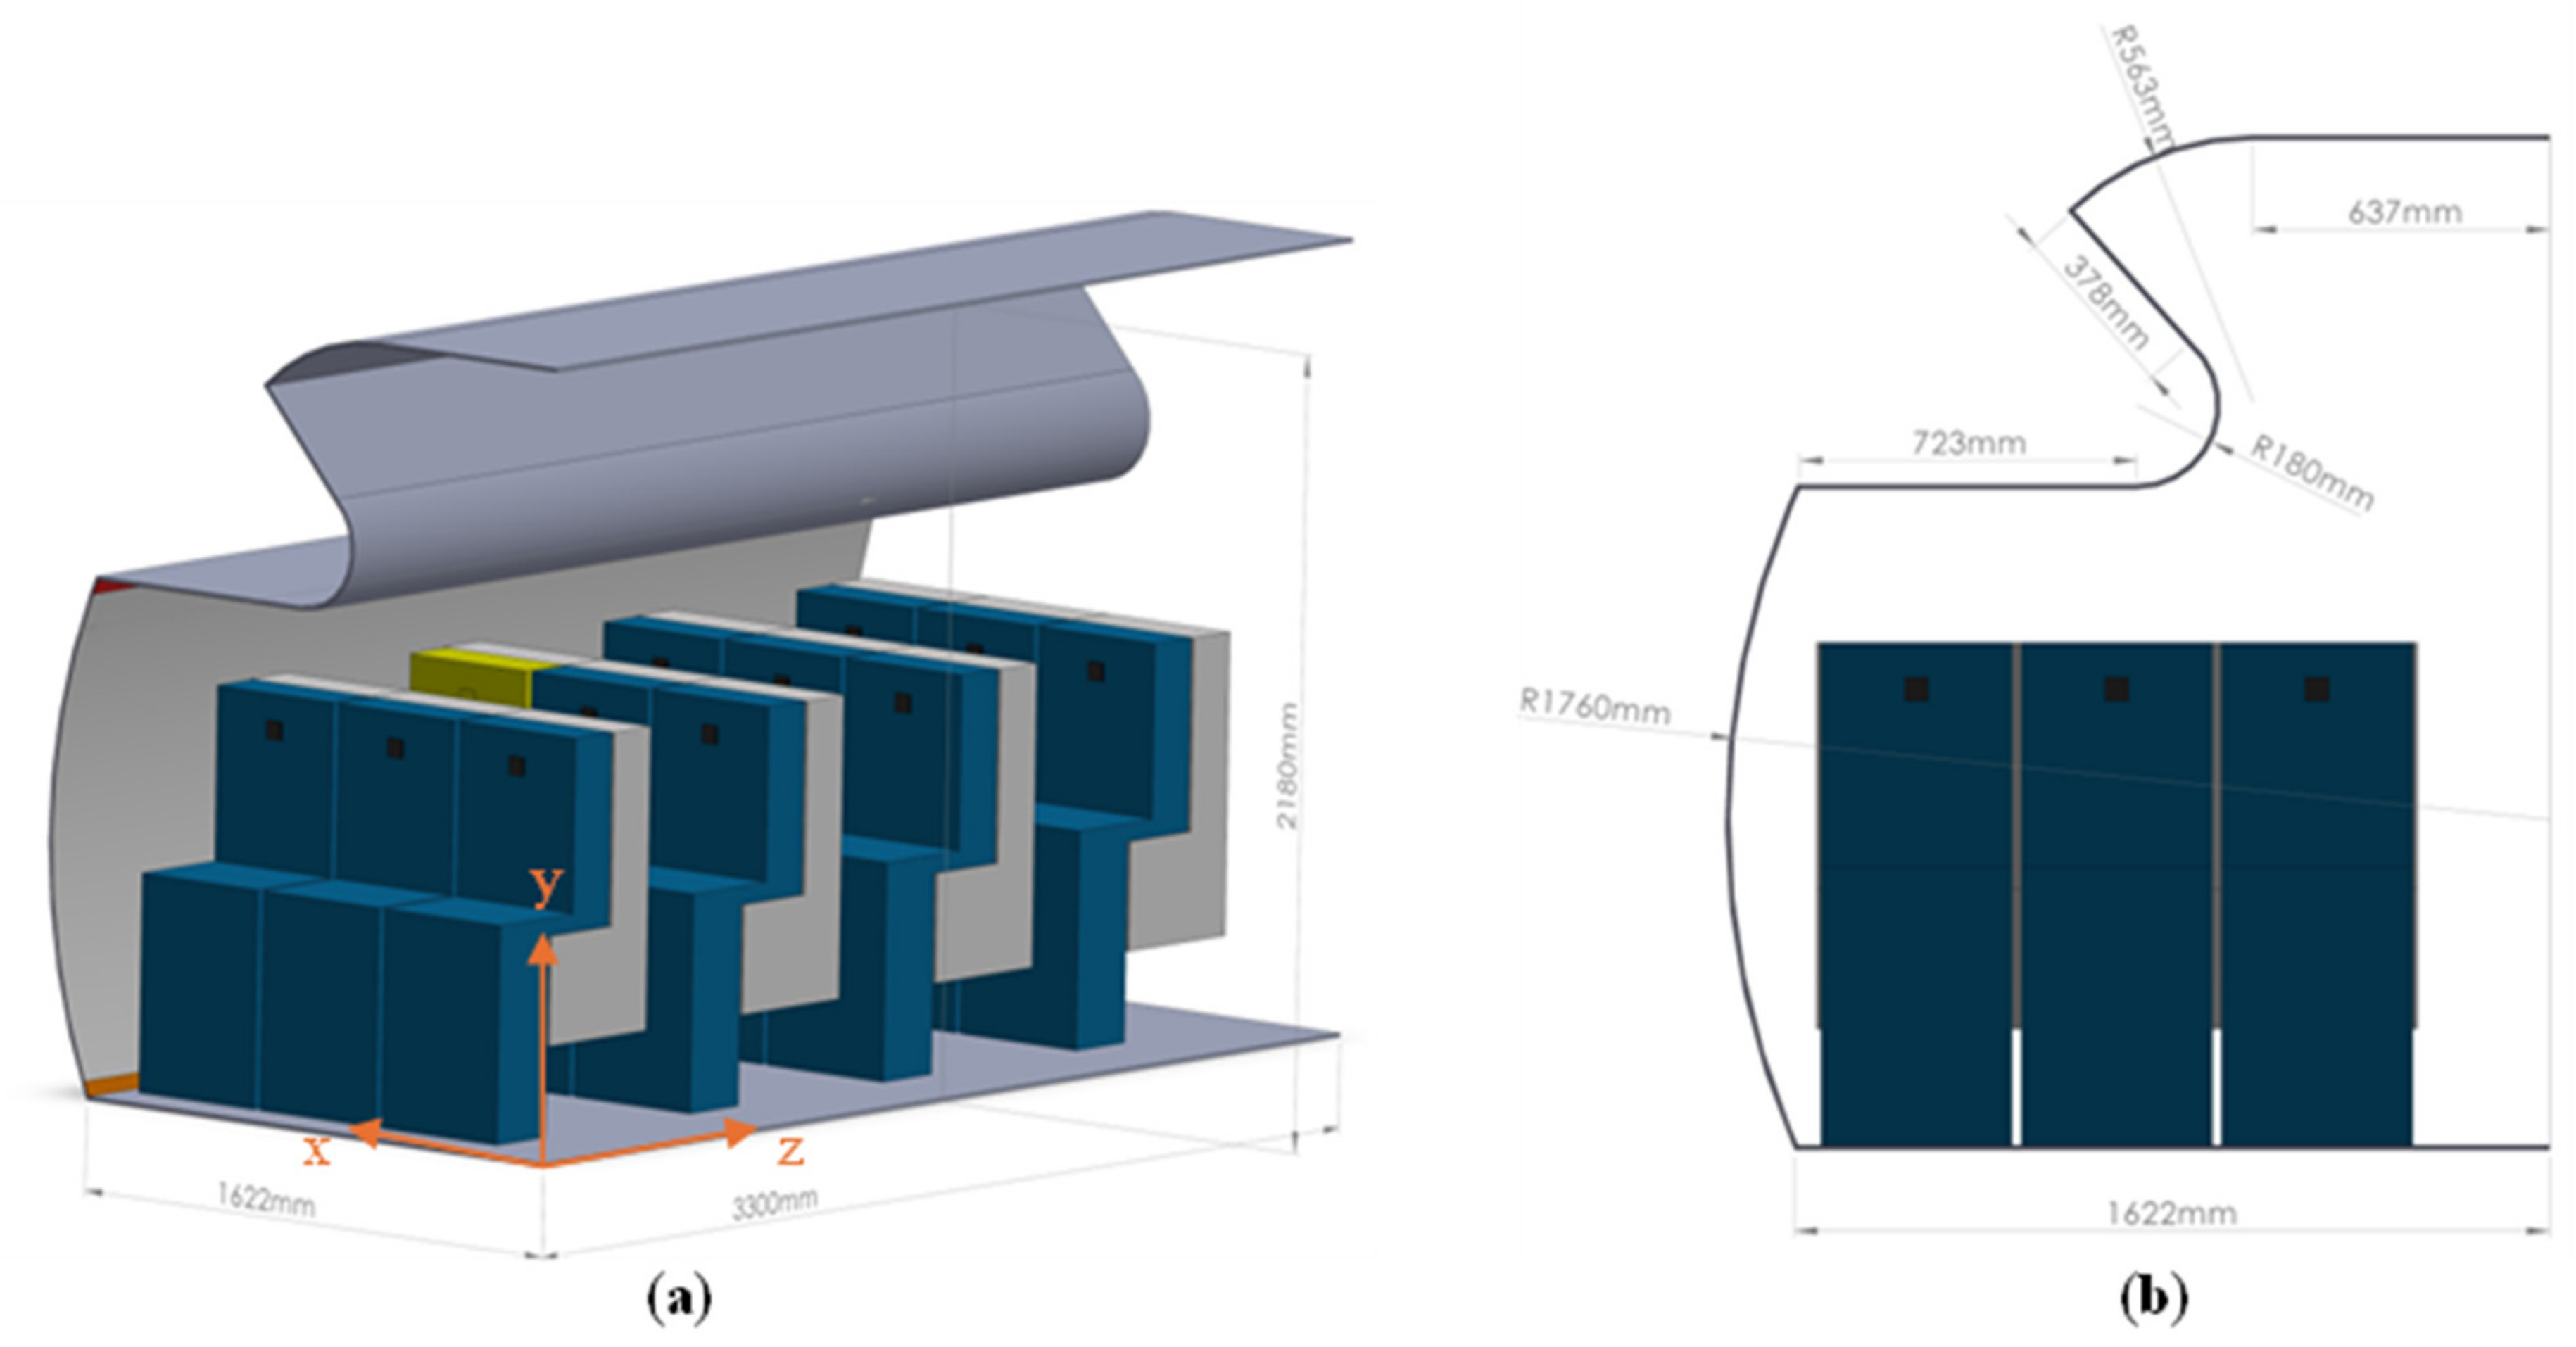
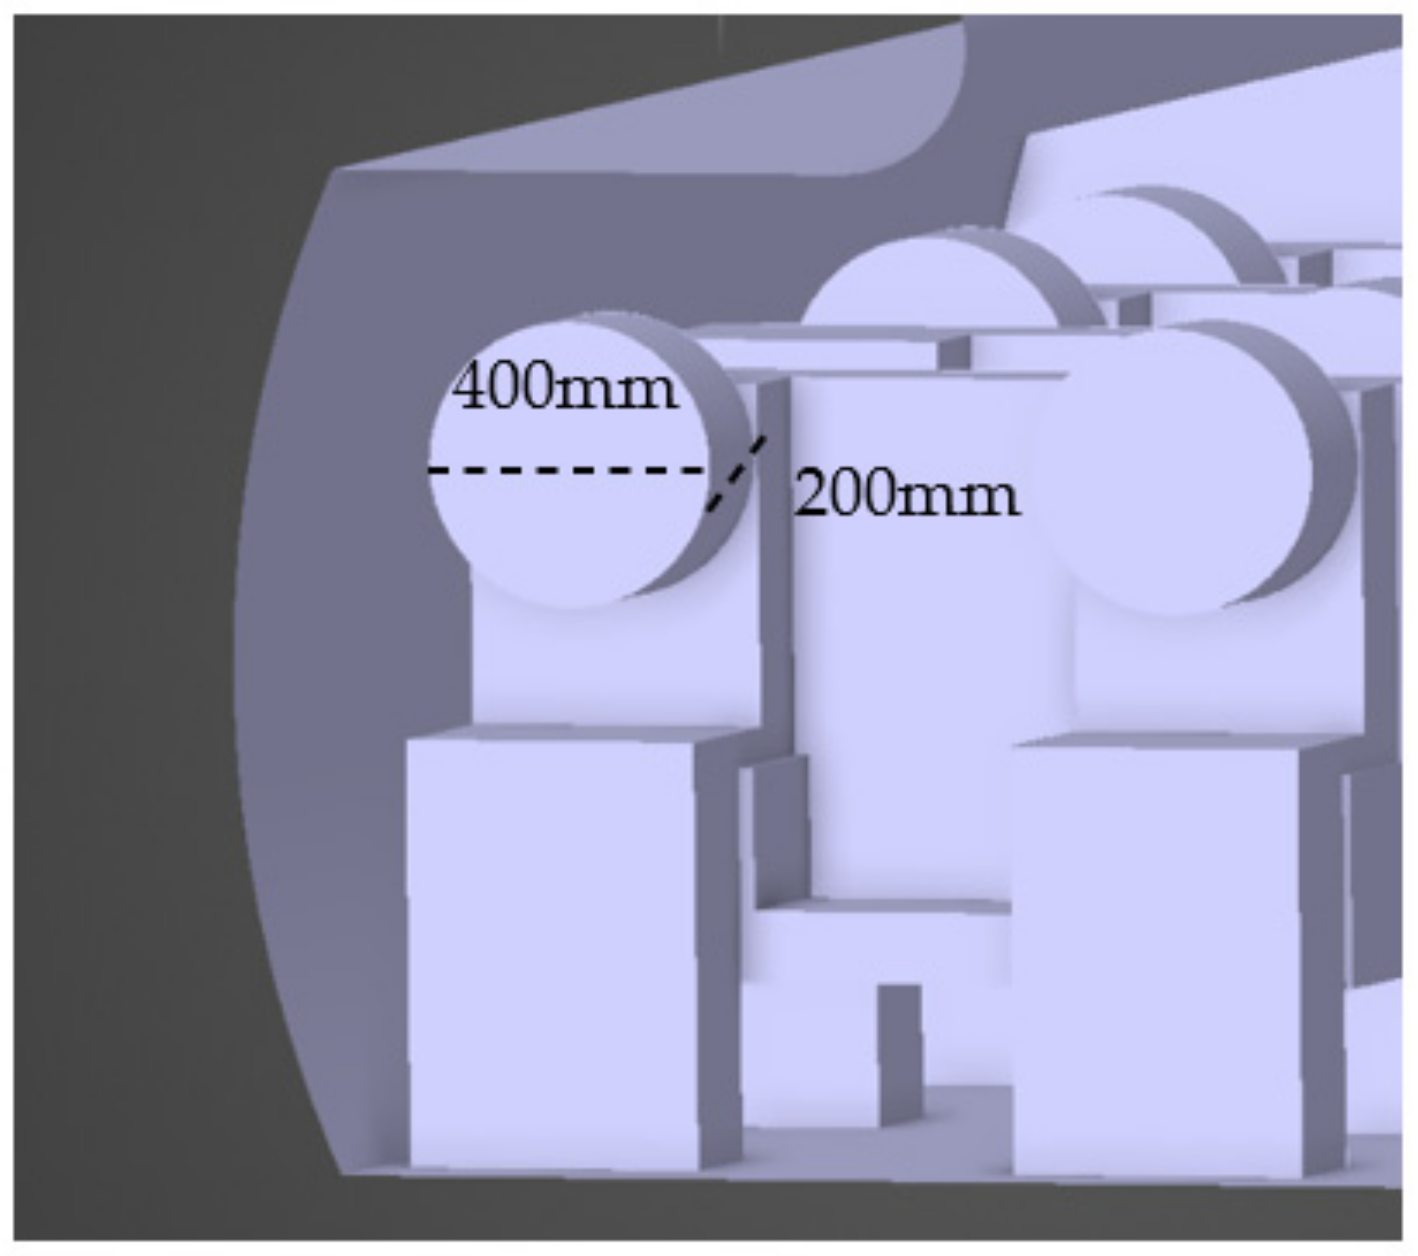
2.1. Airplane Cabin Model
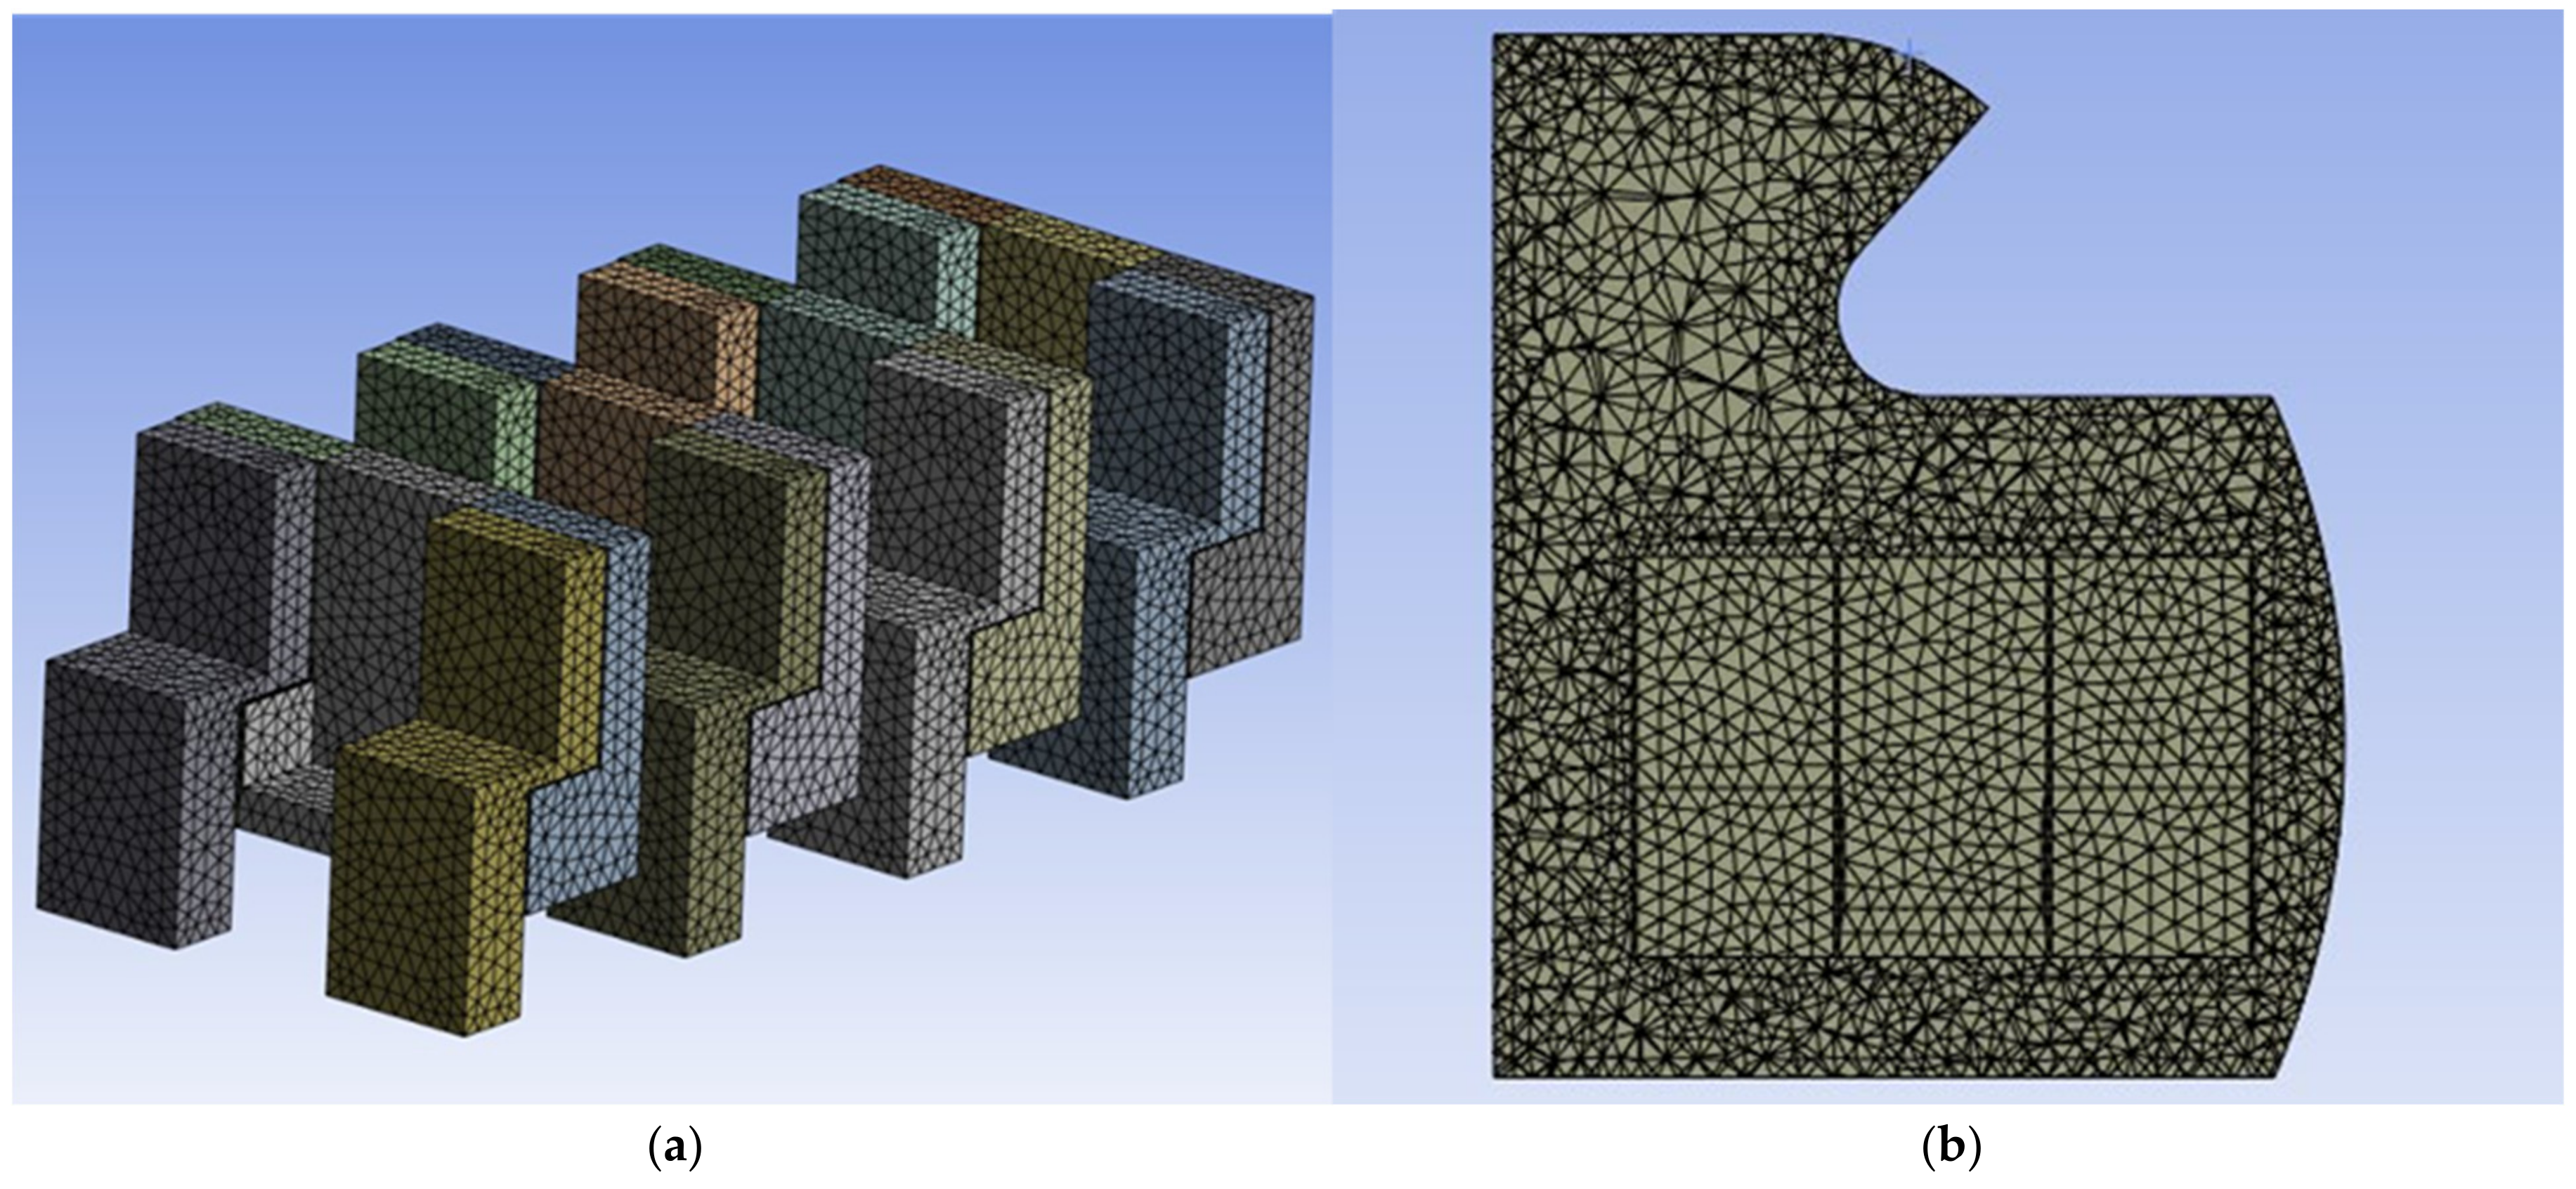
A three-dimensional model of a Boeing 737 cabin zone was created based on the publicly available information from the Boeing 737 Airplane Characteristics for Airport Planning (Boeing Commercial Airplanes, 2023 [5]). This research employed a strategic geometry simplification approach to optimise the computational resources. The Boeing 737-600, featuring a 3-3 seating configuration, was selected due to its widespread use globally. A model of the plane, consisting of only four rows of cabin space, was developed to facilitate the observation of airflow patterns in all directions—longitudinally, parallel to the fuselage, and laterally across the rows. This approach focuses on the most affected area, allowing for a detailed analysis of airflow and particle movement in a confined space directly around the source of infection.
Given that the cabin geometry and airflow conditions are symmetric about the YZ plane, only half of the model was utilised for analysis. This approach not only reduces the mesh count but also significantly cuts down on the computation time without compromising the accuracy of the results. With this setup, a total of 12 seats were included, and it was approximated using the dimensions given in Tagliaferri, D. and Capsoni (2016) [6]. The cabin model was created in SolidWorks 2023 and approximated a Boeing 737 with an overall length × breadth × height of 3330 mm × 3244 mm × 2180 mm as shown in Figure 1.
The ventilation inlets were positioned at the sidewalls of the ceiling, supplying fresh, recirculated air along the length of the fuselage with exhaust outlets removing air from the sidewalls at the floor of the cabin. Approximations were made for the locations and dimensions of the air inlets, exhaust outlets, and geometry of the overhead bins. Topp et al. (2002) [7] investigated the use of computer-simulated persons and found that a “box-design” for the manikins was sufficient to simulate real-life humans. Based on this finding, this approach was utilised in the study to represent the passengers in the aircraft cabin model. Additionally, the centre of an occupant’s breathing zone was assumed to be 980 mm from the ground and is represented as black rectangles with a thickness of 5 mm.
Furthermore, to accurately track the airborne transmission, it is essential to approximate the volume of air surrounding an occupant’s mouth, referred to as the “breathing zone”. The cylindrical geometry simplification with its dimensions is shown below in Figure 2.

2.2. Meshing

To capture the key characteristics of the flow, relevant to the current research in modelling the cabin airflow driven by ventilation as well as particle dispersion, the meshing strategy must be considered. In regions where high velocity gradients and significant flow changes occur, a finer mesh was adopted. Inflation was applied to the external wall boundaries, as well as the inlet and outlet surfaces. In addition, face meshing on mouth surfaces was applied with three levels of refinement to allow for more accurate results for particle tracking. In total, the generated mesh consisted of 373,851 cells, 793,947 faces, and 86,002 nodes, with a single partition. The meshing sensitivity analysis in Section 2.2.1 illustrates the derivation of layer sensitivity.

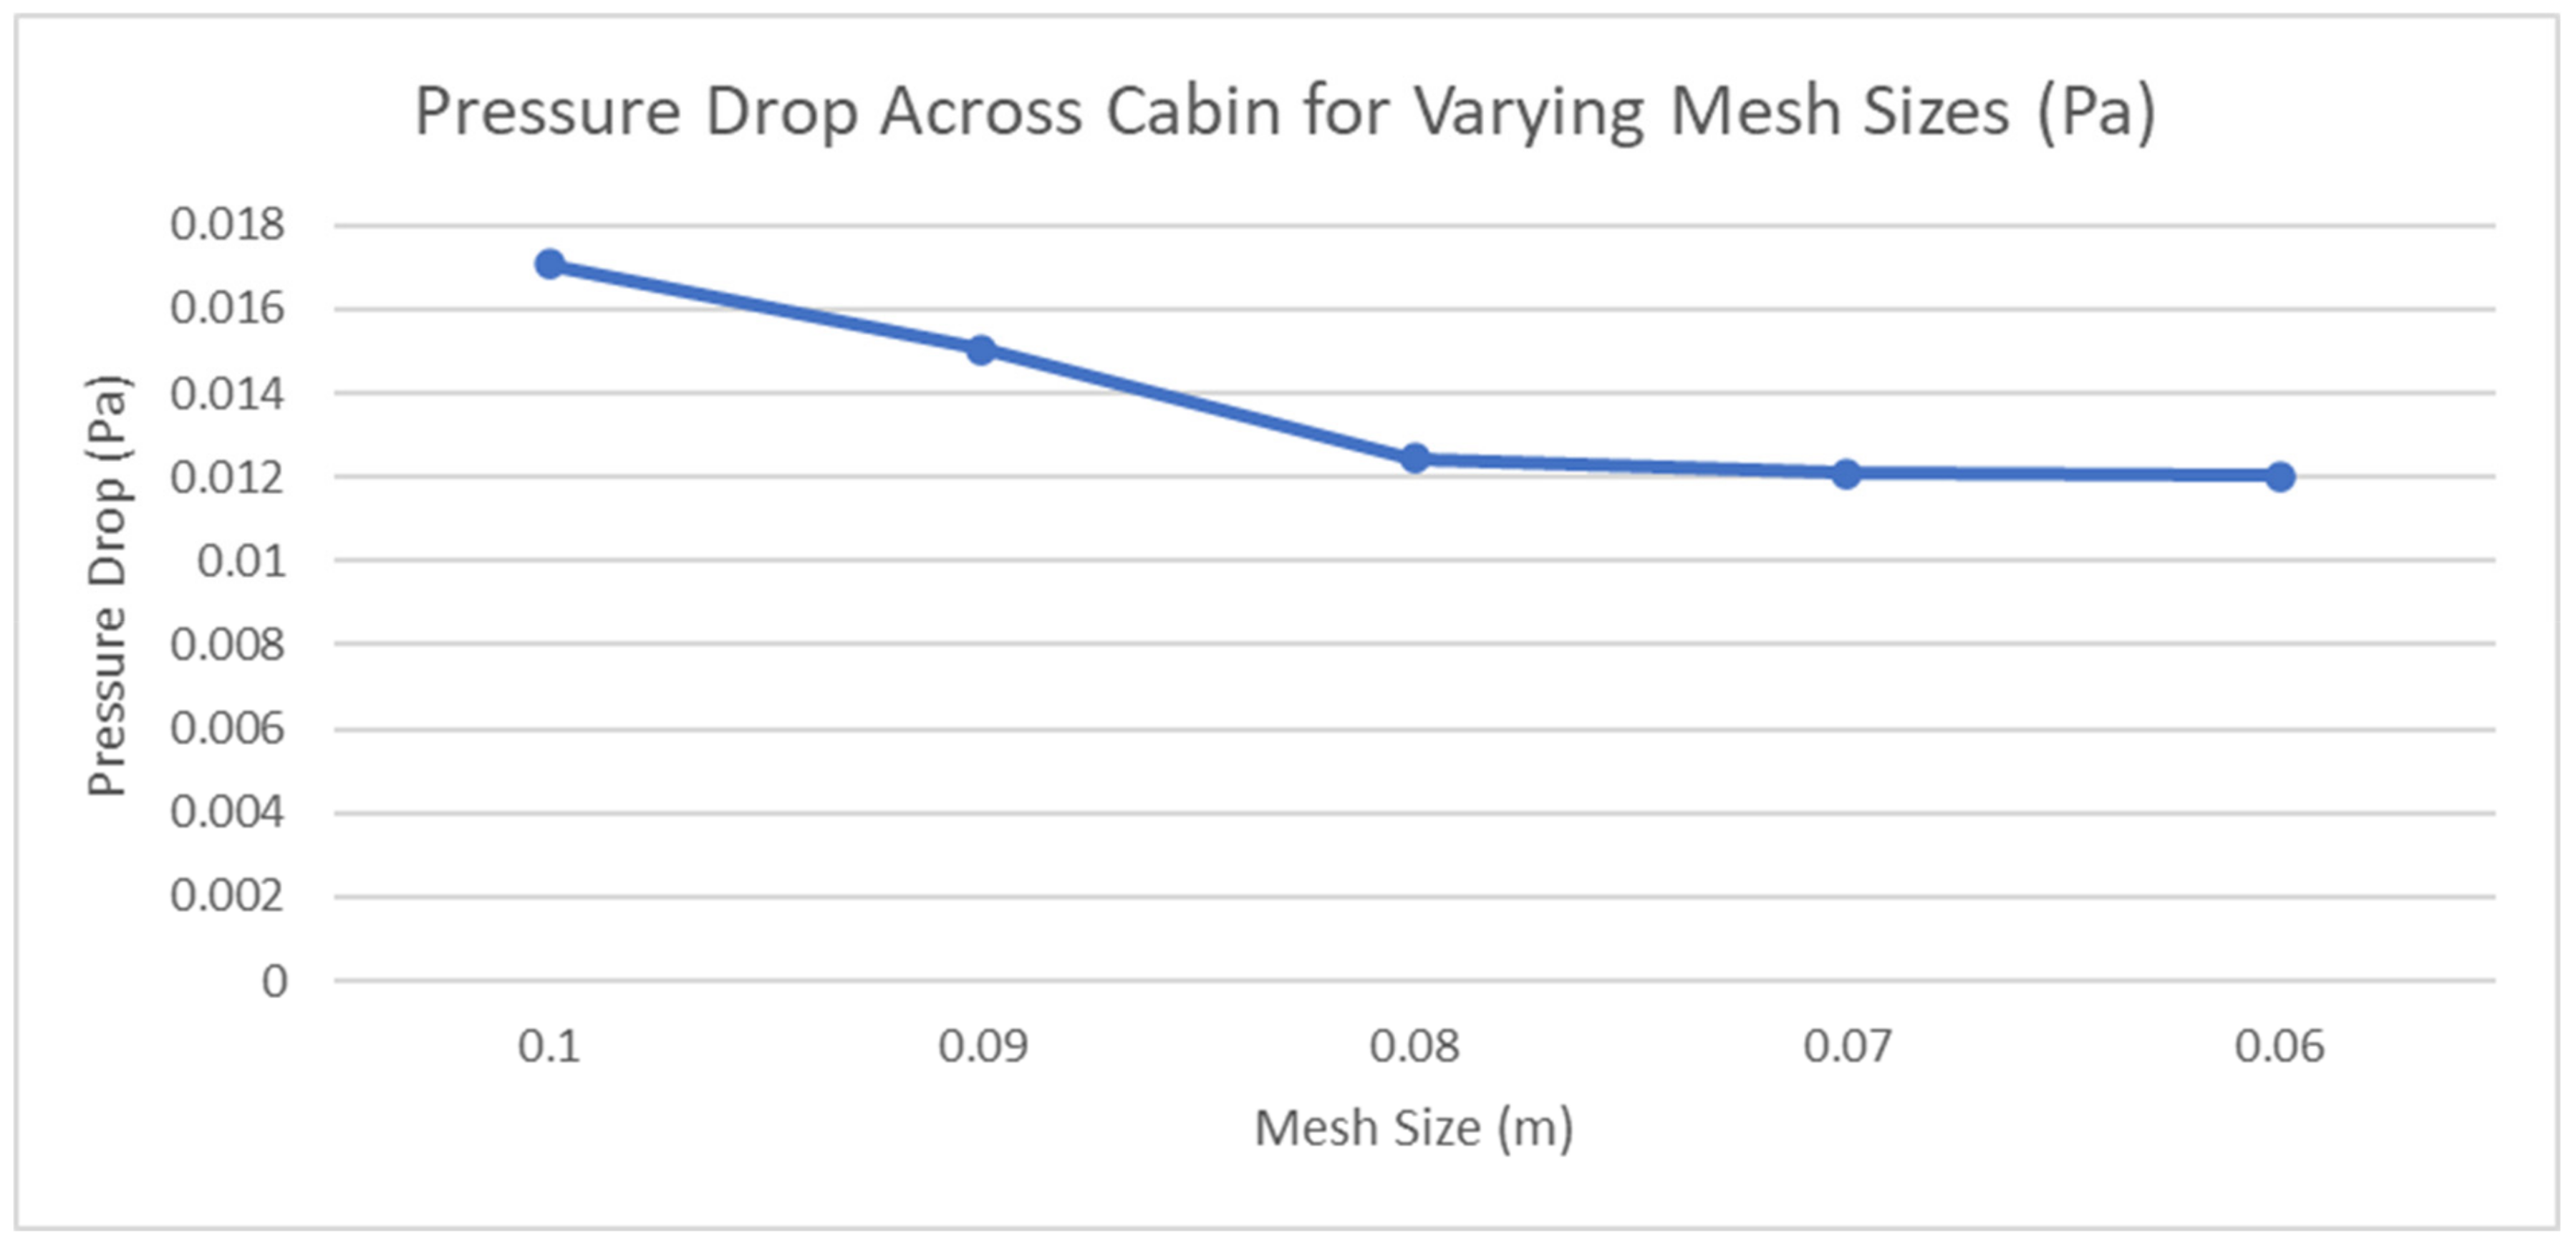
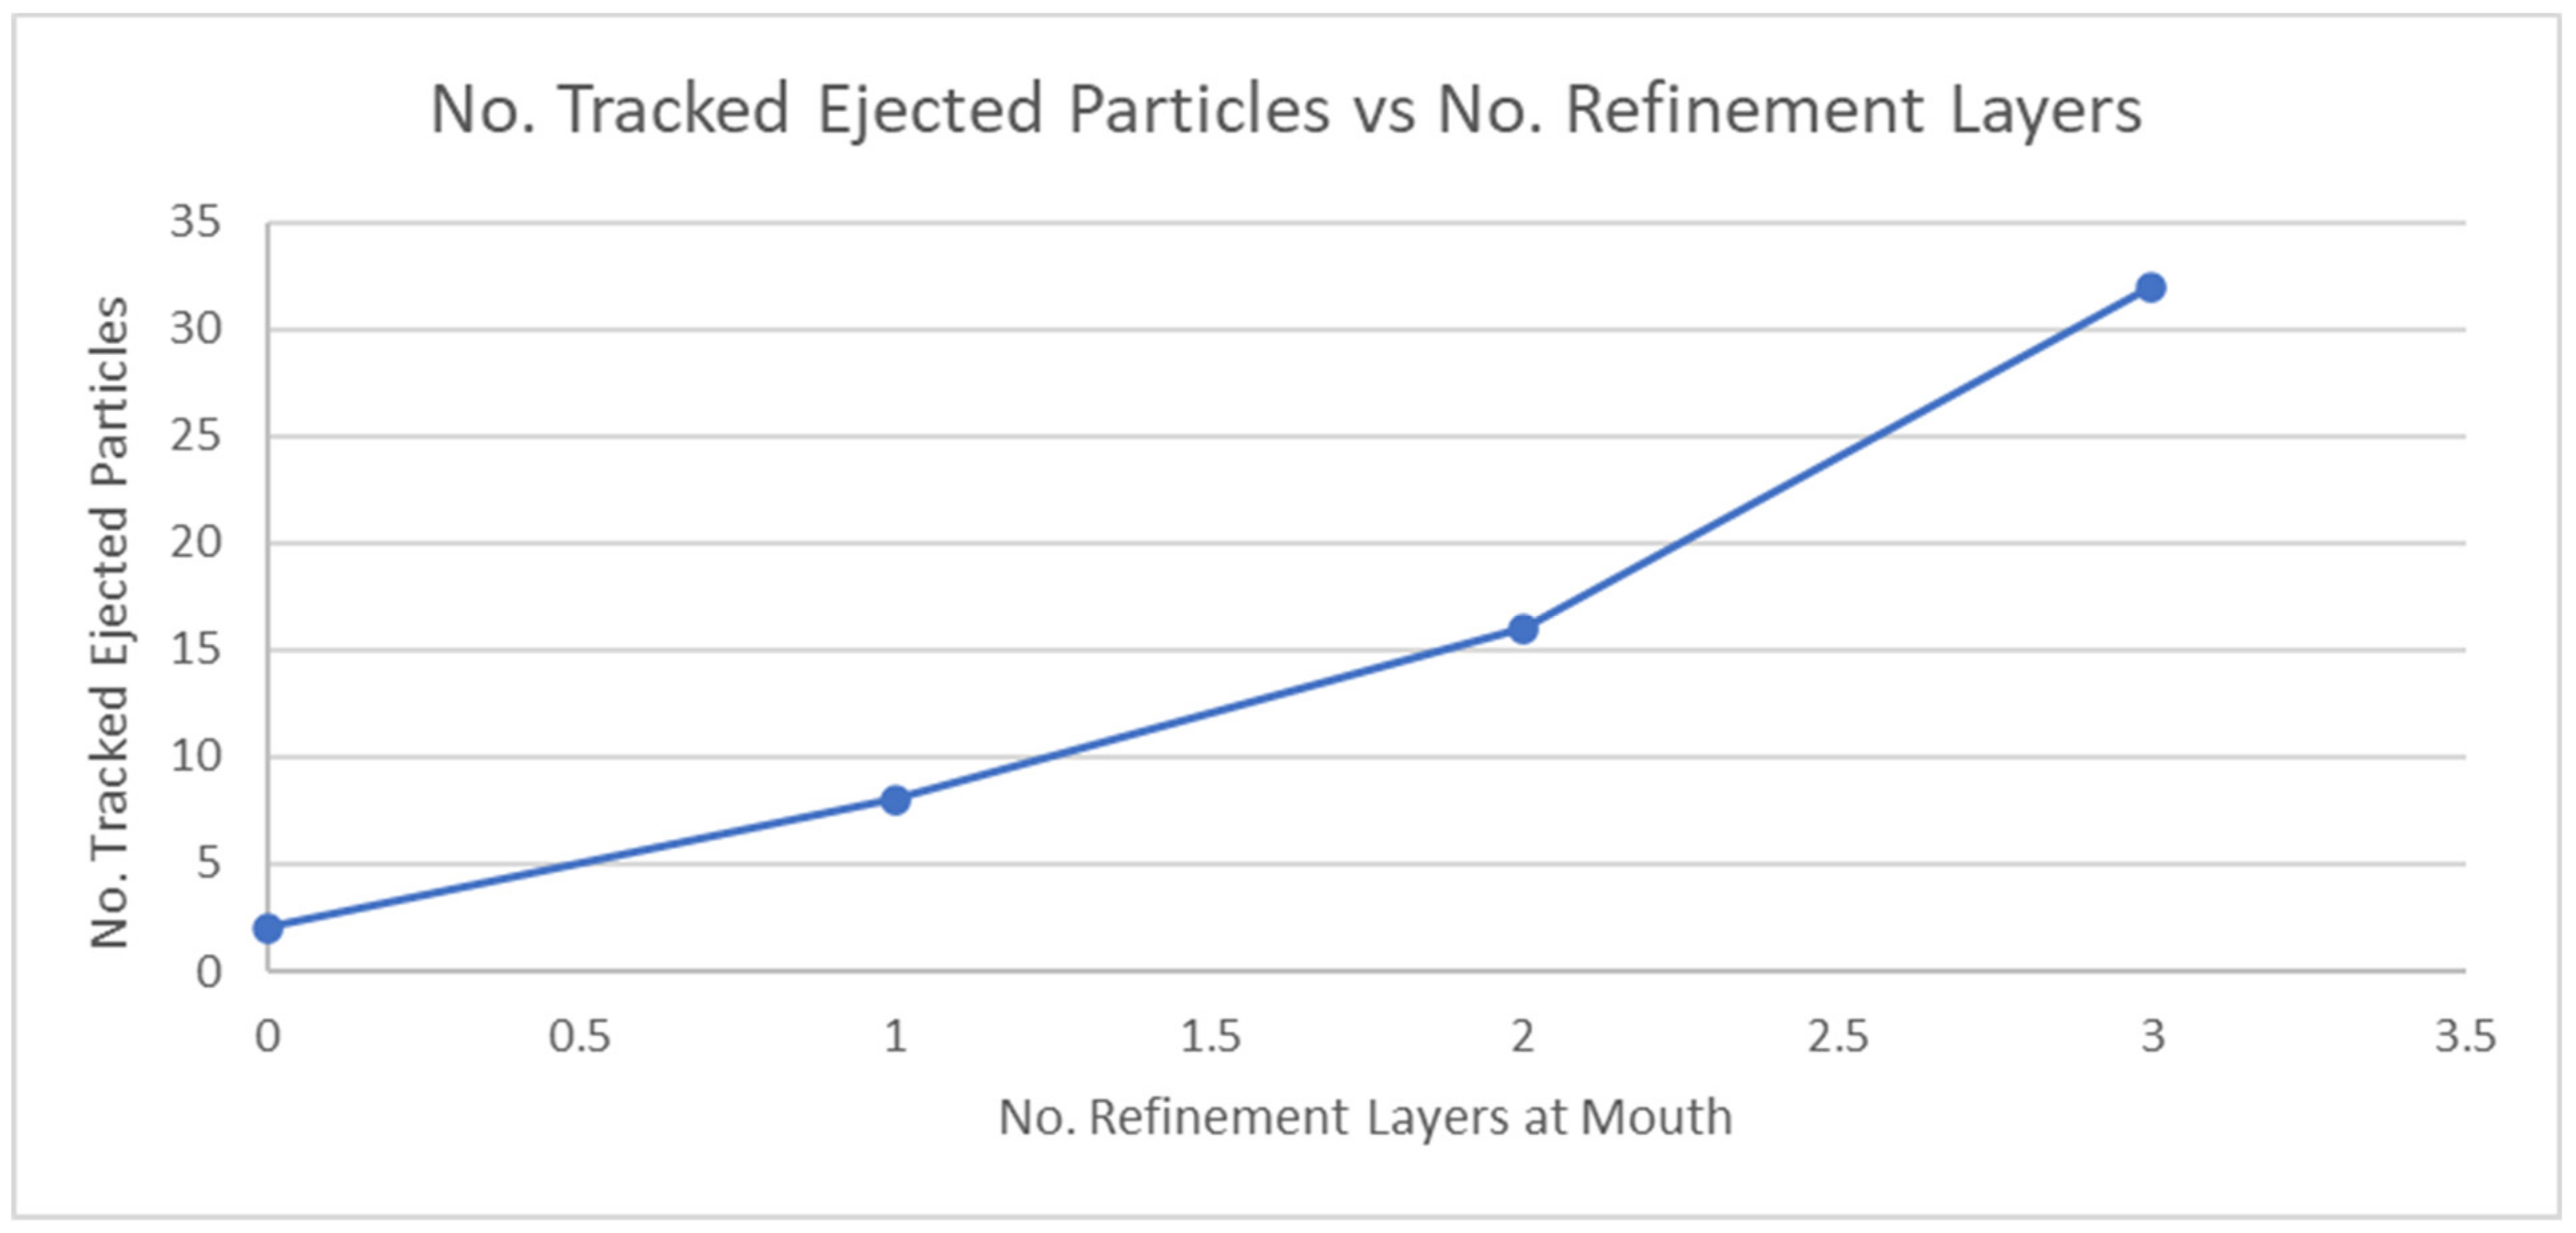
2.2.1. Meshing Sensitivity Analysis

To ensure that the simulation results are independent of the mesh size, a mesh sensitivity analysis was conducted. It involved performing simulations with varying mesh sizes and refinement at appropriate locations to determine the effects on the key output parameters—in this case, the pressure drop across the cabin. According to Skill-Lync (2024) [8], a pressure drop is highly sensitive to the mesh resolution in confined spaces like aircraft cabins with many obstacles for airflow interaction. It was therefore chosen as the critical indicator of how well the simulation captures the overall flow dynamics like boundary layer effects and flow resistance.
To maintain the consistency, all the input parameters and boundary conditions were kept the same, using 20 ACH rates to govern the flow. The following results for the mesh sensitivity analysis are given below in Figure 3:
As the mesh size decreased, the pressure drop also decreased and began to stabilise. This trend indicates that the mesh size of around 0.07 m or finer produces consistent results, which could be considered as a suitable mesh size for accurate pressure drop prediction in this scenario. A total of 242,543 tetrahedral elements were used in the meshing process. As shown in Figure 4, the cross-sectional and isometric views of the mesh demonstrate a uniform distribution of elements across the cabin geometry, ensuring an adequate resolution for airflow simulation and particle tracking.
In addition, to capture the greatest number of injected particles, a comparison of the varying refinement layers on the mouthpiece was performed. Refining the mesh around the mouthpiece is crucial for accurately capturing the dynamics of injected particles, such as those through coughing. The region around the mouth is where particles are introduced into the airflow, and this area typically experiences complex interactions between the injected particles and the surrounding air. These interactions include rapid changes in velocity and turbulence, which can significantly affect the particle dispersion and residence time.
The following graph summarises the number of ejected particles as a result of increasing the layers of mesh refinement at the mouth surface.
As shown in Figure 5, as the refinement layers increase, there is a clear upward trend in the number of particles tracked until 32 particles are reached. This indicates that finer mesh refinement at the mouth surface significantly improves the simulation’s ability to capture the ejected particles. Thus, a scenario of three refinement layers was chosen at the mouth surface.

2.3. Governing Equations

2.3.1. Airflow Simulation

The k−ε turbulence model was employed in this study for its robustness in capturing turbulent flow dynamics within the aircraft cabin while maintaining the computational efficiency. This model is particularly well suited for large-scale simulations involving temperature variations, as it provides accurate predictions of turbulent kinetic energy and its dissipation rate.
The airflow was simulated based on the fundamental conservation laws of mass, momentum, and energy, represented by the following equations:
1.
Continuity Equation (Conservation of Mass):
ρ t + · ρ v = 0
where ρ is the fluid density, and v is the velocity vector.
2.
Momentum Equations (Conservation of Momentum):
t ρ v + 𝛻 · ρ v v = p + · μ e f f v + ρ g
where p is the static pressure, μ e f f is the effective viscosity, and ρ g is the gravitational body force.
3.
Energy Equation (Conservation of Energy):
t ρ E + 𝛻 · v ρ E + p = · k e f f T + S h
In this equation, E is the total energy per unit mass, k e f f is the effective thermal conductivity, T is the temperature, and S h represents any heat source term such as human body heat.
4.
Turbulence Transport Equations:
The k−ε model solves two additional transport equations to account for turbulence:
  • a.
    Turbulent Kinetic Energy Equation:
t ρ k + · ρ k v = · μ + μ t σ k k + G k ρ ϵ
where μ t is the turbulent viscosity, σ k is the turbulent Prandtl number for k , G k is the turbulence production term, and ϵ is the dissipation rate of turbulent kinetic energy.
  • b.
    Turbulent Dissipation Rate Equation:
t ρ ϵ + · ρ ϵ v = · μ + μ t σ ϵ ϵ + C 1 ϵ ϵ k G k C 2 ϵ ρ ϵ 2 k
Here, σ ϵ is the turbulent Prandtl number for ϵ , and C 1 ϵ and C 2 ϵ are model constants.

2.3.2. Particle Tracking

For the dispersed phase, the Lagrangian discrete phase model (DPM) was employed to track individual particle trajectories. This approach accounts for forces such as drag force and gravity acting on the particles. The equations governing particle motion are expressed as:
d x p d t = u p
d u p d t = F D + F G
where x p is the particle position, u p represents the particle velocity, F D is the drag force per unit particle mass, and F G is the gravitational force.
The drag force is defined as:
F D = 18 μ ρ p d p 2 C c u u p
Here, μ is the air viscosity, ρ p is the particle density, d p is the particle diameter, u is the airflow velocity, and C c is the Cunningham correction factor.
Gravitational force F G is expressed as:
F G = g ( 1 ρ f ρ p )
where ρ f is the fluid (air) density, and g is the gravitational acceleration vector.

2.4. Setup and Boundary Conditions

2.4.1. Material Properties

In this analysis, the simulation conditions and parameters are defined to realistically model the aircraft cabin environment and assess the behaviour of aerosols and airflow, considering their impact on the respiratory transmission risks. Assuming a cruising altitude of 2135 m, the 2019 ASHRAE Handbook—HVAC Applications, Chapter 13 Aircraft, specifies a cabin pressure of 78.187 kPa. Additionally, ASHRAE (2019) [9] specifies that the Environmental Control System (ECS) should maintain an internal cabin temperature of 24 °C, which has been used as the basis for further property assumptions. With the employment of The Engineering ToolBox (2004) [10], the following properties of the cabin air were set (Table 1):
Furthermore, coughing is currently assumed to produce a potentially infectious concentration of aerosols, serving as a quantitative reference for evaluating high-risk aerosol generation. The analysis adopted an aerosol concentration of 0.025 particles/cm3 for aerosols sized 1–5 micrometres, based on the findings from Sanmark et al. (2023) [11], which measured the mean particle concentrations during involuntary coughs. Particles smaller than 5 μm dispersing beyond 1 m are considered aerosols, which can linger in the air, heightening the respiratory transmission risks (Santos et al., 2020 [12]). Based on Fennelly (2020) [13], the assumed diameter for respiratory aerosols was set at 4 μm, reflecting the studies on the size and transmission risks of infectious aerosols from respiratory infections. Since aerosols primarily consist of water, proteins, and other biological materials, their density is typically approximated close to that of water, 997.38 k g / m 3 at 24 °C.

2.4.2. Boundary Conditions and Flow Parameters

Table 2 defines the boundary conditions used in the CFD simulation to accurately represent the physical environment of the aircraft cabin.
Moreover, each boundary condition was chosen based on the industry standards and relevant research studies. The assumption for human breath velocity was taken from the work of Rajendran et al., (2023) [3]. The human cough velocity was taken from a similar study by Yan et al. (2017) [14]. A velocity angle of 30 degrees relative to the wall tangent was applied, following the approach used by Talaat et al. (2021) [15]. A minimum of 9.06 L/s/person, representing an equal quantity of filtered recirculated air and conditioned air was considered in these calculations to maintain the ASHRAE (2019) [9] guidelines.
To maintain a comfortable temperature of 24 °C, a supply temperature of 20 °C was assumed. The inlet and outlet boundaries were chosen to have an escape boundary condition, since the air leaves the domain and is not considered further in the simulation, where particles can exit without returning. To reduce the computational cells and resources, a symmetry plane boundary condition was chosen to enable the modelling of only half of the domain and only a sample cabin size. Properly defined symmetry planes ensured accurate mirroring of the flow field, maintaining the simulation accuracy.
Furthermore, thermal boundary specifics were determined by considering the impact significance of each boundary. For example, the cabin surfaces besides the side walls were considered adiabatic to not allow heat transfer, meaning it was thermally insulated. This approach helped to focus the simulation on the more critical heat transfer interactions, such as those involving the side walls, which are closer to the exterior environment and are thus typically colder. The thermal boundary temperatures for fixed temperature boundaries were taken from Isukapalli et al. (2013) [16]. All the thermal boundaries were defined with non-slip velocity conditions whereby the fluid velocity at the wall was set to zero. This ensured that the fluid adhered to all surfaces, such that the boundary layer effects, heat transfers, and shear stresses were accurately represented. Lastly, the fluid domain was defined as the volume within the cabin, excluding the space occupied by the chairs and manikins. This simplification allowed for a more efficient simulation while still capturing the essential dynamics of the cabin environment.

2.4.3. Variables and Metrics

This study aimed to evaluate the impact of the ACH rate for a Boeing 737 on the risk of pathogen transmission. Simulating one infected individual maintained a constant expulsion point to directly observe how increasing the ACH rate affects the spread from a single source. The particulate equivalent ACH over the bleed air ACH was chosen to better model the comprehensive ventilation in an airplane cabin.
The chosen values for measuring the effects of the particulate equivalent ACH were 15, 20, 25, and 30 ACH. The following Table 3 summarises the four scenarios being investigated including the supply air inlet velocity for the corresponding ACH parameters.

3. Results and Discussions

3.1. Airflow Pathlines

Figure 6 illustrates the airflow pathlines and velocity distributions within the cabin at different ACH rates.
As shown in Figure 6, the overall movement of air in the cabin shows a consistent pattern where air is supplied from the overhead compartments, flows downwards past the passengers, and exits near the floor. As air moves across the cabin, it accelerates near the corners of the overhead baggage compartments, creating a stronger airflow in those areas. In the mid-section of the cabin, there is a horizontal flow of air that spans across the passenger seating area, which becomes more concentrated and effective at a higher ACH. The vertical flow pattern shows higher velocities near the ceiling, with air gradually slowing down towards the floor. At a higher ACH, this vertical gradient becomes less pronounced, and the airflow is more balanced, ensuring better overall circulation throughout the cabin.

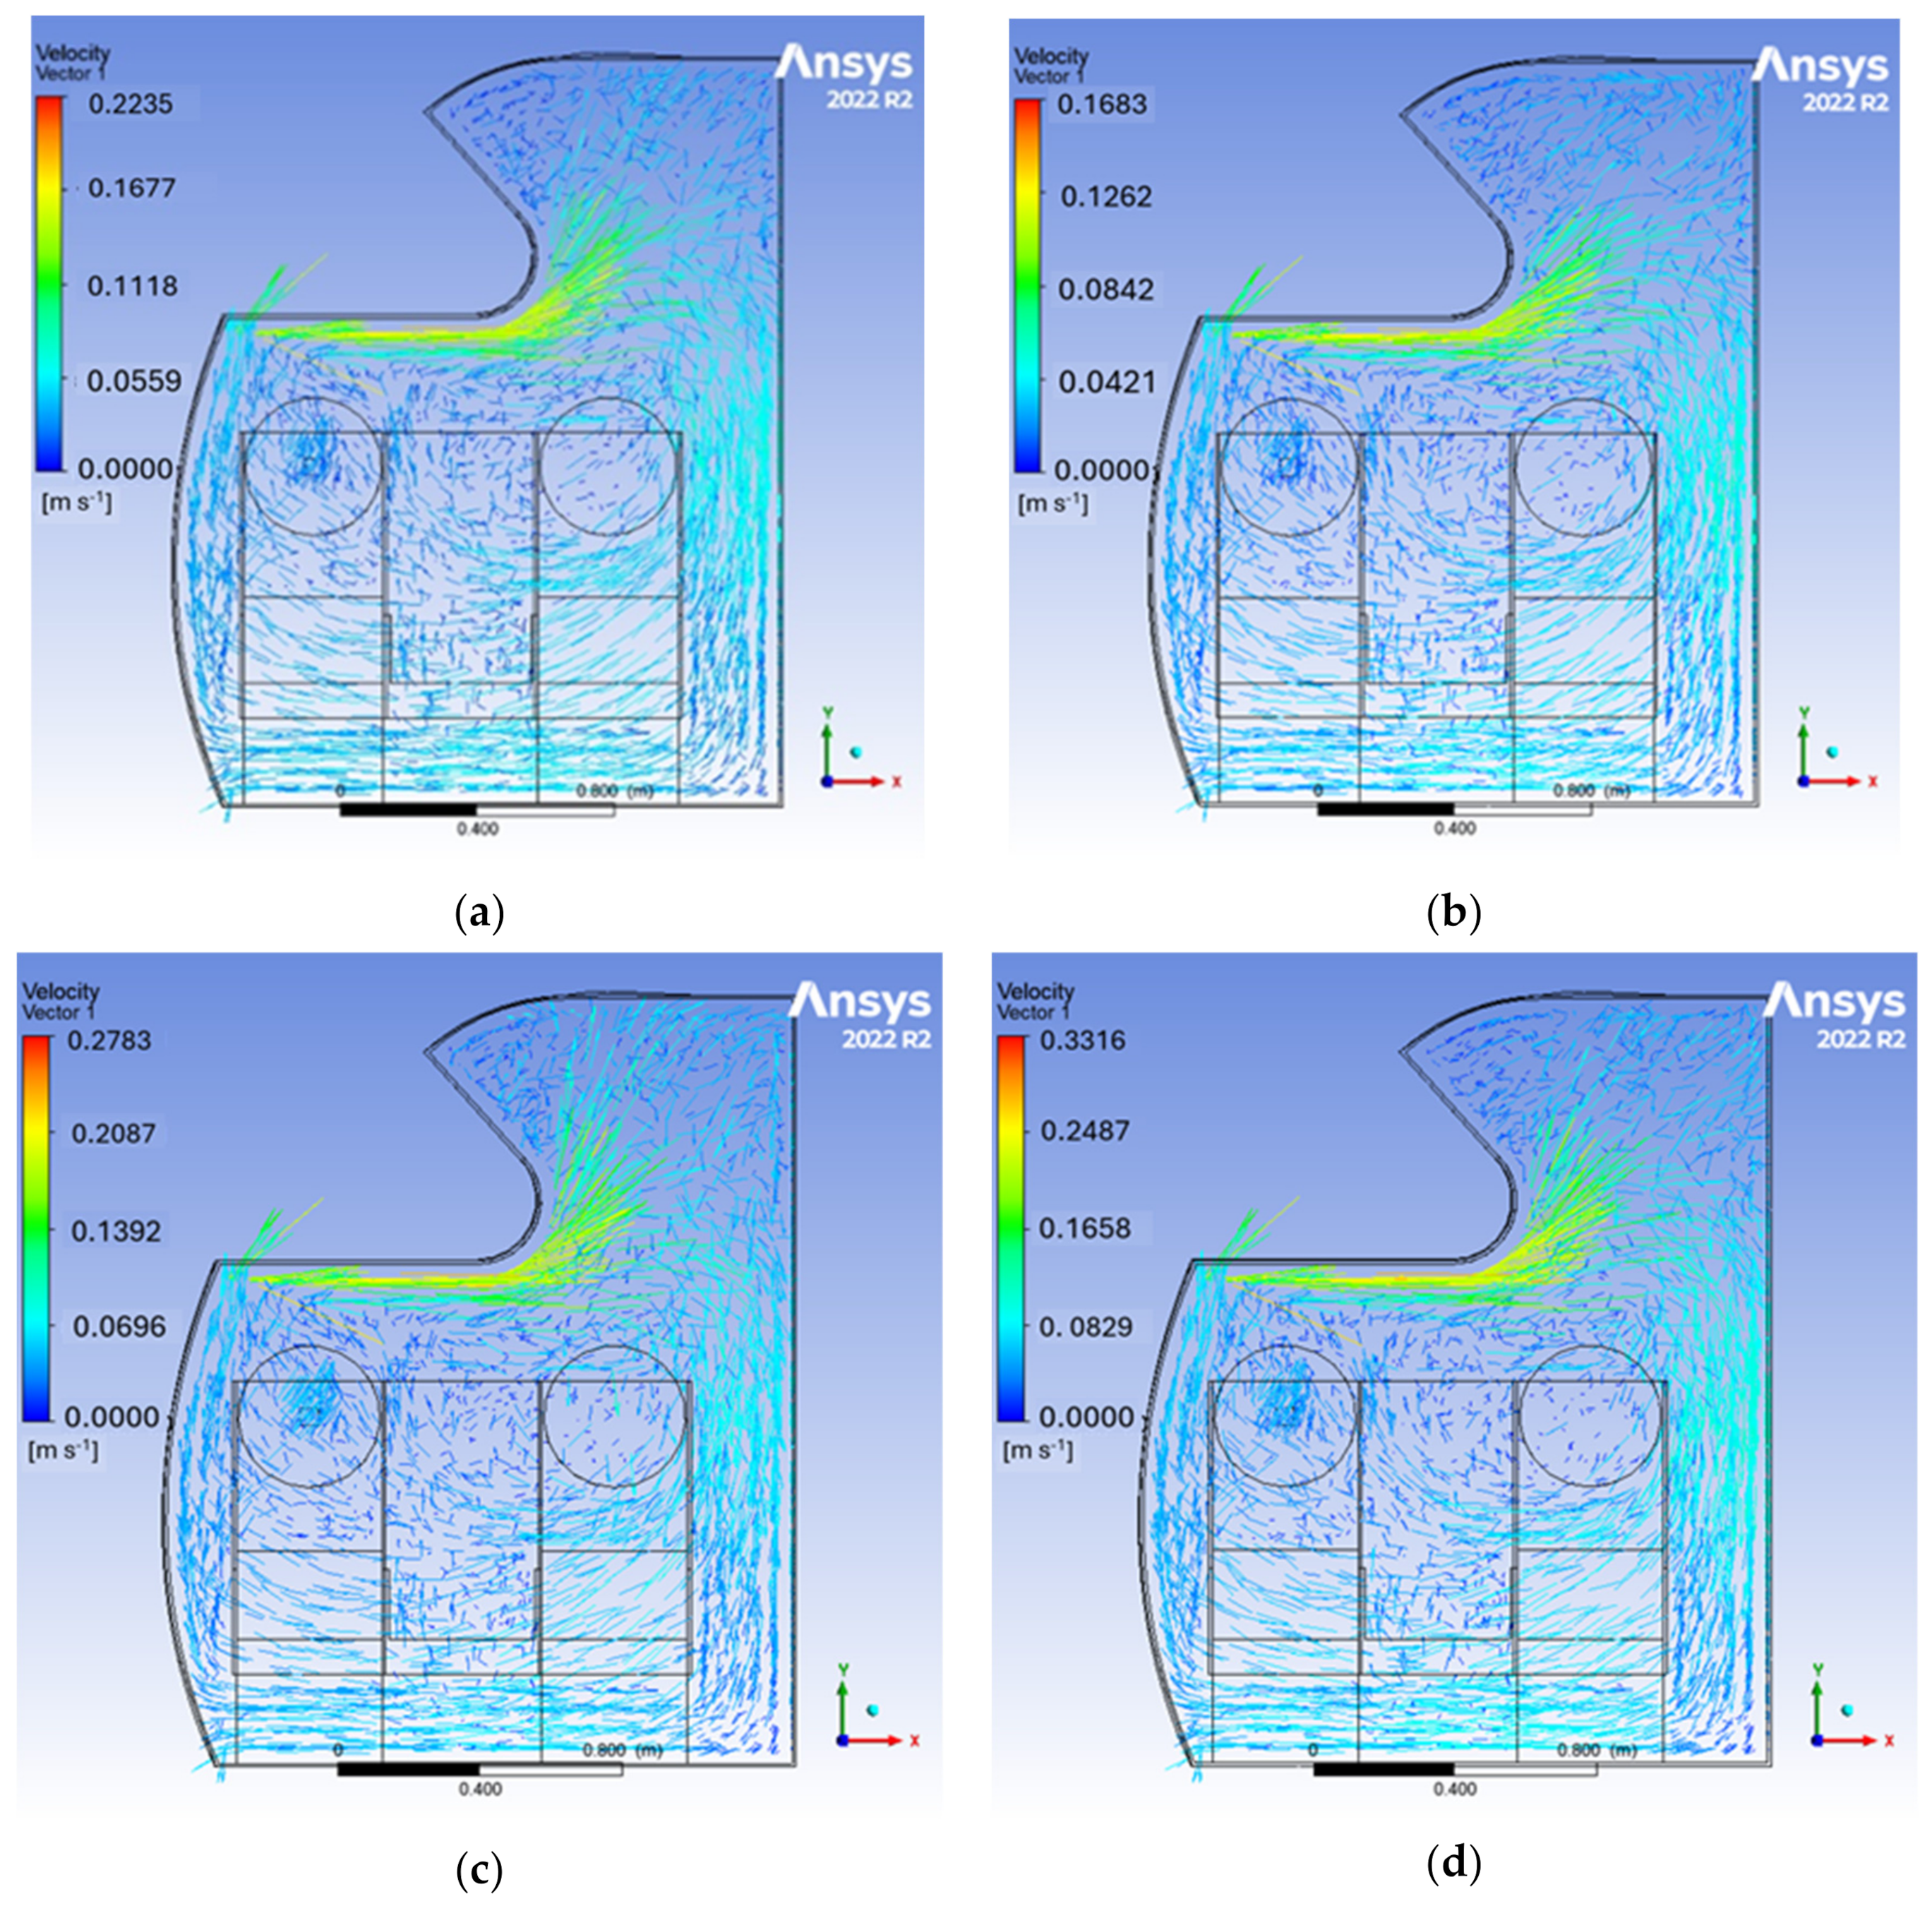
3.2. Velocity Distribution

At 15 ACH (Figure 6a), the velocity is relatively low, with a slower airflow in the breathing zone and significant stagnation near the floor. As the ACH increases to 20 (Figure 6b), there is a notable improvement in the airflow distribution, although some low-velocity areas remain. At 25 ACH (Figure 6c), the airflow becomes more uniform, with reduced stagnation areas, particularly near the passengers. Finally, at 30 ACH (Figure 6d), the velocity distribution reaches its highest levels, resulting in minimal stagnation and more even velocity throughout the cabin. Additionally, as the airflow approaches the overhead baggage compartments, the air accelerates as it passes these corners.
Airflow patterns at 15 ACH showed significant recirculation zones, particularly around the passenger head height between the seats, and dead zones near the floor where the air is stagnant. The velocity increases near the overhead baggage compartments but does not prevent low-velocity areas below. At 20 ACH, the recirculation zones shrink, though some swirling air remains between the passengers, and the dead zones near the floor are reduced but still present. At 25 ACH, the airflow becomes more uniform, further minimising the recirculation and dead zones, especially at the passenger head height and below the seats. By 30 ACH, the recirculation zones are significantly reduced but not fully eliminated, with a stronger airflow throughout the cabin and minimal stagnant regions, especially near the overhead compartments.

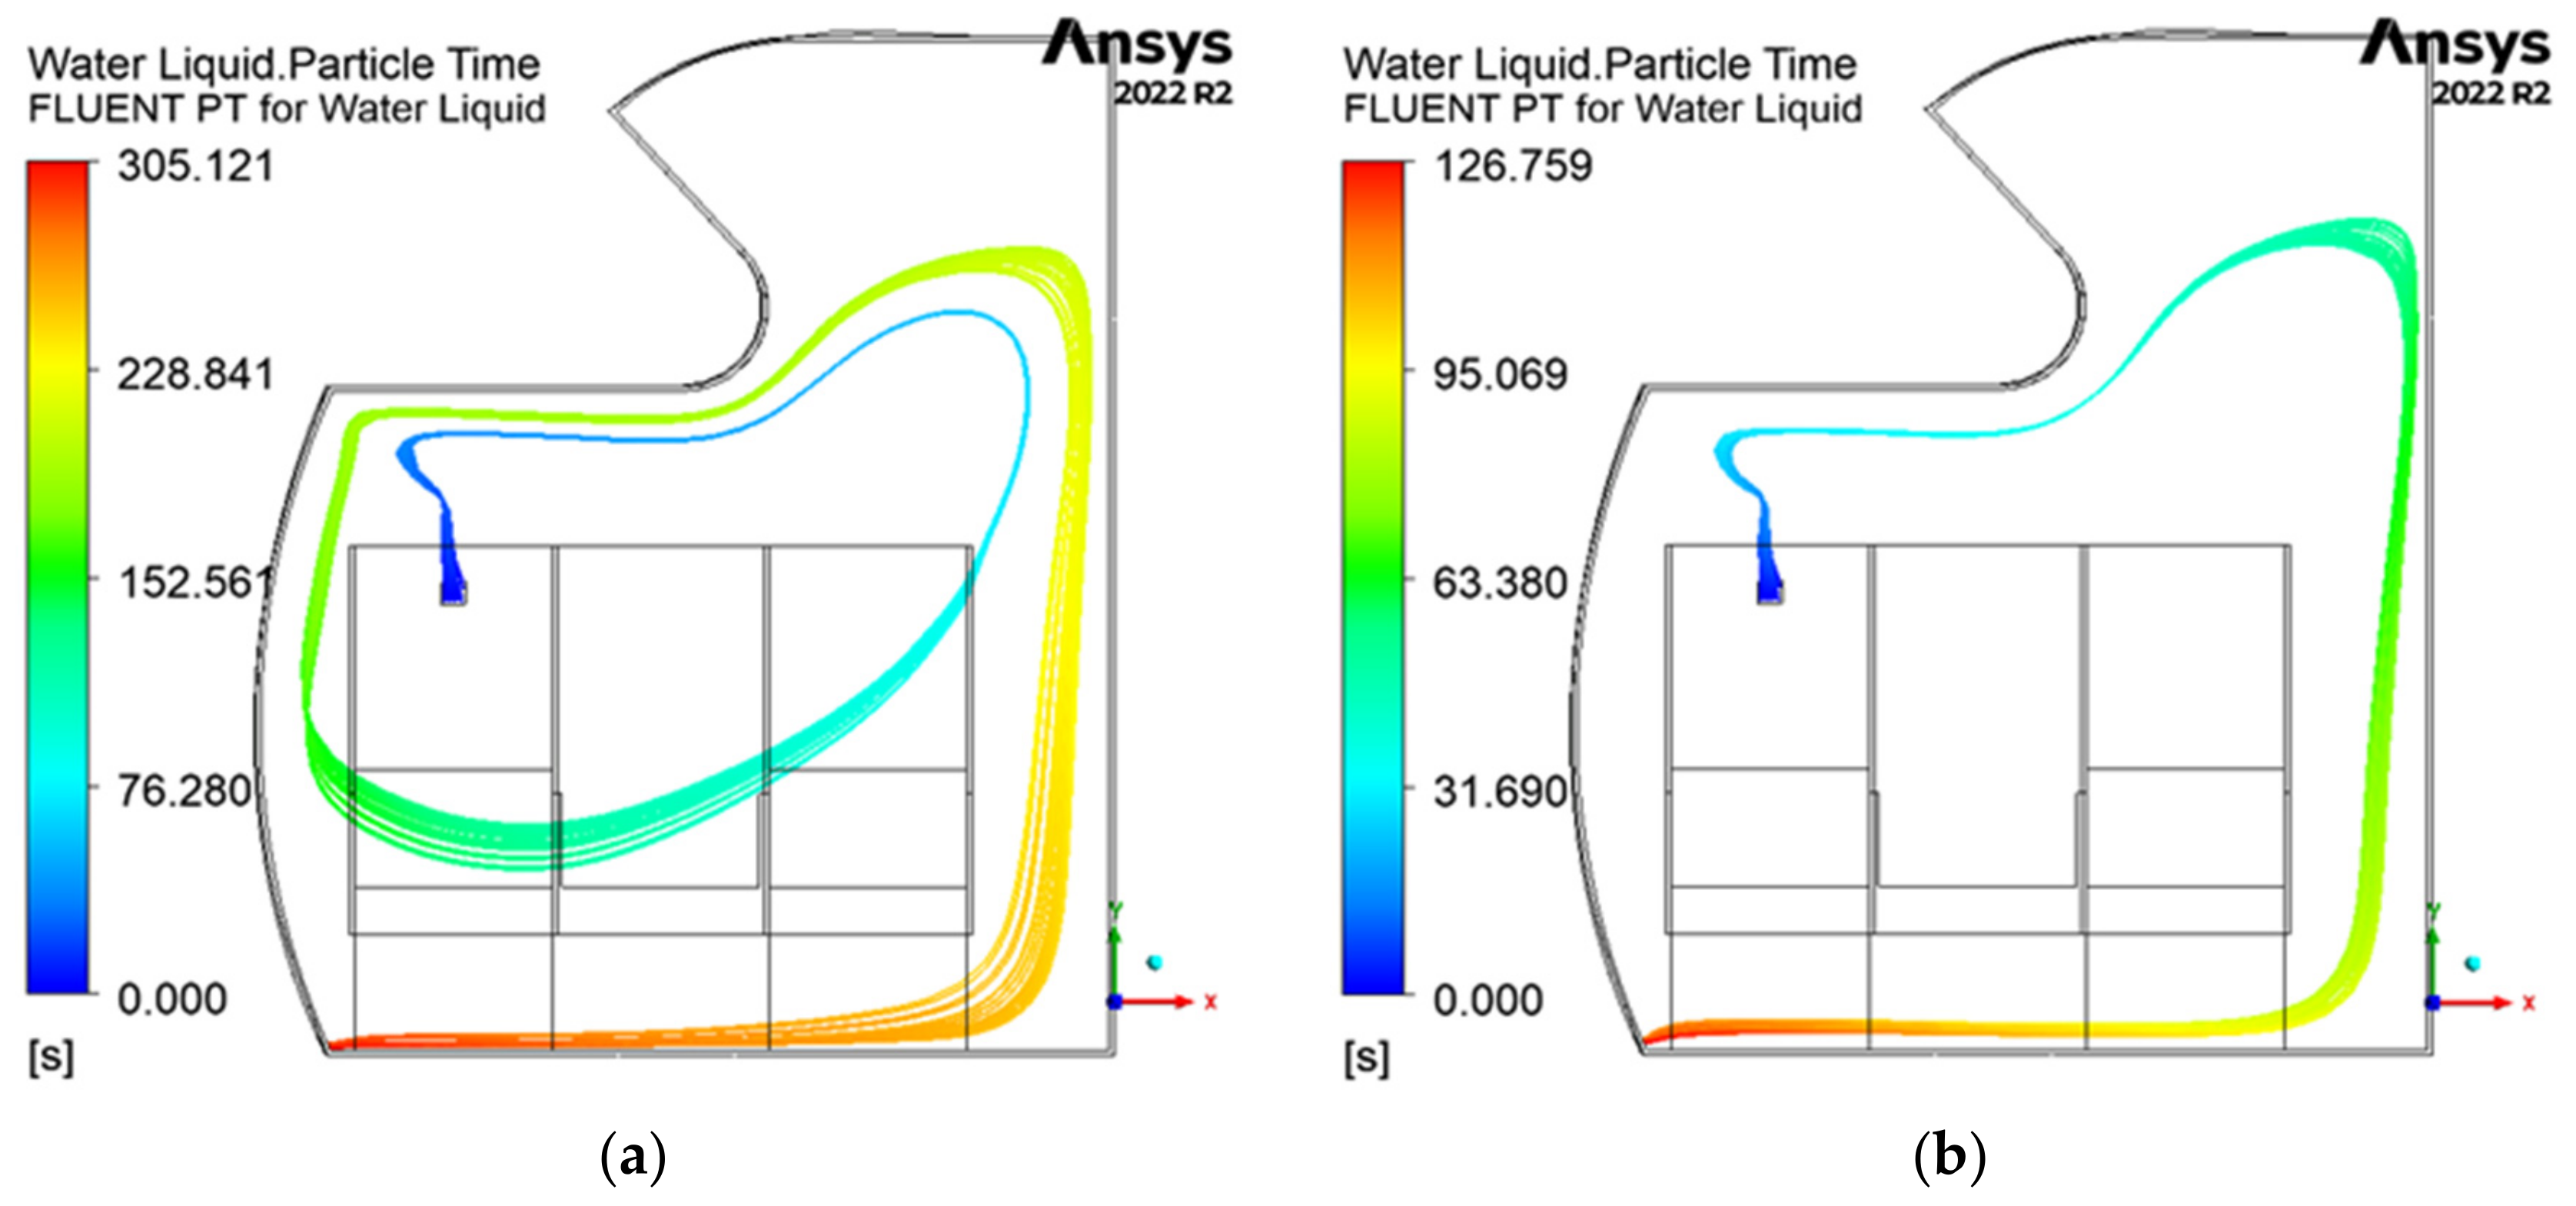
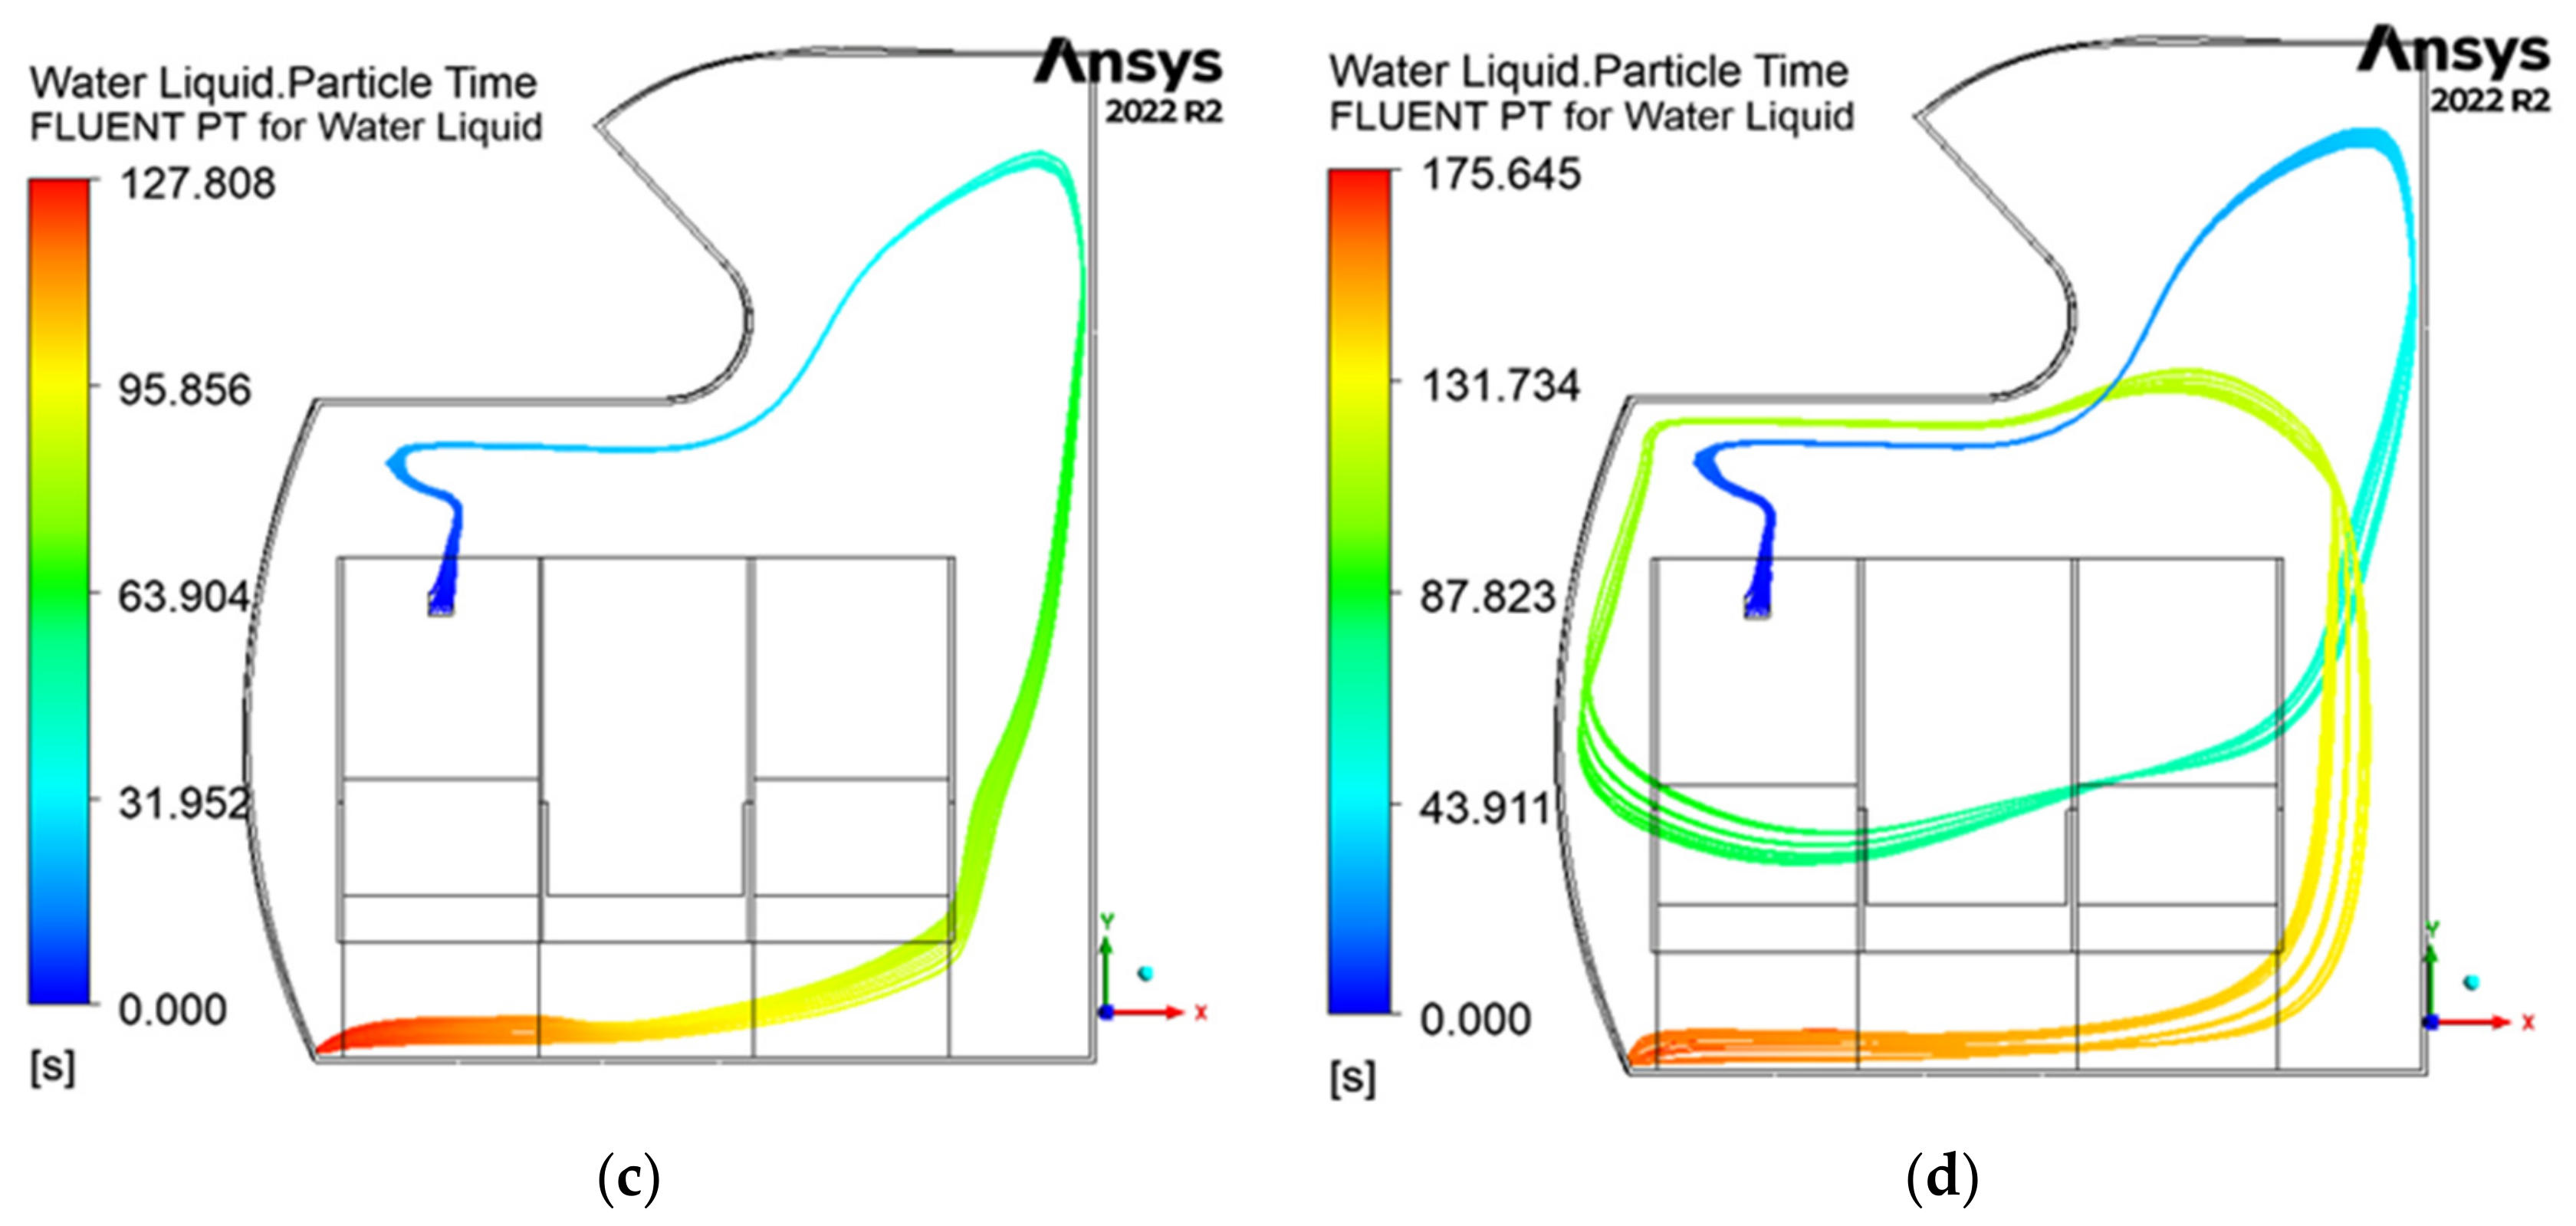
3.3. Pathogen Residence Time

The pathogen residence time represents how long pathogens remain airborne in specific regions of the cabin before settling or being extracted by the ventilation system. Long residence times can indicate high-risk areas where pathogens linger, increasing the chance of inhalation by passengers. Illustrated below in Figure 7 are the pathogen residence times and trajectory within the cabin at different ACH rates.
At ACH 15, the longest pathogen residence time is exhibited across all the tested air change rates with 305.1 s, more than double the next highest residence time.
The pathogen-laden air recirculates the pathogens twice before being expelled, particularly around the breathing zones. This recirculation traps the air in localised vortices, prolonging the pathogen residence time by redistributing particles instead of directing them efficiently towards the outlets.
When the ACH was increased to 20 and 25, a noticeable reduction in the pathogen residence time was observed (see Table 4). At higher ACH rates, the airflow is more streamlined, with fewer dead zones where pathogens could accumulate. However, at 30 ACH the residence time increases to 175.6 s showing a similar movement path to that of 15 ACH, circulating the cabin space twice before exiting. At lower ACH levels of 15 and 20, the pathogen movement is primarily confined to the x-y plane. In these scenarios, pathogens tend to remain trapped within localised recirculation zones, with limited transport along the z-axis to other rows. Conversely, at 25 and 30 ACH, there is more pronounced longitudinal movement along the cabin’s length. Lastly, in all the cases examined, no significant infiltration of pathogens into the breathing zones was detected.

3.4. Summary of the Results

The following points summarise the key findings of the study, based on visual inspection.
  • The pathogen residence time is the longest at 15 ACH, while the shortest residence times are observed at 20 and 25 ACH.
  • At lower ACH rates, airflow stagnation is more prominent, increasing the potential for pathogen buildup in certain areas.
  • At 30 ACH, the residence time slightly increases, breaking the downward trend from 15 to 25 ACH.
  • At 25 and 30 ACH, there is increased pathogen movement between the rows.
The results indicate that increasing the ACH rate from 15 ACH to 25 ACH reduces the pathogen residence time by enhancing the air circulation, which in turn minimises the recirculation and reduces the formation of dead zones, particularly around the passenger breathing zones. This is likely to ensure that infectious particles are quickly diluted and expelled from the cabin, reducing the likelihood of prolonged exposure to pathogens.
At lower ACH rates, airflow stagnation becomes more prominent, which creates pockets where pathogens can accumulate and linger. These stagnation zones increase the potential for localised transmission, as the air is not being replaced frequently enough to clear out infectious particles, particularly in areas further from the air inlets and outlets.
As the ACH rate increases, the airflow becomes more uniform throughout the cabin. This uniformity reduces the time that airborne particles stay suspended, enhancing the pathogen removal. However, at 30 ACH, the increased turbulence seems to increase the residence time and circulation of pathogens in the cabin, indicating that there may be an optimal range where the ventilation is the most effective. Additionally, at ACH 25 and 30, there is more noticeable cross-row movement of pathogens. This promotes pathogen distribution more widely across the cabin, potentially exposing passengers seated further from the original source of the infection.

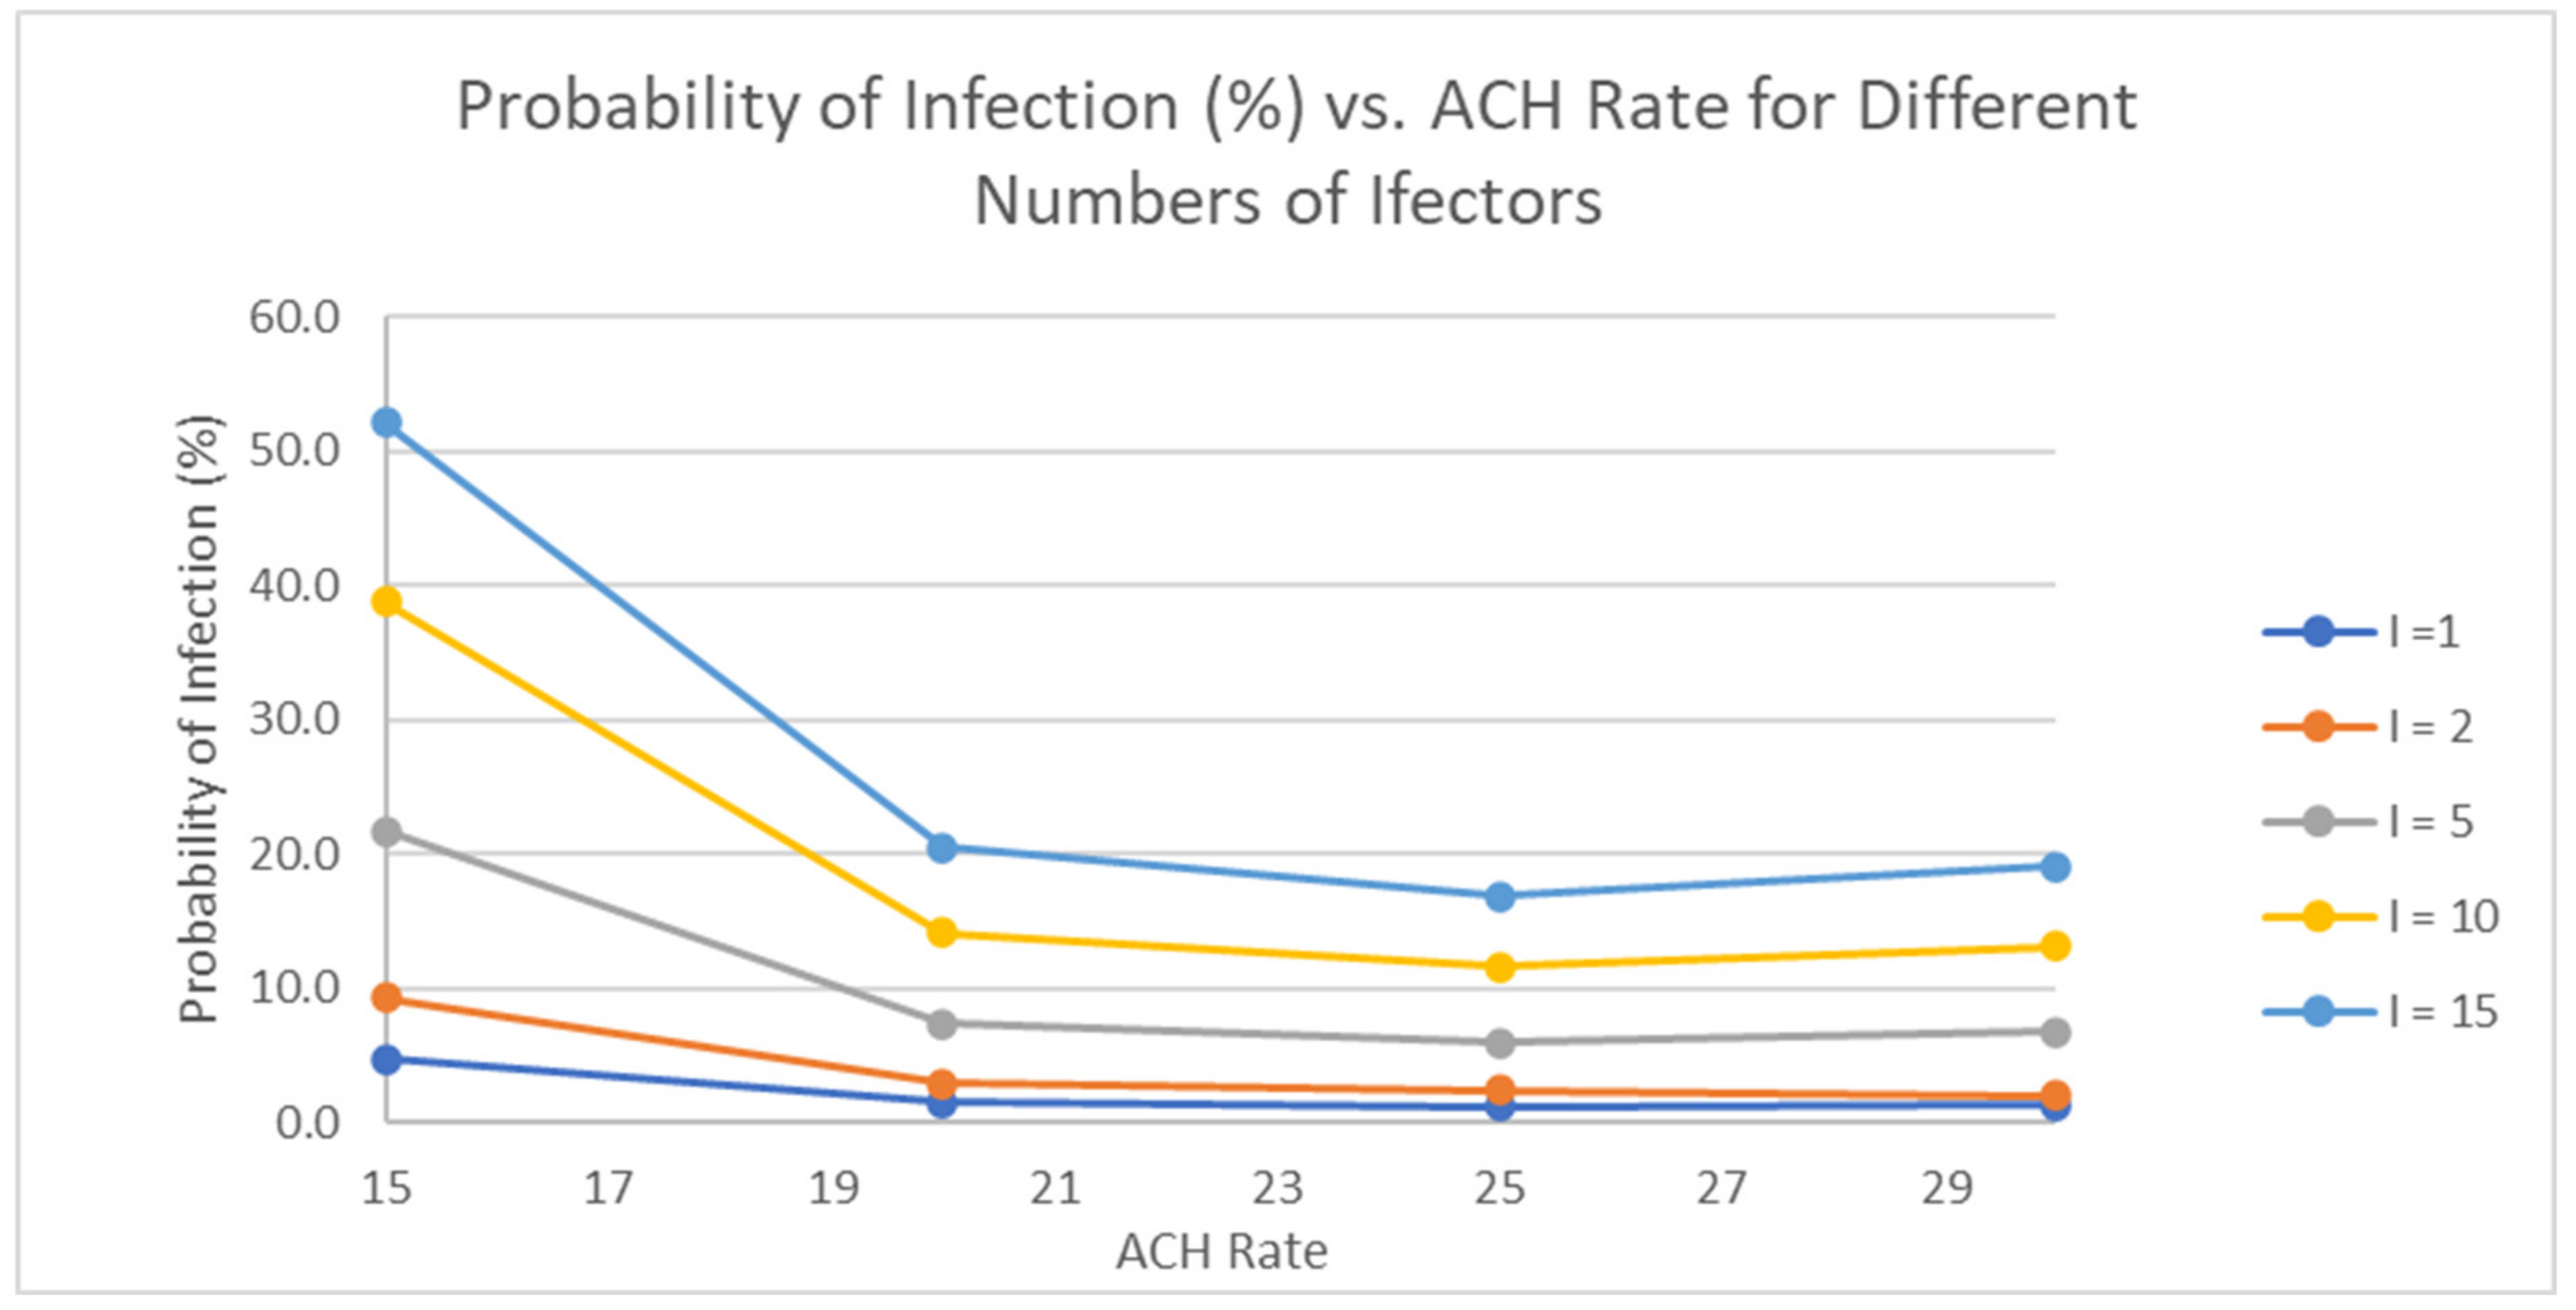
3.4.1. Infection Risk Assessment

The Wells–Riley model has been a widely used quantitative approach for predicting the infection risk of respiratory infectious diseases in indoor spaces. In their study, Sze To and Chao (2010) [17] applied the Wells–Riley model to estimate the airborne transmission risk in various indoor environments, focusing on factors such as exposure duration, environmental infectiousness, and ventilation effectiveness. Building on their work, this study also utilised the Wells–Riley model to examine the impact of ACH, which governs the ventilation rate of a space, on the risk of airborne pathogen transmission.
The Wells–Riley equation is shown below (Sze To and Chao, 2010 [17]):
P I = 1 e ( I q p t Q )  
In this model, P I represents the probability of infection, I is the number of infected individuals, p is the human respiratory rate, q is the quanta generation rate, t is the exposure time or residence time, and Q is the room’s ventilation rate with clean air. The quanta generation rate, q, is derived from case studies and represents the dose of infectious airborne particles sufficient to infect a single susceptible individual. Given the recent and widespread impact of COVID-19, it is reasonable to use this virus as a basis for illustrating the aerosol infection risk in this study. To best represent COVID-19, the quanta generation rate for SARS, a related virus, was selected, as it provides the most relevant data for this context. This value was sourced from the ASHRAE article Ventilation, Filtration, and UVGI by Jonathan Burkett (2021, p. 20) [18]. By utilising the Wells–Riley model, this study assumes a homogeneous mixing of air, a constant quanta generation rate, and steady-state conditions regarding the air exchange and quanta concentration.
The probabilities of infection with one infector, as modelled in this study, are presented in Table 5 for the four case studies discussed.
The findings illustrated in Figure 8 show that with 15 ACH, approximately 5% of susceptible individuals are likely to be infected. Increasing the ventilation rate to 20 ACH reduces the infection probability to around 1.5%, representing a significant 68.3% decrease. Between 20 ACH and 25 ACH, the infection risk decreases by an additional 19.3%, followed by an increase of 14.3% from 25 to 30 ACH. Overall, 20 and 30 ACH exhibit the lowest infection risk, despite 25 and 30 ACH having the lowest residence time.
Up to this point, the infection risk assessment has assumed only one infector. As shown in Figure 9, multiple scenarios with varying numbers of infectors are plotted to compare the likelihood of transmitting SARS. With just a slight increase to two infectors, the infection rate rises to around 10%. This trend continues to increase significantly, reaching just over 50% at 15 ACH with 15 infected individuals. The infection rate increases sharply with just a slight rise in infectors, and the linear fit with an R2 of 0.992 shows a strong, predictable relationship. This highlights the compounding effect of multiple infectors on the viral load, making ventilation systems less effective and requiring stronger mitigation strategies for high-risk scenarios.

3.4.2. Optimisation

High ventilation rates are crucial for diluting and removing airborne pathogens, especially in high-risk environments such as public transport or airplanes, where infectors are more likely to be present. In these settings, maintaining elevated ACH rates plays a key role in reducing the transmission risks. Even when other control measures like mask-wearing or physical distancing are difficult to enforce, proper ventilation can still provide substantial protection by continuously refreshing the air and removing infectious particles.
The analysis reveals that among the ACH rates studied, ACH 15 results in the highest likelihood of pathogen transmission. Increasing the ACH to 20 significantly reduces this risk, with further increases beyond 20 offering diminishing returns. While there are marginal improvements up to ACH 30, this raises the need for a balanced optimisation strategy—one that minimises the transmission risk but remains practical in terms of energy efficiency and occupant comfort.
Achieving and sustaining ACH 30 may not be feasible in all settings due to the considerable energy demands and operational costs, particularly in terms of fan and motor energy consumption. These factors can have negative economic and environmental impacts. Furthermore, increasing the ACH beyond 30 could create uncomfortable drafts, reducing passenger comfort. Therefore, optimising the ventilation rates involves balancing infection control with realistic energy and comfort considerations.
Nevertheless, the ACH rate alone is not the only factor in reducing the pathogen transmission. A more effective approach would be to combine the appropriate ACH rate with other ventilation strategies, such as temperature control, optimised inlet diffuser design, high-efficiency air filtration systems, personalised ventilation systems, and localised exhaust systems. Together, these elements can create a more balanced and optimised solution, achieving both infection control and energy efficiency while maintaining the comfort for occupants.

4. Conclusions

The primary aim of this study was to investigate the influence of ACH on aerosol disease transmission within aircraft cabins using CFD simulations. By examining variations in ACH, the study sought to understand how different ventilation rates affect the dispersion of pathogens, with the broader goal of contributing to the development of optimised ventilation strategies that can minimise the transmission risks during air travel.
The methodology involved developing a 3D CAD model of a Boeing 737 cabin to simulate the airflow dynamics and pathogen transmission. The model was simplified to include four rows of seating and a symmetrical geometry to optimise the computational resources. A meshing strategy was employed, including a mesh sensitivity analysis to ensure the accuracy, particularly around the mouth area for precise particle tracking. Simulations were run using ANSYS Fluent 2024 with varying ACH rates (15, 20, 25, and 30) to assess the airflow patterns, pathogen residence times, and infection risk under different ventilation conditions. The boundary conditions, airflow velocities, and thermal properties were carefully defined to replicate real cabin environments.
The analysis indicates that ACH 15 poses the highest risk of pathogen transmission among the ACH rates tested. However, by increasing the ACH to 20, the transmission risk is significantly mitigated. Beyond ACH 20, additional increases yield diminishing returns, with only slight improvements observed as the rate approaches ACH 30. This underscores the need for an optimised ventilation strategy that effectively reduces the infection risk while balancing factors such as the energy efficiency and passenger comfort. There are several potential areas for future research that could build on these findings to further enhance the field of study.
(a)
Validate the ACH impact: Conduct further studies with more incremental ACH rates to determine the specific point at which the transmission risk is most effectively reduced.
(b)
Explore the ACH beyond 30: Investigate whether ACH rates above 30 continue to show diminishing returns or offer further reductions in the transmission risk.
(c)
Personalised exhaust systems: Research how personalised exhaust systems might prevent cross-contamination between passengers and complement the existing ventilation strategies.
(d)
ACH for different airplane models: Analyse ACH rates across various airplane models, considering differences in volume and cabin geometry, to assess the generalisability of the current findings.
(e)
Optimisation analysis: Perform a full optimisation study to balance the ACH rates with factors like draft, economic feasibility, energy consumption, and passenger comfort to find the most practical solution.

Author Contributions

Conceptualization, J.B. and L.T.; methodology, J.B. and L.T.; software, J.B.; validation, J.B.; formal analysis, J.B.; investigation, J.B.; resources, J.B. and L.T.; writing—original draft preparation, J.B.; writing—review and editing, J.B. and L.T.; supervision, L.T. All authors have read and agreed to the published version of the manuscript.

Funding

This research was funded by the Australian Research Council (Grant No. DE180101138).

Data Availability Statement

The original contributions presented in this study are included in the article. Further inquiries can be directed to the corresponding author.

Conflicts of Interest

The authors declare no conflicts of interest.

References

  1. Fernstrom, A.; Goldblatt, M. Aerobiology and its role in the transmission of infectious diseases. J. Pathog. 2013, 2013, 493960. [Google Scholar] [CrossRef] [PubMed]
  2. Chandler, D.L. A Method to Assess COVID-19 Transmission Risks in Indoor Settings. MIT News. 2021. Available online: https://news.mit.edu/2021/covid-19-risks-indoor-0415 (accessed on 1 June 2024).
  3. Rajendran, R.R.; Țurcanu, F.E.; Tawfiqur, R.M.D.; Askarpour, H. Computational fluid dynamic analysis of corona virus patients breathing in an airplane. Phys. Fluids 2023, 35, 035129. [Google Scholar] [CrossRef]
  4. Lin, C.H.; Horstman, R.H.; Ahlers, M.F.; Sedgwick, L.M.; Dunn, K.H.; Topmiller, J.L.; Bennett, J.S.; Wirogo, S. Numerical Simulation of Airflow and Airborne Pathogen Transport in Aircraft Cabins—Part 1. AIVC. 2005. Available online: https://www.aivc.org/resource/numerical-simulation-airflow-and-airborne-pathogen-transport-aircraft-cabins-part-1 (accessed on 13 June 2024).
  5. Boeing Commercial Airplanes. ‘737NG Airplane Characteristics for Airport Planning (Document No. D6-58329, Rev. A). Boeing. 2023. Available online: https://www.boeing.com/commercial/airports/plan-manuals (accessed on 20 April 2024).
  6. Tagliaferri, D.; Capsoni, C. SNIR predictions for on-aircraft VLC systems. In Proceedings of the 2016 Conference on Broadband Communications (COBCOM), Graz, Austria, 12–14 July 2016; pp. 1–7. [Google Scholar] [CrossRef]
  7. Topp, C.; Nielsen, P.V.; Sorensen, D. Application of computer simulated persons in indoor environmental modeling/Discussion. ASHRAE Trans. 2002, 108, 1084. [Google Scholar]
  8. Skill-Lync. CFD: Tackling Boundary Layers and Near Wall Regions in CFD. Skill-Lync. Available online: https://skill-lync.com/blogs/technical-blogs/cfd-tackling-boundary-layers-and-near-wall-regions-in-cfd (accessed on 2 September 2024).
  9. ASHRAE. Chapter 13, Aircraft. In ASHRAE Handbook—HVAC Applications; American Society of Heating, Refrigerating and Air-Conditioning Engineers: Atlanta, GA, USA, 2019. [Google Scholar]
  10. The Engineering ToolBox. Air—Density vs. Pressure and Temperatures. 2004. Available online: https://www.engineeringtoolbox.com/air-temperature-pressure-density-d_771.html (accessed on 11 April 2024).
  11. Sanmark, E.; Oksanen, L.A.H.; Rantanen, N.; Lahelma, M.; Anttila, V.J.; Lehtonen, L.; Hyvärinen, A.; Geneid, A. Aerosol generation during coughing: An observational study. J. Laryngol. Otol. 2023, 137, 442–447. [Google Scholar] [CrossRef] [PubMed]
  12. Santos, A.F.; Gaspar, P.D.; Hamandosh, A.; Aguiar, E.B.; Guerra, A.C.; Souza, H.J. Best practices on HVAC design to minimize the risk of COVID-19 infection within indoor environments. Braz. Arch. Biol. Technol. 2020, 63, e20200335. [Google Scholar] [CrossRef]
  13. Fennelly, K.P. Particle sizes of infectious aerosols: Implications for infection control. Lancet Respir. Med. 2020, 8, 914–924. [Google Scholar] [CrossRef] [PubMed]
  14. Yan, Y.; Li, X.; Shang, Y.; Tu, J. Evaluation of airborne disease infection risks in an airliner cabin using the Lagrangian-based Wells-Riley approach. Build. Environ. 2017, 121, 79–92. [Google Scholar] [CrossRef] [PubMed]
  15. Talaat, K.; Abuhegazy, M.; Mahfoze, O.A.; Anderoglu, O.; Poroseva, S.V. Simulation of aerosol transmission on a Boeing 737 airplane with intervention measures for COVID-19 mitigation. Phys. Fluids 2021, 33, 033312. [Google Scholar] [CrossRef]
  16. Isukapalli, S.S.; Mazumdar, S.; George, P.; Wei, B.; Jones, B.; Weisel, C.P. Computational fluid dynamics modeling of transport and deposition of pesticides in an aircraft cabin. Atmos. Environ. 2013, 68, 198–207. [Google Scholar] [CrossRef] [PubMed]
  17. Sze To, G.N.; Chao, C.Y. Review and comparison between the Wells-Riley and dose-response approaches to risk assessment of infectious respiratory diseases. Indoor Air 2010, 20, 2–16. [Google Scholar] [CrossRef] [PubMed]
  18. Burkett, B. Ventilation Strategies to Reduce Airborne Infection Risk: Part 3. ASHRAE Journal, August 2021. pp. 18–25. Available online: https://www.ashrae.org/file%20library/technical%20resources/ashrae%20journal/2021journaldocuments/august2021_18-25_burkett--pt3.pdf (accessed on 11 October 2024).
Figure 1. Boeing 737 CAD model with simplified geometry used for computational simulations: (a) isometric view showing the four-row seating configuration with box-shaped manikins and cabin dimensions. (b) Cross-sectional view illustrating the cabin’s interior dimensions and key structural elements.
Fluids 10 00074 g001
Figure 2. Cylindrical simplification of breathing zone volumes in ANSYS Discovery 2024.
Fluids 10 00074 g002
Figure 3. Pressure drop across cabin for varying mesh sizes.
Fluids 10 00074 g003
Figure 4. ANSYS mesh of the simulation domain: (a) 3D view showing the meshing of the cabin seats and box-designed manikins, and (b) x-y plane cross-sectional view displaying the meshing resolution and element distribution within the cabin.
Fluids 10 00074 g004
Figure 5. No. of tracked ejected particles vs. no. of refinement layers.
Fluids 10 00074 g005
Figure 6. Front view of velocity distribution and pathlines in the cabin with different air change rates: (a) 15 ACH (b) 20 ACH (c) 25 ACH (d) 30 ACH.
Fluids 10 00074 g006
Figure 7. Front views of pathogen residence time in the cabin for different air change rates: (a) 15 ACH, (b) 20 ACH, (c) 25 ACH, and (d) 30 ACH.
Fluids 10 00074 g007aFluids 10 00074 g007b
Figure 8. Probability of infection (%) as a function of ACH rate.
Fluids 10 00074 g008
Figure 9. Probability of infection (%) as a function of ACH rate for different numbers of infectors.
Fluids 10 00074 g009
Table 1. Assumed air properties at a cabin altitude of 2135 m and 24 °C.
Air PropertyUnitAssumptionValue
Compressibility -Low-speed flow Incompressible
Density k g / m 3 @ 24   ° C & 78.187 kPa0.91668
Dynamic Viscosity P a · s @ 24   ° C 18.32 × 10 6
Gas Constant J / k g · K 287
Specific Heat Capacity J / k g · K Isobaric @ 24   ° C & 1 bar1006
Thermal Conductivity W / m · K Isobaric @ 24   ° C & 1 bar0.02617
Table 2. Boundary conditions implemented in ANSYS Fluent simulations.
BoundaryBoundary TypeBoundary ConditionValueUnitVelocity Condition
Human Mouth Surface —TemperatureInletEscape35°CN/A
Particle Injection—VelocityInletEscape11.7m/sN/A
Particle Injection—Mass Flow RateInletEscape8.38 × 10−9kg/sN/A
Return Air Pressure OutletEscape0PaN/A
Supply Air—TemperatureInletEscape20°CN/A
Supply Air—VelocityInletEscape@30° to wall tangent.m/sN/A
Supply Air—Water vapour content InletEscape0.001008kg of Water vapor/kg of dry airN/A
Symmetry Plane (y-z plane)SymmetryN/AN/AN/ASymmetry
Chair and Manikin SurfacesWall UndefinedN/AN/AN/A
Cabin WallWallReflectN/AN/AN/A
Thermal Boundary
Ceiling Adiabatic WallNo heat transfer (adiabatic).N/AN/ANo-slip
Floor Adiabatic Wall No heat transfer (adiabatic).N/AN/ANo-slip
Passengers Isothermal WallFixed Temperature30.3°CNo-slip
Seats Adiabatic WallNo heat transfer (adiabatic).No heat transfer (thermally insulated).N/ANo-slip
Side wallsIsothermal Wall Fixed Temperature18°CNo-slip
Table 3. Calculated inlet velocity based on ACH.
Case NumberAir Changes/HourInlet Velocity (m/s)
1150.6051
2200.8069
3251.0086
4301.2103
Table 4. Longest particle residence time (in seconds) for different air change rates (ACH).
ACH RateTotal Time in Cabin (s)
15305.1
20126.8
25127.8
30175.6
Table 5. Probability of infection for different ACH rates based on the injection of SARS aerosol particles.
ACH Ratet (Exposure Time in s) P (Probability of Infection in %)
15305.14.7875
20126.81.5176
25127.81.2254
30175.61.4019
Disclaimer/Publisher’s Note: The statements, opinions and data contained in all publications are solely those of the individual author(s) and contributor(s) and not of MDPI and/or the editor(s). MDPI and/or the editor(s) disclaim responsibility for any injury to people or property resulting from any ideas, methods, instructions or products referred to in the content.

